Attached files
| file | filename |
|---|---|
| EX-10.56 - EXHIBIT 10.56 - SYSCO CORP | exhibit1056summaryofcompen.htm |
| EX-10.7 - EXHIBIT 10.7 - SYSCO CORP | syy2015yeexhibit107.htm |
| EX-10.28 - EXHIBIT 10.28 - SYSCO CORP | syy2015yeexhibit1028.htm |
| EX-10.16 - EXHIBIT 10.16 - SYSCO CORP | syy2015yeexhibit1016.htm |
| EX-23.1 - EXHIBIT 23.1 - SYSCO CORP | a3136exhibit23115ye-a012co.htm |
| EX-10.58 - EXHIBIT 10.58 - SYSCO CORP | exhibit1058-kreidlerletter.htm |
| EX-12.1 - EXHIBIT 12.1 - SYSCO CORP | a31314121ratioofearningsto.htm |
| EX-21.1 - EXHIBIT 21.1 - SYSCO CORP | a31338exhibit211subsidiari.htm |
| EX-32.1 - EXHIBIT 32.1 - SYSCO CORP | syy2015yeex321.htm |
| EX-31.1 - EXHIBIT 31.1 - SYSCO CORP | a31331311ceocertificationp.htm |
| EX-32.2 - EXHIBIT 32.2 - SYSCO CORP | a31334322cfocertificationp.htm |
| EX-31.2 - EXHIBIT 31.2 - SYSCO CORP | syy2015yeex312.htm |
UNITED STATES SECURITIES AND EXCHANGE COMMISSION
Washington, D.C. 20549
________________
Form 10-K
(Mark One)
þ ANNUAL REPORT PURSUANT TO SECTION 13 OR 15(d) OF THE SECURITIES EXCHANGE ACT OF 1934
For the fiscal year ended June 27, 2015
OR
¨ TRANSITION REPORT PURSUANT TO SECTION 13 OR 15(d) OF THE SECURITIES EXCHANGE ACT OF 1934
Commission File Number 1-6544
________________
Sysco Corporation
(Exact name of registrant as specified in its charter)
DELAWARE (State or other jurisdiction of incorporation or organization) 1390 Enclave Parkway Houston, Texas (Address of principal executive offices) | 74-1648137 (I.R.S. Employer Identification No.) 77077-2099 (Zip Code) | |
Registrant's Telephone Number, Including Area Code:
(281) 584-1390
Securities Registered Pursuant to Section 12(b) of the Act:
Title of Each Class | Name of each exchange on which registered | |||
Common Stock, $1.00 Par Value | New York Stock Exchange | |||
Securities Registered Pursuant to Section 12(g) of the Act:
None
Indicate by checkmark if the registrant is a well-known seasoned issuer, as defined in Rule 405 of the Securities Act. Yes ☑ No ☐
Indicate by checkmark if the registrant is not required to file reports pursuant to Section 13 or Section 15(d) of the Act. Yes ☐ No ☑
Indicate by check mark whether the registrant (1) has filed all reports required to be filed by Section 13 or 15(d) of the Securities Exchange Act of 1934 during the preceding 12 months (or for such shorter period that the registrant was required to file such reports), and (2) has been subject to such filing requirements for the past 90 days. Yes ☑ No ☐
Indicate by check mark whether the registrant has submitted electronically and posted on its corporate Web site, if any, every Interactive Data File required to be submitted and posted pursuant to Rule 405 of Regulation S-T during the preceding 12 months (or for such shorter period that the registrant was required to submit and post such files).
Yes ☑ No ☐
Indicate by check mark if disclosure of delinquent filers pursuant to Item 405 of Regulation S-K is not contained herein, and will not be contained, to the best of registrant’s knowledge, in definitive proxy or information statements incorporated by reference in Part III of this Form 10-K or any amendment to this Form 10-K. ☐
Indicate by check mark whether the registrant is a large accelerated filer, an accelerated filer, a non-accelerated filer or a smaller reporting company. See definition of “large accelerated filer,” “accelerated filer” and “smaller reporting company” in Rule 12b-2 of the Exchange Act. (Check one):
Large Accelerated Filer ☑ | Accelerated Filer ☐ |
Non-accelerated Filer ☐ (Do not check if a smaller reporting company) | Smaller Reporting Company ☐ |
Indicate by check mark whether the registrant is a shell company (as defined in Rule 12b-2 of the Exchange Act). Yes ☐ No ☑
The aggregate market value of the voting stock of the registrant held by stockholders who were not affiliates (as defined by regulations of the Securities and Exchange Commission) of the registrant was approximately $23,927,875,000 as of December 27, 2014 (based on the closing sales price on the New York Stock Exchange Composite Tape on December 26, 2014, as reported by The Wall Street Journal (Southwest Edition)). As of August 13, 2015, the registrant had issued and outstanding an aggregate of 594,917,977 shares of its common stock.
DOCUMENTS INCORPORATED BY REFERENCE:
Portions of the company’s 2015 Proxy Statement to be filed with the Securities and Exchange Commission no later than 120 days after the end of the fiscal year covered by this Form 10-K are incorporated by reference into Part III.
TABLE OF CONTENTS
Page No. | ||
PART I | ||
PART I
Item 1. Business
Unless this Form 10-K indicates otherwise or the context otherwise requires, the terms “we,” “our,” “us,” “Sysco,” or “the company” as used in this Form 10-K refer to Sysco Corporation together with its consolidated subsidiaries and divisions.
Overview
Sysco Corporation, acting through its subsidiaries and divisions, is the largest North American distributor of food and related products primarily to the foodservice or food-away-from-home industry. We provide products and related services to approximately 425,000 customers, including restaurants, healthcare and educational facilities, lodging establishments and other foodservice customers.
Founded in 1969, Sysco commenced operations as a public company in March 1970 when the stockholders of nine companies exchanged their stock for Sysco common stock. Since our formation, we have grown from $115.0 million to $48.7 billion in annual sales, both through internal expansion of existing operations and through acquisitions.
Sysco’s fiscal year ends on the Saturday nearest to June 30th. This resulted in a 52-week year ending June 27, 2015 for fiscal 2015, June 28, 2014 for fiscal 2014 and June 29, 2013 for fiscal 2013. We will have a 53-week year ending July 2, 2016 for fiscal 2016.
Sysco Corporation is organized under the laws of Delaware. The address and telephone number of our executive offices are 1390 Enclave Parkway, Houston, Texas 77077-2099, (281) 584-1390. This annual report on Form 10-K, as well as all other reports filed or furnished by Sysco pursuant to Section 13(a) or 15(d) of the Securities Exchange Act of 1934, are available free of charge on Sysco’s website at www.sysco.com as soon as reasonably practicable after they are electronically filed with or furnished to the Securities and Exchange Commission.
Operating Segments
Sysco provides food and related products to the foodservice or food-away-from-home industry. Under the accounting provisions related to disclosures about segments of an enterprise, we have aggregated our operating companies into a number of segments, of which only Broadline and SYGMA are reportable segments as defined by accounting standards. Broadline operating companies distribute a full line of food products and a wide variety of non-food products to their customers. SYGMA operating companies distribute a full line of food products and a wide variety of non-food products to chain restaurant customer locations. Our other segments include our specialty produce companies, custom-cut meat companies, lodging industry products companies, a company that distributes specialty imported products, a company that distributes to international customers and the company’s Sysco Ventures platform, a suite of technology solutions that help support the business needs of Sysco’s customers. Specialty produce companies distribute fresh produce and, on a limited basis, other foodservice products. Our specialty meat companies distribute custom-cut fresh steaks, other meat, seafood and poultry. Our lodging industry products companies distribute personal care guest amenities, equipment, housekeeping supplies, room accessories and textiles to the lodging industry. Selected financial data for each of our reportable segments, as well as financial information concerning geographic areas, can be found in Note 21, “Business Segment Information,” in the Notes to Consolidated Financial Statements in Item 8.
Customers and Products
Sysco’s customers in the foodservice industry include restaurants, hospitals and nursing homes, schools and colleges, hotels and motels, industrial caterers and other similar venues where foodservice products are served. Services to our customers are supported by similar physical facilities, vehicles, material handling equipment and techniques, and administrative and operating staffs.
The products we distribute include:
• | a full line of frozen foods, such as meats, seafood, fully prepared entrees, fruits, vegetables and desserts; |
• | a full line of canned and dry foods; |
• | fresh meats and seafood; |
• | dairy products; |
• | beverage products; |
• | imported specialties; and |
• | fresh produce. |
1
We also supply a wide variety of non-food items, including:
• | paper products such as disposable napkins, plates and cups; |
• | tableware such as china and silverware; |
• | cookware such as pots, pans and utensils; |
• | restaurant and kitchen equipment and supplies; and |
• | cleaning supplies. |
A comparison of the sales mix in the principal product categories during the last three years is presented below:
Principal product categories | 2015 | 2014 | 2013 | ||||||
Fresh and frozen meats | 21 | % | 19 | % | 19 | % | |||
Canned and dry products | 16 | 18 | 19 | ||||||
Frozen fruits, vegetables, bakery and other | 13 | 13 | 14 | ||||||
Dairy products | 11 | 11 | 10 | ||||||
Poultry | 11 | 10 | 10 | ||||||
Fresh produce | 8 | 8 | 8 | ||||||
Paper and disposables | 7 | 7 | 8 | ||||||
Seafood | 5 | 5 | 5 | ||||||
Beverage products | 4 | 4 | 4 | ||||||
Janitorial products | 2 | 2 | 2 | ||||||
Equipment and smallwares | 1 | 2 | 1 | ||||||
Medical supplies (1) | 1 | 1 | — | ||||||
Totals | 100 | % | 100 | % | 100 | % | |||
(1) Sales are less than 1% of total for years shown with a “-"
Our distribution centers, which we refer to as operating companies, distribute nationally-branded merchandise, as well as products packaged under our private brands. Products packaged under our private brands have been manufactured for Sysco according to specifications that have been developed by our quality assurance team. In addition, our quality assurance team certifies the manufacturing and processing plants where these products are packaged, enforces our quality control standards and identifies supply sources that satisfy our requirements.
We believe that prompt and accurate delivery of orders, competitive pricing, close contact with customers and the ability to provide a full array of products and services to assist customers in their foodservice operations are of primary importance in the marketing and distribution of foodservice products to our customers. Our operating companies offer daily delivery to certain customer locations and have the capability of delivering special orders on short notice. Through our approximately 12,800 sales and marketing representatives and support staff of Sysco and our operating companies, we stay informed of the needs of our customers and acquaint them with new products and services. Our operating companies also provide ancillary services relating to foodservice distribution, such as providing customers with product usage reports and other data, menu-planning advice, food safety training and assistance in inventory control, as well as access to various third party services designed to add value to our customers’ businesses.
No single customer accounted for 10% or more of Sysco’s total sales for the fiscal year ended June 27, 2015.
2
We estimate that our sales by type of customer during the past three fiscal years were as follows:
Type of Customer | 2015 | 2014 | 2013 | |||||
Restaurants | 64 | % | 62 | % | 61 | % | ||
Healthcare | 9 | 9 | 10 | |||||
Education, government | 8 | 9 | 8 | |||||
Travel, leisure, retail | 8 | 8 | 8 | |||||
Other (1) | 11 | 12 | 13 | |||||
Totals | 100 | % | 100 | % | 100 | % | ||
(1) Other includes cafeterias that are not stand alone restaurants, bakeries, caterers, churches, civic and fraternal organizations, vending distributors, other distributors and international exports. None of these types of customers, as a group, exceeded 5% of total sales in any of the years for which information is presented.
Sources of Supply
We purchase from thousands of suppliers, both domestic and international, none of which individually accounts for more than 10% of our purchases. These suppliers consist generally of large corporations selling brand name and private label merchandise, as well as independent regional brand and private label processors and packers. Purchasing is generally carried out through both centrally developed purchasing programs and direct purchasing programs established by our various operating companies.
We administer a consolidated product procurement program designed to develop, obtain and ensure consistent quality food and non-food products. The program covers the purchasing and marketing of Sysco Brand merchandise, as well as products from a number of national brand suppliers, encompassing substantially all product lines. Sysco’s operating companies purchase product from the suppliers participating in these consolidated programs and from other suppliers, although Sysco Brand products are only available to the operating companies through these consolidated programs. We also focus on increasing profitability by lowering operating costs and by lowering aggregate inventory levels, which reduces future facility expansion needs at our broadline operating companies, while providing greater value to our suppliers and customers. This includes the construction and operation of regional distribution centers (RDCs), which aggregate inventory demand to optimize the supply chain activities for certain products for all Sysco broadline operating companies in the region. Currently, we have two RDCs in operation, one in Virginia and one in Florida.
Working Capital Practices
Our growth is funded through a combination of cash flow from operations, commercial paper issuances and long-term borrowings. See the discussion in “Management’s Discussion and Analysis of Financial Condition and Results of Operations, Liquidity and Capital Resources” in Item 7 regarding our liquidity, financial position and sources and uses of funds.
Credit terms we extend to our customers can vary from cash on delivery to 30 days or more based on our assessment of each customer’s credit worthiness. We monitor each customer’s account and will suspend shipments if necessary.
A majority of our sales orders are filled within 24 hours of when customer orders are placed. We generally maintain inventory on hand to be able to meet customer demand. The level of inventory on hand will vary by product depending on shelf-life, supplier order fulfillment lead times and customer demand. We also make purchases of additional volumes of certain products based on supply or pricing opportunities.
We take advantage of suppliers’ cash discounts where appropriate and otherwise generally receive payment terms from our suppliers ranging from weekly to 30 days or more.
Corporate Headquarters and Shared Services Center
Our corporate staff makes available a number of services to our operating companies and our shared services center performs support services for employees, suppliers and customers. Members of these groups possess experience and expertise in, among other areas, customer and vendor contract administration, vendor payments, procurement and maintenance support, invoicing, cash application, accounting and finance, treasury, credit services, legal, cash management, information technology, employee benefits, engineering, real estate and construction, risk management and insurance, sales and marketing, payroll, human resources, training and development, strategy, and tax compliance services, including sales and use tax administration. The corporate office also makes available warehousing and distribution services, which provide assistance in operational best practices including space utilization, energy conservation, fleet management and work flow.
3
Capital Improvements
To maximize productivity and customer service, we continue to modernize, expand and construct new distribution facilities. During fiscal 2015, 2014 and 2013, approximately $542.8 million, $523.2 million and $511.9 million, respectively, were invested in delivery fleet, facilities, technology and other capital asset enhancements. From time to time, we dispose of assets in the normal course of business; we consider proceeds from these asset sales to be an offset to capital expenditures. During fiscal 2015, 2014 and 2013, capital expenditures, net of proceeds from sales of assets, were $518.4 million, $497.4 million and $496.3 million, respectively. We estimate our capital expenditures, net of proceeds from sales of assets, in fiscal 2016 should be in the range of $550 million to $600 million. During the three years ended June 27, 2015, capital expenditures were financed primarily by internally generated funds, our commercial paper program and bank and other borrowings. We expect to finance our fiscal 2016 capital expenditures from the same sources.
Employees
As of June 27, 2015, we had approximately 51,700 employees, approximately 18% of whom were represented by unions, primarily the International Brotherhood of Teamsters. Contract negotiations are handled by each individual operating company. Approximately 37% of our union employees are covered by collective bargaining agreements that have expired or will expire during fiscal 2016 and are subject to renegotiation. Since June 27, 2015, there have been no contract renegotiations. We consider our labor relations to be satisfactory.
Competition
Industry sources estimate that there are more than 16,500 companies engaged in the distribution of food and non-food products to the foodservice industry in the U.S. Our customers may also choose to purchase products directly from wholesale or retail outlets, including club, cash and carry and grocery stores, or negotiate prices directly with our suppliers. Online retailers and e-commerce companies are also participants in the foodservice industry. While we compete primarily with local and regional distributors, some organizations compete with us on a multi-region basis. In addition, these local, regional and multi-regional distributors can create purchasing cooperatives and marketing groups to enhance their competitive abilities by expanding their product mix, improving purchasing power and extending their geographic capabilities. We believe that the principal competitive factors in the foodservice industry are effective customer contacts, the ability to deliver a wide range of quality products and related services on a timely and dependable basis and competitive prices. Our customers are accustomed to purchasing from multiple suppliers and channels concurrently. Product needs, service requirements and price are just a few of the factors they evaluate when deciding where to purchase. Customers can choose from many broadline foodservice distributors, specialty distributors that focus on specific categories such as produce, meat or seafood, other wholesale channels, club stores, cash and carry stores, grocery stores and numerous online retailers. Since switching costs are very low, customers can make supplier and channel changes very quickly. There are few barriers to market entry. Existing foodservice competitors can extend their shipping distances and add truck routes and warehouses relatively quickly to serve new markets or customers.
We consider our primary market to be the foodservice market in the U.S. and Canada and estimate that we serve about 17.7% of this approximately $264 billion annual market based on a measurement as of the end of calendar 2014. We believe, based upon industry trade data, that our sales to the U.S. and Canada food-away-from-home industry were the highest of any foodservice distributor during fiscal 2015. While adequate industry statistics are not available, we believe that, in most instances, our local operations are among the leading distributors of food and related non-food products to foodservice customers in their respective trading areas. We believe our competitive advantages include our more than 7,300 marketing associates, our diversified product base, which includes a differentiated group of high quality Sysco brand products, the diversity in the types of customers we serve, our economies of scale and our multi-region portfolio in the U.S. and Canada, which mitigates some of the impact of regional economic declines that may occur over time. We believe our liquidity and access to capital provides us the ability to continuously invest in business improvements. We are one of the few distributors in the food-away-from-home industry in the U.S. with publicly traded equity. While our public company status provides us with some advantages over many of our competitors, including access to capital, we believe it also provides us with some disadvantages that most of them do not have in terms of additional costs related to complying with regulatory requirements.
Government Regulation
Our company is required to comply, and it is our policy to comply, with all applicable laws in the numerous countries throughout the world in which we do business. In many jurisdictions, compliance with competition laws is of special importance to us, and our operations may come under special scrutiny by competition law authorities due to our competitive position in those jurisdictions. In general, competition laws are designed to protect businesses and consumers from anti-competitive behavior.
4
In the U.S., as a marketer and distributor of food products, we are subject to the Federal Food, Drug and Cosmetic Act and regulations promulgated thereunder by the U.S. Food and Drug Administration (FDA). The FDA regulates food safety through various statutory and regulatory mandates, including manufacturing and holding requirements for foods through good manufacturing practice regulations, hazard analysis and critical control point (HACCP) requirements for certain foods, and the food and color additive approval process. The agency also specifies the standards of identity for certain foods, prescribes the format and content of information required to appear on food product labels, regulates food contact packaging and materials, and maintains a Reportable Food Registry for the industry to report when there is a reasonable probability that an article of food will cause serious adverse health consequences. For certain product lines, we are also subject to the Federal Meat Inspection Act, the Poultry Products Inspection Act, the Perishable Agricultural Commodities Act, the Packers and Stockyard Act and regulations promulgated by the U.S. Department of Agriculture (USDA) to interpret and implement these statutory provisions. The USDA imposes standards for product safety, quality and sanitation through the federal meat and poultry inspection program. The USDA reviews and approves the labeling of these products and also establishes standards for the grading and commercial acceptance of produce shipments from our suppliers. We are also subject to the Public Health Security and Bioterrorism Preparedness and Response Act of 2002, which imposes certain registration and record keeping requirements on facilities that manufacture, process, pack or hold food for human or animal consumption.
We and our products are also subject to state and local regulation through such measures as the licensing of our facilities; enforcement by state and local health agencies of state and local standards for our products; and regulation of our trade practices in connection with the sale of our products. Our facilities are subject to regulations issued pursuant to the U.S. Occupational Safety and Health Act by the U.S. Department of Labor. These regulations require us to comply with certain manufacturing, health and safety standards to protect our employees from accidents and to establish hazard communication programs to transmit information on the hazards of certain chemicals present in products we distribute.
We are also subject to regulation by numerous federal, state and local regulatory agencies, including, but not limited to, the U.S. Department of Labor, which sets employment practice standards for workers, and the U.S. Department of Transportation, which regulates transportation of perishable and hazardous materials and waste, and similar state, provincial and local agencies. In addition, we are also subject to the U.S. False Claims Act, and similar state statutes, which prohibit the submission of claims for payment to the government that are false and the knowing retention of overpayments.
The U.S. Foreign Corrupt Practices Act (FCPA) prohibits bribery of public officials to obtain or retain business in foreign jurisdictions. The FCPA also requires us to keep accurate books and records and to maintain internal accounting controls to detect and prevent bribery and to ensure that transactions are properly authorized. We have implemented and continue to develop a robust anti-corruption compliance program applicable to our global operations to detect and prevent bribery and to comply with these and other anti-corruption laws in countries where we operate.
Outside the U.S., our business is subject to numerous similar statutes and regulations, as well as other legal and regulatory requirements.
All of our company's facilities and other operations in the U.S. and elsewhere around the world are subject to various environmental protection statutes and regulations, including those relating to the use of water resources and the discharge of wastewater. Further, most of our distribution facilities have ammonia-based refrigeration systems and tanks for the storage of diesel fuel and other petroleum products which are subject to laws regulating such systems and storage tanks. Our policy is to comply with all such legal requirements. We are subject to other federal, state, provincial and local provisions relating to the protection of the environment or the discharge of materials; however, these provisions do not materially impact the use or operation of our facilities.
General
We have numerous trademarks that are of significant importance, including the SYSCO® trademark and our privately-branded product trademarks that include the SYSCO® trademark. These trademarks and the private brands on which they are used are widely recognized within the foodservice industry. Approximately half of our privately-branded sales are from products labeled with our SYSCO® trademark without any other trademark. We believe the loss of the SYSCO® trademark would have a material adverse effect on our results of operations. Our U.S. trademarks are effective for a ten-year period and the company generally renews its trademarks before their expiration dates unless a particular trademark is no longer in use. The company does not have any material patents or licenses.
We are not engaged in material research and development activities relating to the development of new products or the improvement of existing products.
5
Our sales do not generally fluctuate significantly on a seasonal basis; therefore, the business of the company is not deemed to be seasonal.
As of June 27, 2015, we operated 197 distribution facilities throughout the U.S., Bahamas, Canada, and Ireland. We have interests in joint venture operations in Costa Rica and Mexico.
Item 1A. Risk Factors
The following discussion of “risk factors” identifies the most significant factors that may adversely affect our business, operations, financial position or future financial performance. This information should be read in conjunction with Management’s Discussion and Analysis of Financial Condition and Results of Operations and the consolidated financial statements and related notes contained in this report. The following discussion of risks is not all inclusive, but is designed to highlight what we believe are the most significant factors to consider when evaluating our business. These factors could cause our future results to differ from our expectations expressed in the forward-looking statements identified within "Management's Discussion and Analysis of Financial Condition and Results of Operations," and from historical trends.
Industry and General Economic Risks
Periods of significant or prolonged inflation or deflation affect our product costs and may negatively impact our profitability.
Volatile food costs have a direct impact on our industry. Periods of product cost inflation may have a negative impact on our profit margins and earnings to the extent that we are unable to pass on all or a portion of such product cost increases to our customers, which may have a negative impact on our business and our profitability. In addition, periods of rapidly increasing inflation may negatively impact our business due to the timing needed to pass on such increases, the impact of such inflation on discretionary spending by consumers and our limited ability to increase prices in the current, highly competitive environment. Conversely, our business may be adversely impacted by periods of product cost deflation, because we make a significant portion of our sales at prices that are based on the cost of products we sell plus a percentage margin. As a result, our profit levels may be negatively impacted during periods of product cost deflation, even though our gross profit percentage may remain relatively constant.
Unfavorable macroeconomic conditions in the U.S., as well as unfavorable conditions in particular local markets, may adversely affect our results of operations and financial condition
The foodservice distribution industry, which is characterized by relatively low profit margins with limited demand growth expected in the near-term, is especially susceptible to negative trends and economic uncertainty. The U.S. has experienced an uneven economic environment over the past several years. In addition, our results of operations are substantially affected by local operating and economic conditions, which can vary substantially by market. Economic conditions can affect us in the following ways:
• | Unfavorable conditions can depress sales and/or gross margins in a given market. |
• | Food cost and fuel cost inflation experienced by the consumer can lead to reductions in the frequency of dining out and the amount spent by consumers for food-away-from-home purchases, which could negatively impact our business by reducing demand for our products. |
• | Heightened uncertainty in the financial markets negatively affects consumer confidence and discretionary spending, which can cause disruptions with our customers and suppliers. |
• | Liquidity issues and the inability of our customers, vendors and suppliers to consistently access credit markets to obtain cash to support operations can cause temporary interruptions in our ability to conduct day-to-day transactions involving the payment to or collection of funds from our customers, vendors and suppliers. |
The uncertainty in the economic environment has adversely affected the rate of improvement in both business and consumer confidence and spending, and uncertainty about the long-term investment environment could further depress capital investment and economic activity.
Competition in our industry may adversely impact our margins and our ability to retain customers, and makes it difficult for us to maintain our market share, growth rate and profitability.
The foodservice distribution industry is fragmented and highly competitive, with local, regional, multi-regional distributors and specialty competitors. Furthermore, barriers to entry by new competitors, or geographic or product line expansion
6
by existing competitors, are low. Additionally, increased competition from non-traditional sources (such as club stores and commercial wholesale outlets with lower cost structures), and group purchasing organizations have served to further increase pressure on the industry’s profit margins, and continued margin pressure within the industry may have a material adverse effect on our operating results and profitability. Finally, demand for food-away-from-home products is volatile and price sensitive, imposing limits on our customers’ ability to absorb cost increases. New and increasing competitive sources may result in increased focus on pricing and on limiting price increases, or may require increased discounting. Such competition or other industry pressures may result in margin erosion and/or make it difficult for us to attract and retain customers.
If we are unable to effectively differentiate ourselves from our competitors, our market share, sales and profitability, through increased expenditures or decreased prices, could be adversely impacted.
We may not be able to fully compensate for increases in fuel costs, and forward purchase commitments intended to contain fuel costs could result in above market fuel costs.
Volatile fuel prices have a direct impact on our industry. We require significant quantities of fuel for our delivery vehicles and are exposed to the risk associated with fluctuations in the market price for fuel. The price and supply of fuel can fluctuate significantly based on international, political and economic circumstances, as well as other factors outside our control, such as actions by the Organization of the Petroleum Exporting Countries, or OPEC, and other oil and gas producers, regional production patterns, weather conditions and environmental concerns. The cost of fuel affects the price paid by us for products, as well as the costs we incur to deliver products to our customers. Although we have been able to pass along a portion of increased fuel costs to our customers in the past, there is no guarantee that we will be able to do so in the future. If fuel costs increase in the future, we may experience difficulties in passing all or a portion of these costs along to our customers, which may have a negative impact on our business and our profitability. We routinely enter into forward purchase commitments for a portion of our projected monthly diesel fuel requirements at prices equal to the then-current forward price for diesel. If fuel prices decrease significantly, these forward purchases will result in our paying higher than market costs for a portion of our diesel fuel.
Business and Operational Risks
Conditions beyond our control can interrupt our supplies and increase our product costs.
We obtain substantially all of our foodservice and related products from third-party suppliers. Although our purchasing volume can provide benefits when dealing with suppliers, suppliers may not provide the foodservice products and supplies needed by us in the quantities and at the prices requested. We are also subject to delays caused by interruptions in production and increases in product costs based on conditions outside of our control. These conditions include work slowdowns, work interruptions, strikes or other job actions by employees of suppliers, short-term weather conditions or more prolonged climate change, crop and other agricultural conditions, water shortages, animal disease outbreaks, transportation interruptions, unavailability of fuel or increases in fuel costs, product recalls, competitive demands and natural disasters or other catastrophic events (including, but not limited to food-borne illnesses). Further, increased frequency or duration of extreme weather conditions could also impair production capabilities, disrupt our supply chain or impact demand for our products. Input costs could increase at any point in time for a large portion of the products that we sell for a prolonged period. Our inability to obtain adequate supplies of foodservice and related products as a result of any of the foregoing factors or otherwise could mean that we could not fulfill our obligations to customers, and customers may turn to other distributors.
Adverse publicity about us or lack of confidence in our products could negatively impact our reputation and reduce earnings.
Maintaining a good reputation and public confidence in the safety of the products we distribute is critical to our business. The Sysco brand name, trademarks and logos and our reputation are powerful sales and marketing tools, and we devote significant resources to promoting and protecting them. Anything that damages our reputation or public confidence in our products, whether or not justified, including adverse publicity about the quality, safety, sustainability or integrity of our products or relating to activities by our operations, employees, suppliers or agents could tarnish our reputation and diminish the value of our brand, which could adversely affect our revenues and profits.
Reports, whether true or not, of food-borne illnesses (such as e-coli, avian flu, bovine spongiform encephalopathy, hepatitis A, trichinosis, salmonella, listeria or swine flu) and injuries caused by food tampering could also severely injure our reputation or negatively impact public confidence in our products. If patrons of our restaurant customers become ill from food-borne illnesses, our customers could be forced to temporarily close restaurant locations and our sales and profitability would be correspondingly decreased. In addition, instances of food-borne illnesses or food tampering or other health concerns (even those unrelated to the use of Sysco products) or public concern regarding the safety of our products, can result in negative publicity about the food service distribution industry and cause our sales and profitability to decrease dramatically.
7
Damage to our reputation and loss of brand equity could reduce demand for our products and services. This reduction in demand, together with the dedication of time and expense necessary to defend our reputation, would have an adverse effect on our financial condition, liquidity and results of operations, as well as require additional resources to rebuild our reputation and restore the value of our brand. Our business prospects, financial condition and results of operations could be adversely affected if our public image or reputation were to be tarnished by negative publicity including dissemination via print, broadcast or social media, or other forms of Internet-based communications. Adverse publicity about regulatory or legal action against us could damage our reputation and image, undermine our customers’ confidence and reduce short-term or long-term demand for our products and services, even if the regulatory or legal action is unfounded or not material to our operations. Any of these events could have a material negative impact on our results of operations and financial condition.
Unfavorable changes to the mix of locally-managed customers versus corporate-managed customers could have a material adverse effect on our results of operations and financial condition.
Gross margin from our corporate-managed customers is generally lower than that of our locally-managed customers because we typically sell higher volumes of products to these customers and provide a relatively lower level of value-added services than we do to locally-managed customers. If sales to our locally-managed customers do not grow at the same or a greater rate as sales to our corporate-managed customers, our operating margins may decline.
Moreover, if sales to our corporate-managed customers increase at a faster pace of growth than sales to our locally-managed customers, we will become more dependent on corporate-managed customers as they begin to represent a greater proportion of our total sales. Additionally, the loss of sales to the larger of these corporate-managed customers could have a material negative impact on our results of operations and financial condition. Additionally, as a result of our greater dependence on these customers, we could be pressured by them to lower our prices and/or offer expanded or additional services at the same prices. In that event, we would need to achieve additional cost savings to offset these price reductions and/or cost increases or our gross margins and profitability could be materially adversely affected. We may be unable to change our cost structure and pricing practices rapidly enough to successfully compete in such an environment.
We may not realize anticipated benefits from our operating cost reduction efforts.
We have implemented, and expect to implement in the future, cost reduction initiatives that we believe are necessary to position our business for future success and growth. Our future success and earnings growth will be significantly impacted by our ability to achieve a lower cost structure and operate efficiently in the highly competitive food and beverage industry, particularly in an environment of increased competitive activity and low growth rates. A variety of factors could cause us not to realize some of the expected cost savings, including, among other things, delays in the anticipated timing of activities related to our cost savings initiatives, lack of sustainability in cost savings over time and unexpected costs associated with operating our business. If we are unable to realize the anticipated benefits from our cost cutting efforts, we could become cost disadvantaged in the marketplace, and our competitiveness and our profitability could decrease. Furthermore, even if we realize the anticipated benefits of our cost reduction efforts, we may experience an adverse effect on our employees, customers and suppliers, which could negatively affect our sales and profits.
Expanding into international markets and complementary lines of business presents unique challenges, and our expansion efforts with respect to international operations and complementary lines of business may not be successful.
In addition to our domestic activities, an element of our strategy includes the possibility of further expansion of operations into international markets and the establishment of international procurement organizations. Our ability to successfully operate in international markets may be adversely affected by local laws and customs, legal and regulatory constraints, including compliance with the Foreign Corrupt Practices Act, political and economic conditions and currency regulations of the countries or regions in which we currently operate or intend to operate in the future. Risks inherent in our existing and future international operations also include, among others, the costs and difficulties of managing international operations, difficulties in identifying and gaining access to local suppliers, suffering possible adverse tax consequences, maintaining product quality and greater difficulty in enforcing intellectual property rights. Additionally, foreign currency exchange rates and fluctuations thereof may have an adverse effect on our future costs or on future sales and cash flows from our international operations.
Another element of our strategy includes the possibility of expansion into businesses that are closely related or complementary to, but not currently part of, our core foodservice distribution business. Our ability to successfully operate in these complementary business markets may be adversely affected by legal and regulatory constraints, including compliance with regulatory programs to which we become subject. Risks inherent in branching out into such complementary markets also include
8
the costs and difficulties of managing operations outside of our core business, which may require additional skills and competencies, as well as difficulties in identifying and gaining access to suppliers or customers in new markets.
Product liability claims could materially impact our business.
We, like any other seller of food, face the risk of exposure to product liability claims in the event that the use of products sold by Sysco causes injury or illness. We cannot be sure that consumption of our products will not cause a health-related illness in the future or that we will not be subject to claims or lawsuits relating to such matters. Further, even if a product liability claim is unsuccessful or is not fully pursued, the negative publicity surrounding any assertion that our products caused illness or injury could adversely affect our reputation with existing and potential customers and our corporate and brand image. With respect to product liability claims, we believe we have sufficient primary or excess umbrella liability insurance. However, this insurance may not continue to be available at a reasonable cost or, if available, may not be adequate to cover all of our liabilities. We generally seek contractual indemnification and insurance coverage from parties supplying our products, but this indemnification or insurance coverage is limited, as a practical matter, to the creditworthiness of the indemnifying party and the insured limits of any insurance provided by suppliers. If Sysco does not have adequate insurance or contractual indemnification available, product liability relating to defective products could materially adversely affect our results of operations and financial condition.
If we fail to comply with requirements imposed by applicable law or other governmental regulations, we could become subject to lawsuits, investigations and other liabilities and restrictions on our operations that could significantly and adversely affect our business.
We are subject to governmental regulation at the federal, state, international, national, provincial and local levels in many areas of our business, such as food safety and sanitation, minimum wage, overtime, wage payment, wage and hour and employment discrimination, immigration, human health and safety, and due to the services we provide in connection with governmentally funded entitlement programs. From time to time, both federal and state governmental agencies have conducted audits of our billing practices as part of investigations of providers of services under governmental contracts, or otherwise. We also receive requests for information from governmental agencies in connection with these audits. While we attempt to comply with all applicable laws and regulations, we cannot represent that we are in full compliance with all applicable laws and regulations or interpretations of these laws and regulations at all times or that we will be able to comply with any future laws, regulations or interpretations of these laws and regulations.
If we fail to comply with applicable laws and regulations or encounter disagreements with respect to our contracts subject to governmental regulations, including those referred to above, we may be subject to investigations, criminal sanctions or civil remedies, including fines, injunctions, prohibitions on exporting, seizures or debarments from contracting with the government. The cost of compliance or the consequences of non-compliance, including debarments, could have a material adverse effect on our business and results of operations. In addition, governmental units may make changes in the regulatory frameworks within which we operate that may require us to incur substantial increases in costs in order to comply with such laws and regulations.
We must finance and integrate acquired businesses effectively.
Historically, a portion of our growth has come through acquisitions. If we are unable to integrate acquired businesses successfully or realize anticipated economic, operational and other benefits and synergies in a timely manner, our earnings per share may be materially adversely affected. Integration of an acquired business may be more difficult when we acquire a business in a market in which we have limited expertise, or with a culture different from Sysco’s. A significant expansion of our business and operations, in terms of geography or magnitude, could strain our administrative and operational resources. Significant acquisitions may also require the issuance of material additional amounts of debt or equity, which could materially alter our debt-to-equity ratio, increase our interest expense and decrease earnings per share, and make it difficult for us to obtain favorable financing for other acquisitions or capital investments.
We need access to borrowed funds to grow, and any default by us under our indebtedness could have a material adverse effect on our cash flow and liquidity.
A substantial part of our growth historically has been the result of acquisitions and capital expansion. We anticipate additional acquisitions and capital expansion in the future. As a result, our inability to finance acquisitions and capital expenditures through borrowed funds could restrict our ability to expand. Moreover, any default under the documents governing our indebtedness could have a significant adverse effect on our cash flows, as well as the market value of our common stock.
Our level of indebtedness and the terms of our indebtedness could adversely affect our business and liquidity position.
9
As described in Note 11, “Debt and Other Financing Arrangements,” as of June 27, 2015, we had approximately $7.3 billion of total indebtedness which included a commercial paper program allowing us to issue short-term unsecured notes in an aggregate amount not to exceed $1.5 billion; a revolving credit facility supporting our United States and Canadian commercial paper programs in the amount of $1.5 billion scheduled to expire on December 29, 2018, and various other smaller bank facilities. In July 2015, we redeemed $5.0 billion in senior notes using cash on hand and the proceeds from borrowings under our commercial paper program.
Our indebtedness may further increase from time to time for various reasons, including fluctuations in operating results, working capital needs, capital expenditures, potential acquisitions or joint ventures, and we expect to incur additional indebtedness to fund our repurchase of up to $3 billion in Sysco common stock announced in June 2015. Our increased level of indebtedness and the ultimate cost of such indebtedness could have a negative impact on our liquidity, cost of future debt financing and financial results, and our credit ratings may be adversely affected as a result of the incurrence of additional indebtedness. In the future, our cash flow and capital resources may not be sufficient for payments of interest on and principal of our debt, and any alternative financing measures available may not be successful and may not permit us to meet our scheduled debt service obligations.
Our liquidity can be negatively impacted by payments required to appeal tax assessments with certain tax jurisdictions.
Certain tax jurisdictions require partial to full payment of audit assessments or the posting of letters of credit in order to proceed to the appeals process. Sysco has posted approximately $90 million in letters of credit to appeal the Canadian Revenue Agency assessments of transfer pricing adjustments relating to our cross border procurement activities through our former purchasing cooperative on our 2004 through 2009 fiscal years. If assessed on later years currently under examination using these same positions, we could have to pay cash or post additional letters of credit of as much as $16 million, in order to appeal these further assessments. If significant further payments are required, the company’s financial condition or cash flows could be adversely affected.
We rely on technology in our business and any technology disruption or delay in implementing new technology could have a material negative impact on our business.
Our ability to decrease costs and increase profits, as well as our ability to serve customers most effectively, depends on the reliability of our technology network. We use software and other technology systems, among other things, to generate and select orders, to load and route trucks, to make purchases, manage our warehouses and to monitor and manage our business on a day-to-day basis. Any disruption to these computer systems could adversely affect our customer service, decrease the volume of our business and result in increased costs and lower profits.
Furthermore, process changes will be required as we continue to use our existing warehousing, delivery, and payroll systems to support operations as we implement an Enterprise Resource Planning (ERP) system. While Sysco has invested and continues to invest in technology security initiatives and disaster recovery plans, these measures cannot fully insulate us from technology disruption that could result in adverse effects on operations and profits.
A cybersecurity incident and other technology disruptions could negatively affect our business and our relationships with customers.
We use technology in substantially all aspects of our business operations. We also use mobile devices, social networking and other online activities to connect with our employees, suppliers, business partners and our customers. Such uses give rise to cybersecurity risks, including security breach, espionage, system disruption, theft and inadvertent release of information. Our business involves the storage and transmission of numerous classes of sensitive and/or confidential information and intellectual property, including customers’ and suppliers' personal information, private information about employees, and financial and strategic information about the company and its business partners. Further, as the company pursues its strategy to grow through acquisitions and to pursue new initiatives that improve our operations and cost structure, the company is also expanding and improving its information technologies, resulting in a larger technological presence and corresponding exposure to cybersecurity risk. If we fail to assess and identify cybersecurity risks associated with acquisitions and new initiatives, we may become increasingly vulnerable to such risks. Additionally, while we have implemented measures to prevent security breaches and cyber incidents, our preventative measures and incident response efforts may not be entirely effective. The theft, destruction, loss, misappropriation, or release of sensitive and/or confidential information or intellectual property, or interference with our information technology systems or the technology systems of third parties on which we rely, could result in business disruption, negative publicity, brand damage, violation of privacy laws, loss of customers, potential liability and competitive disadvantage.
We may be required to pay material amounts under multiemployer defined benefit pension plans.
10
We contribute to several multiemployer defined benefit pension plans based on obligations arising under collective bargaining agreements covering union-represented employees. Approximately 10% of our current employees are participants in such multiemployer plans. In fiscal 2015, our total contributions to these plans were approximately $38.1 million, which included payments for withdrawal liabilities of $1.4 million. The costs of providing benefits through such plans have increased in recent years. The amount of any increase or decrease in our required contributions to these multiemployer plans will depend upon many factors, including the outcome of collective bargaining, actions taken by trustees who manage the plans, government regulations, the actual return on assets held in the plans and the potential payment of a withdrawal liability if we choose to exit. Based upon the information available to us from plan administrators, we believe that several of these multiemployer plans are underfunded. The unfunded liabilities of these plans may result in increased future payments by us and the other participating employers. Underfunded multiemployer pension plans may impose a surcharge requiring additional pension contributions. Our risk of such increased payments may be greater if any of the participating employers in these underfunded plans withdraws from the plan due to insolvency and is not able to contribute an amount sufficient to fund the unfunded liabilities associated with its participants in the plan. Based on the latest information available from plan administrators, we estimate our share of the aggregate withdrawal liability on the multiemployer plans in which we participate could have been as much as $245 million as of June 27, 2015. A significant increase to funding requirements could adversely affect the company’s financial condition, results of operations or cash flows.
Our funding requirements for our company-sponsored qualified pension plan may increase should financial markets experience future declines.
At the end of fiscal 2012, we decided to freeze future benefit accruals under the company-sponsored qualified pension plan (Retirement Plan) as of December 31, 2012 for all U.S. based salaried and non-union hourly employees. Effective January 1, 2013, these employees were eligible for additional contributions under an enhanced, defined contribution plan. While these actions will serve to limit future growth in our pension liabilities, we had a sizable pension obligation of $3.2 billion as of June 27, 2015; therefore, financial market factors could impact our funding requirements. Although recent pension funding relief legislation has served to defer some required funding, additional contributions may be required if our plan is not fully funded when the provisions that provided the relief are phased out. See Note 14, “Company-Sponsored Employee Benefit Plans” to the Consolidated Financial Statements in Item 8 for a discussion of the funded status of the Retirement Plan.
The amount of our annual contribution to the Retirement Plan is dependent upon, among other things, the returns on the Retirement Plan’s assets and discount rates used to calculate the plan’s liability. Our Retirement Plan holds investments in both equity and fixed income securities. Fluctuations in asset values can cause the amount of our anticipated future contributions to the plan to increase. The projected liability of the Retirement Plan will be impacted by the fluctuations of interest rates on high quality bonds in the public markets as these are inputs in determining our minimum funding requirements. Specifically, decreases in these interest rates may have an adverse effect on our funding obligations. To the extent financial markets experience future declines similar to those experienced in fiscal 2008 through the beginning of fiscal 2010, and/or interest rates on high quality bonds in the public markets decline, our required contributions may increase for future years as our funded status decreases, which could have an adverse effect on our liquidity.
Failure to successfully renegotiate union contracts could result in work stoppages.
As of June 27, 2015, approximately 9,446 employees at 55 operating companies were members of 58 different local unions associated with the International Brotherhood of Teamsters and other labor organizations. In fiscal 2016, 24 agreements covering approximately 3,500 employees have expired or will expire. Failure of our operating companies to effectively renegotiate these contracts could result in work stoppages. Although our operating subsidiaries have not experienced any significant labor disputes or work stoppages to date, and we believe they have satisfactory relationships with their unions, a work stoppage due to failure of multiple operating subsidiaries to renegotiate union contracts could have a material adverse effect on us.
A shortage of qualified labor could negatively affect our business and materially reduce earnings.
The future success of our operations, including the achievement of our strategic objectives, depends on our ability to identify, recruit, develop and retain qualified and talented individuals, and any shortage of qualified labor could significantly affect our business. Our employee recruitment, development and retention efforts may not be successful, resulting in a shortage of qualified individuals in future periods. Any such shortage would decrease Sysco’s ability to effectively serve our customers and achieve our strategic objectives. Such a shortage would also likely lead to higher wages for employees and a corresponding reduction in our net earnings.
11
Our authorized preferred stock provides anti-takeover benefits that may not be viewed as beneficial to stockholders.
Under our Restated Certificate of Incorporation, Sysco’s Board of Directors is authorized to issue up to 1,500,000 shares of preferred stock without stockholder approval. Issuance of these shares could make it more difficult for anyone to acquire Sysco without approval of the Board of Directors, depending on the rights and preferences of the stock issued. In addition, if anyone attempts to acquire Sysco without approval of the Board of Directors of Sysco, the existence of this undesignated preferred stock could allow the Board of Directors to adopt a shareholder rights plan without obtaining stockholder approval, which could result in substantial dilution to a potential acquirer. As a result, hostile takeover attempts that might result in an acquisition of Sysco, which could otherwise have been financially beneficial to our stockholders, could be deterred.
Item 1B. Unresolved Staff Comments
None.
12
Item 2. Properties
The table below shows the number of distribution facilities occupied by Sysco in each state, province or country and the aggregate square footage devoted to cold and dry storage as of June 27, 2015.
Location | Number of Facilities | Cold Storage (Square Feet in thousands) | Dry Storage (Square Feet in thousands) | Segment Served* | ||||||
Alabama | 2 | 185 | 131 | BL | ||||||
Alaska | 1 | 41 | 28 | BL | ||||||
Arizona | 1 | 228 | 140 | BL | ||||||
Arkansas | 2 | 130 | 88 | BL, O | ||||||
California | 17 | 1,414 | 1,273 | BL, S, O | ||||||
Colorado | 4 | 275 | 213 | BL, S, O | ||||||
Connecticut | 3 | 156 | 110 | BL, O | ||||||
District of Columbia | 2 | 52 | 42 | O | ||||||
Florida | 15 | 1,236 | 974 | BL, S, O | ||||||
Georgia | 5 | 267 | 416 | BL, S, O | ||||||
Idaho | 3 | 95 | 92 | BL, O | ||||||
Illinois | 6 | 410 | 411 | BL, S, O | ||||||
Indiana | 1 | 100 | 109 | BL | ||||||
Iowa | 1 | 93 | 95 | BL | ||||||
Kansas | 1 | 177 | 171 | BL | ||||||
Kentucky | 1 | 91 | 106 | BL | ||||||
Louisiana | 1 | 134 | 113 | BL | ||||||
Maine | 1 | 58 | 50 | BL | ||||||
Maryland | 2 | 318 | 255 | BL | ||||||
Massachusetts | 1 | 218 | 188 | BL | ||||||
Michigan | 3 | 320 | 300 | BL, S | ||||||
Minnesota | 3 | 233 | 195 | BL | ||||||
Mississippi | 1 | 95 | 69 | BL | ||||||
Missouri | 2 | 105 | 95 | BL, S | ||||||
Montana | 1 | 121 | 121 | BL | ||||||
Nebraska | 1 | 144 | 129 | BL | ||||||
Nevada | 3 | 199 | 154 | BL, O | ||||||
New Jersey | 5 | 143 | 502 | BL, O | ||||||
New Mexico | 1 | 121 | 108 | BL | ||||||
New York | 4 | 417 | 361 | BL, O | ||||||
North Carolina | 6 | 325 | 308 | BL, S, O | ||||||
North Dakota | 1 | 46 | 59 | BL | ||||||
Ohio | 7 | 407 | 475 | BL, S, O | ||||||
Oklahoma | 3 | 189 | 152 | BL, S, O | ||||||
Oregon | 3 | 176 | 156 | BL, S, O | ||||||
Pennsylvania | 5 | 542 | 405 | BL, S | ||||||
Rhode Island | 1 | 2 | — | O | ||||||
South Carolina | 1 | 191 | 98 | BL | ||||||
Tennessee | 5 | 406 | 426 | BL, O | ||||||
Texas | 18 | 1,130 | 1,241 | BL, S, O | ||||||
Utah | 1 | 161 | 107 | BL | ||||||
Virginia | 3 | 628 | 419 | BL, O | ||||||
Washington | 1 | 134 | 92 | BL | ||||||
Wisconsin | 3 | 287 | 299 | BL, O | ||||||
Bahamas | 1 | 90 | 23 | BL | ||||||
Alberta, Canada | 3 | 207 | 199 | O | ||||||
British Columbia, Canada | 8 | 309 | 279 | BL, O | ||||||
13
Location | Number of Facilities | Cold Storage (Square Feet in thousands) | Dry Storage (Square Feet in thousands) | Segment Served* | ||||||
Manitoba, Canada | 1 | 79 | 74 | BL | ||||||
New Brunswick, Canada | 2 | 57 | 46 | BL | ||||||
Newfoundland, Canada | 1 | 33 | 41 | BL | ||||||
Nova Scotia, Canada | 1 | 39 | 47 | BL | ||||||
Ontario, Canada | 12 | 602 | 525 | BL, O | ||||||
Quebec, Canada | 7 | 129 | 245 | BL, O | ||||||
Saskatchewan, Canada | 1 | 40 | 54 | BL | ||||||
Ireland | 6 | 230 | 149 | BL | ||||||
Northern Ireland | 1 | 2 | 8 | BL | ||||||
Puerto Rico | 1 | 8 | — | O | ||||||
Totals | 197 | 14,025 | 12,966 | |||||||
* Segments served include Broadline (BL), SYGMA (S), and Other (O).
We own approximately 22,384,000 square feet of our distribution facilities (or 82.9% of the total square feet), and the remainder is occupied under leases expiring at various dates from fiscal 2016 to fiscal 2032, exclusive of renewal options.
We own our approximately 625,000 square foot headquarters office complex in Houston, Texas. In addition, we own our approximately 669,000 square foot shared services complex in Cypress, Texas.
We are currently constructing expansions, replacement or fold-out facilities for our distribution facilities in Maryland, Virginia, and Texas. These operating companies, in the aggregate, accounted for approximately 1% of fiscal 2015 sales.
As of June 27, 2015, our fleet of approximately 9,600 delivery vehicles consisted of tractor and trailer combinations, vans and panel trucks, most of which are either wholly or partially refrigerated for the transportation of frozen or perishable foods. We own approximately 95% of these vehicles and lease the remainder.
Item 3. Legal Proceedings
In the second quarter of fiscal 2014, the company announced an agreement to merge with US Foods, Inc. (US Foods). In February 2015, following completion of its regulatory review of the proposed merger, the US Federal Trade Commission filed a motion with the U.S. District Court for the District of Columbia (the Court) seeking a preliminary injunction to prevent the parties from closing the merger, which the Court granted on June 23, 2015. On June 26, 2015, the parties terminated the merger agreement.
Item 4. Mine Safety Disclosures
Not applicable.
PART II
Item 5. Market for Registrant's Common Equity, Related Stockholder Matters and Issuer Repurchases of Equity Securities
The principal market for Sysco’s common stock (SYY) is the New York Stock Exchange. The table below sets forth the high and low sales prices per share for our common stock as reported on the New York Stock Exchange Composite Tape and the cash dividends declared for the periods indicated.
14
Dividends | ||||||||||||
Common Stock Prices | Declared | |||||||||||
High | Low | Per Share | ||||||||||
Fiscal 2014: | ||||||||||||
First Quarter | $ | 36.05 | $ | 31.37 | $ | 0.28 | ||||||
Second Quarter | 43.40 | 31.13 | 0.29 | |||||||||
Third Quarter | 37.08 | 34.07 | 0.29 | |||||||||
Fourth Quarter | 37.92 | 35.31 | 0.29 | |||||||||
Fiscal 2015: | ||||||||||||
First Quarter | $ | 38.85 | $ | 35.50 | $ | 0.29 | ||||||
Second Quarter | 41.16 | 35.82 | 0.30 | |||||||||
Third Quarter | 41.45 | 37.81 | 0.30 | |||||||||
Fourth Quarter | 38.99 | 35.84 | 0.30 | |||||||||
The number of record owners of Sysco’s common stock as of August 13, 2015 was 10,877.
We made the following share repurchases during the fourth quarter of fiscal 2015:
ISSUER PURCHASES OF EQUITY SECURITIES | |||||||||||||
Period | (a) Total Number of Shares Purchased (1) | (b) Average Price Paid per Share | (c) Total Number of Shares Purchased as Part of Publicly Announced Plans or Programs | (d) Maximum Number of Shares that May Yet Be Purchased Under the Plans or Programs | |||||||||
Month #1 | |||||||||||||
March 29 – April 25 | 5,168 | $ | 38.16 | — | 11,655,197 | ||||||||
Month #2 | |||||||||||||
April 26 – May 23 | 805 | 36.61 | — | 11,655,197 | |||||||||
Month #3 | |||||||||||||
May 24 – June 27 | 2,012 | 37.58 | — | 11,655,197 | |||||||||
Total | 7,985 | $ | 37.86 | — | 11,655,197 | ||||||||
(1) The shares purchased in all 3 months represented shares tendered by individuals in connection with stock option exercises.
The remaining authorization to purchase 11,655,197 shares from the repurchase program, included in the table above, expired on August 23, 2015. In June 2015, our Board of Directors approved a repurchase program to repurchase from time to time in the open market, through an accelerated share repurchase program or through privately negotiated transactions, shares of the company's common stock in an amount not to exceed $3.0 billion during the two year period ending July 1, 2017, including $1.5 billion through a planned accelerated share repurchase in fiscal 2016, in addition to amounts normally repurchased to offset benefit plan and stock option dilution. In addition to this share repurchase program approved in June, in August 2015, our Board of Directors approved the repurchase of up to 20,000,000 shares for an aggregate purchase price not to exceed $800 million. The authorization expires on August 21, 2017. Pursuant to the repurchase program, shares may be acquired in the open market or in privately negotiated transactions at the company’s discretion, subject to market conditions and other factors.
The Board of Directors has authorized us to enter into agreements from time to time to extend our ongoing repurchase program to include repurchases during company announced “blackout periods” of such securities in compliance with Rule 10b5-1 promulgated under the Securities Exchange Act of 1934 (Exchange Act).
Stock Performance Graph
The following performance graph and related information shall not be deemed “soliciting material” or to be “filed” with the Securities and Exchange Commission, nor shall such information be incorporated by reference into any future filing under the Securities Act of 1933 or the Exchange Act, each as amended, except to the extent that Sysco specifically incorporates such information by reference into such filing.
The following stock performance graph compares the performance of Sysco’s Common Stock to the S&P 500 Index and to the S&P 500 Food/Staple Retail Index for Sysco’s last five fiscal years.
15
The graph assumes that the value of the investment in our Common Stock, the S&P 500 Index, and the S&P 500 Food/Staple Retail Index was $100 on the last trading day of fiscal 2010, and that all dividends were reinvested. Performance data for Sysco, the S&P 500 Index and the S&P 500 Food/Staple Retail Index is provided as of the last trading day of each of our last five fiscal years.
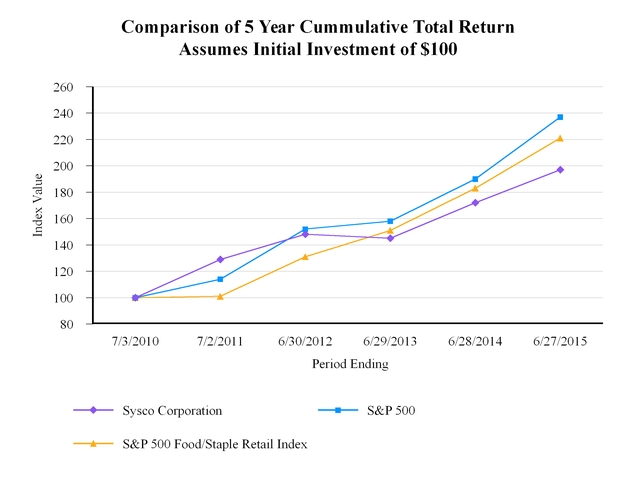
7/3/2010 | 7/2/2011 | 6/30/2012 | 6/29/2013 | 6/28/2014 | 6/27/2015 | |
Sysco Corporation | $100 | $129 | $148 | $145 | $172 | $197 |
S&P 500 | 100 | 114 | 152 | 158 | 190 | 237 |
S&P 500 Food/Staple Retail Index | 100 | 101 | 131 | 151 | 183 | 221 |
16
Item 6. Selected Financial Data
Fiscal Year | ||||||||||||||||||||
2015 | 2014 | 2013 | 2012 | 2011 | ||||||||||||||||
(In thousands except for per share data) | ||||||||||||||||||||
Sales | $ | 48,680,752 | $ | 46,516,712 | $ | 44,411,233 | $ | 42,380,939 | $ | 39,323,489 | ||||||||||
Operating income (1) | 1,229,362 | 1,587,122 | 1,658,478 | 1,890,632 | 1,931,502 | |||||||||||||||
Earnings before income taxes (1) | 1,008,147 | 1,475,624 | 1,547,455 | 1,784,002 | 1,827,454 | |||||||||||||||
Income taxes (1) | 321,374 | 544,091 | 555,028 | 662,417 | 675,424 | |||||||||||||||
Net earnings (1) | $ | 686,773 | $ | 931,533 | $ | 992,427 | $ | 1,121,585 | $ | 1,152,030 | ||||||||||
Net earnings: | ||||||||||||||||||||
Basic earnings per share (1) | $ | 1.16 | $ | 1.59 | $ | 1.68 | $ | 1.91 | $ | 1.96 | ||||||||||
Diluted earnings per share (1) | 1.15 | 1.58 | 1.67 | 1.90 | 1.96 | |||||||||||||||
Dividends declared per share | $ | 1.19 | $ | 1.15 | $ | 1.11 | $ | 1.07 | $ | 1.03 | ||||||||||
Total assets | $ | 17,989,281 | $ | 13,141,113 | $ | 12,678,208 | $ | 12,137,207 | $ | 11,427,190 | ||||||||||
Capital expenditures | 542,830 | 523,206 | 511,862 | 784,501 | 636,442 | |||||||||||||||
Current maturities of long-term debt (2) | $ | 4,979,301 | $ | 304,777 | $ | 207,301 | $ | 254,650 | $ | 207,031 | ||||||||||
Long-term debt | 2,271,825 | 2,357,330 | 2,627,544 | 2,749,304 | 2,268,204 | |||||||||||||||
Total long-term debt | 7,251,126 | 2,662,107 | 2,834,845 | 3,003,954 | 2,475,235 | |||||||||||||||
Shareholders’ equity | 5,260,224 | 5,266,695 | 5,191,810 | 4,685,040 | 4,705,242 | |||||||||||||||
Total capitalization | $ | 12,511,350 | $ | 7,928,802 | $ | 8,026,655 | $ | 7,688,994 | $ | 7,180,477 | ||||||||||
Ratio of long-term debt to capitalization (2) | 58.0 | % | 33.6 | % | 35.3 | % | 39.1 | % | 34.5 | % | ||||||||||
(1) Our results of operations are impacted by Certain Items, that have resulted in reduced earnings on a GAAP basis. See “Non-GAAP Reconciliations,” within Management’s Discussion and Analysis of Financial Condition and Results of Operations, for our results on an adjusted basis that exclude Certain Items.
(2) As discussed in Note 11, "Debt and Other Financing Arrangements," our current maturities of long-term debt include senior notes issued for the proposed merger with US Foods that were required to be redeemed due to the termination of the merger agreement. We redeemed these notes in July 2015.
Our financial results are impacted by accounting changes and the adoption of various accounting standards. See Note 2, "Changes in Accounting" to the Consolidated Financial Statements in Item 8 for further discussion.
Item 7. Management’s Discussion and Analysis of Financial Condition and Results of Operations
Our discussion below of our results includes certain non-GAAP financial measures that we believe provide important perspective with respect to underlying business trends and results and provides meaningful supplemental information to both management and investors that is indicative of the performance of the company’s underlying operations and facilitates comparison on a year-over-year basis. Other than free cash flow, any non-GAAP financial measures will be denoted as adjusted measures and exclude the impact from multiemployer pension withdrawal charges, severance charges, integration planning, litigation costs and termination costs in connection with the merger that had been proposed with U.S. Foods, Inc. (US Foods), facility closure charges and US Foods related financing costs. Additional items in fiscal 2014 include a change in estimate of self-insurance, and charges from a contingency accrual. These fiscal 2015 and 2014 items are collectively referred to as (Certain Items). Our US Foods financing costs include the write off of unamortized debt issuance costs when our bridge acquisition facility was terminated upon the issuance of our senior notes in October 2014 and interest expense on those senior notes. In fiscal 2014, costs from executive
17
retirement plans restructuring were included within Certain Items; however, because these costs in fiscal 2015 are comparable to fiscal 2014, these were not included in the Certain Items definition for the comparison of adjusted results for fiscal 2015 to fiscal 2014. This continues to be presented as a Certain Item in the comparison of adjusted results for fiscal 2014 to fiscal 2013. More information on the rationale for the use of these measures and reconciliations to GAAP numbers can be found under “Non-GAAP Reconciliations” and "Liquidity and Capital Resources."
Overview
Sysco distributes food and related products to restaurants, healthcare and educational facilities, lodging establishments and other foodservice customers. Our primary operations are located throughout the United States (U.S.), Bahamas, Canada, Costa Rica, Ireland and Mexico and include broadline companies, SYGMA (our chain restaurant distribution subsidiary), specialty produce companies, custom-cut meat companies, hotel supply operations, a company that distributes specialty imported products, a company that distributes to international customers and our Sysco Ventures platform, which includes our suite of technology solutions that help support the business needs of our customers.
We consider our primary market to be the foodservice market in the U.S., Canada and Ireland and estimate that we serve about 17.7% of this approximately $264 billion annual market based on a measurement as of the end of calendar 2014. We use industry data obtained from various sources including Technomic, Inc., the Canadian Restaurant and Foodservices Association and the Irish Food Board to calculate this measurement. According to industry sources, the foodservice, or food-away-from-home, market represents approximately 48% of the total dollars spent on food purchases made at the consumer level in the U.S. as of the end of calendar 2014.
Industry sources estimate the total foodservice market in the U.S. experienced a real sales increase of approximately 0.7% in calendar year 2014 and 1.1% in calendar year 2013. Real sales changes do not include the impact of inflation or deflation.
Highlights
The foodservice industry performance in fiscal 2015 was generally improved. Consumer confidence and the outlook of foodservice operators are at high levels, but have decreased slightly in the summer months of 2015. Fuel prices declined during fiscal 2015 and are currently at lower levels, as compared to recent years, that may support higher consumer spending in the future. Spending at restaurants is generally improved, but customer traffic levels are generally unchanged. Overall, the market environment appears to be modestly improved as compared to the prior two years; however, uncertainty in industry growth remains for fiscal 2016. Amid these conditions, we provided our customers with excellent service, growing our business with both our locally and corporate managed customers and stabilizing our gross margins by successfully implementing several value-added commercial initiatives. We improved our expense management performance as the year progressed, achieving greater success managing expenses in the second half of the year as compared to the first half. The impact of Certain Items contributed to lower earnings in fiscal 2015 as compared to fiscal 2014, primarily from the costs associated with the merger that had been proposed with US Foods.
Comparison of results from fiscal 2015 to fiscal 2014:
• | Sales increased 4.7%, or $2.2 billion to $48.7 billion; |
• | Gross profit increased 4.5%, or $370.5 million to $8.6 billion; |
• | Operating income decreased 22.5%, or $0.4 billion, to $1.2 billion; |
• | Adjusted operating income increased 3.4%, or $58.2 million, to $1.8 billion; |
• | Net earnings decreased 26.3%, or $244.8 million, to $0.7 billion; |
• | Adjusted net earnings increased 6.4%, or $66.3 million, to $1.1 billion; |
• | Basic earnings per share in fiscal 2015 was $1.16, a 27% decrease from the comparable prior year period amount of $1.59 per share. Diluted earnings per share in fiscal 2015 was $1.15, a 27.2% decrease from the comparable prior year period amount of $1.58 per share; and |
• | Adjusted diluted earnings per share was $1.84 in fiscal 2015, a 5.1% increase from the comparable prior year amount of $1.75 per share. |
See “Non-GAAP Reconciliations” for an explanation of these non-GAAP financial measures.
Business Transformation
In fiscal 2015, we completed the three-year financial objectives of our Business Transformation. These financial objectives were largely designed to lower our product cost and lower our operating cost structure. We implemented a category management
18
program to leverage our scale and develop deeper, more strategic relationships with our suppliers to drive growth and innovation. We also implemented multiple initiatives to lower our operating cost structure including a more streamlined and standard approach to the management of fleet, labor, maintenance, procurement and supplies. Our goal for the project was to generate approximately $550 million to $650 million in annual benefits to be achieved by fiscal 2015. We exceeded our final three-year target for annualized benefits.
US Foods Merger Termination
We sought to merge with US Foods, a leading foodservice distributor in the U.S. The merger was reviewed by the Federal Trade Commission (FTC) and in February 2015, the FTC commissioners voted 3 to 2 to authorize the FTC staff to seek a preliminary injunction from the U.S. District Court for the District of Columbia preventing the parties from closing the merger. In June 2015, the preliminary injunction was granted. Shortly thereafter, the parties involved agreed to terminate the merger agreement, as a result of which Sysco was obligated to pay $300 million to the owners of US Foods. During the review period with the FTC, Sysco created a divestiture package, comprised of the sale of 11 US Foods facilities to Performance Food Group (PFG), which was contingent on the closing of the merger. This divestiture agreement entitled PFG to receive a $25 million termination fee if the sale of the divestiture package was terminated before July 6, 2015, with each of Sysco and US Foods responsible for one half of the applicable fee. Sysco accrued for termination payments totaling $312.5 million in fiscal 2015 and paid these amounts in fiscal 2016.
The following tables outline our expenses attributable to our integration planning, litigation and termination costs and financing activities, for the periods presented:
2015 | 2014 | ||||||
(In thousands) | |||||||
Operating expense | $ | 554,667 | $ | 90,571 | |||
Interest expense | 138,422 | 6,790 | |||||
Total | $ | 693,089 | $ | 97,361 | |||
Fiscal 2015 Acquisitions
Mayca Distribuidores
In the first quarter of fiscal 2015, we acquired a 50% interest in Mayca Distribuidores (Mayca) of Costa Rica and three other affiliates. Mayca, which has been in business since 1995, is a leading food distributor across Costa Rica. In addition to its distribution business, Mayca has a retail cash-and-carry affiliate with multiple locations, a cold-storage company and a truck-leasing company.
Pacific Star Foodservice
In the fourth quarter of fiscal 2015, we acquired a 50% interest in Pacific Star Foodservice, a leading foodservice distributor in Mexico. Pacific Star has operated since 1989 with distribution centers servicing Mexico City, Guadalajara, Monterrey and Tijuana and primarily services chain restaurants, including fast food and casual dining restaurants, casinos, theme parks, movie theaters and hotels throughout Mexico.
Tannis Foodservice
In the fourth quarter of fiscal 2015, we acquired Tannis Trading, Inc., a broadline foodservice distributor in Ottawa, Ontario. Tannis has a 75-year history of providing quality service to customers in Ottawa, Canada's fourth-largest metropolitan market, and the surrounding areas.
Trends and Strategy
Trends
General economic conditions can affect the frequency of purchases and amounts spent by consumers for food-away-from-home and, in turn, can impact our customers and our sales. Consumer confidence and employment metrics, such as
19
unemployment rates, have shown some signs of improvement during fiscal 2015; however, consumer spending has been cautious. Fuel prices are currently at lower levels, as compared to recent years, that may support higher consumer spending in the future. Overall, the market environment appears to be modestly improved as compared to the prior two years; however, uncertainty in industry growth remains for fiscal 2016. One industry resource, Technomic, Inc., has projected roughly 2% real growth annually. Real growth excludes the impact of inflation or deflation.
Our sales and gross profit performance can be influenced by multiple factors including price, volume and product mix. The modest level of growth in the foodservice market has created additional competitive pricing pressures, which is, in turn, negatively impacting sales and gross profits. Case growth with our locally-managed Broadline business is an important contributor to gross profit dollar growth. Our locally-managed customers, including independent restaurant customers, comprise a significant portion of our overall volumes and an even greater percentage of profitability due to the high level of value added services we typically provide to this customer group. Through focused efforts, our locally-managed case volume growth has accelerated over the past three years. Our sales to corporate-managed customers, including chain restaurants and multi-locational restaurants, also comprise a significant portion of our overall volumes. Gross margin on sales to our corporate-managed customers is generally lower than sales to other types of customers due to the higher volumes we sell to these customers. Case growth for our corporate-managed customers remained strong, but competitive pricing pressure has constrained our gross margins. Inflation is a factor that contributes to the level of sales and gross profit growth and can be a factor that contributes to gross margin pressure. Food cost inflation in fiscal 2015 was 3.7%, an increase from 2.1% experienced in fiscal 2014. Our inflation rates were higher in the first half of fiscal 2015, reaching levels of 6.0% at the mid-point of the fiscal year and dropping to 0.1% by the end of the fiscal year. While we cannot predict whether inflation will continue at current levels, periods of high inflation, either overall or in certain product categories, can have a negative effect on us and our customers. High food costs can be difficult to pass on to our customers. In addition, rapid declines in prices can make it challenging to leverage our fixed costs. Our category management initiative has helped us to manage our gross margin performance in response to several of these factors. Lastly, changes in foreign exchange rates are having a larger impact on our sales as compared to recent fiscal years. The strengthening U.S. dollar is depressing our foreign sales as we convert them to U.S. dollars. The impact of foreign exchange rates for fiscal 2015 was a 1.0% year-over-year decrease to sales growth. This impact has typically been in the range of 0% to 0.5%.
We have experienced higher operating expenses in fiscal 2015 as compared to fiscal 2014, primarily from increased payroll costs and integration planning, litigation and termination costs in connection with the merger that had been proposed with US Foods. We anticipate a low level of operating expenses attributable to the merger termination in the first quarter of fiscal 2016. Our payroll costs have been influenced by higher pay in our sales organization as a result of higher gross profits, investment in new administrative support capabilities, higher management incentive accruals due to improved performance against our incentive targets and companies acquired within the last 12 months. Sales and gross profit growth partially contributed to an increase in sales pay-related expenses due to increases in sales commissions and bonuses. In addition, we have increased our marketing associate headcount in certain markets in order to invest in future sales growth.
In October 2014, we secured long-term financing for the proposed merger with US Foods; therefore, interest expense increased in fiscal 2015 as compared to fiscal 2014. The October 2014 senior notes contained mandatory redemption features providing that, if the merger agreement were terminated on or prior to October 8, 2015, we were required to redeem all of the senior notes at a redemption price equal to 101% of the principal of the senior notes plus accrued interest. In June 2015, we terminated the merger agreement and redeemed the senior notes in July 2015 using cash on hand and the proceeds from borrowings under our commercial paper facility. In fiscal 2016, we will recognize several charges from the redemption of these senior notes including $50.0 million in premium fees, $29 million in unamortized debt issuance costs and $18.0 million in unamortized bond discounts each of which had resulted from the issuance of the senior notes in October 2014. We had hedged $1.25 billion of this debt by swapping the fixed rates to floating rates with the goal of reducing overall borrowing cost. We terminated these swaps in July 2015 and will recognize a gain of $10.0 million from the fair value adjustment that had been recorded on the underlying debt. Our interest expense on the notes was treated as a Certain Item in fiscal 2015, since the proposed merger had not closed. Similarly, these charges and gain associated with the repayment of these notes will be presented as Certain Items in fiscal 2016. As discussed in Note 9, “Derivative Financial Instruments,” two forward starting swap agreements used to hedge interest rate risk exposure on our October 2014 senior notes issuance were previously terminated and were paid in the amount of $188.8 million. The resulting amounts recorded as a loss are currently amortizing into interest expense at a rate of $2.5 million per quarter for the next 9 years and $1.1 million per quarter thereafter for another 19 years. These amounts will continue to amortize into interest expense as the amount hedged is anticipated to remain within our capital structure.
Following the termination of the merger agreement, we announced a $3 billion, two-year share repurchase program. We intend to execute the first half of this program through an accelerated repurchase program near the end of first quarter of fiscal 2016. We expect to issue $2.0 billion of debt at approximately the same time and we intend to use a majority of the proceeds to fund these repurchases. These actions will lower our basic and diluted shares outstanding providing an expected earnings per share benefit of approximately $0.03 to $0.04 per share. This estimate includes a 4% to 5% reduction in average shares outstanding,
20
partially offset by higher interest expense from the new debt issuance. Because the share repurchase will take place near the end of the first quarter of fiscal 2016, we will not realize a full-year's benefit from the reduction in shares in fiscal 2016; however, the full-year benefit will be realized in fiscal 2017.
Sysco’s fiscal year ends on the Saturday nearest to June 30th. We will have a 53-week year ending July 2, 2016 for fiscal 2016, and this additional week will be presented as a Certain Item in fiscal 2016.
Strategy
We are focused on optimizing our core broadline business in the U.S., Bahamas, Canada, Costa Rica, Ireland and Mexico, while continuing to explore appropriate opportunities to profitably grow our market share and create shareholder value by expanding beyond our core business. Day-to-day, our business decisions are driven by our mission to market and deliver great products to our customers with exceptional service, with the aspirational vision of becoming each of our customers’ most valued and trusted business partner. We have identified five components of our strategy to help us achieve our mission and vision as follows:
• | Profoundly enrich the experience of doing business with Sysco: Our primary focus is to help our customers succeed. We believe that by building on our current competitive advantages, we will be able to further differentiate our offering to customers. Our competitive advantages include our sales force of over 7,300 marketing associates; our diversified product base, which includes quality-assured Sysco brand products; the suite of services we provide to our customers such as business reviews and menu analysis; and our multi-regional presence in the U.S. and Canada. In addition, we have a portfolio of businesses spanning broadline, chain restaurant distribution, specialty produce, specialty meat, hotel amenities, specialty import and export which serves our customers’ needs across a wide array of business segments. Through our Sysco Ventures platform, we are developing a suite of technology solutions that help support the administrative needs of our customers. We believe this strategy of enriching the experience of doing business with Sysco will increase customer retention and profitably accelerate sales growth with both existing and new customers. |
• | Continuously improve productivity in all areas of our business: We continually strive to improve productivity and reduce costs. From implementing an integrated software system to leveraging the power of our end-to-end supply chain, we continue to look for ways to improve our service to our customers and lower costs. |
• | Expand our portfolio of products and services by initiating a customer-centric innovation program: We continually explore opportunities to provide new and improved products, technologies and services to our customers. |
• | Explore, assess and pursue new businesses and markets: This strategy is focused on identifying opportunities to expand the core business through growth in new international markets and in adjacent areas that complement our core foodservice distribution business. As a part of our ongoing strategic analysis, we regularly evaluate business opportunities, including potential acquisitions, joint ventures and sales of assets and businesses. |
• | Develop and effectively integrate a comprehensive, enterprise-wide talent management process: Our ability to drive results and grow our business is directly linked to having the best talent in the industry. We are committed to the continued enhancement of our talent management programs in terms of how we recruit, select, train and develop our associates throughout Sysco, as well as succession planning. Our ultimate objective is to provide our associates with outstanding opportunities for professional growth and career development. |
In fiscal 2016, to further our strategy, we see opportunities to further accelerate case growth, especially with our locally-managed sales customers through improved product and service differentiation combined with enhanced sales and technology capabilities. We will continue to build on our success in stabilizing gross margin through enhanced product innovation, growing privately-branded product sales and improving pricing analytics and support. There continues to be opportunity to improve our productivity and reduce overhead costs in our supply chain organization and administrative areas of our business. We will continue to invest in our business to fully realize the benefits and improve our return on invested capital.
Results of Operations
The following table sets forth the components of our consolidated results of operations expressed as a percentage of sales for the periods indicated:
21
2015 | 2014 | 2013 | ||||||
Sales | 100.0 | % | 100.0 | % | 100.0 | % | ||
Cost of sales | 82.4 | 82.4 | 82.0 | |||||
Gross profit | 17.6 | 17.6 | 18.0 | |||||
Operating expenses | 15.0 | 14.2 | 14.3 | |||||
Operating income | 2.6 | 3.4 | 3.7 | |||||
Interest expense | 0.5 | 0.2 | 0.3 | |||||
Other expense (income), net | (0.1 | ) | (0.0 | ) | (0.0 | ) | ||
Earnings before income taxes | 2.2 | 3.2 | 3.4 | |||||
Income taxes | 0.7 | 1.2 | 1.2 | |||||
Net earnings | 1.5 | % | 2.0 | % | 2.2 | % | ||
The following table sets forth the change in the components of our consolidated results of operations expressed as a percentage increase or decrease over the prior year:
2015 | 2014 | ||||
Sales | 4.7 | % | 4.7 | % | |
Cost of sales | 4.7 | 5.3 | |||
Gross profit | 4.5 | 2.3 | |||
Operating expenses | 11.0 | 4.0 | |||
Operating income | (22.5 | ) | (4.3 | ) | |
Interest expense | 105.9 | (3.7 | ) | ||
Other expense (income), net (1) | 174.4 | (29.9 | ) | ||
Earnings before income taxes | (31.7 | ) | (4.6 | ) | |
Income taxes | (40.9 | ) | (2.0 | ) | |
Net earnings | (26.3 | )% | (6.1 | )% | |
Basic earnings per share | (27.0 | )% | (5.4 | )% | |
Diluted earnings per share | (27.2 | ) | (5.4 | ) | |
Average shares outstanding | 1.0 | (0.6 | ) | ||
Diluted shares outstanding | 1.1 | (0.4 | ) | ||
(1) Other expense (income), net was income of $33.6 million in fiscal 2015, $12.2 million in fiscal 2014 and $17.5 million in fiscal 2013.
Sales
Sales for fiscal 2015 were 4.7% higher than fiscal 2014. Sales for fiscal 2015 increased as a result of product cost inflation and the corresponding increase in selling prices, case volume growth, and sales from acquisitions that occurred within the last 12 months. Changes in product costs, an internal measure of inflation or deflation, were estimated as inflation of 3.7% during fiscal 2015, driven mainly by inflation in the meat, seafood and dairy categories. Case volumes including acquisitions within the last 12 months improved 2.6% in fiscal 2015. Case volumes excluding acquisitions within the last 12 months improved 2.4% in fiscal 2015. Our case volumes represent our results from our Broadline and SYGMA segments combined. Sales from acquisitions within the last 12 months favorably impacted sales by 0.6% in fiscal 2015. The changes in the exchange rates used to translate our foreign sales into U.S. dollars negatively impacted sales by 1.0% in fiscal 2015.
Sales for fiscal 2014 were 4.7% higher than fiscal 2013. Sales for fiscal 2014 increased as a result of product cost inflation and the resulting increase in selling prices, sales from acquisitions that occurred within the last 12 months and case volume growth. Our sales growth in fiscal 2014 was greater with our corporate-managed customers as compared to sales growth with our locally-managed customers. We believe our locally-managed customer sales growth was negatively influenced by less favorable consumer sentiment. Case volumes excluding acquisitions within the last 12 months improved 2.2% in fiscal 2014. Our case volumes represent our results from our Broadline and SYGMA segments combined. Sales from acquisitions within the last 12 months favorably impacted sales by 1.4%% for fiscal 2014. Case volumes including acquisitions within the last 12 months
22
improved approximately 3.4% in fiscal 2014. Changes in product costs, an internal measure of inflation or deflation, were estimated as inflation of 2.1% during fiscal 2014. The changes in the exchange rates used to translate our foreign sales into U.S. dollars did not have a significant impact on sales when compared to fiscal 2013.
Operating Income
Cost of sales primarily includes our product costs, net of vendor consideration, and includes in-bound freight. Operating expenses include the costs of facilities, product handling, delivery, selling and general and administrative activities. Fuel surcharges are reflected within sales and gross profit; fuel costs are reflected within operating expenses.
Fiscal 2015 vs. Fiscal 2014
The following table sets forth the change in the components of operating income and adjusted operating income expressed as a percentage increase or decrease over the prior year:
2015 | 2014 | Change in Dollars | % Change | |||||||||||
(Dollars in thousands) | ||||||||||||||
Gross profit | $ | 8,551,516 | $ | 8,181,035 | $ | 370,481 | 4.5 | % | ||||||
Operating expenses | 7,322,154 | 6,593,913 | $ | 728,241 | 11.0 | % | ||||||||
Operating income | $ | 1,229,362 | $ | 1,587,122 | $ | (357,760 | ) | (22.5 | )% | |||||
Gross profit | $ | 8,551,516 | $ | 8,181,035 | $ | 370,481 | 4.5 | % | ||||||
Adjusted operating expenses (Non-GAAP) | 6,759,687 | 6,447,405 | $ | 312,282 | — | |||||||||
Adjusted operating income (Non-GAAP) | $ | 1,791,829 | $ | 1,733,630 | $ | 58,199 | 3.4 | % | ||||||
The decrease in operating income was impacted by an increase of $416.0 million in operating expenses attributable to Certain Items. Adjusted operating income increased due to gross profit dollar growth partially offset by increased expenses from greater case volumes, higher incentive accruals, higher pay for our sales organization as a result of higher gross profit, investment in administrative support capabilities and acquired operations.
Gross profit dollars increased in fiscal 2015 as compared to fiscal 2014 primarily due to increased sales volumes, stronger relative mix of sales to our locally-managed customers and benefits from category management. Gross margin, which is gross profit as a percentage of sales, was 17.57% in fiscal 2015, a decline of 2 basis points from the gross margin of 17.59% in fiscal 2014. Increased competition resulting from a slow-growth market and volatile inflation has pressured our gross margins; however, sales and mix, as well as our category management initiative have helped us stabilize our gross margin performance. Inflation in fiscal 2015 was 3.7%, an increase from 2.1% experienced in fiscal 2014. Our inflation rates were higher in the first half of fiscal 2015, reaching 6.0% at the mid-point of the fiscal year and dropping to 0.1% by the end of the fiscal year. Fiscal 2015 inflation was seen primarily in the meat, dairy and poultry categories.
Operating expenses for fiscal 2015 increased 11.0%, or $728.2 million, over fiscal 2014. Adjusted operating expenses for fiscal 2015 increased 4.8%, or $312.3 million, over fiscal 2014. These increases in adjusted operating expenses were primarily due to increased expenses from greater case volumes, higher incentive accruals, higher pay for our sales organization as a result of higher gross profit, investment in administrative support capabilities and acquired operations. Partially offsetting this increase, was a reduction in fuel costs and provisions for losses on receivables. Sysco’s operating expenses were impacted by Certain Items, which resulted in an increase in operating expenses of $416 million in fiscal 2015 as compared to fiscal 2014. More information on the rationale of the use of adjusted operating expense and adjusted operating income and reconciliations to GAAP numbers can be found under “Non-GAAP Reconciliations.”
Operating Expenses Impacting Adjusted Operating Income
Our operating expenses increased in fiscal 2015 as compared to fiscal 2014 partially due to greater case volumes, higher incentive accruals, higher pay for our sales organization as a result of higher gross profit, investment in administrative support capabilities and acquired operations. Pay-related expenses, which represent a significant portion of our operating costs, increased by $349.3 million in fiscal 2015 over fiscal 2014. Factors contributing to the increase in 2015 include increase in expense related to management incentive accruals of $103.5 million, higher pay in our sales organization largely as a result of higher gross profits, higher costs due to investment in new administrative support capabilities and companies acquired in the last 12 months. The
23
amounts for companies acquired within the last 12 months include our new, consolidated joint ventures, such as our 50% interest in a foodservice company in Costa Rica. Sales and gross profit growth partially contributed to an increase in sales pay-related expenses due to increases in sales commissions and bonuses. In addition, we have increased our marketing associate headcount in certain markets in order to invest in future sales growth. Our expense related to management incentive accruals will vary based on how the company’s performance compares to incentive targets. Our fiscal 2015 financial performance trended more favorably relative to the applicable management incentive targets as compared to fiscal 2014. Consequently, expense is higher period over period.
Cost per case is an important metric management uses to measure our expense performance. This metric is calculated by dividing the total operating expense of our North American Broadline companies by the number of cases sold. Adjusted cost per case is calculated similarly; however, the operating expense component excludes severance and multiemployer pension withdrawal charges, which are the Certain Items applicable to these companies, divided by the number of cases sold. Our corporate expenses are not included in the cost per cases metrics because the metric is a measure of efficiency in our operations. We seek to grow our sales and either minimize or reduce our costs on a per case basis. Our cost per case and adjusted cost per case increased $0.04 per case in fiscal 2015 as compared to fiscal 2014. The impact of foreign exchange rates lowered our cost per case results by $0.05 per case for fiscal 2015 as compared to fiscal 2014, which partially offset the rate of increase occurring primarily from increased pay-related expenses. We are focused on driving improvement across our operations with multiple initiatives that implement best practices, enhance our operating training programs and improve our ability to measure and analyze our performance. More information on the rationale for the use of adjusted operating income and adjusted cost per case and reconciliations can be found under “Non-GAAP Reconciliations.”
Certain Items within Operating Expenses
Sysco’s operating expenses are impacted by Certain Items, which are expenses that can be difficult to predict, can be unanticipated or do not represent core operating expenses. More information on the rationale for the use of these measures and reconciliations to GAAP numbers can be found under “Non-GAAP Reconciliations.” Our significant Certain Items applicable for fiscal 2015 included costs related to integration planning, litigation costs and termination costs in connection with the merger that had been proposed with US Foods. Our significant Certain Items applicable for fiscal 2014 related to costs in connection with the then proposed merger with US Foods, a change in estimate of our self-insurance reserve and a liability for a settlement.
We incurred costs in connection with the proposed merger with US Foods announced in the second quarter of fiscal 2014 primarily from integration planning, litigation costs and termination costs. These costs totaled $554.7 million in fiscal 2015 and $90.6 million in fiscal 2014.
Our self-insurance program covers portions of workers’ compensation, general and vehicle liability and property insurance costs. The amounts in excess of the self-insured levels are fully insured by third party insurers. Liabilities associated with these risks are estimated in part by considering historical claims experience, medical cost trends, demographic factors, severity factors and other actuarial assumptions. In the second quarter of fiscal 2014, based on the historical trends of increased costs primarily attributable to our workers' compensation claims, we increased our estimates of our self-insurance reserve to a higher point in an estimated range of liability as opposed to our past position at the lower end of the range. This resulted in a charge of $23.8 million in fiscal 2014.
During the first quarter of fiscal 2014, Sysco was made aware of certain alleged violations of California law relating to its use of remote storage units in the delivery of products. These are commonly referred to as drop sites. As of June 28, 2014, we recorded a liability for a settlement of $20 million. In July 2014, Sysco agreed to a $19.4 million settlement, which includes a payment of $15.0 million in penalties, $3.3 million to fund four California Department of Public Health investigator positions for five years, a $1.0 million donation to food banks across California, and $0.1 million in legal fees. In the first quarter of fiscal 2014, we eliminated the use of drop sites across Sysco. During fiscal 2014, we introduced mandatory, annual food safety training for all employees across Sysco. We are implementing additional and improved food safety reporting, monitoring and compliance controls across our operations to ensure adherence to our policies.
24
Fiscal 2014 vs. Fiscal 2013
The following table sets forth the change in the components of operating income and adjusted operating income expressed as a percentage increase or decrease over the prior year:
2014 | 2013 | Change in Dollars | % Change | |||||||||||
(Dollars in thousands) | ||||||||||||||
Gross profit | $ | 8,181,035 | $ | 7,996,607 | $ | 184,428 | 2.3 | % | ||||||
Operating expenses | 6,593,913 | 6,338,129 | 255,784 | 4.0 | % | |||||||||
Operating income | $ | 1,587,122 | $ | 1,658,478 | $ | (71,356 | ) | (4.3 | )% | |||||
Gross profit | $ | 8,181,035 | $ | 7,996,607 | $ | 184,428 | 2.3 | % | ||||||
Adjusted operating expenses (Non-GAAP) | 6,444,076 | 6,243,414 | 200,662 | 3.2 | % | |||||||||
Adjusted operating income (Non-GAAP) | $ | 1,736,959 | $ | 1,753,193 | $ | (16,234 | ) | (0.9 | )% | |||||
The decrease in operating income was impacted by an increase in $55.1 million in operating expenses attributable to Certain Items. Operating income and adjusted operating income for fiscal 2014 were lower than fiscal 2013 primarily from a lower rate of growth in our gross profit, increased expenses from higher case volumes, some of which is attributable to our acquired operations, increased depreciation and amortization, increased delivery costs and higher corporate expenses. These were partially offset by lower Business Transformation Project expenses and benefits from Business Transformation Project initiatives. As a percentage of sales, we experienced favorable expense management due in part to benefits from our Business Transformation Project initiatives.
Gross profit dollars increased in fiscal 2014 as compared to fiscal 2013 primarily due to increased sales volumes. The first half of fiscal 2014 contained weaker gross profit growth of 1.2% as compared to the same period in fiscal 2013. Inflation and locally-managed customers case growth was lower in the first half of fiscal 2014. Inflation increased as did local-managed customers case growth in the second half of fiscal 2014. Gross profits grew at a greater rate of 3.4% in the second half of fiscal 2014 as compared to the same time period in fiscal 2013 as result of these factors and in part from our Business Transformation Project initiatives. Gross margin, which is gross profit as a percentage of sales, was 17.59% in fiscal 2014, a decline of 42 basis points from the gross margin of 18.01% in fiscal 2013. This decline in gross margin was partially the result of weak restaurant traffic and increased competition resulting from a slow-growth market. Increased sales to lower margin corporate-managed customers also contributed to the decline in fiscal 2014. Our inflation rates were relatively stable over the first three quarters of fiscal 2014, however it increased in the fourth quarter, all quarters being compared to the past year. Fourth quarter fiscal 2014 inflation was seen primarily in the meat, seafood and dairy categories which represent more than one-third of our annual sales.
Operating expenses for fiscal 2014 increased 4.0%, or $255.8 million, over fiscal 2013. Adjusted operating expenses for fiscal 2014 increased 3.2%, or $200.7 million, over fiscal 2013. These increases were primarily due to increased expenses from higher case volumes, some of which is attributable to our acquired operations, increased depreciation and amortization, increased delivery costs and higher corporate expenses. These were partially offset by lower Business Transformation Project expenses and benefits from Business Transformation Project initiatives. We believe favorable expense management, partially from our Business Transformation Project initiatives, helped to keep our operating expense increases from being greater. Sysco’s operating expenses are impacted by certain charges and adjustments, which we refer to as Certain Items, and which resulted in an increase in operating expenses of $55.1 million in fiscal 2014 as compared to fiscal 2013. More information on the rationale of the use of adjusted operating expenses and adjusted operating income and reconciliations to GAAP numbers can be found under “Non-GAAP Reconciliations".
Operating Expenses Impacting Adjusted Operating Income
Our operating expenses increased in fiscal 2014 as compared to fiscal 2013 partially due to expenses from our acquired operations, expenses attributable to volume growth and increased delivery costs. Pay-related expenses represent a significant portion of our operating costs, contributed to the increase in each of these three categories of expenses and contributed to cost increases in our corporate expenses. Pay-related expenses, excluding labor costs associated with our Business Transformation Project, US Foods integration planning and retirement-related expenses, increased by $74.4 million in fiscal 2014 over fiscal 2013. The increase was primarily due to costs from companies acquired in the last 12 months as well as increased delivery and warehouse compensation, partially attributable to case growth. Pay-related costs have also increased at our corporate office as certain employee costs attributed to our Business Transformation Project in fiscal 2013 were no longer attributed to the Business Transformation
25
Project in fiscal 2014 due to a change in allocation methodology. In fiscal 2013, we allocated internal associates based upon estimates of the percentage of time they spent on the project. In fiscal 2014, only associates that were dedicated full time to the project are included in Business Transformation Project costs. These increases were partially offset by reduced sales compensation, information technology compensation and lower provisions for management incentive plans. Benefits from our Business Transformation Project initiatives helped in lowering the rate of growth in these expenses particularly in our sales area for fiscal 2014. During fiscal 2013, we streamlined our sales management organization and modified marketing associate compensation plans. Fiscal 2014 was also impacted by a reduction in pay in the information technology area, resulting from the restructuring of this department in fiscal 2013, which reduced headcount in this area.
Depreciation and amortization expense, excluding the increase related to our Business Transformation Project described below, increased by $32.8 million in fiscal 2014 over fiscal 2013. The increase was primarily related to depreciation on assets that were not placed in service in fiscal 2013 that were in service in fiscal 2014.
Our retirement-related expenses consist primarily of costs from our Retirement Plan, SERP and our defined contribution plans. As a part of our Business Transformation Project initiatives, our Retirement Plan was substantially frozen and the SERP was completely frozen in fiscal 2013, and our defined contribution plans were enhanced with greater benefits. The net impact in fiscal 2014 of our retirement-related expenses as compared to fiscal 2013 was a decrease of $86.8 million, consisting of a $133.6 million decrease in our net company-sponsored pension costs and approximately $6.2 million for other costs, partially offset by $53.0 million increased costs from our defined contribution plans.
In addition to the increases in our corporate office expenses from pay-related expenses noted above, other sources of cost increases in fiscal 2014 as compared to fiscal 2013 were due to increasing the capabilities of various departments within our corporate office. A subset of our business technology costs was attributable to our Business Transformation Project. Expenses related to our Business Transformation Project, inclusive of pay-related and software amortization expense, were $277 million in fiscal 2014 and $330.5 million in fiscal 2013, representing a decrease of $53.5 million. The decrease in fiscal 2014 resulted from a reduction in certain employee costs that were attributed to our Business Transformation Project in fiscal 2013 that were no longer attributed to the Business Transformation Project in fiscal 2014 due to a change in allocation methodology. In fiscal 2013, we allocated internal associates based upon estimates of the percentage of time they spent on the project. In fiscal 2014, only associates that were dedicated full time to the project are included in Business Transformation Project costs. Additional contributors to the decreases include an increased level of capitalization on amounts spent for system improvements to enhance stability and scalability and reduced level of spend with consultants as compared to the comparable period in fiscal 2013. The decrease in fiscal 2014 was partially offset by an increase in depreciation and amortization expense related to the Business Transformation Project of $10.7 million in fiscal 2014 over fiscal 2013.
Our cost per case decreased $0.10 per case in fiscal 2014 as compared to fiscal 2013. Our adjusted cost per case calculated on a non-GAAP basis decreased $0.06 in fiscal 2014 as compared to fiscal 2013, primarily from reduced pay-related expenses from our sales and information technology areas and lower retirement-related expenses, partially offset by increased costs from delivery pay-related expenses. More information on the rationale for the use of adjusted operating expenses and adjusted cost per case and reconciliations can be found under “Non-GAAP Reconciliations.”
Certain Items Within Operating Expenses
Our significant Certain Items applicable for fiscal 2014 included costs in connection with the then proposed merger with US Foods, a change in the estimate of our self-insurance reserve and a liability for a settlement, which were described in greater detail above. Our significant Certain Items applicable for fiscal 2013 related to withdrawal liabilities from multiemployer pension plans, severance charges and costs from restructuring executive retirement plans.
From time to time, we may voluntarily withdraw from multiemployer pension plans to minimize or limit our future exposure to these plans. In fiscal 2013, we recorded a provision $41.9 million, related to multiemployer pension plan withdrawals.
Net Earnings
Net earnings decreased 26.3% in fiscal 2015 from fiscal 2014 due primarily to the changes in operating income discussed above, including the impact of Certain Items, which included increased interest expense of $131.6 million in fiscal 2015 that related to the financing of our proposed merger with US Foods. These amounts include the write off of unamortized debt issuance costs when our bridge acquisition facility was terminated upon the issuance of our senior notes in October 2014 and interest expense on those senior notes. Excluding this interest expense, adjusted interest expense decreased by $0.6 million. Adjusted net earnings increased $66.3 million, or 6.4%, during fiscal 2015.
26
Net earnings for fiscal 2014 decreased 6.1% compared to fiscal 2013. This decrease was primarily due to changes in operating income discussed above. Adjusted net earnings decreased 1.8% during fiscal 2014.
The effective tax rate of 31.9% for fiscal 2015 was favorably impacted by lower earnings in the U.S. primarily due to costs associated with the termination of the US Foods proposed merger. The lower U.S. earnings resulted in a more significant favorable impact on the effective tax rate from the indefinitely reinvested foreign earnings due to lower foreign statutory tax rates as compared to the domestic tax rate. The additional cost associated with the proposed US Foods merger resulted in lower state taxes. For future periods, we would expect our normalized tax rate to be in the range of 36% to 37%.
The effective tax rate of 36.9% for fiscal 2014 was negatively impacted primarily by two items. First, a non-deductible penalty, that the company incurred, had an unfavorable tax impact of $6.2 million. Second, we recorded net tax expense of $5.2 million for tax and interest related to various federal, foreign and state uncertain tax positions. This negative impact was partially offset by the recording of $5.7 million of tax benefit related to disqualifying dispositions of Sysco stock pursuant to share-based compensation arrangements. Indefinitely reinvested earnings taxed at foreign statutory rates less than our domestic tax rate also had the impact of reducing the effective tax rate.
The effective tax rate for fiscal 2013 was 35.9%. Indefinitely reinvested earnings taxed at foreign statutory tax rates less than our domestic tax rate had the impact of reducing the effective tax rate.
Earnings Per Share
Basic earnings per share in fiscal 2015 were $1.16, a 27.0% decrease from the fiscal 2014 amount of $1.59 per share. Diluted earnings per share in fiscal 2015 were $1.15, a 27.2% decrease from the fiscal 2014 amount of $1.58 per share. This decrease was primarily the result of the factors discussed above and due to greater shares outstanding during fiscal 2015 as compared to fiscal 2014. As discussed below in “liquidity and capital resources - financing activities,” we chose not to repurchase any shares in fiscal 2015 due to the proposed US Foods merger. Our shares outstanding have increased primarily as a result of stock option exercises and restricted stock unit grants to employees. This resulted in lowering our earnings per share amounts by $0.02 per share. Adjusted diluted earnings per share in fiscal 2015 were $1.84, an increase of 5.1% from the comparable prior year period amount of $1.75.
Basic earnings per share in fiscal 2014 were $1.59, a 5.4% decrease from the fiscal 2013 amount of $1.68 per share. Diluted earnings per share in fiscal 2014 were $1.58, a 5.4% decrease from the fiscal 2013 amount of $1.67 per share. This decrease was primarily the result of the factors discussed above. Adjusted diluted earnings per share in fiscal 2014, based on the Certain Items definition for the fiscal 2014 and fiscal 2013 years, were $1.76, a decrease of 1.1% from the comparable prior year period amount of $1.78. All earnings per share metrics for fiscal 2014 were partially impacted by a greater number of shares outstanding. Sysco experienced a greater number of stock option exercises in fiscal 2014 as compared to fiscal 2013, which increased the number of shares outstanding.
Non-GAAP Reconciliations and Adjusted Cost per Case
Sysco’s results of operations are impacted by multiemployer pension withdrawal charges, severance charges, integration planning, litigation costs and termination costs in connection with the merger that had been proposed with US Foods, facility closure charges and US Foods related financing costs. Additional items in fiscal 2014 include a change in estimate of self-insurance, and charges from a contingency accrual. These fiscal 2015 and 2014 items are collectively referred to as (Certain Items). Our US Foods financing costs include the write off of unamortized debt issuance costs when our bridge acquisition facility was terminated upon the issuance of our senior notes in October 2014 and interest expense on those senior notes. In fiscal 2014, costs from executive retirement plans restructuring were included within Certain Items; however, because these costs in fiscal 2015 are comparable to fiscal 2014, these were not included in the Certain Items definition for the comparison of adjusted results for fiscal 2015 to fiscal 2014. This continues to be presented as a Certain Item in the comparison of adjusted results for fiscal 2014 to fiscal 2013. Management believes that adjusting its operating expenses, operating income, interest expense, net earnings and diluted earnings per share to remove the impact of these charges provides an important perspective of underlying business trends and results and provides meaningful supplemental information to both management and investors that is indicative of the performance of the company’s underlying operations and facilitates comparison on a year-over-year basis.
The company uses these non-GAAP measures when evaluating its financial results, as well as for internal planning and forecasting purposes. These financial measures should not be used as a substitute for GAAP measures in assessing the company’s results of operations for periods presented. An analysis of any non-GAAP financial measure should be used in conjunction with results presented in accordance with GAAP. As a result, in the table below, each period presented is adjusted to remove the costs described above. In the table below, individual components of diluted earnings per share may not add to the total presented due
27
to rounding. Adjusted diluted earnings per share is calculated using adjusted net earnings divided by diluted shares outstanding.
Set forth below is a reconciliation of actual operating expenses, operating income, interest expense, net earnings and diluted earnings per share to adjusted results for these measures for fiscal 2015 and fiscal 2014:
2015 | 2014 | Change in Dollars | % Change (3) | |||||||||||
(In thousands, except for share and per share data) | ||||||||||||||
Operating expenses (GAAP) | $ | 7,322,154 | $ | 6,593,913 | $ | 728,241 | 11.0 | % | ||||||
Impact of MEPP charge | — | (1,451 | ) | 1,451 | NM | |||||||||
Impact of severance charges | (5,598 | ) | (7,202 | ) | 1,604 | (22.3 | ) | |||||||
Impact of US Foods merger costs | (554,667 | ) | (90,571 | ) | (464,096 | ) | NM | |||||||
Impact of change in estimate of self insurance | — | (23,841 | ) | 23,841 | NM | |||||||||
Impact of contingency accrual | — | (20,000 | ) | 20,000 | NM | |||||||||
Impact of facility closure charges | (2,203 | ) | (3,443 | ) | 1,240 | (36.0 | ) | |||||||
Impact of Certain Items on operating expenses | (562,468 | ) | (146,508 | ) | (415,960 | ) | NM | |||||||
Adjusted operating expenses (Non-GAAP) | $ | 6,759,686 | $ | 6,447,405 | $ | 312,281 | 4.8 | % | ||||||
Operating Income (GAAP) | $ | 1,229,362 | $ | 1,587,122 | $ | (357,760 | ) | (22.5 | )% | |||||
Impact of Certain Items on operating income | 562,468 | 146,508 | 415,960 | NM | ||||||||||
Adjusted operating income (Non-GAAP) | $ | 1,791,830 | $ | 1,733,630 | $ | 58,200 | 3.4 | % | ||||||
Interest expense (GAAP) | $ | 254,807 | $ | 123,741 | $ | 131,066 | 105.9 | % | ||||||
Impact of US Foods financing costs | (138,422 | ) | (6,790 | ) | (131,632 | ) | NM | |||||||
Adjusted interest expense (Non-GAAP) | $ | 116,385 | $ | 116,951 | $ | (566 | ) | (0.5 | )% | |||||
Net earnings (GAAP) (1) | $ | 686,773 | $ | 931,533 | $ | (244,760 | ) | (26.3 | )% | |||||
Impact of MEPP charge | — | 916 | (916 | ) | NM | |||||||||
Impact of severance charge | 3,302 | 4,546 | (1,244 | ) | (27.4 | ) | ||||||||
Impact of US Foods merger costs | 327,149 | 57,176 | 269,973 | NM | ||||||||||
Impact of change in estimate of self insurance | — | 15,050 | (15,050 | ) | NM | |||||||||
Impact of contingency accrual | — | 18,156 | (18,156 | ) | NM | |||||||||
Impact of facility closure charges | 1,299 | 2,173 | (874 | ) | (40.2 | ) | ||||||||
Impact of US Foods Financing Costs | 81,643 | 4,286 | 77,357 | NM | ||||||||||
Adjusted net earnings (Non-GAAP) (1) | $ | 1,100,166 | $ | 1,033,836 | $ | 66,330 | 6.4 | % | ||||||
Diluted earnings per share (GAAP) (1) | $ | 1.15 | $ | 1.58 | $ | (0.43 | ) | (27.2 | )% | |||||
Impact of severance charge | 0.01 | 0.01 | — | — | ||||||||||
Impact of US Foods merger costs | 0.55 | 0.10 | 0.45 | NM | ||||||||||
Impact of change in estimate of self insurance | — | 0.03 | (0.03 | ) | NM | |||||||||
Impact of contingency accrual | — | 0.03 | (0.03 | ) | NM | |||||||||
Impact of US Foods Financing Costs | 0.14 | 0.01 | 0.13 | NM | ||||||||||
Adjusted diluted earnings per share (Non-GAAP) (1)(2) | $ | 1.84 | $ | 1.75 | $ | 0.09 | 5.1 | % | ||||||
Diluted shares outstanding | 596,849,034 | 590,216,220 | ||||||||||||
(1) The net earnings and diluted earnings per share impacts are shown net of tax. The aggregate tax impact of adjustments for Certain Items was $287.5 million and $55.8 million for fiscal 2015 and fiscal 2014, respectively. Amounts are calculated by
28
multiplying the pretax impact of each Certain Item by the statutory rates in effect for each jurisdiction. In FY14, the impact of the charge from a contingency accrual contained an estimated non-deductible portion.
(2) Individual components of diluted earnings per share may not add to the total presented due to rounding. Total diluted earnings per share is calculated using adjusted net earnings for Certain Items divided by diluted shares outstanding.
(3) NM represents that the percentage change was not meaningful
Set forth below is a reconciliation of actual operating expenses, operating income, net earnings and diluted earnings per share to adjusted results for these measures for fiscal 2014 and fiscal 2013:
2014 | 2013 | Change in Dollars | % Change(3) | |||||||||||
(In thousands, except for share and per share data) | ||||||||||||||
Operating expenses (GAAP) | $ | 6,593,913 | $ | 6,338,129 | $ | 255,784 | 4.0 | % | ||||||
Impact of restructuring executive retirement plans | (3,329 | ) | (20,990 | ) | 17,661 | (84.1 | ) | |||||||
Impact of MEPP charges | (1,451 | ) | (41,876 | ) | 40,425 | (96.5 | ) | |||||||
Impact of severance charges | (7,202 | ) | (23,206 | ) | 16,004 | (69.0 | ) | |||||||
Impact of US Foods merger costs | (90,571 | ) | — | (90,571 | ) | NM | ||||||||
Impact of FY13 acquisition-related charge | — | (5,998 | ) | 5,998 | NM | |||||||||
Impact of change in estimate of self insurance | (23,841 | ) | — | (23,841 | ) | NM | ||||||||
Impact of contingency accrual | (20,000 | ) | $ | — | (20,000 | ) | NM | |||||||
Impact of facility closure charges | (3,443 | ) | (2,645 | ) | (798 | ) | 30.2 | |||||||
Adjusted operating expenses (Non-GAAP) | $ | 6,444,076 | $ | 6,243,414 | $ | 200,662 | 3.2 | % | ||||||
Operating Income (GAAP) | $ | 1,587,122 | $ | 1,658,478 | $ | (71,356 | ) | (4.3 | )% | |||||
Impact of restructuring executive retirement plans | 3,329 | 20,990 | (17,661 | ) | (84.1 | ) | ||||||||
Impact of MEPP charges | 1,451 | 41,876 | (40,425 | ) | (96.5 | ) | ||||||||
Impact of severance charges | 7,202 | 23,206 | (16,004 | ) | (69.0 | ) | ||||||||
Impact of US Foods merger costs | 90,571 | — | 90,571 | NM | ||||||||||
Impact of FY13 acquisition-related charge | — | $ | 5,998 | (5,998 | ) | NM | ||||||||
Impact of change in estimate of self insurance | 23,841 | — | 23,841 | NM | ||||||||||
Impact of contingency accrual | 20,000 | $ | — | 20,000 | NM | |||||||||
Impact of facility closure charges | 3,443 | 2,645 | 798 | 30.2 | ||||||||||
Adjusted operating income (Non-GAAP) | $ | 1,736,959 | $ | 1,753,193 | $ | (16,234 | ) | (0.9 | )% | |||||
Interest Expense (GAAP) | $ | 123,741 | $ | 128,495 | $ | (4,754 | ) | (3.7 | )% | |||||
Impact of US Foods financing costs | (6,790 | ) | — | (6,790 | ) | NM | ||||||||
Adjusted interest expense (Non-GAAP) | $ | 116,951 | $ | 128,495 | $ | (11,544 | ) | (9.0 | )% | |||||
Net earnings (GAAP) (1) | $ | 931,533 | $ | 992,427 | $ | (60.894 | ) | (6.1 | )% | |||||
Impact of restructuring executive retirement plans | 2,102 | 13,461 | (11.359 | ) | (84.4 | ) | ||||||||
Impact of MEPP charges | 916 | 26,855 | (25.939 | ) | (96.6 | ) | ||||||||
Impact of severance charges | 4,546 | 14,882 | (10.336 | ) | (69.5 | ) | ||||||||
Impact of US Foods merger costs | 57,176 | — | 57.176 | NM | ||||||||||
Impact of FY13 acquisition-related charge | — | 5,998 | (5.998 | ) | NM | |||||||||
Impact of change in estimate of self insurance | 15,050 | — | 15.05 | NM | ||||||||||
Impact of contingency accrual | 18,156 | — | 18.156 | NM | ||||||||||
Impact of facility closure charges | 2,173 | $ | 1,696 | 0.477 | 28.1 | |||||||||
Impact of US Foods financing costs | 4,286 | — | 4.286 | NM | ||||||||||
29
2014 | 2013 | Change in Dollars | % Change(3) | |||||||||||
(In thousands, except for share and per share data) | ||||||||||||||
Adjusted net earnings (Non-GAAP) (1) | $ | 1,035,938 | $ | 1,055,319 | $ | (19.381 | ) | (1.8 | )% | |||||
Diluted earnings per share (GAAP) (1) | $ | 1.58 | $ | 1.67 | $ | (0.09 | ) | (5.4 | )% | |||||
Impact of restructuring executive retirement plans | — | 0.02 | (0.02 | ) | NM | |||||||||
Impact of MEPP charges | — | 0.05 | (0.05 | ) | NM | |||||||||
Impact of severance charges | 0.01 | 0.03 | (0.02 | ) | (66.7 | ) | ||||||||
Impact of US Foods merger costs | 0.10 | — | 0.10 | NM | ||||||||||
Impact of FY13 acquisition-related charge | — | 0.01 | (0.01 | ) | NM | |||||||||
Impact of change in estimate of self insurance | 0.03 | — | 0.03 | NM | ||||||||||
Impact of contingency accrual | 0.03 | — | 0.03 | NM | ||||||||||
Impact of US Foods financing costs | 0.01 | — | 0.01 | NM | ||||||||||
Adjusted diluted earnings per share (Non-GAAP) (1)(2) | $ | 1.76 | $ | 1.78 | $ | (0.02 | ) | (1.1 | )% | |||||
Diluted shares outstanding | 590,216,220 | 592,675,110 | ||||||||||||
(1) The net earnings and diluted earnings per share impacts are shown net of tax, except as noted below. The aggregate tax impact of adjustments for Certain Items was $67.2 million and $37.8 million for fiscal 2014 and fiscal 2013, respectively. The fiscal 2014 acquisition-related charge had no tax impact. Amounts are calculated by multiplying the operating income impact of each item by the respective year's effective tax rate with the exception of the impact of the charges from an estimate of a contingency accrual, which had an estimated non-deductible portion.
(2) Individual components of diluted earnings per share may not add to the total presented due to rounding. Total diluted earnings per share is calculated using adjusted net earnings for Certain Items divided by diluted shares outstanding.
(3) NM represents that the percentage change was not meaningful
Cost per case is an important metric management uses to measure our expense performance. This metric is calculated by taking the total operating expense of our North American Broadline companies, divided by the number of cases sold. Adjusted cost per case is calculated similarly, however the operating expense component excludes charges from, multiemployer pension plans and severance, which are the Certain Items applicable to these companies, divided by the number of cases sold. Our corporate expenses are not included in the cost per cases metrics because the metric is a measure of efficiency in our operations. We seek to grow our sales and either minimize or reduce our costs on a per case basis. Our North American Broadline companies represent approximately 80% of our total sales and 75% of our total operating expenses prior to corporate expenses. Sysco considers adjusted cost per case to be a measure that provides useful information to management and investors about Sysco's expense management. An analysis of any non-GAAP financial measure should be used in conjunction with results presented in accordance with GAAP.
In the table that follows, the change in adjusted cost per case is reconciled to cost per case for the periods presented.
Fiscal 2015 change from Fiscal 2014 | Fiscal 2014 change from Fiscal 2013 | ||||||
Increase (decrease) in cost per case | $ | 0.04 | $ | (0.10 | ) | ||
Impact of Certain Items (1) | — | 0.04 | |||||
Increase (decrease) in adjusted cost per case (Non-GAAP basis) | $ | 0.04 | $ | (0.06 | ) | ||
(1) For all periods, the impact of Certain Items excludes charges from multiemployer pension plans and severance. For the fiscal 2015 comparison to fiscal 2014, our Certain Items charges were not significant enough to contribute a different adjusted cost per case result from the reported increase in cost per case. For the fiscal 2014 comparison to fiscal 2013, the majority of the impact relates to multiemployer pension plans in the amount of $0.04 per case attributable to charges taken in fiscal 2014 that did not recur at the same magnitude in fiscal 2013, and the remainder relates to severance charges.
30
Segment Results
We have aggregated our operating companies into two reporting segments, Broadline and SYGMA, as defined in the accounting literature related to disclosures about segments of an enterprise. The accounting policies for the segments are the same as those disclosed by Sysco within the Financial Statements and Supplementary Data within Part II Item 8 of this Form 10-K. Intersegment sales represent specialty produce and imported specialty products distributed by the Broadline and SYGMA operating companies.
Management evaluates the performance of each of our operating segments based on its respective operating income results. Corporate expenses and adjustments generally include all expenses of the corporate office and Sysco’s shared service center. These also include all share-based compensation costs and integration planning, litigation costs and termination costs in connection with the merger that had been proposed US Foods. While a segment’s operating income may be impacted in the short-term by increases or decreases in gross profits, expenses, or a combination thereof, over the long-term each business segment is expected to increase its operating income at a greater rate than sales growth. This is consistent with our long-term goal of leveraging earnings growth at a greater rate than sales growth.
The following table sets forth the operating income of each of our reportable segments and the other segment expressed as a percentage of each segment’s sales for each period reported and should be read in conjunction with Note 21, “Business Segment Information” to the Consolidated Financial Statements in Item 8:
Operating Income as a | ||||||||
Percentage of Sales | ||||||||
2015 | 2014 | 2013 | ||||||
Broadline | 6.6 | % | 6.6 | % | 6.7 | % | ||
SYGMA | 0.3 | 0.6 | 0.9 | |||||
Other | 2.6 | 3.0 | 3.2 | |||||
The following table sets forth the change in the selected financial data of each of our reportable segments and the other segment expressed as a percentage increase or decrease over the prior year and should be read in conjunction with Note 21, “Business Segment Information” to the Consolidated Financial Statements in Item 8:
2015 | 2014 | ||||||||||||
Sales | Operating Income | Sales | Operating Income | ||||||||||
Broadline | 5.0 | % | 5.8 | % | 4.3 | % | 2.8 | % | |||||
SYGMA | (1.6 | ) | (46.1 | ) | (1) | 6.9 | (26.9 | ) | (1) | ||||
Other | 12.6 | (4.6 | ) | 6.6 | 2.2 | ||||||||
(1) SYGMA had operating income of $20.5 million in fiscal 2015, $38.0 million in fiscal 2014 and $52.0 million in fiscal 2013.
31
The following table sets forth sales and operating income of each of our reportable segments, the other segment, and intersegment sales, expressed as a percentage of aggregate segment sales, including intersegment sales, and operating income, respectively. For purposes of this statistical table, operating income of our segments excludes corporate expenses and adjustments of $1.5 billion in fiscal 2015, $1.0 billion in fiscal 2014 and $894.3 million in fiscal 2013 that are not charged to our segments. This information should be read in conjunction with Note 21, “Business Segment Information” to the Consolidated Financial Statements in Item 8:
2015 | 2014 | 2013 | |||||||||||||||
Segment | Segment | Segment | |||||||||||||||
Operating | Operating | Operating | |||||||||||||||
Sales | Income | Sales | Income | Sales | Income | ||||||||||||
Broadline | 79.4 | % | 94.3 | % | 79.1 | % | 93.1 | % | 79.4 | % | 92.5 | % | |||||
SYGMA | 12.5 | 0.7 | 13.3 | 1.5 | 13.0 | 2.0 | |||||||||||
Other | 10.8 | 5.0 | 10.1 | 5.4 | 9.9 | 5.5 | |||||||||||
Intersegment sales | (2.7 | ) | — | (2.5 | ) | — | (2.3 | ) | — | ||||||||
Total | 100.0 | % | 100.0 | % | 100.0 | % | 100.0 | % | 100.0 | % | 100.0 | % | |||||
Broadline Segment
The Broadline reportable segment is an aggregation of the company’s U.S.and International Broadline segments located in Bahamas, Canada, Costa Rica and Ireland. Broadline operating companies distribute a full line of food products and a wide variety of non-food products to both traditional and chain restaurant customers, hospitals, schools, hotels, industrial caterers and other venues where foodservice products are served. Broadline operations have significantly higher operating margins than the rest of Sysco’s operations. In fiscal 2015, the Broadline operating results represented approximately 79.4% of Sysco’s overall sales and 94.3% of the aggregate operating income of Sysco’s segments, which excludes corporate expenses.
There are several factors that contribute to these higher operating results as compared to the SYGMA and Other operating segments. We have invested substantial amounts in assets, operating methods, technology and management expertise in this segment. The breadth of its sales force, geographic reach of its distribution area and its purchasing power allow us to benefit from this segment’s earnings.
Sales
Sales for fiscal 2015 were 5.0% higher than fiscal 2014. Sales for fiscal 2015 increased as a result of product cost inflation and the resulting increase in selling prices, case volume growth, and sales from acquisitions that occurred within the last 12 months. Our case volume growth in fiscal 2015 with our locally-managed customers was strong and corporate-managed customer volumes increased as well. Sales from acquisitions within the last 12 months favorably impacted sales by 0.5% in fiscal 2015. Changes in product costs, an internal measure of inflation or deflation, were estimated as inflation of 3.8% during fiscal 2015, driven mainly by inflation in the meat, seafood and dairy categories. The exchange rates used to translate our foreign sales into U.S. dollars negatively impacted sales by 1.3% in fiscal 2015.
Sales for fiscal 2014 were 4.3% higher than fiscal 2013. Sales for fiscal 2014 increased as a result of sales from acquisitions that occurred within the last 12 months, case volume growth and product cost inflation and the resulting increase in selling prices. Our sales growth in fiscal 2014 was greater with our corporate-managed customers as compared to sales growth with our locally-managed customers. The disparity in the growth rate between these customer types moderated in the last half of fiscal 2014 with locally-managed sales growth trending at similar rates as corporate-managed customers. Sales from acquisitions within the last 12 months favorably impacted sales by 1.7% in fiscal 2014. Changes in product costs, an internal measure of inflation or deflation, were estimated as inflation of 2.0% during fiscal 2014, driven mainly by inflation in the meat, seafood and dairy categories. The exchange rates used to translate our foreign sales into U.S. dollars negatively impacted sales by 0.8% in fiscal 2014.
Operating Income
Fiscal 2015 vs. Fiscal 2014
Operating income increased by 5.8% in fiscal 2015 over fiscal 2014. We experienced growth in our gross profits due to increased sales volumes, stronger relative mix of sales for our locally-managed customers and benefits from our category
32
management initiative. Operating expenses increased from greater case volumes, higher incentive accruals, higher pay for our sales organization as a result of higher gross profit, investment in administrative support capabilities and acquired operations.
Gross profits increased in fiscal 2015 as compared to fiscal 2014 and gross margins were steady. Increased competition resulting from a slow-growth market and volatile inflation has pressured our gross margins; however, sales and mix, as well as our category management initiative, have helped us stabilize our gross margin performance. Our inflation rates were higher in the first half of fiscal 2015, reaching levels of 6% at the mid-point of the fiscal year and dropping to minimal amounts by the end of the fiscal year. Fiscal 2015 inflation was seen primarily in the meat, dairy and poultry categories.
Operating expenses for the Broadline segment increased in fiscal 2015 as compared to fiscal 2014. The increase in expenses for fiscal 2015 as compared to fiscal 2014 was driven largely by higher sales costs, increased expense related to management incentive accruals and costs from companies acquired within the last 12 months. Partially offsetting these increases were decreases in fuel costs. Sales and gross profit growth partially contributed to an increase in sales pay-related expenses due to increases in sales commissions and bonuses. In addition, we have increased our marketing associate headcount in certain markets in order to invest in future sales growth. Our cost per case and adjusted cost per case increased $0.04 per case in fiscal 2015 as compared to fiscal 2014. The impact of foreign exchange rates lowered our cost per case results by $0.05 per case for fiscal 2015 as compared to fiscal 2014, which partially offset the rate of increase occurring primarily from increased pay-related expenses partially offset by lower fuel costs.
Fiscal 2014 vs. Fiscal 2013
Operating income increased by 2.8% in fiscal 2014 from fiscal 2013. This increase was driven by operating expenses increasing more than gross profit dollars.
Gross profit dollars increased in fiscal 2014 primarily due to increased sales; however, gross profit dollars increased at a lower rate than sales. This decline in gross margin was partially the result of increased inflation, increased growth from corporate-managed customers and, in part, from our Business Transformation Project Initiative. Increased competition resulting from a slow-growth market also contributed to the decline in gross margins. Our Broadline segment experienced product cost inflation in fiscal 2014. Based on our product sales mix during fiscal 2014, we were most impacted by higher levels of inflation in the poultry and meat product categories.
Operating expenses for the Broadline segment increased in fiscal 2014 as compared to fiscal 2013. The expense increases in fiscal 2014 were driven largely by charges related to multiemployer pension plan withdrawals, pay-related expenses including severance costs, depreciation and amortization expense and fuel. The increase in pay-related expenses was primarily due to increased delivery and warehouse compensation, partially attributable to case growth, and added costs from companies acquired in the last 12 months. Delivery and warehouse compensation includes activity-based pay that will increase when our case volumes increase. Additionally, pay rates have been higher particularly in geographies where oil and gas exploration occurs. These increases were partially offset by reduced sales and information technology pay-related expenses. Our enhanced defined contribution plan became effective January 1, 2013 and contributed to the increase in operating expenses. Depreciation and amortization increased primarily from assets that were not placed in service in fiscal 2013 that were in service in fiscal 2014, primarily from new facilities, property from new acquisitions and expansions.
In fiscal 2014 and fiscal 2013, we recorded provisions of $1.5 million and $41.9 million, respectively, related to multiemployer pension plan withdrawals.
Our fiscal 2014 cost per case, excluding charges related to withdrawals from multiemployer pension plans, decreased as compared to fiscal 2013 primarily from reduced pay-related expenses from our sales and information technology areas, partially offset by increased costs from delivery and warehouse pay-related expenses, increased retirement-related expenses and fuel increases.
SYGMA Segment
SYGMA operating companies distribute a full line of food products, a wide variety of non-food products and customer-specific proprietary products to certain chain restaurant customer locations. SYGMA operations have traditionally had lower operating income as a percentage of sales than Sysco’s other segments. This segment of the foodservice industry has generally been characterized by lower overall operating margins as the volume that these customers command allows them to negotiate for reduced margins. These operations service chain restaurants through contractual agreements that are typically structured on a fee per case delivered basis.
33
Sales
Sales were 1.6% lower in fiscal 2015 than in fiscal 2014. The decrease was primarily due to the resignation of several unprofitable accounts, lost customers and lower fuel surcharges. Partially offsetting these decreases were increases from product cost inflation (and the resulting increase in selling prices) and case volume increases from existing customers. We expect similar sales results in fiscal 2016 due to the continued impact of these resignations, as well as competitive pricing pressures. SYGMA intends to add business with new and existing customers to profitably grow this segment's results.
Sales were 6.9% greater in fiscal 2014 than in fiscal 2013. The increase was primarily due to new customers. Other contributors to the increase were product cost inflation and the resulting increase in selling prices and case volume increases from existing customers.
Operating Income
Operating income decreased by 46.1% in fiscal 2015 from fiscal 2014. Gross profit dollars decreased 3.3% while operating expenses increased 7.3% in fiscal 2015 over fiscal 2014. Gross profit dollar growth was lower primarily due to reduced fuel surcharges and lower margins as a result of the competitive market environment. Operating expenses increased in fiscal 2015 largely due to increased warehouse and delivery costs, including pay-related expenses, partially resulting from efforts to increase driver retention and manage warehouse employee shortages. Operating income is expected to improve in fiscal 2016 as compared to fiscal 2015 due to improved profitability from resigning less profitable customers and improved productivity.
Operating income decreased by26.9% in fiscal 2014 from fiscal 2013. Gross profit dollars increased 2.8% while operating expenses increased 6.5% in fiscal 2014 over fiscal 2013. These gross profit results largely reflect the sluggish sales environment that existed at that time. Operating expenses increased in fiscal 2014 largely due to increased delivery costs including pay-related expenses. Our enhanced defined contribution plan became effective January 1, 2013 and contributed to the increase in pay-related expense.
Other Segment
“Other” financial information is attributable to our other operating segments, including our specialty produce, our custom-cut meat operations, lodging industry products segments, a company that distributes specialty imported products, a company that distributes to international customers and our Sysco Ventures platform, our suite of technology solutions that help support the business needs of our customers. These operating segments are discussed on an aggregate basis as they do not represent reportable segments under segment accounting literature.
On an aggregate basis, our “Other” segment has had a lower operating income as a percentage of sales than Sysco’s Broadline segment. Sysco has acquired some of the operating companies within this segment in recent years. These operations generally operate in a niche within the foodservice industry except for our lodging industry supply company. Each individual operation is also generally smaller in sales and scope than an average Broadline operation and each of these operating segments is considerably smaller in sales and overall scope than the Broadline segment. In fiscal 2015, in the aggregate, the “Other” segment represented approximately 10.8% of Sysco’s overall sales and 5.0% of the aggregate operating income of Sysco’s segments, which excludes corporate expenses and adjustments.
Operating income decreased 4.6%, or $6.5 million, in fiscal 2015 as compared to fiscal 2014. The decrease in operating income was largely due to startup costs from our Iowa Premium Beef operations, partially offset by increased earnings from our specialty produce and custom-cut meat segments.
Operating income decreased 2.2% for fiscal 2014 over fiscal 2013. The decrease in operating income was largely due to startup costs from our Sysco Ventures operations, partially offset by increased earnings from our specialty produce and lodging industry products segments. Additionally, retirement-related expenses were greater for these companies for fiscal 2014 as our enhanced defined contribution plan became effective January 1, 2013, and some of these operations were not a part of prior benefit plans.
Liquidity and Capital Resources
34
Highlights
Comparisons of the cash flows from fiscal 2015 to fiscal 2014:
• | Cash flows from operations were $1.6 billion this year compared to $1.5 billion last year. |
• | Net capital expenditures totaled $518.4 million this year compared to $497.4 million last year. |
• | Free cash flow was $1.0 billion this year compared to $995.4 million last year (see Non-GAAP reconciliation below under the heading “Free Cash Flow”) |
• | Cash used for acquisition of businesses was $115.9 million this year compared to $79.3 million last year. |
• | Net bank borrowings were a net repayment of $130.0 million this year compared to a net borrowing of $34.5 million last year. |
• | Proceeds from exercises of share-based compensation awards were $240.2 million this year compared to $255.6 million last year. |
• | Treasury stock purchases were zero this year compared to $332.4 million last year. |
• | Dividends paid were $695.3 million this year compared to $667.2 million last year. |
Sources and Uses of Cash
Sysco’s strategic objectives include continuous investment in our business; these investments are funded by a combination of cash from operations and access to capital from financial markets. Our operations historically have produced significant cash flow. Cash generated from operations is generally allocated to:
• | working capital requirements; |
• | investments in facilities, systems, fleet, other equipment and technology; |
• | return of capital to shareholders, including cash dividends and share repurchases; |
• | acquisitions compatible with our overall growth strategy; |
• | contributions to our various retirement plans; and |
• | debt repayments. |
Any remaining cash generated from operations may be invested in high-quality, short-term instruments. As a part of our ongoing strategic analysis, we regularly evaluate business opportunities, including potential acquisitions and sales of assets and businesses, and our overall capital structure. Any transactions resulting from these evaluations may materially impact our liquidity, borrowing capacity, leverage ratios and capital availability.
We continue to generate substantial cash flows from operations and remain in a strong financial position; however, our liquidity and capital resources can be influenced by economic trends and conditions that impact our results of operations. We believe our mechanisms to manage working capital, such as credit monitoring, optimizing inventory levels and maximizing payment terms with vendors, and our mechanisms to manage the items impacting our gross profits have been sufficient to limit a significant unfavorable impact on our cash flows from operations. We believe these mechanisms will continue to prevent a significant unfavorable impact on our cash flows from operations. As of June 27, 2015, we had $5.1 billion in cash and cash equivalents, approximately 4% of which was held by our international subsidiaries generated from our earnings of international operations. This percentage is lower than previous years because of proceeds from our senior notes offering, which we borrowed to fund the then proposed US Foods merger. Since the senior notes were redeemed subsequent to June 27, 2015, due to the termination of the merger agreement, we would expect this percentage to return to historical levels, such as 32%, which was the percentage as of June 28, 2014. If these earnings were transferred among countries or repatriated to the U.S., such amounts may be subject to additional tax obligations; however, we do not currently anticipate the need to repatriate this cash.
We believe the following sources will be sufficient to meet our anticipated cash requirements for the next twelve months, while maintaining sufficient liquidity for normal operating purposes:
• | our cash flows from operations; |
• | the availability of additional capital under our existing commercial paper programs, supported by our revolving credit facility and bank line of credit; and |
• | our ability to access capital from financial markets, including issuances of debt securities, either privately or under a shelf registration statement to be filed with the Securities and Exchange Commission (SEC) in the first quarter of fiscal 2016. |
Due to our strong financial position, we believe that we will continue to be able to effectively access the commercial paper market and long-term capital markets, if necessary.
35
Cash Flows
Operating Activities
Fiscal 2015 vs. Fiscal 2014
We generated $1.6 billion in cash flow from operations in fiscal 2015, as compared to $1.5 billion in fiscal 2014. This increase of $62.7 million, or 4.2%, was largely attributable to favorable comparisons on accrued expenses, partially offset by unfavorable comparisons on the cash impact of our Certain Items that increased $148.9 million year-over-year. Other unfavorable comparisons were a decrease in other long-term liabilities and the impact of timing for pension contributions, as well as increased working capital needs.
Included in the change in accrued expenses was a favorable comparison of incentive accruals due to better performance against incentive targets in fiscal 2015. Our Certain Items increased primarily from integration planning, litigation and termination costs in connection with the merger that had been proposed with US Foods. Our merger termination fees of $312.5 million, payable to US Foods and PFG, were accrued as of June 27, 2015, and were paid in the July 2015.
Included in the change in other long-term liabilities was a negative comparison on pension expense and contributions, which contributed $90.4 million to the unfavorable comparison on cash flow from operations for fiscal 2015 to fiscal 2014. Pension income was $15.3 million and pension contributions were $75.1 million, including a $50 million contribution to our Retirement Plan in fiscal 2015, which resulted in a decrease to other long-term liabilities. Pension expense was $4.8 million and pension contributions were $24.8 million in fiscal 2014, which resulted in a decrease to other long-term liabilities.
Changes in working capital, specifically accounts receivable, inventory and accounts payable, had a net unfavorable comparison of $25.0 million on the comparison of cash flow from operations for fiscal 2015 to fiscal 2014. There was a favorable comparison on inventory and accounts receivable, which was partially offset by unfavorable comparisons on accounts payable. Accounts receivable increased in both periods as a result of increases in sales; however, the level of increase in fiscal 2015 was less than fiscal 2014 due to improved collection efforts. Inventory increased in both periods as a result of increases in sales. However, inventory turnover improved in fiscal 2015, as compared to fiscal 2014. Accounts payable increased in both periods as a result of increases in sales. The year-over-year impact of the change in accounts payable is unfavorable to cash flow from operations due to working capital improvements that were at a greater magnitude in fiscal 2014 as compared to fiscal 2015.
Fiscal 2014 vs. Fiscal 2013
We generated $1.49 billion in cash flow from operations in fiscal 2014, as compared to $1.51 billion in fiscal 2013. The decrease of $18.8 million or 1.2%, was largely attributable to a negative comparison on pension expense and contributions, reduced net earnings, a negative comparison on multiemployer pension withdrawal provisions and payments and an unfavorable comparison on prepaid expenses. Partially offsetting these unfavorable comparisons was a favorable comparison on working capital, several significant accruals in fiscal 2014 and an increase in non-cash depreciation and amortization.
Included in the change in other long-term liabilities was a negative comparison on pension expense and contributions, which contributed $65 million to the unfavorable comparison on cash flow from operations for fiscal 2014 to fiscal 2013. Pension expense was $4.8 million and pension contributions were $24.8 million in fiscal 2014, which resulted in a decrease to other long-term liabilities. Pension expense was $138.3 million and pension contributions were $93.6 million in fiscal 2013, which resulted in an increase to other long-term liabilities.
Included in the change in accrued expenses was a negative comparison of $49.4 million on multiemployer withdrawal provisions and payments. Fiscal 2014 included a provision for multiemployer pension withdrawal of $1.5 million and payments of $40.8 million, which resulted in a decrease to accrued expenses. Fiscal 2013 included a provision for multiemployer pension withdrawal of $41.9 million and payments of $31.8 million, which resulted in an increase to accrued expenses. Partially offsetting the unfavorable impact of the multiemployer accrual comparison were several significant accruals unique to fiscal 2014, which contributed $48.5 million to cash flow from operations for fiscal 2014 to fiscal 2013.
Changes in working capital, specifically accounts receivable, inventory and accounts payable, had a favorable comparison of $129.7 million on the comparison of cash flow from operations for fiscal 2014 to fiscal 2013. There was a favorable comparison on accounts payable, which was partially offset by unfavorable comparisons on accounts receivable and inventory. Accounts receivable increased in both periods as a result of increases in sales. Our sales growth in fiscal 2014 was greater with our corporate-managed customers and payment terms for these types of customers are traditionally longer than average. This mix of longer-term
36
receivables contributed to the unfavorable comparison on cash flow from fiscal 2014 to fiscal 2013. Inventory increased in both periods as a result of increases in sales. However, inventory turnover improved in fiscal 2014, as compared to a deterioration of inventory turnover in fiscal 2013, due to working capital improvements in inventory. Fiscal 2014 also included an increase in inventory in transit, which offset the favorable comparison due to working capital improvements, resulting in an overall unfavorable comparison on cash flow from fiscal 2014 to fiscal 2013. Accounts payable increased in both periods as a result of increases in sales. The year-over-year impact of the change in accounts payable is favorable to cash flow from operations due to working capital improvements in accounts payable as well as an increase in fiscal 2014 in accounts payable related to inventory in transit.
Investing Activities
Fiscal 2015 capital expenditures included:
• | fleet replacements; |
• | investments in technology. |
• | replacement or significant expansion of facilities in Arizona, California, Iowa and Virginia; and |
• | construction of fold-out facilities in Ireland. |
Fiscal 2014 capital expenditures included:
• | fleet replacements; |
• | construction of fold-out facilities in Ontario, Canada and Ireland; |
• | replacement or significant expansion of facilities in Arizona, California, Pennsylvania and Virginia; and |
• | investments in technology. |
Fiscal 2013 capital expenditures included:
• | fleet replacements; |
• | construction of a fold-out facility in southern California; |
• | replacement or significant expansion of facilities in Georgia; British Columbia, Canada; Massachusetts and South Carolina; and |
• | investments in technology. |
The level of capital expenditures in fiscal 2015 was mostly consistent with fiscal 2014, representing a small increase of $19.6 million. Capital expenditures in fiscal 2014 increased by $11.3 million from fiscal 2013. Capital expenditures in fiscal 2014 and 2013 for our Business Transformation Project were $33.4 million and $20.0 million, respectively.
We estimate our capital expenditures, net of proceeds from sales of assets, in fiscal 2016 should be in the range of $550 million to $600 million. Fiscal 2016 expenditures will include facility, fleet and other equipment replacements and expansions; new facility construction, including fold-out facilities; and investments in technology.
During fiscal 2015, in the aggregate, the company paid cash of $115.9 million for operations acquired during fiscal 2015 and for contingent consideration related to operations acquired in previous fiscal years. During fiscal 2015, we acquired for cash a broadline company in Ontario, Canada; a joint venture interest in a foodservice distribution company in Mexico; a joint venture interest in a foodservice distribution company in Costa Rica and a specialty seafood company in New Jersey.
During fiscal 2014, in the aggregate, the company paid cash of $79.3 million for operations acquired during fiscal 2014 and for contingent consideration related to operations acquired in previous fiscal years. During fiscal 2014, we acquired for cash a specialty meat company in Maryland and broadline operations in Missouri, Ohio and Philadelphia.
During fiscal 2013, in the aggregate, the company paid cash of $397.4 million for operations acquired during fiscal 2013 and for contingent consideration related to operations acquired in previous fiscal years. During fiscal 2013, we acquired for cash broadline operations in Bahamas, California, Ohio, Quebec, Canada, Northern Ireland; specialty seafood companies in Ontario, Canada, Florida and Houston; specialty produce in Ireland and our Sysco Ventures startup in California.
Free Cash Flow
Free cash flow represents net cash provided from operating activities less purchases of plant and equipment plus proceeds from sales of plant and equipment. Sysco considers free cash flow to be a non-GAAP liquidity measure that provides useful information to management and investors about the amount of cash generated by the business after the purchases and sales of buildings, fleet, equipment and technology, which may potentially be used to pay for, among other things, strategic uses of cash
37
including dividend payments, share repurchases and acquisitions. However, free cash flow may not be available for discretionary expenditures, as it may be necessary that we use it to make mandatory debt service or other payments. As a result of increased cash provided by operating activities, partially offset by increased capital spending and decreased proceeds from sales of plant and equipment, free cash flow for fiscal 2015 increased 4.2%, or $41.7 million, to $1.0 billion as compared to fiscal 2014. Increased cash provided by operating activities, partially offset by increased capital spending, resulted in free cash flow for fiscal 2014 decreasing 2.0%, or $19.9 million, to $995.4 million as compared to fiscal 2013.
Free cash flow should not be used as a substitute in assessing the company’s liquidity for the periods presented. An analysis of any non-GAAP financial measure should be used in conjunction with results presented in accordance with GAAP. In the table that follows, free cash flow for each period presented is reconciled to net cash provided by operating activities.
2015 | 2014 | Change in Dollars | % Change | |||||||||||
(In thousands) | ||||||||||||||
Net cash provided by operating activities (GAAP) | $ | 1,555,484 | $ | 1,492,815 | $ | 62,669 | 4.2 | |||||||
Additions to plant and equipment | (542,830 | ) | (523,206 | ) | (19,624 | ) | 3.8 | |||||||
Proceeds from sales of plant and equipment | 24,472 | 25,790 | (1,318 | ) | (5.1 | ) | ||||||||
Free Cash Flow (Non-GAAP) | $ | 1,037,126 | $ | 995,399 | $ | 41,727 | 4.2 | |||||||
2014 | 2013 | Change in Dollars | % Change | |||||||||||
(In thousands) | ||||||||||||||
Net cash provided by operating activities (GAAP) | $ | 1,492,815 | $ | 1,511,594 | $ | (18,779 | ) | (1.2 | ) | |||||
Additions to plant and equipment | (523,206 | ) | (511,862 | ) | (11,344 | ) | 2.2 | |||||||
Proceeds from sales of plant and equipment | 25,790 | 15,527 | 10,263 | 66.1 | ||||||||||
Free Cash Flow (Non-GAAP) | $ | 995,399 | $ | 1,015,259 | $ | (19,860 | ) | (2.0 | ) | |||||
Financing Activities
Equity Transactions
Proceeds from exercises of share-based compensation awards were $240.2 million in fiscal 2015, $255.6 million in fiscal 2014 and $628.7 million in fiscal 2013. The level of proceeds in each year is directly related to the number of options exercised in each year. The level of option exercises, and thus proceeds, will vary from period to period and is largely dependent on movements in our stock price.
We traditionally have engaged in Board-approved share repurchase programs. No shares were acquired in fiscal 2015 due to the proposed US Foods merger. The number of shares acquired and their cost during 2014 and 2013 were 10,059,000 shares for $332.4 million in fiscal 2014 and 21,672,403 shares for $721.6 million in fiscal 2013. No additional shares were repurchased through August 13, 2015, resulting in a remaining authorization by our Board of Directors to repurchase up to 11,655,197 shares from a repurchase program that expired on August 23, 2015. In June 2015, our Board of Directors approved a repurchase program to repurchase from time to time in the open market, through an accelerated share repurchase program or through privately negotiated transactions, shares of the company's common stock in an amount not to exceed $3.0 billion during the two year period ending July 1, 2017, including $1.5 billion through a planned accelerated share repurchase in fiscal 2016, in addition to amounts normally repurchased to offset benefit plan and stock option dilution. In addition to the share repurchase program approved in June, in August 2015, our Board of Directors approved the repurchase of up to 20,000,000 shares for an aggregate purchase price not to exceed $800 million. The authorization expires on August 21, 2017. Beyond our $3.0 billion share repurchase program approved in June 2015, our share repurchase strategy is to purchase enough shares to keep our average shares outstanding relatively constant over time. The number of shares we repurchase in fiscal 2016 will be dependent on many factors, including the level of future stock option exercises as well as competing uses for available cash.
We have made dividend payments to our shareholders in each fiscal year since our company’s inception over 40 years ago. We target a dividend payout of 40% to 50% of net earnings. We paid in excess of that range in fiscal 2015 and fiscal 2014 primarily due to increased expenses from our Certain Items. Dividends paid were $695.3 million, or $1.17 per share, in fiscal 2015, $667.2 million, or $1.14 per share, in fiscal 2014 and $648.3 million, or $1.10 per share, in fiscal 2013. In May 2015, we declared our regular quarterly dividend for the first quarter of fiscal 2016 of $0.30 per share, which was paid in July 2015.
38
In November 2000, we filed with the SEC a shelf registration statement covering 30,000,000 shares of common stock to be offered from time to time in connection with acquisitions. As of August 13, 2015, 29,477,835 shares remained available for issuance under this registration statement.
Debt Activity and Borrowing Availability
Our debt activity, including issuances and repayments, and our borrowing availability is described in Note 11, “Debt and Other Financing Arrangements.” Our outstanding borrowings at June 27, 2015, and repayment activity since the close of fiscal 2015, are disclosed within that note. Updated amounts through August 13, 2015, include:
• | $744.0 million outstanding from our commercial paper program |
• | No amounts outstanding from the credit facility supporting the company’s U.S. and Canadian commercial paper programs. |
Our aggregate commercial paper issuances and short-term bank borrowings had a weighted average interest rate of 0.54%, for fiscal 2015 and 0.16% for each of fiscal 2014 and 2013 respectively.
In the first quarter of fiscal 2016, we intend to file with the SEC an automatically effective well-known seasoned issuer shelf registration statement for the issuance of an indeterminate amount of common stock, preferred stock, debt securities and guarantees of debt securities that may be issued from time to time.
Other Considerations
Multiemployer Plans
Our exposure to multiemployer defined benefit plans is discussed in Note 15, “Multiemployer Employee Benefit Plans,” including our estimate of our share of withdrawal liability for these plans. An update of this amount through August 13, 2015, based on the latest available information, is unchanged from the amount disclosed in Note 15.
Potential Contingencies Impacting Liquidity
Certain tax jurisdictions require partial to full payment on audit assessments or the posting of letters of credit in order to proceed to the appeals process. Sysco has posted approximately $90 million in letters of credit, representing a partial payment of the audit assessments, in order to appeal the Canadian Revenue Authority assessments of transfer pricing adjustments relating to our cross border procurement activities through our former purchasing cooperative on our fiscal 2004 through fiscal 2009 fiscal years. We are protesting these adjustments through appeals. We could have to pay cash or post additional letters of credit of as much as $16.0 million, in order to appeal these assessments.
Off-Balance Sheet Arrangements
We have no off-balance sheet arrangements.
39
Contractual Obligations
The following table sets forth, as of June 27, 2015, certain information concerning our obligations and commitments to make contractual future payments:
Payments Due by Period | |||||||||||||||||||
More Than | |||||||||||||||||||
Total | < 1 Year | 1-3 Years | 3-5 Years | 5 Years | |||||||||||||||
(In thousands) | |||||||||||||||||||
Recorded Contractual Obligations: | |||||||||||||||||||
Principal payments of long-term debt | 7,271,831 | 5,002,972 | 526,291 | 266,972 | 1,475,596 | ||||||||||||||
Mandatory senior note redemption premium | 50,000 | 50,000 | |||||||||||||||||
Merger-termination payments | 312,500 | 312,500 | |||||||||||||||||
Other debt repayments | $ | 69,542 | $ | 69,542 | |||||||||||||||
Capital leases obligations | 32,939 | 4,971 | 9,543 | 5,946 | 12,479 | ||||||||||||||
Deferred compensation (1) | 82,925 | 7,288 | 11,945 | 9,186 | 54,506 | ||||||||||||||
Pension Plan (2) | 44,900 | 44,900 | |||||||||||||||||
SERP and other postretirement plans (3) | 306,424 | 28,268 | 58,908 | 61,409 | 157,839 | ||||||||||||||
Unrecognized tax benefits and interest (4) | 70,992 | 70,992 | |||||||||||||||||
Unrecorded Contractual Obligations: | |||||||||||||||||||
Interest payments related to debt (5) | 1,453,240 | 143,851 | 215,523 | 164,017 | 929,849 | ||||||||||||||
Operating lease obligations | 196,223 | 47,559 | 66,013 | 36,981 | 45,670 | ||||||||||||||
Purchase obligations (6) | 5,032,523 | 3,823,783 | 1,098,488 | 108,761 | 1,491 | ||||||||||||||
Total contractual cash obligations | $ | 14,924,039 | $ | 9,561,726 | $ | 1,986,711 | $ | 653,272 | $ | 2,722,330 | |||||||||
(1) The estimate of the timing of future payments under the Executive Deferred Compensation Plan involves the use of certain assumptions, including retirement ages and payout periods.
(2) The estimated contributions through fiscal 2024 to meet ERISA minimum funding requirements based on actuarial assumptions include the extension of funding relief included in the Highway and Transportation Funding Act of 2014.
(3) Includes estimated contributions to the unfunded SERP and other postretirement benefit plans made in amounts needed to fund benefit payments for vested participants in these plans through fiscal 2025, based on actuarial assumptions.
(4) Unrecognized tax benefits relate to uncertain tax positions recorded under accounting standards related to uncertain tax positions. As of June 27, 2015, we had a liability of $37.5 million for unrecognized tax benefits for all tax jurisdictions and $33.4 million for related interest that could result in cash payment. We are not able to reasonably estimate the timing of non-current payments or the amount by which the liability will increase or decrease over time. Accordingly, the related non-current balances have not been reflected in the "Payments Due by Period" section of the table.
(5) Includes payments on floating rate debt based on rates as of June 27, 2015, assuming amount remains unchanged until maturity, and payments on fixed rate debt based on maturity dates. The impact of our outstanding fixed-to-floating interest rate swap on the fixed rate debt interest payments is included as well based on the floating rates in effect as of June 27, 2015.
(6) For purposes of this table, purchase obligations include agreements for purchases of product in the normal course of business, for which all significant terms have been confirmed, including minimum quantities resulting from our category management initiative. As we progress with this initiative, our purchase obligations are increasing. Such amounts included in the table above are based on estimates. Purchase obligations also includes amounts committed with various third party service providers to provide information technology services for period up to fiscal 2019 (See discussion under Note 20, “Commitments and Contingencies”, to the Notes to Consolidated Financial Statements in Item 8) and fixed fuel purchase commitments. Purchase obligations exclude full requirements electricity contracts where no stated minimum purchase volume is required.
Certain acquisitions involve contingent consideration, typically payable only in the event that certain operating results are attained or certain outstanding contingencies are resolved. Aggregate contingent consideration amounts outstanding as of June 27, 2015 were $39 million. This amount is not included in the table above.
40
Critical Accounting Policies and Estimates
The preparation of financial statements in conformity with generally accepted accounting principles requires us to make estimates and assumptions that affect the reported amounts of assets, liabilities, sales and expenses in the accompanying financial statements. Significant accounting policies employed by Sysco are presented in the notes to the financial statements.
Critical accounting policies and estimates are those that are most important to the portrayal of our financial position and results of operations. These policies require our most subjective or complex judgments, often employing the use of estimates about the effect of matters that are inherently uncertain. We have reviewed with the Audit Committee of the Board of Directors the development and selection of the critical accounting policies and estimates and this related disclosure. Our most critical accounting policies and estimates pertain to the allowance for doubtful accounts receivable, self-insurance programs, company-sponsored pension plans, income taxes, vendor consideration, goodwill and intangible assets and share-based compensation.
Allowance for Doubtful Accounts
We evaluate the collectability of accounts receivable and determine the appropriate reserve for doubtful accounts based on a combination of factors. We utilize specific criteria to determine uncollectible receivables to be written off, including whether a customer has filed for or has been placed in bankruptcy, has had accounts referred to outside parties for collection or has had accounts past due over specified periods. In these instances, a specific allowance for doubtful accounts is recorded to reduce the receivable to the net amount reasonably expected to be collected. Allowances are recorded for all other receivables based on an analysis of historical trends of write-offs and recoveries. Our judgment is required as to the impact of certain of these items and other factors as to ultimate realization of our accounts receivable. If the financial condition of our customers were to deteriorate, additional allowances may be required.
Self-Insurance Program
We maintain a self-insurance program covering portions of workers’ compensation, general liability and vehicle liability costs. The amounts in excess of the self-insured levels are fully insured by third party insurers. We also maintain a fully self-insured group medical program. Liabilities associated with these risks are estimated in part by considering historical claims experience, medical cost trends, demographic factors, severity factors and other actuarial assumptions. Projections of future loss expenses are inherently uncertain because of the random nature of insurance claims occurrences and could be significantly affected if future occurrences and claims differ from these assumptions and historical trends. In an attempt to mitigate the risks of workers’ compensation, vehicle and general liability claims, safety procedures and awareness programs have been implemented.
Company-Sponsored Pension Plans
Amounts related to defined benefit plans recognized in the financial statements are determined on an actuarial basis. Two of the more critical assumptions in the actuarial calculations are the discount rate for determining the current value of plan benefits and the expected rate of return on plan assets. Our Retirement Plan was frozen in fiscal 2013 and is only open to a small number of employees. Our SERP was frozen in fiscal 2013. Due to these plan freezes, our assumption for the rate of increase in future compensation is no longer a critical assumption.
For guidance in determining the discount rates, we calculate the implied rate of return on a hypothetical portfolio of high-quality fixed-income investments for which the timing and amount of cash outflows approximates the estimated payouts of the pension plan. The discount rate assumption is reviewed annually and revised as deemed appropriate. The discount rate for determining fiscal 2015 net pension costs for the Retirement Plan, which was determined as of the June 28, 2014 measurement date, decreased 58 basis points to 4.74%. The discount rate for determining fiscal 2015 net pension costs for the SERP, which was determined as of the June 28, 2014 measurement date, decreased 35 basis points to 4.59%. The combined effect of these discount rate changes increased our net company-sponsored pension costs for all plans for fiscal 2015 by an estimated $7 million. The discount rate for determining fiscal 2016 net pension costs for the Retirement Plan, which was determined as of the June 27, 2015 measurement date, increased 10 basis points to 4.84%. The discount rate for determining fiscal 2016 net pension costs for the SERP, which was determined as of the June 27, 2015 measurement date, increased 4 basis points to 4.63%. The combined effect of these discount rate changes will decrease our net company-sponsored pension costs for all plans for fiscal 2016 by an estimated $1 million. A 100 basis point increase (or decrease) in the discount rates for fiscal 2015 would decrease (or increase) Sysco’s net company-sponsored pension cost by approximately $11 million. Now that Sysco’s pension plans are frozen, net company-sponsored pension cost is not as sensitive to discount rate changes as compared to when these plans were active.
The expected long-term rate of return on plan assets of the Retirement Plan was 7.75% for fiscal 2015 and fiscal 2014. The expectations of future returns are derived from a mathematical asset model that incorporates assumptions as to the various asset
41
class returns, reflecting a combination of historical performance analysis and the forward-looking views of the financial markets regarding the yield on bonds, historical returns of the major stock markets and returns on alternative investments. Although not determinative of future returns, the effective annual rate of return on plan assets, developed using geometric/compound averaging, was approximately 8.3%, 6.3%, 11.1%, and 7.7%, over the 20-year, 10-year, 5-year and 1-year periods ended December 31, 2014, respectively. In addition, in seven of the last 15 years, the actual return on plan assets has exceeded 10%. The rate of return assumption is reviewed annually and revised as deemed appropriate.
The expected return on plan assets impacts the recorded amount of net pension costs. The expected long-term rate of return on plan assets of the Retirement Plan is 7.25% for fiscal 2016. A 100 basis point increase (decrease) in the assumed rate of return for fiscal 2015 would decrease (increase) Sysco’s net company-sponsored pension costs for fiscal 2015 by approximately $30 million.
Pension accounting standards require the recognition of the funded status of our defined benefit plans in the statement of financial position, with a corresponding adjustment to accumulated other comprehensive income, net of tax. The amount reflected in accumulated other comprehensive loss related to the recognition of the funded status of our defined benefit plans as of June 27, 2015 was a charge, net of tax, of $705.3 million. The amount reflected in accumulated other comprehensive loss related to the recognition of the funded status of our defined benefit plans as of June 28, 2014 was a charge, net of tax, of $686.0 million.
We made cash contributions to our company-sponsored pension plans of $75.1 million and $24.8 million in fiscal years 2015 and 2014, respectively. Our contributions in fiscal 2015 include a $50.0 million contribution to the Retirement Plan that was voluntary, as there was no minimum required contribution for the calendar 2014 plan year to meet ERISA minimum funding requirements. There was no contribution to the Retirement Plan in fiscal 2014, as there was no minimum required contribution for the calendar 2013 plan year to meet ERISA minimum funding requirements. There are no required contributions to the Retirement Plan to meet ERISA minimum funding requirements in fiscal 2016. The estimated fiscal 2016 contributions to fund benefit payments for the SERP plan are approximately $28 million.
Income Taxes
The determination of our provision for income taxes requires significant judgment, the use of estimates and the interpretation and application of complex tax laws. Our provision for income taxes primarily reflects a combination of income earned and taxed in the various U.S. federal and state, as well as foreign jurisdictions. Jurisdictional tax law changes, increases or decreases in permanent differences between book and tax items, accruals or adjustments of accruals for unrecognized tax benefits or valuation allowances, and our change in the mix of earnings from these taxing jurisdictions all affect the overall effective tax rate.
Our liability for unrecognized tax benefits contains uncertainties because management is required to make assumptions and to apply judgment to estimate the exposures associated with our various filing positions. We believe that the judgments and estimates discussed herein are reasonable; however, actual results could differ, and we may be exposed to losses or gains that could be material. To the extent we prevail in matters for which a liability has been established, or pay amounts in excess of recorded liabilities, our effective income tax rate in a given financial statement period could be materially affected. An unfavorable tax settlement generally would require use of our cash and may result in an increase in our effective income tax rate in the period of resolution. A favorable tax settlement may be recognized as a reduction in our effective income tax rate in the period of resolution.
Vendor Consideration
We recognize consideration received from vendors when the services performed in connection with the monies received are completed and when the related product has been sold by Sysco. There are several types of cash consideration received from vendors. In many instances, the vendor consideration is in the form of a specified amount per case or per pound. In these instances, we will recognize the vendor consideration as a reduction of cost of sales when the product is sold. In some instances, vendor consideration is received upon receipt of inventory in our distribution facilities. We calculate the amount needed to reduce our inventory based on inventory turns until the product is sold. Our inventory turnover is usually less than one month; therefore, amounts deferred against inventory do not require long-term estimation. In the situations where the vendor consideration is not related directly to specific product purchases, we will recognize these as a reduction of cost of sales when the earnings process is complete, the related service is performed and the amounts realized. Historically, adjustments to our estimates related to vendor consideration have not been significant.
42
Goodwill and Intangible Assets
Goodwill and intangible assets represent the excess of consideration paid over the fair value of tangible net assets acquired. Certain assumptions and estimates are employed in determining the fair value of assets acquired, including goodwill and other intangible assets, as well as determining the allocation of goodwill to the appropriate reporting unit.
In addition, annually in our fourth quarter or more frequently as needed, we assess the recoverability of goodwill and indefinite-lived intangibles by determining whether the fair values of the applicable reporting units exceed the carrying values of these assets. The reporting units used in assessing goodwill impairment are our 13 operating segments as described in Note 21, “Business Segment Information,” to the Consolidated Financial Statements in Item 8. The components within each of our 13 operating segments have similar economic characteristics and therefore are aggregated into 13 reporting units.
We arrive at our estimates of fair value using a combination of discounted cash flow and earnings multiple models. The results from each of these models are then weighted and combined into a single estimate of fair value for each of our 13 operating segments. We primarily use a 60% weighting for our discounted cash flow valuation and 40% for the earnings multiple models giving greater emphasis to our discounted cash flow model because the forecasted operating results that serve as a basis for the analysis incorporate management’s outlook and anticipated changes for the businesses consistent with a market participant. The primary assumptions used in these various models include estimated earnings multiples of comparable acquisitions in the industry including control premiums, earnings multiples on acquisitions completed by Sysco in the past, future cash flow estimates of the reporting units, which are dependent on internal forecasts and projected growth rates, and weighted average cost of capital, along with working capital and capital expenditure requirements. When possible, we use observable market inputs in our models to arrive at the fair values of our reporting units. We update our projections used in our discounted cash flow model based on historical performance and changing business conditions for each of our reporting units.
Our estimates of fair value contain uncertainties requiring management to make assumptions and to apply judgment to estimate industry economic factors and the profitability of future business strategies. Actual results could differ from these assumptions and projections, resulting in the company revising its assumptions and, if required, recognizing an impairment loss. There were no impairments of goodwill or indefinite-lived intangibles recorded as a result of assessment in fiscal 2015, 2014 or 2013. Our past estimates of fair value for fiscal 2014 and 2013 have not been materially different when revised to include subsequent years’ actual results. Sysco has not made any material changes in its impairment assessment methodology during the past three fiscal years. We do not believe the estimates used in the analysis are reasonably likely to change materially in the future but we will continue to assess the estimates in the future based on the expectations of the reporting units. In the fiscal 2015 assessment, our estimates of fair value did not require additional analysis. However, we would have performed additional analysis to determine if an impairment existed for our Costa Rican Broadline and European Broadline reporting units if our estimates of fair value were decreased by 14% to 15%, respectively. As of June 27, 2015, these reporting units had goodwill aggregating $218.2 million. For the remainder of our reporting units, which as of June 27, 2015 had goodwill aggregating $1.8 billion, we would have performed additional analysis to determine if an impairment existed for a reporting unit if the estimated fair value of these reporting units had declined by greater than 25%.
Certain reporting units (Caribbean Broadline, European Broadline, specialty produce, custom-cut meat, lodging industry products, imported specialty products, international distribution operations and our Sysco Ventures platform) have a greater proportion of goodwill recorded to estimated fair value as compared to the U.S. Broadline, Canada Broadline or SYGMA reporting units. This is primarily due to these businesses having been more recently acquired, and as a result there has been less history of organic growth than in the U.S. Broadline, Canadian Broadline and SYGMA reporting units. In addition, these businesses also have lower levels of cash flow than the U.S. Broadline reporting unit. As such, these reporting units have a greater risk of future impairment if their operations were to suffer a significant downturn.
Share-Based Compensation
Sysco provides compensation benefits to employees and non-employee directors under several share-based payment arrangements including various employee stock option plans, a non-employee director plan and the Employees’ Stock Purchase Plan.
As of June 27, 2015, there was $69.4 million of total unrecognized compensation cost related to share-based compensation arrangements. That cost is expected to be recognized over a weighted-average period of 2.42 years.
The fair value of each option award is estimated on the date of grant using a Black-Scholes option pricing model. Expected volatility is based on historical volatility of Sysco’s stock, implied volatilities from traded options on Sysco’s stock and other factors. We utilize historical data to estimate option exercise and employee termination behavior within the valuation model;
43
separate groups of employees that have similar historical exercise behavior are considered separately for valuation purposes. Expected dividend yield is estimated based on the historical pattern of dividends and the average stock price for the year preceding the option grant. The risk-free rate for the expected term of the option is based on the U.S. Treasury yield curve in effect at the time of grant.
The fair value of each restricted stock unit award granted with a dividend equivalent is based on the company’s stock price as of the date of grant. For restricted stock units granted without dividend equivalents, the fair value is reduced by the present value of expected dividends during the vesting period.
The fair value of the stock issued under the Employee Stock Purchase Plan is calculated as the difference between the stock price and the employee purchase price.
The fair value of restricted stock granted to employees or non-employee directors is based on the stock price on grant date. The application of a discount to the fair value of a restricted stock grant is dependent upon whether or not each individual grant contains a post-vesting restriction.
The compensation cost related to these share-based awards is recognized over the requisite service period. The requisite service period is generally the period during which an employee is required to provide service in exchange for the award. The compensation cost related to stock issuances resulting from employee purchases of stock under the Employees’ Stock Purchase Plan is recognized during the quarter in which the employee payroll withholdings are made.
Our share-based awards are generally subject to graded vesting over a service period. We will recognize compensation cost on a straight-line basis over the requisite service period for the entire award.
In addition, certain of our share-based awards provide that the awards continue to vest as if the award holder continued to be an employee or director if the award holder meets certain age and years of service thresholds upon retirement. In these cases, we will recognize compensation cost for such awards over the period from the grant date to the date the employee or director first becomes eligible to retire with the options continuing to vest after retirement.
Our option grants include options that qualify as incentive stock options for income tax purposes. In the period the compensation cost related to incentive stock options is recorded, a corresponding tax benefit is not recorded as it is assumed that we will not receive a tax deduction related to such incentive stock options. We may be eligible for tax deductions in subsequent periods to the extent that there is a disqualifying disposition of the incentive stock option. In such cases, we would record a tax benefit related to the tax deduction in an amount not to exceed the corresponding cumulative compensation cost recorded in the financial statements on the particular options multiplied by the statutory tax rate.
Forward-Looking Statements
Certain statements made herein that look forward in time or express management’s expectations or beliefs with respect to the occurrence of future events are forward-looking statements under the Private Securities Litigation Reform Act of 1995. These statements are based on management’s current expectations and estimates. Forward-looking statements provide current expectations of future events based on certain assumptions and include any statement that does not directly relate to any historical or current fact. Forward-looking statements can also be identified by words such as “future,” “anticipates,” “believes,” “estimates,” “expects,” “intends,” “plans,” “predicts,” “will,” “would,” “could,” “can,” “may,” and similar terms. Forward-looking statements are not guarantees of future performance and our actual results may differ significantly from the results discussed in the forward-looking statements. Factors that might cause such differences include, but are not limited to, those discussed in Part I, Item 1A of this Form 10-K under the heading “Risk Factors,” which are incorporated herein by reference.
In addition to the Risk Factors discussed in Part I, Item 1A of this Form 10-K, the success of Sysco’s strategic initiatives could be affected by conditions in the economy and the industry and internal factors, such as the ability to control expenses, including fuel costs. Our expectations regarding cost per case may be impacted by factors beyond our control, including actions by our competitors and/or customers. Company-sponsored pension plan liabilities are impacted by a number of factors including the discount rate for determining the current value of plan benefits, the assumption for the rate of increase in future compensation levels and the expected rate of return on plan assets. The amount of shares repurchased in a given period is subject to a number of factors, including available cash and our general working capital needs at the time. Meeting our dividend target objectives depends on our level of earnings, available cash and the success of our various strategic initiatives. Our expectations regarding earnings per share and various items impacting earnings is subject to a number of factors, including our ability to manage operating expenses and the impact of Certain Items. Our plans with respect to growth in international markets and adjacent areas that complement our core business are subject to our other strategic initiatives, the allocation of resources, and plans and economic
44
conditions generally. Legal proceedings and the adequacy of insurance are impacted by events, circumstances and individuals beyond the control of Sysco. The need for additional borrowing or other capital is impacted by various factors, including capital expenditures or acquisitions in excess of those currently anticipated, levels of stock repurchases, or other unexpected cash requirements. Plans regarding the repayment of debt are subject to change at any time based on management’s assessment of the overall needs of the company. Capital expenditures may vary from those projected based on changes in business plans and other factors, including risks related to the timing and successful completions of acquisitions, construction schedules and the possibility that other cash requirements could result in delays or cancellations of capital spending. Our ability to finance capital expenditures as anticipated may be influenced by our results of operations, our borrowing capacity, share repurchases, dividend levels and other factors. Expectations regarding tax rates and the transfer of cash held in foreign jurisdictions are subject to various factors beyond our control and decisions of management throughout the fiscal year that are subject to change based on Sysco's business needs. The anticipated impact of compliance with laws and regulations also involves the risk that estimates may turn out to be materially incorrect, and laws and regulations, as well as methods of enforcement, are subject to change.
Item 7A. Quantitative and Qualitative Disclosures About Market Risk
Interest Rate Risk
We do not utilize financial instruments for trading purposes. Our use of debt directly exposes us to interest rate risk. Floating rate debt, where the interest rate fluctuates periodically, exposes us to short-term changes in market interest rates. Fixed rate debt, where the interest rate is fixed over the life of the instrument, exposes us to changes in market interest rates reflected in the fair value of the debt and to the risk that we may need to refinance maturing debt with new debt at higher rates.
We manage our debt portfolio to achieve an overall desired position of fixed and floating rates and may employ interest rate swaps as a tool to achieve that position. The major risks from interest rate derivatives include changes in the interest rates affecting the fair value of such instruments, potential increases in interest expense due to market increases in floating interest rates and the creditworthiness of the counterparties in such transactions.
Fiscal 2015
As of June 27, 2015, we had no commercial paper outstanding. Total debt as of June 27, 2015 was $7.3 billion, of which approximately 74% was at fixed rates of interest, including the impact of our interest rate swap agreement. Included in the total debt amount is $5.0 billion in senior notes that were issued in October 2014, for the proposed merger with US Foods. The October 2014 senior notes contained mandatory redemption features providing that, on the earlier of the merger agreement termination date or October 8, 2015, we were required to redeem all of the senior notes at a redemption price equal to 101% of the principal of the senior notes plus accrued interest. In June 2015, we terminated the merger agreement and redeemed the senior notes in July 2015 using cash on hand and the proceeds from borrowings under our commercial paper facility.
In August 2013, we entered into an interest rate swap agreement that effectively converted $500.0 million of fixed rate debt maturing in fiscal 2018 to floating rate debt. In October 2014, we also entered into interest rate swap agreements that effectively converted $500.0 million of the new senior notes maturing on October 2, 2017 and $750.0 million of the new senior notes maturing on October 2, 2019 to floating rate debt (2014 swaps). These transactions were entered into with the goal of reducing overall borrowing cost. The major risks from interest rate derivatives include changes in interest rates affecting the fair value of such instruments, potential increases in interest expense due to market increases in floating interest rates and the creditworthiness of the counterparties in such transactions. These transactions were designated as fair value hedges since the swaps hedge against the change in fair value of fixed rate debt resulting from changes in interest rates.
Our 2014 swaps were terminated in July 2015. Details of our outstanding swap agreements at June 27, 2015, are below:
Maturity Date of Swap | Notional Value (in millions) | Fixed Coupon Rate on Hedged Debt | Floating Interest Rate on Swap | Floating Rate Reset Terms | Location of Fair Value on Balance Sheet | Fair Value of Asset (Liability) (in thousands) | |||||||||||
October 2, 2017 | $ | 500 | 1.45 | % | Three-month LIBOR | Every three months in arrears | Other assets | $ | 2,419 | ||||||||
February 12, 2018 | 500 | 5.25 | % | Six-month LIBOR | Every six months in advance | Other assets | 4,275 | ||||||||||
October 2, 2019 | 750 | 2.35 | % | Three-month LIBOR | Every three months in advance | Other assets | 5,903 | ||||||||||
45
In January 2014, in contemplation of securing financing and hedging interest rate risk relating to our assumption or refinancing of the net debt of US Foods that was scheduled to occur upon closing of the proposed merger (discussed in Note 4, “Acquisitions”), we entered into two forward starting swap agreements with notional amounts totaling $2.0 billion. We designated these derivatives as cash flow hedges of the variability in the cash outflows of interest payments on 10-year and 30-year debt issued in fiscal 2015. In September 2014, in conjunction with the pricing of the $1.25 billion senior notes maturing on October 2, 2024 and $1 billion senior notes maturing October 2, 2044, we terminated these swaps, locking in the effective yields on the related debt. Cash of $58.9 million was paid to settle the 10-year swap in September 2014, and cash of $129.9 million was paid to settle the 30-year swap in October 2014.
The following tables present our interest rate position as of June 27, 2015. All amounts are stated in United States (U.S.) dollar equivalents.
Interest Rate Position as of June 27, 2015 | |||||||||||||||||||||||||||||||
Principal Amount by Expected Maturity | |||||||||||||||||||||||||||||||
Average Interest Rate | |||||||||||||||||||||||||||||||
2016 | 2017 | 2018 | 2019 | 2020 | Thereafter | Total | Fair Value | ||||||||||||||||||||||||
(Dollars in thousands) | |||||||||||||||||||||||||||||||
U.S. $ Denominated: | |||||||||||||||||||||||||||||||
Fixed Rate Debt | $ | 3,713,525 | $ | 4,258 | $ | 3,017 | $ | 250,874 | $ | 1,399 | $ | 1,460,334 | $ | 5,433,407 | $ | 5,675,462 | |||||||||||||||
Average Interest Rate | 3.8 | % | 3.6 | % | 4.4 | % | 5.5 | % | 6.1 | % | 5.1 | % | 4.5 | % | |||||||||||||||||
Floating Rate Debt (1) | $ | 1,254,138 | $ | 21,794 | $ | 503,875 | $ | 15,094 | $ | — | $ | — | $ | 1,794,901 | $ | 1,794,902 | |||||||||||||||
Average Interest Rate | 2.0 | % | 3.9 | % | 5.4 | % | 2.9 | % | — | — | 3.0 | % | |||||||||||||||||||
Canadian $ Denominated: | |||||||||||||||||||||||||||||||
Fixed Rate Debt | $ | 1,456 | $ | 1,475 | $ | 1,325 | $ | 1,268 | $ | 1,350 | $ | 10,717 | $ | 17,590 | $ | 18,374 | |||||||||||||||
Average Interest Rate | 8.3 | % | 8.3 | % | 9.0 | % | 9.6 | % | 9.7 | % | 9.8 | % | 9.5 | % | |||||||||||||||||
(1) Includes fixed rate debt that has been converted to floating rate debt through an interest rate swap agreement.
Interest Rate Position as of June 27, 2015 | ||||||||||||||||||||||||||
Notional Amount by Expected Maturity | ||||||||||||||||||||||||||
Average Interest Swap Rate | ||||||||||||||||||||||||||
2016 | 2017 | 2018 | 2019 | 2020 | Thereafter | Total | ||||||||||||||||||||
(Dollars in thousands) | ||||||||||||||||||||||||||
Interest Rate Swaps | ||||||||||||||||||||||||||
Related To Debt: | ||||||||||||||||||||||||||
Pay Variable/Receive Fixed | $ | 1,250,000 | — | 500,000 | — | $ | — | $ | — | $ | 1,750,000 | |||||||||||||||
Average Variable Rate Paid: | ||||||||||||||||||||||||||
Rate A Plus | 3.2 | % | — | — | ||||||||||||||||||||||
Rate B Plus | (1) | — | — | |||||||||||||||||||||||
Fixed Rate Received | (2) | 5.25 | % | — | — | |||||||||||||||||||||
Rate A – six-month LIBOR
Rate B – three-month LIBOR
(1) 0.22% for notional amount of $500,000 maturing on October 2, 2017 and .046% for notional amount of $750,000 maturing on October 2, 2019
(2) 1.45% for notional amount of $500,000 maturing on October 2, 2017 and 2.35% for notional amount of $750,000 maturing on October 2, 2019
In August 2015, the company entered into two forward starting swap agreements with notional amounts totaling $500 million. The company designated these derivatives as cash flow hedges to reduce interest rate exposure on forecasted 10-year debt due to changes in the benchmark interest rates for debt the company expects to issue in fiscal 2016.
46
Foreign Currency Exchange Rate Risk
The majority of our foreign subsidiaries use their local currency as their functional currency. To the extent that business transactions are not denominated in a foreign subsidiary’s functional currency, we are exposed to foreign currency exchange rate risk. We will also incur gains and losses within our shareholders’ equity due to the translation of our financial statements from foreign currencies into U.S. dollars. Our income statement trends may be impacted by the translation of the income statements of our foreign subsidiaries into U.S. dollars. The exchange rates used to translate our foreign sales into U.S. dollars negatively impacted sales by 1.0% in fiscal 2015 when compared to fiscal 2014. The exchange rate used to translate our foreign sales into U.S. dollars negatively impacted sales by 0.7% in fiscal 2014 when compared to fiscal 2013. The impact to our operating income, net earnings and earnings per share was not material in fiscal 2015 or fiscal 2014. A 10% unfavorable change in the fiscal 2015 weighted year-to-date exchange rate and the resulting impact on our financial statements would have negatively impacted fiscal 2015 sales by 1.2% and would not have materially impacted our operating income, net earnings and earnings per share. We do not routinely enter into material agreements to hedge foreign currency exchange rate risks.
Fuel Price Risk
Due to the nature of our distribution business, we are exposed to potential volatility in fuel prices. The price and availability of diesel fuel fluctuates due to changes in production, seasonality and other market factors generally outside of our control. Increased fuel costs may have a negative impact on our results of operations in three areas. First, the high cost of fuel can negatively impact consumer confidence and discretionary spending and thus reduce the frequency and amount spent by consumers for food-away-from-home purchases. Second, the high cost of fuel can increase the price we pay for product purchases and we may not be able to pass these costs fully to our customers. Third, increased fuel costs impact the costs we incur to deliver product to our customers. During fiscal 2015 fuel costs related to outbound deliveries represented approximately 0.6% of sales. For fiscal 2014 and fiscal 2013, these costs represented approximately 0.7% of sales.
Our activities to mitigate fuel costs include routing optimization with the goal of reducing miles driven, improving fleet utilization by adjusting idling time and maximum speeds and using fuel surcharges. We routinely enter into forward purchase commitments for a portion of our projected monthly diesel fuel requirements. As of June 27, 2015, we had forward diesel fuel commitments totaling approximately $99.3 million through June 2016. These contracts will lock in the price of approximately 40% to 45% of our fuel purchase needs for the contracted periods at prices slightly lower than the current market price for diesel. Our remaining fuel purchase needs will occur at market rates unless contracted for a fixed price at a later date. Using current, published quarterly market price projections for diesel and estimates of fuel consumption, a 10% unfavorable change in diesel prices from the market price would result in a potential increase of approximately $15 million in our fuel costs on our non-contracted volumes.
Investment Risk
Our company-sponsored qualified pension plan (Retirement Plan) holds investments in public and private equity, fixed income securities and real estate funds. The amount of our annual contribution to the plan is dependent upon, among other things, the return on the plan’s assets and discount rates used to calculate the plan’s liability. Fluctuations in asset values can cause the amount of our anticipated future contributions to the plan to increase and can result in a reduction to shareholders’ equity on our balance sheet as of fiscal year-end, which is when this plan’s funded status is measured. Also, the projected liability of the plan will be impacted by the fluctuations of interest rates on high quality bonds in the public markets. To the extent the financial markets experience declines, our anticipated future contributions and funded status will be affected for future years. A 10% unfavorable change in the value of the investments held by our company-sponsored Retirement Plan at the plan’s fiscal year end (December 31, 2014) would not have a material impact on our anticipated future contributions for fiscal 2016; however, this unfavorable change would increase our pension expense for fiscal 2016 by $31.0 million and would reduce our shareholders’ equity on our balance sheet as of June 27, 2015 by $300.3 million.
47
Item 8. Financial Statements and Supplementary Data
SYSCO CORPORATION AND SUBSIDIARIES
INDEX TO CONSOLIDATED FINANCIAL STATEMENTS
Page | |
Consolidated Financial Statements: | |
All schedules are omitted because they are not applicable or the information is set forth in the consolidated financial statements or notes thereto.
48
REPORT OF MANAGEMENT ON INTERNAL CONTROL OVER FINANCIAL REPORTING
The management of Sysco Corporation (“Sysco”) is responsible for establishing and maintaining adequate internal control over financial reporting for the company. Sysco’s internal control system is designed to provide reasonable assurance regarding the reliability of financial reporting and the preparation and fair presentation of published financial statements. All internal control systems, no matter how well designed, have inherent limitations. Therefore, even those systems determined to be effective can provide only reasonable assurance with respect to financial statement preparation and presentation.
Sysco’s management assessed the effectiveness of Sysco’s internal control over financial reporting as of June 27, 2015. In making this assessment, management used the criteria set forth by the Committee of Sponsoring Organizations of the Treadway Commission in Internal Control — Integrated Framework (2013). Based on this assessment, management concluded that, as of June 27, 2015, Sysco’s internal control over financial reporting was effective based on those criteria.
Ernst & Young LLP has issued an audit report on the effectiveness of Sysco’s internal control over financial reporting as of June 27, 2015.
49
REPORT OF INDEPENDENT REGISTERED PUBLIC ACCOUNTING FIRM
ON INTERNAL CONTROL OVER FINANCIAL REPORTING
The Board of Directors and Shareholders of Sysco Corporation
We have audited Sysco Corporation (a Delaware Corporation) and subsidiaries’ (the “Company”) internal control over financial reporting as of June 27, 2015, based on criteria established in Internal Control-Integrated Framework issued by the Committee of Sponsoring Organizations of the Treadway Commission (2013 framework) (the COSO criteria). Sysco Corporation and subsidiaries' management is responsible for maintaining effective internal control over financial reporting, and for its assessment of the effectiveness of internal control over financial reporting included in the accompanying Report of Management on Internal Control over Financial Reporting. Our responsibility is to express an opinion on the company’s internal control over financial reporting based on our audit.
We conducted our audit in accordance with the standards of the Public Company Accounting Oversight Board (United States). Those standards require that we plan and perform the audit to obtain reasonable assurance about whether effective internal control over financial reporting was maintained in all material respects. Our audit included obtaining an understanding of internal control over financial reporting, assessing the risk that a material weakness exists, testing and evaluating the design and operating effectiveness of internal control based on the assessed risk, and performing such other procedures as we considered necessary in the circumstances. We believe that our audit provides a reasonable basis for our opinion.
A company’s internal control over financial reporting is a process designed to provide reasonable assurance regarding the reliability of financial reporting and the preparation of financial statements for external purposes in accordance with generally accepted accounting principles. A company’s internal control over financial reporting includes those policies and procedures that (1) pertain to the maintenance of records that, in reasonable detail, accurately and fairly reflect the transactions and dispositions of the assets of the company; (2) prove reasonable assurance that transactions are recorded as necessary to permit preparation of financial statements in accordance with generally accepted accounting principles, and that receipts and expenditures of the company are being made only in accordance with authorizations of management and directors of the company; and (3) provide reasonable assurance regarding prevention or timely detection of unauthorized acquisition, use, or disposition of the company’s assets that could have a material effect on the financial statements.
Because of its inherent limitations, internal control over financial reporting may not prevent or detect misstatements. Also, projections of any evaluation of effectiveness to future periods are subject to the risk that controls may become inadequate because of changes in conditions, or that the degree of compliance with the policies or procedures may deteriorate.
In our opinion, Sysco Corporation and subsidiaries maintained, in all material respects, effective internal control over financial reporting as of June 27, 2015, based on the COSO criteria.
We also have audited, in accordance with the standards of the Public Company Accounting Oversight Board (United States), the consolidated balance sheets of the Company as of June 27, 2015 and June 28, 2014, and the related consolidated results of operations, and statements of comprehensive income, changes in shareholders’ equity, and cash flow for each of the three years in the period ended June 27, 2015 of Sysco Corporation and subsidiaries and our report dated August 24, 2015 expressed an unqualified opinion thereon.
/s/ Ernst & Young LLP
Houston, Texas
August 24, 2015
50
REPORT OF INDEPENDENT REGISTERED PUBLIC ACCOUNTING FIRM
ON CONSOLIDATED FINANCIAL STATEMENTS
The Board of Directors and Shareholders of Sysco Corporation
We have audited the accompanying consolidated balance sheets of Sysco Corporation (a Delaware Corporation) and subsidiaries (the "Company") as of June 27, 2015 and June 28, 2014, and the related consolidated results of operations, and statements of comprehensive income, changes in shareholders' equity and cash flows for each of the three years in the period ended June 27, 2015. These financial statements are the responsibility of the Company's management. Our responsibility is to express an opinion on these financial statements based on our audits.
We conducted our audits in accordance with the standards of the Public Company Accounting Oversight Board (United States). Those standards require that we plan and perform the audit to obtain reasonable assurance about whether the financial statements are free of material misstatement. An audit includes examining, on a test basis, evidence supporting the amounts and disclosures in the financial statements. An audit also includes assessing the accounting principles used and significant estimates made by management, as well as evaluating the overall financial statement presentation. We believe that our audits provide a reasonable basis for our opinion.
In our opinion, the financial statements referred to above present fairly, in all material respects, the consolidated financial position of the Company as of June 27, 2015 and June 28, 2014, and the consolidated results of its operations and its cash flows for each of the three years in the period ended June 27, 2015, in conformity with U.S. generally accepted accounting principles.
We also have audited, in accordance with the standards of the Public Company Accounting Oversight Board (United States), the Company's internal control over financial reporting as of June 27, 2015, based on criteria established in Internal Control-Integrated Framework issued by the Committee of Sponsoring Organizations of the Treadway Commission (2013 framework) and our report dated August 24, 2015 expressed an unqualified opinion thereon.
/s/ Ernst & Young LLP
Houston, Texas
August 24, 2015
51
SYSCO
CONSOLIDATED BALANCE SHEETS
June 27, 2015 | June 28, 2014 | ||||||
(In thousands except for share data) | |||||||
ASSETS | |||||||
Current assets | |||||||
Cash and cash equivalents | $ | 5,130,044 | $ | 413,046 | |||
Accounts and notes receivable, less allowances of $41,720 and $49,902 | 3,353,381 | 3,398,713 | |||||
Inventories | 2,691,823 | 2,602,018 | |||||
Deferred income taxes | 135,254 | 141,225 | |||||
Prepaid expenses and other current assets | 93,039 | 83,745 | |||||
Prepaid income taxes | 90,763 | 43,225 | |||||
Total current assets | 11,494,304 | 6,681,972 | |||||
Plant and equipment at cost, less depreciation | 3,982,143 | 3,985,618 | |||||
Other assets | |||||||
Goodwill | 1,959,817 | 1,950,672 | |||||
Intangibles, less amortization | 154,809 | 177,227 | |||||
Restricted cash | 168,274 | 145,412 | |||||
Other assets | 229,934 | 200,212 | |||||
Total other assets | 2,512,834 | 2,473,523 | |||||
Total assets | $ | 17,989,281 | $ | 13,141,113 | |||
LIABILITIES AND SHAREHOLDERS' EQUITY | |||||||
Current liabilities | |||||||
Notes payable | $ | 70,751 | $ | 70,975 | |||
Accounts payable | 2,881,953 | 2,831,028 | |||||
Accrued expenses | 1,467,610 | 1,160,850 | |||||
Current maturities of long-term debt | 4,979,301 | 304,777 | |||||
Total current liabilities | 9,399,615 | 4,367,630 | |||||
Other liabilities | |||||||
Long-term debt | 2,271,825 | 2,357,330 | |||||
Deferred income taxes | 81,591 | 121,580 | |||||
Other long-term liabilities | 934,722 | 1,027,878 | |||||
Total other liabilities | 3,288,138 | 3,506,788 | |||||
Noncontrolling interest | 41,304 | — | |||||
Commitments and contingencies | |||||||
Shareholders' equity | |||||||
Preferred stock, par value $1 per share Authorized 1,500,000 shares, issued none | — | — | |||||
Common stock, par value $1 per share Authorized 2,000,000,000 shares, issued 765,174,900 shares | 765,175 | 765,175 | |||||
Paid-in capital | 1,213,999 | 1,139,218 | |||||
Retained earnings | 8,751,985 | 8,770,751 | |||||
Accumulated other comprehensive loss | (923,197 | ) | (642,663 | ) | |||
Treasury stock, 170,857,231 and 179,050,186 shares, at cost | (4,547,738 | ) | (4,765,786 | ) | |||
Total shareholders' equity | 5,260,224 | 5,266,695 | |||||
Total liabilities and shareholders' equity | $ | 17,989,281 | $ | 13,141,113 | |||
See Notes to Consolidated Financial Statements
52
SYSCO
CONSOLIDATED RESULTS OF OPERATIONS
Year Ended | |||||||||||
June 27, 2015 | June 28, 2014 | June 29, 2013 | |||||||||
(In thousands except for share and per share data) | |||||||||||
Sales | $ | 48,680,752 | $ | 46,516,712 | $ | 44,411,233 | |||||
Cost of sales | 40,129,236 | 38,335,677 | 36,414,626 | ||||||||
Gross profit | 8,551,516 | 8,181,035 | 7,996,607 | ||||||||
Operating expenses | 7,322,154 | 6,593,913 | 6,338,129 | ||||||||
Operating income | 1,229,362 | 1,587,122 | 1,658,478 | ||||||||
Interest expense | 254,807 | 123,741 | 128,495 | ||||||||
Other expense (income), net | (33,592 | ) | (12,243 | ) | (17,472 | ) | |||||
Earnings before income taxes | 1,008,147 | 1,475,624 | 1,547,455 | ||||||||
Income taxes | 321,374 | 544,091 | 555,028 | ||||||||
Net earnings | $ | 686,773 | $ | 931,533 | $ | 992,427 | |||||
Net earnings: | |||||||||||
Basic earnings per share | $ | 1.16 | $ | 1.59 | $ | 1.68 | |||||
Diluted earnings per share | 1.15 | 1.58 | 1.67 | ||||||||
Average shares outstanding | 592,072,308 | 585,988,084 | 589,397,807 | ||||||||
Diluted shares outstanding | 596,849,034 | 590,216,220 | 592,675,110 | ||||||||
Dividends declared per common share | $ | 1.19 | $ | 1.15 | $ | 1.11 | |||||
See Notes to Consolidated Financial Statements
53
SYSCO
CONSOLIDATED STATEMENTS OF COMPREHENSIVE INCOME
Year Ended | |||||||||||
June 27, 2015 | June 28, 2014 | June 29, 2013 | |||||||||
(In thousands) | |||||||||||
Net earnings | $ | 686,773 | $ | 931,533 | $ | 992,427 | |||||
Other comprehensive (loss) income: | |||||||||||
Foreign currency translation adjustment | (232,185 | ) | (3,106 | ) | (33,191 | ) | |||||
Items presented net of tax: | |||||||||||
Amortization of cash flow hedges | 5,116 | 385 | 386 | ||||||||
Change in fair value of cash flow hedges | (34,111 | ) | (82,215 | ) | — | ||||||
Amortization of prior service cost | 6,949 | 6,970 | 11,310 | ||||||||
Amortization of actuarial loss (gain), net | 11,972 | 9,968 | 44,610 | ||||||||
Amortization of transition obligation | — | — | 88 | ||||||||
Prior service cost arising in current year | (563 | ) | 214 | (33,203 | ) | ||||||
Actuarial (loss) gain, net arising in current year | (37,712 | ) | (127,942 | ) | 225,929 | ||||||
Total other comprehensive (loss) income | (280,534 | ) | (195,726 | ) | 215,929 | ||||||
Comprehensive income | $ | 406,239 | $ | 735,807 | $ | 1,208,356 | |||||
See Notes to Consolidated Financial Statements
54
SYSCO
CHANGES IN CONSOLIDATED SHAREHOLDERS’ EQUITY
Accumulated | |||||||||||||||||||||||||||||
Other | |||||||||||||||||||||||||||||
Common Stock | Paid-in | Retained | Comprehensive | Treasury Stock | |||||||||||||||||||||||||
Shares | Amount | Capital | Earnings | Loss | Shares | Amounts | Totals | ||||||||||||||||||||||
(In thousands except for share data) | |||||||||||||||||||||||||||||
Balance as of June 30, 2012 | 765,174,900 | $ | 765,175 | $ | 939,179 | $ | 8,175,230 | $ | (662,866 | ) | 179,228,383 | $ | (4,531,678 | ) | $ | 4,685,040 | |||||||||||||
Net earnings | 992,427 | 992,427 | |||||||||||||||||||||||||||
Foreign currency translation adjustment | (33,191 | ) | (33,191 | ) | |||||||||||||||||||||||||
Amortization of cash flow hedges, net of tax | 386 | 386 | |||||||||||||||||||||||||||
Reclassification of pension and other postretirement benefit plans amounts to net earnings, net of tax | 56,008 | 56,008 | |||||||||||||||||||||||||||
Pension funded status adjustment, net of tax | 192,726 | 192,726 | |||||||||||||||||||||||||||
Dividends declared | (654,871 | ) | (654,871 | ) | |||||||||||||||||||||||||
Treasury stock purchases | 21,897,403 | (729,333 | ) | (729,333 | ) | ||||||||||||||||||||||||
Share-based compensation awards | 120,445 | (22,057,356 | ) | 562,173 | 682,618 | ||||||||||||||||||||||||
Balance as of June 29, 2013 | 765,174,900 | $ | 765,175 | $ | 1,059,624 | $ | 8,512,786 | $ | (446,937 | ) | 179,068,430 | $ | (4,698,838 | ) | $ | 5,191,810 | |||||||||||||
Net earnings | 931,533 | 931,533 | |||||||||||||||||||||||||||
Foreign currency translation adjustment | (3,106 | ) | (3,106 | ) | |||||||||||||||||||||||||
Amortization of cash flow hedges, net of tax | 385 | 385 | |||||||||||||||||||||||||||
Change in fair value of cash flow hedges, net of tax | (82,215 | ) | (82,215 | ) | |||||||||||||||||||||||||
Reclassification of pension and other postretirement benefit plans amounts to net earnings, net of tax | 16,938 | 16,938 | |||||||||||||||||||||||||||
Pension funded status adjustment, net of tax | (127,728 | ) | (127,728 | ) | |||||||||||||||||||||||||
Dividends declared | (673,568 | ) | (673,568 | ) | |||||||||||||||||||||||||
Treasury stock purchases | 9,834,000 | (324,665 | ) | (324,665 | ) | ||||||||||||||||||||||||
Share-based compensation awards | 79,594 | (9,852,244 | ) | 257,717 | 337,311 | ||||||||||||||||||||||||
Balance as of June 28, 2014 | 765,174,900 | $ | 765,175 | $ | 1,139,218 | $ | 8,770,751 | $ | (642,663 | ) | 179,050,186 | $ | (4,765,786 | ) | $ | 5,266,695 | |||||||||||||
Net earnings | 686,773 | 686,773 | |||||||||||||||||||||||||||
Foreign currency translation adjustment | (232,185 | ) | (232,185 | ) | |||||||||||||||||||||||||
Amortization of cash flow hedges, net of tax | 5,116 | 5,116 | |||||||||||||||||||||||||||
Change in fair value of cash flow hedges, net of tax | (34,111 | ) | (34,111 | ) | |||||||||||||||||||||||||
Reclassification of pension and other postretirement benefit plans amounts to net earnings, net of tax | 18,921 | 18,921 | |||||||||||||||||||||||||||
Pension funded status adjustment, net of tax | (38,275 | ) | (38,275 | ) | |||||||||||||||||||||||||
Dividends declared | (705,539 | ) | (705,539 | ) | |||||||||||||||||||||||||
Share-based compensation awards | 74,781 | (8,192,955 | ) | 218,048 | 292,829 | ||||||||||||||||||||||||
Balance as of June 27, 2015 | 765,174,900 | $ | 765,175 | $ | 1,213,999 | $ | 8,751,985 | $ | (923,197 | ) | 170,857,231 | $ | (4,547,738 | ) | $ | 5,260,224 | |||||||||||||
See Notes to Consolidated Financial Statements
55
SYSCO
CONSOLIDATED CASH FLOWS
Year Ended | |||||||||||
June 27, 2015 | June 28, 2014 | June 29, 2013 | |||||||||
(In thousands) | |||||||||||
Cash flows from operating activities: | |||||||||||
Net earnings | $ | 686,773 | $ | 931,533 | $ | 992,427 | |||||
Adjustments to reconcile net earnings to cash provided by operating activities: | |||||||||||
Share-based compensation expense | 73,766 | 74,328 | 70,147 | ||||||||
Depreciation and amortization | 553,021 | 547,776 | 510,061 | ||||||||
Amortization of debt issuance and other debt-related costs | 27,943 | 8,286 | 2,487 | ||||||||
Deferred income taxes | (4,705 | ) | (30,665 | ) | (28,129 | ) | |||||
Provision for losses on receivables | 17,996 | 34,429 | 35,243 | ||||||||
Other non-cash items | (24,205 | ) | 2,875 | 2,485 | |||||||
Additional investment in certain assets and liabilities, net of effect of businesses acquired: | |||||||||||
(Increase) in receivables | (11,741 | ) | (236,320 | ) | (193,755 | ) | |||||
(Increase) in inventories | (125,232 | ) | (195,845 | ) | (180,277 | ) | |||||
(Increase) decrease in prepaid expenses and other current assets | (10,508 | ) | (24,787 | ) | 21,704 | ||||||
Increase in accounts payable | 72,516 | 392,720 | 204,861 | ||||||||
Increase in accrued expenses | 464,403 | 55,838 | 67,015 | ||||||||
(Decrease) in accrued income taxes | (32,843 | ) | (18,672 | ) | (38,017 | ) | |||||
(Increase) decrease in other assets | (10,745 | ) | 23,552 | 182 | |||||||
(Decrease) increase in other long-term liabilities | (105,501 | ) | (63,753 | ) | 49,716 | ||||||
Excess tax benefits from share-based compensation arrangements | (15,454 | ) | (8,480 | ) | (4,556 | ) | |||||
Net cash provided by operating activities | 1,555,484 | 1,492,815 | 1,511,594 | ||||||||
Cash flows from investing activities: | |||||||||||
Additions to plant and equipment | (542,830 | ) | (523,206 | ) | (511,862 | ) | |||||
Proceeds from sales of plant and equipment | 24,472 | 25,790 | 15,527 | ||||||||
Acquisition of businesses, net of cash acquired | (115,862 | ) | (79,338 | ) | (397,447 | ) | |||||
(Increase) in restricted cash | (20,126 | ) | (84 | ) | (18,100 | ) | |||||
Net cash used for investing activities | (654,346 | ) | (576,838 | ) | (911,882 | ) | |||||
Cash flows from financing activities: | |||||||||||
Bank and commercial paper borrowings (repayments), net | (129,999 | ) | 34,499 | 95,500 | |||||||
Other debt borrowings | 5,041,032 | 36,830 | 61,467 | ||||||||
Other debt repayments | (354,007 | ) | (229,507 | ) | (294,514 | ) | |||||
Debt issuance costs | (30,980 | ) | (22,175 | ) | — | ||||||
Cash paid for settlement of cash flow hedges | (188,840 | ) | — | — | |||||||
Proceeds from stock option exercises | 240,176 | 255,613 | 628,652 | ||||||||
Treasury stock purchases | — | (332,381 | ) | (721,616 | ) | ||||||
Dividends paid | (695,274 | ) | (667,217 | ) | (648,253 | ) | |||||
Excess tax benefits from share-based compensation arrangements | 15,454 | 8,480 | 4,556 | ||||||||
Net cash provided by (used for) financing activities | 3,897,562 | (915,858 | ) | (874,208 | ) | ||||||
Effect of exchange rates on cash | (81,702 | ) | 642 | (2,086 | ) | ||||||
Net increase (decrease) in cash and cash equivalents | 4,716,998 | 761 | (276,582 | ) | |||||||
Cash and cash equivalents at beginning of period | 413,046 | 412,285 | 688,867 | ||||||||
Cash and cash equivalents at end of period | $ | 5,130,044 | $ | 413,046 | $ | 412,285 | |||||
Supplemental disclosures of cash flow information: | |||||||||||
Cash paid during the period for: | |||||||||||
Interest | $ | 192,939 | $ | 128,861 | $ | 131,665 | |||||
Income taxes | 376,508 | 591,334 | 620,132 | ||||||||
See Notes to Consolidated Financial Statements
56
NOTES TO CONSOLIDATED FINANCIAL STATEMENTS
1. SUMMARY OF ACCOUNTING POLICIES
Business and Consolidation
Sysco Corporation, acting through its subsidiaries and divisions (Sysco or the company), is engaged in the marketing and distribution of a wide range of food and related products primarily to the foodservice or food-away-from-home industry. These services are performed for approximately 425,000 customers from 197 distribution facilities located throughout the United States (U.S.), Bahamas, Canada and Ireland.
Sysco’s fiscal year ends on the Saturday nearest to June 30th. This resulted in a 52-week year ending June 27, 2015 for fiscal 2015, June 28, 2014 for fiscal 2014 and June 29, 2013 for fiscal 2013.
The accompanying financial statements include the accounts of Sysco and its consolidated subsidiaries. All significant intercompany transactions and account balances have been eliminated.
The preparation of financial statements in conformity with generally accepted accounting principles requires management to make estimates that affect the reported amounts of assets, liabilities, sales and expenses. Actual results could differ from the estimates used.
Cash and Cash Equivalents
Cash includes cash equivalents such as time deposits, certificates of deposit, short-term investments and all highly liquid instruments with original maturities of three months or less, which are recorded at fair value.
Accounts Receivable
Accounts receivable consist primarily of trade receivables from customers and receivables from suppliers for marketing or incentive programs. Sysco determines the past due status of trade receivables based on contractual terms with each customer. Sysco evaluates the collectability of accounts receivable and determines the appropriate reserve for doubtful accounts based on a combination of factors. The company utilizes specific criteria to determine uncollectible receivables to be written off including whether a customer has filed for or been placed in bankruptcy, has had accounts referred to outside parties for collection or has had accounts past due over specified periods. In these instances, a specific allowance for doubtful accounts is recorded to reduce the receivable to the net amount reasonably expected to be collected. Allowances are recorded for all other receivables based on an analysis of historical trends of write-offs and recoveries.
Inventories
Inventories consisting primarily of finished goods include food and related products and lodging products held for resale and are valued at the lower of cost (first-in, first-out method) or market. Elements of costs include the purchase price of the product and freight charges to deliver the product to the company’s warehouses and are net of certain cash or non-cash consideration received from vendors (see “Vendor Consideration”).
Plant and Equipment
Capital additions, improvements and major replacements are classified as plant and equipment and are carried at cost. Depreciation is recorded using the straight-line method, which reduces the book value of each asset in equal amounts over its estimated useful life, and is included within operating expenses in the consolidated results of operations. Maintenance, repairs and minor replacements are charged to earnings when they are incurred. Upon the disposition of an asset, its accumulated depreciation is deducted from the original cost, and any gain or loss is reflected in current earnings.
Certain internal and external costs related to the acquisition and development of internal use software are capitalized within plant and equipment during the application development stages of the project.
Applicable interest charges incurred during the construction of new facilities and development of software for internal use are capitalized as one of the elements of cost and are amortized over the assets’ estimated useful lives. Interest capitalized for the past three fiscal years was $0.9 million in fiscal 2015, $1.1 million in fiscal 2014 and $4.2 million in fiscal 2013.
57
Long-Lived Assets
Management reviews long-lived assets for indicators of impairment whenever events or changes in circumstances indicate that the carrying value may not be recoverable. Cash flows expected to be generated by the related assets are estimated over the asset’s useful life based on updated projections on an undiscounted basis. If the evaluation indicates that the carrying value of the asset may not be recoverable, the potential impairment is measured using fair value.
Goodwill and Intangibles
Goodwill and intangibles represent the excess of cost over the fair value of tangible net assets acquired. Goodwill and intangibles with indefinite lives are not amortized. Goodwill is assigned to the reporting units that are expected to benefit from the synergies of a business combination. The recoverability of goodwill and indefinite-lived intangibles is assessed annually, or more frequently as needed when events or changes have occurred that would suggest an impairment of carrying value, by determining whether the fair values of the applicable reporting units exceed their carrying values. The reporting units used to assess goodwill impairment are the company’s 13 operating segments as described in Note 21, “Business Segment Information.” The components within each of the 13 operating segments have similar economic characteristics and therefore are aggregated into 13 reporting units. The evaluation of fair value requires the use of projections, estimates and assumptions as to the future performance of the operations in performing a discounted cash flow analysis, as well as assumptions regarding sales and earnings multiples that would be applied in comparable acquisitions.
Intangibles with definite lives are amortized over their useful lives in a manner consistent with underlying cash flow, which generally ranges from two to ten years. Management reviews finite-lived intangibles for indicators of impairment whenever events or changes in circumstances indicate that the carrying value may not be recoverable. Cash flows expected to be generated by the finite-lived intangibles are estimated over the intangible asset’s useful life based on updated projections on an undiscounted basis. If the evaluation indicates that the carrying value of the finite-lived intangible asset may not be recoverable, the potential impairment is measured at fair value.
Restricted Cash
Sysco is required by its insurers to collateralize a part of the self-insured portion of its workers’ compensation and liability claims. Sysco has chosen to satisfy these collateral requirements by depositing funds in insurance trusts or by issuing letters of credit. All amounts in restricted cash at June 27, 2015 and June 28, 2014 represented funds deposited in insurance trusts.
Derivative Financial Instruments
All derivatives are recognized as assets or liabilities within the consolidated balance sheets at fair value at their gross values. Gains or losses on derivative financial instruments designated as fair value hedges are recognized immediately in the consolidated results of operations, along with the offsetting gain or loss related to the underlying hedged item.
Gains or losses on derivative financial instruments designated as cash flow hedges are recorded as a separate component of shareholders’ equity from inception of the hedges to their settlement, at which time gains or losses are reclassified to the Consolidated Results of Operations in conjunction with the recognition of the underlying hedged item.
In the normal course of business, Sysco enters into forward purchase agreements for the procurement of fuel and electricity. Certain of these agreements meet the definition of a derivative. However, the company elected to use the normal purchase and sale exemption available under derivatives accounting literature; therefore, these agreements are not recorded at fair value.
Investments in Corporate-Owned Life Insurance
Investments in corporate-owned life insurance (COLI) policies are recorded at their cash surrender values as of each balance sheet date. Changes in the cash surrender value during the period are recorded as a gain or loss within operating expenses. The company does not record deferred tax balances related to cash surrender value gains or losses for the policies that Sysco has the ability and intent to hold to maturity. Deferred tax balances are recorded for those policies that Sysco intends to redeem prior to maturity. The total amounts related to the company’s investments in COLI policies included in other assets in the consolidated balance sheets were $162.8 million and $161.9 million at June 27, 2015 and June 28, 2014, respectively.
58
Treasury Stock
The company records treasury stock purchases at cost. Shares removed from treasury are valued at cost using the average cost method.
Foreign Currency Translation
The assets and liabilities of all foreign subsidiaries are translated at current exchange rates. Related translation adjustments are recorded as a component of accumulated other comprehensive income (loss).
Revenue Recognition
The company recognizes revenue from the sale of a product when it is considered to be realized or realizable and earned. The company determines these requirements to be met at the point at which the product is delivered to the customer. The company grants certain customers sales incentives such as rebates or discounts and treats these as a reduction of sales at the time the sale is recognized. Sales tax collected from customers is not included in revenue but rather recorded as a liability due to the respective taxing authorities. Purchases and sales of inventory with the same counterparty that are entered into in contemplation of one another are considered to be a single nonmonetary transaction. As such, the company records the net effect of such transactions in the consolidated results of operations within sales.
Vendor Consideration
Sysco recognizes consideration received from vendors when the services performed in connection with the monies received are completed and when the related product has been sold by Sysco as a reduction to cost of sales. There are several types of cash consideration received from vendors. In many instances, the vendor consideration is in the form of a specified amount per case or per pound. In these instances, Sysco will recognize the vendor consideration as a reduction of cost of sales when the product is sold. In the situations in which the vendor consideration is not related directly to specific product purchases, Sysco will recognize these as a reduction of cost of sales when the earnings process is complete, the related service is performed and the amounts are realized.
Shipping and Handling Costs
Shipping and handling costs include costs associated with the selection of products and delivery to customers. Included in operating expenses are shipping and handling costs of approximately $2.6 billion in fiscal 2015, $2.6 billion in fiscal 2014 and $2.5 billion in fiscal 2013.
Insurance Program
Sysco maintains a self-insurance program covering portions of workers’ compensation, general and vehicle liability and property insurance costs. The amounts in excess of the self-insured levels are fully insured by third party insurers. The company also maintains a fully self-insured group medical program. Liabilities associated with these risks are estimated in part by considering historical claims experience, medical cost trends, demographic factors, severity factors and other actuarial assumptions.
Share-Based Compensation
Sysco recognizes expense for its share-based compensation based on the fair value of the awards that are granted. The fair value of stock options is estimated at the date of grant using the Black-Scholes option pricing model. Option pricing methods require the input of highly subjective assumptions, including the expected stock price volatility. The fair value of restricted stock and restricted stock unit awards are based on the company’s stock price on the date of grant. Measured compensation cost is recognized ratably over the vesting period of the related share-based compensation award. Cash flows resulting from tax deductions in excess of the compensation cost recognized for those options (excess tax benefits) are classified as financing cash flows on the consolidated cash flows statements.
Income Taxes
Sysco recognizes deferred tax assets and liabilities based on the estimated future tax consequences attributable to differences between the financial statement carrying amounts of existing assets and liabilities and their respective tax bases. Deferred tax assets and liabilities are measured pursuant to tax laws using rates expected to apply to taxable income in the years in which those temporary differences are expected to be recovered or settled. The impact on deferred tax assets and liabilities
59
of a change in tax rate is recognized in income in the period that includes the enactment date. Valuation allowances are established when necessary to reduce deferred tax assets to the amount more likely than not to be realized.
Sysco recognizes a tax benefit from an uncertain tax position when it is more likely than not that the position will be sustained upon examination, including resolutions of any related appeals or litigation processes, based on the technical merits of the position. The amount recognized is measured as the largest amount of tax benefit that has greater than a 50% likelihood of being realized upon settlement. To the extent interest and penalties may be assessed by taxing authorities on any underpayment of income tax, estimated amounts required by the accounting guidance related to uncertain tax positions have been accrued and are classified as a component of income taxes in the consolidated results of operations.
The determination of the company’s provision for income taxes requires significant judgment, the use of estimates and the interpretation and application of complex tax laws. The company’s provision for income taxes primarily reflects a combination of income earned and taxed in the various U.S. federal and state, as well as various foreign jurisdictions. Jurisdictional tax law changes, increases or decreases in permanent differences between book and tax items, accruals or adjustments of accruals for tax contingencies or valuation allowances, and the company’s change in the mix of earnings from these taxing jurisdictions all affect the overall effective tax rate.
Acquisitions
Acquisitions of businesses are accounted for using the acquisition method of accounting, and the financial statements include the results of the acquired operations from the respective dates of acquisition.
The purchase price of the acquired entities is allocated to the net assets acquired and liabilities assumed based on the estimated fair value at the dates of acquisition, with any excess of cost over the fair value of net assets acquired, including intangibles, recognized as goodwill. The balances included in the consolidated balance sheets related to recent acquisitions are based upon preliminary information and are subject to change when final asset and liability valuations are obtained. Subsequent changes to the preliminary balances are reflected retrospectively, if material. Material changes to the preliminary allocations are not anticipated by management.
Noncontrolling interest
In fiscal 2015, Sysco acquired a 50% interest in a foodservice company in Costa Rica. It was determined that consolidation of the entity was appropriate and, therefore, the financial position, results of operations and cash flows for this company have been included in Sysco’s financial statements. The value of the 50% noncontrolling interest is considered redeemable due to certain features of the investment agreement and has been presented as mezzanine equity, which is outside of permanent equity, in the consolidated balance sheets. The income attributable to the noncontrolling interest is located within other expense (income), net in the consolidated results of operations, as this amount is not material. The non-cash add back for the change in the value of the noncontrolling interest is located within Other non-cash items on the consolidated cash flows.
2. CHANGES IN ACCOUNTING
Presentation of an Unrecognized Tax Benefit When a Net Operating Loss Carryforward, a Similar Tax Loss, or a Tax Credit Carryforward Exists
In July 2013, the Financial Accounting Standards Board (FASB) issued Accounting Standards Update (ASU) 2013-11, “Presentation of an Unrecognized Tax Benefit When a Net Operating Loss Carryforward, a Similar Tax Loss, or a Tax Credit Carryforward Exists.” This update amends ASC 740, “Income Taxes,” to require that in certain cases, an unrecognized tax benefit, or portion of an unrecognized tax benefit, should be presented in the financial statements as a reduction to a deferred tax asset for a net operating loss carryforward, a similar tax loss, or a tax credit carryforward when such items exist in the same taxing jurisdiction. The amendments in this update are effective for fiscal years, and interim periods within those years, beginning after December 15, 2013, which was fiscal 2015 for Sysco. The company’s adoption of this guidance did not have a material impact on the company’s balance sheets, results of operations or cash flows.
Simplifying the Presentation of Debt Issuance Costs
In April 2015, the FASB issued ASU 2015-03, Interest - Imputation of Interest (Subtopic 835-30): Simplifying the Presentation of Debt Issuance Costs. The update requires debt issuance costs related to a recognized debt liability be presented in the balance sheet as a direct deduction from the carrying amount of the related debt liability, instead of being presented as an
60
asset. Debt disclosures will include the face amount of the debt liability and the effective interest rate. The update requires retrospective application and represents a change in accounting principle. We adopted this standard for the fiscal year ended June 27, 2015. Although the new guidance had no impact on the company’s results of operations, the debt issuance costs presented as assets within the company’s consolidated balance sheet as of June 28, 2014, of $26.8 million has been reclassified as reductions of the related debt liability as a result of early adoption.
Practical Expedient for the Measurement Date of an Employer's Defined Benefit Obligation and Plan Assets
In April 2015, the FASB issued ASU 2015-04, "Compensation-Retirement Benefits (Topic 715), Practical Expedient for the Measurement Date of an Employer’s Defined Benefit Obligation and Plan Assets." The amendments in this ASU provide a practical expedient for employers with fiscal year-ends that do not fall on a month-end by permitting those employers to measure defined benefit plan assets and obligations as of the month-end that is closest to the entity's fiscal year-end. Sysco early adopted this standard in fiscal 2015 using a June 30th measurement date as a practical expedient. The adoption did not have a material impact on the financial position of Sysco.
3. NEW ACCOUNTING STANDARDS
Reporting Discontinued Operations and Disclosures of Disposals of Components of an Entity
In April 2014, the FASB issued ASU 2014-08, “Reporting Discontinued Operations and Disclosures of Disposals of Components of an Entity.” This update amends ASC 205, “Presentation of Financial Statements,” and ASC 360, “Property, Plant, and Equipment,” primarily to change the criteria for when a disposal is required to be reported as a discontinued operation. A disposal of a component of an entity or a group of components of an entity is required to be reported in discontinued operations if the disposal represents a strategic shift that has or will have a major effect on the entity’s operations or financial results. The amendments in this update specify presentation and disclosure requirements for discontinued operations as well as disclosure requirements for other disposals that do not qualify as discontinued operations. The amendments in this update are effective for all disposals or classifications as held for sale, including upon acquisition, of a component of an entity that occur within annual periods beginning on or after December 15, 2014 and interim periods within those years, which is fiscal 2016 for Sysco. Early adoption is permitted. Sysco will implement on any related transactions, prospectively.
Revenue from Contracts with Customers
In May 2014, the FASB issued ASU 2014-09, “Revenue from Contracts with Customers.” This update creates ASC 606, “Revenue from Contracts with Customers,” and supersedes the revenue recognition requirements in ASC 605, “Revenue Recognition.” Additionally, other sections of the ASC were amended to be consistent with the guidance in this update. The core principle of ASC 606 is that an entity should recognize revenue to depict the transfer of promised goods or services to customers in an amount that reflects the consideration to which the entity expects to be entitled in exchange for those goods and services. A five-step revenue recognition model is to be applied to achieve this core principle. ASC 606 also specifies comprehensive disclosures to help users of financial statements understand the nature, amount, timing and uncertainty of revenue that is recognized. The amendments in this update are effective for annual periods beginning after December 15, 2017, including interim periods within that reporting period, which is fiscal 2019 for Sysco. Early adoption is not permitted. Sysco is currently evaluating the impact this update will have on its financial statements.
Disclosure of Uncertainties About an Entity’s Ability to Continue as a Going Concern
In August 2014, the FASB issued ASU No. 2014-15, "Disclosure of Uncertainties About an Entity’s Ability to Continue as a Going Concern." This ASU provides guidance on determining when and how to disclose going-concern uncertainties in the financial statements. The new standard requires management to perform interim and annual assessments of an entity’s ability to continue as a going concern within one year of the date the financial statements are issued. An entity must provide certain disclosures if conditions or events raise substantial doubt about the entity’s ability to continue as a going concern. This guidance is effective for fiscal years—and interim periods within those fiscal years—beginning after December 15, 2016, with early adoption permitted. The Company is currently reviewing the provisions of the new standard and whether it will early adopt.
4. ACQUISITIONS
During fiscal 2015, in the aggregate, the company paid cash of $115.9 million, net of cash acquired, for acquisitions made during fiscal 2015 and for contingent consideration related to acquisitions made in previous fiscal years. During fiscal 2015, Sysco
61
acquired for cash a broadline company in Ontario, Canada; a joint venture interest in a foodservice distribution company in Mexico; a joint venture interest in a foodservice distribution company in Costa Rica and a specialty seafood company in New Jersey. The fiscal 2015 acquisitions were immaterial, individually and in the aggregate, to the consolidated financial statements.
Certain acquisitions involve contingent consideration that may include earnout agreements that are typically payable over periods of up to three years only in the event that certain operating results are attained. As of June 27, 2015, aggregate contingent consideration amounts outstanding relating to completed acquisitions were $39.0 million, of which $29.4 million was recorded as earnout liabilities as of June 27, 2015.
In the second quarter of fiscal 2014, the company announced an agreement to merge with US Foods, Inc. (US Foods). In February 2015, following completion of its regulatory review of the proposed merger, the US Federal Trade Commission (FTC) filed a motion with the U.S. District Court for the District of Columbia (the Court) seeking a preliminary injunction to prevent the parties from closing the merger, which the Court granted on June 23, 2015. On June 26, 2015, the parties terminated the merger agreement, as a result of which Sysco was obligated to pay $300 million to the owners of US Foods. During the review period with the FTC, Sysco created a divestiture package, comprised of the sale of 11 US Foods facilities to Performance Food Group (PFG), which was contingent on the closing of the merger. This divestiture agreement entitled PFG to receive a $25 million termination fee if the sale of the divestiture package was terminated before July 6, 2015, with each of Sysco and US Foods responsible for one half of the applicable fee. Sysco accrued for termination payments totaling $312.5 million in fiscal 2015 and paid these amounts in fiscal 2016.
At the time of the merger announcement, Sysco secured a fully committed bridge financing that could be used for funding a portion of the purchase price. In contemplation of issuing long-term financing for this proposed merger, in January 2014, the company entered into two forward starting swap agreements with notional amounts totaling $2 billion to reduce interest rate exposure on 10-year and 30-year debt that was anticipated to be issued. In October 2014, Sysco obtained long-term financing for this proposed merger by completing a six-part senior notes offering totaling $5 billion. At the same time, (i) the bridge financing was terminated and (ii) the forward starting interest rate swaps were terminated and cash settlement of these swaps was made. Concurrent with the issuance of the new senior notes, Sysco entered into new interest rate swap agreements that effectively converted two series of the senior notes totaling $1.25 billion to floating rate debt. These swaps were designated as fair value hedges. These senior notes contained mandatory redemption features providing that, on the earlier of the merger agreement termination date or October 8, 2015, the company was required to redeem all of the senior notes at a redemption price equal to 101% of the principal of the senior notes plus accrued interest. These notes were redeemed in July 2015. Detailed discussion of these transactions is located in Note 9, "Derivative Financial Instruments", and Note 11, "Debt and Other Financing Arrangements."
5. FAIR VALUE MEASUREMENTS
Fair value is defined as the price that would be received to sell an asset or paid to transfer a liability in an orderly transaction between market participants at the measurement date (i.e., an exit price). The accounting guidance includes a fair value hierarchy that prioritizes the inputs to valuation techniques used to measure fair value. The three levels of the fair value hierarchy are as follows:
• | Level 1 – Unadjusted quoted prices for identical assets or liabilities in active markets; |
• | Level 2 – Inputs other than quoted prices in active markets for identical assets and liabilities that are observable either directly or indirectly for substantially the full term of the asset or liability; and |
• | Level 3 – Unobservable inputs for the asset or liability, which include management’s own assumption about the assumptions market participants would use in pricing the asset or liability, including assumptions about risk. |
Sysco’s policy is to invest in only high-quality investments. Cash equivalents primarily include time deposits, certificates of deposit, commercial paper, high-quality money market funds and all highly liquid instruments with original maturities of three months or less. Restricted cash consists of investments in high-quality money market funds.
The following is a description of the valuation methodologies used for assets and liabilities measured at fair value.
• | Time deposits and commercial paper included in cash equivalents are valued at amortized cost, which approximates fair value due to the short-term maturities of these instruments. These are included within cash equivalents as a Level 2 measurement in the tables below. |
• | Money market funds are valued at the closing price reported by the fund sponsor from an actively traded exchange. These are included within cash equivalents and restricted cash as Level 1 measurements in the tables below. |
62
• | The interest rate swap agreements, discussed further in Note 9, “Derivative Financial Instruments,” are valued using a swap valuation model that utilizes an income approach using observable market inputs including interest rates, LIBOR swap rates and credit default swap rates. These are included within other assets and accrued expenses as Level 2 measurements in the tables below. |
The following tables present the company’s assets and liabilities measured at fair value on a recurring basis as of June 27, 2015 and June 28, 2014:
Assets and Liabilities Measured at Fair Value as of June 27, 2015 | |||||||||||||||
Level 1 | Level 2 | Level 3 | Total | ||||||||||||
(In thousands) | |||||||||||||||
Assets: | |||||||||||||||
Cash and cash equivalents | |||||||||||||||
Cash equivalents | $ | 4,677,735 | $ | 63,689 | $ | — | $ | 4,741,424 | |||||||
Restricted cash | 168,274 | — | — | 168,274 | |||||||||||
Other assets | |||||||||||||||
Interest rate swap agreements | — | 12,597 | — | 12,597 | |||||||||||
Total assets at fair value | $ | 4,846,009 | $ | 76,286 | $ | — | $ | 4,922,295 | |||||||
Liabilities: | |||||||||||||||
Current portion of long-term debt | $ | — | $ | 1,257,127 | $ | — | $ | 1,257,127 | |||||||
Long-term debt | — | $ | 503,379 | $ | — | $ | 503,379 | ||||||||
Total liabilities at fair value | $ | — | $ | 1,760,506 | $ | — | $ | 1,760,506 | |||||||
Assets and Liabilities Measured at Fair Value as of June 28, 2014 | |||||||||||||||
Level 1 | Level 2 | Level 3 | Total | ||||||||||||
(In thousands) | |||||||||||||||
Assets: | |||||||||||||||
Cash and cash equivalents | |||||||||||||||
Cash equivalents | $ | 2,770 | $ | 131,966 | $ | — | $ | 134,736 | |||||||
Restricted cash | 145,412 | — | — | 145,412 | |||||||||||
Other assets | |||||||||||||||
Interest rate swap agreement | — | 4,828 | — | 4,828 | |||||||||||
Total assets at fair value | $ | 148,182 | $ | 136,794 | $ | — | $ | 284,976 | |||||||
Liabilities: | |||||||||||||||
Accrued expenses | |||||||||||||||
Interest rate swap agreements | $ | — | $ | 133,466 | $ | — | $ | 133,466 | |||||||
Total liabilities at fair value | $ | — | $ | 133,466 | $ | — | $ | 133,466 | |||||||
The carrying values of accounts receivable and accounts payable approximated their respective fair values due to the short-term maturities of these instruments. The fair value of Sysco’s total debt is estimated based on the quoted market prices for the same or similar issue or on the current rates offered to the company for debt of the same remaining maturities and is considered a Level 2 measurement. The fair value of total debt approximated $7.6 billion and $3.0 billion as of June 27, 2015 and June 28, 2014, respectively. The carrying value of total debt was $7.3 billion and $2.7 billion as of June 27, 2015 and June 28, 2014, respectively.
63
6. ALLOWANCE FOR DOUBTFUL ACCOUNTS
A summary of the activity in the allowance for doubtful accounts appears below:
2015 | 2014 | 2013 | |||||||||
(In thousands) | |||||||||||
Balance at beginning of period | $ | 49,902 | $ | 47,345 | $ | 42,919 | |||||
Charged to costs and expenses | 17,996 | 34,429 | 35,243 | ||||||||
Customer accounts written off, net of recoveries | (25,719 | ) | (31,721 | ) | (30,824 | ) | |||||
Other adjustments | (459 | ) | (151 | ) | 7 | ||||||
Balance at end of period | $ | 41,720 | $ | 49,902 | $ | 47,345 | |||||
7. PLANT AND EQUIPMENT
A summary of plant and equipment, including the related accumulated depreciation, appears below:
June 27, 2015 | June 28, 2014 | Estimated Useful Lives | |||||||
(In thousands) | |||||||||
Plant and equipment at cost: | |||||||||
Land | $ | 441,939 | $ | 431,694 | |||||
Buildings and improvements | 3,877,817 | 3,816,387 | 10-30 years | ||||||
Fleet and equipment | 2,836,554 | 2,726,415 | 3-10 years | ||||||
Computer hardware and software | 1,234,138 | 1,109,379 | 3-7 years | ||||||
Total plant and equipment at cost | 8,390,448 | 8,083,875 | |||||||
Accumulated depreciation | (4,408,305 | ) | (4,098,257 | ) | |||||
Total plant and equipment, net | $ | 3,982,143 | $ | 3,985,618 | |||||
The capitalized direct costs for the internal use software portion of the company’s Enterprise Resource Planning system are included within “computer hardware and software” in the table above in the amount of $293.8 million and $355.2 million, net of accumulated amortization, as of June 27, 2015 and June 28, 2014, respectively. The majority of this internal use software was placed into service and began amortization in August of fiscal 2013.
Depreciation expense, including amortization of capital leases, for the past three years was $495.8 million in 2015, $493.8 million in 2014 and $473.5 million in 2013.
8. GOODWILL AND OTHER INTANGIBLES
The changes in the carrying amount of goodwill and the amount allocated by reportable segment for the years presented are as follows:
Broadline | SYGMA | Other | Total | ||||||||||||
(In thousands) | |||||||||||||||
Carrying amount as of June 29, 2013 | $ | 1,123,419 | $ | 32,609 | $ | 728,207 | $ | 1,884,235 | |||||||
Goodwill acquired during year | 48,425 | — | 14,408 | 62,833 | |||||||||||
Currency translation/other | 3,649 | — | (45 | ) | 3,604 | ||||||||||
Carrying amount as of June 28, 2014 | 1,175,493 | 32,609 | 742,570 | 1,950,672 | |||||||||||
Goodwill acquired during year | 79,802 | — | 8,408 | 88,210 | |||||||||||
Currency translation/other | (78,524 | ) | — | (541 | ) | (79,065 | ) | ||||||||
Carrying amount as of June 27, 2015 | $ | 1,176,771 | $ | 32,609 | $ | 750,437 | $ | 1,959,817 | |||||||
Amortizable intangible assets acquired during fiscal 2015 were $27.7 million with a weighted-average amortization period of 7.9 years. By intangible asset category, the amortizable intangible assets acquired during fiscal 2015 were customer relationships of $19.5 million with a weighted-average amortization period of 9.4 years, non-compete agreements of $4.3 million
64
with a weighted-average amortization period of 4.6 years and other intangibles of $3.9 million with a weighted-average amortization period of 4.0 years.
The following table presents details of the company’s amortizable intangible assets:
June 27, 2015 | June 28, 2014 | ||||||||||||||||||||||
Gross Carrying Amount | Accumulated Amortization | Net | Gross Carrying Amount | Accumulated Amortization | Net | ||||||||||||||||||
(In thousands) | |||||||||||||||||||||||
Customer relationships | $ | 236,916 | $ | (130,506 | ) | $ | 106,410 | $ | 246,019 | $ | (124,223 | ) | $ | 121,796 | |||||||||
Non-compete agreements | 33,436 | (14,525 | ) | 18,911 | 33,164 | (10,629 | ) | 22,535 | |||||||||||||||
Trademarks | 10,768 | (4,117 | ) | 6,651 | 12,063 | (3,200 | ) | 8,863 | |||||||||||||||
Other | 13,437 | (4,871 | ) | 8,566 | 13,498 | (2,070 | ) | 11,428 | |||||||||||||||
Total amortizable intangible assets | $ | 294,557 | $ | (154,019 | ) | $ | 140,538 | $ | 304,744 | $ | (140,122 | ) | $ | 164,622 | |||||||||
Intangible assets that have been fully amortized have been removed in the schedule above in the period full amortization is reached.
The following table presents details of the company’s indefinite-lived intangible assets:
June 27, 2015 | June 28, 2014 | ||||||
(In thousands) | |||||||
Trademarks | $ | 13,304 | $ | 11,639 | |||
Licenses | 966 | 966 | |||||
Total indefinite-lived intangible assets | $ | 14,271 | $ | 12,605 | |||
Amortization expense for the past three years was $40.0 million in 2015, $42.2 million in 2014 and $32.1 million in 2013. The estimated future amortization expense for the next five fiscal years on intangible assets outstanding as of June 27, 2015 is shown below:
Amount | |||
(In thousands) | |||
2016 | $ | 33,570 | |
2017 | 29,264 | ||
2018 | 26,162 | ||
2019 | 16,245 | ||
2020 | 12,215 | ||
9. DERIVATIVE FINANCIAL INSTRUMENTS
Sysco manages its debt portfolio to achieve an overall desired position of fixed and floating rates and may employ interest rate swaps from time to time to achieve this position. The company does not use derivative financial instruments for trading or speculative purposes.
In fiscal 2014, the company entered into an interest rate swap agreement that effectively converted $500 million of fixed rate debt maturing in fiscal 2018 to floating rate debt. In October 2014, Sysco obtained long-term financing for the proposed US Foods merger by completing a six-part senior notes offering totaling $5 billion. At the same time of these note issuances, the company entered into interest rate swap agreements that effectively converted $500 million of senior notes maturing in fiscal 2018 and $750 million of senior notes maturing in fiscal 2020 to floating rate debt. These are collectively referred to as the 2015 swaps. See Note 11, "Debt and Other Financing Arrangements," for further discussion of the senior notes issuance. These transactions were designated as fair value hedges against the changes in fair value of fixed rate debt resulting from changes in interest rates. Subsequent to fiscal 2015, we terminated our 2015 swaps in connection with the redemption of the senior notes.
In January 2014, the company entered into two forward starting swap agreements with notional amounts totaling $2.0 billion in contemplation of securing long-term financing for the proposed US Foods merger or for other long-term financing purposes in the event the merger did not occur. The company designated these derivatives as cash flow hedges to reduce interest
65
rate exposure on forecasted 10-year and 30-year debt due to changes in the benchmark interest rates for debt the company issued in fiscal 2015. In September 2014, in conjunction with the pricing of the $1.25 billion senior notes maturing in fiscal 2025 and the $1 billion senior notes maturing in fiscal 2045, the company terminated these swaps, locking in the effective yields on the related debt. Cash of $58.9 million was paid to settle the 10-year swap in September 2014, and cash of $129.9 million was paid to settle the 30-year swap in October 2014. The cash payments are located within the line Cash paid for settlement of cash flow hedge within financing activities in the statement of consolidated cash flows. The cumulative losses recorded in Accumulated other comprehensive (loss) income related to these swaps will continue to be amortized through interest expense over the term of the originally issued debt as the amount hedged is anticipated to remain within our capital structure.
In August 2015, the company entered into two forward starting swap agreements with notional amounts totaling $500 million. The company designated these derivatives as cash flow hedges to reduce interest rate exposure on forecasted 10-year debt due to changes in the benchmark interest rates for debt the company expects to issue in fiscal 2016.
The location and the fair value of derivative instruments designated as hedges in the consolidated balance sheet as of each fiscal year-end are as follows:
Asset Derivatives | Liability Derivatives | ||||||||||
Balance Sheet Location | Fair Value | Balance Sheet Location | Fair Value | ||||||||
(In thousands) | |||||||||||
Interest rate swap agreements: | |||||||||||
June 27, 2015 | Other assets | $ | 12,597 | Accrued expenses | $ | — | |||||
June 28, 2014 | Other assets | 4,828 | Accrued expenses | 133,466 | |||||||
The location and effect of derivative instruments and related hedged items on the consolidated comprehensive income for each fiscal year presented on a pretax basis are as follows:
Amount of (Gain) or Loss | |||||||||||||
Recognized in Comprehensive Income | |||||||||||||
Location of (Gain) or Loss Recognized in Comprehensive Income | 2015 | 2014 | 2013 | ||||||||||
(In thousands) | |||||||||||||
Fair Value Hedge Relationships: | |||||||||||||
Interest rate swap agreements | Interest expense | $ | (21,960 | ) | $ | (10,879 | ) | $ | (4,492 | ) | |||
Cash Flow Hedge Relationships: | |||||||||||||
Forward starting interest rate swap agreements | Other comprehensive income | — | $ | 133,466 | N/A | ||||||||
Forward starting interest rate swap agreements (1) | Interest expense | 8,305 | 625 | 626 | |||||||||
(1) Represents amortization of losses on forward starting interest rate swap agreements that were previously settled.
Hedge ineffectiveness represents the difference between the changes in the fair value of the derivative instruments and the changes in fair value of the fixed rate debt attributable to changes in the benchmark interest rates. Hedge ineffectiveness is recorded directly in earnings within interest expense and was immaterial for fiscal 2015, fiscal 2014 and fiscal 2013. The interest rate swaps do not contain credit-risk-related contingent features.
66
10. SELF-INSURED LIABILITIES
Sysco maintains a self-insurance program covering portions of workers’ compensation, general and vehicle liability and property insurance costs. The amounts in excess of the self-insured levels are fully insured by third party insurers. The company also maintains a fully self-insured group medical program. A summary of the activity in self-insured liabilities appears below:
2015 | 2014 | 2013 | |||||||||
(In thousands) | |||||||||||
Balance at beginning of period | $ | 194,476 | $ | 147,598 | $ | 129,749 | |||||
Charged to costs and expenses | 367,025 | 375,267 | 352,374 | ||||||||
Payments | (368,189 | ) | (328,389 | ) | (334,525 | ) | |||||
Balance at end of period | $ | 193,312 | $ | 194,476 | $ | 147,598 | |||||
11. DEBT AND OTHER FINANCING ARRANGEMENTS
Sysco’s debt consists of the following:
June 27, 2015 | June 28, 2014 | ||||||
(In thousands) | |||||||
Commercial paper, interest averaging 0.2% as of June 28, 2014 | $ | — | $ | 129,999 | |||
Senior notes, interest at 0.55%, maturing in fiscal 2015 | — | 299,015 | |||||
Senior notes, interest at 5.25%, maturing in fiscal 2018 (1) | 502,608 | 502,521 | |||||
Senior notes, interest at 5.375%, maturing in fiscal 2019 (1) | 248,824 | 248,509 | |||||
Senior notes, interest at 2.6%, maturing in fiscal 2022 (1) | 444,212 | 443,384 | |||||
Debentures, interest at 7.16%, maturing in fiscal 2027 (2) | 50,000 | 50,000 | |||||
Debentures, interest at 6.5%, maturing in fiscal 2029 (1) | 223,610 | 223,505 | |||||
Senior notes, interest at 5.375%, maturing in fiscal 2036 (1) | 496,775 | 495,636 | |||||
Senior notes, interest at 6.625%, maturing in fiscal 2039 (1) | 244,415 | 244,180 | |||||
Senior notes, interest at 1.45%, maturing in fiscal 2018 (1), (3) | 500,801 | — | |||||
Senior notes, interest at 2.35% maturing in fiscal 2020 (1), (3) | 752,070 | — | |||||
Senior notes, interest at 3.00% , maturing in fiscal 2022 (1), (3) | 745,136 | — | |||||
Senior notes, interest at 3.50% , maturing in fiscal 2025 (1), (3) | 1,239,116 | — | |||||
Senior notes, interest at 4.35%, maturing in fiscal 2035 (1), (3) | 742,664 | — | |||||
Senior notes, interest at 4.50%, maturing in fiscal 2045 (1), (3) | 981,813 | — | |||||
Notes payable, capital leases, and other debt, interest averaging 2.81% and maturing at various dates to fiscal 2026 as of June 27, 2015 and 2.59% and maturing at various dates to fiscal 2029 as of June 28, 2014 | 149,833 | 96,333 | |||||
Total debt | 7,321,877 | 2,733,082 | |||||
Less current maturities of long-term debt | (4,979,301 | ) | (304,777 | ) | |||
Less notes payable | (70,751 | ) | (70,975 | ) | |||
Net long-term debt | $ | 2,271,825 | $ | 2,357,330 | |||
(1) Represents senior notes that are unsecured, are not subject to any sinking fund requirement and include a redemption provision that allows Sysco to retire the debentures and notes at any time prior to maturity at the greater of par plus accrued interest or an amount designed to ensure that the debenture and note holders are not penalized by the early redemption.
(2) This debenture is not subject to any sinking fund requirement and is no longer redeemable prior to maturity.
(3) Represents senior notes that were redeemed in July 2015 under a mandatory redemption feature.
67
As of June 27, 2015, the principal payments required to be made during the next five fiscal years on long-term debt, excluding notes payable and commercial paper, are shown below:
Amount | |||
(In thousands) | |||
2016 | $ | 5,007,943 | |
2017 | 29,140 | ||
2018 | 506,694 | ||
2019 | 269,532 | ||
2020 | 3,387 | ||
Commercial Paper and Revolving Credit Facility
Sysco has a commercial paper program allowing the company to issue short-term unsecured notes in an aggregate amount not to exceed $1.5 billion.
Sysco and one of its subsidiaries, Sysco International, ULC, have a revolving credit facility supporting the company’s U.S. and Canadian commercial paper programs. The facility provides for borrowings in both U.S. and Canadian dollars. Borrowings by Sysco International, ULC under the agreement are guaranteed by Sysco, and borrowings by Sysco and Sysco International, ULC under the credit agreement are guaranteed by the wholly-owned subsidiaries of Sysco that are guarantors of the company’s senior notes and debentures. The facility, in the amount of $1.5 billion, expires on December 29, 2018, but is subject to extension. As of June 27, 2015, there were no commercial paper issuances outstanding. In periods where Sysco has commercial paper borrowings, the amounts are classified within long-term debt, as the program is supported by long-term revolving credit facility described above.
During fiscal 2015, 2014, and 2013, aggregate outstanding commercial paper issuances ranged from approximately zero to $659.4 million, zero to $770.5 million, and zero to $330.0 million, respectively.
Fixed Rate Debt
In February 2013, Sysco repaid 4.2% senior notes totaling $250.0 million at maturity utilizing a combination of cash flow from operations and cash on hand.
In March 2014, Sysco repaid 4.6% senior notes totaling $200.0 million at maturity utilizing a combination of cash flow from operations and commercial paper issuances.
In June 2015, Sysco repaid 0.55% senior notes totaling $300.0 million at maturity utilizing a combination of cash flow from operations and cash on hand.
In October 2014, Sysco issued senior notes and terminated a previously outstanding unsecured bridge facility that was established in December 2013 as a potential financing mechanism for funding the proposed US Foods merger until longer-term funding could be obtained. The senior notes, issued under the company’s previous February 2012 registration statement, were unsecured, were not subject to any sinking fund requirement and included a redemption provision that allowed Sysco to retire the notes at any time prior to maturity at the greater of par plus accrued interest or an amount designed to ensure that the note holders are not penalized by early redemption. These senior notes contained mandatory redemption features providing that, on the earlier of the merger agreement termination date or October 8, 2015, Sysco was required to redeem all of the senior notes at a redemption price equal to 101% of the principal of the senior notes plus accrued interest. In June 2015, we terminated the merger agreement, and we redeemed the senior notes in July 2015 using cash on hand and the proceeds from borrowings under our commercial paper program. The senior notes were classified as current maturities of long-term debt as of June 27, 2015. Details of the senior notes are below:
68
Maturity Date | Par Value (in millions) | Coupon Rate | Pricing (percentage of par) | ||||||||
October 2, 2017 | $ | 500 | 1.45 | % | 99.962 | % | |||||
October 2, 2019 | 750 | 2.35 | 99.864 | ||||||||
October 2, 2021 | 750 | 3.00 | 99.781 | ||||||||
October 2, 2024 | 1,250 | 3.50 | 99.616 | ||||||||
October 2, 2034 | 750 | 4.35 | 99.841 | ||||||||
October 2, 2044 | 1,000 | 4.50 | 98.992 | ||||||||
Total Debt
Total debt as of June 27, 2015 was $7.3 billion, of which approximately 74% was at fixed rates with a weighted average of 4.3% and an average life of 4.37 years, and the remainder was at floating rates with a weighted average of 2.9% and an average life of 0.84 years. Certain loan agreements contain typical debt covenants to protect note holders, including provisions to maintain the company’s long-term debt to total capital ratio below a specified level. Sysco is currently in compliance with all debt covenants.
Other
As of June 27, 2015 and June 28, 2014, letters of credit outstanding were $101.0 million and $45.7 million, respectively.
12. LEASES
Sysco has obligations under capital and operating leases for certain distribution facilities, vehicles and computers. Total rental expense under operating leases was $104.3 million, $92.3 million, and $84.4 million in fiscal 2015, 2014 and 2013, respectively. Contingent rentals, subleases and assets and obligations under capital leases are not significant.
Aggregate minimum lease payments by fiscal year under existing long-term operating leases are as follows:
Amount | |||
(In thousands) | |||
2016 | $ | 47,559 | |
2017 | 38,183 | ||
2018 | 27,831 | ||
2019 | 20,320 | ||
2020 | 16,661 | ||
Thereafter | 45,670 | ||
13. OTHER LONG-TERM LIABILITIES
The following table presents details of the company’s other long-term liabilities:
June 27, 2015 | June 28, 2014 | ||||||
(In thousands) | |||||||
Retirement Plan | $ | 227,352 | $ | 270,189 | |||
Supplemental executive retirement plan | 420,704 | 438,288 | |||||
Other | 286,666 | 319,401 | |||||
Total | $ | 934,722 | $ | 1,027,878 | |||
14. COMPANY-SPONSORED EMPLOYEE BENEFIT PLANS
Sysco has company-sponsored defined benefit and defined contribution retirement plans for its employees. Also, the company provides certain health care benefits to eligible retirees and their dependents.
69
Defined Contribution Plans
In December 2012, the company amended its defined contribution 401(k) Plan to be a Safe Harbor Plan, a plan that treats all employees’ benefits equally within the plan, under Sections 401(k) and 401(m) of the Internal Revenue Code with respect to non-union employees and those union employees whose unions adopted the Safe Harbor Plan provisions. Effective January 1, 2013, the new Safe Harbor Plan provides that the company will make a non-elective contribution each pay period equal to 3% of a participant’s compensation. Additionally, the company will make matching contributions of 50% of a participant’s pre-tax contribution on the first 5% of the participant’s compensation contributed by the participant. Certain employees are also eligible for a transition contribution, and the company may also make discretionary contributions. For union employees who are members of unions that did not adopt the Safe Harbor Plan provisions, the plan provides that under certain circumstances the company may make matching contributions of up to 50% of the first 6% of a participant’s compensation.
Prior to the adoption of the Safe Harbor Plan in January 2013, the company’s defined contribution 401(k) plan provided that, under certain circumstances, the company may make matching contributions of up to 50% of the first 6% of a participant’s compensation.
The company also has a nonqualified, unfunded Management Savings Plan (MSP) available to key management personnel who are participants in the Management Incentive Plan. Participants may defer up to 50% of their annual salary and up to 100% of their annual bonus. The company will make a non-elective contribution each pay period equal to 3% of a participant’s compensation. Additionally, the company will make matching contributions of 50% of a participant’s pre-tax contribution on the first 5% of the participant’s eligible compensation that is deferred. Certain employees are also eligible for a transition contribution, and the company may also make discretionary contributions. All company contributions to the MSP are limited by the amounts contributed by the company to the participant’s 401(k) account.
Sysco’s expense related to its defined contribution plans was $125.4 million in fiscal 2015, $118.6 million in fiscal 2014, and $65.3 million in fiscal 2013.
Defined Benefit Plans
Sysco maintains a qualified pension plan (Retirement Plan) that pays benefits to participating employees at retirement, using formulas based on a participant’s years of service and compensation. During fiscal 2012, Sysco approved a plan to freeze future benefit accruals under the Retirement Plan as of December 31, 2012 for all U.S.-based salaried and non-union hourly employees. Effective January 1, 2013, these employees were eligible for additional contributions under the company’s defined contribution 401(k) plan.
In addition to receiving benefits upon retirement under the company’s Retirement Plan, certain key management personnel who were participants in the Management Incentive Plan are entitled to receive benefits under a Supplemental Executive Retirement Plan (SERP). This plan is a nonqualified, unfunded supplementary retirement plan. In November 2012, Sysco approved a plan to restructure its executive nonqualified retirement program including the SERP. Future benefit accruals have been frozen under this plan as of June 29, 2013, for all participants.
Also, the company provides certain health care benefits to eligible retirees and their dependents.
70
Funded Status
Accumulated pension assets measured against the obligation for pension benefits represents the funded status of a given plan. The funded status of Sysco’s company-sponsored defined benefit plans is presented in the table below. The caption “Pension Benefits” in the tables below includes both the Retirement Plan and the SERP.
Pension Benefits | Other Postretirement Plans | ||||||||||||||
June 27, 2015 | June 28, 2014 | June 27, 2015 | June 28, 2014 | ||||||||||||
(In thousands) | |||||||||||||||
Change in benefit obligation: | |||||||||||||||
Benefit obligation at beginning of year | $ | 3,671,708 | $ | 3,089,022 | $ | 12,611 | $ | 14,248 | |||||||
Service cost | 11,263 | 9,657 | 536 | 546 | |||||||||||
Interest cost | 171,120 | 160,436 | 590 | 748 | |||||||||||
Amendments | 914 | (347 | ) | — | — | ||||||||||
Actuarial (gain) loss, net | (86,129 | ) | 492,720 | (1,050 | ) | (3,280 | ) | ||||||||
Total disbursements | (89,749 | ) | (79,780 | ) | 329 | 349 | |||||||||
Benefit obligation at end of year | 3,679,127 | 3,671,708 | 13,016 | 12,611 | |||||||||||
Change in plan assets: | |||||||||||||||
Fair value of plan assets at beginning of year | 2,937,519 | 2,518,009 | — | — | |||||||||||
Actual return on plan assets | 80,225 | 474,538 | — | — | |||||||||||
Employer contribution | 75,133 | 24,752 | (329 | ) | (349 | ) | |||||||||
Total disbursements | (89,749 | ) | (79,780 | ) | 329 | 349 | |||||||||
Fair value of plan assets at end of year | 3,003,128 | 2,937,519 | — | — | |||||||||||
Funded status at end of year | $ | (675,999 | ) | $ | (734,189 | ) | $ | (13,016 | ) | $ | (12,611 | ) | |||
In order to meet a portion of its obligations under the SERP, Sysco has contributed to a rabbi trust, COLI policies on the lives of participants and interests in corporate-owned real estate assets. These assets are not included as plan assets or in the funded status amounts in the tables above and below. As they are held in a rabbi trust, these assets are available to satisfy the claims of the company’s creditors in the event of bankruptcy or insolvency of the company. The life insurance policies on the lives of the participants had carrying values of $97.2 million as of June 27, 2015 and $96.5 million as of June 28, 2014. Sysco is the sole owner and beneficiary of such policies.
The amounts recognized on Sysco’s consolidated balance sheets related to its company-sponsored defined benefit plans are as follows:
Pension Benefits | Other Postretirement Plans | ||||||||||||||
June 27, 2015 | June 28, 2014 | June 27, 2015 | June 28, 2014 | ||||||||||||
(In thousands) | |||||||||||||||
Current accrued benefit liability (Accrued expenses) | $ | (27,942 | ) | $ | (25,712 | ) | $ | (327 | ) | $ | (313 | ) | |||
Non-current accrued benefit liability (Other long-term liabilities) | (648,057 | ) | (708,477 | ) | (12,689 | ) | (12,298 | ) | |||||||
Net amount recognized | $ | (675,999 | ) | $ | (734,189 | ) | $ | (13,016 | ) | $ | (12,611 | ) | |||
Accumulated other comprehensive loss (income) as of June 27, 2015 consists of the following amounts that had not, as of that date, been recognized in net benefit cost:
Pension Benefits | Other Postretirement Plans | Total | |||||||||
(In thousands) | |||||||||||
Prior service cost | $ | 50,109 | $ | 730 | $ | 50,839 | |||||
Actuarial losses (gains) | 1,101,051 | (6,903 | ) | 1,094,148 | |||||||
Total | $ | 1,151,160 | $ | (6,173 | ) | $ | 1,144,987 | ||||
71
Accumulated other comprehensive loss (income) as of June 28, 2014 consists of the following amounts that had not, as of that date, been recognized in net benefit cost:
Pension Benefits | Other Postretirement Plans | Total | |||||||||
(In thousands) | |||||||||||
Prior service cost | $ | 60,306 | $ | 898 | $ | 61,204 | |||||
Actuarial losses (gains) | 1,058,651 | (6,287 | ) | 1,052,364 | |||||||
Total | $ | 1,118,957 | $ | (5,389 | ) | $ | 1,113,568 | ||||
The accumulated benefit obligation, which does not consider any salary increases for the remaining active union employees in the Retirement Plan, for the company-sponsored defined benefit pension plans was $3.7 billion and $3.7 billion as of June 27, 2015 and June 28, 2014, respectively.
Information for plans with accumulated benefit obligation/aggregate benefit obligation in excess of fair value of plan assets is as follows:
Pension Benefits (1) | Other Postretirement Plans | ||||||||||||||
June 27, 2015 | June 28, 2014 | June 27, 2015 | June 28, 2014 | ||||||||||||
(In thousands) | |||||||||||||||
Accumulated benefit obligation/aggregate benefit obligation | $ | 3,667,031 | $ | 3,660,227 | $ | 13,016 | $ | 12,611 | |||||||
Fair value of plan assets at end of year | 3,003,128 | 2,937,519 | — | — | |||||||||||
(1) Information under Pension Benefits as of June 27, 2015 and June 28, 2014 includes both the Retirement Plan and the SERP.
Components of Net Benefit Costs and Other Comprehensive Income
The components of net company-sponsored pension costs for each fiscal year are as follows:
Pension Benefits | |||||||||||
2015 | 2014 | 2013 | |||||||||
(In thousands) | |||||||||||
Service cost | $ | 11,263 | $ | 9,657 | $ | 70,166 | |||||
Interest cost | 171,120 | 160,436 | 148,561 | ||||||||
Expected return on plan assets | (228,624 | ) | (192,795 | ) | (171,201 | ) | |||||
Amortization of prior service cost | 11,111 | 11,145 | 9,899 | ||||||||
Amortization of actuarial loss | 19,871 | 16,327 | 72,624 | ||||||||
Curtailment loss | — | — | 8,293 | ||||||||
Net pension (benefits) costs | $ | (15,259 | ) | $ | 4,770 | $ | 138,342 | ||||
The components of other postretirement benefit costs for each fiscal year are as follows:
Other Postretirement Plans | |||||||||||
2015 | 2014 | 2013 | |||||||||
(In thousands) | |||||||||||
Service cost | $ | 536 | $ | 546 | $ | 541 | |||||
Interest cost | 590 | 748 | 614 | ||||||||
Amortization of prior service cost | 168 | 168 | 168 | ||||||||
Amortization of actuarial gain | (434 | ) | (143 | ) | (203 | ) | |||||
Amortization of transition obligation | — | — | 141 | ||||||||
Net other postretirement benefit costs | $ | 860 | $ | 1,319 | $ | 1,261 | |||||
72
Other changes in plan assets and benefit obligations recognized in other comprehensive income (loss) related to company-sponsored pension plans for each fiscal year are as follows:
Pension Benefits | |||||||||||
2015 | 2014 | 2013 | |||||||||
(In thousands) | |||||||||||
Amortization of prior service cost | $ | 11,111 | $ | 11,145 | $ | 18,192 | |||||
Amortization of actuarial loss | 19,871 | 16,327 | 72,624 | ||||||||
Prior service cost arising in current year | (914 | ) | 347 | (53,902 | ) | ||||||
Actuarial (loss) gain arising in current year | (62,270 | ) | (210,978 | ) | 366,957 | ||||||
Net pension costs | $ | (32,202 | ) | $ | (183,159 | ) | $ | 403,871 | |||
Other changes in benefit obligations recognized in other comprehensive (loss) income related to other postretirement plans for each fiscal year are as follows:
Other Postretirement Plans | |||||||||||
2015 | 2014 | 2013 | |||||||||
(In thousands) | |||||||||||
Amortization of prior service cost | $ | 168 | $ | 168 | $ | 168 | |||||
Amortization of actuarial gain | (434 | ) | (143 | ) | (203 | ) | |||||
Amortization of transition obligation | — | — | 141 | ||||||||
Actuarial (loss) gain arising in current year | 1,050 | 3,280 | (188 | ) | |||||||
Net pension costs | $ | 784 | $ | 3,305 | $ | (82 | ) | ||||
Amounts included in accumulated other comprehensive loss (income) as of June 27, 2015 that are expected to be recognized as components of net company-sponsored benefit cost during fiscal 2016 are:
Pension Benefits | Other Postretirement Plans | Total | |||||||||
(In thousands) | |||||||||||
Amortization of prior service cost | $ | 11,202 | $ | 169 | $ | 11,371 | |||||
Amortization of actuarial losses (gains) | 22,186 | (481 | ) | 21,705 | |||||||
Total | $ | 33,388 | $ | (312 | ) | $ | 33,076 | ||||
Employer Contributions
The company made cash contributions to its company-sponsored pension plans of $75.1 million and $24.8 million in fiscal years 2015 and 2014, respectively. There were no required contributions to the Retirement Plan to meet ERISA minimum funding requirements in fiscal 2015. The $50 million contribution to the Retirement Plan in fiscal 2015 was voluntary, as there were no required contributions to meet ERISA minimum funding requirements in fiscal 2015. There are no required contributions to the Retirement Plan to meet ERISA minimum funding requirements in fiscal 2016. The company’s contributions to the SERP and other post-retirement plans are made in the amounts needed to fund current year benefit payments. The estimated fiscal 2016 contributions to fund benefit payments for the SERP and other postretirement plans are $27.9 million and $0.3 million, respectively.
73
Estimated Future Benefit Payments
Estimated future benefit payments for vested participants, based on actuarial assumptions, are as follows:
Pension Benefits | Other Postretirement Plans | ||||||
(In thousands) | |||||||
2016 | $ | 105,555 | $ | 327 | |||
2017 | 115,844 | 546 | |||||
2018 | 126,413 | 824 | |||||
2019 | 137,300 | 1,035 | |||||
2020 | 148,517 | 1,213 | |||||
Subsequent five years | 906,784 | 6,658 | |||||
Assumptions
Weighted-average assumptions used to determine benefit obligations as of year-end were:
June 27, 2015 | June 28, 2014 | ||||
Discount rate — Retirement Plan | 4.84 | % | 4.74 | % | |
Discount rate — SERP | 4.63 | 4.59 | |||
Discount rate — Other Postretirement Plans | 4.84 | 4.74 | |||
Rate of compensation increase — Retirement Plan | 3.89 | 3.89 | |||
As benefit accruals under the SERP were frozen as of June 29, 2013, due to the plan freeze discussed above, future pay is not projected in the determination of the benefit obligation as of June 27, 2015 or June 28, 2014.
Weighted-average assumptions used to determine net company-sponsored pension costs and other postretirement benefit costs for each fiscal year were:
2015 | 2014 | 2013 | ||||||||
Discount rate — Retirement Plan | 4.74 | % | 5.32 | % | 4.81 | % | ||||
Discount rate — SERP | 4.59 | % | 4.94 | % | 3.96 | % | (1) | |||
Discount rate — Other Postretirement Plans | 4.74 | % | 5.32 | % | 4.81 | % | ||||
Expected rate of return — Retirement Plan | 7.75 | % | 7.75 | % | 7.75 | % | ||||
Rate of compensation increase — Retirement Plan | 3.89 | % | 3.89 | % | 5.30 | % | ||||
(1) The SERP was remeasured in November 2012 as a result of the plan freeze discussed above. The rate in the table above reflects the discount rate as of this remeasurement.
As benefit accruals under the SERP were frozen as of June 29, 2013, due to the plan freeze discussed above, future pay is not projected in the determination of net pension costs related to the SERP for fiscal 2015 and fiscal 2014. For determining the net pension costs related to the SERP for fiscal 2013, the SERP calculations utilized an age-graded salary growth assumption.
A healthcare cost trend rate is not used in the calculations of postretirement benefit obligations because Sysco subsidizes the cost of postretirement medical coverage by a fixed dollar amount, with the retiree responsible for the cost of coverage in excess of the subsidy, including all future cost increases.
For guidance in determining the discount rate, Sysco calculates the implied rate of return on a hypothetical portfolio of high-quality fixed-income investments for which the timing and amount of cash outflows approximates the estimated payouts of the company-sponsored pension plans. The discount rate assumption is updated annually and revised as deemed appropriate. The discount rate to be used for the calculation of fiscal 2016 net company-sponsored benefit costs for the Retirement Plan is 4.84%. The discount rate to be used for the calculation of fiscal 2016 net company-sponsored benefit costs for the SERP is 4.63%. The discount rate to be used for the calculation of fiscal 2016 net company-sponsored benefit costs for the Other Postretirement Plans is 4.84%.
74
The expected long-term rate of return on plan assets assumption is net return on assets assumption, representing gross return on assets less plan expenses. The expected return is derived from a mathematical asset model that incorporates assumptions as to the various asset class returns, reflecting a combination of rigorous historical performance analysis and the forward-looking views of the financial markets regarding the yield on bonds, the historical returns of the major stock markets and returns on alternative investments. The rate of return assumption is reviewed annually and revised as deemed appropriate. The expected long-term rate of return to be used in the calculation of fiscal 2016 net company-sponsored benefit costs for the Retirement Plan is 7.25%.
Plan Assets
Investment Strategy
The company’s overall strategic investment objectives for the Retirement Plan are to preserve capital for future benefit payments and to balance risk and return commensurate with ongoing changes in the valuation of plan liabilities. Over time, the company intends to decrease the risk of the Retirement Plan’s investments in order to preserve the Retirement Plan’s funded status. In order to accomplish these objectives, the company oversees the Retirement Plan’s investment objectives and policy design, decides proper plan asset class strategies and structures, monitors the performance of plan investment managers and investment funds and determines the proper investment allocation of pension plan contributions and withdrawals. The company has created an investment structure for the Retirement Plan that takes into account the nature of the Retirement Plan’s liabilities. This structure ensures the Retirement Plan’s investments are diversified within each asset class, in addition to being diversified across asset classes with the intent to build asset class portfolios that are structured without strategic bias for or against any subcategories within each asset class. The company has also created a set of investment guidelines for the Retirement Plan’s investment managers to specify prohibited transactions, including borrowing of money except for real estate, private equity or hedge fund portfolios where leverage is a key component of the investment strategy and permitted in the investments’ governing documents, the purchase of securities on margin unless fully collateralized by cash or cash equivalents or short sales, pledging, mortgaging or hypothecating of any securities, except for loans of securities that are fully collateralized, market timing transactions and the direct purchase of the securities of Sysco or the investment manager. The purchase or sale of derivatives for speculation or leverage is also prohibited; however, investment managers are allowed to use derivative securities so long as they do not increase the risk profile or leverage of the manager’s portfolio.
The company’s target and actual investment allocation as of June 27, 2015 is as follows:
Target Asset Allocation | Actual Asset Allocation | ||||
U.S. equity | 24 | % | 24 | % | |
International equity | 24 | 25 | |||
Long duration fixed income | 27 | 26 | |||
High yield fixed income | 7 | 7 | |||
Alternative investments | 18 | 18 | |||
100 | % | ||||
Sysco’s investment strategy is implemented through a combination of balanced and specialized investment managers, passive investment funds and actively-managed investment funds. U.S. equity consists of both large-cap and small-to-mid-cap securities. Long duration fixed income investments include U.S. government and agency securities, corporate bonds from diversified industries, asset-backed securities, mortgage-backed securities, other debt securities and derivative securities. High yield fixed income consists of below investment grade corporate debt securities and may include derivative securities. Alternative investments may include private equity, private real estate, hedge funds, timberland, and commodities investments. Investment funds are selected based on each fund’s stated investment strategy to align with Sysco’s overall target mix of investments. Actual asset allocation is regularly reviewed and periodically rebalanced to the target allocation when considered appropriate.
As discussed above, the Retirement Plan’s investments in equity, fixed income and alternative investments provide a range of returns and also expose the plan to investment risk. However, the investment policies put in place by the company require diversification of plan assets across issuers, industries and countries. As such, the Retirement Plan does not have significant concentrations of risk in plan assets.
75
Fair Value of Plan Assets
Fair value is defined as the price that would be received to sell an asset or paid to transfer a liability in an orderly transaction between market participants at the measurement date (i.e. an exit price). See Note 5, “Fair Value Measurements,” for a description of the fair value hierarchy that prioritizes the inputs to valuation techniques used to measure fair value. The following is a description of the valuation methodologies used for assets and liabilities held by Sysco's Retirement Plan measured at fair value.
Cash and cash equivalents: Valued at amortized cost, which approximates fair value due to the short-term maturities of these investments. Cash and cash equivalents is included as a Level 2 measurement in the table below.
Equity securities: Valued at the closing price reported on the exchange market. If a stock is not listed on a public exchange, such as an American Depository Receipt or some preferred stocks, the stock is valued using an evaluated bid price based on a compilation of observable market information. Inputs used include yields, the underlying security “best price”, adjustments for corporate actions and exchange prices of underlying and common stock of the same issuer. Equity securities valued at the closing price reported on the exchange market are classified as a Level 1 measurement in the table below; all other equity securities are included as a Level 2 measurement.
Fixed income securities: Valued using evaluated bid prices based on a compilation of observable market information or a broker quote in a non-active market. Inputs used vary by type of security, but include spreads, yields, rate benchmarks, rate of prepayment, cash flows, rating changes and collateral performance and type. All fixed income securities are included as a Level 2 measurement in the table below.
Investment funds: Funds holding debt, equity and exchange-traded real estate securities are valued at the net asset value (NAV) provided by the manager of each fund. The NAV is calculated as the underlying net assets owned by the fund, divided by the number of shares outstanding. The NAV is based on the fair value of the underlying securities within the fund. Non-exchange traded real estate funds are valued based on the proportionate interest held by the Retirement Plan, which is based on the valuations of the underlying real estate investments held by each fund. Each real estate investment is valued on the basis of a discounted cash flow approach. Inputs used include future rental receipts, expenses and residual values from a market participant view of the highest and best use of the real estate as rental property. The private equity funds are valued based on the proportionate interest held by the Retirement Plan, which is based on the valuations of the underlying private equity investments held by each fund. The hedge funds are valued based on the hedge funds' proportionate share of the net assets of the underlying private investment fund as determined by the underlying private investment fund's general partner. Indirectly-held investments are valued utilizing the latest financial reports supplied by the fund’s portfolio investments. Directly-held investments are valued initially based on transaction price and are adjusted utilizing available market data and investment-specific factors, such as estimates of liquidation value, prices of recent transactions in the same or similar issuer, current operating performance and future expectations of the particular investment, changes in market outlook and the financing environment. Investment funds holding debt, equity and exchange traded real-estate securities are included as a Level 2 measurement in the table below. The non-exchange traded real estate funds, hedge funds and private equity funds are included as Level 3 measurements.
Derivatives: Valuation method varies by type of derivative security.
•Credit default and interest rate swaps: Valued using evaluated bid prices based on a compilation of observable market information. Inputs used for credit default swaps include spread curves and trade data about the credit quality of the counterparty. Inputs used for interest rate swaps include benchmark yields, swap curves, cash flow analysis, and interdealer broker rates. Credit default and interest rate swaps are included as a Level 2 measurement in the table below.
•Foreign currency contracts: Valued using a standardized interpolation model that utilizes the quoted prices for standard-length forward foreign currency contracts and adjusts to the remaining term outstanding on the contract being valued. Foreign currency contracts are included as a Level 2 measurement in the table below.
•Futures and option contracts: Valued at the closing price reported on the exchange market for exchange-traded futures and options. Over-the-counter options are valued using pricing models that are based on observable market information. Exchange-traded futures and options are included as a Level 1 measurement in the table below; over-the-counter options are included as a Level 2 measurement.
76
The following table presents the fair value of the Retirement Plan’s assets by major asset category as of June 27, 2015:
Assets Measured at Fair Value as of June 27, 2015 | |||||||||||||||
Level 1 | Level 2 | Level 3 | Total | ||||||||||||
(In thousands) | |||||||||||||||
Cash and cash equivalents | $ | — | $ | 21,968 | $ | — | $ | 21,968 | |||||||
U.S. equity: | |||||||||||||||
U.S. large-cap (1) | 233,525 | 333,709 | — | $ | 567,234 | ||||||||||
U.S. small-cap | 154,598 | — | — | 154,598 | |||||||||||
International equity (2) | — | 732,595 | — | $ | 732,595 | ||||||||||
Long duration fixed income: | |||||||||||||||
Corporate bonds | — | 567,280 | — | $ | 567,280 | ||||||||||
U.S. government and agency securities | — | 190,125 | — | 190,125 | |||||||||||
Other | — | 4,343 | — | 4,343 | |||||||||||
Derivatives, net (3) | — | 1,078 | — | $ | 1,078 | ||||||||||
High yield fixed income (2) | — | 204,175 | — | 204,175 | |||||||||||
Alternative investments: | |||||||||||||||
Hedge Fund (2) | — | 335,265 | 335,265 | ||||||||||||
Real estate (2) | — | 25,386 | 138,283 | 163,669 | |||||||||||
Private equity (2) | — | — | 52,891 | $ | 52,891 | ||||||||||
Total investments at fair value | $ | 388,123 | $ | 2,080,659 | $ | 526,439 | $ | 2,995,221 | |||||||
Other (4) | 7,907 | ||||||||||||||
Fair value of plan assets at end of year | $ | 3,003,128 | |||||||||||||
(1) Include direct investments and investment funds.
(2) Include investments in investment funds only.
(3) Include credit default swaps, interest rate swaps and futures. The fair value of asset positions totaled $1.4 million; the fair
value of liability positions totaled $0.3 million.
(4) Include primarily plan receivables and payables, net.
77
The following table presents the fair value of the Retirement Plan’s assets by major asset category as of June 28, 2014:
Assets Measured at Fair Value as of June 28, 2014 | |||||||||||||||
Level 1 | Level 2 | Level 3 | Total | ||||||||||||
(In thousands) | |||||||||||||||
Cash and cash equivalents | $ | — | $ | 51,066 | $ | — | $ | 51,066 | |||||||
U.S. equity: | |||||||||||||||
U.S. large-cap (1) | 218,165 | 777,627 | — | 995,792 | |||||||||||
U.S. small-cap | 135,781 | — | — | 135,781 | |||||||||||
International equity (2) | — | 717,022 | — | 717,022 | |||||||||||
Long duration fixed income: | |||||||||||||||
Corporate bonds | — | 568,419 | — | 568,419 | |||||||||||
U.S. government and agency securities | — | 171,617 | — | 171,617 | |||||||||||
Other | — | 4,907 | — | 4,907 | |||||||||||
Derivatives, net (3) | (127 | ) | 352 | — | 225 | ||||||||||
High yield fixed income (2) | — | 102,041 | — | 102,041 | |||||||||||
Alternative investments: | |||||||||||||||
Real estate (2) | — | 114,250 | 35,403 | 149,653 | |||||||||||
Private equity (2) | — | — | 31,204 | 31,204 | |||||||||||
Total investments at fair value | $ | 353,819 | $ | 2,507,301 | $ | 66,607 | $ | 2,927,727 | |||||||
Other (4) | 9,792 | ||||||||||||||
Fair value of plan assets at the end of the year | $ | 2,937,519 | |||||||||||||
(1) Include direct investments and investment funds.
(2) Include investments in investment funds only.
(3) Include credit default swaps, interest rate swaps and futures.
The fair value of asset positions totaled $0.8 million; the fair value of liability positions totaled $0.6 million.
(4) Include primarily plan receivables and payables, net.
The following table sets forth a summary of changes in the fair value of the Retirement Plan’s Level 3 assets for each fiscal year:
Real Estate Funds | Private Equity Funds | Hedge Funds | Total Level 3 Measurements | ||||||||||||
(In thousands) | |||||||||||||||
Balance, June 29, 2013 | $ | 64,845 | $ | 14,375 | $ | — | $ | 79,220 | |||||||
Actual return on plan assets: | |||||||||||||||
Relating to assets still held at the reporting date | 3,044 | 1,931 | — | 4,975 | |||||||||||
Relating to assets sold during the period | 3,307 | 1,767 | — | 5,074 | |||||||||||
Purchases and sales, net | (35,793 | ) | 13,131 | — | (22,662 | ) | |||||||||
Transfers in and/or out of Level 3 | — | — | — | — | |||||||||||
Balance, June 28, 2014 | $ | 35,403 | $ | 31,204 | $ | — | $ | 66,607 | |||||||
Actual return on plan assets: | |||||||||||||||
Relating to assets still held at the reporting date | 8,122 | 2,438 | 12,265 | 22,825 | |||||||||||
Relating to assets sold during the period | 1,062 | 1,780 | — | 2,842 | |||||||||||
Purchases and sales, net | 93,696 | 17,469 | 323,000 | 434,165 | |||||||||||
Transfers in and/or out of Level 3 | — | — | — | — | |||||||||||
Balance, June 27, 2015 | $ | 138,283 | $ | 52,891 | $ | 335,265 | $ | 526,439 | |||||||
78
15. MULTIEMPLOYER EMPLOYEE BENEFIT PLANS
Defined Benefit Pension Plans
Sysco contributes to several multiemployer defined benefit pension plans in the U.S. and Canada based on obligations arising under collective bargaining agreements covering union-represented employees. Sysco does not directly manage these multiemployer plans, which are generally managed by boards of trustees, half of whom are appointed by the unions and the other half appointed by Sysco and the other employers contributing to the plan. Approximately 10% of Sysco’s current employees are participants in such multiemployer plans as of June 27, 2015.
The risks of participating in these multiemployer plans are different from single-employer plans in the following aspects:
• | Assets contributed to the multiemployer plan by one employer may be used to provide benefits to employees of other participating employers. |
• | If a participating employer stops contributing to the plan, the unfunded obligations of the plan may be borne by the remaining participating employers. |
• | If Sysco chooses to stop participating in some of its multiemployer plans, Sysco may be required to pay those plans an amount based on the underfunded status of the plan, referred to as a withdrawal liability. |
Based upon the information available from plan administrators, management believes that several of these multiemployer plans are underfunded. In addition, pension-related legislation in the U.S. requires underfunded pension plans to improve their funding ratios within prescribed intervals based on the level of their underfunding. As a result, Sysco expects its contributions to these plans to increase in the future. In addition, if a U.S. multiemployer defined benefit plan fails to satisfy certain minimum funding requirements, the Internal Revenue Service (IRS) may impose a nondeductible excise tax of 5% on the amount of the accumulated funding deficiency for those employers contributing to the fund.
Withdrawal Activity
Sysco has voluntarily withdrawn from various multiemployer pension plans. There were no withdrawal liability provisions recorded in fiscal 2015, $1.5 million in fiscal 2014 and $41.9 million in fiscal 2013. As of June 27, 2015, Sysco had no liabilities recorded related to certain multiemployer defined benefit plans for which Sysco’s voluntary withdrawal had already occurred and had $1.4 million liabilities as of June 28, 2014. Recorded withdrawal liabilities are estimated at the time of withdrawal based on the most recently available valuation and participant data for the respective plans; amounts are subsequently adjusted to the period of payment to reflect any changes to these estimates. If any of these plans were to undergo a mass withdrawal, as defined by the Pension Benefit Guaranty Corporation, within the two plan years following the plan year in which we completely withdraw from that plan, Sysco could have additional liability. The company does not currently believe any mass withdrawals are probable to occur in the applicable two-plan year time frame relating to the plans from which Sysco has voluntarily withdrawn.
Potential Withdrawal Liability
Under current law regarding multiemployer defined benefit plans, a plan’s termination, Sysco’s voluntary withdrawal, or the mass withdrawal of all contributing employers from any underfunded multiemployer defined benefit plan would require Sysco to make payments to the plan for Sysco’s proportionate share of the multiemployer plan’s unfunded vested liabilities. Generally, Sysco does not have the greatest share of liability among the participants in any of the plans in which it participates. Sysco believes that one of the above-mentioned events is reasonably possible for certain plans in which it participates and estimates its share of withdrawal liability for these plans could have been as much as $90.0 million as of June 27, 2015. This estimate excludes plans for which Sysco has recorded withdrawal liabilities or where the likelihood of the above-mentioned events is deemed remote. This estimate is based on the information available from plan administrators, which had a valuation date of December 31, 2013 for a majority of the plans. As the valuation date for all of these plans was December 31, 2013, the company’s estimate reflects the condition of the financial markets as of that date. Due to the lack of current information, management believes Sysco’s current share of the withdrawal liability could materially differ from this estimate.
79
Plan Contributions
Sysco’s contributions to multiemployer defined benefit pension plans were as follows for each fiscal year:
2015 | 2014 | 2013 | |||||||||
(In thousands) | |||||||||||
Individually significant plans | $ | 32,097 | $ | 30,402 | $ | 28,816 | |||||
All other plans | 6,047 | 45,627 | 36,923 | ||||||||
Total contributions | $ | 38,144 | $ | 76,029 | $ | 65,739 | |||||
Payments for voluntary withdrawals included in contributions were $1.4 million, $40.8 million and $31.8 million in fiscal 2015, 2014 and 2013, respectively.
Individually Significant Plans
The information in the following tables relate to multiemployer defined benefit pension plans which Sysco has determined to be individually significant to the company. To determine individually significant plans, the company evaluated several factors, including Sysco’s significance to the plan in terms of employees and contributions, the funded status of the plan and the size of company’s potential withdrawal liability if it were to voluntarily withdraw from the plan.
The following table provides information about the funded status of individually significant plans:
• | The “EIN-PN” column provides the Employer Identification Number (EIN) and the three-digit plan number (PN). |
• | The “Pension Protection Act Zone Status” columns provide the two most recent Pension Protection Act zone statuses available from each plan. The zone status is based on information that the company received from the plan’s administrators and is certified by each plan’s actuary. Among other factors, plans in the red zone are generally less than 65% funded, plans in the orange zone are both less than 80% funded and have an accumulated funding deficiency or are expected to have a deficiency in any of the next six plan years, plans in the yellow zone are less than 80% funded and plans in the green zone are at least 80% funded. |
• | The “FIP/RP Status” column indicates whether a financial improvement plan (FIP) for yellow/orange zone plans or a rehabilitation plan (RP) for red zone plans is pending or implemented in the current year or was put in place in a prior year. A status of “Pending” indicates a FIP/RP has been approved but actual period covered by the FIP/RP has not begun. A status of “Implemented” means the period covered by the FIP/RP began in the current year or is ongoing. |
• | The “Surcharge Imposed” column indicates whether a surcharge was paid during the most recent annual period presented for the company’s contributions to each plan in the red zone. If the company’s current collective bargaining agreement (CBA) with a plan satisfies the requirements of a pending but not yet implemented RP, then the payment of surcharges is not required and “No” will be reflected in this column. If the company’s current collective bargaining agreement (CBA) with a plan does not yet satisfy the requirements of a pending but not yet implemented RP, then the payment of surcharges is required and “Yes” will be reflected in this column. |
80
Pension Protection Act Zone Status | ||||||||||||
Pension Fund | EIN-PN | As of 12/31/15 | As of 12/31/14 | FIP/RP Status | Surcharge Imposed | Expiration Date(s) of CBA(s) | ||||||
Western Conference of Teamsters Pension Plan | 91-6145047-001 | Green | Green | N/A | N/A | 4/26/14 to 11/7/20 (1) | ||||||
Teamsters Pension Trust Fund of Philadelphia and Vicinity | 23-1511735-001 | Yellow | Yellow | Implemented | N/A | 7/31/16 to 7/20/20 (2) | ||||||
New York State Teamsters Conference Pension and Retirement Fund | 16-6063585-074 | Red | Red | Implemented | No | 4/30/2017 | ||||||
Truck Drivers and Helpers Local Union No. 355 Retirement Pension Fund | 52-6043608-001 | Yellow | Yellow | Implemented | N/A | 8/31/2015 | ||||||
Minneapolis Food Distributing Industry Pension Plan | 41-6047047-001 | Green | Green | Implemented | N/A | 8/8/2017 | ||||||
(1) | Sysco is party to 23 CBAs that require contributions to the Western Conference of Teamsters Pension Trust. Each agreement covers anywhere from less than 1% to 10% of the total contributions Sysco is required to pay the fund. |
(2) | Sysco is party to three CBAs that require contributions to the Teamsters Pension Trust Fund of Philadelphia and Vicinity. One agreement expires July 31, 2016 and covers approximately 5% of the total Contribution Sysco is required to pay the fund. The remaining two agreements expire July 20, 2020 and cover the remaining 95% of the total contributions Sysco is required to pay the fund. |
The following table provides information about the company’s contributions to individually significant plans:
• | The “Sysco Contributions” columns provide contribution amounts based on Sysco’s fiscal years, which may not coincide with the plans’ fiscal years. |
• | The“Sysco 5% of Total Plan Contributions” columns indicate whether Sysco was listed in the plan’s most recently filed Form 5500s as providing more than five percent of the total contributions to the plan, and the plan year-end is noted. |
Sysco Contributions | Sysco 5% of Total Plan Contributions | |||||||||||||||
Pension Fund | 2015 | 2014 | 2013 | Year Ending 12/31/13 | Year Ending 12/31/12 | |||||||||||
(In thousands) | ||||||||||||||||
Western Conference of Teamsters Pension Plan | $ | 23,268 | $ | 21,893 | $ | 20,561 | No | No | ||||||||
Teamsters Pension Trust Fund of Philadelphia and Vicinity | 2,233 | 1,977 | 2,256 | No | No | |||||||||||
N.Y. State Teamsters Conference Pension and Retirement Fund | 1,455 | 1,444 | 1,399 | No | No | |||||||||||
Truck Drivers and Helpers Local Union No. 355 Retirement Pension Fund | 2,068 | 1,874 | 1,624 | Yes | Yes | |||||||||||
Minneapolis Food Distributing Industry Pension Plan | 3,073 | 3,214 | 2,976 | Yes | Yes | |||||||||||
For all of the plans noted in the table above, minimum contributions outside of the agreed upon contractual rate are not required.
81
Other Postretirement Benefit Plans
In addition to the contributions to the defined benefit pension plans described above, Sysco also contributes to several multiemployer plans that provide other postretirement benefits based on obligations arising under collective bargaining agreements covering union-represented employees. These plans may provide medical, pharmacy, dental, vision, mental health and other benefits to active employees and retirees as determined by the trustees of each plan. Sysco contributed to these plans $28.5 million in fiscal 2015, $29.7 million in fiscal 2014 and $30.6 million in fiscal 2013. There have been no significant changes that affect the comparability of fiscal 2015, fiscal 2014 and fiscal 2013 contributions.
16. EARNINGS PER SHARE
Basic earnings per share has been computed by dividing net earnings by the weighted average number of shares of common stock outstanding for each respective year. Diluted earnings per share has been computed by dividing net earnings by the weighted average number of shares of common stock outstanding during those respective years adjusted for the dilutive effect of share-based awards outstanding using the treasury stock method.
A reconciliation of the numerators and the denominators of the basic and diluted earnings per share computations for the periods presented follows:
2015 | 2014 | 2013 | |||||||||
(In thousands, except for share and per share data) | |||||||||||
Numerator: | |||||||||||
Net earnings | $ | 686,773 | $ | 931,533 | $ | 992,427 | |||||
Denominator: | |||||||||||
Weighted-average basic shares outstanding | 592,072,308 | 585,988,084 | 589,397,807 | ||||||||
Dilutive effect of share-based awards | 4,776,726 | 4,228,136 | 3,277,303 | ||||||||
Weighted-average diluted shares outstanding | 596,849,034 | 590,216,220 | 592,675,110 | ||||||||
Basic earnings per share: | $ | 1.16 | $ | 1.59 | $ | 1.68 | |||||
Diluted earnings per share: | $ | 1.15 | $ | 1.58 | $ | 1.67 | |||||
The number of options that were not included in the diluted earnings per share calculation because the effect would have been anti-dilutive was approximately 2,400,000, 2,100,000 and 18,200,000 for fiscal 2015, 2014 and 2013, respectively.
Dividends declared were $705.5 million, $673.6 million and $654.9 million in fiscal 2015, 2014 and 2013, respectively. Included in dividends declared for each year were dividends declared but not yet paid at year-end of approximately $178.3 million, $171.6 million and $165.8 million in fiscal 2015, 2014 and 2013, respectively.
17. COMPREHENSIVE INCOME
Comprehensive income is net earnings plus certain other items that are recorded directly to shareholders’ equity, such as foreign currency translation adjustments, amounts related to cash flow hedging arrangements and certain amounts related to pension and other postretirement plans. Comprehensive income was $406.2 million, $735.8 million and $1.2 billion in fiscal 2015, 2014 and 2013, respectively.
82
A summary of the components of other comprehensive income (loss) and the related tax effects for each of the years presented is as follows:
2015 | |||||||||||||
Location of Expense (Income) Recognized in Net Earnings | Before Tax Amount | Tax | Net of Tax Amount | ||||||||||
(In thousands) | |||||||||||||
Pension and other postretirement benefit plans: | |||||||||||||
Reclassification adjustments: | |||||||||||||
Amortization of prior service cost | Operating expenses | $ | 11,279 | $ | 4,331 | $ | 6,948 | ||||||
Amortization of actuarial loss (gain), net | Operating expenses | 19,437 | 7,464 | 11,973 | |||||||||
Total reclassification adjustments | 30,716 | 11,795 | 18,921 | ||||||||||
Other comprehensive income before reclassification adjustments: | |||||||||||||
Prior service cost arising in current year | N/A | (914 | ) | (351 | ) | (563 | ) | ||||||
Net actuarial gain arising in current year | N/A | (61,221 | ) | (23,509 | ) | (37,712 | ) | ||||||
Total other comprehensive income before reclassification adjustments | (62,135 | ) | (23,860 | ) | (38,275 | ) | |||||||
Foreign currency translation: | |||||||||||||
Other comprehensive income before reclassification adjustments: | |||||||||||||
Foreign currency translation adjustment | N/A | (232,185 | ) | — | (232,185 | ) | |||||||
Interest rate swaps: | |||||||||||||
Reclassification adjustments: | |||||||||||||
Amortization of cash flow hedges | Interest expense | 8,305 | 3,189 | 5,116 | |||||||||
Other comprehensive income before reclassification adjustments: | |||||||||||||
Change in fair value of cash flow hedges | N/A | (55,374 | ) | (21,263 | ) | (34,111 | ) | ||||||
Total other comprehensive income (loss) | $ | (310,673 | ) | $ | (30,139 | ) | $ | (280,534 | ) | ||||
83
2014 | |||||||||||||
Location of Expense (Income) Recognized in Net Earnings | Before Tax Amount | Tax | Net of Tax Amount | ||||||||||
(In thousands) | |||||||||||||
Pension and other postretirement benefit plans: | |||||||||||||
Reclassification adjustments: | |||||||||||||
Amortization of prior service cost | Operating expenses | $ | 11,313 | $ | 4,343 | $ | 6,970 | ||||||
Amortization of actuarial loss (gain), net | Operating expenses | 16,184 | 6,216 | 9,968 | |||||||||
Total reclassification adjustments | 27,497 | 10,559 | 16,938 | ||||||||||
Other comprehensive income before reclassification adjustments: | |||||||||||||
Prior service cost arising in current year | N/A | 347 | 133 | 214 | |||||||||
Net actuarial gain arising in current year | N/A | (207,698 | ) | (79,756 | ) | (127,942 | ) | ||||||
Total other comprehensive income before reclassification adjustments | (207,351 | ) | (79,623 | ) | (127,728 | ) | |||||||
Foreign currency translation: | |||||||||||||
Other comprehensive income before reclassification adjustments: | |||||||||||||
Foreign currency translation adjustment | N/A | (3,106 | ) | — | (3,106 | ) | |||||||
Interest rate swaps: | |||||||||||||
Reclassification adjustments: | |||||||||||||
Amortization of cash flow hedges | Interest expense | 625 | 240 | 385 | |||||||||
Other comprehensive income before reclassification adjustments: | |||||||||||||
Change in fair value of cash flow hedges | N/A | (133,466 | ) | (51,251 | ) | (82,215 | ) | ||||||
Total other comprehensive income (loss) | $ | (315,801 | ) | $ | (120,075 | ) | $ | (195,726 | ) | ||||
84
2013 | |||||||||||||
Location of Expense (Income) Recognized in Net Earnings | Before Tax Amount | Tax | Net of Tax Amount | ||||||||||
(In thousands) | |||||||||||||
Pension and other postretirement benefit plans: | |||||||||||||
Reclassification adjustments: | |||||||||||||
Amortization of prior service cost | Operating expenses | $ | 18,360 | $ | 7,050 | $ | 11,310 | ||||||
Amortization of actuarial loss (gain), net | Operating expenses | 72,421 | 27,811 | 44,610 | |||||||||
Amortization of transition obligation | Operating expenses | 141 | 53 | 88 | |||||||||
Total reclassification adjustments | 90,922 | 34,914 | 56,008 | ||||||||||
Other comprehensive income before reclassification adjustments: | |||||||||||||
Prior service cost arising in current year | N/A | (53,902 | ) | (20,699 | ) | (33,203 | ) | ||||||
Net actuarial gain arising in current year | N/A | 366,769 | 140,840 | 225,929 | |||||||||
Total other comprehensive income before reclassification adjustments | 312,867 | 120,141 | 192,726 | ||||||||||
Foreign currency translation: | |||||||||||||
Other comprehensive income before reclassification adjustments: | |||||||||||||
Foreign currency translation adjustment | N/A | (33,191 | ) | — | (33,191 | ) | |||||||
Interest rate swaps: | |||||||||||||
Reclassification adjustments: | |||||||||||||
Amortization of cash flow hedges | Interest expense | 626 | 240 | 386 | |||||||||
Total other comprehensive income (loss) | $ | 371,224 | $ | 155,295 | $ | 215,929 | |||||||
The following table provides a summary of the changes in accumulated other comprehensive (loss) income for the years presented:
Pension and Other Postretirement Benefit Plans, net of tax | Foreign Currency Translation | Interest Rate Swap, net of tax | Total | ||||||||||||
(In thousands) | |||||||||||||||
Balance as of June 30, 2012 | $ | (823,901 | ) | $ | 170,749 | $ | (9,714 | ) | $ | (662,866 | ) | ||||
Other comprehensive income before reclassification adjustments | 192,726 | (33,191 | ) | — | 159,535 | ||||||||||
Amounts reclassified from accumulated other comprehensive loss | 56,008 | — | 386 | 56,394 | |||||||||||
Balance as of June 29, 2013 | (575,167 | ) | 137,558 | (9,328 | ) | (446,937 | ) | ||||||||
Other comprehensive income before reclassification adjustments | (127,728 | ) | (3,106 | ) | (82,215 | ) | (213,049 | ) | |||||||
Amounts reclassified from accumulated other comprehensive loss | 16,938 | — | 385 | 17,323 | |||||||||||
Balance as of June 28, 2014 | (685,957 | ) | 134,452 | (91,158 | ) | (642,663 | ) | ||||||||
Other comprehensive income before reclassification adjustments | (38,275 | ) | (232,185 | ) | (34,111 | ) | (304,571 | ) | |||||||
Amounts reclassified from accumulated other comprehensive loss | 18,921 | — | 5,116 | 24,037 | |||||||||||
Balance as of June 27, 2015 | $ | (705,311 | ) | $ | (97,733 | ) | $ | (120,153 | ) | $ | (923,197 | ) | |||
85
18. SHARE-BASED COMPENSATION
Sysco provides compensation benefits to employees and non-employee directors under several share-based payment arrangements including various employee stock option plans, a non-employee director plan and the Employees’ Stock Purchase Plan.
Stock Incentive Plans
In November 2013, Sysco’s Long-term Incentive Plan (2013 Plan) was adopted and reserved up to 55,600,000 shares of Sysco common stock for share-based awards to employees, non-employee directors and key advisors. Of the 55,600,000 authorized shares, the full 55,600,000 shares may be issued as options or stock appreciation rights and up to 17,500,000 shares may be issued as restricted stock, restricted stock units or other types of stock-based awards. To date, Sysco has issued options and restricted stock units under this plan. Vesting requirements for awards under this plan will vary by individual grant and may include either time-based vesting or time-based vesting subject to acceleration based on performance criteria for fiscal periods of at least one year. The contractual life of all options granted under this plan will be no greater than ten years. As of June 27, 2015, there were 43,562,619 remaining shares authorized and available for grant in total under the 2013 Plan, of which the full 43,562,619 shares may be issued as options or stock appreciation rights, or as a combination of up to 15,115,359 shares that may be issued as restricted stock, restricted stock units or other types of stock-based awards, with the remainder available for issuance as options or stock appreciation rights.
Sysco has also granted employee options under several previous employee stock option plans for which previously granted options remain outstanding as of June 27, 2015. No new options will be issued under any of the prior plans, as future grants to employees will be made through the 2013 Plan or subsequently adopted plans. Awards under these plans are subject to time-based vesting with vesting periods that vary by individual grant. The contractual life of all options granted under these plans is seven years.
In November 2009, Sysco’s 2009 Non-Employee Directors Stock Plan was adopted and provides for the issuance of up to 750,000 shares of Sysco common stock for share-based awards to non-employee directors. The authorized shares may be granted as restricted stock, restricted stock units, elected shares or additional shares. Vesting requirements for awards under these plans vary by individual grant and include either time-based vesting or vesting based on performance criteria. As of June 27, 2015, there were a total of 346,286 remaining shares authorized and available for grant under the 2009 Non-Employee Directors Stock Plan.
Stock Options
Sysco’s option awards are subject to graded vesting over a service period. Sysco recognizes compensation cost on a straight-line basis over the requisite service period for the entire award.
In addition, certain of Sysco’s options provide that the options continue to vest as if the optionee continued to be an employee or director if the optionee meets certain age and years of service thresholds upon retirement. In these cases, Sysco will recognize compensation cost for such awards over the period from the grant date to the date the employee or director first becomes eligible to retire with the options continuing to vest after retirement.
The fair value of each option award is estimated as of the date of grant using a Black-Scholes option pricing model. The weighted average assumptions for the periods indicated are noted in the following table. Expected volatility is based on historical volatility of Sysco’s stock, implied volatilities from traded options on Sysco’s stock and other factors. Sysco utilizes historical data to estimate option exercise and employee termination behavior within the valuation model; separate groups of employees that have similar historical exercise behavior are considered separately for valuation purposes. Expected dividend yield is estimated based on the historical pattern of dividends and the average stock price for the year preceding the option grant. The risk-free rate for the expected term of the option is based on the U.S. Treasury yield curve in effect at the time of grant.
The following weighted-average assumptions were used for each fiscal year presented:
2015 | 2014 | 2013 | ||||||
Dividend yield | 3.2 | % | 3.5 | % | 3.7 | % | ||
Expected volatility | 20.7 | % | 20.4 | % | 20.7 | % | ||
Risk-free interest rate | 2.0 | % | 2.1 | % | 0.7 | % | ||
Expected life | 7.3 years | 7.2 years | 5.4 years | |||||
86
The following summary presents information regarding outstanding options as of June 27, 2015 and changes during the fiscal year then ended with regard to options under all stock incentive plans:
Shares Under Option | Weighted Average Exercise Price Per Share | Weighted Average Remaining Contractual Term (in years) | Aggregate Intrinsic Value (in thousands) | |||||||||
Outstanding as of June 28, 2014 | 27,469,911 | $ | 29.59 | |||||||||
Granted | 4,497,954 | 38.89 | ||||||||||
Exercised | (6,054,528 | ) | 29.31 | |||||||||
Forfeited | (85,550 | ) | 29.33 | |||||||||
Expired | (35,409 | ) | 33.22 | |||||||||
Outstanding as of June 27, 2015 | 25,792,378 | $ | 31.28 | 5.21 | $ | 185,242 | ||||||
Vested or expected to vest as of June 27, 2015 | 25,575,542 | $ | 31.24 | 5.18 | $ | 184,526 | ||||||
Exercisable as of June 27, 2015 | 9,902,719 | $ | 28.54 | 3.05 | $ | 97,362 | ||||||
The total number of employee options granted was 4,497,954, 5,575,645 and 6,212,716 in fiscal years 2015, 2014 and 2013, respectively. During fiscal 2015, 1,286,533 options were granted to 6 executive officers and 3,211,421 options were granted to approximately 173 other key employees. During fiscal 2014, 2,159,698 options were granted to 11 executive officers and 3,415,947 options were granted to approximately 167 other key employees. During fiscal 2013, 2,351,720 options were granted to 11 executive officers and 3,860,996 options were granted to approximately 152 other key employees.
The weighted average grant-date fair value of options granted in fiscal 2015, 2014 and 2013 was $5.78, $4.64 and $3.20, respectively. The total intrinsic value of options exercised during fiscal 2015, 2014 and 2013 was $21.6 million, $19.1 million and $24.1 million, respectively.
Restricted Stock Units
During fiscal 2015, 2014 and 2013, 1,198,588, 1,322,709 and 1,722,835 restricted stock units, respectively, were granted to employees, the majority of which will vest ratably over a three-year period. Some of these restricted stock units were granted with dividend equivalents. The fair value of each restricted stock unit award granted with a dividend equivalent is based on the company’s stock price as of the date of grant. For restricted stock unit awards granted without dividend equivalents, the fair value was reduced by the present value of expected dividends during the vesting period. The weighted average grant-date fair value per share of restricted stock units granted during fiscal 2015, 2014 and 2013 was $37.59, $33.39 and $29.75, respectively. The total fair value of restricted stock units vested during fiscal 2015, 2014 and 2013 was $52.5 million, $39.4 million and $27.6 million, respectively.
Non-Employee Director Awards
During fiscal 2015, 2014 and 2013, 37,035, 43,119 and 48,069 shares, respectively, of restricted awards were granted to non-employee directors that will vest over a one-year period. Non-employee directors may elect to receive these awards in restricted stock shares that will vest at the end of the award stated vesting period or as deferred units which convert into shares of Sysco common stock upon a date selected by the non-employee director that is subsequent to the award stated vesting date. The fair value of the restricted awards is based on the company’s stock price as of the date of grant. The weighted average grant-date fair value of the shares granted during fiscal 2015, 2014 and 2013 was $38.89, $33.40 and $29.96, respectively. The total fair value of restricted stock shares vested and deferred units distributed during fiscal 2015, 2014 and 2013 was $1.6 million, $1.4 million and $1.9 million, respectively. Restricted stock shares are valued on their vesting date. Vested deferred units are valued on their subsequent conversion and distribution date.
Non-employee directors may elect to receive up to 100% of their annual directors’ fees in Sysco common stock on either an annual or deferred basis. Sysco provides a matching grant of 50% of the number of shares received for the stock election subject to certain limitations. As a result of such elections, a total of 23,949, 24,565 and 26,702 shares with a weighted-average grant date fair value of $38.26, $34.59 and $30.38 per share were issued in fiscal 2015, 2014 and 2013, respectively, in the form of fully vested common stock or deferred units. The total fair value of common stock issued as a result of election shares and deferred units distributed during fiscal 2015, 2014 and 2013 was $0.9 million, $0.8 million and $0.5 million, respectively. Common stock shares are valued on their vesting date. Vested deferred units are valued on their subsequent conversion and distribution date.
87
As of June 27, 2015, there were 104,605 fully vested deferred units outstanding that will convert into shares of Sysco common stock upon dates selected by the respective non-employee directors.
Summary of Non-vested Awards
The following summary presents information regarding outstanding non-vested awards as of June 27, 2015 and changes during the fiscal year then ended with regard to these awards under the stock incentive plans. Award types represented include: restricted stock units granted to employees and restricted awards granted to non-employee directors.
Shares | Weighted Average Grant Date Fair Value Per Share | |||||
Nonvested as of June 28, 2014 | 2,918,405 | $ | 31.06 | |||
Granted | 1,235,940 | 37.63 | ||||
Vested | (1,396,269 | ) | 30.40 | |||
Forfeited | (60,422 | ) | 32.90 | |||
Nonvested as of June 27, 2015 | 2,697,654 | $ | 34.37 | |||
Employees’ Stock Purchase Plan
Sysco has an Employees’ Stock Purchase Plan that permits employees to invest in Sysco common stock by means of periodic payroll deductions at a discount of 15% from the closing price on the last business day of each calendar quarter. The total number of shares which may be sold pursuant to the plan may not exceed 79,000,000 shares, of which 1,211,657 remained available as of June 27, 2015.
During fiscal 2015, 1,243,275 shares of Sysco common stock were purchased by the participants, as compared to 1,315,535 shares purchased in fiscal 2014 and 1,470,271 shares purchased in fiscal 2013. The weighted average fair value of employee stock purchase rights issued pursuant to the Employees’ Stock Purchase Plan was $5.73, $5.17 and $4.78 per share during fiscal 2015, 2014 and 2013, respectively. The fair value of the stock purchase rights was calculated as the difference between the stock price at date of issuance and the employee purchase price.
All Share-Based Payment Arrangements
The total share-based compensation cost that has been recognized in results of operations was $73.8 million, $74.3 million and $70.1 million for fiscal 2015, 2014 and 2013, respectively, and is included within operating expenses in the consolidated results of operations. The total income tax benefit recognized in results of operations for share-based compensation arrangements was $27.4 million, $28.1 million and $29.9 million for fiscal 2015, 2014 and 2013, respectively.
As of June 27, 2015, there was $69.4 million of total unrecognized compensation cost related to share-based compensation arrangements. That cost is expected to be recognized over a weighted-average period of 2.42 years.
Cash received from option exercises and purchases of shares under the Employees’ Stock Purchase Plan was $240.2 million, $255.6 million and $628.7 million during fiscal 2015, 2014 and 2013, respectively. The actual tax benefit realized for the tax deductions from option exercises totaled $20.7 million, $16.6 million and $24.0 million during fiscal 2015, 2014 and 2013, respectively.
19. INCOME TAXES
Income Tax Provisions
For financial reporting purposes, earnings before income taxes consists of the following:
2015 | 2014 | 2013 | |||||||||
(In thousands) | |||||||||||
U.S. | $ | 818,244 | $ | 1,287,371 | $ | 1,351,947 | |||||
Foreign | 189,903 | 188,253 | 195,508 | ||||||||
Total | $ | 1,008,147 | $ | 1,475,624 | $ | 1,547,455 | |||||
88
The income tax provision / (benefit) for each fiscal year consists of the following:
2015 | 2014 | 2013 | |||||||||
(In thousands) | |||||||||||
U.S. federal income taxes | $ | 285,807 | $ | 433,795 | $ | 439,667 | |||||
State and local income taxes | (2,737 | ) | 55,736 | 69,759 | |||||||
Foreign income taxes | 38,304 | 54,560 | 45,602 | ||||||||
Total | $ | 321,374 | $ | 544,091 | $ | 555,028 | |||||
The current and deferred components of the income tax provisions for each fiscal year are as follows:
2015 | 2014 | 2013 | |||||||||
(In thousands) | |||||||||||
Current | $ | 327,639 | $ | 574,760 | $ | 582,889 | |||||
Deferred | (6,265 | ) | (30,669 | ) | (27,861 | ) | |||||
Total | $ | 321,374 | $ | 544,091 | $ | 555,028 | |||||
The deferred tax provisions result from the effects of net changes during the year in deferred tax assets and liabilities arising from temporary differences between the carrying amounts of assets and liabilities for financial reporting purposes and the amounts used for income tax purposes.
Deferred Tax Assets and Liabilities
Significant components of Sysco’s deferred tax assets and liabilities are as follows:
June 27, 2015 | June 28, 2014 | ||||||
(In thousands) | |||||||
Deferred tax liabilities: | |||||||
Excess tax depreciation and basis differences of assets | $ | 381,875 | $ | 416,417 | |||
Goodwill and intangible assets | 224,943 | 211,434 | |||||
Other | 23,449 | 15,171 | |||||
Total deferred tax liabilities | 630,267 | 643,022 | |||||
Deferred tax assets: | |||||||
Net operating tax state loss carryforwards | 47,958 | 20,123 | |||||
Benefit on unrecognized tax benefits | 16,270 | 22,170 | |||||
Pension | 264,780 | 287,046 | |||||
Share-based compensation | 42,569 | 41,262 | |||||
Deferred compensation | 35,573 | 33,280 | |||||
Self-insured liabilities | 65,617 | 65,002 | |||||
Receivables | 38,410 | 47,688 | |||||
Inventory | 68,186 | 62,799 | |||||
Cash flow hedge | 74,900 | 56,826 | |||||
Other | 29,667 | 26,471 | |||||
Total deferred tax assets | 683,930 | 662,667 | |||||
Total net deferred tax (assets) | $ | (53,663 | ) | $ | (19,645 | ) | |
The company’s net operating tax loss carryforwards as of June 27, 2015 and June 28, 2014 consisted primarily of state net operating tax loss carryforwards. The state net operating tax loss carryforwards outstanding as of June 27, 2015 expire in fiscal years 2017 through 2035. There were no valuation allowances recorded for the state tax loss carryforwards as of June 27, 2015 and June 28, 2014 because management believes it is more likely than not that these benefits will be realized based on utilization forecasts.
89
Effective Tax Rates
Reconciliations of the statutory federal income tax rate to the effective income tax rates for each fiscal year are as follows:
2015 | 2014 | 2013 | ||||||
U.S. statutory federal income tax rate | 35.00 | % | 35.00 | % | 35.00 | % | ||
State and local income taxes, net of any applicable federal income tax benefit | 0.91 | 2.82 | 2.59 | |||||
Foreign tax rate differential | (2.84 | ) | (1.66 | ) | (1.22 | ) | ||
Other | (1.19 | ) | 0.71 | (0.50 | ) | |||
31.88 | % | 36.87 | % | 35.87 | % | |||
The effective tax rate of 31.9% for fiscal 2015 was favorably impacted by lower earnings in the U.S. primarily due to costs associated with the termination of the US Foods proposed merger. The lower U.S. earnings resulted in a more significant favorable impact on the effective tax rate from the indefinitely reinvested foreign earnings due to lower foreign statutory tax rates as compared to the domestic tax rate. The additional cost associated with the proposed US Foods merger resulted in lower state taxes.
The effective tax rate of 36.9% for fiscal 2014 was negatively impacted primarily by two items. First, a non-deductible penalty, that the company incurred, had an unfavorable tax impact of $6.2 million. Second, we recorded net tax expense of $5.2 million for tax and interest related to various federal, foreign and state uncertain tax positions. This negative impact was partially offset by the recording of $5.7 million of tax benefit related to disqualifying dispositions of Sysco stock pursuant to share-based compensation arrangements. Indefinitely reinvested earnings taxed at foreign statutory rates less than our domestic tax rate also had the impact of reducing the effective tax rate.
The effective tax rate for fiscal 2013 was 35.9%. Indefinitely reinvested earnings taxed at foreign statutory tax rates that are lower than our domestic tax rate had the impact of reducing the effective tax rate.
Uncertain Tax Positions
A reconciliation of the beginning and ending amount of gross unrecognized tax benefits, excluding interest and penalties, is as follows:
2015 | 2014 | ||||||
(In thousands) | |||||||
Unrecognized tax benefits at beginning of year | $ | 49,180 | $ | 108,337 | |||
Additions for tax positions related to prior years | 797 | 2,128 | |||||
Reductions for tax positions related to prior years | (8,001 | ) | (41,802 | ) | |||
Reductions due to settlements with taxing authorities | (4,430 | ) | (19,483 | ) | |||
Unrecognized tax benefits at end of year | $ | 37,546 | $ | 49,180 | |||
As of June 27, 2015, the gross amount of liability for accrued interest and penalties related to unrecognized tax benefits was $33.4 million. The expense recorded for interest and penalties related to unrecognized tax benefits in fiscal 2015 was not material.
As of June 28, 2014, the gross amount of liability for accrued interest and penalties related to unrecognized tax benefits was $36.7 million. The expense recorded for interest and penalties related to unrecognized tax benefits in fiscal 2014 was $14.8 million. In the fourth quarter of fiscal 2014, we reclassified a receivable that would arise upon the resolution of an unrecognized tax benefit from a gross position in other assets to a net position in other long-term liabilities on our consolidated balance sheet due to a change in circumstances related to transfer pricing positions
If Sysco were to recognize all unrecognized tax benefits recorded as of June 27, 2015, approximately $27.7 million of the $37.5 million reserve would reduce the effective tax rate. If Sysco were to recognize all unrecognized tax benefits recorded as of June 28, 2014, approximately $35.1 million of the $49.2 million reserve would reduce the effective tax rate. It is reasonably possible that the amount of the unrecognized tax benefits with respect to certain of the company’s unrecognized tax positions will increase or decrease in the next twelve months either because Sysco’s positions are sustained on audit or because the company agrees to their disallowance. Items that may cause changes to unrecognized tax benefits primarily include the consideration of
90
various filing requirements in various states and the allocation of income and expense between tax jurisdictions. In addition, the amount of unrecognized tax benefits recognized within the next twelve months may decrease due to the expiration of the statute of limitations for certain years in various jurisdictions; however, it is possible that a jurisdiction may open an audit on one of these years prior to the statute of limitations expiring. At this time, an estimate of the range of the reasonably possible change cannot be made.
The IRS has open audits for Sysco’s 2006, 2007, 2008 and 2009 federal income tax returns. As of June 27, 2015, Sysco’s tax returns in the majority of the state and local jurisdictions and Canada are no longer subject to audit for the years before 2009. However, in Canada, the company remains open to transfer pricing adjustments back to 2003 for some entities. Certain tax jurisdictions require partial to full payment on audit assessments or the posting of letters of credit in order to proceed to the appeals process. Although the outcome of tax audits is generally uncertain, the company believes that adequate amounts of tax, including interest and penalties, have been accrued for any adjustments that may result from those open years.
Other
Undistributed income of certain consolidated foreign subsidiaries at June 27, 2015 amounted to $1.1 billion for which no deferred U.S. income tax provision has been recorded because Sysco intends to permanently reinvest such income in those foreign operations. An estimate of any U.S. income or foreign withholding taxes that may be applicable upon actual or deemed repatriation is not practical due to the complexities associated with the hypothetical calculation.
20. COMMITMENTS AND CONTINGENCIES
Legal Proceedings
Sysco is engaged in various legal proceedings which have arisen but have not been fully adjudicated. The likelihood of loss for these legal proceedings, based on definitions within contingency accounting literature, ranges from remote to reasonably possible to probable. When probable and reasonably estimable, the losses have been accrued. Based on estimates of the range of potential losses associated with these matters, management does not believe the ultimate resolution of these proceedings, either individually or in the aggregate, will have a material adverse effect upon the consolidated financial position or results of operations of the company. However, the final results of legal proceedings cannot be predicted with certainty and if the company failed to prevail in one or more of these legal matters, and the associated realized losses were to exceed the company’s current estimates of the range of potential losses, the company’s consolidated financial position or results of operations could be materially adversely affected in future periods.
Fuel Commitments
Sysco routinely enters into forward purchase commitments for a portion of its projected diesel fuel requirements. As of June 27, 2015, we had forward diesel fuel commitments totaling approximately $99.3 million through June 2016.
Other Commitments
Sysco has committed to aggregate product purchases for resale in order to benefit from a centralized approach to purchasing. A majority of these agreements expire within one year; however, certain agreements have terms through fiscal 2019. These agreements commit the company to a minimum volume at various pricing terms, including fixed pricing, variable pricing or a combination thereof. Minimum amounts committed to as of June 27, 2015 totaled approximately $3.4 billion. Minimum amounts committed to by year are as follows:
Amount | |||
(In thousands) | |||
2016 | $ | 2,553,305 | |
2017 | 818,521 | ||
2018 | 29,035 | ||
2019 | 2,863 | ||
2020 | 2,863 | ||
2021 | 1,491 | ||
Sysco has contracts with various third party service providers to receive information technology services. The services have been committed for periods up to fiscal 2019 and may be extended. As of June 27, 2015, the total remaining cost of the
91
services over that period is expected to be approximately $485.5 million. A portion of this committed amount may be reduced by Sysco utilizing less than estimated resources and can be increased by Sysco utilizing more than estimated resources. Certain agreements allow adjustments for inflation. Sysco may also cancel a portion or all of the services provided subject to termination fees that decrease over time. If Sysco were to terminate all of the services in fiscal 2016, the estimated termination fees incurred in fiscal 2016 would be approximately $18.1 million.
21. BUSINESS SEGMENT INFORMATION
The company has aggregated its operating companies into two reporting segments, Broadline and SYGMA, as defined in the accounting literature related to disclosures about segments of an enterprise. The Broadline reportable segment is an aggregation of the company’s U.S. and International Broadline segments located in the Bahamas, Canada, Costa Rica and Ireland. Broadline operating companies distribute a full line of food products and a wide variety of non-food products to both traditional and chain restaurant customers, hospitals, schools, hotels, industrial caterers and other venues where foodservice products are served. SYGMA operating companies distribute a full line of food products and a wide variety of non-food products to certain chain restaurant customer locations. "Other" financial information is attributable to the company's other operating segments, including the company's specialty produce, custom-cut meat operations, lodging industry segments, a company that distributes specialty imported products, a company that distributes to international customers and the company’s Sysco Ventures platform, which includes a suite of technology solutions that help support the business needs of Sysco’s customers. In fiscal 2015, our leadership structure was realigned and now our custom-cut meat operations no longer report through our U.S. broadline leadership. As a result, these operations are no longer included in our Broadline segment and now reported in "Other." Prior year amounts have been reclassified to conform to the current year presentation.
The accounting policies for the segments are the same as those disclosed by Sysco for its consolidated financial statements. Intersegment sales primarily represent products the Broadline and SYGMA operating companies procured from the specialty produce, custom-cut meat operations, imported specialty products and a company that distributes to international customers. Management evaluates the performance of each of the operating segments based on its respective operating income results. Corporate expenses and adjustments generally include all expenses of the corporate office and Sysco’s shared service center. These also include all share-based compensation costs.
92
The following table sets forth the financial information for Sysco’s business segments:
Fiscal Year | |||||||||||
2015 | 2014 | 2013 | |||||||||
(In thousands) | |||||||||||
Sales: | |||||||||||
Broadline | $ | 38,652,211 | $ | 36,808,051 | $ | 35,284,529 | |||||
SYGMA | 6,076,215 | 6,177,804 | 5,780,103 | ||||||||
Other | 5,270,518 | 4,678,954 | 4,388,261 | ||||||||
Intersegment sales | (1,318,192 | ) | (1,148,097 | ) | (1,041,660 | ) | |||||
Total | $ | 48,680,752 | $ | 46,516,712 | $ | 44,411,233 | |||||
Operating income: | |||||||||||
Broadline | $ | 2,567,954 | $ | 2,426,908 | $ | 2,361,442 | |||||
SYGMA | 20,521 | 38,048 | 52,016 | ||||||||
Other | 135,885 | 142,419 | 139,337 | ||||||||
Total segments | 2,724,360 | 2,607,375 | 2,552,795 | ||||||||
Corporate expenses and adjustments | (1,494,998 | ) | (1,020,253 | ) | (894,317 | ) | |||||
Total operating income | 1,229,362 | 1,587,122 | 1,658,478 | ||||||||
Interest expense | 254,807 | 123,741 | 128,495 | ||||||||
Other expense (income), net | (33,592 | ) | (12,243 | ) | (17,472 | ) | |||||
Earnings before income taxes | $ | 1,008,147 | $ | 1,475,624 | $ | 1,547,455 | |||||
Depreciation and amortization: | |||||||||||
Broadline | $ | 278,553 | $ | 296,267 | $ | 303,084 | |||||
SYGMA | 29,753 | 28,164 | 28,059 | ||||||||
Other | 54,086 | 41,704 | 38,721 | ||||||||
Total segments | 362,392 | 366,135 | 369,864 | ||||||||
Corporate | 218,572 | 189,927 | 142,684 | ||||||||
Total | $ | 580,964 | $ | 556,062 | $ | 512,548 | |||||
Capital expenditures: | |||||||||||
Broadline | $ | 199,831 | $ | 276,314 | $ | 265,578 | |||||
SYGMA | 36,948 | 34,671 | 18,078 | ||||||||
Other | 69,193 | 101,128 | 66,182 | ||||||||
Total segments | 305,972 | 412,113 | 349,838 | ||||||||
Corporate | 236,858 | 111,093 | 162,024 | ||||||||
Total | $ | 542,830 | $ | 523,206 | $ | 511,862 | |||||
Assets: | |||||||||||
Broadline | $ | 7,730,239 | $ | 8,611,776 | $ | 9,893,743 | |||||
SYGMA | 512,044 | 513,587 | 485,520 | ||||||||
Other | 1,415,038 | 1,379,910 | 1,279,119 | ||||||||
Total segments | 9,657,321 | 10,505,273 | 11,658,382 | ||||||||
Corporate | 8,331,960 | 2,635,840 | 1,007,384 | ||||||||
Total | $ | 17,989,281 | $ | 13,141,113 | $ | 12,665,766 | |||||
93
The sales mix for the principal product categories for each fiscal year is as follows:
Fiscal Year | |||||||||||
2015 | 2014 | 2013 | |||||||||
(In thousands) | |||||||||||
Fresh and frozen meats | $ | 10,080,290 | $ | 8,809,148 | $ | 8,242,423 | |||||
Canned and dry products | 7,999,250 | 8,383,007 | 8,310,634 | ||||||||
Frozen fruits, vegetables, bakery and other | 6,339,537 | 6,196,362 | 6,023,990 | ||||||||
Dairy products | 5,199,036 | 4,956,895 | 4,669,986 | ||||||||
Poultry | 5,189,496 | 4,814,949 | 4,580,445 | ||||||||
Fresh produce | 3,828,298 | 3,725,108 | 3,540,027 | ||||||||
Paper and disposables | 3,507,007 | 3,438,074 | 3,364,965 | ||||||||
Seafood | 2,490,523 | 2,401,021 | 2,167,588 | ||||||||
Beverage products | 1,754,944 | 1,671,000 | 1,643,034 | ||||||||
Janitorial products | 1,102,855 | 1,050,187 | 1,013,488 | ||||||||
Equipment and smallwares | 661,254 | 678,454 | 637,680 | ||||||||
Medical supplies | 528,262 | 392,507 | 216,973 | ||||||||
Total | $ | 48,680,752 | $ | 46,516,712 | $ | 44,411,233 | |||||
Information concerning geographic areas is as follows:
Fiscal Year | |||||||||||
2015 | 2014 | 2013 | |||||||||
(In thousands) | |||||||||||
Sales: (1) | |||||||||||
U.S. | $ | 43,146,591 | $ | 40,612,963 | $ | 38,985,715 | |||||
Canada | 4,727,742 | 4,923,672 | 4,698,814 | ||||||||
Other | 806,419 | 980,077 | 726,704 | ||||||||
Total | $ | 48,680,752 | $ | 46,516,712 | $ | 44,411,233 | |||||
Long-lived assets: (2) | |||||||||||
U.S. | $ | 3,519,610 | $ | 3,520,449 | $ | 3,593,346 | |||||
Canada | 317,231 | 347,440 | 307,605 | ||||||||
Other | 145,302 | 117,729 | 77,120 | ||||||||
Total | $ | 3,982,143 | $ | 3,985,618 | $ | 3,978,071 | |||||
(1) Represents sales to external customers from businesses operating in these countries.
(2) Long-lived assets represents net property, plant and equipment reported in the country in which they are held.
22. SUPPLEMENTAL GUARANTOR INFORMATION – SUBSIDIARY GUARANTEES
On January 19, 2011, the wholly-owned U.S. Broadline subsidiaries of Sysco Corporation entered into full and unconditional guarantees of all outstanding senior notes and debentures of Sysco Corporation. Borrowings under the company’s revolving credit facility supporting the company’s U.S. and Canadian commercial paper programs are also covered under these guarantees. As of June 27, 2015, Sysco had a total of $7.3 billion in senior notes, debentures and commercial paper outstanding that was covered by these guarantees, including the $5 billion of senior notes issued in October 2014. See Note 11, "Debt and Other Financing Arrangements," for further discussion of the October 2014 senior notes issuance. All subsidiary guarantors are 100%-owned by the parent company, all guarantees are full and unconditional and all guarantees are joint and several, except that the guarantee of any subsidiary guarantor with respect to a series of senior notes or debentures may be released under certain customary circumstances. If we exercise our defeasance option with respect to the senior notes or debentures of any series, then any subsidiary guarantor effectively will be released with respect to that series. Further, each subsidiary guarantee will remain in full force and effect until the earliest to occur of the date, if any, on which (1) the applicable subsidiary guarantor shall consolidate with or merge into Sysco Corporation or any successor of Sysco Corporation and (2) Sysco Corporation or any successor of Sysco Corporation consolidates with or merges into the applicable subsidiary guarantor.
94
The following condensed consolidating financial statements present separately the financial position, comprehensive income and cash flows of the parent issuer (Sysco Corporation), the guarantors (the majority of the company's U.S. Broadline subsidiaries) and all other non-guarantor subsidiaries of Sysco (Other Non-Guarantor Subsidiaries) on a combined basis with eliminating entries.
Condensed Consolidating Balance Sheet | |||||||||||||||||||
June 27, 2015 | |||||||||||||||||||
Sysco | Certain U.S. Broadline Subsidiaries | Other Non-Guarantor Subsidiaries | Eliminations | Consolidated Totals | |||||||||||||||
(In thousands) | |||||||||||||||||||
Current assets | $ | 4,894,387 | $ | 4,012,924 | $ | 2,586,993 | $ | 11,494,304 | |||||||||||
Investment in subsidiaries | 9,088,455 | — | — | (9,088,455 | ) | — | |||||||||||||
Plant and equipment, net | 510,285 | 1,694,659 | 1,777,199 | 3,982,143 | |||||||||||||||
Other assets | 371,802 | 522,566 | 1,618,466 | 2,512,834 | |||||||||||||||
Total assets | $ | 14,864,929 | $ | 6,230,149 | $ | 5,982,658 | $ | (9,088,455 | ) | $ | 17,989,281 | ||||||||
Current liabilities | $ | 5,851,364 | $ | 1,658,558 | $ | 1,889,693 | $ | 9,399,615 | |||||||||||
Intercompany payables (receivables) | 973,497 | (1,996,915 | ) | 1,023,418 | — | ||||||||||||||
Long-term debt | 2,154,923 | 10,121 | 106,781 | 2,271,825 | |||||||||||||||
Other liabilities | 624,795 | 278,458 | 113,060 | 1,016,313 | |||||||||||||||
Noncontrolling interest | — | — | 41,304 | $ | 41,304 | ||||||||||||||
Shareholders’ equity | 5,260,350 | 6,279,927 | 2,808,402 | (9,088,455 | ) | 5,260,224 | |||||||||||||
Total liabilities and shareholders’ equity | $ | 14,864,929 | $ | 6,230,149 | $ | 5,982,658 | $ | (9,088,455 | ) | $ | 17,989,281 | ||||||||
Condensed Consolidating Balance Sheet | |||||||||||||||||||
June 28, 2014 | |||||||||||||||||||
Sysco | Certain U.S. Broadline Subsidiaries | Other Non-Guarantor Subsidiaries | Eliminations | Consolidated Totals | |||||||||||||||
(In thousands) | |||||||||||||||||||
Current assets | $ | 254,766 | $ | 3,928,660 | $ | 2,498,546 | $ | — | $ | 6,681,972 | |||||||||
Investment in subsidiaries | 8,013,214 | — | — | (8,013,214 | ) | — | |||||||||||||
Plant and equipment, net | 496,953 | 1,783,262 | 1,705,403 | — | 3,985,618 | ||||||||||||||
Other assets | 317,208 | 524,468 | 1,631,847 | — | 2,473,523 | ||||||||||||||
Total assets | $ | 9,082,141 | $ | 6,236,390 | $ | 5,835,796 | $ | (8,013,214 | ) | $ | 13,141,113 | ||||||||
Current liabilities | $ | 793,240 | $ | 1,008,366 | $ | 2,566,024 | $ | — | $ | 4,367,630 | |||||||||
Intercompany payables (receivables) | 20,107 | (239,539 | ) | 219,432 | — | — | |||||||||||||
Long-term debt | 2,321,721 | 14,094 | 21,515 | — | 2,357,330 | ||||||||||||||
Other liabilities | 680,378 | 328,185 | 140,895 | — | 1,149,458 | ||||||||||||||
Shareholders’ equity | 5,266,695 | 5,125,284 | 2,887,930 | (8,013,214 | ) | 5,266,695 | |||||||||||||
Total liabilities and shareholders’ equity | $ | 9,082,141 | $ | 6,236,390 | $ | 5,835,796 | $ | (8,013,214 | ) | $ | 13,141,113 | ||||||||
95
Condensed Consolidating Statement of Comprehensive Income | |||||||||||||||||||
Year Ended June 27, 2015 | |||||||||||||||||||
Sysco | Certain U.S. Broadline Subsidiaries | Other Non-Guarantor Subsidiaries | Eliminations | Consolidated Totals | |||||||||||||||
(In thousands) | |||||||||||||||||||
Sales | $ | — | $ | 32,626,221 | $ | 17,477,986 | $ | (1,423,455 | ) | $ | 48,680,752 | ||||||||
Cost of sales | — | 26,572,257 | 14,980,434 | (1,423,455 | ) | 40,129,236 | |||||||||||||
Gross profit | — | 6,053,964 | 2,497,552 | — | 8,551,516 | ||||||||||||||
Operating expenses | 1,232,956 | 3,709,320 | 2,379,878 | — | 7,322,154 | ||||||||||||||
Operating income (loss) | (1,232,956 | ) | 2,344,644 | 117,674 | — | 1,229,362 | |||||||||||||
Interest expense (income) | 323,918 | (108,233 | ) | 39,122 | — | 254,807 | |||||||||||||
Other expense (income), net | (9,496 | ) | (3,609 | ) | (20,487 | ) | — | (33,592 | ) | ||||||||||
Earnings (losses) before income taxes | (1,547,378 | ) | 2,456,486 | 99,039 | — | 1,008,147 | |||||||||||||
Income tax (benefit) provision | (493,263 | ) | 783,066 | 31,571 | — | 321,374 | |||||||||||||
Equity in earnings of subsidiaries | 1,740,888 | — | — | (1,740,888 | ) | — | |||||||||||||
Net earnings | 686,773 | 1,673,420 | 67,468 | (1,740,888 | ) | 686,773 | |||||||||||||
Other comprehensive income (loss) | (280,534 | ) | (232,185 | ) | 232,185 | (280,534 | ) | ||||||||||||
Comprehensive income | $ | 406,239 | $ | 1,673,420 | $ | (164,717 | ) | $ | (1,508,703 | ) | $ | 406,239 | |||||||
Condensed Consolidating Statement of Comprehensive Income | |||||||||||||||||||
Year Ended June 28, 2014 | |||||||||||||||||||
Sysco | Certain U.S. Broadline Subsidiaries | Other Non-Guarantor Subsidiaries | Eliminations | Consolidated Totals | |||||||||||||||
(In thousands) | |||||||||||||||||||
Sales | $ | — | $ | 30,741,979 | $ | 16,979,494 | $ | (1,204,761 | ) | $ | 46,516,712 | ||||||||
Cost of sales | — | 24,990,377 | 14,550,061 | (1,204,761 | ) | 38,335,677 | |||||||||||||
Gross profit | — | 5,751,602 | 2,429,433 | — | 8,181,035 | ||||||||||||||
Operating expenses | 804,177 | 3,520,577 | 2,269,159 | — | 6,593,913 | ||||||||||||||
Operating income (loss) | (804,177 | ) | 2,231,025 | 160,274 | — | 1,587,122 | |||||||||||||
Interest expense (income) | 232,140 | (102,086 | ) | (6,313 | ) | — | 123,741 | ||||||||||||
Other expense (income), net | (7,434 | ) | 217 | (5,026 | ) | — | (12,243 | ) | |||||||||||
Earnings (losses) before income taxes | (1,028,883 | ) | 2,332,894 | 171,613 | — | 1,475,624 | |||||||||||||
Income tax (benefit) provision | (379,369 | ) | 860,184 | 63,276 | — | 544,091 | |||||||||||||
Equity in earnings of subsidiaries | 1,581,047 | — | — | (1,581,047 | ) | — | |||||||||||||
Net earnings | 931,533 | 1,472,710 | 108,337 | (1,581,047 | ) | 931,533 | |||||||||||||
Other comprehensive income (loss) | (195,726 | ) | — | (3,106 | ) | 3,106 | (195,726 | ) | |||||||||||
Comprehensive income | $ | 735,807 | $ | 1,472,710 | $ | 105,231 | $ | (1,577,941 | ) | $ | 735,807 | ||||||||
96
Condensed Consolidating Statement of Comprehensive Income | |||||||||||||||||||
Year Ended June 29, 2013 | |||||||||||||||||||
Sysco | Certain U.S. Broadline Subsidiaries | Other Non-Guarantor Subsidiaries | Eliminations | Consolidated Totals | |||||||||||||||
(In thousands) | |||||||||||||||||||
Sales | $ | — | $ | 30,162,329 | $ | 15,335,180 | $ | (1,086,276 | ) | $ | 44,411,233 | ||||||||
Cost of sales | — | 24,385,677 | 13,115,225 | (1,086,276 | ) | 36,414,626 | |||||||||||||
Gross profit | — | 5,776,652 | 2,219,955 | — | 7,996,607 | ||||||||||||||
Operating expenses | 694,323 | 3,610,907 | 2,032,899 | — | 6,338,129 | ||||||||||||||
Operating income (loss) | (694,323 | ) | 2,165,745 | 187,056 | — | 1,658,478 | |||||||||||||
Interest expense (income) | 298,474 | (177,421 | ) | 7,442 | — | 128,495 | |||||||||||||
Other expense (income), net | (12,864 | ) | (4,554 | ) | (54 | ) | — | (17,472 | ) | ||||||||||
Earnings (losses) before income taxes | (979,933 | ) | 2,347,720 | 179,668 | — | 1,547,455 | |||||||||||||
Income tax (benefit) provision | (351,474 | ) | 842,062 | 64,440 | — | 555,028 | |||||||||||||
Equity in earnings of subsidiaries | 1,620,886 | — | — | (1,620,886 | ) | — | |||||||||||||
Net earnings | 992,427 | 1,505,658 | 115,228 | (1,620,886 | ) | 992,427 | |||||||||||||
Other comprehensive income (loss) | 215,929 | — | (33,191 | ) | 33,191 | 215,929 | |||||||||||||
Comprehensive income | $ | 1,208,356 | $ | 1,505,658 | $ | 82,037 | $ | (1,587,695 | ) | $ | 1,208,356 | ||||||||
Condensed Consolidating Cash Flows | |||||||||||||||
Year Ended June 27, 2015 | |||||||||||||||
Sysco | Certain U.S. Broadline Subsidiaries | Other Non-Guarantor Subsidiaries | Consolidated Totals | ||||||||||||
(In thousands) | |||||||||||||||
Net cash provided by (used for): | |||||||||||||||
Operating activities | $ | (359,239 | ) | $ | 2,363,836 | $ | (449,113 | ) | $ | 1,555,484 | |||||
Investing activities | (160,234 | ) | (108,099 | ) | (386,013 | ) | (654,346 | ) | |||||||
Financing activities | 3,832,479 | (6,022 | ) | 71,105 | 3,897,562 | ||||||||||
Effect of exchange rate on cash | — | — | (81,702 | ) | (81,702 | ) | |||||||||
Intercompany activity | 1,379,112 | (2,251,109 | ) | 871,997 | — | ||||||||||
Net increase (decrease) in cash and cash equivalents | 4,692,118 | (1,394 | ) | 26,274 | 4,716,998 | ||||||||||
Cash and cash equivalents at beginning of the period | 158,957 | 27,772 | 226,317 | 413,046 | |||||||||||
Cash and cash equivalents at end of the period | $ | 4,851,075 | $ | 26,378 | $ | 252,591 | $ | 5,130,044 | |||||||
Condensed Consolidating Cash Flows | |||||||||||||||
Year Ended June 28, 2014 | |||||||||||||||
Sysco | Certain U.S. Broadline Subsidiaries | Other Non-Guarantor Subsidiaries | Consolidated Totals | ||||||||||||
(In thousands) | |||||||||||||||
Net cash provided by (used for): | |||||||||||||||
Operating activities | $ | (504,119 | ) | $ | 1,541,062 | $ | 455,872 | $ | 1,492,815 | ||||||
Investing activities | (51,290 | ) | (171,979 | ) | (353,569 | ) | (576,838 | ) | |||||||
Financing activities | (919,627 | ) | 3,872 | (103 | ) | (915,858 | ) | ||||||||
Effect of exchange rate on cash | — | — | 642 | 642 | |||||||||||
Intercompany activity | 1,426,402 | (1,369,478 | ) | (56,924 | ) | — | |||||||||
Net increase (decrease) in cash and cash equivalents | (48,634 | ) | 3,477 | 45,918 | 761 | ||||||||||
Cash and cash equivalents at beginning of the period | 207,591 | 24,295 | 180,399 | 412,285 | |||||||||||
Cash and cash equivalents at end of the period | $ | 158,957 | $ | 27,772 | $ | 226,317 | $ | 413,046 | |||||||
97
Condensed Consolidating Cash Flows | |||||||||||||||
Year Ended June 29, 2013 | |||||||||||||||
Sysco | Certain U.S. Broadline Subsidiaries | Other Non-Guarantor Subsidiaries | Consolidated Totals | ||||||||||||
(In thousands) | |||||||||||||||
Net cash provided by (used for): | |||||||||||||||
Operating activities | $ | (449,417 | ) | $ | 1,705,950 | $ | 255,061 | $ | 1,511,594 | ||||||
Investing activities | (105,314 | ) | (140,217 | ) | (666,351 | ) | (911,882 | ) | |||||||
Financing activities | (887,707 | ) | (15,666 | ) | 29,165 | (874,208 | ) | ||||||||
Effect of exchange rate on cash | — | — | (2,086 | ) | (2,086 | ) | |||||||||
Intercompany activity | 1,178,922 | (1,560,250 | ) | 381,328 | — | ||||||||||
Net increase (decrease) in cash and cash equivalents | (263,516 | ) | (10,183 | ) | (2,883 | ) | (276,582 | ) | |||||||
Cash and cash equivalents at beginning of the period | 471,107 | 34,478 | 183,282 | 688,867 | |||||||||||
Cash and cash equivalents at end of the period | $ | 207,591 | $ | 24,295 | $ | 180,399 | $ | 412,285 | |||||||
23. QUARTERLY RESULTS (UNAUDITED)
Financial information for each quarter in the years ended June 27, 2015 and June 28, 2014 is set forth below:
Fiscal 2015 Quarter Ended | |||||||||||||||||||
September 27, | December 27, | March 28, | June 27, | Fiscal Year | |||||||||||||||
(In thousands except for per share data) | |||||||||||||||||||
Sales | $ | 12,445,081 | $ | 12,087,074 | $ | 11,746,659 | $ | 12,401,938 | $ | 48,680,752 | |||||||||
Cost of sales | 10,256,364 | 10,001,937 | 9,689,161 | 10,181,774 | 40,129,236 | ||||||||||||||
Gross profit | 2,188,717 | 2,085,137 | 2,057,498 | 2,220,164 | 8,551,516 | ||||||||||||||
Operating expenses | 1,723,104 | 1,769,691 | 1,730,190 | 2,099,169 | 7,322,154 | ||||||||||||||
Operating income | 465,613 | 315,446 | 327,308 | 120,995 | 1,229,362 | ||||||||||||||
Interest expense | 30,934 | 77,042 | 69,550 | 77,281 | 254,807 | ||||||||||||||
Other expense (income), net | (2,188 | ) | 2,207 | (8,577 | ) | (25,034 | ) | (33,592 | ) | ||||||||||
Earnings before income taxes | 436,867 | 236,197 | 266,335 | 68,748 | 1,008,147 | ||||||||||||||
Income taxes | 158,054 | 78,218 | 89,380 | (4,278 | ) | 321,374 | |||||||||||||
Net earnings | $ | 278,813 | $ | 157,979 | $ | 176,955 | $ | 73,026 | $ | 686,773 | |||||||||
Per share: | |||||||||||||||||||
Basic net earnings | $ | 0.47 | $ | 0.27 | $ | 0.30 | $ | 0.12 | $ | 1.16 | |||||||||
Diluted net earnings | 0.47 | 0.27 | 0.30 | 0.12 | 1.15 | ||||||||||||||
Dividends declared | 0.29 | 0.30 | 0.30 | 0.30 | 1.19 | ||||||||||||||
Market price — high/low | 39-36 | 41-36 | 41-38 | 39-36 | 41-36 | ||||||||||||||
98
Fiscal 2014 Quarter Ended | |||||||||||||||||||
September 28, | December 28, | March 29, | June 28, | Fiscal Year | |||||||||||||||
(In thousands except for per share data) | |||||||||||||||||||
Sales | $ | 11,714,267 | $ | 11,237,969 | $ | 11,277,484 | $ | 12,286,992 | $ | 46,516,712 | |||||||||
Cost of sales | 9,648,780 | 9,273,018 | 9,282,743 | 10,131,136 | 38,335,677 | ||||||||||||||
Gross profit | 2,065,487 | 1,964,951 | 1,994,741 | 2,155,856 | 8,181,035 | ||||||||||||||
Operating expenses | 1,587,289 | 1,613,174 | 1,662,116 | 1,731,334 | 6,593,913 | ||||||||||||||
Operating income | 478,198 | 351,777 | 332,625 | 424,522 | 1,587,122 | ||||||||||||||
Interest expense | 30,528 | 29,784 | 32,224 | 31,205 | 123,741 | ||||||||||||||
Other (income), net | (4,534 | ) | (4,211 | ) | 3,718 | (7,216 | ) | (12,243 | ) | ||||||||||
Earnings before income taxes | 452,204 | 326,204 | 296,683 | 400,533 | 1,475,624 | ||||||||||||||
Income taxes | 166,614 | 115,369 | 115,746 | 146,362 | 544,091 | ||||||||||||||
Net earnings | $ | 285,590 | $ | 210,835 | $ | 180,937 | $ | 254,171 | $ | 931,533 | |||||||||
Per share: | |||||||||||||||||||
Basic net earnings | $ | 0.49 | $ | 0.36 | $ | 0.31 | $ | 0.43 | $ | 1.59 | |||||||||
Diluted net earnings | 0.48 | 0.36 | 0.31 | 0.43 | 1.58 | ||||||||||||||
Dividends declared | 0.28 | 0.29 | 0.29 | 0.29 | 1.15 | ||||||||||||||
Market price — high/low | 36-31 | 43-31 | 37-34 | 38-35 | 43-31 | ||||||||||||||
Percentage change — 2015 vs. 2014: | ||||||||||||||
Quarter 1 | Quarter 2 | Quarter 3 | Quarter 4 | Fiscal Year | ||||||||||
Sales | 6 | % | 8 | % | 4 | % | 1 | % | 5 | % | ||||
Operating income | (3 | ) | (10 | ) | (2 | ) | (71 | ) | (23 | ) | ||||
Net earnings | (2 | ) | (25 | ) | (2 | ) | (71 | ) | (26 | ) | ||||
Basic net earnings per share | (4 | ) | (25 | ) | (3 | ) | (72 | ) | (27 | ) | ||||
Diluted net earnings per share | (2 | ) | (25 | ) | (3 | ) | (72 | ) | (27 | ) | ||||
Financial results are impacted by accounting changes and the adoption of various accounting standards. See Note 2, “Changes in Accounting.”
Item 9. Changes in and Disagreements with Accountants on Accounting and Financial Disclosure
None.
Item 9A. Controls and Procedures
Sysco’s management, with the participation of our chief executive officer and chief financial officer, evaluated the effectiveness of our disclosure controls and procedures as of June 27, 2015. The term “disclosure controls and procedures,” as defined in Rules 13a-15(e) and 15d-15(e) under the Exchange Act, means controls and other procedures of a company that are designed to ensure that information required to be disclosed by a company in the reports that it files or submits under the Exchange Act is recorded, processed, summarized and reported, within the time periods specified in the Securities and Exchange Commission’s rules and forms. Disclosure controls and procedures include, without limitation, controls and procedures designed to ensure that information required to be disclosed by a company in the reports that it files or submits under the Exchange Act is accumulated and communicated to the company’s management, including its principal executive and principal financial officers, as appropriate to allow timely decisions regarding the required disclosure. Management recognizes that any controls and procedures, no matter how well designed and operated, can provide only reasonable assurance of achieving their objectives and management necessarily applies its judgment in evaluating the cost-benefit relationship of possible controls and procedures. Sysco’s disclosure controls and procedures have been designed to provide reasonable assurance of achieving their objectives. Based on the evaluation of our disclosure controls and procedures as of June 27, 2015, our chief executive officer and chief financial officer concluded that, as of such date, Sysco’s disclosure controls and procedures were effective at the reasonable assurance level.
Management’s report on internal control over financial reporting is included in the financial statement pages at page 49.
99
No change in our internal control over financial reporting (as defined in Rules 13a-15(f) and 15d-15(f) under the Exchange Act) occurred during the fiscal quarter ended June 27, 2015 that has materially affected, or is reasonably likely to materially affect, our internal control over financial reporting.
Item 9B. Other Information
None.
PART III
Item 10. Directors, Executive Officers and Corporate Governance
The information required by this item will be included in our proxy statement for the 2015 Annual Meeting of Stockholders under the following captions, and is incorporated herein by reference thereto: “Corporate Governance,” “Executive Officers,” “Section 16(a) Beneficial Ownership Reporting Compliance,” “Report of the Audit Committee” and “Board of Directors Matters.”
Item 11. Executive Compensation
The information required by this item will be included in our proxy statement for the 2015 Annual Meeting of Stockholders under the following captions, and is incorporated herein by reference thereto: “Compensation Discussion and Analysis,” “Report of the Compensation Committee,” “Director Compensation” and “Executive Compensation.
Item 12. Security Ownership of Certain Beneficial Owners and Management and Related Stockholder Matters
The information required by this item will be included in our proxy statement for the 2015 Annual Meeting of Stockholders under the following captions, and is incorporated herein by reference thereto: “Stock Ownership” and “Equity Compensation Plan Information."
Item 13. Certain Relationships and Related Transactions, and Director Independence
The information required by this item will be included in our proxy statement for the 2015 Annual Meeting of Stockholders under the following caption, and is incorporated herein by reference thereto: “Corporate Governance – Certain Relationships and Related Person Transactions” and “Corporate Governance – Director Independence.”
Item 14. Principal Accounting Fees and Services
The information required by this item will be included in our proxy statement for the 2015 Annual Meeting of Stockholders under the following caption, and is incorporated herein by reference thereto: “Fees Paid to Independent Registered Public Accounting Firm.”
PART IV
Item 15. Exhibits
(a) | The following documents are filed, or incorporated by reference, as part of this Form 10-K: |
1. | All financial statements. See Index to Consolidated Financial Statements on page 48 of this Form 10-K. |
2. | All financial statement schedules are omitted because they are not applicable or the information is set forth in the consolidated financial statements or notes thereto within Item 8. Financial Statements and Supplementary Data. |
3. | Exhibits. |
The exhibits listed on the Exhibit Index immediately preceding such exhibits, which is hereby incorporated herein by reference, are filed or furnished as part of this Annual Report on Form 10-K.
100
SIGNATURES
Pursuant to the requirements of Section 13 or 15(d) of the Securities Exchange Act of 1934, Sysco Corporation has duly caused this Form 10-K to be signed on its behalf by the undersigned, thereunto duly authorized, on this 24th day of August, 2015.
SYSCO CORPORATION | |
By | /s/ WILLIAM J. DELANEY |
William J. DeLaney | |
President and Chief Executive Officer | |
Pursuant to the requirements of the Securities Exchange Act of 1934, this report has been signed below by the following persons on behalf of Sysco Corporation in the capacities indicated and on the date indicated above.
PRINCIPAL EXECUTIVE, FINANCIAL & ACCOUNTING OFFICERS:
/s/ WILLIAM J. DELANEY | President and Chief Executive Officer |
William J. DeLaney | (principal executive officer) |
/s/ ROBERT C. KREIDLER | Executive Vice President and Chief Financial Officer |
Robert C. Kreidler | (principal financial officer) |
/s/ JOEL T. GRADE | Senior Vice President - Finance and Chief Accounting Officer |
Joel T. Grade | (principal accounting officer) |
DIRECTORS:
/s/ JOHN M. CASSADAY | /s/ JOSEPH A. HAFNER, JR. |
John M. Cassaday | Joseph A. Hafner, Jr. |
/s/ JUDITH B. CRAVEN | /s/ HANS-JOACHIM KOERBER |
Judith B. Craven | Hans-Joachim Koerber |
/s/ WILLIAM J. DELANEY | /s/ NANCY S. NEWCOMB |
William J. DeLaney | Nancy S. Newcomb |
/s/ LARRY C. GLASSCOCK | /s/ RICHARD G. TILGHMAN |
Larry C. Glasscock | Richard G. Tilghman |
/s/ JONATHAN GOLDEN | /s/ JACKIE M. WARD |
Jonathan Golden | Jackie M. Ward |
101
EXHIBIT INDEX
Exhibits.
3.1 | — | Restated Certificate of Incorporation, incorporated by reference to Exhibit 3(a) to Form 10-K for the year ended June 28, 1997 (File No. 1-6544). |
3.2 | — | Certificate of Amendment to Restated Certificate of Incorporation increasing authorized shares, incorporated by reference to Exhibit 3(e) to Form 10-Q for the quarter ended December 27, 2003 (File No. 1-6544). |
3.3 | — | Form of Amended Certificate of Designation, Preferences and Rights of Series A Junior Participating Preferred Stock, incorporated by reference to Exhibit 3(c) to Form 10-K for the year ended June 29, 1996 (File No. 1-6544). |
3.4 | — | Amended and Restated Bylaws of Sysco Corporation dated November 14, 2013, incorporated by reference to Exhibit 3.01 to Form 8-K filed on November 20, 2013 (File No. 1-6544). |
4.1 | — | Senior Debt Indenture, dated as of June 15, 1995, between Sysco Corporation and First Union National Bank of North Carolina, Trustee, incorporated by reference to Exhibit 4(a) to Registration Statement on Form S-3 filed June 6, 1995 (File No. 33-60023). |
4.2 | — | Third Supplemental Indenture, dated as of April 25, 1997 between Sysco Corporation and First Union National Bank of North Carolina, Trustee, incorporated by reference to Exhibit 4(g) to Form 10-K for the year ended June 28, 1997 (File No. 1-6544). |
4.3 | — | Fifth Supplemental Indenture, dated as of July 27, 1998 between Sysco Corporation and First Union National Bank, Trustee, incorporated by reference to Exhibit 4(h) to Form 10-K for the year ended June 27, 1998 (File No. 1-6544). |
4.4 | — | Seventh Supplemental Indenture, including form of Note, dated March 5, 2004 between Sysco Corporation, as Issuer, and Wachovia Bank, National Association (formerly First Union National Bank of North Carolina), as Trustee, incorporated by reference to Exhibit 4(j) to Form 10-Q for the quarter ended March 27, 2004 (File No. 1-6544). |
4.5 | — | Eighth Supplemental Indenture, including form of Note, dated September 22, 2005 between Sysco Corporation, as Issuer, and Wachovia Bank, National Association, as Trustee, incorporated by reference to Exhibits 4.1 and 4.2 to Form 8-K filed on September 20, 2005 (File No. 1-6544). |
4.6 | — | Ninth Supplemental Indenture, including form of Note, dated February 12, 2008 between Sysco Corporation, as Issuer, and the Trustee, incorporated by reference to Exhibit 4.1 to Form 8-K filed on February 12, 2008 (File No. 1-6544). |
4.7 | — | Tenth Supplemental Indenture, including form of Note, dated February 12, 2008 between Sysco Corporation, as Issuer, and the Trustee, incorporated by reference to Exhibit 4.3 to Form 8-K filed on February 12, 2008 (File No. 1-6544). |
4.8 | — | Form of Eleventh Supplemental Indenture, including form of Note, dated March 17, 2009 between Sysco Corporation, as Issuer, and the Trustee, incorporated by reference to Exhibit 4.1 to Form 8-K filed on March 13, 2009 (File No. 1-6544). |
4.9 | — | Form of Twelfth Supplemental Indenture, including form of Note, dated March 17, 2009 between Sysco Corporation, as Issuer, and the Trustee, incorporated by reference to Exhibit 4.3 to Form 8-K filed on March 13, 2009 (File No. 1-6544). |
4.10 | — | Form of Guarantee of Indebtedness of Sysco Corporation under Exhibits 4.1 through 4.9 as executed by Sysco’s U.S. Broadline subsidiaries, incorporated by reference to Exhibit 4.1 to Form 8-K filed on January 20, 2011 (File No. 1-6544). |
4.11 | — | Thirteenth Supplemental Indenture, including form of Initial Guarantee, dated February 17, 2012 between Sysco Corporation, as Issuer, the Trustee and the Initial Guarantors, incorporated by reference to Exhibit 4(o) to Registration Statement on Form S-3 filed on February 17, 2012 (File No. 1-6544). |
4.12 | — | Fourteenth Supplemental Indenture, including form of Note, dated June 12, 2012 among Sysco, the Guarantors and the Trustee relating to the 2015 Notes, incorporated by reference to Exhibit 4.1 to Form 8-K filed on June 12, 2012 (File No. 1-6544). |
4.13 | — | Fifteenth Supplemental Indenture, including form of Note, dated June 12, 2012 among Sysco, the Guarantors and the Trustee relating to the 2022 Notes, incorporated by reference to Exhibit 4.3 to Form 8-K filed on June 12, 2012 (File No. 1-6544). |
4.14 | — | Indenture dated May 23, 2002 between Sysco International, Co., Sysco Corporation and Wachovia Bank, National Association, incorporated by reference to Exhibit 4.1 to Registration Statement on Form S-4 filed August 21, 2002 (File No. 333-98489). |
4.15 | — | Form of Supplemental Indenture No. 1, dated July 2, 2010, between Sysco International, ULC, as successor by conversion and name change to Sysco International Co., Sysco Corporation, as Guarantor, and the Trustee, incorporated by reference to Exhibit 4.12 to Form 10-K for the year ended July 3, 2010 filed on August 31, 2010 (File No. 1-6544). |
4.16 | — | Agreement of Resignation, Appointment and Acceptance, dated February 13, 2007, by and among Sysco Corporation and Sysco International Co., a wholly-owned subsidiary of Sysco Corporation, U.S. Bank National Association and The Bank of New York Trust Company, N.A., incorporated by reference to Exhibit 4(h) to Registration Statement on Form S-3 filed on February 6, 2008 (File No. 333-149086). |
10.1 | — | Credit Agreement dated December 29, 2011 between Sysco Corporation, Sysco International, ULC, JP Morgan Chase Bank, N.A., JPMorgan Chase Bank, N.A., Toronto Branch, and certain Lenders and Guarantors party thereto, incorporated by reference to Exhibit 10.1 to Form 10-Q for the quarter ended December 31, 2011 filed on February 7, 2012 (File No. 1-6544). |
10.2 | — | First Amendment, dated November 29, 2012, in the form of a Maturity Date Extension Letter Agreement, amending that certain Credit Agreement dated December 29, 2011 between Sysco Corporation, Sysco International, ULC, JP Morgan Chase Bank, N.A., JPMorgan Chase Bank, N.A., Toronto Branch, and certain Lenders and Guarantors party thereto, incorporated, by reference to Exhibit 10.1 to Form 10-Q for the quarter ended December 29, 2012 filed on February 5, 2013 (File No. 1-6544). |
10.3 | — | Second Amendment, dated as of January 31, 2014, to the Credit Agreement dated December 29, 2011 by and among Sysco Corporation, Sysco International, ULC, JPMorgan Chase Bank, N.A., JPMorgan Chase Bank, N.A., Toronto Branch and the lenders party thereto, incorporated by reference to Exhibit 10.6 to Form 10-Q for the quarter ended December 28, 2013 filed on February 4, 2014 (File No. 1-6544). |
10.4 | — | Issuing and Paying Agent Agreement, dated as of October 31, 2014, between Sysco Corporation and U.S. Bank; National Association, incorporated by reference to Exhibit 10.1 to Form 10-Q for the quarter ended December 27, 2014 filed on February 2, 2015 (File No. 1-6544). |
10.5 | — | Amended and Restated Commercial Paper Dealer Agreement, dated as of October 31, 2014, between Sysco Corporation, as issuer, and JPMorgan Morgan Securities LLC, as Dealer, incorporated by reference to Exhibit 10.2 to Form 10-Q for the quarter ended December 27, 2014 filed on February 2, 2015(File No. 1-6544). |
10.6 | — | Commercial Paper Dealer Agreement, dated as of October 31, 2014, between Sysco Corporation, as issuer, and Goldman, Sachs & Co, as Dealer, incorporated by reference to Exhibit 10.3 to Form 10-Q for the quarter ended December 27, 2014 filed on February 2, 2015(File No. 1-6544). |
10.7# | — | Commercial Paper Dealer Agreement, dated as of February 13, 2015, between Sysco Corporation, as issuer, and BNY Mellon Capital Markets, LLC, as Dealer. |
10.8 | — | Demand Facility Agreement, dated as of June 30, 2011, between SFS Canada I, LP and The Toronto-Dominion Bank, incorporated by reference to Exhibit 10.7 to Form 10-K for the year ended July 2, 2011 filed on August 30, 2011 (File No. 1-6544). |
10.9 | — | Guaranty Agreement, dated as of June 30, 2011, between Sysco Corporation and The Toronto-Dominion Bank, incorporated by reference to Exhibit 10.8 to Form 10-K for the year ended July 2, 2011 filed on August 30, 2011 (File No. 1-6544). |
10.10 | — | 364-Day Bridge Term Loan Agreement, dated January 31, 2014, among Sysco Corporation, the Guarantors party thereto, the Lenders party thereto and Goldman Sachs Bank USA, as Administrative Agent, incorporated by reference to Exhibit 10.7 to Form 10-Q for the quarter ended December 28, 2013 filed on February 4, 2014 (File No. 1-6544). |
10.11+ | — | Stockholders Agreement, dated as of December 8, 2013, by and among Sysco Corporation, Clayton Dubilier & Rice LLC, Kohlberg, Kravis Roberts & Co. L.P. and the stockholders named therein, incorporated by reference to Exhibit 10.1 to Form 10-Q for the quarter ended December 28, 2013 filed on February 4, 2014 (File No. 1-6544). |
10.12† | — | Sixth Amended and Restated Sysco Corporation Executive Deferred Compensation Plan, incorporated by reference to Exhibit 10.3 to Form 10-Q for the quarter ended October 2, 2010 filed on November 9, 2010 (File No. 1-6544). |
10.13† | — | First Amendment to the Sixth Amended and Restated Sysco Corporation Executive Deferred Compensation Plan, incorporated by reference to Exhibit 10.2 to Form 10-Q for the quarter ended March 31, 2012 filed on May 8, 2012 (File No. 1-6544). |
10.14† | — | Seventh Amended and Restated Sysco Corporation Executive Deferred Compensation Plan, incorporated by reference to Exhibit 10.3 to Form 10-Q for the quarter ended December 29, 2012 filed on February 4, 2013 (File No. 1-6544). |
10.15† | — | Amended and Restated Sysco Corporation Executive Deferred Compensation Plan, effective June 29, 2013, incorporated by reference to Exhibit 10.11 to Form 10-K for the year ended June 29, 2013 filed on August 27, 2013 (File No. 1-6544). |
10.16†# | — | 2015-1 Amendment to the Amended and Restated Sysco Corporation Executive Deferred Compensation Plan. |
10.17† | Tenth Amended and Restated Sysco Corporation Supplemental Executive Retirement Plan, incorporated by reference to Exhibit 10.4 to Form 10-Q for the quarter ended October 2, 2010 filed on November 9, 2010 (File No. 1-6544). | |
10.18† | — | First Amendment to Tenth Amended and Restated Sysco Corporation Supplemental Executive Retirement Plan, incorporated by reference to Exhibit 10.15 to Form 10-K for the year ended July 2, 2011 filed on August 30, 2011 (File No. 1-6544). |
10.19† | — | Second Amendment to Tenth Amended and Restated Sysco Corporation Supplemental Executive Retirement Plan, incorporated by reference to Exhibit 10.1 to Form 10-Q for the quarter ended March 31, 2012 filed on May 8, 2012 (File No. 1-6544). |
10.20† | — | Eleventh Amended and Restated Sysco Corporation Supplemental Executive Retirement Plan, incorporated by reference to Exhibit 10.2 to Form 10-Q for the quarter ended December 29, 2012 filed on February 4, 2013 (File No. 1-6544). |
10.21† | — | Amended and Restated Sysco Corporation Supplemental Executive Retirement Plan, including the Amended and Restated Sysco Corporation MIP Retirement Program, attached as Appendix I, effective as of June 29, 2013, incorporated by reference to Exhibit 10.16 to Form 10-K for the year ended June 29, 2013 filed on August 27, 2013 (File No. 1-6544). |
10.22† | — | First Amendment to the Amended and Restated Sysco Corporation Supplemental Executive Retirement Plan, incorporated by reference to Exhibit 10.2 to Form 10-Q for the quarter ended March 29, 2014 filed on May 6, 2014 (File No. 1-6544). |
10.23† | — | Amended and Restated Sysco Corporation MIP Retirement Program, effective as of June 29, 2013, incorporated by reference to Exhibit 10.17 to Form 10-K for the year ended June 29, 2013 filed on August 27, 2013 (File No. 1-6544). |
10.24† | — | First Amendment to the Amended and Restated Sysco Corporation MIP Retirement Program, incorporated by reference to Exhibit 10.3 to Form 10-Q for the quarter ended March 29, 2014 filed on May 6, 2014 (File No. 1-6544). |
10.25† | — | Sysco Corporation Management Savings Plan, incorporated by reference to Exhibit 10.4 to Form 10-Q for the quarter ended December 29, 2012 filed on February 4, 2013 (File No. 1-6544). |
10.26† | — | Amended and Restated Sysco Corporation Management Savings Plan, effective as of June 29, 2013, incorporated by reference to Exhibit 10.19 to Form 10-K for the year ended June 29, 2013 filed on August 27, 2013 (File No. 1-6544). |
10.27 † | — | First Amendment to the Amended and Restated Sysco Corporation Management Savings Plan., incorporated by reference to Exhibit 10.1 to Form 10-Q for the quarter ended March 29, 2014 filed on May 6, 2014 (File No. 1-6544). |
10.28†# | 2015-1 Amendment to the Amended and Restated Sysco Corporation Management Savings Plan. | |
10.29† | — | Form of Stock Option Grant Agreement issued to executive officers on September 2, 2004 under the 2000 Stock Incentive Plan, incorporated by reference to Exhibit 10(a) to Form 8-K filed on September 9, 2004 (File No. 1-6544). |
10.30† | — | 2004 Stock Option Plan, incorporated by reference to Appendix B to the Sysco Corporation Proxy Statement filed September 24, 2004 (File No. 1-6544). |
10.31† | — | 2007 Stock Incentive Plan, as amended, incorporated by reference to Annex B to the Sysco Corporation Proxy Statement filed October 8, 2009 (File No. 1-6544). |
10.32† | — | Form of Stock Option Grant Agreement issued to executive officers under the 2007 Stock Incentive Plan, incorporated by reference to Exhibit 10.6 to Form 10-Q for the quarter ended December 29, 2007 filed on February 5, 2008 (File No. 1-6544). |
10.33† | — | Form of Stock Option Grant Agreement issued to Robert C. Kreidler effective October 5, 2009 under the 2007 Stock Incentive Plan, incorporated by reference to Exhibit 10.5 to Form 10-Q for the quarter ended September 26, 2009 filed on November 3, 2009 (File No. 1-6544). |
10.34† | — | Form of Restricted Stock Unit Award Agreement issued to executive officers under the 2007 Stock Incentive Plan, incorporated by reference to Exhibit 10.7 to Form 10-Q for the quarter ended September 26, 2009 filed on November 3, 2009 (File No. 1-6544). |
10.35 † | — | Sysco Corporation 2013 Long-Term Incentive Plan, incorporated by reference to Exhibit 99.1 to Form S-8 filed on November 15, 2013 (File No. 1-6544). |
10.36† | — | Form of Stock Option Grant Agreement issued to executive officers under the Sysco Corporation 2013 Long-Term Incentive Plan, incorporated by reference to Exhibit 10.3 to Form 10-Q for the quarter ended December 28, 2013 filed on February 4, 2014 (File No. 16544). |
10.37 † | — | Form of Restricted Stock Unit Award Agreement issued to executive officers under the 2013 Long-Term Incentive Plan, incorporated by reference to Exhibit 10.4 to Form 10-Q for the quarter ended December 28, 2013 filed on February 4, 2014 (File No. 16544). |
10.38† | — | Form of Sysco Protective Covenants Agreement (RSU Grant) issued to executive officers in connection with a Restricted Stock Unit Award Agreement issued under the 2013 Long-Term Incentive Plan, incorporated by reference to Exhibit 10.5 to Form 10-Q for the quarter ended December 28, 2013 filed on February 4, 2014 (File No. 16544). |
10.39† | — | First Amended and Restated 2008 Cash Performance Unit Plan, incorporated by reference to Exhibit 10.2 to Form 10-Q for the quarter ended September 26, 2009 filed on November 3, 2009 (File No. 1-6544). |
10.40† | — | 2009 Management Incentive Plan, incorporated by reference to Annex C to the Sysco Corporation Proxy Statement filed on October 8, 2009 (File No. 1-6544). |
10.41† | — | Form of Fiscal Year 2014 Bonus Award under the 2009 Management Incentive Plan, incorporated by reference to Exhibit 10.1 to Form 10-Q for the quarter ended September 28, 2013 filed on November 5, 2013 (File No. 1-6544). |
10.42† | — | Form of Fiscal Year 2015 Bonus Award under the 2009 Management Incentive Plan, incorporated by reference to Exhibit 10.1 to Form 10-Q for the quarter ended September 27, 2014 filed on November 4, 2014 (File No. 1-6544). |
10.43† | — | Description of Sysco Corporation's Executive Relocation Expense Reimbursement Policy, incorporated by reference to Exhibit 10.3 to Form 10-Q for the quarter ended January 1, 2011 filed on February 8, 2011 (File No. 1-6544). |
10.44† | Amended and Restated Non-Employee Directors Stock Plan, incorporated by reference to Appendix B to Proxy Statement filed on September 24, 2001 (File No. 1-6544). | |
10.45† | — | Form of Retainer Stock Agreement for issuance to Non-Employee Directors under the Non-Employee Directors Stock Plan, incorporated by reference to Exhibit 10(a) to Form 10-Q for the quarter ended January 1, 2005 filed on February 10, 2005 (File No. 1-6544). |
10.46† | — | 2009 Non-Employee Directors Stock Plan, incorporated by reference to Annex A to the Sysco Corporation Proxy Statement filed October 8, 2009 (File No. 1-6544). |
10.47† | — | Form of Restricted Stock Grant Agreement under the 2009 Non-Employee Directors Stock Plan, incorporated by reference to Exhibit 10.1 to Form 10-Q for the quarter ended April 2, 2011 filed on May 10, 2011(File No. 1-6544). |
10.48† | — | Form of Restricted Stock Grant Agreement under the 2009 Non-Employee Directors Stock Plan for those individuals who elected to defer receipt of shares under the 2009 Board of Directors Stock Deferral Plan, incorporated by reference to Exhibit 10.2 to Form 10-Q for the quarter ended April 2, 2011 filed on May 10, 2011(File No. 1-6544). |
10.49† | — | Second Amended and Restated Board of Directors Deferred Compensation Plan dated April 1, 2002, incorporated by reference to Exhibit 10(aa) to Form 10-K for the year ended June 29, 2002 filed on September 25, 2002 (File No. 1-6544). |
10.50† | — | First Amendment to Second Amended and Restated Board of Directors Deferred Compensation Plan dated July 12, 2002, incorporated by reference to Exhibit 10(bb) to Form 10-K for the year ended June 29, 2002 filed on September 25, 2002 (File No. 1-6544). |
10.51† | — | Second Amendment to the Second Amended and Restated Sysco Corporation Board of Directors Deferred Compensation Plan, incorporated by reference to Exhibit 10(k) to Form 10-Q for the quarter ended December 31, 2005 filed on February 9, 2006 (File No. 1-6544). |
10.52† | — | Third Amendment to the Second Amended and Restated Sysco Corporation Board of Directors Deferred Compensation Plan, incorporated by reference to Exhibit 10.4 to Form 10-Q for the quarter ended March 31, 2012 filed on May 8, 2012 (File No. 1-6544). |
10.53† | — | Second Amended and Restated Sysco Corporation 2005 Board of Directors Deferred Compensation Plan, incorporated by reference to Exhibit 10.59 to Form 10-K for the year ended July 28, 2008 filed on August 26, 2008 (File No. 1-6544). |
10.54† | First Amendment to the Second Amended and Restated Sysco Corporation 2005 Board of Directors Deferred Compensation Plan, incorporated by reference to Exhibit 10.3 to Form 10-Q for the quarter ended March 31, 2012 filed on May 8, 2012 (File No. 1-6544). | |
10.55† | — | 2009 Board of Directors Stock Deferral Plan, incorporated by reference to Exhibit 10.1 to Form 10-Q for the quarter ended December 26, 2009 filed on February 2, 2010 (File No. 1-6544). |
10.56†# | — | Description of Compensation Arrangements with Non-Employee Directors. |
10.57† | — | Form of Indemnification Agreement with Non-Employee Directors, incorporated by reference to Exhibit 10.61 to Form 10-K for the year ended July 28, 2008 filed on August 26, 2008 (File No. 1-6544). |
10.58†# | — | Letter Agreement dated as of April 1, 2015, between Sysco Corporation and Robert C. Kreidler. |
10.59 | Agreement and Release, dated June 26, 2015, among USF Holding Corp., Sysco Corporation, Scorpion Corporation I, Inc. and Scorpion Company II, LLC, incorporated by reference to Exhibit 10.1 to Form 8-K filed on June 29, 2015 (File No. 1-6544). | |
12.1# | — | Statement regarding Computation of Ratio of Earnings to Fixed Charges. |
21.1# | — | Subsidiaries of the Registrant. |
23.1# | — | Consent of Independent Registered Public Accounting Firm. |
31.1# | — | CEO Certification Pursuant to Section 302 of the Sarbanes-Oxley Act of 2002. |
31.2# | — | CFO Certification Pursuant to Section 302 of the Sarbanes-Oxley Act of 2002. |
32.1# | — | CEO Certification Pursuant to Section 906 of the Sarbanes-Oxley Act of 2002. |
32.2# | — | CFO Certification Pursuant to Section 906 of the Sarbanes-Oxley Act of 2002. |
101.1# | — | The following financial information from Sysco Corporation’s Annual Report on Form 10-K for the year ended June 27, 2015 filed with the SEC on August 24, 2015, formatted in XBRL includes: (i) Consolidated Balance Sheets as of June 27, 2015 and June 28, 2014, (ii) Consolidated Results of Operations for the periods ended June 27, 2015, June 28, 2014 and June 29, 2013, (iii) Consolidated Shareholders’ Equity for the periods ended June 27, 2015, June 28, 2014 and June 29, 2013, (iv) Consolidated Cash Flows for the periods ended June 27, 2015, June 28, 2014 and June 29, 2013, and (v) the Notes to Consolidated Financial Statements. |
_________
† Executive Compensation Arrangement pursuant to 601(b)(10)(iii)(A) of Regulation S-K
# Filed Herewith
+ Confidential treatment has been granted for certain portions of this exhibit pursuant to Rule 24b-2 of the Securities Exchange Act of 1934, as amended.
Note: Debt instruments of Sysco Corporation and its subsidiaries defining the rights of long-term debt holders in principal amounts not exceeding 10% of Sysco Corporation’s consolidated assets have been omitted and will be provided to the Securities and Exchange Commission upon request.