Attached files
| file | filename |
|---|---|
| EX-21.1 - EX-21.1 - OSI SYSTEMS INC | osis-20150630ex21163a57e.htm |
| EX-31.1 - EX-31.1 - OSI SYSTEMS INC | osis-20150630ex311c2212c.htm |
| EX-31.2 - EX-31.2 - OSI SYSTEMS INC | osis-20150630ex31276cfa3.htm |
| EX-23.1 - EX-23.1 - OSI SYSTEMS INC | osis-20150630ex231f17845.htm |
| EX-32.1 - EX-32.1 - OSI SYSTEMS INC | osis-20150630ex3217d0fd1.htm |
| EX-32.2 - EX-32.2 - OSI SYSTEMS INC | osis-20150630ex32203da78.htm |
UNITED STATES
SECURITIES AND EXCHANGE COMMISSION
Washington, D.C. 20549
FORM 10‑K
|
|
|
|
(Mark One) |
|
|
☒ |
ANNUAL REPORT PURSUANT TO SECTION 13 OR 15(d) OF THE SECURITIES EXCHANGE ACT OF 1934 |
|
|
For the fiscal year ended June 30, 2015 |
|
OR |
|
|
☐ |
TRANSITION REPORT PURSUANT TO SECTION 13 OR 15(d) OF THE SECURITIES EXCHANGE ACT OF 1934 |
|
|
For the transition period from to |
Commission File Number 000‑23125
OSI SYSTEMS, INC.
(Exact name of registrant as specified in its charter)
|
|
|
|
Delaware |
33‑0238801 |
|
12525 Chadron Avenue, Hawthorne, California |
90250 |
Registrant’s telephone number, including area code: (310) 978‑0516
Securities registered pursuant to Section 12(b) of the Act:
|
|
|
|
Title of each class |
Name of each exchange on which registered |
|
Common Stock, $0.001 par value |
The NASDAQ Global Select Market |
Securities registered pursuant to Section 12(g) of the Act: None
Indicate by check mark if the registrant is a well‑known seasoned issuer, as defined in Rule 405 of the Securities Act. Yes: ☒ No ☐
Indicate by check mark if the registrant is not required to file reports pursuant to Section 13 or Section 15(d) of the Act. Yes: ☐ No ☒
Indicate by check mark whether the registrant (1) has filed all reports required to be filed by Section 13 or 15(d) of the Securities Exchange Act of 1934 during the preceding 12 months (or for such shorter period that the registrant was required to file such reports), and (2) has been subject to such filing requirements for the past 90 days. Yes: ☒ No ☐
Indicate by check mark whether the registrant has submitted electronically and posted on its corporate Web site, if any, every Interactive Data File required to be submitted and posted pursuant to Rule 405 of Regulation S‑T (§232.405 of this chapter) during the preceding 12 months (or for such shorter period that the registrant was required to submit and post such files). Yes: ☒ No ☐
Indicate by check mark if disclosure of delinquent filers pursuant to Item 405 of Regulation S‑K (§229.405 of this chapter) is not contained herein, and will not be contained, to the best of the registrant’s knowledge, in definitive proxy or information statements incorporated by reference in Part III of this Form 10‑K or any amendment to this Form 10‑K. ☐
Indicate by check mark whether the registrant is a large accelerated filer, an accelerated filer, a non‑accelerated filer or a smaller reporting company. See definitions of “large accelerated filer,” “accelerated filer” and “smaller reporting company” in Rule 12b‑2 of the Exchange Act.
|
|
|
|
|
|
Large accelerated filer ☒ |
Accelerated filer ☐ |
Non‑accelerated filer ☐ |
Smaller reporting company ☐ |
Indicate by check mark whether the registrant is a shell company (as defined in Rule 12b‑2 of the Exchange Act). Yes: ☐ No ☒
The aggregate market value of the registrant’s voting and non‑voting Common Stock held by non‑affiliates computed by reference to the price at which the Common Stock was last sold on December 31, 2014, the last business day of the registrant’s most recently completed second fiscal quarter, was $1,342,631,031.
The number of shares outstanding of the registrant’s Common Stock as of August 19, 2015 was 19,758,833.
DOCUMENTS INCORPORATED BY REFERENCE
Portions of the definitive proxy statement relating to the 2015 annual meeting of stockholders are incorporated by reference into Part III. The proxy statement will be filed by the registrant with the Securities and Exchange Commission not later than 120 days after the end of the registrant’s fiscal year.
TABLE OF CONTENTS
|
|
|
|
|
|
|
Item |
|
Description |
|
Page |
|
|
|
|
|
|
|
|
|
1 |
||
|
|
|
21 |
||
|
|
|
42 |
||
|
|
|
42 |
||
|
|
|
43 |
||
|
|
|
44 |
||
|
|
|
|
|
|
|
|
|
45 |
||
|
|
|
48 |
||
|
|
Management’s Discussion and Analysis of Financial Condition and Results of Operations |
|
49 |
|
|
|
|
61 |
||
|
|
|
62 |
||
|
|
Changes in and Disagreements With Accountants on Accounting and Financial Disclosure |
|
62 |
|
|
|
|
62 |
||
|
|
|
63 |
||
|
|
|
|
|
|
|
|
|
64 |
||
|
|
|
64 |
||
|
|
Security Ownership of Certain Beneficial Owners and Management and Related Stockholder Matters |
|
64 |
|
|
|
Certain Relationships and Related Transactions, and Director Independence |
|
64 |
|
|
|
|
64 |
||
|
|
|
|
|
|
|
|
|
65 |
||
|
|
|
|
II‑1 |
Forward‑Looking Statements
This report contains “forward‑looking statements” within the meaning of the Private Securities Litigation Reform Act of 1995, Section 27A of the Securities Act of 1933, as amended, and Section 21E of the Securities Exchange Act of 1934, as amended (the “Exchange Act”). Forward‑looking statements relate to current expectations, beliefs, projections and similar expressions concerning matters that are not historical facts. Words such as “project,” “believe,” “anticipate,” “plan,” “expect,” “intend,” “may,” “should,” “will,” “would,” and similar words and expressions are intended to identify forward‑looking statements. The expectations, beliefs, projections and similar expressions reflected in the forward‑looking statements may prove to be inaccurate, and actual results may differ materially from those reflected in such forward‑looking statements. Important factors that could cause our actual results to differ materially from those expectations are disclosed in this report, including, without limitation, those described in Part I, Item 1, “Business,” Part I, Item 1A, “Risk Factors” and Part II, Item 7, “Management’s Discussion and Analysis of Financial Condition and Results of Operations” as well as elsewhere in this report and other documents previously filed or hereafter filed by us from time to time with the Securities and Exchange Commission. Such factors, of course, do not include all factors that might affect our business and financial condition. Although we believe that the assumptions upon which our forward‑looking statements are based are reasonable, such assumptions could prove to be inaccurate and actual results could differ materially from those expressed in or implied by the forward‑looking statements. For example, we could be exposed to a variety of negative consequences as a result of delays related to the award of domestic and international contracts; delays in customer programs; delays in revenue recognition related to the timing of customer acceptance; unanticipated impacts of sequestration and other provisions of the Budget Control Act of 2011 as modified by the Bipartisan Budget Act of 2013; changes in domestic and foreign government spending, budgetary, procurement and trade policies adverse to our businesses; unfavorable currency exchange rate fluctuations; market acceptance of our new and existing technologies, products and services; our ability to win new business and convert any orders received to sales within the fiscal year in accordance with our operating plan; enforcement actions in respect of any noncompliance with laws and regulations including export control and environmental regulations and the matters that are the subject of some or all of our ongoing investigations and compliance reviews, contract and regulatory compliance matters, and actions, if brought, resulting in judgments, settlements, fines, injunctions, debarment or penalties, as well as other risks and uncertainties, including but not limited to those detailed herein and from time to time in our Securities and Exchange Commission filings, which could have a material and adverse impact on our business, financial condition and results of operation. All forward‑looking statements contained in this report are qualified in their entirety by this statement. Moreover, we operate in a very competitive and rapidly changing environment. New risks emerge from time to time. It is not possible for our management to predict all risks, nor can we assess the impact of all factors on our business or the extent to which any factor, or combination of factors, may cause actual results to differ materially from those contained in any forward‑looking statements we may make. In light of these risks, uncertainties and assumptions, the future events and trends discussed in this Annual Report on Form 10‑K may not occur and actual results could differ materially and adversely from those anticipated or implied in the forward‑looking statements. We undertake no obligation other than as may be required under securities laws to publicly update or revise any forward‑looking statements, whether as a result of new information, future events or otherwise.
General
OSI Systems, Inc., together with its subsidiaries, is a vertically integrated designer and manufacturer of specialized electronic systems and components for critical applications. We sell our products and provide related services in diversified markets, including homeland security, healthcare, defense and aerospace. Our company was originally incorporated in 1987 in California. In March 2010, we reincorporated our company in the State of Delaware. Our principal office is located at 12525 Chadron Avenue, Hawthorne, California 90250.
We have three operating divisions: (a) Security, providing security and inspection systems, turnkey security screening solutions and related services; (b) Healthcare, providing patient monitoring, diagnostic cardiology, anesthesia delivery and ventilation systems and defibrillators; and (c) Optoelectronics and Manufacturing, providing specialized electronic components and electronic manufacturing services for the Security and Healthcare divisions, as well as to external original equipment manufacturer clients for applications in the defense, aerospace, medical and industrial markets, among others.
1
Through our Security division, we provide security screening products and services globally under the “Rapiscan Systems” trade name. Rapiscan Systems products fall into the following categories: baggage and parcel inspection; cargo and vehicle inspection; hold (checked) baggage screening; people screening; radiation detection; and explosive and narcotics trace detection. In addition to these products, we provide site design, installation, training and technical support services to our customers. We also provide turnkey security screening solutions under the “S2” trade name, which can include the construction, staffing and long‑term operation of security screening checkpoints for our customers.
Through our Healthcare division, we design, manufacture, market and service patient monitoring, diagnostic cardiology, anesthesia delivery and ventilation systems and defibrillators globally to end users under the “Spacelabs” and “Primedic” trade names, and related supplies and accessories under the names “Spacelabs” and “Statcorp Medical.” These products are used by care providers in critical care, emergency and perioperative areas within hospitals as well as physicians’ offices, medical clinics and ambulatory surgery centers; the defibrillators are also used in public facilities.
Through our Optoelectronics and Manufacturing division, we design, manufacture and market optoelectronic devices and provide electronics manufacturing services globally for use in a broad range of applications, including aerospace and defense electronics, security and inspection systems, medical imaging and diagnostics, telecommunications, office automation, computer peripherals, industrial automation systems, automotive diagnostic systems, gaming systems and consumer products. We sell our optoelectronic devices primarily under the “OSI Optoelectronics” trade name and perform our electronics manufacturing services primarily under the “OSI Electronics,” “APlus Products” and “Briton” trade names. We provide our optoelectronic devices and electronics manufacturing services to original equipment manufacturers, as well as to our own Security and Healthcare divisions.
In fiscal 2015, revenues from the Security division were $481.1 million, or approximately 50% of our revenues; revenues from the Healthcare division amounted to $255.7 million, or approximately 27% of our revenues; and third‑party revenues from the Optoelectronics and Manufacturing division were $221.4 million, or approximately 23% of our revenues. See Note 13 to the Consolidated Financial Statements for additional financial information concerning reporting segments and geographic areas.
Industry Overview
We sell our security and inspection systems and patient monitoring, cardiology and anesthesia systems primarily to end‑users, while we design and manufacture our optoelectronic devices and value‑added subsystems, and provide electronics manufacturing services primarily for original equipment manufacturers.
Security. A variety of technologies are currently used globally in security and inspection applications, including transmission and backscatter X‑ray, computed tomography, magnetometry and trace detection. We believe that the market for security and inspection products will continue to be affected by the threat of terrorist incidents and by new government mandates and appropriations for security and inspection products in the United States and internationally.
As a result of the September 11, 2001 terrorist attacks on the World Trade Center and subsequent attacks in other locations worldwide, security and inspection products have increasingly been used at a wide range of facilities other than airports, such as border crossings, railways, seaports, cruise line terminals, freight forwarding operations, sporting venues, government and military installations and nuclear facilities. Congress passed the Aviation and Transportation Security Act and integrated many U.S. security‑related agencies, including the U.S. Transportation Security Administration, into the U.S. Department of Homeland Security. Under its directive from Congress, the U.S. Department of Homeland Security has since undertaken numerous initiatives to prevent terrorists from entering the country, hijacking airliners, and obtaining and trafficking in weapons of mass destruction and their components, to secure sensitive U.S. technologies and to identify and screen high‑risk cargo before it is loaded onto airlines and ships, among others. These initiatives, known, for example, as the Strategic Border Initiative, the Customs‑Trade Partnership Against Terrorism, the U.S. Transportation Security Administration’s Air Cargo Screening Mandate and the U.S. Customs and Border Protection Container Security Initiative, have resulted in an increased demand for security and inspection products.
Certain of the government sponsored initiatives in the United States, such as the U.S. Customs and Border Protection Container Security Initiative, the Customs‑Trade Partnership Against Terrorism and the U.S. Transportation Security Administration’s Air Cargo Screening Mandate have also stimulated security programs in other areas of the world because the U.S. initiatives call on other nations to bolster their port security strategies, including acquiring or improving their security and inspection equipment and screening operations. The international market for non‑intrusive inspection
2
equipment and related services, therefore, continues to expand as countries that ship goods directly to the United States participate in such programs and as they choose to procure and operate equipment in order to secure their own borders, transportation networks, facilities and other venues.
Congress also passed legislation that calls for the inspection of international maritime cargo destined for the United States, domestic civil aviation cargo, and radiological and nuclear threats in cargo entering the United States. Certain of our cargo and vehicle inspection systems are already being used internationally and by the U.S. Government to comply with these standards.
Following recommendations outlined in “The 9/11 Commission Report,” issued by the National Commission on Terrorist Attacks Upon the United States, the U.S. Department of Homeland Security now requires the screening of all cargo carried on passenger airlines in the United States. Several of our hold (checked) baggage and cargo screening systems have been approved by the U.S. Department of Homeland Security for this purpose and are being procured and used by freight forwarders, airlines, transportation companies and other businesses to fulfill their compliance requirements.
Furthermore, the U.S. Department of Homeland Security’s Science and Technology Directorate has supported the development of new security inspection technologies and products. Our Security division participates in a number of such research and development efforts, including projects to develop new technologies for radiation and nuclear materials detection, aviation screening and suicide bomber detection. The Science and Technology Directorate has also initiated programs for the development of technologies capable of protecting highways, railways and waterways from terrorist attack.
In addition, the U.S. Department of Defense has invested heavily in technologies and services that screen would‑be attackers before they are able to harm U.S. and allied forces. These technologies include products that can screen personnel, vehicles and other containers for the presence of explosives, improvised explosive devices (IEDs), weapons and other contraband.
The U.S. Department of Energy (DOE) and other U.S. federal agencies implemented the Second Line of Defense Program and Megaports programs to help prevent the proliferation and trafficking of radioactive and nuclear materials. The DOE has procured, and we continue to supply and maintain, multiple Rapiscan radiation detection sensors, monitors and communications systems. Our Security division also directly supplies many countries, nuclear power facilities and industries handling radioactive materials with radiation detection technology.
Similar initiatives and new regulations promulgated by international organizations have resulted in a growing global demand for airline, cargo, port and border inspection technologies. For example, the European Commission has issued uniform performance standards for systems that screen baggage and people at aviation checkpoints and air cargo, as well as new directives related specifically to maritime security, among other security directives.
Major projects recently installed or currently underway include installations at airports, ports and border crossings, government and military facilities and other locations in the United States and throughout the world. These projects contain various inspection product offerings. We anticipate that there may be growing demand from governments and commercial enterprises for increasingly sophisticated, turnkey, and other security screening solutions.
Certain contracts with the U.S. Government and foreign governments contain provisions allowing the government to terminate a contract for convenience. For further discussion, please refer to Item 1A. Risk Factors.
Healthcare. Healthcare has been, and we believe will continue to be, a growing sector throughout much of the world. Many developing countries in Asia and Latin America are expected to continue to build healthcare infrastructure to serve expanding middle class populations. In developed countries, including the United States and Europe, an aging population is expected to fuel growth in healthcare for many years.
Many factors such as stricter government requirements affecting staffing and accountability as well as shrinking reimbursements from health insurance organizations are forcing healthcare providers to do more with less. Our Healthcare division designs, manufactures and markets products that respond to these economic forces by helping hospitals reduce costs while maintaining or improving the quality of care their physicians and nurses are able to deliver.
3
We are a global manufacturer and distributor of patient monitoring, cardiology and clinical networking solutions for use primarily in hospitals. We design, manufacture and market patient monitoring solutions for critical, perinatal, sub-acute and perioperative care areas of the hospital, wired and wireless networks, and ambulatory blood pressure monitors, all aimed at providing caregivers with timely patient information. Our diagnostic cardiology systems include Holter recorders and analyzers, ambulatory blood pressure monitors, electrocardiography (ECG), stress event data management systems and related software and services. By making critical patient information more readily accessible both inside and outside the hospital, delays in treatment related decision‑making can be reduced, length of stay can be shortened and treatment errors can be minimized.
We are also a global manufacturer and distributor of anesthesia delivery systems, ventilators and vaporizers. We sell these products primarily to hospitals for use in operating rooms and anesthesia induction areas, as well as in magnetic resonance imaging (MRI) facilities. We also sell subsystems and components, such as anesthesia vaporizers and ventilators, to pharmaceutical companies and other manufacturers of anesthesia delivery systems.
We are also a global manufacturer and distributor of defibrillators outside the U.S. under the Primedic name. We sell these products to emergency first responders and building managers for general use in facilities, hospitals, and emergency vehicles.
Optoelectronics and Manufacturing. Our optoelectronic devices are used in a wide variety of applications for diversified markets including the aerospace and defense, avionics, medical imaging and diagnostics, biochemistry analysis, pharmaceutical, nanotechnology, telecommunications, construction and homeland security markets. Medical applications for our devices include diagnostic and imaging products, patient monitoring equipment, optometry instrumentation, and glucose monitors. Aerospace and defense applications for our devices include satellite navigation sensors, laser guided munitions systems, range finders, weapons simulation systems, computer peripherals and other applications that require the conversion of optical signals into electronic signals. Homeland security applications for our devices include X‑ray based and other detection systems. Our optoelectronic devices and value‑added subsystems are also used in a wide variety of measurement control, monitoring and industrial applications and are key components in telecommunications technologies. We also offer electronics manufacturing services to our optoelectronics customers, as well as to our Security and Healthcare divisions. We offer full turnkey and printed circuit board assembly, cable and harness assembly, liquid crystal displays and box‑build manufacturing services, in which we provide product design and development, supply chain management, and production manufacturing services.
We believe that continued advances in technology and reductions in the cost of key components of optoelectronic systems, including computer processing power and memory, have broadened the market by enabling the use of optoelectronic devices in a greater number of applications. In addition, we see a trend among original equipment manufacturers to increasingly outsource the design and manufacture of optoelectronic devices as well as value‑added subsystems to fully‑integrated, independent manufacturers, like us, that may have greater specialization, broader expertise and more flexibility to respond to short cycle times and quicker market expectations. We believe that our level of vertical integration, substantial engineering resources, expertise in the use and application of optoelectronic technology and low‑cost international manufacturing operations enable us to compete effectively in the market for optoelectronic products and for electronics manufacturing services.
We have also penetrated several related markets that depend on our optoelectronic technologies and electronics manufacturing capabilities. Through system engineering and product development, we also develop, manufacture and sell laser‑based products, as well as sensors for vehicle classification in toll and traffic management systems.
Growth Strategy
We believe that one of our primary competitive strengths is our expertise in the cost‑effective design and manufacture of specialized electronic systems and components for critical applications. As a result, we have leveraged, and intend to continue to leverage, such expertise and capacity to gain price, performance and agility advantages over our competitors in the security, healthcare and optoelectronics fields, and to translate such advantages into profitable growth in those fields. At the same time, we continually seek to identify new markets in which our core expertise and capacity will provide us with competitive advantages. Key elements of this strategy include:
4
Capitalizing on Global Reach. We operate from locations throughout the world. We view our international operations as providing an important strategic advantage over competitors. First, our international manufacturing facilities allow us to take advantage of competitive labor rates and favorable tax regulations in order to be a low cost producer. Second, our international offices strengthen our sales and marketing efforts and our ability to service and repair our systems by providing direct access to growing markets and to our existing international customer base. Third, our international manufacturing locations allow us to reduce delivery times to our global customer base. In the future, we intend to continue to enhance our international manufacturing and sales capabilities.
Capitalizing on Vertical Integration. Our vertical integration provides several advantages in each of our divisions. These advantages include reduced manufacturing and delivery times, lower costs due to our access to competitive international labor markets and direct sourcing of raw materials. We also believe that we offer significant added value to our customers by providing a full range of vertically‑integrated services, including component design and customization, subsystem concept design and application engineering, product prototyping and development, efficient pre‑production and short‑run and high volume manufacturing. We believe that our vertical integration differentiates us from many of our competitors and provides value to our customers who can rely on us to be an integrated supplier. We intend to continue to leverage our vertical integration to create greater value for our customers in the design and manufacture of our products.
Capitalizing on the Growing Market for Security and Inspection Systems. Attentiveness to terrorist and other security threats may continue to drive growth in the market for security and inspection systems in transportation security and also at ports and border crossings, government installations, military facilities and public event venues. The trend toward increased screening of goods entering and departing from ports and borders has resulted, and may continue to result in, the growth in the market for cargo inspection systems and turnkey security screening services that are capable of screening shipping containers for contraband and assisting customs officials in the verification of shipping manifests. Package and cargo screening by freight forwarders, airlines and air cargo companies represents a growing sector, as new regulations in the United States and Europe require such screening in certain circumstances. We intend to expand our sales and marketing efforts, both domestically and internationally, to capitalize on opportunities to replace, service and upgrade existing security installations, and to offer turnkey security screening solutions in which we may construct, staff and/or operate on a long‑term basis security screening checkpoints for our customers. Finally, we also intend to continue to develop new security and inspection technologies, such as our proprietary real time tomography products, and to enhance our current product and service offerings through internal research and development and selective acquisitions.
Improving and Complementing Existing Medical Technologies. We develop and market patient monitoring systems, diagnostic cardiology products, anesthesia delivery systems, ventilators and vaporizers, defibrillators, and associated supplies and accessories. We are able to market and sell many of our product offerings through shared sales channels and distribution networks. Our efforts to develop new products and improve our existing medical technologies are focused on the needs of care providers and their patients. By making decision‑critical patient information available to clinicians at the bedside, throughout a hospital, or even away from the hospital, our products reduce time demands on physicians and nurses, enabling more rapid treatment decisions and improved patient care. Our efforts to improve existing cardiology and anesthesia delivery technologies will also continue to concentrate on providing products that are flexible and intuitive to use so that clinicians can deliver accurate, precise, reliable and cost‑effective care. We focus on enabling hospitals to leverage their IT infrastructure at a significant financial savings, providing actionable alarms at the bedside monitor, the central station monitor and through our software products, thus simplifying the user experience and allowing caregivers to spend more time focusing on the patient.
Selectively Entering New Markets. We intend to continue to selectively enter new markets that complement our existing capabilities in the design, development and manufacture of specialized electronic systems and components for critical applications such as security inspection and patient monitoring, cardiology and anesthesia systems. We believe that by manufacturing products that rely on our existing technological capabilities, we will leverage our integrated design and manufacturing infrastructure to build a larger presence in new markets that present attractive competitive dynamics. We intend to achieve this strategy through internal growth and through selective acquisitions.
Acquiring New Technologies and Companies. Our success depends in part on our ability to continually enhance and broaden our product offerings in response to changing technologies, customer demands and competitive pressures. We have developed expertise in our various lines of business and other areas through internal research and development
5
efforts, as well as through selective acquisitions. We continue to seek acquisition opportunities to broaden our technological expertise and capabilities, lower our manufacturing costs and facilitate our entry into new markets.
Products and Technology
We design, develop, manufacture and sell products ranging from security and inspection systems to patient monitoring, cardiology and anesthesia systems to discrete optoelectronic devices and value‑added subsystems.
Security and Inspection Systems. We design, manufacture and market security and inspection systems globally to end users under the “Rapiscan Systems” trade name. Rapiscan Systems products are used to inspect baggage, parcels, cargo, people, vehicles and other objects for weapons, explosives, drugs, radioactive and nuclear materials and other contraband. These systems are also used for the safe, accurate and efficient verification of cargo manifests for the purpose of assessing duties and monitoring the export and import of controlled materials. Rapiscan Systems products fall into the following categories: baggage and parcel inspection; cargo and vehicle inspection; hold (checked) baggage screening; people screening; radiation detection; and explosive and narcotics trace detection. We also offer turnkey security screening services under the “S2” trade name, including the staffing and operation of security screening checkpoints.
As a result of the terrorist attacks of September 11, 2001, and subsequent attacks in other locations worldwide, security and inspection products have increasingly been used at a wide range of facilities other than airports, such as border crossings, railways, seaports, cruise line terminals, freight forwarding operations, government and military installations and nuclear facilities. As a result of the use of security and inspection products at additional facilities, we have diversified our sales channels for security and inspection products.
Many of our security and inspection systems include dual‑ or multi‑energy X‑ray technology with computer software enhanced imaging technology to facilitate the detection of materials such as explosives, weapons, narcotics, currency or other contraband. While all X‑ray systems produce a two‑dimensional image of the contents of the inspected object, the dual‑energy X‑ray systems also measure the X‑ray absorption of the inspected object’s contents at two X‑ray energies to determine the atomic number, mass and other characteristics of the object’s contents. The various organic and inorganic substances in the inspected object appear to operators of the inspection systems in various colors, and this visual information can be used to identify and differentiate the inspected materials. We have developed a dual‑view X‑ray technology, now available on many of our systems, that allows operators to examine objects from two orthogonal positions simultaneously, thereby reducing the need for re‑scanning of objects and improving the operator’s ability to detect threats. Our baggage and parcel inspection, cargo and vehicle inspection and hold (checked) baggage screening inspection systems range in size from compact tabletop systems to large systems comprising entire buildings in which trucks, shipping containers or pallets are inspected. Many of our inspection systems are also designed to be upgradeable to respond to new customer requirements as they emerge or change.
Our cargo and vehicle inspection applications, in which cars, trucks, shipping containers, pallets and other large objects can be inspected, are designed in various configurations, including fixed‑site, gantry, relocatable, portal and mobile systems. These products are primarily used to verify the contents of cars, trucks or cargo containers and to detect the presence of contraband, including narcotics, weapons, explosives, radioactive and nuclear materials and other smuggled items. They offer significant improvements over past methods of cargo screening, such as manual searches, as our cargo systems are faster, more thorough and do not subject the cargo to pilferage. Entire shipping containers or trucks containing densely packed goods can be screened rapidly.
Many of our cargo and vehicle inspection systems are based on X‑ray technology, in conjunction with digital imaging equipment, to non‑intrusively inspect objects and present images to an inspector, showing shapes, sizes, locations and relative densities of the contents. We also manufacture passive radiation detection devices for detecting nuclear threat material utilizing their gamma and neutron signatures. Additionally, we have developed isotope specific identification algorithms. Many of these systems have been built to meet specific customer inspection requirements.
Our Security division is among the only companies in the market offering X‑ray and neutron‑based material specific technologies. In addition, we are among the only companies that offer inspection systems at energy levels ranging from 200 Kilo electron Volts (KeV) to 1 Mega electron Volt (MeV), 4.5 MeV, 6 MeV, and 9MeV. As a result, we believe
6
that we offer one of the broadest technology platforms in the cargo and vehicle inspection systems industry. This broad platform also permits us to offer customers hybrid solutions utilizing two or more of the technologies together, thereby optimizing flexibility, performance and cost to meet the customer’s unique application requirements.
Our Security division also offers hold (checked) baggage screening systems that are utilized by airports, freight forwarders and other parties responsible for screening baggage and cargo before it is placed in the cargo hold of airplanes. Certain of our currently available systems utilize multiple, dual‑energy X‑ray beams to provide high‑quality images and to enable algorithms that assist operators in the detection of explosives. Other systems utilize a very large number of distributed X‑ray emitters that rapidly capture approximately 1,000 views of a bag and then utilize sophisticated software to reconstruct high resolution images. These systems are designed to meet the high‑speed screening and analysis demands of regulators in the United States and European Union. They can be operated in stand‑alone mode, where a single operator views the images produced by a single system, or can be networked, allowing operators stationed at a remote computer terminal to monitor multiple systems.
Our Security division also offers people screening products, such as a line of “Metor” brand walk‑through metal detection products for use at security checkpoints at airports, amusement parks, banks, courthouses, government buildings, sports arenas and other venues, and the Counterbomber line of suicide bomber detection products. We have also developed a hand‑held trace detection system providing portable light‑weight detection of trace amounts of explosives. This system is designed to be used in screening people, cargo, baggage and other items for illicit materials and weapons.
The following table sets forth certain information related to the standard security and inspection products that we currently offer. We do, however, also customize our standard products to suit specific applications and customer requirements.
|
PRODUCT |
|
PRODUCT NAME / |
|
TECHNOLOGY |
|
MARKET |
|
|
|
|
|
|
|
|
|
Baggage and Parcel Inspection |
|
Rapiscan 600 series |
|
Dual‑energy X‑ray Single and multi-view |
|
Checkpoint inspection at airports, prisons, border crossings, government buildings, air cargo and postal facilities, critical infrastructure protection at power and chemical plants, water resource sites |
|
|
|
|
|
|
|
|
|
|
|
|
|
|
|
|
|
Cargo and Vehicle Inspection |
|
Rapiscan Eagle |
|
High energy X‑ray |
|
Cargo, vehicle and rail car inspection at airports, border crossings and sea ports |
|
|
|
|
|
|
|
|
|
|
|
|
|
|
|
|
|
Hold (Checked) Baggage Screening |
|
Rapiscan MVXR 5000 |
|
Multi‑view, dual energy X‑ray explosive detection system (EDS) Stationary gantry computed tomography EDS |
|
Baggage inspection with automatic explosive detection at airports and freight forwarding facilities |
|
|
|
|
|
|
|
|
|
|
|
|
|
|
|
|
|
People Screening |
|
Metor series metal detectors |
|
Electromagnetic induction Radar and video tracking |
|
Checkpoint inspection at airports, border crossings, military checkpoints, stadiums, prisons and government facilities |
|
|
|
|
|
|
|
|
|
|
|
|
|
|
|
|
|
Radiation Detection |
|
Rapiscan Radiation Monitors |
|
Gamma and neutron detection of radioactive and nuclear material |
|
Cargo, vehicle, rail car and people screening at airports, border crossings, military checkpoints, stadiums, prisons and government facilities |
|
|
|
|
|
|
|
|
|
|
|
|
|
|
|
|
|
Trace Detection |
|
Detectra |
|
IMS based technology hand‑held explosives detection |
|
Checkpoint inspection at airports, border crossings, military checkpoints, stadiums, prisons and government facilities |
|
|
|
|
|
|
|
|
7
Patient Monitoring, Diagnostic Cardiology, Anesthesia Systems and Defibrillators. Our Healthcare division designs, manufactures and markets its products globally to end users primarily under the “Spacelabs”, “Primedic” and “Statcorp” trade names.
Spacelabs products include patient monitors for use in perioperative, critical care and emergency care environments with neonatal, pediatric and adult patients. Our patient monitoring systems comprise monitors and central nursing stations connected via hardwired or wireless networks, as well as stand‑alone monitors where the patient data can be transported physically from one monitor to another as the patient is moved. This enables hospital staff to access patient data where and when it is required. In addition, these products are designed with an “open architecture” to interact with hospital information systems. Many of these products allow clinicians to view and control various software applications on the patient monitor’s display, eliminating the need for separate computer terminals in the patient’s room. Attending nurses can check laboratory results and other reports, enter orders, review protocols and complete medical charting at the patient’s bedside.
For electrocardiograph monitoring or multiparameter monitoring of ambulatory patients, we offer a digital telemetry system. The system operates in government‑protected bands, not used for private land mobile radio, business radio services or broadcast analog and digital television. Spacelabs Intesys Clinical Suite (ICS) provides a software suite allowing hospitals to leverage their infrastructure to capture all data from the bedside, compact and telemetry monitors. Retrospective data formerly only found at a central station monitor is made available at any PC throughout the hospital.
In the past few years, Spacelabs has introduced a number of new products, including the XPREZZON™ patient monitor, followed shortly by the qube™ compact monitor. The qube can be used in both bedside and transport applications. We also introduced a new telemetry transmitter, the AriaTele™, with subsequent product additions to enable the AritaTeleTM to broadcast on a number of specialized frequency bands that are prescribed for global healthcare use. Other recent product introduction were the Xhibit™ Central Station, a highly scalable system providing clinicians the ability to remotely monitor up to 48 patients and the XprezzNet, a high resolution data integration for electronic medical records vendor Cerner, which provides unique patient to device association (P2DA). In June 2015, we introduced the XTR telemetry system. XTR provides a proprietary arrhythmia detection algorithm which continuously analyzes and displays seven leads of ECG on Xhibit or in ICS clinical access.
Our Healthcare division also develops cardiac diagnostic systems, including Holter analyzers and recorders. In 2013, we introduced PathfinderSL, an analysis tool where technicians provide cardiologists simple, actionable Holter reports to any PC, inside or outside the hospital. Our evo Holter recorders provide low cost of ownership through, for example, the elimination of disposable batteries, memory cards with no moving parts to maintain and other advances. Our Lifecard CF Holter recorders are worn by patients for up to seven days in order to capture heart arrhythmias that may occur in a patient only a few times per week. This product is especially helpful in identifying the presence of atrial fibrillation. Patients that may be experiencing even less frequent heart arrhythmias wear our CardioCall product, which stays with the patient over several weeks and transmits its findings over the phone to a receiving station in the hospital. In 2014, we acquired certain assets from Cambridge Cardiac Technologies, including the Cambridge Heart HearTwave II® Stress Testing System product, which provides vital information during an exercise stress test using the optional Microvolt T-Wave™ Alternans test that is designed to help identify patients at risk of sudden cardiac death.
We are also a leading supplier of ambulatory blood pressure (ABP) monitors which are routinely used by physicians around the world and clinical research organizations. Many physicians are using ambulatory blood pressure monitoring to detect “white coat” hypertension, a condition in which people experience elevated blood pressure in the doctor’s office, but not in their daily lives. Ambulatory blood pressure monitoring helps improve diagnostic accuracy and minimize the associated costs of treatment. In 2014, we introduced the OnTrak ambulatory blood pressure system. This system provides the first ambulatory blood pressure monitor to be validated for both pediatric and adult patient types, and includes the capability to measure activity correlation with non-invasive blood pressure readings.
We also provide the Sentinel Cardiology Information Management System, which integrates data from Spacelabs‑branded products into a central enterprise wide database system that can be accessed by care providers and medical facility administrators thereby providing enhanced workflow and efficiencies. In 2015, we introduced a thin client version of Sentinel that enables clinicians to easily interact with remote, centralized databases using their standard browser
8
on PCs, tablets and cell phones. Sentinel 10 supports a zero IT deployment model with smart applets downloaded to user PC devices on demand, simplifying roll-out and maintenance from an IT perspective.
Our anesthesia delivery and ventilation group designs and manufactures anesthesia delivery systems, vaporizers and ventilators. In 2013, we introduced the ARKON Anesthesia System. This is a high‑performance anesthesia delivery system that offers functionality, comfort and control. This anesthesia delivery system can be expanded to enable a wide‑angle view of the clinical setting so the clinician can face the patient, as well as other clinical advancements. The ARKON complements our BleaseSirius, BleaseFocus, and BleaseGenius anesthesia delivery systems. With this broad portfolio of anesthesia systems, we can provide flexible anesthesia solutions for operating room environments, anesthesia induction areas, day surgery centers, magnetic resonance imaging facilities and other locations where the administration of anesthesia is required. Our BleaseDatum anesthesia vaporizers and Blease 700/900 anesthesia ventilators are also designed to be compatible with the anesthesia delivery systems of several other manufacturers.
Our defibrillator products are distributed under the Primedic brand name. The HeartSave One / PAD / AED / AED-M / AS products are for use by public first responders, while the HeartSave 6/6S and DefiMonitor XD / EVO products are for use by medical personnel.
Many of the capital products that Spacelabs sells have supplies and accessories associated with them that can represent significant annuity revenue opportunities. Recognizing this, we integrated Statcorp Medical, which manufactures blood pressure cuffs and rapid infusor bags, into Spacelabs. Statcorp Medical has recently introduced bariatric cuffs providing improved blood pressure measurements from patients with larger arms, as well as patient cables that allow transition between different devices without the need to recable.
The following table sets forth a description of the more significant healthcare products that we currently offer:
|
PRODUCT LINE |
|
PRODUCT NAME / |
|
MARKET SEGMENT |
||
|
|
|
|
|
|
||
|
Patient Monitoring and Connectivity |
|
XPREZZON |
|
Hospital care areas, outpatient surgery centers and physician offices |
||
|
|
|
|
|
|
||
|
Diagnostic Cardiology |
|
Ambulatory blood pressure monitors (various) OnTrak ABP
Pathfinder SL HearTwave II® Stress Testing System |
|
Hospital cardiology care areas and physician offices |
||
|
|
|
|
|
|
||
9
|
Anesthesia Delivery and Ventilation |
|
ARKON |
|
Ambulatory surgery centers and operating rooms |
||
|
|
|
|
|
|
||
|
Defibrillators |
|
HeartSave One / PAD / AED / AED-M / AS HeartSave 6/6S DefiMonitor XD / EVO |
|
Emergency first responders and building management |
||
|
|
|
|
|
|
||
|
Medical Devices and Accessories |
|
UltraCheck, SoftCheck and Curve Blood Pressure Cuffs |
|
All hospital care areas, outpatient surgery centers and physician offices |
||
Optoelectronic Devices and Manufacturing Services. Optoelectronic devices generally consist of both active and passive components. Active components sense light of varying wavelengths and convert the light detected into electronic signals, whereas passive components amplify, separate or reflect light. The active components we manufacture consist of silicon, gallium arsenide and indium gallium arsenide photodetectors and light sources. Passive components include lenses, prisms, filters, mirrors and other precision optical products that are used by us in the manufacture of our optoelectronic products or are sold to third parties for use in telescopes, laser printers, copiers, microscopes and other detection and vision equipment. The devices we manufacture are both standard products and products customized for specific applications and are offered either as components or as subsystems. Our optoelectronic products and services are provided primarily under the “OSI Optoelectronics” trade name.
In addition to the manufacture of standard and original equipment manufacturer products, we also specialize in designing and manufacturing customized value‑added subsystems for use in a wide range of products and equipment. An optoelectronic subsystem typically consists of one or more optoelectronic devices that are combined with other electronic components and packaging for use in an end product. The composition of a subsystem can range from a simple assembly of various optoelectronic devices that are incorporated into other subsystems (for example, a printed circuit board containing our optoelectronic devices) to complete end‑products (for example, pulse oximetry equipment).
We also provide electronics design and manufacturing services both in North America and in the Asia Pacific region with enhanced, RoHS‑compliant, printed circuit board and cable and harness assemblies and box‑build manufacturing services utilizing state‑of‑the‑art automated surface mount technology lines. We offer electronics manufacturing services to original equipment manufacturers for medical, automotive, defense, aerospace, industrial and skin care applications that do not utilize optoelectronic devices. We also manufacture LCD displays for medical, industrial and consumer electronics applications. Our electronics manufacturing services are provided primarily under the “OSI Electronics,” “APlus Products” and “Briton” trade names.
We develop, manufacture and sell laser‑based remote sensing devices that are used to detect and classify vehicles in toll and traffic management systems under the “OSI Laserscan” and “Autosense” trade names. We offer solid‑state laser products for aerospace, defense, telecommunication and medical applications under the “OSI LaserDiode” trade name.
10
The following table sets forth a description of the more significant standard optoelectronics products that we currently offer. We also customize our standard products to suit specific applications and customer requirements.
|
PRODUCT LINE |
|
PRODUCT NAME / |
|
MARKET |
|||
|
|
|
|
|
|
|||
|
Optoelectronic Components |
|
Si and InGaAs Photodiodes and Avalanche Diodes
Position Sensitive Devices |
|
Medical diagnostics instrumentation and analytical chemistry, oximetry and blood chemistry, barcode readers, security scanners and inspection systems, lidar and laser range finder, optical time-domain reflectometer (OTDR) and test and measurement instruments, laser guided munitions, weapon simulation systems, aircraft gyro navigation sensors, satellite sun acquisition sensors, electronic toll collection (ETC) and toll and traffic management systems and laser scanners. |
|||
|
|
|
|
|
|
|||
|
Medical Devices and Accessories |
|
Oximetry Sensors and Accessories |
|
Medical devices and instrumentation |
|||
|
Toll and Traffic Management Systems, Laser Scanners |
|
|
|
Laser based scanners and ETC hardware and software |
|||
Markets, Customers and Applications
Security and Inspection Products. Many security and inspection products were developed in response to civilian airline hijackings. Consequently, a significant portion of our security and inspection products have been and continue to be sold for use at airports. Our security and inspection products are also used for security purposes at locations in addition to airports, such as border crossings, shipping ports, military and other government installations, freight forwarding facilities, high‑profile locations such as Buckingham Palace, the Kremlin and the Vatican and for high‑profile events such as the Olympic Games. Furthermore, as terrorist attacks continue to occur, overall transportation and travel industry demands have increased, resulting in heightened attention for our security and inspection products. We also provide turnkey security screening solutions, which can include the construction, staffing and long‑term operation of security screening locations for our customers.
Our customers include, among many others, the U.S. Customs and Border Protection, U.S. Department of Defense, U.S. Transportation Security Administration and Federal Bureau of Prisons in the United States, as well as Her Majesty’s Revenue and Customs and Manchester Airport Group in the United Kingdom, the Servicio de Administración Tributaria in México, Chek Lap Kok Airport in Hong Kong and Ben Gurion International Airport in Israel.
Patient Monitoring, Diagnostic Cardiology, Anesthesia Systems and Defibrillators. Our patient monitoring, diagnostic cardiology and anesthesia systems are manufactured and distributed globally for use in critical care, emergency and perioperative areas within hospitals as well as physicians’ offices, medical clinics and ambulatory surgery centers. We also provide wired and wireless networks, clinical information access solutions and ambulatory blood pressure monitors. Our defibrillators are manufactured and distributed globally for use in public facilities, medical facilities and ambulances.
We have sold products to organizations such as Eisenhower Medical Center in Rancho Mirage, California, Spartanburg Regional Medical Center in Spartanburg, South Carolina, LSU Medical Center in Shreveport, Louisiana, The Newcastle upon Tyne Hospitals NHS Foundation Trust in the United Kingdom, Centre Hospitalier Saint Joseph—Saint
11
Luc and CHU Bordeaux - Hôpital Pellegrin in France, among many other organizations. We have also sold the products through various group purchasing organizations, including Novation, Inc., Healthtrust Purchasing Group, L.P., MedAssets Supply Chain Systems, LLC, and Premier, Inc., among others.
Optoelectronic Devices and Electronics Manufacturing Services. Our optoelectronic devices and the electronics we manufacture are used in a broad range of products by a variety of customers. For example, they are utilized by customers in the following market segments: defense, aerospace and avionics; analytical and medical imaging; healthcare; telecommunications; homeland security; barcode scanners; toll and traffic management; and automotive diagnostic systems. Major customers in these segments include Raytheon, Honeywell, UTC Aerospace Systems, Northrop Grumman, Covidien, Smiths Medical, Conmed Corporation, Draeger Medical, Beckman Coulter, FireEye, United Technologies, Gilardoni, Microtec, Draeger Safety, Pacific Bioscience Laboratories and Vislink, among others.
Marketing, Sales and Service
We market and sell our security and inspection products and turnkey security screening solutions globally through a direct sales and marketing staff located in the Americas, Europe, Middle East, Africa, Asia and Australia, in addition to an expansive global network of independent distributors. This sales staff is supported by a service organization located primarily in North America, Latin America, Europe and Asia, as well as a global network of independent distributors. We also support these sales and customer relations efforts by providing operator training, computerized training and testing equipment, in‑country service support, software upgrades and service training for customer technicians.
We market and sell our patient monitoring, diagnostic cardiology, anesthesia systems and defibrillators globally through a direct sales and marketing staff located in North America, Europe and Asia, in addition to a global network of independent distributors. We also support these sales and customer service efforts by providing operator in‑service training, comprehensive interactive eLearning for all monitoring products, software updates and upgrades and service training for customer biomedical staff and distributors. We also provide IT specialists and clinical specialists to provide support both before and after product sale.
We market and sell our optoelectronic devices and value‑added manufacturing services, through both a direct sales and marketing staff located in North America, Europe and Asia, and indirectly through a global network of independent distributors. Our sales staff is supported by an applications engineering group whose members are available to provide technical support, which includes designing applications, providing custom tooling and process integration and developing products that meet customer defined specifications.
We consider our maintenance service operations to be an important element of our business. After the expiration of our standard product warranty periods, we are sometimes engaged by our customers to provide maintenance services for our security and inspection products through annual maintenance contracts. In addition, we believe that our expertise in installing, maintaining and operating our security inspection products is an important factor for customers that are considering engaging us to provide turnkey security screening solutions. We provide a variety of service and support options for our healthcare customers, including complete hospital on‑site repair and maintenance service and telephone support, parts exchange programs for customers with the internal expertise to perform a portion of their own service needs and a depot repair center at our division headquarters. We believe that our international maintenance service capabilities allow us to be competitive in selling our security and inspection systems as well as our patient monitoring, cardiology and anesthesia systems. Furthermore, we believe that as the installed base of both our security and inspection systems and patient monitoring, cardiology and anesthesia systems increases, revenues generated from such annual maintenance service contracts and from the sale of replacement parts will increase.
Research and Development
Our security and inspection systems are primarily designed at our facilities in the United States and internationally in Finland and the United Kingdom. These products include mechanical, electrical, analog and digital electronics, software subsystems and algorithms, which are all designed by us. In addition to product design, we provide system integration services to integrate our products into turnkey systems at the customer site. We support cooperative research projects with government agencies and provide contract research for government agencies.
12
Our patient monitoring, diagnostic cardiology, anesthesia and defibrillator products are primarily designed at our facilities in the United States and internationally in China, Germany and the United Kingdom. These products include mechanical, electrical, digital electronic and software subsystems, most of which are designed by us. We are also currently involved, both in the United States and internationally, in several research projects aimed at improving our medical systems and at expanding our current product lines.
We design and manufacture optoelectronic devices and we provide electronics manufacturing services primarily in our facilities in the United States and internationally in the United Kingdom, India, Indonesia, Malaysia and Singapore. We engineer and manufacture subsystems to solve the specific application needs of our original equipment manufacturer customers. In addition, we offer entire subsystem design and manufacturing solutions. We consider our engineering personnel to be an important extension of our core sales and marketing efforts.
In addition to close collaboration with our customers in the design and development of our current products, we maintain an active program for the development and introduction of new products, enhancements and improvements to our existing products, including the implementation of new applications of our technology. We seek to further enhance our research and development program and consider such program to be an important element of our business and operations. As of June 30, 2015, we engaged approximately 442 full‑time engineers, technicians and support staff. Our research and development expenses were $48.2 million in fiscal 2013, $44.8 million in fiscal 2014 and $51.6 million in fiscal 2015. We intend to continue to invest in our research and development efforts in the future.
Manufacturing and Materials
We currently manufacture our security and inspection systems domestically in California, Colorado, Virginia and North Carolina, and internationally in Malaysia and the United Kingdom. We currently manufacture our patient monitoring, diagnostic cardiology, anesthesia systems, defibrillators and related supplies and accessories domestically in Washington and Florida and internationally in China and Germany. We currently manufacture our optoelectronic devices and provide electronics manufacturing services domestically in California and New Jersey, and internationally in India, Indonesia, Malaysia, the United Kingdom and Singapore. Most of our high volume, labor intensive manufacturing and assembly activities are performed at our facilities in India, Indonesia and Malaysia. Since many of our customers are located in the United States, Europe and Asia, our ability to manufacture products in these markets and provide follow‑on service from offices located in these regions is an important component of our global strategy.
Our global manufacturing organization has expertise in optoelectronic, microelectronic and integrated electronics for industrial and automation, medical, aerospace and defense industry applications. Our manufacturing includes silicon wafer processing and fabrication, optoelectronic device assembly and screening, thin and thick film microelectronic hybrid assemblies, surface mounted and thru‑hole printed circuit board electronic assemblies and electronics services, including complete turnkey and box‑build manufacturing. We outsource certain manufacturing operations, including certain sheet metal fabrication and plastic components.
The principal raw materials and subcomponents used in producing our security and inspection systems consist of X‑ray generators, linear accelerators, radioactive isotopes, detectors, data acquisition and computer systems, conveyance systems and miscellaneous mechanical and electrical components. A large portion of the optoelectronic devices, subsystems and circuit card assemblies used in our inspection and detection systems are manufactured in‑house. The majority of our X‑ray generators, linear accelerators, radioactive isotopes and conveyance systems used in our cargo and vehicle inspection systems are purchased from unaffiliated third party providers.
The principal raw materials and subcomponents used in producing our patient monitoring, cardiology and anesthesia systems and related supplies and accessories consist of printed circuit boards, housings, mechanical assemblies, pneumatic devices, touch screens, medical grade displays, cables, filters, textiles, fabric, gauges, fittings, tubing and packaging materials. We purchase certain devices, including computers, peripheral accessories and remote displays from unaffiliated third party providers.
The principal raw materials and subcomponents used in producing our optoelectronic devices and electronic subsystems consist of silicon wafers, electronic components, light emitting diodes, scintillation crystals, passive optical components, printed circuit boards and packaging materials. The silicon‑based optoelectronic devices manufactured by us
13
are critical components in most of our products and subsystems. We purchase silicon wafers and other electronic components from unaffiliated third party providers.
For cost, quality control and efficiency reasons, at times we purchase raw materials and subcomponents only from single vendors with whom we have ongoing relationships. We do, however, qualify second sources for many of our raw materials and critical components. We purchase the materials pursuant to purchase orders placed from time to time in the ordinary course of business. Although to date none of our divisions has experienced any significant shortages or material delays in obtaining raw materials or subcomponents, it is possible that we may face such shortages or delays in one or more materials in the future.
Trademarks and Tradenames, Patents, and Licenses
Trademarks and Tradenames. We have used, registered and applied to register certain trademarks and service marks to distinguish our products, technologies and services from those of our competitors in the United States and in foreign countries. We enforce our trademark, service mark and trade name rights in the United States and abroad.
Patents. We possess rights to a number of U.S. and foreign patents relating to various aspects of our security and inspection products, healthcare products and optoelectronic devices and subsystems. Our current patents will expire at various times between 2015 and 2033. However, it remains possible that pending patent applications or other applications that may be filed may not result in issued patents. In addition, issued patents may not survive challenges to their validity or enforceability, or may be found to not be infringed by any third parties. Although we believe that our patents have value, our patents, or any additional patents that may be issued in the future, may not be able to provide meaningful protection from competition.
Licenses. Our Security, Healthcare and Optoelectronics and Manufacturing divisions have each entered into a variety of license arrangements under which certain third parties are permitted to manufacture, market, and/or sell a limited number of the products that we offer and/or to service various types of software, data, equipment, components and enhancements to our own proprietary technology.
We believe that our trademarks and tradenames, patents and licenses are important to our business. The loss of some of our trademarks, patents or licenses might have a negative impact on our financial results and operations. Nevertheless, with the exception of the loss of either the Spacelabs® or Rapiscan® trademarks, the impact of the loss of any single trademark, patent or license would not likely have a material adverse effect on our business. As of June 30, 2015, the Spacelabs brand is protected by both pending and registered trademarks in 39 countries; and the Rapiscan brand is protected by both pending and registered trademarks in 17 countries.
Regulation of Medical Devices
The patient monitoring, cardiology and anesthesia systems we manufacture and market are subject to regulation by numerous government agencies, principally the U.S. Food and Drug Administration (FDA) and by other federal, state, local and foreign authorities. They are also subject to various U.S. and foreign electrical safety standards. Our medical device product candidates must undergo an extensive government regulatory clearance or approval process prior to sale in the United States and other countries, and the lengthy process of clinical development and submissions for approvals, as well as the continuing need for compliance with applicable laws and regulations, require the expenditure of substantial resources.
United States. In the United States, the FDA has broad regulatory powers with respect to pre‑clinical and clinical testing of new medical devices and the designing, manufacturing, labeling, storage, record keeping, marketing, advertising, promotion, distribution, post‑approval monitoring and reporting and import and export of medical devices. Unless an exemption applies, federal law and FDA regulations require that all new or significantly modified medical devices introduced into the market be preceded either by a pre‑market notification clearance order under section 510(k) of the Federal Food, Drug and Cosmetic Act (FDCA), or an approved pre‑market approval (PMA) application. Under the FDCA, medical devices are classified into one of three classes—Class I, Class II or Class III—depending on the degree of risk associated with each medical device and the extent of control needed to provide reasonable assurances with respect to
14
safety and effectiveness. Class I devices are those for which safety and effectiveness can be reasonably assured by adherence to a set of regulations, referred to as General Controls, which require compliance with the applicable portions of the FDA’s Quality System Regulation (QSR) facility registration and product listing, reporting of adverse events and malfunctions, and appropriate, truthful and non‑misleading labeling and promotional materials. Some Class I devices, also called Class I reserved devices, also require pre-market clearance by the FDA through the 510(k) pre-market notification process described below. Most Class I products are exempt from the pre-market notification requirements.
Class II devices are those that are subject to the General Controls, as well as Special Controls, which can include performance standards, guidelines and post‑market surveillance. Most Class II devices are subject to pre-market review and clearance by the FDA. Pre-market review and clearance by the FDA for Class II devices is accomplished through the 510(k) pre-market notification process. Under the 510(k) process, the manufacturer must submit to the FDA a pre-market notification, demonstrating that the product for which clearance has been sought is substantially equivalent to a previously cleared 510(k) device or a device that was in commercial distribution before May 28, 1976 for which the FDA had not yet called for the submission of pre‑market approval applications. To be substantially equivalent, the proposed device must have the same intended use as the predicate device, and either have the same technological characteristics as the predicate device or have different technological characteristics and not raise different questions of safety or effectiveness than the predicate device. Clinical data is sometimes required to support substantial equivalence.
After a 510(k) notice is submitted, the FDA determines whether to accept it for substantive review. If it lacks necessary information for substantive review, the FDA will refuse to accept the 510(k) notification. If it is accepted for filing, the FDA begins a substantive review. By statute, the FDA is required to complete its review of a 510(k) notification within 90 days of receiving the 510(k) notification. As a practical matter, clearance often takes longer, and clearance is never assured. Although many 510(k) pre-market notifications are cleared without clinical data, the FDA may require further information, including clinical data, to make a determination regarding substantial equivalence, which may significantly prolong the review process. If the FDA agrees that the device is substantially equivalent, it will grant clearance to commercially market the device.
After a device receives 510(k) clearance, any modification that could significantly affect its safety or effectiveness, or that would constitute a new or major change in its intended use, will require a new 510(k) clearance or, depending on the modification, could require a PMA application. The FDA requires each manufacturer to make this determination initially, but the FDA can review any such decision and can disagree with a manufacturer’s determination. If the FDA disagrees with a manufacturer’s determination regarding whether a new pre-market submission is required for the modification of an existing device, the FDA can require the manufacturer to cease marketing and/or recall the modified device until 510(k) clearance or approval of a PMA application is obtained. If the FDA requires us to seek 510(k) clearance or approval of a PMA application for any modifications to a previously cleared product, we may be required to cease marketing or recall the modified device until we obtain this clearance or approval. In addition, in these circumstances, we may be subject to significant regulatory fines or penalties for failure to submit the requisite PMA application(s). In addition, the FDA is currently evaluating the 510(k) process and may make substantial changes to industry requirements.
Class III devices include devices deemed by the FDA to pose the greatest risk such as life‑supporting or life‑sustaining devices, or implantable devices, in addition to those deemed not substantially equivalent following the 510(k) process. The safety and effectiveness of Class III devices cannot be reasonably assured solely by the General Controls and Special Controls described above. Therefore, these devices are subject to the PMA application process, which is generally more costly and time consuming than the 510(k) process. To date, all of the patient monitoring, cardiology and anesthesia systems we manufacture and sell in the United States have required only 510(k) pre‑market notification clearance.
FDA clearance or approval, when granted, may entail limitations on the indicated uses for which a product may be marketed, and such product approvals, once granted, may be withdrawn if problems occur after initial marketing. Manufacturers of FDA‑regulated products are subject to pervasive and continuing governmental regulation, including, but not limited to, the registration and listing regulation, which requires manufacturers to register all manufacturing facilities and list all medical devices placed into commercial distribution; the QSR, which requires manufacturers, including third party manufacturers, to follow elaborate design, testing, production, control, supplier/contractor selection, complaint handling, documentation and other quality assurance procedures during the manufacturing process; labeling regulations
15
and unique device identification requirements; advertising and promotion requirements; restrictions on sale, distribution or use of a device; PMA annual reporting requirements; the FDA’s general prohibition against promoting products for unapproved or “off‑label” uses; the Medical Device Reporting (MDR) regulation, which requires that manufacturers report to the FDA if their device may have caused or contributed to a death or serious injury or malfunctioned in a way that would likely cause or contribute to a death or serious injury if it were to reoccur; medical device correction and removal reporting regulations, which require that manufacturers report to the FDA field corrections and product recalls or removals if undertaken to reduce a risk to health posed by the device or to remedy a violation of the FDCA that may present a risk to health; recall requirements, including a mandatory recall if there is a reasonable probability that the device would cause serious adverse health consequences or death; an order of repair, replacement or refund; device tracking requirements; and post‑approval study and post‑market surveillance requirements.
Our facilities, records and manufacturing processes are subject to periodic unscheduled inspections by the FDA. Failure to comply with the applicable United States medical device regulatory requirements could result in, among other things, warning letters, untitled letters, fines, injunctions, consent decrees, civil penalties, unanticipated expenditures, repairs, replacements, refunds, recalls or seizures of products, operating restrictions, total or partial suspension of production, the FDA’s refusal to issue certificates to foreign governments needed to export products for sale in other countries, the FDA’s refusal to grant future pre-market clearances or approvals, withdrawals or suspensions of current product clearances or approvals and criminal prosecution.
In August 2014, the FDA issued a warning letter to our Healthcare division relating primarily to the maintenance of certain procedures and internal processes at our facility in Snoqualmie, Washington. We have implemented corrective actions as a result of the warning letter and provided the FDA with a detailed response regarding our completed and in process activities. However, there can be no assurance that the FDA will be satisfied with our response to the warning letter or our proposed resolution of the outstanding issues. Until the items raised in the warning letter are fully corrected, we may be subject to additional regulatory action by the FDA, including the issuance of additional warning letters, injunction, seizure or recall of products, imposition of fines or penalties or operating restrictions on our facilities. Such actions could significantly disrupt our ongoing business and operations and have a material adverse impact on our financial position and operating results.
Foreign Regulation. We are also subject to regulation in the foreign countries in which we manufacture and market our patient monitoring, cardiology and anesthesia systems. For example, the commercialization of medical devices in the European Union is regulated under a system that presently requires all medical devices sold in the European Union to bear the CE mark—an international symbol of adherence to quality assurance standards. Our manufacturing facilities in Hawthorne, California; Jacksonville, Florida; Snoqualmie, Washington; Rottweil, Germany; Johor Bahru, Malaysia; Batam, Indonesia; Hyderabad, India; and Suzhou, China are all certified to the International Organization for Standardization’s ISO 13485 standard for medical device quality management systems. Our Hawthorne, California; Snoqualmie, Washington; and Rottweil, Germany facilities are also certified to the requirements of Annex II, section 3 of the Directive 93/42/EEC on Medical Devices, which allows them to self‑certify that manufactured products can bear the CE mark. Further, the implementation of the Restriction of Hazardous Substance Directive (“ROHS”) requires that medical devices shipped into the European Union eliminate targeted ROHS substances effective July 23, 2014.
Coverage and Reimbursement. Government and private sector initiatives to limit the growth of healthcare costs, including price regulation and competitive pricing, coverage and payment policies, comparative effectiveness therapies, technology assessments and managed care arrangements, are continuing in many countries where we do business, including the United States, Europe and Asia. As a result of these changes, the marketplace has placed increased emphasis on the delivery of more cost‑effective medical therapies. In addition, because there is generally no separate reimbursement from third‑party payors to our customers for many of our products, the additional costs associated with the use of our products can impact the profit margin of our customers. Accordingly, these various initiatives have created increased price sensitivity over healthcare products generally and may impact demand for our products and technologies.
Healthcare cost containment efforts have also prompted domestic hospitals and other customers of medical devices to consolidate into larger purchasing groups to enhance purchasing power, and this trend is expected to continue. The medical device industry has also experienced some consolidation, partly in order to offer a broader range of products to large purchasers. As a result, transactions with customers are larger, more complex and tend to involve more long‑term
16
contracts than in the past. These larger customers, due to their enhanced purchasing power, may attempt to increase the pressure on product pricing.
In 2010, significant reforms to the healthcare system were adopted as law in the United States. Among other things, the Patient Protection and Affordable Care Act, as amended by the Health Care and Education Reconciliation Act, which we refer to collectively as the Affordable Care Act, requires the medical device industry to subsidize healthcare reform in the form of a 2.3% excise tax on United States sales of most medical devices, which went into effect in 2013. The excise tax has increased our operating expenses. The effects of the Affordable Care Act upon the healthcare industry are still being determined and the long‑term impact on us is uncertain.
In addition, other legislative changes have been proposed and adopted since the Affordable Care Act was enacted. On August 2, 2011, the Budget Control Act of 2011 was signed into law, which, among other things, created the Joint Select Committee on Deficit Reduction to recommend to Congress proposals in spending reductions. The Joint Select Committee did not achieve a targeted deficit reduction of at least $1.2 trillion for the years 2013 through 2021, triggering the legislation’s automatic reduction to several government programs. This includes reductions to Medicare payments to providers of 2% per fiscal year, which went into effect in April 2013 and will stay in effect through 2024, unless additional Congressional action is taken. On January 2, 2013, the American Taxpayer Relief Act of 2012 (ATRA) was signed into law which, among other things, further reduced Medicare payments to several providers, including hospitals and imaging centers. We expect that additional state and federal healthcare reform measures will be adopted in the future, any of which could limit the amounts that federal and state governments will pay for healthcare products and services, which could result in reduced demand for our products or additional pricing pressure.
Other Healthcare Laws. In addition to FDA restrictions on marketing and promotion of drugs and devices, other federal and state laws restrict our business practices. These laws include, without limitation, data privacy and security laws, anti‑kickback and false claims laws, and transparency laws regarding payments or other items of value provided to healthcare providers.
As a participant in the healthcare industry, we are subject to extensive regulations protecting the privacy and security of patient health information that we receive, including the Health Insurance Portability and Accountability Act of 1996 (HIPAA), as amended by the Health Information Technology for Economic and Clinical Health Act of 2009 (HITECH), which was enacted as part of the American Recovery and Reinvestment Act of 2009. Among other things, these regulations impose extensive requirements for maintaining the privacy and security of individually identifiable health information, known as “protected health information.” The HIPAA privacy regulations do not preempt state laws and regulations relating to personal information that may also apply to us. Our failure to comply with these regulations could expose us to civil and criminal sanctions.
The federal Anti‑Kickback Statute prohibits, among other things, knowingly and willfully offering, paying, soliciting or receiving any remuneration (including any kickback, bribe or rebate), directly or indirectly, overtly or covertly, to induce or in return for the purchasing, leasing, ordering, or arranging for or recommending the purchase, lease or order of items or services for which payment may be made, in whole or in part, under Medicare, Medicaid or other federal healthcare programs. The term “remuneration” has been broadly interpreted to include anything of value. Although there are a number of statutory exceptions and regulatory safe harbors protecting some common activities from prosecution, the exceptions and safe harbors are drawn narrowly. Further, a claim including items or services resulting from a violation of the federal Anti‑Kickback Statute constitutes a false or fraudulent claim for purposes of the federal civil False Claims Act.
The federal False Claims Act prohibits, among other things, any person or entity from knowingly presenting, or causing to be presented, a false or fraudulent claim for payment or approval to the federal government, or knowingly making, using or causing to be made or used a false record or statement material to a false or fraudulent claim to the federal government. A claim includes “any request or demand” for money or property presented to the U.S. Government. Medical device manufacturers have been held liable under these laws if they are deemed to cause the submission of false or fraudulent claims by, for example, providing customers with inaccurate billing or coding information.
The HIPAA provisions also created federal criminal statutes that prohibit among other actions, knowingly and willfully executing, or attempting to execute, a scheme to defraud any healthcare benefit program, including private third‑party payors, knowingly and willfully embezzling or stealing from a healthcare benefit program, willfully obstructing
17
a criminal investigation of a healthcare offense, and knowingly and willfully falsifying, concealing or covering up a material fact or making any materially false, fictitious or fraudulent statement in connection with the delivery of or payment for healthcare benefits, items or services. Like the Anti‑Kickback Statute, a person or entity does not need to have actual knowledge of the statutes or specific intent to violate them in order to have committed a violation. Also, many states have similar fraud and abuse statutes or regulations that may be broader in scope and may apply regardless of payor, in addition to items and services reimbursed under Medicaid and other state programs.
These laws impact the kinds of financial arrangements we may have with hospitals or other potential purchasers of our products. They particularly impact how we structure our sales offerings, including discount practices, customer support, education and training programs, physician consulting, research grants and other service arrangements. If our operations are found to be in violation of any of the health regulatory laws described above or any other laws that apply to us, we may be subject to penalties, including potentially significant criminal and civil and administrative penalties, damages, fines, disgorgement, imprisonment, exclusion from participation in government healthcare programs, contractual damages, reputational harm, and the curtailment or restructuring of our operations, any of which could adversely affect our ability to operate our business and our results of operations.
Additionally, there has been a recent trend of increased federal and state regulation of payments and other transfers of value provided to healthcare professionals or entities. The federal Physician Payment Sunshine Act requires that certain device manufacturers track and report to the government information regarding payments and other transfers of value to physicians and teaching hospitals, as well as ownership and investment interests held by physicians and their family members. A manufacturer’s failure to submit timely, accurately and completely the required information for all payments, transfers of value or ownership or investment interests may result in civil monetary penalties of up to an aggregate of $150,000 per year, and up to an aggregate of $1 million per year for “knowing failures.” Certain states also mandate implementation of compliance programs, impose restrictions on device manufacturer marketing practices and/or require the tracking and reporting of gifts, compensation and other remuneration to healthcare professionals and entities.
We are subject to similar laws in foreign countries where we conduct business. For example, within the European Union, the control of unlawful marketing activities is a matter of national law in each of the member states. The member states of the European Union closely monitor perceived unlawful marketing activity by companies. We could face civil, criminal and administrative sanctions if any member state determines that we have breached our obligations under its national laws. Industry associations also closely monitor the activities of member companies. If these organizations or authorities name us as having breached our obligations under their regulations, rules or standards, our reputation would suffer and our business and financial condition could be adversely affected.
Environmental Regulations
We are subject to various environmental laws, directives, and regulations pertaining to the use, storage, handling and disposal of hazardous substances used, and hazardous wastes generated, in the manufacture of our products. Such laws mandate the use of controls and practices designed to mitigate the impact of our operations on the environment, and under such laws we may be held liable for the costs associated with the remediation and removal of any unintended or previously unknown releases of hazardous substances on, beneath or from our property and associated operations, including the remediation of hazardous waste disposed off‑site. Such laws may impose liability without regard to whether we knew of, or caused, the release of such hazardous substances. Any failure by us to comply with present or future regulations could subject us to the imposition of substantial fines, suspension of production, alteration of manufacturing processes or cessation of operations, any of which could have a material adverse effect on our business, financial condition and results of operations.
We believe that, except to an extent that would not have a material adverse effect on our business, financial condition or results of operations, we are currently in compliance with all environmental regulations in connection with our manufacturing operations, and that we have obtained all environmental permits necessary to conduct our business. The amount of hazardous substances used, and hazardous wastes generated, by us may increase in the future depending on changes in our operations. To ensure compliance and practice proper due diligence, we conduct appropriate environmental investigations at our manufacturing facilities in North America, Asia Pacific, and Europe, and, to the extent practicable, on all new properties. These investigations address matters related to current and former occupants and operations, historical land use, and regulatory oversight and status of associated properties and/or operations (including surrounding
18
properties). The purpose of each study is to identify, as of the date of such report, potential areas of environmental concern related to past and present activities or from nearby operations. The scope and extent of each investigation is dependent upon the size and complexity of the property and/or operation and on recommendations by independent environmental consultants.
During one such investigation at our Hawthorne, California facility, we discovered soil and groundwater contamination that we believe was the result of unspecified on‑ and off‑site releases occurring prior to our occupancy. Historical usage of this site includes semiconductor and electronics manufacturing, dating back to the mid‑1960s, as well as possible aircraft and related manufacturing dating back to the early 1940s. Similar operations, including chemical manufacturing and storage, were conducted at neighboring sites throughout that period and into the 1990s. It is not presently known when the releases occurred or by whom they were caused, though our records, in conjunction with data obtained from soil and groundwater surveys, support our assertion that these releases are historical in nature. The groundwater contamination is a known regional issue, not limited to our premises or our immediate surroundings. We filed the requisite reports concerning this site with the appropriate environmental authorities upon discovery, and in cooperation with the local governing agency, have provided additional historical information and conducted further site characterization studies. Recent activities include the installation of groundwater monitoring wells, indoor air quality monitoring and additional soil and soil vapor studies. Results from these studies are being evaluated to determine the extent of the on‑site releases as well as appropriate and cost-effective remedial action measures. Periodic groundwater monitoring is expected to continue until such time as the governing authority requests further action.
Competition
The markets in which we operate are highly competitive and characterized by evolving customer needs and rapid technological change. We compete with a number of other manufacturers, some of which have significantly greater financial, technical and marketing resources than we have. In addition, these competitors may have the ability to respond more quickly to new or emerging technologies, adapt more quickly to changes in customer requirements, have stronger customer relationships, have greater name recognition and devote greater resources to the development, promotion and sale of their products than we do. As a result, we may not be able to compete successfully against designers and manufacturers of specialized electronic systems and components or within the markets for security and inspection systems, patient monitoring, diagnostic cardiology, anesthesia systems and defibrillator products or optoelectronic devices. Future competitive pressures may materially and adversely affect our business, financial condition and results of operations.
In the security and inspection market, competition is based primarily on factors such as product performance, functionality and quality, government regulatory approvals and qualifications, the overall cost effectiveness of the system, prior customer relationships, technological capabilities of the products, price, local market presence and breadth of sales and service organization. We believe that our principal competitors in the market for security and inspection products are Smiths Detection, L‑3 Communications—Security and Detection Systems division, American Science and Engineering, Morpho Detection, Leidos, CEIA, Nuctech and Astrophysics. Competition could result in price reductions, reduced margins and loss of market share. Although our competitors offer products in competition with one or more of our products, we can supply a variety of system types and offer among the widest array of solutions available from a single supplier. This variety of technologies also permits us to offer unique hybrid systems to our customers that utilize two or more of these technologies, thereby optimizing flexibility, performance and cost to meet the customer’s unique application requirements.
In the patient monitoring, diagnostic cardiology, anesthesia systems delivery and defibrillator market, competition is also based on a variety of factors including product performance, functionality, value and breadth of sales and service organization. We believe that our principal competitors in the market for patient monitoring, diagnostic cardiology, anesthesia systems and related supplies are Philips Healthcare, GE Healthcare, Mindray Medical, Mortara Instrument, Dräger Medical, Nihon Kohden, Penlon, Maquet and Welch Allyn. We believe that our principal competitors in the market for our defibrillator products are Koninklijke Philips N.V., Zoll Medical Corporation, Physio-Control, Inc. and Cardiac Science. Competition could result in price reductions, reduced margins and loss of our market share. We believe that our patient monitoring products are easier to use than the products of many of our competitors because we offer a consistent user interface throughout many of our product lines. We also believe that the capability of our monitoring systems to connect together, and to the hospital IT infrastructure, is a key competitive advantage. Further, while some of our competitors are also beginning to introduce portal technology, which allows remote access to data from the bedside monitor, central station or other point of care, we believe that our competing technologies are superior in bringing instant
19
access to labs, radiology and charting at the point of care. Additionally, our defibrillator products have the ability to control the amount of current administered to a patient, which sets our products apart from a number of competitive products.
In the markets in which we compete to provide optoelectronic devices and electronics manufacturing services, competition is based primarily on such factors as expertise in the design and development of optoelectronic devices, product quality, timeliness of delivery, price, customer technical support and the ability to provide fully integrated services from application development and design through production. We believe that our major competitors in the optoelectronic device markets where we provide products and services are Hamamatsu Photonics, First Sensor and Excelitas Technologies. Because we specialize in custom subsystems requiring a high degree of engineering expertise, we believe that we generally do not compete to any significant degree with any other large United States, European or Asian manufacturers of standard optoelectronic components. Competition in the extensive electronic manufacturing services market ranges from multinational corporations with sales in excess of several billions of dollars, to large regional competitors and to small local assembly companies. In our experience, the original equipment manufacturers to whom we provide such services prefer to engage companies that offer both local and lower‑cost off‑shore facilities. We believe that our primary domestic competitors for these services are Flextronics, Benchmark Electronics, Plexus, Qual Pro, ESC and Express Manufacturing Inc. In addition, our high‑volume, low‑cost contract manufacturing locations in Southeast Asia compete with other manufacturers in the same region.
Backlog
We measure our backlog as quantifiable purchase orders or contracts that have been signed, but for which revenues have not yet been recognized. In instances where we are not able to estimate the value of a purchase order or contract, it is not included in backlog.
We ship most of our baggage and parcel inspection, people screening, patient monitoring, cardiology and anesthesia systems and optoelectronic devices and value‑added subsystems within one to several months after receiving an order. However, such shipments may be delayed for a variety of reasons, including any special design or requirements of the customer. In addition, large orders of security and inspection products typically require greater lead‑times. Fulfillment of orders of our Rapiscan RTT hold (checked) baggage screening equipment generally requires longer lead times. Further, we provide turnkey screening services to certain customers for which we may recognize revenue over multi‑year periods.
Certain of our cargo and vehicle inspection systems may require up to a year of lead‑time. We have experienced some significant shipping delays associated with our cargo and vehicle inspection systems. Such delays can occur for many reasons, including: (i) additional time necessary to coordinate and conduct factory inspections with the customer before shipment; (ii) a customer’s need to engage in time‑consuming special site preparation to accommodate the system, over which we have no control or responsibility; (iii) additional fine tuning of such systems once they are installed; (iv) design or specification changes by the customer; (v) time needed to obtain export licenses and/or letters of credit; and (vi) delays originating from other contractors on the project.
As of June 30, 2015, our consolidated backlog totaled approximately $0.6 billion, compared to approximately $0.8 billion as of June 30, 2014 and approximately $1.0 billion at June 30, 2013. This gradual decline in backlog is primarily attributable to a single large turnkey security screening program in Mexico that we were awarded in fiscal 2012. As the revenue generated from this program is recognized, the corresponding backlog decreases. Sales orders underlying our backlog are firm orders; although, from time to time we may agree to permit a customer to cancel an order or an order may be cancelled for other reasons. Variations in the size of orders, product mix, or delivery requirements, among other factors, may result in substantial fluctuations in backlog from period to period. Backlog as of any particular date should not be relied upon as indicative of our revenues for any future period and cannot be considered a meaningful indicator of our performance on an annual or quarterly basis.
Employees
As of June 30, 2015, we employed approximately 5,810 people, of whom 3,358 were employed in manufacturing, 442 were employed in engineering or research and development, 514 were employed in administration, 393 were employed in sales and marketing and 1,103 were employed in service capacities. Of the total employees, 2,017 were employed in the
20
Americas, 3,117 were employed in Asia and 676 were employed in Europe. Many of our employees in Europe have statutory collective bargaining rights. We have never experienced a work stoppage or strike, and management believes that our relations with our employees are good.
Available Information
We are subject to the informational requirements of the Exchange Act. Therefore, we file periodic reports, proxy statements and other information with the Securities and Exchange Commission. Such reports, proxy statements and other information may be obtained by visiting the Public Reference Room of the Securities and Exchange Commission at 100 F Street, N.E., Washington, D.C. 20549 or by calling the Securities and Exchange Commission at 1‑800‑SEC‑0330. In addition, the Securities and Exchange Commission maintains an internet website (http://www.sec.gov) that contains reports, proxy statements and other information that issuers are required to file electronically.
Our internet address is: http://www.osi‑systems.com. The information found on, or otherwise accessible through, our website is not incorporated into, and does not form a part of, this annual report on Form 10‑K or any other report or document we file with or furnish to the Securities and Exchange Commission. We make available, free of charge through our internet website, our annual reports on Form 10‑K, quarterly reports on Form 10‑Q, current reports on Form 8‑K, amendments to those reports filed or furnished pursuant to Section 13(a) or 15(d) of the Exchange Act, and reports filed pursuant to Section 16 of the Exchange Act, as soon as reasonably practicable after electronically filing such material with, or furnishing it to, the Securities and Exchange Commission. Also available on our website free of charge are our Corporate Governance Guidelines, the Charters of our Nominating and Governance, Audit, Compensation and Executive Committees of our Board of Directors and our Code of Ethics and Conduct (which applies to all Directors and employees, including our principal executive officer, principal financial officer and principal accounting officer). A copy of this annual report on Form 10‑K is available without charge upon written request addressed to: c/o Secretary, OSI Systems, Inc., 12525 Chadron Avenue, Hawthorne, CA 90250 or by calling telephone number (310) 978‑0516.
Set forth below and elsewhere in this report and in other documents we file with the Securities and Exchange Commission are descriptions of the risks and uncertainties that could cause our actual results to differ materially from the results contemplated by the forward‑looking statements contained in this report. We encourage you to carefully consider all such risk factors when making investment decisions regarding our company. If any such risks, or any other risks that we do not currently consider to be material, or which are not known to us, materialize, our business, financial condition and operating results could be materially adversely affected.
Fluctuations in our operating results may cause our stock price to decline.
Given the nature of the markets in which we participate, it is difficult to reliably predict future revenues and profitability. Changes in competitive, market and economic conditions may cause us to adjust our operations. A high proportion of our costs are fixed, due in part to our significant sales, research and development and manufacturing costs. Thus, small declines in revenue could disproportionately affect our operating results. Factors that may affect our operating results and/or the market price of our Common Stock include, but are not limited to:
|
· |
demand for and market acceptance of our products; |
|
· |
competitive pressures resulting in lower selling prices; |
|
· |
adverse changes in the level of economic activity in regions in which we do business; |
|
· |
low or fluctuating levels of political stability in regions in which we do business; |
|
· |
adverse changes in industries on which we are particularly dependent; |
|
· |
changes in the portions of our revenue represented by various products and customers; |
|
· |
delays or problems in the introduction of new products; |
21
|
· |
announcements or introductions of new products, services or technological innovations by our competitors; |
|
· |
variations in our product mix; |
|
· |
timing and amount of our expenditures in anticipation of future sales; |
|
· |
availability of equity and credit markets to provide our customers with funding to make equipment purchases; |
|
· |
public guidance that we provide regarding future financial results based on facts, judgments and assumptions made at the time of the publication of the guidance, all of which may change after the publication of the guidance; |
|
· |
negative resolutions of the matters raised in the warning letter issued in August 2014 by the FDA to our Healthcare division, or additional actions by or requests from the FDA and unanticipated costs or delays associated with the resolution of these matters; |
|
· |
adverse outcomes in our litigation matters; |
|
· |
exchange rate fluctuations; |
|
· |
increased costs of raw materials or supplies; |
|
· |
changes in the volume or timing of product orders; |
|
· |
timing of completion of acceptance testing of some of our products; |
|
· |
changes in regulatory requirements; |
|
· |
natural disasters; and |
|
· |
changes in general economic factors. |
Unfavorable currency exchange rate fluctuations could adversely affect our financial results.
Our international sales and our operations in foreign countries expose us to risks associated with fluctuating currency values and exchange rates. Gains and losses on the conversion of accounts receivable, accounts payable and other monetary assets and liabilities to U.S. dollars may contribute to fluctuations in our results of operations. In addition, since we conduct business in currencies other than the U.S. dollar but report our financial results in U.S. dollars, increases or decreases in the value of the U.S. dollar relative to other currencies could have an adverse effect on our results of operations.
We face aggressive competition in each of our operating divisions. If we do not compete effectively, our business will be harmed.
We encounter aggressive competition from numerous competitors in each of our divisions. In the security and inspection and patient monitoring, cardiology and anesthesia systems markets, competition is based primarily on such factors as product performance, functionality and quality, cost, prior customer relationships, technological capabilities of the product, price, certification by government authorities, past performance, local market presence and breadth of sales and service organization. In the optoelectronic devices and electronics manufacturing markets, competition is based primarily on factors such as expertise in the design and development of optoelectronic devices, product quality, timeliness of delivery, price, customer technical support and on the ability to provide fully‑integrated services from application development and design through volume subsystem production. We may not be able to compete effectively with all of our competitors. To remain competitive, we must develop new products and enhance our existing products and services in a
22
timely manner. We anticipate that we may have to adjust the prices of many of our products to stay competitive. In addition, new competitors may emerge and entire product lines or service offerings may be threatened by new technologies or market trends that reduce the value of these product lines or service offerings.
The September 11, 2001 terrorist attacks, subsequent attacks in other locations worldwide and the creation of the U.S. Department of Homeland Security have increased financial expectations that may not materialize.
The September 11, 2001 terrorist attacks and subsequent attacks in other locations worldwide have created increased interest in our security and inspection systems and service offerings. However, we are not certain whether the level of demand will continue to be as high as it is now. We do not know what solutions will continue to be adopted by the U.S. Department of Homeland Security, the U.S. Department of Defense, and similar agencies in other countries and whether our products will be a part of those solutions. Additionally, should our products and services be considered as a part of future security solutions, it is unclear what the level may be and how quickly funding to purchase our products and services may be made available. These factors may adversely impact us and create unpredictability in revenues and operating results.
If operators of, or algorithms installed in, our security and inspection systems fail to detect weapons, explosives or other devices or materials that are used to commit a terrorist act, we could be exposed to product and professional liability and related claims for which we may not have adequate insurance coverage.
Our business exposes us to potential product liability risks that are inherent in the development, manufacturing, sale and service of security and inspection systems as well as in the provision of training to our customers in the use and operation of such systems. Our customers use our security and inspection systems to help them detect items that could be used in performing terrorist acts or other crimes. Some of our security and inspection systems require that an operator interpret an image of suspicious items within a bag, parcel, container or other vessel. Others signal to the operator that further investigation is required. In either case, the training, reliability and competence of the customer’s operator are crucial to the detection of suspicious items.
Security inspection systems that signal to the operator that further investigation is required are sometimes referred to in the security industry as “automatic” detection systems. Such systems utilize software algorithms (often designed to meet government requirements) to interpret data produced by the system and to signal to the operator when a dangerous object may be present. Such algorithms are probabilistic in nature and are also subject to significant technical limitations. Nevertheless, if such a system were to fail to signal to an operator when an explosive or other contraband was in fact present, resulting in significant damage, we could become the subject of significant product liability claims.
Furthermore, security inspection by technological means is circumstance and application‑specific. Our security and inspection systems are not designed to work under all circumstances and can malfunction.
We also offer turnkey security screening solutions under which we perform certain of the security screening tasks that have historically been performed by our customers. Such tasks include: design, layout and construction of the security checkpoint where the inspection equipment is located; selection of the security equipment to be used at the checkpoint; selection, training and management of the personnel operating the checkpoint; operation of the security screening equipment; interpretation of the images and other signals produced by the security screening equipment; maintenance and security of the checkpoint as well as other related services. Such projects expose us to certain professional liability risks that are inherent in performing security inspection services (in live checkpoint environments and over extended periods of time) for the purpose of assisting our customers in the detection of contraband items, including items that could be used in performing terrorist acts or other crimes. If a contraband item were to pass through the checkpoint and be used to perform a terrorist act or other crime, we could become the subject of significant professional liability claims.
In addition, there are also many other factors beyond our control that could lead to liability claims should an act of terrorism occur. The 1993 World Trade Center bombing, the September 11, 2001 attacks, subsequent attacks in other locations worldwide and the potential for future attacks have caused commercial insurance for such threats to become extremely difficult to obtain. Although we have been able to obtain insurance coverage, it is likely that, should we be found
23
liable following a major act of terrorism, the insurance we currently have in place would not fully cover the claims for damages.
The Support Anti‑terrorism by Fostering Effective Technologies Act of 2002 (SAFETY Act) may not shield us against all legal claims we may face following an act of terrorism.
The SAFETY Act provides important legal liability protections for providers of qualified anti‑terrorism products and services. Under the SAFETY Act, providers, such as our Security division, may apply to the U.S. Department of Homeland Security for coverage of the products and services. If granted coverage, such providers would receive certain legal protections against product liability, professional liability and certain other claims that could arise following an act of terrorism.
We have applied to the U.S. Department of Homeland Security for many of the products and services offered by our Security division but we do not enjoy coverage (or the highest level of coverage) for every product line, model number and service offering that our Security division provides. In addition, the terms of the SAFETY Act coverage decisions awarded to us by the U.S. Department of Homeland Security contain conditions and requirements that we may not (or may not be able to) continue to satisfy in the future.
In the future, if we fail to maintain the coverage that we currently enjoy or fail to timely apply for coverage for new products and services as we introduce them, or if the U.S. Department of Homeland Security limits the scope of any coverage previously awarded to us, denies us coverage or continued coverage for a particular product, product line or service offering, or delays in making decisions about whether to grant us coverage, we may become exposed to legal claims that the SAFETY Act was otherwise designed to prevent.
The SAFETY Act was not designed to shield providers of qualified anti‑terrorism products and services from all types of claims that may arise from acts of terrorism, including from many types of claims lodged in courts outside of the United States or acts of terrorism that occur outside of the United States. This too could leave us exposed to significant legal claims and litigation defense costs despite the SAFETY Act awards we have received.
Our insurance coverage may be inadequate to cover all significant risk exposures.
We are exposed to liabilities that are unique to the products and services we provide. We maintain insurance for certain risks, and we believe our insurance coverage is consistent with general practices within our industry. However, the amount of our insurance coverage may not cover all claims or liabilities and we may be forced to bear substantial costs. While some of our products are shielded from liability within the U.S. under the SAFETY Act, no such protection is available outside the U.S., potentially resulting in significant liabilities. The amount of insurance coverage we maintain may be inadequate to cover these or other claims or liabilities.
Our patient monitoring, cardiology and anesthesia systems could give rise to product liability claims and product recall events that could materially and adversely affect our financial condition and results of operations.
The development, manufacturing and sale of medical devices expose us to significant risk of product liability claims, product recalls and, sometimes, product failure claims. We face an inherent business risk of financial exposure to product liability claims if the use of our medical devices results in personal injury or death. Substantial product liability litigation currently exists within the medical device industry. Some of our patient monitoring, cardiology and anesthesia systems products may become subject to product liability claims and/or product recalls. Future product liability claims and/or product recall costs may exceed the limits of our insurance coverages or such insurance may not continue to be available to us on commercially reasonable terms, or at all. In addition, a significant product liability claim or product recall could significantly damage our reputation for producing safe, reliable and effective products, making it more difficult for us to market and sell our products in the future. Consequently, a product liability claim, product recall or other claim could have a material adverse effect on our business, financial condition, operating results and cash flows.
24
If we are unable to sustain high quality processes for the manufacture and delivery of goods and services, our reputation could be harmed, our competitive advantage could erode and we could incur significant costs.
Quality is extremely important to us and our customers, due in part to the serious consequences of product failure. Our quality certifications are critical both to the marketing success of our goods and services and to the satisfaction of both regulatory and contractual requirements under which we sell many of our products. If we fail to meet these standards or other standards required in our industries, we could lose customers and market share, our revenue could decline and we could face significant costs and other liabilities.
As a U.S. Government contractor, we are subject to extensive federal procurement rules and regulations as well as contractual obligations that are unique to doing business with the U.S. Government. Non‑compliance with any such rules, regulations or contractual obligations could negatively affect current programs, potential awards and our ability to do business with the U.S. Government in the future.
U.S. Government contractors must comply with extensive procurement regulations and other requirements including, but not limited to, those appearing in the Federal Acquisition Regulation (FAR) and its supplements, as well as specific procurement rules and contractual conditions imposed by various U.S. Government agencies. Many of these types of requirements do not appear in our contracts with commercial customers or foreign governments. In particular, government contracts typically contain provisions and are subject to laws and regulations that give the government agencies rights and remedies not typically found in commercial contracts, including providing the government agency with the ability to unilaterally:
|
· |
terminate our existing contracts; |
|
· |
reduce the value of our existing contracts; |
|
· |
modify some of the terms and conditions in our existing contracts; |
|
· |
suspend or permanently prohibit us from doing business with the government or with any specific government agency; |
|
· |
control and potentially prohibit the export of our products; |
|
· |
cancel or delay existing multiyear contracts and related orders if the necessary funds for contract performance for any subsequent year are not appropriated; |
|
· |
decline to exercise an option to extend an existing multiyear contract; and |
|
· |
claim rights in technologies and systems invented, developed or produced by us. |
U.S. Government agencies and some other agencies with which we contract can terminate their contracts with us for convenience, and in that event we generally may recover only our incurred or committed costs, settlement expenses and profit on the work completed prior to termination. If an agency terminates a contract with us for default, we may be denied any recovery and may be liable for excess costs incurred by the agency in procuring undelivered items from an alternative source. We may receive notices under such contracts that, if not addressed to the agency’s satisfaction, could give the agency the right to terminate those contracts for default or to cease procuring our services under those contracts. The U.S. Government or regulators may initiate civil False Claims Act litigation against us based on allegations related to our performance of contracts for the U.S. Government, which can be expensive to defend and if found liable can result in treble damages and significant civil penalties. The U.S. Government may also initiate administrative proceedings that, if resulting in an adverse finding against us or our subsidiaries as to our present responsibility to be a U.S. Government contractor or subcontractor, could result in our company or our subsidiaries being suspended for a period of time from eligibility for awards of new government contracts or task orders or in a loss of export privileges and, if satisfying the requisite level of seriousness, in our debarment from contracting with the U.S. Government for a specified term as well as being subject to other remedies available to the U.S. Government.
25
For example, subsidiaries within our Security division received a “show cause” letter in November 2012 from the U.S. Transportation Security Administration and a related Notice for Proposed Debarment from the U.S. Department of Homeland Security in May 2013. Although, with respect to that “show cause” letter and Notice for Proposed Debarment, we were ultimately able to reach an Administrative Agreement with the U.S. Government, which allowed us to continue with our current and future business with U.S. Government agencies, there is no assurance that we would be able to reach a similar outcome with respect to any future proceedings that we may become involved. In addition, if our Security division fails to remain in compliance with its current Administrative Agreement, the U.S. Department of Homeland Security could initiate debarment proceedings.
The loss of certain of our customers, including government agencies that can modify or terminate agreements more easily than other commercial customers with which we contract, the failure to continue to diversify our customer base or the non-renewal of certain material contracts could have a negative effect on our reputation and could have a material adverse effect on our business, financial condition and results of operations.
We sell many of our products to prominent, well‑respected institutions, including agencies and departments of the U.S. Government, state and local governments, foreign governments, renowned hospitals and hospital networks, and large military‑defense and space‑industry contractors. Many of these larger customers spend considerable resources testing and evaluating our products and our design and manufacturing processes and services. Some of our smaller customers know this and rely on this as an indication of the high‑quality and reliability of our products and services. As a result, part of our reputation and success depends on our ability to continue to sell to larger institutions that are known for demanding high standards of excellence.
The loss or termination of a contract by such an institution, even if for reasons unrelated to the quality of our products or services, could therefore have a more wide‑spread and potentially material adverse effect on our business, financial condition and results of operations.
Further, we are generating revenues from certain customers, the loss of which could have a material adverse effect on our business. In particular, in fiscal 2012, we entered into a six‑year contract with the Mexican government to provide a turnkey security screening solution at various locations throughout the country. This project is expected to provide significant revenues over the life of the contract. The termination, non‑renewal or reduction in scope of this contract, even if for reasons unrelated to the quality of our products or services, could therefore have a more wide‑spread and potentially material adverse effect on our business, financial condition and results of operations, including but not limited to impairment of capital assets purchased or manufactured specifically for this contract.
Our revenues are dependent on orders of security and inspection systems, turnkey security screening solutions and patient monitoring, cardiology and anesthesia systems, which may have lengthy and unpredictable sales cycles.
Sales of security and inspection systems and turnkey security screening solutions often depend upon the decision of governmental agencies to upgrade or expand existing airports, border crossing inspection sites, seaport inspection sites, military facilities and other security installations. In the case of turnkey security screening solutions, the commencement of screening operations may be dependent on the approval, by a government agency, of the protocols and procedures that our personnel are to follow during the performance of their activities. Sales outside of the United States of our patient monitoring, cardiology and anesthesia systems depend in significant part on the decision of governmental agencies to build new medical facilities or to expand or update existing medical facilities. Accordingly, a significant portion of our sales of security and inspection systems, turnkey security screening solutions and our patient monitoring, cardiology and anesthesia systems is often subject to delays associated with the lengthy approval processes. During these approval periods, we expend significant financial and management resources in anticipation of future revenues that may not occur. If we fail to receive such revenues after expending such resources, such failure could have a material adverse effect on our business, financial condition and results of operations.
26
Current economic conditions, including the slow pace of recovery from recession in the United States and other parts of the world, as well as further disruptions in the financial markets could result in substantial declines in our revenues, earnings, cash flows and financial condition.
The economic slowdown still present in many parts of the world has and could continue to adversely affect our businesses and our profitability. If economic growth continues to remain slow, many customers may continue to delay purchases or reduce purchase quantities. This could result in the reduction in sales of certain of our products, slower adoption of both new technologies and upgrades to existing technologies and could also result in increased price competition. Continued market disruptions and broader economic downturns also increase our exposure to losses from bad debts. If economic or other factors cause financial institutions to fail, we could lose current or potential customers. We cannot predict when the world’s economic condition will recover and therefore when this period of delayed and diminished purchasing will end. A prolonged delay could have a material adverse effect on our business, financial condition and results of operations.
Additionally, in August 2011, Congress enacted the Budget Control Act of 2011 (BCA), committing the U.S. Government to significantly reduce the federal deficit over ten years. The BCA contains provisions commonly referred to as “sequestration”, which call for substantial, unspecified automatic spending cuts split between defense and non‑defense programs that may continue for a period of ten years. The BCA also included reductions to Medicare payments to providers of 2% per fiscal year, which went into effect in April 2013 and will stay in effect through 2024, unless additional Congressional action is taken. Likewise, various European governments have implemented or intend to implement austerity measures intended to reduce government spending. Such measures may reduce demand for our products directly by affected governmental agencies and by our customers who derive revenues from these governmental agencies or governmental healthcare programs. We cannot currently predict the impact of governmental spending reductions on us or our customers or whether and to what extent our business and results of operations may be adversely harmed.
Further, in June 2015, the Governor of Puerto Rico announced that Puerto Rico could not pay its debts as they were becoming due. We are currently performing on a 10-year turnkey solutions contract entered into in 2009 with the Ports Authority in Puerto Rico. If the current fiscal situation in Puerto Rico negatively impacts the ability of the Ports Authority to continue to make payments on our contract, this could have a material adverse effect on our financial results.
Any or all of these factors, as well as other consequences of the current economic conditions which cannot currently be anticipated, could have a material adverse effect on our revenues, earnings and cash flows and otherwise adversely affect our financial condition.
If we fail to perform on our existing agreements to provide security screening solutions to customers after expending substantial resources, such failure could have a material adverse effect on our business, financial condition and results of operations.
Certain of our projects require the expenditure of substantial management and financial resources in anticipation of future revenue generation. For example, in 2012, we entered into a substantial six‑year contract with the Mexican government to provide a turnkey security screening solution at various sites throughout Mexico, which required substantial expenditures for capital equipment and infrastructure. Although to date we have generated revenues from this project, if we fail to perform and thus do not receive continued revenues over the remaining life of the project after expending such resources, such failure could have a material adverse effect on our business, financial condition and results of operations. We anticipate that future contracts for turnkey security screening solutions in other territories could also require the outlay and management of substantial financial resources for capital equipment and infrastructure.
Turnkey screening solutions projects, in contrast to the sale and installation of security inspection equipment, also require that we hire and manage large numbers of local personnel in jurisdictions where we may not have previously operated. They also require that we establish, adhere to, adapt and monitor operating procedures over periods that last much longer than our other projects. If we are unable to efficiently manage the adaptation and growth of our operations relating to these projects, our operations could be materially and adversely affected.
27
If we do not introduce new products in a timely manner, our products could become obsolete and our operating results would suffer.
We sell many of our products in industries characterized by rapid technological changes, frequent new product and service introductions and evolving industry standards and customer needs. Without the timely introduction of new products and enhancements, our products could become technologically obsolete over time, in which case our revenue and operating results would suffer. The success of our new product offerings will depend upon several factors, including our ability to:
|
· |
accurately anticipate customer needs; |
|
· |
innovate and develop new technologies and applications; |
|
· |
successfully commercialize new technologies in a timely manner; |
|
· |
price our products competitively and manufacture and deliver our products in sufficient volumes and on time; and |
|
· |
differentiate our offerings from our competitors’ offerings. |
Some of our products are used by our customers to develop, test and manufacture their products. We therefore must anticipate industry trends and develop products in advance of the commercialization of our customers’ products. In developing any new product, we may be required to make a substantial investment before we can determine the commercial viability of the new product. If we fail to accurately foresee our customers’ needs and future activities, we may invest heavily in research and development of products that do not lead to significant revenues.
Interruptions in our ability to purchase raw materials and subcomponents may adversely affect our profitability.
We purchase raw materials and certain subcomponents from third parties. Standard purchase order terms are as long as one year at fixed costs, but we do not have guaranteed long‑term supply arrangements with our suppliers. In addition, for certain raw materials and subcomponents that we use, there are a limited number of potential suppliers that we have qualified or that we are currently able to qualify. Consequently, some of the key raw materials and subcomponents that we use are currently available to us only from a single vendor. The reliance on a single qualified vendor could result in delays in delivering products or increases in the cost of manufacturing the affected products. Any material interruption in our ability to purchase necessary raw materials or subcomponents could adversely affect our ability to fulfill customer orders and therefore could ultimately have a material adverse effect on our business, financial condition and results of operations.
Delays by the construction firms we engage may interfere with our ability to complete projects on time.
Purchasers of our security and inspection systems and turnkey security screening solutions sometimes require, as a part of our contract, the construction of the facilities that will house our systems and/or operations. Some of these construction projects are significant in size and complexity. We engage qualified construction firms to perform this work. However, if such firms experience delays, if they perform sub‑standard work or if we fail to properly monitor the quality of their work or the timeliness of their progress, we may not be able to complete our construction projects on time. In any such circumstance, we could face the imposition of delay penalties and breach of contract claims by our customer. In addition, we could be forced to incur significant expenses to rectify the problems caused by the construction firm. Any material delay caused by our construction firm subcontractors could therefore ultimately have a material adverse effect on our business, financial condition and results of operations.
We contract with third party service vendors who may be unable to fulfill contracts on time.
We contract with third‑party vendors to service our equipment in the field. We have made such arrangements because sometimes it is more efficient to outsource these activities than it is for our own employees to service our equipment. In addition, some of these vendors maintain stocks of spare parts that are more efficiently accessed in conjunction with a service agreement than would be the case if we were to maintain such spare parts independently. Any material interruption in the ability of our vendors to fulfill such service contracts could adversely affect our ability to fulfill
28
customer orders and therefore could ultimately have a material adverse effect on our business, financial condition and results of operations.
We have the potential to accumulate excess inventory.
Because of long lead times and specialized product designs, in certain cases we purchase components and manufacture products in anticipation of customer orders based on customer forecasts. For a variety of reasons, such as decreased end‑user demand for our products, inadequate or inaccurate forecasts, or other issues that might impact production planning, our customers might not purchase all the products that we have manufactured or for which we have purchased components. In any such event, we would attempt to recoup material and manufacturing costs by means such as returning components to our vendors, disposing of excess inventory through other channels, or requiring our OEM customers to purchase or otherwise compensate us for such excess inventory. However, some of our significant customer agreements do not give us the ability to require our OEM customers to do this. To the extent that we are unsuccessful in recouping our material and manufacturing costs, this could adversely affect our ability to fulfill customer orders and therefore could ultimately have a material adverse effect on our business, financial condition and results of operations.
We may not be able to successfully implement our acquisitions and investment strategies, integrate acquired businesses into our existing business or make acquired businesses profitable.
One of our strategies is to supplement our internal growth by acquiring and investing in businesses and technologies that complement or augment our existing product lines. This growth has placed, and may continue to place, significant demands on our management, working capital and financial resources. We may be unable to identify or complete promising acquisitions for many reasons, including:
|
· |
competition among buyers; |
|
· |
the need for regulatory approvals, including antitrust approvals; and |
|
· |
the high valuations of businesses. |
Some of the businesses we may seek to acquire or invest in may be marginally profitable or unprofitable. For these businesses to achieve acceptable levels of profitability, we must improve their management, operations, products and market penetration. We may not be successful in this regard and we may encounter other difficulties in integrating acquired businesses into our existing operations.
To finance our acquisitions, we may have to raise additional funds, through either public or private financings. We may be unable to obtain such funds or may be able to do so only on unfavorable terms.
Our acquisition and alliance activities could disrupt our ongoing business.
We intend to continue to make investments in companies, products and technologies, either through acquisitions, investments or alliances. Acquisition and alliance activities often involve risks, including:
|
· |
difficulty in assimilating the acquired operations and employees and realizing synergies expected to result from the acquisition; |
|
· |
difficulty in managing product co‑development activities with our alliance partners; |
|
· |
difficulty in effectively coordinating sales and marketing efforts; |
|
· |
difficulty in combining product offerings and product lines quickly and effectively; |
|
· |
difficulty in retaining the key employees of the acquired operation; |
|
· |
disruption of our ongoing business, including diversion of management time; |
29
|
· |
inability to successfully integrate the acquired technologies and operations into our businesses and maintain uniform standards, controls, policies and procedures; |
|
· |
lacking the experience necessary to enter into new product or technology markets successfully; and |
|
· |
difficulty in integrating financial reporting systems and implementing controls, procedures and policies, including disclosure controls and procedures and internal control over financial reporting, appropriate for public companies of our size at companies that, prior to the acquisition, had lacked such controls, procedures and policies. |
Integrating acquired businesses has been and will continue to be complex, time consuming and expensive, and can negatively impact the effectiveness of our internal control over financial reporting. The use of debt to fund acquisitions or for other related purposes increases our interest expense and leverage. If we issue equity securities as consideration in an acquisition, current stockholders percentage ownership and earnings per share may be diluted. As a result of these and other risks, we cannot be certain that our previous or future acquisitions will be successful and will not materially adversely affect the conduct, operating results or financial condition of our business.
Acquisition and alliance activities by our competitors could disrupt our ongoing business.
From time to time, our competitors acquire or enter into exclusive arrangements with companies with whom we do business or may do business in the future. Reductions in the number of partners with whom we may do business in a particular context may reduce our ability to enter into critical alliances on attractive terms or at all, and the termination of an existing alliance by a business partner may disrupt our operations.
Our ability to successfully adapt to ongoing organizational changes could impact our business results.
We have executed a number of significant business and organizational changes to rationalize our overall cost structure. These changes have included and may continue to include the implementation of cost‑cutting measures and the consolidation of facilities. We expect these types of changes may continue from time to time in the future as we uncover additional opportunities to streamline our operations. Successfully managing these changes is critical to our productivity improvement and business success. If we are unable to successfully manage these changes, while continuing to invest in business growth, our financial results could be adversely impacted.
Economic, political, legal, operational and other risks associated with international sales and operations could adversely affect our financial performance.
In fiscal 2013, 2014 and 2015 revenues from shipments made to customers outside of the United States accounted for approximately 52%, 61% and 57% of our revenues, respectively. Since we sell certain of our products and services worldwide, our businesses are subject to risks associated with doing business internationally. We anticipate that revenues from international operations will continue to represent a substantial portion of our total revenue. In addition, many of our manufacturing facilities, and therefore employees, suppliers, real property, capital equipment, cash and other assets are located outside the United States. Accordingly, our future results could be harmed by a variety of factors, including without limitation:
|
· |
changes in foreign currency exchange rates; |
|
· |
changes in a country’s or region’s political or economic conditions, particularly in developing or emerging markets; |
|
· |
political and economic instability, including the possibility of civil unrest, terrorism, mass violence or armed conflict; |
|
· |
longer payment cycles of foreign customers and difficulty of collecting receivables in foreign jurisdictions; |
|
· |
trade protection measures; |
|
· |
difficulty in staffing and managing widespread operations; |
30
|
· |
difficulty in managing distributors and sales agents and their compliance with applicable laws; |
|
· |
changes in a foreign government’s budgets, leadership and national priorities; |
|
· |
increased legal risks arising from differing legal systems; and |
|
· |
compliance with export control and anticorruption legislation, including but not limited to, the Foreign Corrupt Practices Act and UK Bribery Act and International Traffic in Arms Regulations. |
We are facing an increasingly complex international regulatory environment which is constantly changing and if we fail to comply with international regulatory requirements, or are unable to comply with changes to such requirements, our financial performance may be harmed.
Our international operations and sales subject us to an international regulatory environment which is becoming increasingly complex and is constantly changing due to factors beyond our control. Risks associated with our international operations and sales include, without limitation, those arising from the following factors:
|
· |
differing legal and court systems and changes to such systems; |
|
· |
differing labor laws and changes in those laws; |
|
· |
differing tax laws and changes in those laws; |
|
· |
differing environmental laws and changes in those laws; |
|
· |
differing laws governing our distributors and sales agents and changes in those laws; |
|
· |
differing protection of intellectual property and changes in that protection; |
|
· |
differing import and export requirements and changes to those requirements; and |
|
· |
differing regulatory requirements and changes in those requirements. |
If we fail to comply with applicable international regulatory requirements, even if such non‑compliance by us is inadvertent, or if we are unable to comply with changes to such requirements, our financial performance may be harmed.
Our global operations expose us to legal compliance risks related to certain anti-bribery and anti-corruption laws.
We are required to comply with the U.S. Foreign Corrupt Practices Act, which prohibits United States companies from engaging in bribery or making other prohibited payments to foreign officials for the purpose of obtaining or retaining business. It also requires us to maintain specific record-keeping standards and adequate internal accounting controls. In addition, we are subject to similar requirements in other countries. Bribery, corruption, and trade laws and regulations, and the enforcement thereof, are increasing in frequency, complexity and severity on a global basis. Although we have internal policies and procedures with the intention of assuring compliance with these laws and regulations, our employees, distributors, resellers and contractors involved in our international sales may take actions in violations of such policies. If our internal controls and compliance program do not adequately prevent or deter our employees, distributors, resellers, contractors and/or other third parties with whom we do business from violating anti-bribery, anti-corruption or similar laws and regulations, we may incur severe fines, penalties and reputational damage.
We are subject to import and export controls that could subject us to liability or impair our ability to compete in international markets.
Due to the international scope of our operations, we are subject to a complex system of import- and export-related laws and regulations, including U.S. export control and customs regulations and customs regulations of other countries. These regulations are complex and vary among the legal jurisdictions in which we operate. Any alleged or actual failure to comply with such regulations may subject us to government scrutiny, investigation, and civil and criminal penalties, and may limit our ability to import or export our products or to provide services outside the United States. Depending on
31
severity, any of these penalties could have a material impact on our business, financial condition and results of operations.
There are inherent risks associated with operations in Mexico.
We are currently in the process of fulfilling a multi‑year agreement to provide a turnkey security scanning solution to the tax and customs authority of Mexico. This agreement is individually material to our business, financial condition and results of operations. There are certain administrative, legal, governmental and societal risks to operating in Mexico that could adversely impact our operations. Any one or more of the risks that could adversely affect our ability to fulfill our agreement and therefore ultimately have a material adverse effect on our business, financial condition and results of operations include, without limitation:
|
· |
regional political and economic instability; |
|
· |
high rate of crime in Mexico where we conduct operations; |
|
· |
ability of key suppliers and subcontractors to fulfill obligations; |
|
· |
ability to hire and maintain a significant work force; |
|
· |
burdensome and evolving government regulations; |
|
· |
cooperation of various departments of the Mexican government in issuing permits, and inspecting our operations on a timely basis; |
|
· |
providing adequate security among other items; |
|
· |
receipt of payments in a timely manner; |
|
· |
termination or change in scope of program and at the election of the government; and |
|
· |
change in the value of the Mexican peso. |
Our operations are vulnerable to interruption or loss due to natural disasters, epidemics, terrorist acts and other events beyond our control, which could adversely impact our operations.
Although we perform manufacturing in multiple locations, we generally do not have redundant manufacturing capabilities in place for any particular product or component. As a result, we depend on our current facilities for the continued operation of our business. A natural disaster, epidemic, terrorist act, act of war, or other natural or manmade disaster affecting any of our facilities could significantly disrupt our operations, or delay or prevent product manufacturing and shipment for the time required to repair, rebuild, or replace our manufacturing facilities. This delay could be lengthy and we could incur significant expenses to repair or replace the facilities. Any similar natural or manmade disaster that affects a key supplier or customer could lead to a similar disruption in our business.
Third parties may claim we are infringing their intellectual property rights, and we could suffer significant litigation or licensing expenses or be prevented from selling products.
As we introduce any new and potentially promising product or service, or improve existing products or services with new features or components, companies possessing competing technologies, or other companies owning patents or other intellectual property rights, may be motivated to assert infringement claims in order to generate royalty revenues, delay or diminish potential sales and challenge our right to market such products or services. Even if successful in defending against such claims, patent and other intellectual property related litigation is costly and time consuming. In addition, we may find it necessary to initiate litigation in order to protect our patent or other intellectual property rights, and even if the claims are well‑founded and ultimately successful such litigation is typically costly and time‑consuming and may expose us to counterclaims, including claims for intellectual property infringement, anti‑trust, or other such claims. Third parties could also obtain patents or other intellectual property rights that may require us to either redesign products or, if possible, negotiate licenses from such third parties. Adverse determinations in any such litigation could result in significant liabilities to third parties or injunctions, or could require us to seek licenses from third parties, and if such licenses are not available on commercially reasonable terms, prevent us from manufacturing, importing, distributing, selling or using certain products, any one of which could have a material adverse effect on us. In addition, some licenses
32
may be non‑exclusive, which could provide our competitors access to the same technologies. Under any of these circumstances, we may incur significant expenses.
Our ongoing success is dependent upon the continued availability of certain key employees.
We are dependent in our operations on the continued availability of the services of our employees, many of whom are individually key to our current and future success, and the availability of new employees to implement our growth plans. The market for skilled employees is highly competitive, especially for employees in technical fields. While our compensation programs are intended to attract and retain the employees required for us to be successful, ultimately, we may not be able to retain the services of all of our key employees or a sufficient number to execute on our plans. In addition, we may not be able to continue to attract new employees as required.
Healthcare cost containment pressures and legislative or regulatory reforms may affect our ability to sell our products profitably.
All third‑party payors, whether governmental or commercial, whether inside the United States or outside, are developing increasingly sophisticated methods of controlling healthcare costs. These cost‑control methods also potentially limit the amount that healthcare providers may be willing to pay for medical devices. In the United States, hospital and other healthcare provider customers, including physicians and ambulatory surgery centers, that purchase our products typically bill various third‑party payors to cover all or a portion of the costs and fees associated with the procedures or tests in which our products are used and bill patients for any deductibles or co‑payments. Because there is often no separate reimbursement for our products, any decline in the amount payors are willing to reimburse our customers for the procedures and tests associated with our products could make it difficult for customers to continue using, or adopt, our products and create additional pricing pressure for us. If we are forced to lower the price we charge for our products, our gross margins will decrease, which will adversely affect our ability to invest in and grow our business.
There have been, and we expect there will continue to be, a number of legislative and regulatory proposals to change the healthcare system, and some could involve changes that could significantly affect the ways in which doctors, hospitals, healthcare systems and health insurance companies are compensated for the services they provide, which could have a material impact on our business. For example, the Affordable Care Act includes a 2.3% excise tax on U.S. sales of a wide range of medical devices. The excise tax became effective in 2013 and increased our costs. It is not clear at this time whether and to what extent the Affordable Care Act may impact the ability of hospitals and hospital networks to purchase the patient monitoring, cardiology and anesthesia systems that we sell or if it will alter market‑based incentives that hospitals and hospital networks currently face to continually improve, upgrade and expand their use of such equipment. While the Affordable Care Act could materially and adversely affect us, at this time we cannot predict the extent of any impact on our business or results of operations.
Efforts by governmental and third‑party payors to reduce healthcare costs or the implementation of new legislative reforms imposing additional government controls could cause a reduction in sales or in the selling price of our products, which could adversely affect our business.
Substantial government regulation in the United States and abroad may restrict our ability to sell our patient monitoring, cardiology and anesthesia systems, and failure to comply with such laws and regulations may have a material adverse impact on our business.
The FDA and comparable regulatory authorities in foreign countries extensively and rigorously regulate our patient monitoring, cardiology and anesthesia systems, including the research and development, design, testing, clinical trials, manufacturing, clearance or approval, safety and efficacy, labeling, advertising, promotion, pricing, recordkeeping, reporting, import and export, post‑approval studies and sale and distribution of these products. In the United States, before we can market a new medical device, or a new use of, new claim for, or significant modification to, an existing product, we must first receive either clearance under Section 510(k) of the Federal Food, Drug and Cosmetic Act or approval of a pre-market approval (PMA) application from the FDA, unless an exemption applies. In the 510(k) clearance process, the FDA must determine that a proposed device is “substantially equivalent” to a device legally on the market, known as a “predicate” device, in order to clear the proposed device for marketing. To be “substantially equivalent,” the proposed device must have the same intended use as the predicate device, and either have the same technological characteristics as the predicate device or have different technological characteristics and not raise different questions of safety or
33
effectiveness than the predicate device. Clinical data is sometimes required to support substantial equivalence. In the PMA approval process, the FDA must determine that a proposed device is safe and effective for its intended use based, in part, on extensive data, including, but not limited to, technical, pre‑clinical, clinical trial, manufacturing and labeling data. The PMA process is typically required for devices for which the 510(k) process cannot be used and that are deemed to pose the greatest risk.
Modifications to products that are approved through a PMA application generally need FDA approval, and some modifications made to products cleared through a 510(k) may require a new 510(k). The FDA can delay, limit or deny clearance or approval of a device for many reasons, including:
|
· |
we may not be able to demonstrate to the FDA’s satisfaction that our products are safe and effective for their intended uses; |
|
· |
the data from our pre‑clinical studies and clinical trials may be insufficient to support clearance or approval, where required; |
|
· |
the manufacturing process or facilities we use may not meet applicable requirements; and |
|
· |
the potential for approval policies or regulations of the FDA or applicable foreign regulatory bodies to change significantly in a manner rendering our clinical data or regulatory filings insufficient for clearance or approval. |
Our future products may not obtain FDA clearance on a timely basis, or at all. Further, the FDA makes periodic inspections of medical device manufacturers and in connection with such inspections issues observations when the FDA believes the manufacturer has failed to comply with applicable regulations. If FDA observations are not addressed to the FDA’s satisfaction, the FDA may issue a warning letter and/or proceed directly to other forms of enforcement action, which could include the shutdown of our production facilities, adverse publicity, and civil and criminal penalties. The expense and costs of any corrective actions that we may take, which may include product recalls, correction and removal of products from customer sites and/or changes to our product manufacturing and quality systems, could adversely impact our financial results. Issuance of a warning letter may also lead customers to delay purchasing decisions or cancel orders.
In August 2014, the FDA issued a warning letter to our Healthcare division, relating primarily to the maintenance of certain procedures and internal processes at our facility in Snoqualmie, Washington. We have implemented corrective actions as a result of the warning letter and provided the FDA with a detailed response regarding our completed and in process activities. However, there can be no assurance that the FDA will be satisfied with our response to the warning letter or our proposed resolution of the outstanding issues. Until the items raised in the warning letter are fully corrected, we may be subject to additional regulatory action by the FDA, including the issuance of additional warning letters, injunction, seizure or recall of products, imposition of fines or penalties or operating restrictions on our facilities. Such actions could significantly disrupt our ongoing business and operations and have a material adverse impact on our financial position and operating results.
Our patient monitoring, diagnostic cardiology, anesthesia systems and defibrillator products must also comply with the laws and regulations of foreign countries in which we develop, manufacture and market such products. In general, the extent and complexity of medical device regulation is increasing worldwide. This trend is likely to continue and the cost and time required to obtain marketing clearance in any given country may increase as a result. Our products may not obtain any necessary foreign clearances on a timely basis, or at all.
Once any of our patient monitoring, diagnostic cardiology, anesthesia systems or defibrillator products is cleared for sale, regulatory authorities may still limit the use of such product, prevent its sale or manufacture or require a recall or withdrawal of such product from the marketplace. Following initial clearance from regulatory authorities, we continue to be subject to extensive regulatory requirements. Government authorities can withdraw marketing clearance or impose sanctions due to our failure to comply with regulatory standards or due to the occurrence of unforeseen problems following initial clearance. Ongoing regulatory requirements are wide‑ranging and govern, among other things:
|
· |
annual inspections to retain a CE mark for sale of products in the European Union; |
|
· |
product manufacturing; |
34
|
· |
patient health data protection and medical device security; |
|
· |
supplier substitution; |
|
· |
product changes; |
|
· |
process modifications; |
|
· |
medical device reporting; and |
|
· |
product sales and distribution. |
Changes in laws affecting the healthcare industry could adversely affect our revenues and profitability.
We operate in a highly regulated industry. As a result, our business could be adversely affected by governmental actions, including implementation of new laws, regulations or judicial decisions, or new interpretations of existing laws, regulations or decisions; changes in the FDA and foreign regulatory approval processes that may delay or prevent the approval of new products; and/or changes in FDA and foreign regulations that may require additional safety monitoring, labeling changes, restrictions on product distribution or use, or other measures after the introduction of our products to market, which could increase our costs of doing business, adversely affect the future permitted uses of approved products, or otherwise adversely affect the market for our products. We anticipate that governmental authorities will continue to scrutinize the healthcare industry closely and that additional regulation by governmental authorities may cause increased compliance costs, exposure to litigation and other adverse effects to our operations.
We must continually monitor the performance of our products once approved and marketed for signs that their use may elicit serious and unexpected adverse effects. Any recall of our products, either voluntarily or at the direction of the FDA or another governmental authority, or the discovery of serious safety issues with our products that leads to corrective actions, could have a significant adverse impact on us.
Although we believe that existing data continue to support the efficacy and safety of our patient monitoring, diagnostic cardiology, anesthesia systems and defibrillator products, in the future, longer term study outcomes could demonstrate conflicting clinical effectiveness, a reduction of effectiveness, no clinical effectiveness or longer term safety issues. This type of differing data could have a detrimental effect on the market penetration and usage of our medical device products. As a result, our sales may decline or expected growth would be negatively impacted. This could negatively impact our operating condition and financial results.
More generally, all medical devices can experience performance problems that require review and possible corrective action by us or a component supplier. We cannot provide assurance that component failures, manufacturing errors, noncompliance with quality system requirements or good manufacturing practices, design defects and/or labeling inadequacies in any device that could result in an unsafe condition or injury to the patient will not occur. The FDA and similar foreign governmental authorities have the authority to require the recall of commercialized products in the event of material deficiencies or defects in design or manufacture of a product or in the event that a product poses an unacceptable risk to health. Manufacturers may also, under their own initiative, stop shipment or recall a product if any material deficiency is found or withdraw a product to improve device performance or for other reasons. A government‑mandated or voluntary recall by us or one of our distributors could occur as a result of an unacceptable risk to health, component failures, manufacturing errors, noncompliance with good manufacturing practices or quality system requirements, design or labeling defects or other deficiencies and issues. Similar regulatory agencies in other countries have similar authority to recall products because of material deficiencies or defects in design or manufacture that could endanger health. A recall involving our products could be particularly harmful to our business, financial and operating results.
The FDA requires that certain classifications of recalls be reported to the FDA within 10 working days after the recall is initiated. Notice to the FDA of a correction or removal is required when undertaken to reduce a risk to health, including when there is a reasonable probability that the product will cause serious adverse health consequences or death, or when use of the device may cause temporary or medically reversible adverse health consequences or an outcome where
35
the probability of serious adverse health consequences is remote. In addition, companies are required to maintain certain records of corrections and removal, even if they are not reportable to the FDA or similar foreign governmental authorities. We may initiate voluntary recalls involving our products in the future that we determine do not require notification of the FDA or foreign governmental authorities. If the FDA or foreign governmental authorities disagree with our determinations, they could require us to report those actions as recalls. A future recall announcement could harm our reputation with customers and negatively affect our sales. In addition, the FDA or a foreign governmental authority could take enforcement action for failing to report the recalls when they were conducted.
In addition, under the FDA’s medical device reporting regulations, we are required to report to the FDA any incident in which our product may have caused or contributed to a death or serious injury or in which our product malfunctioned and, if the malfunction were to recur, would likely cause or contribute to death or serious injury. Repeated product malfunctions may result in a voluntary or involuntary product recall.
Depending on the corrective action we take to redress a product’s deficiencies or defects, the FDA or applicable foreign regulatory authority may require, or we may decide, that we will need to obtain new approvals or clearances for the device before we may market or distribute the corrected device. Seeking such approvals or clearances may delay our ability to replace the recalled devices in a timely manner. Moreover, we may face additional regulatory enforcement action, including FDA warning letters, product seizure, injunctions, administrative penalties, civil penalties or criminal fines. We may also be required to bear other costs or take other actions that may have a negative impact on our sales as well as face significant adverse publicity or regulatory consequences, which could harm our business, including our ability to market our products in the future.
Any adverse event involving our products, whether in the United States or abroad, could result in future voluntary corrective actions, such as recalls or customer notifications, or agency action, such as inspection, mandatory recall, orders of repair, replacement or refund or other enforcement action. Any corrective action, whether voluntary or involuntary, as well as defending ourselves in a lawsuit, will require the dedication of our time and capital and may harm our reputation and financial results.
We may be subject to fines, penalties, injunctions or other enforcement actions if we are determined to be promoting the use of our products for unapproved or “off‑label” uses, resulting in damage to our reputation and business.
Our promotional materials and training methods must comply with FDA and other applicable laws and regulations, including the prohibition of the promotion of a medical device for a use that has not been cleared or approved by the FDA. Use of a device outside of its cleared or approved indications is known as “off‑label” use. Physicians may use our products off‑label, as the FDA does not restrict or regulate a physician’s choice of treatment within the practice of medicine. However, if the FDA determines that our promotional materials or training constitutes promotion of an off‑label use, it could request that we modify our training or promotional materials or subject us to regulatory or enforcement actions, including the issuance of warning letters, untitled letters, fines, penalties, consent decrees, injunctions, or seizures, which could have an adverse impact on our reputation and financial results. We could also be subject to enforcement action under other federal or state laws, including the False Claims Act.
We are subject to additional federal, state and foreign laws and regulations relating to our healthcare business; our failure to comply with those laws could have a material adverse effect on our results of operations and financial condition.
Although we do not provide healthcare services, submit claims for third‑party reimbursement, or receive payments directly from Medicare, Medicaid or other third‑party payors for our product, we are subject to healthcare fraud and abuse regulation and enforcement by federal and state governments, which could significantly impact our business. Healthcare fraud and abuse and health information privacy and security laws potentially applicable to our operations include:
|
· |
the federal Anti‑Kickback Statute, which applies to our marketing practices, pricing policies and relationships with healthcare providers, by prohibiting, among other things, soliciting, receiving, offering or providing
36 |
remuneration intended to induce the purchase or recommendation of an item or service reimbursable under a federal healthcare program, such as the Medicare or Medicaid programs; |
|
· |
federal civil and criminal false claims laws and civil monetary penalty laws, including civil whistleblower or qui tam actions, that prohibit, among other things, knowingly presenting, or causing to be presented, claims for payment or approval to the federal government that are false or fraudulent, knowingly making a false statement material to an obligation to pay or transmit money or property to the federal government or knowingly concealing or knowingly and improperly avoiding or decreasing an obligation to pay or transmit money or property to the federal government; |
|
· |
the federal Health Insurance Portability and Accountability Act of 1996 (HIPAA) and its implementing regulations, which created federal criminal laws that prohibit, among other things, executing a scheme to defraud any healthcare benefit program or making false statements relating to healthcare matters; |
|
· |
HIPAA, as amended by the Health Information Technology for Economic and Clinical Health Act (HITECH), imposes certain regulatory and contractual requirements regarding the privacy, security and transmission of individually identifiable health information; |
|
· |
federal “Sunshine Act” requirements imposed by the Affordable Care Act, on device manufacturers regarding any “payment or other transfer of value” to physicians and teaching hospitals. Failure to submit required information may result in civil monetary penalties of up to an aggregate of $150,000 per year (or up to an aggregate of $1 million per year for “knowing failures”) for all payments, transfers of value or ownership or investment interests that are not timely, accurately, and completely reported in an annual submission; and |
|
· |
state and foreign law equivalents of each of the above federal laws, such as state anti‑kickback and false claims laws that may apply to items or services reimbursed by any third‑party payor, including commercial insurers; state laws that require device companies to comply with the industry’s voluntary compliance guidelines and the relevant compliance guidance promulgated by the federal government or otherwise restrict payments that may be made to healthcare providers; state laws that require drug and device manufacturers to report information related to payments and other transfers of value to physicians and other healthcare providers or marketing expenditures; and state laws governing the privacy and security of certain health information, many of which differ from each other in significant ways and often are not preempted by HIPAA/HITECH, thus complicating compliance efforts. |
The risk of our being found in violation of these laws and regulations is increased by the fact that many of them have not been fully interpreted by the regulatory authorities or the courts, and their provisions are open to a variety of interpretations. Moreover, recent health care reform legislation has strengthened these laws. For example, the Affordable Care Act, among other things, amended the intent requirement of the federal Anti‑Kickback Statute and criminal health care fraud statutes; a person or entity no longer needs to have actual knowledge of these statutes or specific intent to violate them to have committed a violation. In addition, the Affordable Care Act provided that the government may assert that a claim including items or services resulting from a violation of the federal Anti‑Kickback Statute constitutes a false or fraudulent claim for purposes of the False Claims Act.
Because of the breadth of these laws and the narrowness of the statutory exceptions and safe harbors available under such laws, it is possible that some of our business activities could be subject to challenge under one or more of such laws. Any action against us for violation of these laws, even if we successfully defend against it, could cause us to incur significant legal expenses and divert our management’s attention from the operation of our business. If our operations are found to be in violation of any of the laws described above or any other governmental regulations that apply to us, we may be subject to penalties, including civil and criminal penalties, damages, fines, exclusion from governmental health care programs, disgorgement, contractual damages, reputational harm, diminished profits and future earnings, and the curtailment or restructuring of our operations, any of which could impair our ability to operate our business and our financial results.
37
Consolidation in the healthcare industry could have an adverse effect on our revenues and results of operations.
The healthcare industry has been consolidating and organizations such as group purchasing organizations, independent delivery networks, and large single accounts such as the United States Veterans Administration, continue to consolidate purchasing decisions for many of our healthcare provider customers. As a result, transactions with customers are larger, more complex, and tend to involve more long‑term contracts. The purchasing power of these larger customers has increased, and may continue to increase, causing downward pressure on product pricing. If we are not one of the providers selected by one of these organizations, we may be precluded from making sales to its members or participants. Even if we are one of the selected providers, we may be at a disadvantage relative to other selected providers that are able to offer volume discounts based on purchases of a broader range of products. Further, we may be required to commit to pricing that has a material adverse effect on our revenues and profit margins, business, financial condition and results of operations. We expect that market demand, governmental regulation, third‑party reimbursement policies and societal pressures will continue to change the worldwide healthcare industry, resulting in further business consolidations and alliances, which may exert further downward pressure on the prices of our products and could adversely impact our business, financial condition, and results of operations.
Technological advances and evolving industry and regulatory standards and certifications could reduce our future product sales, which could cause our revenues to grow more slowly or decline.
The markets for our products are characterized by rapidly changing technology, changing customer needs, evolving industry or regulatory standards and certifications and frequent new product introductions and enhancements. The emergence of new industry or regulatory standards and certification requirements in related fields may adversely affect the demand for our products. This could happen, for example, if new standards and technologies emerged that were incompatible with customer deployments of our applications. In addition, any products or processes that we develop may become obsolete or uneconomical before we recover any of the expenses incurred in connection with their development. We cannot provide assurance that we will succeed in developing and marketing product enhancements or new products that respond to technological change, new industry standards, changed customer requirements or competitive products on a timely and cost‑effective basis. Additionally, even if we are able to develop new products and product enhancements, we cannot provide assurance that they will be profitable or that they will achieve market acceptance.
We develop certain of our security inspection technologies to meet the certification requirements of various agencies worldwide, including the U.S. Transportation Security Administration and the European Civil Aviation Conference among others. Such standards frequently change and there is a risk now and in the future that we may not ultimately be able to develop technologies, or develop in a timely way, solutions that are ultimately able to meet the new standards.
We are subject to various environmental regulations which may impose liability on us whether or not we knew of or caused the release of hazardous substances on or in our facilities.
We are subject to various U.S. and international environmental laws, directives, and regulations pertaining to the use, storage, handling and disposal of hazardous substances used, and hazardous wastes used or generated, in the manufacture of our products. Such laws mandate the use of controls and practices designed to mitigate the impact of our operations on the environment, and under such laws we may be held liable for the costs associated with the remediation and removal of any unintended or previously unknown releases of hazardous substances on, beneath or from our property and associated operations, including the remediation of hazardous waste disposed off‑site. Such laws may impose liability without regard to whether we knew of or caused the release of such hazardous substances or wastes. For example, we continue to investigate soil and groundwater contamination at our Hawthorne, California facility that we believe stems from historical releases and off‑site sources. See “Business—Environmental Regulations”. Any failure by us to comply with present or future regulations could subject us to the imposition of substantial fines, suspension of production, alteration of manufacturing processes, or cessation of operations, any of which could have a material adverse effect on our business, financial condition and results of operations.
38
A failure of a key information technology system, process or site could have a material adverse impact on our ability to conduct business.
We rely extensively on information technology systems to interact with our employees and our customers. These interactions include, but are not limited to, ordering and managing materials from suppliers, converting materials to finished products, shipping product to customers, processing transactions, summarizing and reporting results of operations, transmitting data used by our service personnel and by and among our wide‑spread operations, complying with regulatory, legal and tax requirements, and other processes necessary to manage our business. If our systems are damaged or cease to function properly due to any number of causes, ranging from the failures of third‑party service providers, to catastrophic events, to power outages, to security breaches, and our business continuity plans do not effectively compensate on a timely basis, we may suffer interruptions in our ability to manage operations which may adversely impact our results of operations and/or financial condition.
Increased cybersecurity requirements, vulnerabilities, threats and more sophisticated and targeted computer crime could pose a risk to our systems, networks, products, services and data.
Increased global cybersecurity vulnerabilities, threats and more sophisticated and targeted cyber-related attacks pose a risk to the security of our Company’s and our customers', suppliers' and third-party service providers' products, systems and networks and the confidentiality, availability and integrity of our and our customers' data. Although we have implemented policies, procedures and controls to protect against, detect and mitigate these threats, we remain potentially vulnerable to additional known or unknown threats. We also may have access to sensitive, confidential or personal data or information that is subject to privacy and security laws, regulations and customer-imposed controls. Despite our efforts to protect sensitive, confidential or personal data or information, we may be vulnerable to material security breaches, theft, misplaced or lost data, programming errors, employee errors and/or malfeasance that could potentially lead to the compromising of sensitive, confidential or personal data or information, improper use of our systems or networks, unauthorized access, use, disclosure, modification or destruction of information, defective products, production downtimes and operational disruptions. In addition, a cyber-related attack could result in other negative consequences, including damage to our reputation or competitiveness and remediation or increased protection costs, and could subject us to fines, damages, litigation and enforcement actions.
We receive significant amounts of research and development funding for our security and inspection systems from government grants and contracts, but we may not continue to receive comparable levels of funding in the future.
The U.S. Government currently plays an important role in funding the development of certain of our security and inspection systems and sponsoring their deployment at airports, ports, military installations and border crossings. However, in the future, additional research and development funds from the government may not be available to us. If the government fails to continue to sponsor our technologies, we may have to expend more resources on product development or cease development of certain technologies, which could adversely affect our business. Government funded research and development also presents risks associated with government contracting in general that are described elsewhere in our risk factors. Government agencies can generally terminate their contracts for convenience, and if we fail to meet the goals of government funded research and development, there is a risk that the government agency may terminate our contracts for default. In addition, any future grants to our competitors may improve their ability to develop and market competing products and cause our customers to delay purchase decisions, which could harm our ability to market our products.
Certain of our U.S. Government contracts are dependent upon our employees obtaining and maintaining required security clearances, as well as our ability to obtain security clearances for the facilities in which we perform sensitive government work.
Certain of our U.S. Government contracts require our employees to maintain various levels of security clearances, and we are required to maintain certain facility security clearances. If we cannot maintain or obtain the required security clearances for our facilities and our employees, or obtain these clearances in a timely manner, we may be unable to perform certain U.S. Government contracts. Further, loss of a facility clearance, or an employee’s failure to obtain or maintain a security clearance, could result in a U.S. Government customer terminating an existing contract or choosing not to renew
39
a contract. Lack of required clearances could also impede our ability to bid on or win new U.S. Government contracts. This could damage our reputation and adversely affect our business, financial condition and results of operations.
We are involved in various litigation matters, which could have a material adverse effect on our business, financial condition or operating results.
Litigation can be lengthy, expensive and disruptive to our operations, and can divert our management’s attention away from the running of our business. Claims arising out of actual or alleged violations of law could be asserted against us by individuals, either individually or through class actions, or by governmental entities in investigations and proceedings. If we are unsuccessful in our defense in litigation matters, or any other legal proceeding, we may be forced to pay damages or fines and/or change our business practices, any of which could have a material adverse effect on our business, financial condition and results of operations. For more information about our litigation matters, see “Legal Proceedings” and Note 9 to the Consolidated Financial Statements.
Our credit facility contains provisions that could restrict our ability to finance our future operations or engage in other business activities that may be in our interest.
Our credit facility contains a number of significant covenants that, among other things, limit our ability to:
|
· |
dispose of assets; |
|
· |
incur certain additional indebtedness; |
|
· |
repay certain indebtedness; |
|
· |
create liens on assets; |
|
· |
pay dividends on our Common Stock; |
|
· |
make certain investments, loans and advances; |
|
· |
repurchase or redeem capital stock; |
|
· |
make certain capital expenditures; |
|
· |
engage in acquisitions, mergers or consolidations; and |
|
· |
engage in certain transactions with subsidiaries and affiliates. |
These covenants could limit our ability to plan for or react to market conditions, finance our operations, engage in strategic acquisitions or disposals or meet our capital needs or could otherwise restrict our activities or business plans. Our ability to comply with these covenants may be affected by events beyond our control. In addition, our credit facility also requires us to maintain compliance with certain financial ratios. Our inability to comply with the required financial ratios or covenants could result in an event of default under our credit facility. A default, if not cured or waived, may permit acceleration of our indebtedness. In addition, our lenders could terminate their commitments to make further extensions of credit under our credit facility. If our indebtedness is accelerated, we cannot be certain that we will have sufficient funds to pay the accelerated indebtedness or that we will have the ability to refinance accelerated indebtedness on terms favorable to us or at all.
Changes in our tax rates could affect our future financial results.
Our future effective tax rates could be favorably or unfavorably affected by changes in the valuation of our deferred tax assets and liabilities, or by changes in tax laws or their interpretation. In addition, we are subject to the examination of our income tax returns by the Internal Revenue Service and other tax authorities. We regularly assess the likelihood of adverse outcomes resulting from these examinations to determine the adequacy of our provision for income taxes. There can be no assurance that the outcomes from these examinations will not have an adverse effect on our operating results and financial condition.
40
Changes in tax laws or tax rulings could materially affect our financial position and results of operations.
Changes in tax laws or tax rulings could materially affect our financial position and results of operations. For example, the current U.S. administration and key members of Congress have made public statements indicating that tax reform is a priority. Certain changes to U.S. tax laws, including limitations on the ability to defer U.S. taxation on earnings outside of the United States until those earnings are repatriated to the United States, could affect the tax treatment of our foreign earnings. In addition, many countries in the European Union, as well as a number of other countries and organizations such as the Organization for Economic Cooperation and Development, are actively considering changes to existing tax laws. Certain proposals could include recommendations that would significantly increase our tax obligations in many countries where we do business. Due to the large and expanding scale of our international business activities, any changes in the taxation of such activities may increase our worldwide effective tax rate and harm our financial position and results of operations.
If goodwill or other intangible assets in connection with our acquisitions become impaired, we could take significant non-cash charges against earnings.
We have pursued and will continue to seek potential acquisitions to complement and expand our existing businesses, increase our revenues and profitability, and expand our markets. As a result of prior acquisitions, we have goodwill and intangible assets recorded on our balance sheet as described in Note 4 to our Consolidated Financial Statements. Under current accounting guidelines, we must assess, at least annually, whether the value of goodwill and other intangible assets has been impaired. Any reduction or impairment of the value of goodwill or other intangible assets will result in charges against earnings, which could adversely affect our results of operations in future periods.
Our Certificate of Incorporation and other agreements contain provisions that could discourage a takeover.
Our Certificate of Incorporation authorizes our Board of Directors to issue up to 10,000,000 shares of Preferred Stock in one or more series, to fix the rights, preferences, privileges and restrictions of Preferred Stock, to fix the number of shares constituting any such series and to fix the designation of any such series, without further vote or action by stockholders. The terms of any series of Preferred Stock, which may include economic rights senior to our Common Stock and special voting rights, could adversely affect the rights of the holders of our Common Stock and thereby reduce the value of our Common Stock. The issuance of Preferred Stock, coupled with the concentration of ownership in the directors and executive officers, could discourage certain types of transactions involving an actual or potential change in control of our company, including transactions in which the holders of Common Stock might otherwise receive a premium for their shares over then current prices, could otherwise dilute the rights of holders of Common Stock and may limit the ability of such stockholders to cause or approve transactions which they may deem to be in their best interests, all of which could have a material adverse effect on the market price of our Common Stock.
Our Certificate of Incorporation limits the liability of our directors, which may limit the remedies we or our stockholders have available.
Our Certificate of Incorporation provides that, pursuant to the Delaware General Corporation Law, the liability of our directors for monetary damages shall be eliminated to the fullest extent permissible under Delaware law, as that law exists currently and as it may be amended in the future. This is intended to eliminate the personal liability of a director for monetary damages in an action brought by us, or in our right for breach of a director’s duties to us or our stockholders and may limit the remedies available to us or our stockholders. Under Delaware law, this provision does not apply to eliminate or limit a director’s monetary liabilities for: (i) breaches of the director’s duty of loyalty to us or our stockholders; (ii) acts or omissions not in good faith or which involve intentional misconduct or knowing violations of law; (iii) the unlawful payment of dividends or unlawful stock repurchases or redemptions under Section 174 of the Delaware General Corporation Law or (iv) transactions in which the director received an improper personal benefit. Additionally, under Delaware law, this provision does not limit a director’s liability for the violation of, or otherwise relieve us or our directors from complying with, federal or state securities laws, nor does it limit the availability of non‑monetary remedies such as injunctive relief or rescission for a violation of federal or state securities laws.
41
New regulations related to conflict minerals may force us to incur additional expenses, may make our supply chain more complex and may result in damage to our relationships with customers.
Under the Dodd‑Frank Wall Street Reform and Consumer Protection Act of 2010, the SEC adopted requirements for companies that manufacture products that contain certain minerals and metals, known as conflict minerals. These rules require public companies to perform diligence and to report annually to the SEC whether such minerals originate from the Democratic Republic of Congo and adjoining countries. The implementation of these new requirements could adversely affect the sourcing, availability and pricing of minerals we use in the manufacture of certain of our products. In addition, we will incur additional costs to comply with the disclosure requirements, including costs related to determining the source of any of the relevant minerals used in our products. Since our supply chain is complex, we may not be able to ascertain the origins for these minerals used in our products through the due diligence procedures that we implement, which may harm our reputation. We may also face difficulties in satisfying customers who may require that our products be certified as conflict mineral free, which could harm our relationships with these customers and lead to a loss of revenue. These new requirements could limit the pool of suppliers that can provide conflict‑free minerals, and we may be unable to obtain conflict‑free minerals at competitive prices, which could increase our costs and adversely affect our manufacturing operations and our profitability.
ITEM 1B. UNRESOLVED STAFF COMMENTS
None.
As of June 30, 2015, we owned the following principal facilities (i.e., facilities greater than 50,000 square feet):
|
|
|
|
|
Approximate |
|
|
Location |
|
Description of Facility |
|
Square Footage |
|
|
Hawthorne, California |
|
Corporate headquarters and administrative, manufacturing, engineering, sales and marketing and service for our Optoelectronics and Manufacturing division |
|
88,000 |
|
|
Snoqualmie, Washington (1) |
|
Headquarters and administrative, manufacturing, engineering, sales, marketing and service for our Healthcare division |
|
177,000 |
|
|
Stoke on Trent, United Kingdom |
|
Manufacturing, engineering, sales, marketing and service for our Security division |
|
90,000 |
|
|
Surrey, United Kingdom (1) |
|
Manufacturing, engineering, sales, marketing and service for our Security division |
|
59,000 |
|
|
Batam, Indonesia |
|
Manufacturing for our Optoelectronics and Manufacturing division |
|
59,000 |
|
|
(1) |
Each of these facilities is encumbered by a mortgage. |
42
As of June 30, 2015, we leased the following principal facilities (i.e., facilities greater than 50,000 square feet):
|
|
|
|
|
Approximate |
|
|
|
|
Location |
|
Description of Facility |
|
Square Footage |
|
Expiration |
|
|
Batam, Indonesia (1) |
|
Manufacturing for our Optoelectronics and Manufacturing division |
|
93,200 |
|
various |
|
|
Torrance, California |
|
Manufacturing, engineering, sales, marketing and service for our Security division |
|
91,900 |
|
2017 |
|
|
Johor Bahru, Malaysia |
|
Manufacturing, engineering, sales and service for our Security division |
|
89,000 |
|
2018 |
|
|
Johor Bahru, Malaysia |
|
Manufacturing, engineering, sales and service for our Optoelectronics and Manufacturing division |
|
71,000 |
|
2017 |
|
|
Garner, North Carolina |
|
Manufacturing, engineering, sales, marketing and service for our Security division |
|
68,000 |
|
2017 |
|
|
Sunnyvale, California |
|
Manufacturing, engineering, sales, marketing and service for our Security division |
|
62,500 |
|
2017 |
|
|
Suzhou, China |
|
Manufacturing, engineering, sales, marketing and service for our Healthcare division |
|
53,000 |
|
2017 |
|
|
Hyderabad, India (2) |
|
Manufacturing and engineering for our Security, Healthcare and Optoelectronics and Manufacturing divisions |
|
50,400 |
|
2016 |
|
|
(1) |
This is comprised of five leases, ranging in size between 11,000 square feet and 37,400 square feet and expiring at various dates between 2015 and 2017, at the same or nearby facilities. |
|
(2) |
This is comprised of three leases, ranging in size between 5,000 square feet and 33,600 square feet, at the same or nearby facilities. |
We believe that our facilities are in good condition to support our current operations, but we will expand as necessary to support our growth. We currently anticipate that we will be able to renew the leases that are scheduled to expire in the next few years on terms that are substantially the same as those currently in effect. However, even if we were not able to renew one or more of the leases, we believe that suitable substitute space is available to relocate any of the facilities. Accordingly, we do not believe that our failure to renew any of the leases that are scheduled to expire in the next few years will have a material adverse effect on our operations.
On December 12, 2013, a class action complaint was filed against the Company and certain of our officers in the United States District Court for the Central District of California (the “Court”) captioned Roberti v. OSI Systems, Inc., et al. (the “Securities Class Action”). The Amended Complaint in the Securities Class Action, filed on May 20, 2014, alleges that the Company and the individual defendants violated the Exchange Act by misrepresenting or failing to disclose facts concerning the status of the Security division’s efforts to develop automated threat recognition software and the alleged use of unapproved parts in its baggage scanning systems in violation of its contract with the U.S. Transportation Security Administration (the “TSA”). The Amended Complaint also asserts that the individual defendants allegedly sold stock based on material non-public information. Following a mediation and further post-mediation settlement discussions, the parties to the litigation accepted settlement terms proposed by the mediator and entered into a stipulation and agreement of settlement (the “Settlement”), which was filed with the Court on August 21, 2015. The Settlement provides for the resolution of all of the pending claims in the Securities Class Action. The Company and the other defendants agreed to the Settlement Agreement to avoid further expense, inconvenience, and the distraction and inherent risks of burdensome and protracted litigation. Neither the Company nor the individual defendants conceded any wrongdoing or liability, and continue to believe that they have meritorious defenses to all claims alleged in the Securities Class Action. Pursuant to the Settlement, the defendants will pay $15.0 million (the “Settlement Amount”) for a full and complete release of all claims that were or could have been asserted against the Company or the other defendants in the Securities Class Action.
43
The Company expects that the Settlement Amount will be fully covered and funded by the Company’s insurers pursuant to the applicable insurance policies. The Settlement remains subject to preliminary and final approval by the Court and certain other conditions, including notice to all class members.
Three shareholder derivative complaints (the “Derivative Actions”) have also been filed purportedly on behalf of the Company against the members of our Board of Directors (as individual defendants). Hagan v. Chopra et al. was filed in the Court on April 15, 2014, and was subsequently consolidated by the Court with City of Irving Benefit Plan v. Chopra et al., which was filed on December 29, 2014. Kocen v. Chopra et al. was filed in the Delaware Court of Chancery on July 14, 2015. The Derivative Actions generally assert the same factual allegations as those at issue in the related Securities Class Action and purport to allege claims for breach of fiduciary duties and unjust enrichment against the individual defendants on behalf of the Company. Plaintiffs in the Derivative Actions seek unspecified damages, restitution, injunctive relief, attorneys’ and experts’ fees, costs, expenses, and other unspecified relief. While we believe that the Derivative Actions are without merit and intend to defend the litigation vigorously, we expect to incur costs associated with the defense of the actions. At this early stage of litigation, the ultimate outcomes of the Derivative Actions are uncertain and we cannot reasonably predict the timing or outcomes, or estimate their effect, if any, on our financial statements.
We are involved in various other claims and legal proceedings arising in the ordinary course of business. In our opinion after consultation with legal counsel, the ultimate disposition of such proceedings is not likely to have a material adverse effect on our business, financial condition, results of operations or cash flows. We have not accrued for loss contingencies relating to such matters because we believe that, although unfavorable outcomes in the proceedings may be possible, they are not considered by management to be probable or reasonably estimable. If one or more of these matters are resolved in a manner adverse to the Company, the impact on our business, financial condition, results of operations and/or liquidity could be material.
Other Matters
On December 5, 2013, our Security division was notified by the TSA that a delivery order that it had received on September 26, 2013 for baggage and handling inspection systems was being terminated for default. The termination resulted from the use of an upgraded X-ray generator component. While the component had been vetted by the Security division’s internal quality assurance, the Security division had not met the contractual requirement of obtaining the TSA’s approval in advance. The upgraded X-ray generator component has since been approved for use by the TSA. The termination resulted in a claim by the TSA for compensation. This matter was resolved by mutual agreement in April 2015.
ITEM 4. MINE SAFETY DISCLOSURES
None.
44
ITEM 5. MARKET FOR REGISTRANT’S COMMON EQUITY, RELATED STOCKHOLDER MATTERS AND ISSUER PURCHASES OF EQUITY SECURITIES
Stock Market and Other Information
Our Common Stock is traded on The NASDAQ Global Select Market under the symbol “OSIS.”
The following table sets forth the high and low sale prices of a share of our Common Stock as reported by The NASDAQ Global Select Market on a quarterly basis for fiscal 2014 and 2015. The prices shown reflect inter‑dealer prices, without retail markup, markdown or commission and may not necessarily represent actual transactions.
|
|
|
|
|
|
|
|
|
|
2014: |
|
High |
|
Low |
|
||
|
Quarter ended September 30, 2013 |
|
$ |
76.25 |
|
$ |
63.20 |
|
|
Quarter ended December 31, 2013 |
|
$ |
78.50 |
|
$ |
39.00 |
|
|
Quarter ended March 31, 2014 |
|
$ |
66.78 |
|
$ |
51.85 |
|
|
Quarter ended June 30, 2014 |
|
$ |
67.44 |
|
$ |
52.68 |
|
|
|
|
|
|
|
|
|
|
|
2015: |
|
High |
|
Low |
|
||
|
Quarter ended September 30, 2014 |
|
$ |
70.27 |
|
$ |
62.10 |
|
|
Quarter ended December 31, 2014 |
|
$ |
74.79 |
|
$ |
58.54 |
|
|
Quarter ended March 31, 2015 |
|
$ |
75.00 |
|
$ |
66.90 |
|
|
Quarter ended June 30, 2015 |
|
$ |
76.70 |
|
$ |
66.03 |
|
As of August 19, 2015, there were approximately 131 holders of record of our Common Stock. This number does not include beneficial owners holding shares through nominees or in “street” name.
Dividend Policy
We have not paid any cash dividends since the consummation of our initial public offering in 1997 and we do not currently intend to pay any cash dividends in the foreseeable future. Our Board of Directors will determine the payment of future cash dividends, if any. Certain of our current bank credit facilities restrict the payment of cash dividends and future borrowings may contain similar restrictions.
Issuer Purchases of Equity Securities
The following table presents the shares acquired during the quarter ended June 30, 2015:
|
|
|
|
|
|
|
|
|
|
|
|
|
|
|
|
|
|
|
|
|
|
Maximum number |
|
|
|
|
|
|
|
|
|
|
|
(or approximate |
|
|
|
|
|
|
|
|
|
Total number of |
|
dollar value) |
|
|
|
|
|
|
|
|
|
shares (or units) |
|
of shares (or units) |
|
|
|
|
|
|
|
|
|
purchased as |
|
that may |
|
|
|
|
Total number of |
|
Average price |
|
part of publicly |
|
yet be purchased |
|
|
|
|
|
shares (or units) |
|
paid per share |
|
announced plans or |
|
under the plans or |
|
|
|
|
|
purchased |
|
(or unit) |
|
programs |
|
programs (3) |
|
|
|
April 1, 2015 to April 30, 2015 |
|
21,562 |
(1) (2) |
$ |
68.41 |
|
20,000 |
|
849,903 |
|
|
May 1, 2015 to May 31, 2015 |
|
53,672 |
(1) (2) |
$ |
68.55 |
|
53,271 |
|
796,632 |
|
|
June 1, 2015 to June 30, 2015 |
|
32,072 |
(2) |
$ |
73.04 |
|
32,072 |
|
764,560 |
|
|
|
|
107,306 |
|
$ |
69.86 |
|
105,343 |
|
|
|
45
(1) A total of 1,562 shares and 401 shares of Common Stock were tendered to satisfy minimum statutory tax withholding obligations related to the vesting of restricted shares for the months April and May 2015, respectively.
(2)For the three months ended June 30, 2015, a total of 105,343 shares of Common Stock were purchased under the stock repurchase program at an average price of $69.80 per share.
(3)In March 1999, our Board of Directors authorized a stock repurchase program of up to 2,000,000 shares. In September 2004, our Board of Directors authorized an additional 1,000,000 shares for repurchase pursuant to this program. In April 2013, our Board of Directors authorized an additional 1,000,000 shares for repurchase pursuant to this program. This program does not have an expiration date. Upon repurchase, the shares are restored to the status of authorized but unissued and we record them as a reduction in the number of shares of Common Stock issued and outstanding in our Consolidated Financial Statements.
Equity Compensation Plans
The following table provides information concerning our equity compensation plans as of June 30, 2015.
|
|
|
|
|
|
|
|
|
|
|
|
|
|
|
|
|
|
Number of securities |
|
|
|
|
|
|
|
|
|
remaining available for |
|
|
|
|
Number of securities to |
|
Weighted‑average |
|
future issuance under |
|
|
|
|
|
be issued upon exercise |
|
exercise price of |
|
equity compensation |
|
|
|
|
|
of outstanding options, |
|
outstanding options, |
|
plans (excluding securities |
|
|
|
Plan category |
|
warrants and rights |
|
warrants and rights |
|
reflected in column (a)) |
|
|
|
|
|
(a) |
|
(b) |
|
(c) |
|
|
|
Equity compensation plans approved by security holders (1) |
|
1,012,650 |
|
$ |
27.30 |
|
3,020,206 |
(2)(3)(4) |
|
Equity compensation plans not approved by security holders |
|
— |
|
|
N/A |
|
— |
|
|
Total |
|
1,012,650 |
|
$ |
27.30 |
|
3,020,206 |
|
|
(1) |
Includes shares of our Common Stock issuable upon exercise of options under our 2006 Equity Participation Plan and our 2012 Incentive Award Plan. |
|
(2) |
These shares are available for future issuance under our 2012 Incentive Award Plan, which was approved by our shareholders on December 12, 2012. Upon shareholder approval of the 2012 Incentive Award Plan, we froze the 2006 Equity Participation Plan, and no further awards can be granted thereunder. |
|
(3) |
Awards of restricted stock, restricted stock units or other awards that convey the full value of the shares subject to the award are counted as 1.87 shares for every one award granted. |
|
(4) |
Shares subject to awards outstanding under the 2006 Equity Participation Plan that terminate, expire or lapse for any reason (up to a maximum of 2,220,000 shares) also become available for future issuance under our 2012 Incentive Award Plan. |
Performance Graph
The graph below compares the cumulative total stockholder return for the period beginning on the market close on the last trading day before the beginning of our fifth preceding fiscal year through and including the end of our last completed fiscal year with (a) The NASDAQ Composite Index and (b) a peer group of publicly‑traded issuers with which we have generally competed.
46
The peer group includes the following companies: American Science & Engineering (NASDAQ Symbol: ASEI) and Analogic Corporation (NASDAQ Symbol: ALOG).
The graph assumes that $100.00 was invested on June 30, 2010 in (a) our Common Stock, (b) The NASDAQ Composite Index and (c) the companies comprising the peer group described above (weighted according to each respective issuer’s stock market capitalization at the beginning of each period for which a return is indicated). The graph assumes that all dividends were reinvested. Historical stock price performance is not necessarily indicative of future stock price performance.
This performance graph shall not be deemed “filed” for purposes of Section 18 of the Exchange Act, or incorporated by reference into any Company filing under the Securities Act of 1933, as amended, or the Exchange Act, except as shall be expressly set forth by specific reference in such filing.
Comparison of 5 Year Cumulative Total Return
Assumes Initial Investment of $100
June 2010 through June 2015
Among OSI Systems, Inc.
The NASDAQ Composite Index and a Peer Group
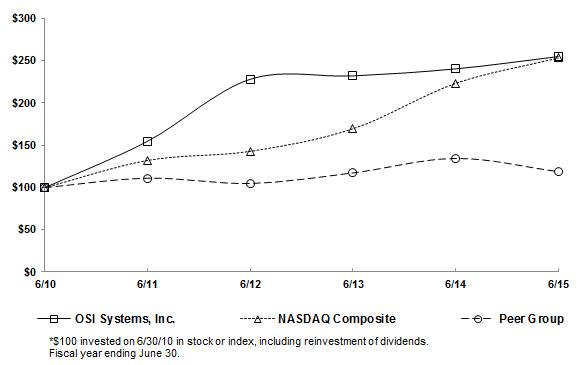
The following table provides the same information in tabular form as of June 30:
|
|
|
|
|
|
|
|
|
|
|
|
|
|
|
|
|
|
|
|
|
|
|
|
2010 |
|
2011 |
|
2012 |
|
2013 |
|
2014 |
|
2015 |
|
||||||
|
OSI Systems, Inc. |
|
$ |
100.00 |
|
$ |
154.84 |
|
$ |
228.09 |
|
$ |
231.98 |
|
$ |
240.37 |
|
$ |
254.92 |
|
|
The NASDAQ Composite Index |
|
|
100.00 |
|
|
132.14 |
|
|
142.90 |
|
|
169.55 |
|
|
223.20 |
|
|
253.21 |
|
|
Peer Group |
|
|
100.00 |
|
|
111.10 |
|
|
104.90 |
|
|
117.37 |
|
|
134.48 |
|
|
118.89 |
|
47
ITEM 6. SELECTED FINANCIAL DATA
The following tables set forth our selected consolidated financial data as of and for each of the five fiscal years ended June 30, 2015, and is derived from our Consolidated Financial Statements. The Consolidated Financial Statements as of June 30, 2014 and 2015, and for each of the years in the three‑year period ended June 30, 2015, are included elsewhere in this report. The following data should be read in conjunction with “Management’s Discussion and Analysis of Financial Condition and Results of Operations” and the Consolidated Financial Statements and Notes thereto included elsewhere in this report.
|
|
|
|
|
|
|
|
|
|
|
|
|
|
|
|
|
|
|
|
|
Year Ended June 30, |
|
|||||||||||||
|
|
|
2011 |
|
2012 |
|
2013 |
|
2014 |
|
2015 |
|
|||||
|
|
|
(in thousands, except earnings per share data) |
|
|||||||||||||
|
Consolidated Statements of Operations Data: |
|
|
|
|
|
|
|
|
|
|
|
|
|
|
|
|
|
Revenues |
|
$ |
656,100 |
|
$ |
792,990 |
|
$ |
802,047 |
|
$ |
906,742 |
|
$ |
958,202 |
|
|
Cost of goods sold |
|
|
416,834 |
|
|
524,348 |
|
|
511,621 |
|
|
601,742 |
|
|
632,849 |
|
|
Gross profit |
|
|
239,266 |
|
|
268,642 |
|
|
290,426 |
|
|
305,000 |
|
|
325,353 |
|
|
Operating expenses: |
|
|
|
|
|
|
|
|
|
|
|
|
|
|
|
|
|
Selling, general and administrative |
|
|
142,633 |
|
|
151,746 |
|
|
159,761 |
|
|
166,869 |
|
|
171,756 |
|
|
Research and development |
|
|
45,448 |
|
|
49,565 |
|
|
48,240 |
|
|
44,792 |
|
|
51,639 |
|
|
Impairment, restructuring and other charges |
|
|
3,424 |
|
|
1,391 |
|
|
7,987 |
|
|
12,044 |
|
|
9,850 |
|
|
Total operating expenses |
|
|
191,505 |
|
|
202,702 |
|
|
215,988 |
|
|
223,705 |
|
|
233,245 |
|
|
Income from operations |
|
|
47,761 |
|
|
65,940 |
|
|
74,438 |
|
|
81,295 |
|
|
92,108 |
|
|
Interest and other expense, net |
|
|
(1,026) |
|
|
(3,957) |
|
|
(5,024) |
|
|
(5,440) |
|
|
(3,255) |
|
|
Income before income taxes |
|
|
46,735 |
|
|
61,983 |
|
|
69,414 |
|
|
75,855 |
|
|
88,853 |
|
|
Provision for income taxes |
|
|
13,313 |
|
|
16,435 |
|
|
25,279 |
|
|
27,961 |
|
|
23,702 |
|
|
Net income |
|
$ |
33,422 |
|
$ |
45,548 |
|
$ |
44,135 |
|
$ |
47,894 |
|
$ |
65,151 |
|
|
Net income available to common stockholders—diluted |
|
$ |
33,422 |
|
$ |
45,548 |
|
$ |
44,135 |
|
$ |
47,894 |
|
$ |
65,151 |
|
|
Basic earnings per common share |
|
$ |
1.77 |
|
$ |
2.31 |
|
$ |
2.21 |
|
$ |
2.40 |
|
$ |
3.29 |
|
|
Diluted earnings per common share |
|
$ |
1.71 |
|
$ |
2.24 |
|
$ |
2.15 |
|
$ |
2.33 |
|
$ |
3.17 |
|
|
Weighted average shares outstanding—diluted |
|
|
19,548 |
|
|
20,330 |
|
|
20,568 |
|
|
20,587 |
|
|
20,526 |
|
|
|
|
|
|
|
|
|
|
|
|
|
|
|
|
|
|
|
|
|
|
Year Ended June 30, |
|
|||||||||||||
|
|
|
2011 |
|
2012 |
|
2013 |
|
2014 |
|
2015 |
|
|||||
|
|
|
(in thousands) |
|
|||||||||||||
|
Consolidated Balance Sheet Data: |
|
|
|
|
|
|
|
|
|
|
|
|
|
|
|
|
|
Cash and cash equivalents |
|
$ |
55,619 |
|
$ |
91,452 |
|
$ |
34,697 |
|
$ |
38,831 |
|
$ |
47,593 |
|
|
Working capital |
|
|
244,305 |
|
|
322,464 |
|
|
244,885 |
|
|
263,514 |
|
|
292,240 |
|
|
Total assets |
|
|
584,916 |
|
|
749,896 |
|
|
952,739 |
|
|
1,011,077 |
|
|
979,674 |
|
|
Long‑term debt |
|
|
2,756 |
|
|
2,467 |
|
|
10,673 |
|
|
10,436 |
|
|
8,556 |
|
|
Total debt |
|
|
2,977 |
|
|
2,682 |
|
|
71,470 |
|
|
37,255 |
|
|
11,357 |
|
|
Total stockholders’ equity |
|
|
384,800 |
|
|
434,119 |
|
|
478,451 |
|
|
532,213 |
|
|
581,779 |
|
48
ITEM 7. MANAGEMENT’S DISCUSSION AND ANALYSIS OF FINANCIAL CONDITION AND RESULTS OF OPERATIONS
Overview
We are a vertically integrated designer and manufacturer of specialized electronic systems and components for critical applications. We sell our products and provide related services in diversified markets, including homeland security, healthcare, defense and aerospace. We have three operating divisions: (a) Security, providing security and inspection systems and turnkey security screening solutions; (b) Healthcare, providing patient monitoring, diagnostic cardiology, anesthesia systems and defibrillator products; and (c) Optoelectronics and Manufacturing, providing specialized electronic components for our Security and Healthcare divisions, as well as to third parties for applications in the defense and aerospace markets, among others.
Security Division. Through our Security division, we provide security screening products and services worldwide, as well as turnkey security screening solutions. These products and services are used to inspect baggage, parcels, cargo, people, vehicles and other objects for weapons, explosives, drugs, radioactive and nuclear materials and other contraband. Revenues from our Security division accounted for 50% of our total consolidated revenues for fiscal 2015.
As a result of the terrorist attacks of September 11, 2001, and subsequent attacks in other locations worldwide, security and inspection products have increasingly been used at a wide range of facilities other than airports, such as border crossings, railways, seaports, cruise line terminals, freight forwarding operations, sporting venues, government and military installations and nuclear facilities. We believe that our wide‑ranging product portfolio together with our ability to provide turnkey screening solutions position us to competitively pursue security and inspection opportunities as they arise throughout the world.
Currently, the U.S. federal government is discussing various options to address sequestration and the U.S. federal government’s overall fiscal challenges and we cannot predict the outcome of these efforts. While we believe that national security spending will continue to be a priority, U.S. government budget deficits and the national debt have created increasing pressure to examine and reduce spending across many federal agencies. We believe that the diversified product portfolio and international customer mix of our Security division position us well to withstand the impact of these uncertainties and even benefit from specific initiatives within various governments. However, depending on how future sequestration cuts are implemented and how the U.S. federal government manages its fiscal challenges, we believe that these federal actions could have a material, adverse effect on our business, financial condition and results of operations.
Healthcare Division. Through our Healthcare division, we design, manufacture, market and service patient monitoring, diagnostic cardiology, anesthesia delivery and ventilation systems and defibrillator products worldwide for sale primarily to hospitals and medical centers. Our products monitor patients in critical, emergency and perioperative care areas of the hospital and provide such information, through wired and wireless networks, to physicians and nurses who may be at the patient’s bedside, in another area of the hospital or even outside the hospital. Revenues from our Healthcare division accounted for 27% of our total consolidated revenues for fiscal 2015.
The healthcare markets in which we operate are highly competitive. We believe that our customers choose among competing products on the basis of product performance, functionality, value and service. In addition, there is continued uncertainty regarding the ongoing debates related to the U.S. budget, the debt ceiling and the Affordable Care Act, any of which may impact hospital spending, third‑party payor reimbursement and fees to be levied on certain medical device revenues, any of which could adversely affect our business and results of operations. In addition, hospital capital spending appears to have been impacted by strategic uncertainties surrounding the Affordable Care Act and economic pressures. We also believe that the economic slowdown has caused some hospitals and healthcare providers to delay purchases of our products and services. During this period of uncertainty, sales of our healthcare products may be negatively impacted. Although there are indications that a general economic recovery is underway, we cannot predict when the markets will fully recover or when the uncertainties related to the U.S. federal government will be resolved and, therefore, when this period of delayed and diminished purchasing will end. A prolonged delay could have a material adverse effect on our business, financial condition and results of operations.
49
Optoelectronics and Manufacturing Division. Through our Optoelectronics and Manufacturing division, we design, manufacture and market optoelectronic devices and provide electronics manufacturing services globally for use in a broad range of applications, including aerospace and defense electronics, security and inspection systems, medical imaging and diagnostics, telecommunications, office automation, computer peripherals, industrial automation, automotive diagnostic systems, gaming systems and consumer products. We also provide our optoelectronic devices and electronics manufacturing services to original equipment manufacturers, as well as our own Security and Healthcare divisions. Revenues from external customers in our Optoelectronics and Manufacturing division accounted for approximately 23% of our total consolidated revenues for fiscal 2015.
Consolidated Results
Fiscal 2015 Compared with Fiscal 2014. We reported consolidated operating profit of $92.1 million for fiscal 2015, a $10.8 million, or 13%, improvement over the $81.3 million operating profit reported for fiscal 2014. This improved profitability was driven primarily by a 6% increase in sales, which was the primary driver of a $20.4 million increase in gross profit, and a $2.2 million decrease in impairment, restructuring and other charges. These factors were partially offset by a $4.9 million increase in SG&A expenses to support our growth and a $6.8 million increase in research and development to support and expand our product portfolio.
Fiscal 2014 Compared with Fiscal 2013. We reported consolidated operating profit of $81.3 million for fiscal 2014, a $6.9 million, or 9%, improvement over the $74.4 million operating profit reported for fiscal 2013. This improved profitability was driven primarily by a 13% increase in sales, which resulted in a $14.6 million increase in gross profit. This increase was partially offset by a $7.1 million increase in SG&A expenses to support our growth and a $4.0 million increase in impairment, restructuring and other charges.
Acquisitions. Historically, an active acquisition program has been an important element of our corporate strategy. Over the past three years, each of our acquisitions has not been considered materially significant, either individually or in the aggregate. We continue to believe that an active acquisition program supports our long‑term strategic goals and we intend to look to acquisitions to strengthen our competitive position, expand our customer base and augment our considerable research and development programs. Through such efforts we aim to accelerate innovation, improve earnings and increase overall stockholder value.
Critical Accounting Policies and Estimates
The following discussion and analysis of our financial condition and results of operations is based on our Consolidated Financial Statements, which have been prepared in conformity with accounting principles generally accepted in the United States. Our preparation of these Consolidated Financial Statements requires us to make judgments and estimates that affect the reported amounts of assets and liabilities, disclosure of contingent assets and liabilities at the date of the financial statements and the reported amounts of revenues and expenses during the reporting period. We base our estimates on historical experience and on various other assumptions that we believe to be reasonable under the circumstances. As a result, actual results may differ from such estimates. Our senior management has reviewed these critical accounting policies and related disclosures with the Audit Committee of our Board of Directors. The following summarizes our critical accounting policies and significant estimates used in preparing our Consolidated Financial Statements:
Revenue Recognition. We recognize revenue from sales of products when title and risk of loss passes, and when terms are fixed and collection is probable. Generally, this occurs upon shipment but there are instances when customer acceptance occurs at our factory where the product is held at the customer’s request. In these instances, when we are able to bill our customer and payment is probable, we recognize revenue. Revenue from services includes after‑market services, installation and implementation of products, and turnkey security screening services. The portion of revenue for the sale attributable to installation is deferred and recognized when the installation service is provided. In an instance where terms of sale include subjective customer acceptance criteria, revenue is deferred until we have achieved the acceptance criteria. Concurrent with revenue recognition, we accrue estimated product return reserves and warranty expenses. Critical judgments made by management related to revenue recognition include the determination of whether or not customer acceptance criteria are perfunctory or inconsequential. The determination of whether or not customer acceptance terms are
50
perfunctory or inconsequential impacts the amount and timing of revenue recognized. Critical judgments also include estimates of warranty reserves, which are established based on historical experience and knowledge of the product under warranty.
Revenue from turnkey services agreements is included in revenue from services. In certain agreements, revenue is recognized based upon proportional performance, measured by the actual number of hours incurred divided by the total estimated number of hours for the project. The impact of changes in the estimated hours to service the agreement is reflected in the period during which the change becomes known.
We recognize revenues from out of warranty service maintenance contracts ratably over the term of the contracts. For services not derived from specific maintenance contracts, we recognize service revenues as we perform the services. Deferred revenue for such services arises from payments received from customers for services not yet performed.
Allowance for Doubtful Accounts. The allowance for doubtful accounts involves estimates based on management’s judgment, review of individual receivables and analysis of historical bad debts. We monitor collections and payments from our customers and we maintain allowances for doubtful accounts for estimated losses resulting from the inability of our customers to make required payments. We also assess current economic trends that might impact the level of credit losses in the future. If the financial condition of our customers were to deteriorate, resulting in an impairment of their ability to make payments, additional allowances could be required.
Inventory. Inventory is stated at the lower of cost or market. Cost is determined on the first‑in, first‑out method. We write down inventory for slow‑moving and obsolete inventory based on assessments of future demands, market conditions and customers who may be experiencing financial difficulties. If these factors were to become less favorable than those projected, additional inventory write‑downs could be required.
Property and Equipment. Property and equipment are stated at cost less accumulated depreciation and amortization. Depreciation and amortization are charged while assets are used in service and are computed using the straight‑line method over the estimated useful lives of the assets and taking into account their estimated salvage value. Amortization of leasehold improvements is calculated on the straight‑line basis over the shorter of the useful life of the asset or the lease term. Leased capital assets are included in property and equipment. Amortization of property and equipment under capital leases is included with depreciation expense. In the event that property and equipment for turnkey screening operations are idle as a result of the early termination, nonrenewal or reduction in scope of the related project, such assets are assessed for impairment on a periodic basis.
Income Taxes. Our annual tax rate is based on our income, statutory tax rates and tax planning opportunities available to us in the various jurisdictions in which we operate. Tax laws are complex and subject to different interpretations by the taxpayer and respective governmental taxing authorities. Significant judgment is required in determining our tax expense and in evaluating our tax positions including evaluating uncertainties. We review our tax positions quarterly and adjust the balances as new information becomes available.
Deferred income tax assets represent amounts available to reduce income taxes payable on taxable income in future years. Such assets arise because of temporary differences between the financial reporting and tax bases of assets and liabilities, as well as from net operating loss and tax credit carryforwards. We evaluate the recoverability of these future tax deductions by assessing the adequacy of future expected taxable income from all sources, including reversal of taxable temporary differences, forecasted operating earnings and available tax planning strategies. These sources of income inherently rely on estimates. To provide insight, we use our historical experience and our short and long‑range business forecasts. We believe it is more likely than not that a portion of the deferred income tax assets may expire unused and therefore have established a valuation allowance against them. Although realization is not assured for the remaining deferred income tax assets, we believe it is more likely than not that the deferred tax assets will be fully recoverable within the applicable statutory expiration periods. However, deferred tax assets could be reduced in the near term if our estimates of taxable income are significantly reduced or available tax planning strategies are no longer viable.
Business Combinations. Under the acquisition method of accounting, we allocate the fair value of the consideration paid for the businesses to the tangible and identifiable intangible assets acquired and liabilities assumed
51
based on their estimated fair values. We record the excess of purchase price over the aggregate fair values as goodwill. We engage third‑party appraisal firms to assist us in determining the fair values of assets acquired and liabilities assumed for larger transactions. These valuations require us to make significant estimates and assumptions, especially with respect to intangible assets and the fair value of contingent payment obligations. Critical estimates in valuing purchased technology, customer lists and other identifiable intangible assets include future cash flows that we expect to generate from the acquired assets. If the subsequent actual results and updated projections of the underlying business activity change compared with the assumptions and projections used to develop these values, we could experience impairment charges. In addition, we have estimated the economic lives of certain acquired assets and these lives are used to calculate depreciation and amortization expense. If our estimates of the economic lives change, depreciation or amortization expenses could be accelerated or slowed.
Impairment of Long‑Lived Assets. Goodwill represents the excess purchase price of net tangible and intangible assets acquired in business combinations over their estimated fair value. Goodwill is allocated to our segments based on the nature of the product line of the acquired business. The carrying value of goodwill is not amortized, but is annually tested for impairment during our second quarter and more often if there is an indicator of impairment. Intangible assets other than goodwill are amortized over their useful lives unless these lives are determined to be indefinite.
We assess qualitative factors of each of our reporting units to determine whether it is more likely than not that the fair value of a reporting unit is less than its carrying amount, including goodwill. Such assessments indicated that it is not more likely than not that the fair value of each reporting unit is less than its carrying amount, including goodwill. Thus, we have determined that it is not necessary to proceed with the two‑step goodwill impairment test. There was no goodwill impairment for each of the three fiscal years ended June 30, 2015. We evaluate long‑lived assets with finite lives for impairment whenever events or changes in circumstances indicate that the carrying amount of the asset may not be recoverable. Impairment is considered to exist if the total estimated future cash flows on an undiscounted basis are less than the carrying amount of the assets. If impairment does exist, we measure the impairment loss and record it based on the discounted estimate of future cash flows. In estimating future cash flows, we group assets at the lowest level for which there are identifiable cash flows that are largely independent of the cash flows from other asset groups. Our estimate of future cash flows is based upon, among other things, certain assumptions about expected future operating performance, growth rates and other factors.
Although we believe the assumptions and estimates we have made in the past have been reasonable and appropriate, different assumptions and estimates could materially impact our reported financial results. More conservative estimates of the anticipated future benefits from these businesses could result in impairment charges, which would decrease net income and result in lower asset values on our balance sheet.
Stock‑Based Compensation Expense. We account for stock‑based compensation using fair value recognition provisions. Thus, we record stock‑based compensation as a charge to earnings net of the estimated impact of forfeited awards. As such, we recognize stock‑based compensation cost only for those stock‑based awards that are estimated to ultimately vest over their requisite vesting period, based on the vesting provisions of the individual grants.
The process of estimating the fair value of stock‑based compensation awards and recognizing stock‑based compensation cost over their requisite vesting period involves significant assumptions and judgments. We estimate the fair value of stock option awards on the date of grant using the Black‑Scholes option‑valuation model which requires that we make certain assumptions regarding: (i) the expected volatility in the market price of our Common Stock; (ii) dividend yield; (iii) risk‑free interest rates; and (iv) the period of time employees are expected to hold the award prior to exercise. We estimate the fair value of restricted stock and restricted stock unit awards on the date of the grant using the market price of our Common Stock on that date. In addition, we are required to estimate the expected impact of forfeited awards and recognize stock‑based compensation cost only for those awards expected to vest. If actual forfeiture rates differ materially from our estimates, stock‑based compensation expense could differ significantly from the amounts we have recorded in the current period. We periodically review actual forfeiture experience and revise our estimates, as necessary. We recognize the cumulative effect of changes in the estimated forfeiture rate as compensation cost in earnings in the period of the revision. As a result, if we revise our assumptions and estimates, our stock‑based compensation expense could change materially in the future. Certain shares of restricted stock and restricted stock units vest based upon the achievement of pre‑established performance criteria. We estimate the fair value of performance‑based awards at the date
52
of grant based upon the probability that the specified performance criteria will be met, adjusted for estimated forfeitures. Each quarter we update our assessment of the probability that the specified performance criteria will be achieved and adjust our estimate of the fair value of the performance‑based awards if necessary. We amortize the fair values of performance‑based awards over the requisite service period adjusted for estimated forfeitures for each separately vesting tranche of the award. See Note 7 to the Consolidated Financial Statements for a further discussion of stock‑based compensation.
Legal and Other Contingencies. We are subject to various claims and legal proceedings. We review the status of each significant legal dispute to which we are a party and assess our potential financial exposure, if any. If the potential financial exposure from any claim or legal proceeding is considered probable and the amount can be reasonably estimated, we record a liability and an expense for the estimated loss. Significant judgment is required in both the determination of probability and the determination as to whether an exposure is reasonably estimable. Because of uncertainties related to these matters, accruals are based only on the best information available at the time. As additional information becomes available, we reassess the potential liability related to our pending claims and litigation and revise our estimates accordingly. Such revisions in the estimates of the potential liabilities could have a material impact on our results of operations and financial position.
Net Revenues
The table below and the discussion that follows are based upon the way we analyze our business. See Note 13 to the Consolidated Financial Statements for additional information about business segments.
|
|
|
|
|
|
|
|
|
|
|
|
|
|
|
|
|
|
|
|
|
|
|
|
|
|
|
|
% of |
|
|
|
|
% of |
|
|
|
|
% of |
|
2013‑2014 |
|
2014‑2015 |
|
|
|
|
2013 |
|
Net Sales |
|
2014 |
|
Net Sales |
|
2015 |
|
Net Sales |
|
% Change |
|
% Change |
|
|||
|
|
|
(Dollars in millions) |
|
|||||||||||||||||
|
Security |
|
$ |
372.2 |
|
46 |
% |
$ |
440.4 |
|
49 |
% |
$ |
481.1 |
|
50 |
% |
18 |
% |
9 |
% |
|
Healthcare |
|
|
231.3 |
|
29 |
% |
|
222.3 |
|
24 |
% |
|
255.7 |
|
27 |
% |
(4) |
% |
15 |
% |
|
Optoelectronics / Manufacturing |
|
|
198.5 |
|
25 |
% |
|
244.0 |
|
27 |
% |
|
221.4 |
|
23 |
% |
23 |
% |
(9) |
% |
|
Total Net Revenues |
|
$ |
802.0 |
|
|
|
$ |
906.7 |
|
|
|
$ |
958.2 |
|
|
|
13 |
% |
6 |
% |
Fiscal 2015 Compared with Fiscal 2014. Revenues for the Security division increased 9% primarily as a result of new product launches, and increased cargo sales comprised of $48 million of incremental revenue from the Foreign Military Sale contract with the U.S. Department of Defense (“FMS Contract”) awarded in the fourth quarter of fiscal 2014 to supply multiple units of cargo and vehicle inspection systems and related training, spare parts, service and logistics support for Iraq. These increases were partially offset by a decrease in sales of other products and services.
Revenues for the Healthcare division increased 15% primarily as a result of a 14% increase in sales in North America as sales in the U.S. and Canada improved significantly, an 11% increase in Latin American and Asian markets, and the impact of an acquisition of a European cardiology equipment business during the first quarter of fiscal 2015, which drove 8% of the division’s growth. The increase in organic sales primarily occurred within our patient monitoring product line as the domestic market improved coupled with the success of new product introductions. These increases were partially offset by a decrease in organic sales in our Europe, Middle East and African regions.
Revenues for the Optoelectronics and Manufacturing decreased 9% as a result of lower contract manufacturing sales in the current fiscal year. This decrease was primarily attributable to significant sales to two customers during fiscal 2014 to whom we continue to sell but at a lower level. Increased sales within our commercial optoelectronics business partially offset this decrease.
53
Fiscal 2014 Compared with Fiscal 2013. Revenues for the Security division increased 18% primarily as a result of an increase in revenue from our turnkey screening services in Mexico as the program ramped up in fiscal 2014, and due to growth in the sales of cargo equipment, including the partial fulfillment of the FMS Contract. These increases were partially offset by a decrease in the sales of baggage and parcel inspection equipment.
Revenues for the Healthcare division decreased 4% primarily as a result of an $8.7 million, or 5%, decrease in our patient monitoring product line sales mainly in our North American region as certain hospitals have delayed capital spending.
Revenues for the Optoelectronics and Manufacturing division increased 23% driven by strong organic growth as well as acquisitions. The organic growth was led by a $25.1 million increase in contract manufacturing sales primarily to customers in the consumer products and industrial businesses, partially offset by a $7.6 million decrease in commercial optoelectronics sales mainly caused by reduced aerospace and defense industry spending. This growth was supplemented by fiscal 2014 acquisitions, which contributed $28.0 million in revenues.
Gross Profit
|
|
|
|
|
|
|
|
|
|
|
|
|
|
|
|
|
|
|
|
|
|
|
|
% of |
|
|
|
|
% of |
|
|
|
|
% of |
|
|
|
|
2013 |
|
Net Sales |
|
2014 |
|
Net Sales |
|
2015 |
|
Net Sales |
|
|||
|
|
|
(Dollars in millions) |
|
|||||||||||||
|
Gross profit |
|
$ |
290.4 |
|
36.2 |
% |
$ |
305.0 |
|
33.6 |
% |
$ |
325.4 |
|
34.0 |
% |
Fiscal 2015 Compared with Fiscal 2014. Gross profit increased 7% primarily as a result of the 6% increase in sales. Our gross margin during fiscal 2015 increased to 34.0% from 33.6% for the prior year. The increase was attributable to: (i) the impact of increased revenue from our Healthcare division, which grew faster than our other two divisions, and which historically generates the highest gross margins across the three divisions; (ii) the impact of a reduction in revenues in our Optoelectronics and Manufacturing division, which historically generates the lowest gross margin across the three divisions; and (iii) operational improvements implemented within our Optoelectronics and Manufacturing division. These factors were partially offset by increased depreciation associated with our turnkey operations in the Security division.
Fiscal 2014 Compared with Fiscal 2013. Gross profit increased $14.6 million, or 5%, to $305.0 million for fiscal 2014, from $290.4 million for fiscal 2013 and was attributable to the 13% increase in sales. Our gross margin during the period decreased to 33.6% from 36.2% for the prior‑year period. The decrease was attributable to: (i) the impact of increased revenue from our Optoelectronics and Manufacturing division, which grew faster than our other two divisions, and which historically generates the lowest gross margins across the three division; (ii) the impact of product mix within our Optoelectronics and Manufacturing division, as a higher proportion of sales occurred in the contract manufacturing business, which carries lower gross margins than the optoelectronics business; (iii) the impact of a reduction in revenues in our Healthcare division, which historically generates the highest gross margin across the three divisions and (iv) increased depreciation associated with the ramp up of turnkey operations in our Security division. These factors were partially offset by improvements in margins in the cargo equipment business within our Security division, primarily as a result of more efficient manufacturing processes and economies of scale.
54
Operating Expenses
|
|
|
|
|
|
|
|
|
|
|
|
|
|
|
|
|
|
|
|
|
|
|
|
|
|
|
|
% of |
|
|
|
|
% of |
|
|
|
|
% of |
|
2013‑2014 |
|
2014‑2015 |
|
|
|
|
2013 |
|
Net Sales |
|
2014 |
|
Net Sales |
|
2015 |
|
Net Sales |
|
% Change |
|
% Change |
|
|||
|
|
|
(Dollars in millions) |
|
|||||||||||||||||
|
Selling, general and administrative |
|
$ |
159.8 |
|
19.9 |
% |
$ |
166.9 |
|
18.4 |
% |
$ |
171.8 |
|
17.9 |
% |
4 |
% |
3 |
% |
|
Research and development |
|
|
48.2 |
|
6.0 |
% |
|
44.8 |
|
4.9 |
% |
|
51.6 |
|
5.4 |
% |
(7) |
% |
15 |
% |
|
Impairment, restructuring and other charges |
|
|
8.0 |
|
1.0 |
% |
|
12.0 |
|
1.3 |
% |
|
9.8 |
|
1.0 |
% |
50 |
% |
(18) |
% |
|
Total operating expenses |
|
$ |
216.0 |
|
26.9 |
% |
$ |
223.7 |
|
24.7 |
% |
$ |
233.2 |
|
24.3 |
% |
4 |
% |
4 |
% |
Selling, General and Administrative
SG&A expenses consisted primarily of compensation paid to sales, marketing and administrative personnel, professional service fees and marketing expenses.
Fiscal 2015 Compared with Fiscal 2014. For fiscal 2015, SG&A expenses increased by 3% to support our 6% revenue growth. As a percentage of revenue, SG&A expenses were 17.9% for fiscal 2015, compared to 18.4% for the comparable prior year period.
Fiscal 2014 Compared with Fiscal 2013. For fiscal 2014, SG&A expenses increased by 4% primarily to support our 13% revenue growth and as a result of increased professional fees primarily in our Security division. As a percentage of revenue, SG&A expenses were 18.4% for fiscal 2014, compared to 19.9% for the comparable prior year period.
Research and Development
Our Security and Healthcare divisions have historically invested substantial amounts in R&D. We intend to continue this trend in future years, although specific programs may or may not continue to be funded and funding levels may fluctuate. R&D expenses included research related to new product development and product enhancement expenditures.
Fiscal 2015 Compared with Fiscal 2014. R&D spending in fiscal 2015 increased by 15% over the prior year as a result of increased investment in the next generation of products within our Security division. This increase was partially offset by a decrease in spending within our Healthcare division.
Fiscal 2014 Compared with Fiscal 2013. For fiscal 2014, R&D expenses decreased by 7% from fiscal 2013 mainly as a result of reduced spending related to products that are nearing completion as well as resources moving from R&D activities to support newly developed products in our Security division.
Impairment, Restructuring and Other Charges
For the past several years we have endeavored to align our global capacity and infrastructure with demand by our customers and fully integrate acquisitions, thereby improving our operational efficiency. These activities included reducing excess workforce and capacity, consolidating and relocating certain manufacturing facilities and reviewing the value of certain technologies and product lines. The overall objectives of the restructuring activities were to lower costs and better utilize our existing manufacturing capacity. During fiscal 2013 through 2015, we continued these efforts to further increase operating efficiencies. Our efforts have helped enhance our ability to improve operating margins, retain and expand existing relationships with customers and attract new business. We may utilize similar measures in the future to realign our operations to further increase our operating efficiencies. The effect of these efforts may materially affect our future operating results.
55
Fiscal 2015 Compared with Fiscal 2014. During fiscal 2015, we incurred $9.8 million of impairment, restructuring and other charges as follows: (i) $5.4 million related to facility consolidations and severance; (ii) $3.8 million of costs incurred within our Security division related to contract issues with the U. S. federal government; and (iii) $0.7 million of professional fees associated with defending the Securities Class Action and Derivative Actions, which were recorded in our Corporate segment. See description of costs incurred in fiscal 2014 in the section below.
Fiscal 2014 Compared with Fiscal 2013. During fiscal 2014, we incurred $12.0 million of impairment, restructuring and other charges as follows: (i) $2.3 million in our Security and Optoelectronics and Manufacturing divisions for employee termination costs and costs related to facility consolidations; (ii) $2.0 million in our Healthcare division related to our move into a new building to serve as the division’s headquarters and primary manufacturing facility; (iii) $5.8 million of costs incurred within our Security division related to contract issues with the U. S. federal government; (iv) $1.3 million in our Corporate segment for debt restructuring costs related to the amendment of our credit agreement that was completed in the fourth quarter of fiscal 2014 and (v) $0.6 million of professional fees associated with defending the Securities Class Action and Derivative Actions, which were recorded in our Corporate segment.
During fiscal 2013, we incurred $8.0 million of impairment, restructuring and other charges primarily related to headcount reductions and facility consolidation, and in conjunction with our agreement with the Transportation Security Administration (TSA) related to the Rapiscan Secure 1000SP Advanced Imaging Technology system and associated Automated Target Recognition software and our related agreement with the U.S. Department of Homeland Security (DHS). Of this amount, $2.4 million was recorded within our Healthcare division, $5.0 million was recorded within our Security division, and $0.6 million was recorded within our Optoelectronics and Manufacturing division.
Interest Expense and Other Income, net
Interest expense and other income, net includes interest expense related to our credit facility and other debt, the impact of foreign currency forward contracts that were not treated as cash flow hedges and other non‑operating expense and income items.
Fiscal 2015 Compared with Fiscal 2014. In fiscal 2015, our interest expense and other income, net was $3.3 million, compared to $5.4 million in fiscal 2014. This decrease was due to decreased interest expense related to lower average outstanding borrowings and lower average outstanding letters of credit under our revolving credit facility, and the reduction in the cost of borrowing in connection with the amended credit facility completed in May 2014.
Fiscal 2014 Compared with Fiscal 2013. In fiscal 2014, our interest expense and other income, net was $5.4 million, compared to $5.0 million in fiscal 2013. This increase was primarily due to the prior‑year favorable impact of the gain related to the performance of foreign currency forward contracts. The net interest expense in fiscal 2014 associated with borrowings and the utilization of the letters‑of‑credit facility were similar to fiscal 2013.
Provision for Income Taxes
The effective tax rate for a particular period varies depending on a number of factors including (i) the mix of income earned in various tax jurisdictions, each of which applies a unique range of income tax rates and income tax credits, (ii) changes in previously established valuation allowances for deferred tax assets (changes are based upon our current analysis of the likelihood that these deferred tax assets will be realized), (iii) the level of non‑deductible expenses, (iv) certain tax elections and (v) tax holidays granted to certain of our international subsidiaries.
Fiscal 2015 Compared with Fiscal 2014. In fiscal 2015, our income tax expense was $23.7 million, compared to $28.0 million for fiscal 2014, resulting in an effective tax rate of 26.7% in fiscal 2015 and 36.9% in fiscal 2014. Included within the fiscal 2014 expense was a non‑cash tax charge of $7.6 million as a result of electing to accelerate the tax depreciation of certain fixed assets related to our turnkey screening solutions program in Mexico. This election resulted in cash tax savings of approximately $21 million in fiscal 2014. However, portions of the tax bases of the underlying assets were forfeited resulting in a non‑cash tax charge in the year the election was made. Excluding the impact of this charge, our effective tax rate would have been 26.8% in fiscal 2014.
56
Fiscal 2014 Compared with Fiscal 2013. In fiscal 2014, our income tax expense was $28.0 million, compared to $25.3 million for fiscal 2013, resulting in an effective tax rate of 36.9% in fiscal 2014 and 36.4% in fiscal 2013. Included within the fiscal 2014 expense was a non‑cash tax charge of $7.6 million resulting in cash tax savings of approximately $21 million in fiscal 2014 as explained above. Similarly, included in the fiscal 2013 expense was a non‑cash tax charge of $6.8 million as a result of electing to accelerate the tax depreciation of certain fixed assets related to our turnkey screening solution program in Mexico. This prior year election resulted in cash tax savings of approximately $26 million. However, in both fiscal 2014 and 2013, portions of the tax bases of the underlying assets were forfeited resulting in a non‑cash tax charge in the year the election was made. Excluding the impact of these charges, our effective tax rate would have been 26.8% in fiscal 2014 and 26.6% in fiscal 2013. Effective for tax years beginning January 1, 2014, the election to accelerate depreciation is no longer available in the Mexican tax code.
Liquidity and Capital Resources
Our principal sources of liquidity are our cash and cash equivalents, cash generated from operations and our credit facility. Cash and cash equivalents totaled $47.6 million at June 30, 2015, an increase of $8.8 million, or 23%, from $38.8 million at June 30, 2014. During fiscal 2015, we generated $105.1 million of cash flow from operations. The majority of the proceeds were used for the following: $15.3 million invested in capital expenditures, $24.0 million in the repayment of bank lines of credit, $20.1 million for the acquisition of businesses and other assets and $37.9 million for the repurchase of our Common Stock, including net share settlement of equity awards. If we continue to net settle equity awards, we will use additional cash to pay our tax withholding obligations in connection with such settlements.
We currently anticipate that our available funds, credit facilities and cash flow from operations will be sufficient to meet our operational cash needs for the foreseeable future. In addition, without repatriating earnings from non‑U.S. subsidiaries, we anticipate that cash generated from operations will be able to satisfy our obligations in the U.S., including our outstanding lines of credit, as accounting earnings in the U.S. are not necessarily indicative of cash flows since earnings are generally reduced by non‑cash expenses including depreciation, amortization, and stock‑based compensation.
We have a five-year revolving credit facility that allows us to borrow up to $450 million at London Interbank Offered Rate (“LIBOR”) plus 1.25% depending upon our leverage ratio. As of June 30, 2015, there was no borrowing outstanding under the revolving credit facility and letters‑of‑credit outstanding totaled $6.0 million.
Cash Provided by Operating Activities
Cash flows from operating activities can fluctuate significantly from period to period as profitability, tax timing differences and other items can significantly impact cash flows. Our largest source of operating cash flows is cash collections from our customers following the sale of our products and services. Our primary uses of cash for operating activities are for purchasing inventory in support of the products that we sell, personnel related expenditures, facilities costs and payments for general operating matters.
Fiscal 2015 Compared with Fiscal 2014. Cash generated by operating activities in fiscal 2015 was $105.1 million, a decrease of $24.1 million, or 19%, from fiscal 2014. This decrease was primarily due to changes in working capital in the current‑year period when compared to the prior‑year period, including: (i) an $18.8 million decrease in the change in cash flow from accounts receivables due partially to the impact of substantial efforts to improve our days sales outstanding in fiscal 2014 and collecting delinquent receivables from our turnkey program in Mexico in fiscal 2014; (ii) a $52.8 million decrease in the change in cash flow from deferred revenue as a result of earning revenue related to the turnkey program in Mexico and for other services and product installations that were previously paid for by customers; and (iii) a $12.6 million decrease in the change in prepaid expenses and other assets. These unfavorable changes in cash flow were partially offset by the following favorable changes in working capital: (i) a $12.9 million increase in net income for fiscal 2015, after giving consideration to non‑cash operating items including depreciation and amortization, stock‑based compensation and deferred taxes among others, as compared to the fiscal 2014; (ii) a $21.3 increase in the change of inventory primarily as a result of an inventory build that occurred at the end of fiscal 2014 related to the fulfillment of a large order within the Security division; (iii) an $11.0 million decrease in the change of accounts payable; and (iv) a $13.0 million increase in the change of other accrued expenses and current liabilities.
57
Fiscal 2014 Compared with Fiscal 2013. Cash generated by operating activities in fiscal 2014 was $129.2 million, an increase of $70.5 million, or 120%, from fiscal 2013. This increase was primarily due to changes in working capital in the current‑year period when compared to the prior‑year period, including: (i) a $79.7 increase in the change in cash flow from accounts receivables due partially to the increased level of focus on improving our days sales outstanding and collecting delinquent receivables from our turnkey program in Mexico; and (ii) a $46.2 million increase in the change in cash flow from deferred revenue as well as due to the $32.9 million increase in net income for fiscal 2014 after giving consideration to non‑cash operating items including depreciation and amortization, stock‑based compensation and deferred taxes among others as compared to the prior‑year period. These favorable changes in cash flow were partially offset by the following unfavorable changes in working capital: (i) a $66.6 million decrease in the change in cash from accounts payable and (ii) a $16.1 million decrease in the change from prepaid expenses and other current assets.
Cash Used in Investing Activities
The changes in cash flows from investing activities were primarily related to capital expenditures as well as the acquisition of businesses and other assets to support our growth plans.
Fiscal 2015 Compared with Fiscal 2014. Net cash used in investing activities was $35.4 million in fiscal 2015, a decrease of $36.8 million, or 51%, as compared to the $72.2 million used in fiscal 2014. During fiscal 2015, we invested $15.3 million in capital expenditures as compared to $54.6 million in the comparable prior‑year period. This decrease was primarily a result of the timing of capital expenditures in support of our turnkey screening program in Mexico. During fiscal 2015, we also used cash of $20.1 million for the acquisitions of businesses and other assets as compared to $17.6 million in the comparable prior‑year period.
Fiscal 2014 Compared with Fiscal 2013. Net cash used in investing activities was $72.2 million in fiscal 2014, a decrease of $95.7 million, or 57%, as compared to the $167.9 million used in fiscal 2013. During fiscal 2014, we invested $54.6 million in capital expenditures as compared to $157.4 million in the comparable prior‑year period. This decrease was primarily a result of the timing of capital expenditures in support of our turnkey screening program in Mexico. During fiscal 2014, we also used cash of $17.6 million for the acquisitions of businesses and other assets as compared to $10.5 million in the comparable prior‑year period.
Cash Provided by (Used in) Financing Activities
The changes in cash flows from financing activities primarily relate to (i) borrowings and payments under debt obligations; (ii) the issuance of and/or repurchase of Common Stock and (iii) employee stock plan activities.
Fiscal 2015 Compared with Fiscal 2014. Net cash used in financing activities was $60.0 million in fiscal 2015, compared to net cash used in financing activities of $54.3 million in fiscal 2014. In fiscal 2015 we repaid $24.0 million on our outstanding bank lines of credit as compared to $35.0 million in the comparable prior‑year period. In fiscal 2015, we repurchased $37.9 million of our Common Stock including net settlement of equity awards compared to $20.6 million for the comparable prior‑year period.
Fiscal 2014 Compared with Fiscal 2013. Net cash used in financing activities was $54.3 million in fiscal 2014, compared to net cash provided by financing activities of $51.1 million in fiscal 2013. In fiscal 2014 we paid down our outstanding bank lines of credit by using $35.0 million as compared to receiving $59.0 million in the comparable prior‑year period. In fiscal 2014, we repurchased $20.6 million of our Common Stock including net settlement of equity awards compared to $22.4 million for the comparable prior‑year period. In addition, cash provided by financing in the prior year period included a new term loan of $11.1 million for our new headquarters in our Healthcare division.
Borrowings
Outstanding lines of credit and current and long‑term debt totaled $11.4 million at June 30, 2015, a decrease of $25.9 million from $37.3 million at June 30, 2014. See Note 6 to the Consolidated Financial Statements for further discussion.
58
The following is a summary of our contractual obligations and commitments at June 30, 2015 (in thousands):
|
|
|
|
|
|
|
|
|
|
|
|
|
|
|
|
|
|
|
|
|
Payments Due by Period |
|
|||||||||||||
|
Contractual |
|
|
|
|
Less than |
|
|
|
|
|
|
|
After |
|
||
|
Obligations |
|
Total |
|
1 year |
|
2‑3 years |
|
4‑5 years |
|
5 years |
|
|||||
|
Total debt |
|
$ |
11,357 |
|
$ |
2,801 |
|
$ |
4,956 |
|
$ |
2,623 |
|
$ |
977 |
|
|
Operating leases |
|
$ |
18,422 |
|
$ |
7,220 |
|
$ |
7,988 |
|
$ |
1,722 |
|
$ |
1,492 |
|
|
Purchase obligations |
|
$ |
42,796 |
|
$ |
42,418 |
|
$ |
374 |
|
$ |
4 |
|
$ |
— |
|
|
Defined benefit plan obligation |
|
$ |
9,435 |
|
$ |
153 |
|
$ |
412 |
|
$ |
2,086 |
|
$ |
6,784 |
|
|
Total contractual obligations |
|
$ |
82,010 |
|
$ |
52,592 |
|
$ |
13,730 |
|
$ |
6,435 |
|
$ |
9,253 |
|
|
Other Commercial Commitments—letters of credit |
|
$ |
52,386 |
|
$ |
25,498 |
|
$ |
22,705 |
|
$ |
1,497 |
|
$ |
2,686 |
|
We anticipate that cash generated from our operations, in addition to existing cash borrowing arrangements and future access to capital markets should be sufficient to meet our cash requirements for the foreseeable future. However, our future capital requirements will depend on many factors, including future business acquisitions, capital expenditures, litigation, stock repurchases and levels of research and development spending, among other factors. The adequacy of available funds will depend on many factors, including the success of our businesses in generating cash, continued compliance with financial covenants contained in our credit facility and the health of capital markets in general, among other factors.
Cash Held by Foreign Subsidiaries
Our cash, cash equivalents, and investments totaled $47.6 million at June 30, 2015. Of this amount, approximately 63% was held by our foreign subsidiaries and subject to repatriation tax considerations. These foreign funds were located primarily in Malaysia and the United Kingdom, and to a lesser extent in India, Singapore, Germany, China and Mexico amongst others. We intend to permanently reinvest a significant portion of our earnings from foreign operations, and we currently do not anticipate that we will need this cash in foreign countries to fund our U.S. operations. In the event that funds from foreign operations are needed to fund operations in the United States and if U.S. taxes have not been previously provided on the related earnings, we would provide for and pay additional U.S. taxes at the time we change our intention with regard to the reinvestment of those earnings.
Stock Repurchase Program
Our Board of Directors authorized a stock repurchase program under which we may repurchase up to 4,000,000 shares of our Common Stock. During fiscal 2015, we repurchased 454,635 shares under this program. As of June 30, 2015, 764,560 shares were available for additional repurchase under the program. Upon repurchase, the shares are restored to the status of authorized but unissued shares and we record them as a reduction in the number of shares of Common Stock issued and outstanding in our Consolidated Financial Statements.
Off Balance Sheet Arrangements
As of June 30, 2015, we had no off balance sheet arrangements, as defined in Item 303(a)(4) of Regulation S‑K, other than those previously disclosed.
New Accounting Pronouncements
For information with respect to new accounting pronouncements and the impact of these pronouncements on our Consolidated Financial Statements, see Note 1 to the Consolidated Financial Statements.
Related‑Party Transactions
In 1994, we, together with an unrelated company, formed ECIL‑Rapiscan Security Products Limited, a joint venture organized under the laws of India. We own a 36% interest in the joint venture, our Chairman and Chief Executive
59
Officer owns a 10.5% interest, and our Executive Vice President and Director owns a 4.5% ownership interest. Our initial investment was $0.1 million. For the years ended June 30, 2013 and 2015, the Company’s equity earnings in the joint venture were approximately $0.1 million and $0.1 million, respectively. There was no equity earnings in the joint venture recognized for the year ended June 30, 2014. We, our Chairman and Chief Executive Officer and our Executive Vice President and Director collectively control less than 50% of the board of directors voting power in the joint venture. As a result, we account for the investment under the equity method of accounting. The joint venture was formed for the purpose of the manufacture, assembly, service and testing of security and inspection systems and other products. Some of our subsidiaries are suppliers to the joint venture, which in turn manufactures and sells the resulting products. Sales to the joint venture for fiscal 2013, 2014 and 2015 were approximately $5.7 million, $5.2 million and $7.3 million, respectively. Receivables from the joint venture were $0.6 million and $2.7 million as of June 30, 2014 and 2015, respectively.
We have contracted with entities owned by our Chief Executive Officer and/or his family members to provide messenger service, auto rental and printing services. Such expenses for fiscal 2013 and 2014 were approximately $76,000 and $31,000, respectively; while there were no expenses during fiscal 2015.
UNAUDITED QUARTERLY RESULTS
The following tables present unaudited quarterly financial information for the four quarters ended June 30, 2014 and 2015 (in thousands, except per share data):
|
|
|
|
|
|
|
|
|
|
|
|
|
|
|
|
|
|
Quarter Ended |
|
||||||||||
|
|
|
September 30, |
|
December 31, |
|
March 31, |
|
June 30, |
|
||||
|
|
|
2013 |
|
2013 |
|
2014 |
|
2014 |
|
||||
|
|
|
(Unaudited) |
|
||||||||||
|
Revenues |
|
$ |
206,274 |
|
$ |
236,408 |
|
$ |
203,956 |
|
$ |
260,104 |
|
|
Costs of goods sold |
|
|
138,328 |
|
|
155,469 |
|
|
133,449 |
|
|
174,496 |
|
|
Gross profit |
|
|
67,946 |
|
|
80,939 |
|
|
70,507 |
|
|
85,608 |
|
|
Operating expenses: |
|
|
|
|
|
|
|
|
|
|
|
|
|
|
Selling, general and administrative |
|
|
42,214 |
|
|
45,556 |
|
|
39,399 |
|
|
39,700 |
|
|
Research and development |
|
|
11,020 |
|
|
11,175 |
|
|
10,579 |
|
|
12,018 |
|
|
Impairment, restructuring and other charges |
|
|
4,239 |
|
|
2,179 |
|
|
2,507 |
|
|
3,119 |
|
|
Total operating expenses |
|
|
57,473 |
|
|
58,910 |
|
|
52,485 |
|
|
54,837 |
|
|
Income from operations |
|
|
10,473 |
|
|
22,029 |
|
|
18,022 |
|
|
30,771 |
|
|
Interest and other expense, net |
|
|
(1,470) |
|
|
(1,503) |
|
|
(1,370) |
|
|
(1,097) |
|
|
Income before provision for income taxes |
|
|
9,003 |
|
|
20,526 |
|
|
16,652 |
|
|
29,674 |
|
|
Provision for income taxes |
|
|
2,609 |
|
|
5,953 |
|
|
11,851 |
|
|
7,548 |
|
|
Net income |
|
$ |
6,394 |
|
$ |
14,573 |
|
$ |
4,801 |
|
$ |
22,126 |
|
|
Basic earnings per common share |
|
$ |
0.32 |
|
$ |
0.73 |
|
$ |
0.24 |
|
$ |
1.11 |
|
|
Diluted earnings per common share |
|
$ |
0.31 |
|
$ |
0.71 |
|
$ |
0.23 |
|
$ |
1.07 |
|
60
|
|
|
|
|
|
|
|
|
|
|
|
|
|
|
|
|
|
Quarter Ended |
|
||||||||||
|
|
|
September 30, |
|
December 31, |
|
March 31, |
|
June 30, |
|
||||
|
|
|
2014 |
|
2014 |
|
2015 |
|
2015 |
|
||||
|
|
|
(Unaudited) |
|
||||||||||
|
Revenues |
|
$ |
218,397 |
|
$ |
257,829 |
|
$ |
215,375 |
|
$ |
266,601 |
|
|
Costs of goods sold |
|
|
144,155 |
|
|
168,555 |
|
|
142,771 |
|
|
177,368 |
|
|
Gross profit |
|
|
74,242 |
|
|
89,274 |
|
|
72,604 |
|
|
89,233 |
|
|
Operating expenses: |
|
|
|
|
|
|
|
|
|
|
|
|
|
|
Selling, general and administrative |
|
|
44,182 |
|
|
47,894 |
|
|
37,970 |
|
|
41,710 |
|
|
Research and development |
|
|
12,670 |
|
|
13,240 |
|
|
12,559 |
|
|
13,170 |
|
|
Impairment, restructuring and other charges |
|
|
726 |
|
|
2,079 |
|
|
3,620 |
|
|
3,425 |
|
|
Total operating expenses |
|
|
57,578 |
|
|
63,213 |
|
|
54,149 |
|
|
58,305 |
|
|
Income from operations |
|
|
16,664 |
|
|
26,061 |
|
|
18,455 |
|
|
30,928 |
|
|
Interest and other expense, net |
|
|
(864) |
|
|
(832) |
|
|
(812) |
|
|
(747) |
|
|
Income before provision for income taxes |
|
|
15,800 |
|
|
25,229 |
|
|
17,643 |
|
|
30,181 |
|
|
Provision for income taxes |
|
|
4,551 |
|
|
6,988 |
|
|
4,415 |
|
|
7,748 |
|
|
Net income |
|
$ |
11,249 |
|
$ |
18,241 |
|
$ |
13,228 |
|
$ |
22,433 |
|
|
Basic earnings per common share |
|
$ |
0.32 |
|
$ |
0.92 |
|
$ |
0.67 |
|
$ |
1.13 |
|
|
Diluted earnings per common share |
|
$ |
0.31 |
|
$ |
0.89 |
|
$ |
0.64 |
|
$ |
1.09 |
|
ITEM 7A. QUANTITATIVE AND QUALITATIVE DISCLOSURES ABOUT MARKET RISK
Market Risk
We are exposed to certain market risks, which are inherent in our financial instruments and arise from transactions entered into in the normal course of business. We may enter into derivative financial instrument transactions in order to manage or reduce market risk in connection with specific foreign‑currency‑denominated transactions. We do not enter into derivative financial instrument transactions for speculative purposes.
We are subject to interest rate risk on our borrowings under our bank lines of credit. Consequently, our interest expense would fluctuate with changes in the general level of these interest rates if we were to borrow any amounts under the credit facility.
Foreign Currency
Our international operations are subject to certain opportunities and risks, including foreign currency fluctuations and governmental actions. We closely monitor our operations in each country and seek to adopt appropriate strategies that are responsive to changing economic and political environments, and to fluctuations in foreign currencies. We conduct business in more than 20 countries. Due to our global operations, weaknesses in the currencies of some of these countries are often offset by strengths in others. Foreign currency financial statements are translated into U.S. dollars at period‑end rates, with the exception of revenues, costs and expenses, which are translated at average rates during the reporting period. We include gains and losses resulting from foreign currency transactions in income, while we exclude those resulting from translation of financial statements from income and include them as a component of accumulated other comprehensive income. Transaction gains and losses, which were included in our consolidated statement of operations, amounted to a gain (loss) of approximately $1.8 million, $(1.8) million and $2.1 million for the fiscal years ended June 30, 2013, 2014 and 2015, respectively. Furthermore, a 10% appreciation of the U.S. dollar relative to the local currency exchange rates would have resulted in a net increase in our operating income of approximately $14.0 million in fiscal 2015. Conversely, a 10% depreciation of the U.S. dollar relative to the local currency exchange rates would have resulted in a net decrease in our operating income of approximately $14.0 million in fiscal 2015.
61
Use of Derivatives
Our use of derivatives consists primarily of an interest swap agreement. As discussed in Note 1 to the Consolidated Financial Statements, we had an interest rate swap of $6.8 million outstanding as of June 30, 2015.
Importance of International Markets
International markets provide us with significant growth opportunities. However, the following events, among others, could adversely affect our financial results in subsequent periods: periodic economic downturns in different regions of the world, changes in trade policies or tariffs, civil or military conflict and other political instability. We continue to perform ongoing credit evaluations of our customers’ financial condition. We monitor economic and currency conditions around the world to evaluate whether there may be any significant effect on our international sales in the future. Due to our overseas investments and the necessity of dealing with local currencies in our foreign business transactions, we are at risk with respect to foreign currency fluctuations.
Inflation
We do not believe that inflation has had a material impact on our results of operations.
Interest Rate Risk
The principal maturity and estimated value of our long‑term debt exposure as of June 30, 2015 are as follows (in thousands):
|
|
|
|
|
|
|
|
|
|
|
|
|
|
|
|
|
|
|
|
|
|
|
|
|
|
|
|
|
|
Maturity |
|
|
|
|
|
|
|
||||||||||||||||
|
|
|
|
|
|
|
|
|
|
|
|
|
|
|
|
|
|
2021 and |
|
|
|
|
Fair |
|
||
|
|
|
2016 |
|
2017 |
|
2018 |
|
2019 |
|
2020 |
|
thereafter |
|
Total |
|
Value |
|
||||||||
|
Secured long term loans |
|
$ |
2,801 |
|
$ |
2,707 |
|
$ |
2,249 |
|
$ |
1,877 |
|
$ |
746 |
|
$ |
977 |
|
$ |
11,357 |
|
$ |
11,357 |
|
|
Average interest rate |
|
|
2.1 |
% |
|
2.1 |
% |
|
2.1 |
% |
|
2.0 |
% |
|
1.9 |
% |
|
1.9 |
% |
|
2.1 |
% |
|
|
|
ITEM 8. FINANCIAL STATEMENTS AND SUPPLEMENTARY DATA
We make reference here to the Index to Consolidated Financial Statements that appears on page F‑1 of this report. The Report of Independent Registered Public Accounting Firm from Moss Adams LLP, the Consolidated Financial Statements, the Notes to Consolidated Financial Statements and Schedule II—Valuation and Qualifying Accounts listed in the Index to Consolidated Financial Statements, which appear beginning on page F‑2 of this report, are incorporated by reference into this Item 8.
ITEM 9. CHANGES IN AND DISAGREEMENTS WITH ACCOUNTANTS ON ACCOUNTING AND FINANCIAL DISCLOSURE
None.
ITEM 9A. CONTROLS AND PROCEDURES
Evaluation of Disclosure Controls and Procedures
As of June 30, 2015, the end of the period covered by this report, our management, including our Chief Executive Officer and our Chief Financial Officer, reviewed and evaluated the effectiveness of our disclosure controls and procedures (as defined in Rule 13a‑15(e) or 15d‑15(e) of the Exchange Act). Based upon such review and evaluation, our Chief Executive Officer and Chief Financial Officer have concluded that, as of the end of the period covered by this Annual Report on Form 10-K, our disclosure controls and procedures were effective to provide reasonable assurance that information required to be disclosed in our Exchange Act reports is recorded, processed, summarized and reported within
62
the time periods specified by the Securities and Exchange Commission and is accumulated and communicated to management, including the Chief Executive Officer and Chief Financial Officer, as appropriate, to allow timely decisions regarding required disclosure.
Management’s Report on Internal Control over Financial Reporting
Our management is responsible for establishing and maintaining adequate internal control over financial reporting (as such term is defined in Rule 13a‑ 15(f) or 15d‑15(f) of the Exchange Act) for the Company. Under the supervision and with the participation of management, including our Chief Executive Officer and Chief Financial Officer, we conducted an evaluation of the effectiveness of our internal control over financial reporting based on the framework and criteria established in Internal Control—Integrated Framework issued by the Committee of Sponsoring Organizations of the Treadway Commission (COSO) in 2013. Based on that evaluation, management concluded that our internal control over financial reporting was effective as of June 30, 2015.
Moss Adams LLP, an independent registered public accounting firm, has audited and reported on the consolidated financial statements of OSI Systems, Inc. and on the effectiveness of our internal control over financial reporting. The report of Moss Adams LLP is contained in this annual report.
Changes in Internal Control over Financial Reporting
There were no changes in our internal control over financial reporting during the fourth quarter of fiscal 2015 that have materially affected, or are reasonably likely to materially affect, our internal control over financial reporting.
Limitations on Effectiveness of Controls and Procedures
In designing and evaluating our controls and procedures, management recognizes that any controls and procedures, no matter how well designed and operated, can provide only reasonable assurance of achieving the desired control objectives, and management is required to apply its judgment in evaluating the cost-benefit relationship of possible controls and procedures. Because of the inherent limitations in all control systems, no evaluation of controls can provide absolute assurance that all control issues and instances of fraud, if any, within the Company have been detected.
None.
63
ITEM 10. DIRECTORS, EXECUTIVE OFFICERS AND CORPORATE GOVERNANCE
The information required by Item 10 is incorporated by reference from our definitive proxy statement for our annual stockholders’ meeting, presently scheduled to be held in December 2015.
ITEM 11. EXECUTIVE COMPENSATION
The information required by Item 11 is incorporated by reference from our definitive proxy statement for our annual stockholders’ meeting, presently scheduled to be held in December 2015.
ITEM 12. SECURITY OWNERSHIP OF CERTAIN BENEFICIAL OWNERS AND MANAGEMENT AND RELATED STOCKHOLDER MATTERS
The information required by Item 12 is incorporated by reference from our definitive proxy statement for our annual stockholders’ meeting, presently scheduled to be held in December 2015.
ITEM 13. CERTAIN RELATIONSHIPS AND RELATED TRANSACTIONS, AND DIRECTOR INDEPENDENCE
The information required by Item 13 is incorporated by reference from our definitive proxy statement for our annual stockholders’ meeting, presently scheduled to be held in December 2015.
ITEM 14. PRINCIPAL ACCOUNTING FEES AND SERVICES
The information required by Item 14 is incorporated by reference from our definitive proxy statement for our annual stockholders’ meeting, presently scheduled to be held in December 2015.
64
ITEM 15. EXHIBITS, FINANCIAL STATEMENT SCHEDULES
(a)The following documents are filed as part of this report:
1. Financial Statements. Please see the accompanying Index to Consolidated Financial Statements, which appears on page F‑1 of the report. The Report of Independent Registered Public Accounting Firm, the Consolidated Financial Statements and the Notes to Consolidated Financial Statements listed in the Index to Consolidated Financial Statements, which appear beginning on page F‑2 of this report, are incorporated by reference into Item 8 above.
2. Financial Statement Schedules.
Schedule II—Valuation and Qualifying Accounts
No other financial statement schedules are presented as the required information is either not applicable or included in the Consolidated Financial Statements or Notes thereto.
3. Exhibits. Reference is made to item 15(b) below.
(b) Exhibits. The exhibits listed on the accompanying Exhibit Index immediately following the signature page are filed as part of, or are incorporated by reference into, this report.
(c) Financial Statement Schedules. Reference is made to Item 15(a)(2) above.
65
OSI SYSTEMS, INC.
INDEX TO CONSOLIDATED FINANCIAL STATEMENTS
|
|
Page |
|
Report of Independent Registered Public Accounting Firm—Moss Adams LLP |
F‑2 |
|
F‑3 |
|
|
F‑4 |
|
|
F‑5 |
|
|
F‑6 |
|
|
F‑7 |
|
|
F‑8 |
|
|
F‑35 |
F-1
REPORT OF INDEPENDENT REGISTERED PUBLIC ACCOUNTING FIRM
To the Board of Directors and Stockholders of OSI Systems, Inc.:
We have audited the accompanying consolidated balance sheets of OSI Systems, Inc. and Subsidiaries (the “Company”) as of June 30, 2014 and 2015, and the related consolidated statements of operations, comprehensive income, stockholders’ equity and cash flows for each of the three years in the period ended June 30, 2015. In connection with our audits of the consolidated financial statements, we have also audited the consolidated financial statement schedule of valuation and qualifying accounts for each of the years in the three-year period ended June 30, 2015. We also have audited the Company’s internal control over financial reporting as of June 30, 2015, based on the 2013 criteria established in Internal Control — Integrated Framework issued by the Committee of Sponsoring Organizations of the Treadway Commission. The Company’s management is responsible for these consolidated financial statements and financial statement schedule, for maintaining effective internal control over financial reporting, and for its assessment of the effectiveness of internal control over financial reporting, included in the accompanying Management’s Report on Internal Control Over Financial Reporting appearing under Item 9A. Our responsibility is to express an opinion on these consolidated financial statements and financial statement schedule and an opinion on the Company’s internal control over financial reporting based on our audits.
We conducted our audits in accordance with the standards of the Public Company Accounting Oversight Board (United States). Those standards require that we plan and perform the audits to obtain reasonable assurance about whether the consolidated financial statements are free of material misstatement and whether effective internal control over financial reporting was maintained in all material respects. Our audits of the consolidated financial statements included examining, on a test basis, evidence supporting the amounts and disclosures in the consolidated financial statements, assessing the accounting principles used and significant estimates made by management, and evaluating the overall consolidated financial statement presentation. Our audit of internal control over financial reporting included obtaining an understanding of internal control over financial reporting, assessing the risk that a material weakness exists, and testing and evaluating the design and operating effectiveness of internal control based on the assessed risk. Our audits also include performing such other procedures as we considered necessary in the circumstances. We believe that our audits provide a reasonable basis for our opinions.
A company’s internal control over financial reporting is a process designed to provide reasonable assurance regarding the reliability of financial reporting and the preparation of financial statements for external purposes in accordance with generally accepted accounting principles. A company’s internal control over financial reporting includes those policies and procedures that (1) pertain to the maintenance of records that, in reasonable detail, accurately and fairly reflect the transactions and dispositions of the assets of the company; (2) provide reasonable assurance that transactions are recorded as necessary to permit preparation of financial statements in accordance with generally accepted accounting principles, and that receipts and expenditures of the company are being made only in accordance with authorizations of management and directors of the company; and (3) provide reasonable assurance regarding prevention or timely detection of unauthorized acquisition, use, or disposition of the company’s assets that could have a material effect on the consolidated financial statements.
Because of its inherent limitations, internal control over financial reporting may not prevent or detect misstatements. Also, projections of any evaluation of effectiveness to future periods are subject to the risk that controls may become inadequate because of changes in conditions, or that the degree of compliance with the policies or procedures may deteriorate.
In our opinion, the consolidated financial statements referred to above present fairly, in all material respects, the consolidated financial position of OSI Systems, Inc. and Subsidiaries as of June 30, 2014 and 2015, and the consolidated results of their operations, their comprehensive income and their cash flows for each of the three years in the period ended June 30, 2015, in conformity with accounting principles generally accepted in the United States of America. Also, in our opinion, the related consolidated financial statement schedule, when considered in relation to the basic consolidated financial statements taken as a whole, presents fairly, in all material respects, the information set forth therein. Also in our opinion, OSI Systems, Inc. and Subsidiaries, maintained, in all material respects, effective internal control over financial reporting as of June 30, 2015, based on the 2013 criteria established in Internal Control — Integrated Framework issued by the Committee of Sponsoring Organizations of the Treadway Commission.
/s/ MOSS ADAMS LLP
Los Angeles, California
August 24, 2015
F-2
OSI SYSTEMS, INC. AND SUBSIDIARIES
(in thousands, except share data)
|
|
|
|
|
|
|
|
|
|
|
|
June 30, |
|
||||
|
|
|
2014 |
|
2015 |
|
||
|
ASSETS |
|
|
|
|
|
|
|
|
CURRENT ASSETS: |
|
|
|
|
|
|
|
|
Cash and cash equivalents |
|
$ |
38,831 |
|
$ |
47,593 |
|
|
Accounts receivable, net |
|
|
185,773 |
|
|
178,519 |
|
|
Inventories |
|
|
234,138 |
|
|
230,421 |
|
|
Deferred taxes |
|
|
60,401 |
|
|
44,887 |
|
|
Prepaid expenses and other current assets |
|
|
46,978 |
|
|
40,101 |
|
|
Total current assets |
|
|
566,121 |
|
|
541,521 |
|
|
Property and equipment, net |
|
|
260,479 |
|
|
225,703 |
|
|
Goodwill |
|
|
92,607 |
|
|
98,167 |
|
|
Intangible assets, net |
|
|
43,615 |
|
|
50,413 |
|
|
Other assets |
|
|
48,255 |
|
|
63,870 |
|
|
Total assets |
|
$ |
1,011,077 |
|
$ |
979,674 |
|
|
LIABILITIES AND STOCKHOLDERS’ EQUITY |
|
|
|
|
|
|
|
|
CURRENT LIABILITIES: |
|
|
|
|
|
|
|
|
Bank lines of credit |
|
$ |
24,000 |
|
$ |
— |
|
|
Current portion of long-term debt |
|
|
2,819 |
|
|
2,801 |
|
|
Accounts payable |
|
|
74,460 |
|
|
61,932 |
|
|
Accrued payroll and related expenses |
|
|
32,997 |
|
|
33,169 |
|
|
Advances from customers |
|
|
38,493 |
|
|
41,389 |
|
|
Deferred revenue |
|
|
60,677 |
|
|
47,787 |
|
|
Income taxes payable |
|
|
20,556 |
|
|
9,610 |
|
|
Other accrued expenses and current liabilities |
|
|
48,605 |
|
|
52,593 |
|
|
Total current liabilities |
|
|
302,607 |
|
|
249,281 |
|
|
Long-term debt |
|
|
10,436 |
|
|
8,556 |
|
|
Advances from customers |
|
|
50,000 |
|
|
25,000 |
|
|
Deferred income taxes |
|
|
73,161 |
|
|
65,435 |
|
|
Other long-term liabilities |
|
|
42,660 |
|
|
49,623 |
|
|
Total liabilities |
|
|
478,864 |
|
|
397,895 |
|
|
Commitments and contingencies (Note 9) |
|
|
|
|
|
|
|
|
Stockholders’ Equity: |
|||||||
|
Preferred stock, $0.001 par value—authorized, 10,000,000 shares; no shares issued or outstanding |
|
|
— |
|
|
— |
|
|
Common stock, $0.001 par value—authorized, 100,000,000 shares; issued and outstanding, 19,942,923 and 19,716,507 shares at June 30, 2014 and 2015, respectively |
|
|
287,434 |
|
|
279,212 |
|
|
Retained earnings |
|
|
247,680 |
|
|
312,831 |
|
|
Accumulated other comprehensive loss |
|
|
(2,901) |
|
|
(10,264) |
|
|
Total stockholders’ equity |
|
|
532,213 |
|
|
581,779 |
|
|
Total liabilities and stockholders’ equity |
|
$ |
1,011,077 |
|
$ |
979,674 |
|
See accompanying notes to Consolidated Financial Statements.
F-3
OSI SYSTEMS, INC. AND SUBSIDIARIES
CONSOLIDATED STATEMENTS OF OPERATIONS
(in thousands, except per share data)
|
|
|
|
|
|
|
|
|
|
|
|
|
|
|
Year Ended June 30, |
|
|||||||
|
|
|
2013 |
|
2014 |
|
2015 |
|
|||
|
Net revenues: |
|
|
|
|
|
|
|
|
|
|
|
Products |
|
$ |
600,279 |
|
$ |
654,040 |
|
$ |
707,700 |
|
|
Services |
|
|
201,768 |
|
|
252,702 |
|
|
250,502 |
|
|
Total net revenues |
|
|
802,047 |
|
|
906,742 |
|
|
958,202 |
|
|
Cost of goods sold: |
|
|
|
|
|
|
|
|
|
|
|
Products |
|
|
397,061 |
|
|
453,709 |
|
|
482,401 |
|
|
Services |
|
|
114,560 |
|
|
148,033 |
|
|
150,448 |
|
|
Total cost of goods sold |
|
|
511,621 |
|
|
601,742 |
|
|
632,849 |
|
|
Gross profit |
|
|
290,426 |
|
|
305,000 |
|
|
325,353 |
|
|
Operating expenses: |
|
|
|
|
|
|
|
|
|
|
|
Selling, general and administrative |
|
|
159,761 |
|
|
166,869 |
|
|
171,756 |
|
|
Research and development |
|
|
48,240 |
|
|
44,792 |
|
|
51,639 |
|
|
Impairment, restructuring and other charges |
|
|
7,987 |
|
|
12,044 |
|
|
9,850 |
|
|
Total operating expenses |
|
|
215,988 |
|
|
223,705 |
|
|
233,245 |
|
|
Income from operations |
|
|
74,438 |
|
|
81,295 |
|
|
92,108 |
|
|
Interest and other expense, net |
|
|
(5,024) |
|
|
(5,440) |
|
|
(3,255) |
|
|
Income before income taxes |
|
|
69,414 |
|
|
75,855 |
|
|
88,853 |
|
|
Provision for income taxes |
|
|
25,279 |
|
|
27,961 |
|
|
23,702 |
|
|
Net income |
|
$ |
44,135 |
|
$ |
47,894 |
|
$ |
65,151 |
|
|
Earnings per share: |
|
|
|
|
|
|
|
|
|
|
|
Basic |
|
$ |
2.21 |
|
$ |
2.40 |
|
$ |
3.29 |
|
|
Diluted |
|
$ |
2.15 |
|
$ |
2.33 |
|
$ |
3.17 |
|
|
Shares used in per share calculation: |
|
|
|
|
|
|
|
|
|
|
|
Basic |
|
|
19,956 |
|
|
19,952 |
|
|
19,799 |
|
|
Diluted |
|
|
20,568 |
|
|
20,587 |
|
|
20,526 |
|
See accompanying notes to Consolidated Financial Statements.
F-4
OSI SYSTEMS, INC. AND SUBSIDIARIES
CONSOLIDATED STATEMENTS OF COMPREHENSIVE INCOME
(in thousands)
|
|
|
|
|
|
|
|
|
|
|
|
|
|
|
|
|
|
|
|
|
|
|
|
|
|
|
2013 |
|
2014 |
|
2015 |
|
|||
|
Net income |
|
$ |
44,135 |
|
$ |
47,894 |
|
$ |
65,151 |
|
|
Other comprehensive income (loss): |
|
|
|
|
|
|
|
|
|
|
|
Foreign currency translation adjustment |
|
|
(2,359) |
|
|
2,795 |
|
|
(7,436) |
|
|
Defined benefit pension plans |
|
|
194 |
|
|
606 |
|
|
157 |
|
|
Net unrealized gain (loss) on investments and derivatives |
|
|
117 |
|
|
34 |
|
|
(84) |
|
|
Other comprehensive income (loss) |
|
$ |
(2,048) |
|
$ |
3,435 |
|
$ |
(7,363) |
|
|
Comprehensive income |
|
$ |
42,087 |
|
$ |
51,329 |
|
$ |
57,788 |
|
See accompanying notes to Consolidated Financial Statements.
F-5
OSI SYSTEMS, INC. AND SUBSIDIARIES
CONSOLIDATED STATEMENTS OF STOCKHOLDERS’ EQUITY
(in thousands, except share data)
|
|
|
|
|
|
|
|
|
|
|
|
|
|
|
|
|
|
|
|
|
|
|
|
|
|
|
|
Accumulated |
|
|
|
|
|
|
|
|
Common |
|
Other |
|
|
|
|
|||||||
|
|
|
Number of |
|
|
|
|
Retained |
|
Comprehensive |
|
|
|
|
||
|
|
|
Shares |
|
Amount |
|
Earnings |
|
Income (Loss) |
|
Total |
|
||||
|
Balance--June 30, 2012 |
|
19,821,064 |
|
$ |
282,756 |
|
$ |
155,651 |
|
$ |
(4,288) |
|
$ |
434,119 |
|
|
Exercise of stock options |
|
117,705 |
|
|
1,835 |
|
|
— |
|
|
— |
|
|
1,835 |
|
|
Vesting of restricted shares |
|
236,070 |
|
|
— |
|
|
— |
|
|
— |
|
|
— |
|
|
Net tax benefit of stock options exercised/forfeited |
|
— |
|
|
3,566 |
|
|
— |
|
|
— |
|
|
3,566 |
|
|
Shares issued under employee stock purchase program |
|
85,056 |
|
|
2,840 |
|
|
— |
|
|
— |
|
|
2,840 |
|
|
Stock compensation expense |
|
— |
|
|
16,446 |
|
|
— |
|
|
— |
|
|
16,446 |
|
|
Repurchase of common stock |
|
(200,732) |
|
|
(12,012) |
|
|
— |
|
|
— |
|
|
(12,012) |
|
|
Taxes paid related to net share settlement of equity awards |
|
(145,074) |
|
|
(10,430) |
|
|
— |
|
|
— |
|
|
(10,430) |
|
|
Net income |
|
— |
|
|
— |
|
|
44,135 |
|
|
— |
|
|
44,135 |
|
|
Other comprehensive loss |
|
— |
|
|
— |
|
|
— |
|
|
(2,048) |
|
|
(2,048) |
|
|
Balance--June 30, 2013 |
|
19,914,089 |
|
$ |
285,001 |
|
$ |
199,786 |
|
$ |
(6,336) |
|
$ |
478,451 |
|
|
Exercise of stock options |
|
1,169 |
|
|
47 |
|
|
— |
|
|
— |
|
|
47 |
|
|
Vesting of restricted shares |
|
283,091 |
|
|
— |
|
|
— |
|
|
— |
|
|
— |
|
|
Net tax benefit of stock options exercised/forfeited |
|
— |
|
|
4,573 |
|
|
— |
|
|
— |
|
|
4,573 |
|
|
Shares issued under employee stock purchase program |
|
29,185 |
|
|
1,455 |
|
|
— |
|
|
— |
|
|
1,455 |
|
|
Stock compensation expense |
|
— |
|
|
16,983 |
|
|
— |
|
|
— |
|
|
16,983 |
|
|
Repurchase of common stock |
|
(165,845) |
|
|
(12,056) |
|
|
— |
|
|
— |
|
|
(12,056) |
|
|
Taxes paid related to net share settlement of equity awards |
|
(118,766) |
|
|
(8,569) |
|
|
— |
|
|
— |
|
|
(8,569) |
|
|
Net income |
|
— |
|
|
— |
|
|
47,894 |
|
|
— |
|
|
47,894 |
|
|
Other comprehensive income |
|
— |
|
|
— |
|
|
— |
|
|
3,435 |
|
|
3,435 |
|
|
Balance--June 30, 2014 |
|
19,942,923 |
|
$ |
287,434 |
|
$ |
247,680 |
|
$ |
(2,901) |
|
$ |
532,213 |
|
|
Exercise of stock options |
|
38,907 |
|
|
1,603 |
|
|
— |
|
|
— |
|
|
1,603 |
|
|
Vesting of restricted shares |
|
262,221 |
|
|
— |
|
|
— |
|
|
— |
|
|
— |
|
|
Net tax benefit of stock options exercised/forfeited |
|
— |
|
|
3,617 |
|
|
— |
|
|
— |
|
|
3,617 |
|
|
Shares issued under employee stock purchase program |
|
37,334 |
|
|
1,995 |
|
|
— |
|
|
— |
|
|
1,995 |
|
|
Stock compensation expense |
|
— |
|
|
22,501 |
|
|
— |
|
|
— |
|
|
22,501 |
|
|
Repurchase of common stock |
|
(454,635) |
|
|
(30,744) |
|
|
— |
|
|
— |
|
|
(30,744) |
|
|
Taxes paid related to net share settlement of equity awards |
|
(110,243) |
|
|
(7,194) |
|
|
— |
|
|
— |
|
|
(7,194) |
|
|
Net income |
|
— |
|
|
— |
|
|
65,151 |
|
|
— |
|
|
65,151 |
|
|
Other comprehensive loss |
|
— |
|
|
— |
|
|
— |
|
|
(7,363) |
|
|
(7,363) |
|
|
Balance--June 30, 2015 |
|
19,716,507 |
|
$ |
279,212 |
|
$ |
312,831 |
|
$ |
(10,264) |
|
$ |
581,779 |
|
See accompanying notes to Consolidated Financial Statements.
F-6
OSI SYSTEMS, INC. AND SUBSIDIARIES
CONSOLIDATED STATEMENTS OF CASH FLOWS
(in thousands)
|
|
|
Year Ended June 30, |
|
|||||||
|
|
|
2013 |
|
2014 |
|
2015 |
|
|||
|
CASH FLOWS FROM OPERATING ACTIVITIES |
|
|
|
|
|
|
|
|
|
|
|
Net income |
|
$ |
44,135 |
|
$ |
47,894 |
|
$ |
65,151 |
|
|
Adjustments to reconcile net income to net cash provided by operating activities, net of effects from acquisitions: |
|
|
|
|
|
|
|
|
|
|
|
Depreciation and amortization |
|
|
27,507 |
|
|
54,239 |
|
|
58,976 |
|
|
Stock based compensation expense |
|
|
16,446 |
|
|
16,983 |
|
|
22,501 |
|
|
Provision for losses on accounts receivable |
|
|
3,563 |
|
|
229 |
|
|
340 |
|
|
Tax benefit of share based compensation plan |
|
|
3,566 |
|
|
4,573 |
|
|
3,617 |
|
|
Deferred income taxes |
|
|
3,604 |
|
|
7,936 |
|
|
(5,956) |
|
|
Other |
|
|
299 |
|
|
121 |
|
|
276 |
|
|
Changes in operating assets and liabilities—net of business acquisitions: |
|
|
|
|
|
|
|
|
|
|
|
Accounts receivable |
|
|
(53,568) |
|
|
26,180 |
|
|
7,358 |
|
|
Inventories |
|
|
(12,894) |
|
|
(21,026) |
|
|
249 |
|
|
Prepaid expenses and other assets |
|
|
20,547 |
|
|
4,485 |
|
|
(8,135) |
|
|
Accounts payable |
|
|
40,476 |
|
|
(26,143) |
|
|
(15,117) |
|
|
Advances from customers |
|
|
(10,736) |
|
|
(23,944) |
|
|
(22,051) |
|
|
Deferred revenue |
|
|
(5,563) |
|
|
40,630 |
|
|
(12,128) |
|
|
Other accrued expenses and current liabilities |
|
|
(18,717) |
|
|
(2,987) |
|
|
10,022 |
|
|
Net cash provided by operating activities |
|
|
58,665 |
|
|
129,170 |
|
|
105,103 |
|
|
CASH FLOWS FROM INVESTING ACTIVITIES |
|
|
|
|
|
|
|
|
|
|
|
Acquisition of property and equipment |
|
|
(157,367) |
|
|
(54,598) |
|
|
(15,286) |
|
|
Acquisition of businesses, net of cash acquired |
|
|
(6,087) |
|
|
(11,740) |
|
|
(13,919) |
|
|
Acquisition of intangible and other assets |
|
|
(4,399) |
|
|
(5,896) |
|
|
(6,228) |
|
|
Net cash used in investing activities |
|
|
(167,853) |
|
|
(72,234) |
|
|
(35,433) |
|
|
CASH FLOWS FROM FINANCING ACTIVITIES |
|
|
|
|
|
|
|
|
|
|
|
Net borrowings (repayments) on bank lines of credit |
|
|
59,000 |
|
|
(35,000) |
|
|
(24,000) |
|
|
Proceeds from long-term debt |
|
|
11,100 |
|
|
3,497 |
|
|
1,561 |
|
|
Payments on long-term debt |
|
|
(1,274) |
|
|
(3,667) |
|
|
(3,247) |
|
|
Proceeds from exercise of stock options and employee stock purchase plan |
|
|
4,674 |
|
|
1,501 |
|
|
3,598 |
|
|
Repurchase of common shares |
|
|
(12,011) |
|
|
(12,056) |
|
|
(30,744) |
|
|
Taxes paid related to net share settlement of equity awards |
|
|
(10,431) |
|
|
(8,569) |
|
|
(7,194) |
|
|
Net cash provided by (used in) financing activities |
|
|
51,058 |
|
|
(54,294) |
|
|
(60,026) |
|
|
Effect of exchange rate changes on cash |
|
|
1,375 |
|
|
1,492 |
|
|
(882) |
|
|
Net increase (decrease) in cash and cash equivalents |
|
|
(56,755) |
|
|
4,134 |
|
|
8,762 |
|
|
Cash and cash equivalents—beginning of year |
|
|
91,452 |
|
|
34,697 |
|
|
38,831 |
|
|
Cash and cash equivalents—end of year |
|
$ |
34,697 |
|
$ |
38,831 |
|
$ |
47,593 |
|
|
Supplemental disclosure of cash flow information: |
|
|
|
|
|
|
|
|
|
|
|
Interest |
|
$ |
3,480 |
|
$ |
4,659 |
|
$ |
2,802 |
|
|
Income taxes |
|
$ |
12,289 |
|
$ |
18,552 |
|
$ |
31,266 |
|
See accompanying notes to Consolidated Financial Statements.
F-7
1. SUMMARY OF SIGNIFICANT ACCOUNTING POLICIES
Description of Business—OSI Systems, Inc., together with its subsidiaries (the “Company”), is a vertically integrated designer and manufacturer of specialized electronic systems and components for critical applications. The Company sells its products in diversified markets, including homeland security, healthcare, defense and aerospace.
The Company has three reporting segments: (i) Security, providing security inspection systems, turnkey security screening solutions and related services; (ii) Healthcare, providing patient monitoring, diagnostic cardiology, anesthesia systems and defibrillator products, and related services and (iii) Optoelectronics and Manufacturing, providing specialized electronic components and electronic manufacturing services for the Security and Healthcare divisions as well as to external original equipment manufacturing clients for applications in the defense, aerospace, medical and industrial markets, among others.
Through its Security division, the Company provides security screening products and related services globally. These products fall into the following categories: baggage and parcel inspection; cargo and vehicle inspection; hold (checked) baggage screening; people screening; radiation detection; and explosive and narcotics trace detection. In addition to these products, the Company provides site design, installation, training and technical support services to its customers. The Company also provides turnkey security screening solutions, which can include the construction, staffing and long‑term operation of security screening checkpoints for its customers.
Through its Healthcare division, the Company designs, manufactures, markets and services patient monitoring, diagnostic cardiology, anesthesia delivery and ventilation systems, defibrillator products, and related supplies and accessories worldwide. These products are used by care providers in critical care, emergency and perioperative areas within hospitals as well as physicians’ offices, medical clinics and ambulatory surgery centers amongst others.
Through its Optoelectronics and Manufacturing division, the Company designs, manufactures and markets optoelectronic devices and provides electronics manufacturing services worldwide for use in a broad range of applications, including aerospace and defense electronics, security and inspection systems, medical imaging and diagnostic products, telecommunications, computer peripherals, industrial automation systems, automotive diagnostic systems, gaming systems and consumer products. This division provides products and services to original equipment manufacturers and end users as well as to the Company’s own Security and Healthcare divisions.
Consolidation—The Consolidated Financial Statements include the accounts of OSI Systems, Inc. and its wholly‑owned and majority‑owned subsidiaries. All significant intercompany accounts and transactions have been eliminated in consolidation. Investments in joint ventures over which the Company has significant influence but does not have voting control are accounted for using the equity method. Investments over which the Company does not have significant influence are accounted for using the cost method.
Use of Estimates—The preparation of financial statements in conformity with U.S. GAAP requires management to make estimates and assumptions that affect the reported amounts of assets and liabilities and the disclosure of contingent assets and liabilities at the date of the financial statements and the reported amounts of sales and costs of sales during the reporting period. The most significant of these estimates and assumptions for the Company relate to contract revenue, profit and loss recognition, fair values of assets acquired and assumed in business combinations, market values for inventories reported at lower of cost or market, stock-based employee compensation expense, income taxes, accrued product warranty costs, and the recoverability, useful lives and valuation of recorded amounts of long-lived assets, identifiable intangible assets and goodwill. Changes in estimates are reflected in the periods during which they become known. Actual amounts will differ from these estimates and could differ materially.
F-8
OSI SYSTEMS, INC. AND SUBSIDIARIES
NOTES TO CONSOLIDATED FINANCIAL STATEMENTS—(Continued)
Reclassifications—Certain reclassifications have been made to prior year amounts within the consolidated balance sheet and consolidated statement of cash flows to conform to the current year’s presentation.
Cash Equivalents—The Company considers all highly liquid investments purchased with maturities of approximately three months or less as of the acquisition date to be cash equivalents.
Accounts Receivable—Billed receivables include outstanding trade receivables. Unbilled receivables primarily include earned but unbilled revenue. Allowance for doubtful accounts involves estimates based on management’s judgment, review of individual receivables and analysis of historical bad debts. The Company monitors collections and payments from its customers and maintains allowances for doubtful accounts for estimated losses resulting from the inability of its customers to make required payments.
Components of accounts receivable consisted of:
|
|
|
|
|
|
|
|
|
|
|
|
June 30, |
|
||||
|
|
|
2014 |
|
2015 |
|
||
|
Billed receivables |
|
$ |
189,489 |
|
$ |
181,805 |
|
|
Unbilled receivables |
|
|
1,975 |
|
|
2,614 |
|
|
Less allowance for doubtful accounts |
|
|
(5,691) |
|
|
(5,900) |
|
|
Total |
|
$ |
185,773 |
|
$ |
178,519 |
|
Inventories—Inventories are generally stated at the lower of cost (first‑in, first‑out) or market. The Company writes down inventory for slow‑moving and obsolete inventory based on assessments of future demands, market conditions and customers who may be experiencing financial difficulties. If these factors are less favorable than those projected, additional inventory write‑downs may be required.
Property and Equipment—Property and equipment are stated at cost less accumulated depreciation and amortization. Depreciation and amortization are charged while assets are used in service and are computed using the straight‑line method over the estimated useful lives of the assets taking into consideration any salvage value. Amortization of leasehold improvements is calculated on the straight‑line basis over the shorter of the useful life of the asset or the lease term. Leased capital assets are included in property and equipment. Amortization of property and equipment under capital leases is included with depreciation expense. In the event that property and equipment for turnkey screening operations are idle as a result of the early termination, non‑renewal or reduction in scope of the related project, such assets are assessed for impairment on a periodic basis.
Goodwill and Other Intangible Assets and Valuation of Long‑Lived Assets—Goodwill represents the excess purchase price of net tangible and intangible assets acquired in business combinations over their estimated fair value. Goodwill is allocated to the Company’s segments based on the nature of the product line of the acquired business. The carrying value of goodwill is not amortized, but is annually tested for impairment during the Company’s second quarter and more often if there is an indicator of impairment. Intangible assets other than goodwill are amortized over their useful lives unless these lives are determined to be indefinite. The Company assesses qualitative factors of each of its reporting units to determine whether it is more likely than not that the fair value of a reporting unit is less than its carrying amount, including goodwill. Such assessments indicated that it is not more likely than not that the fair value of each reporting unit is less than its carrying amount, including goodwill. Thus, the Company has determined that it is not necessary to proceed with the two‑step goodwill impairment test. There was no goodwill impairment for each of three fiscal years ended June 30, 2015.
F-9
OSI SYSTEMS, INC. AND SUBSIDIARIES
NOTES TO CONSOLIDATED FINANCIAL STATEMENTS—(Continued)
The Company evaluates long‑lived assets with finite lives for impairment whenever events or changes in circumstances indicate that the carrying amount of the asset may not be recoverable. Impairment is considered to exist if the total estimated future cash flows on an undiscounted basis are less than the carrying amount of the assets. If impairment does exist, the Company measures the impairment loss and records it based on the discounted estimate of future cash flows. In estimating future cash flows, the Company groups assets at the lowest level for which there are identifiable cash flows that are largely independent of the cash flows from other asset groups. The Company’s estimate of future cash flows is based upon, among other things, certain assumptions about expected future operating performance, growth rates and other factors.
The Company assesses qualitative factors that could affect the significant inputs used to determine the fair value of indefinite-lived intangible assets. This assessment is performed annually to determine whether it is more likely than not that an indefinite-lived intangible asset has been impaired. Such assessments indicated that it is not more likely than not that an indefinite-lived intangible asset has been impaired. Thus, the Company has determined that it is not necessary to perform additional quantitative impairment tests. There was no impairment of indefinite-lived intangible assets for each of three fiscal years ended June 30, 2015.
Income Taxes—Deferred income taxes are provided for temporary differences between the financial statement and income tax basis of the Company’s assets and liabilities, based on enacted tax rates. A valuation allowance is provided when it is more likely than not that some portion or all of the deferred income tax assets will not be realized. Income tax accounting standards prescribe a two‑step process for the financial statement measurement and recognition of a tax position taken or expected to be taken in a tax return. The first step involves the determination of whether it is more likely than not (greater than 50 percent likelihood) that a tax position will be sustained upon examination, based on the technical merits of the position. The second step requires that any tax position that meets the more‑likely‑than‑not recognition threshold be measured and recognized in the financial statements at the largest amount of benefit that is greater than 50 percent likely of being realized upon ultimate settlement. The income tax accounting standards also provide guidance on the accounting for related interest and penalties, financial statement classification and disclosure. The cumulative effect of applying these standards is to be reported as an adjustment to the opening balance of retained earnings in the period of adoption. See Note 8 for additional information.
Fair Value of Financial Instruments—The Company’s financial instruments consist primarily of cash, marketable securities, derivative instruments, accounts receivable, accounts payable and debt instruments. The carrying values of financial instruments, other than long‑term debt instruments, are representative of their fair values due to their short‑term maturities. The carrying values of the Company’s long‑term debt instruments are considered to approximate their fair values because the interest rates of these instruments are variable or comparable to current rates offered to the Company.
Fair value is the price that would be received to sell an asset or paid to transfer a liability in an orderly transaction between market participants at the measurement date. “Level 1” category includes assets and liabilities at the quoted prices in active markets for identical assets and liabilities. “Level 2” category includes assets and liabilities from observable inputs other than quoted market prices. “Level 3” category includes assets and liabilities whose valuation techniques are unobservable and significant to the fair value measurement. There were no assets or liabilities where “Level 3” valuation techniques were used, and there were no assets and liabilities measured at fair value on a non‑recurring basis.
F-10
OSI SYSTEMS, INC. AND SUBSIDIARIES
NOTES TO CONSOLIDATED FINANCIAL STATEMENTS—(Continued)
The following is a summary of the investments carried at fair value (in thousands):
|
|
|
|
|
|
|
|
|
June 30, |
|
|
|
|
|
|
|
June 30, |
|
||
|
|
|
Level 1 |
|
Level 2 |
|
2014 |
|
Level 1 |
|
Level 2 |
|
2015 |
|
||||||
|
Equity securities |
|
|
414 |
|
|
4,671 |
|
|
5,085 |
|
|
291 |
|
|
6,024 |
|
|
6,315 |
|
|
Insurance company contracts |
|
|
— |
|
|
17,383 |
|
|
17,383 |
|
|
— |
|
|
20,100 |
|
|
20,100 |
|
|
Bonds |
|
|
— |
|
|
1,695 |
|
|
1,695 |
|
|
— |
|
|
1,972 |
|
|
1,972 |
|
|
Derivative contracts |
|
|
— |
|
|
28 |
|
|
28 |
|
|
— |
|
|
(41) |
|
|
(41) |
|
|
Total |
|
$ |
414 |
|
$ |
23,777 |
|
$ |
24,191 |
|
$ |
291 |
|
$ |
28,055 |
|
$ |
28,346 |
|
Derivative Instruments and Hedging Activity—The Company’s use of derivatives consists of an interest rate swap agreement. The interest rate swap agreement was entered into to improve the predictability of cash flows from interest payments related to variable, LIBOR‑based debt for the duration of the term loan. The interest rate swap matures in October 2019. The interest rate swap is considered an effective cash flow hedge, and, as a result, the net gains or losses on such instrument were reported as a component of Other comprehensive income in the Consolidated Financial Statements and are reclassified as net income when the hedge transaction settles.
Revenue Recognition—The Company recognizes revenue from sales of products upon shipment when title and risk of loss passes, and when terms are fixed and collection is probable. Revenue from services includes after‑market services, installation and implementation of products, and turnkey security screening services. The portion of revenue for the sale attributable to installation is deferred and recognized when the installation service is provided. In an instance where terms of sale include subjective customer acceptance criteria, revenue is deferred until the Company has achieved the acceptance criteria. Concurrent with the shipment of the product, the Company accrues estimated product return reserves and warranty expenses. Critical judgments made by management related to revenue recognition include the determination of whether or not customer acceptance criteria are perfunctory or inconsequential. The determination of whether or not customer acceptance terms are perfunctory or inconsequential impacts the amount and timing of revenue recognized. Critical judgments also include estimates of warranty reserves, which are established based on historical experience and knowledge of the product under warranty.
Revenue from turnkey services agreements is included in revenue from services. In certain agreements, revenue is recognized based upon proportional performance, measured by the actual number of hours incurred divided by the total estimated number of hours for the project. The impact of changes in the estimated hours to service the agreement is reflected in the period during which the change becomes known. Deferred revenue for such agreements arises when payments from customers are received in advance of revenue recognition.
Revenues from out of warranty service maintenance contracts are recognized ratably over the term of such contract. For services not derived from specific maintenance contracts, revenues are recognized as the services are performed. Deferred revenue for such services arises from payments received from customers for services not yet performed. On occasion, the Company receives advances from customers that are amortized against future customer payments pursuant to the underlying agreements. Such advances are classified in the consolidated balance sheets as either a current or long‑term liability dependent upon when the Company estimates the corresponding amortization to occur.
Freight—The Company records shipping and handling fees it charges to its customers as revenue and related costs as cost of goods sold.
Research and Development Costs—Research and development costs are those costs related to the development of a new product, process or service, or significant improvement to an existing product, process or service. Such costs are charged to operations as incurred.
F-11
OSI SYSTEMS, INC. AND SUBSIDIARIES
NOTES TO CONSOLIDATED FINANCIAL STATEMENTS—(Continued)
Stock‑Based Compensation—Stock‑based compensation cost is measured at the grant date based on the estimated fair value of the award and is recognized as expense over the employee’s requisite service period for all stock‑based awards granted or modified. Certain restricted awards vest based on the achievement of pre‑established performance criteria. The fair value of performance‑based awards is estimated at the date of grant based upon the probability that the specified performance criteria will be met, adjusted for estimated forfeitures. Each quarter the Company updates the assessment of the probability that the specified performance criteria will be achieved and adjusts the estimate of the fair value of the performance‑based awards if necessary. The Company amortizes the fair value of performance‑based awards over the requisite service period for each separately vesting tranche of the award. See Note 7 to the Consolidated Financial Statements.
Impairment, Restructuring and Other Charges—The Company consolidates processes and facilities of its subsidiaries to better align with demand by its customers and thereby improve its operational efficiencies. The associated charges, and other non‑recurring charges and impairment of assets, are recognized as impairment, restructuring and other charges in the Consolidated Financial Statements. See Note 5 for additional information about these charges.
Credit Risk and Concentration—Financial instruments that are potentially subject to concentrations of credit risk consist primarily of cash, cash equivalents, marketable securities and accounts receivable. The Company restricts investments in cash equivalents to financial institutions with high credit standing. Credit risk on accounts receivable is minimized as a result of the large and diverse nature of the Company’s worldwide customer base. As of June 30, 2014, one customer accounted for 13% of accounts receivable; while no customer accounted for greater than 10% of accounts receivable as of June 30, 2015. One customer accounted for 14% and 12% of revenues for the fiscal years ended June 30, 2014 and 2015, respectively. There were no customers accounting for more than 10% of revenues during fiscal 2013. The Company performs ongoing credit evaluations of its customers’ financial condition and maintains allowances for potential credit losses.
The Company has a single‑source vendor to supply an integral component in its cargo product lines in the Security division. The Company also relies primarily on a vendor that provides key components to the Optoelectronics and Manufacturing division. While management believes that relying on key vendors improves the efficiency and reliability of business operations, relying on any one vendor for a significant aspect of business can have a significant negative impact on revenue and profitability if that vendor fails to perform at acceptable service levels for any reason, including financial difficulties of the vendor.
Foreign Currency Translation—The Company transacts business in various foreign currencies. In countries where the functional currency of the underlying operations has been determined to be the local country’s currency, revenues and expenses of operations outside the United States are translated into United States dollars using average exchange rates while assets and liabilities of operations outside the United States are translated into United States dollars using period‑end exchange rates. The effects of foreign currency translation adjustments are included in stockholders’ equity as a component of accumulated other comprehensive income in the accompanying consolidated balance sheets. Transaction gains and losses, which were included in the Company’s consolidated statement of operations, amounted to a gain (loss) of approximately $1.8 million, $(1.8) million and $2.1 million for the fiscal years ended June 30, 2013, 2014 and 2015, respectively.
Business Combinations—During the normal course of business the Company makes acquisitions. In the event that an individual acquisition (or an aggregate of acquisitions) is material, appropriate disclosure of such acquisition activity is provided. The acquisition method of accounting for business combinations requires the Company to use significant estimates and assumptions, including fair value estimates, as of the business combination date and to refine those estimates as necessary during the measurement period (defined as the period, not to exceed one year, in which we
F-12
OSI SYSTEMS, INC. AND SUBSIDIARIES
NOTES TO CONSOLIDATED FINANCIAL STATEMENTS—(Continued)
may adjust the provisional amounts recognized for a business combination) in a manner that is generally similar to the previous purchase method of accounting.
Under the acquisition method of accounting the Company recognizes separately from goodwill the identifiable assets acquired, the liabilities assumed, and any noncontrolling interests in an acquiree, generally at the acquisition date fair value. The Company measures goodwill as of the acquisition date as the excess of consideration transferred, which the Company also measures at fair value, over the net of the acquisition date amounts of the identifiable assets acquired and liabilities assumed. Costs that the Company incurs to complete the business combination such as investment banking, legal and other professional fees are not considered part of consideration and the Company charges them to general and administrative expense as they are incurred. Under the acquisition method the Company also accounts for acquired company restructuring activities that the Company initiates separately from the business combination. Should the initial accounting for a business combination be incomplete by the end of a reporting period that falls within the measurement period, the Company reports provisional amounts in its financial statements. During the measurement period, the Company adjusts the provisional amounts recognized at the acquisition date to reflect new information obtained about facts and circumstances that existed as of the acquisition date that, if known, would have affected the measurement of the amounts recognized as of that date and the Company records those adjustments to its financial statements. The Company applies those measurement period adjustments that the Company determines to be significant retrospectively to comparative information in its financial statements, including adjustments to depreciation and amortization expense. For further discussion regarding contingent earn outs that are included as part of the purchase price of an acquisition, please refer to footnote nine of the Consolidated Financial Statements.
Earnings per Share—Basic earnings per share is computed by dividing net income available to common stockholders by the weighted average number of common shares outstanding during the period. Diluted earnings per share is computed by dividing net income available to common stockholders by the sum of the weighted average number of common and dilutive potential common shares outstanding. Potential common shares consist of the shares issuable upon the exercise of stock options under the treasury stock method.
The following table sets forth the computation of basic and diluted earnings per share for the fiscal years ended June 30 (in thousands, except earnings per share data):
|
|
|
|
|
|
|
|
|
|
|
|
|
|
|
|
|
|
|
|
|
|
|
|
|
|
|
2013 |
|
2014 |
|
2015 |
|
|||
|
Net income available to common stockholders |
|
$ |
44,135 |
|
$ |
47,894 |
|
$ |
65,151 |
|
|
Weighted average shares outstanding—basic |
|
|
19,956 |
|
|
19,952 |
|
|
19,799 |
|
|
Dilutive effect of stock options |
|
|
612 |
|
|
635 |
|
|
727 |
|
|
Weighted average shares outstanding—diluted |
|
|
20,568 |
|
|
20,587 |
|
|
20,526 |
|
|
Basic earnings per share |
|
$ |
2.21 |
|
$ |
2.40 |
|
$ |
3.29 |
|
|
Diluted earnings per share |
|
$ |
2.15 |
|
$ |
2.33 |
|
$ |
3.17 |
|
Provision for Warranties—The Company offers its customers warranties on many of the products that it sells. These warranties typically provide for repairs and maintenance of the products if problems arise during a specified time period after original shipment. Concurrent with the sale of products, the Company records a provision for estimated warranty expenses with a corresponding increase in cost of goods sold. The Company periodically adjusts this provision
F-13
OSI SYSTEMS, INC. AND SUBSIDIARIES
NOTES TO CONSOLIDATED FINANCIAL STATEMENTS—(Continued)
based on historical experience and anticipated expenses. The Company charges actual expenses of repairs under warranty, including parts and labor, to this provision when incurred.
|
|
|
|
|
|
|
|
|
Provision for |
|
|
|
|
|
Warranties |
|
|
|
|
|
(in thousands) |
|
|
|
Balance on June 30, 2012 |
|
$ |
17,562 |
|
|
Warranty claims provision |
|
|
1,948 |
|
|
Settlements made |
|
|
(6,620) |
|
|
Balance on June 30, 2013 |
|
$ |
12,890 |
|
|
Warranty claims provision |
|
|
5,573 |
|
|
Settlements made |
|
|
(6,540) |
|
|
Balance on June 30, 2014 |
|
$ |
11,923 |
|
|
Warranty claims provision |
|
|
6,043 |
|
|
Settlements made |
|
|
(5,228) |
|
|
Balance on June 30, 2015 |
|
$ |
12,738 |
|
Recent Accounting Updates Not Yet Adopted—In May 2014, the Financial Accounting Standards Board issued an accounting standards update amending revenue recognition requirements for multiple deliverable revenue arrangements. This update provides guidance on how revenue is recognized to depict the transfer of promised goods or services to customers in an amount that reflects the consideration to which the entity expects to be entitled in exchange for the goods or services. This determination is made in five steps: (i) identify the contract with the customer; (ii) identify the performance obligations in the contract; (iii) determine the transaction price; (iv) allocate the transaction price to the performance obligations in the contract; and (v) recognize revenue when (or as) the entity satisfies a performance obligation. The effective date was amended in August 2015 for annual reporting periods after December 15, 2017 and for interim reporting periods within that reporting period. Earlier application is permitted only as of annual reporting periods beginning after December 15, 2016, including interim reporting periods within that reporting period. The Company has not yet selected a transition method and is currently evaluating the impact it may have on its financial condition and results of operations.
In July 2015, the Financial Accounting Standards Board issued an accounting standards update amending some of the guidance on subsequent measurement of inventory. This standard affects companies that are using first-in, first-out (FIFO) or average cost, or any other methods besides last-in, first out (LIFO) or the retail inventory method. The amendments in this update are effective for fiscal years beginning after December 15, 2016, including interim reporting periods within that reporting period. The amendments in this update should be applied prospectively with earlier application permitted as of the beginning of an interim or annual reporting period. The Company has not yet selected a transition method and is currently evaluating the impact it may have on its financial condition and results of operations.
F-14
OSI SYSTEMS, INC. AND SUBSIDIARIES
NOTES TO CONSOLIDATED FINANCIAL STATEMENTS—(Continued)
2. INVENTORIES
Inventory consisted of the following (in thousands):
|
|
|
|
|
|
|
|
|
|
|
|
June 30, |
|
||||
|
|
|
2014 |
|
2015 |
|
||
|
Raw materials |
|
$ |
117,945 |
|
$ |
131,373 |
|
|
Work-in-process |
|
|
33,394 |
|
|
45,386 |
|
|
Finished goods |
|
|
82,799 |
|
|
53,662 |
|
|
Total |
|
$ |
234,138 |
|
$ |
230,421 |
|
3. PROPERTY AND EQUIPMENT
Property and equipment consisted of the following (in thousands):
|
|
|
|
|
|
|
|
|
|
|
|
|
|
Estimated |
|
|
|
|
|
|
|
|
|
|
Useful |
|
June 30, |
|
||||
|
|
|
Lives |
|
2014 |
|
2015 |
|
||
|
Land |
|
N/A |
|
$ |
13,651 |
|
$ |
14,419 |
|
|
Buildings and improvements |
|
20 - 40 years |
|
|
163,952 |
|
|
167,269 |
|
|
Leasehold improvements |
|
1 - 20 years |
|
|
9,744 |
|
|
9,991 |
|
|
Equipment and tooling |
|
3 - 10 years |
|
|
154,367 |
|
|
152,518 |
|
|
Furniture and fixtures |
|
3 - 13 years |
|
|
4,017 |
|
|
3,475 |
|
|
Computer equipment |
|
1 - 5 years |
|
|
17,466 |
|
|
17,023 |
|
|
Computer software |
|
3 - 10 years |
|
|
15,670 |
|
|
16,612 |
|
|
Construction in process |
|
N/A |
|
|
12,650 |
|
|
9,593 |
|
|
Total |
|
|
|
|
391,517 |
|
|
390,900 |
|
|
Less accumulated depreciation and amortization |
|
|
|
|
(131,038) |
|
|
(165,197) |
|
|
Property and equipment, net |
|
|
|
$ |
260,479 |
|
$ |
225,703 |
|
During fiscal 2013, 2014 and 2015, depreciation expense was approximately $22.6 million, $49.9 million and $55.4 million, respectively.
F-15
OSI SYSTEMS, INC. AND SUBSIDIARIES
NOTES TO CONSOLIDATED FINANCIAL STATEMENTS—(Continued)
4. GOODWILL AND INTANGIBLE ASSETS
The changes in the carrying amount of goodwill for fiscal 2014 and 2015 are as follows (in thousands):
|
|
|
|
|
|
|
|
|
|
|
|
|
|
|
|
|
|
|
|
|
|
|
|
Optoelectronics |
|
|
|
|
|
|
|
|
|
|
|
|
|
|
and |
|
|
|
|
|
|
|
|
Security |
|
Healthcare |
|
Manufacturing |
|
|
|
|
|||
|
|
|
Division |
|
Division |
|
Division |
|
Consolidated |
|
||||
|
Balance as of June 30, 2013 |
|
$ |
28,546 |
|
$ |
35,827 |
|
$ |
19,370 |
|
$ |
83,743 |
|
|
Goodwill acquired or adjusted during the period |
|
|
784 |
|
|
1,018 |
|
|
5,730 |
|
|
7,532 |
|
|
Foreign currency translation adjustment |
|
|
177 |
|
|
392 |
|
|
763 |
|
|
1,332 |
|
|
Balance as of June 30, 2014 |
|
$ |
29,507 |
|
$ |
37,237 |
|
$ |
25,863 |
|
$ |
92,607 |
|
|
Goodwill acquired or adjusted during the period |
|
|
957 |
|
|
6,988 |
|
|
(49) |
|
|
7,896 |
|
|
Foreign currency translation adjustment |
|
|
(734) |
|
|
(1,043) |
|
|
(559) |
|
|
(2,336) |
|
|
Balance as of June 30, 2015 |
|
$ |
29,730 |
|
$ |
43,182 |
|
$ |
25,255 |
|
$ |
98,167 |
|
Intangible assets consisted of the following (in thousands):
|
|
|
|
|
|
|
|
|
|
|
|
|
|
|
|
|
|
|
|
|
|
|
|
|
|
|
|
June 30, 2014 |
|
June 30, 2015 |
|
||||||||||||||
|
|
|
Weighted |
|
Gross |
|
|
|
|
|
|
|
Gross |
|
|
|
|
|
|
|
||
|
|
|
Average |
|
Carrying |
|
Accumulated |
|
Intangibles |
|
Carrying |
|
Accumulated |
|
Intangibles |
|
||||||
|
|
|
Lives |
|
Value |
|
Amortization |
|
Net |
|
Value |
|
Amortization |
|
Net |
|
||||||
|
Amortizable assets: |
|
|
|
|
|
|
|
|
|
|
|
|
|
|
|
|
|
|
|
|
|
|
Software development costs |
|
8 years |
|
$ |
21,165 |
|
$ |
6,716 |
|
$ |
14,449 |
|
$ |
24,631 |
|
$ |
7,500 |
|
$ |
17,131 |
|
|
Patents |
|
17 years |
|
|
6,566 |
|
|
765 |
|
|
5,801 |
|
|
7,206 |
|
|
994 |
|
|
6,212 |
|
|
Core technology |
|
— |
|
|
2,289 |
|
|
2,150 |
|
|
139 |
|
|
— |
|
|
— |
|
|
— |
|
|
Developed technology |
|
11 years |
|
|
18,308 |
|
|
11,559 |
|
|
6,749 |
|
|
13,397 |
|
|
4,528 |
|
|
8,869 |
|
|
Customer relationships/backlog |
|
7 years |
|
|
11,419 |
|
|
7,011 |
|
|
4,408 |
|
|
8,619 |
|
|
3,406 |
|
|
5,213 |
|
|
Total amortizable assets |
|
|
|
|
59,747 |
|
|
28,201 |
|
|
31,546 |
|
|
53,853 |
|
|
16,428 |
|
|
37,425 |
|
|
Non-amortizable assets: |
|
|
|
|
|
|
|
|
|
|
|
|
|
|
|
|
|
|
|
|
|
|
Trademarks |
|
|
|
|
12,069 |
|
|
— |
|
|
12,069 |
|
|
12,988 |
|
|
— |
|
|
12,988 |
|
|
Total intangible assets |
|
|
|
$ |
71,816 |
|
$ |
28,201 |
|
$ |
43,615 |
|
$ |
66,841 |
|
$ |
16,428 |
|
$ |
50,413 |
|
Amortization expense for fiscal 2013, 2014 and 2015 was $4.9 million, $4.3 million and $3.6 million, respectively. Future acquisitions could cause these amounts to increase. At June 30, 2015, estimated future amortization expense was as follows (in thousands):
|
|
|
|
|
|
|
2016 |
|
$ |
4,852 |
|
|
2017 |
|
|
4,967 |
|
|
2018 |
|
|
5,218 |
|
|
2019 |
|
|
4,844 |
|
|
2020 |
|
|
4,488 |
|
|
Thereafter, including assets that have not yet begun to be amortized |
|
|
13,056 |
|
|
Total |
|
$ |
37,425 |
|
Software development costs for software products incurred before establishing technological feasibility are
F-16
OSI SYSTEMS, INC. AND SUBSIDIARIES
NOTES TO CONSOLIDATED FINANCIAL STATEMENTS—(Continued)
charged to operations. Software development costs incurred after establishing technological feasibility are capitalized on a product by product basis until the product is available for general release to customers at which time amortization begins. Annual amortization, charged to cost of goods sold, is the amount computed using the ratio that current revenues for a product bear to the total current and anticipated future revenues for that product. In the event that future revenues are not estimable, such costs are amortized on a straight line basis over the remaining estimated economic life of the product. Amortizable assets that have not yet begun to be amortized are included in thereafter in the table above. During fiscal 2013, 2014 and 2015, the Company capitalized software development costs in the amount of $2.2 million, $3.0 million and $3.0 million, respectively.
5. IMPAIRMENT, RESTRUCTURING AND OTHER CHARGES
In response to challenging worldwide economic conditions, the Company continued to optimize its cost structure by reducing excess workforce and facilities and consolidating and relocating certain manufacturing facilities. In addition, as a result of a contract settlement with the Transportation Security Administration (TSA) in fiscal 2013 related to the Rapiscan Secure 1000SP Advanced Imaging Technology system and associated Automated Target Recognition software and the Company’s related agreement with the U.S. Department of Homeland Security (DHS), and other contract issues with U.S. Government agencies, the Company incurred charges, including the write‑off of inventory, removal and storage costs for products previously sold to the TSA and legal costs; and recognized the impairment of related capitalized software development costs. In fiscal years 2014 and 2015, the Company recognized additional charges related to a termination for default of a contract with the TSA as well as contract issues with other U.S. Government agencies. The related accruals are included in other accrued expenses and current liabilities in the consolidated balance sheets. The following table analyzes the key components of impairment, restructuring and other charges throughout fiscal 2013, 2014 and 2015:
|
|
|
|
|
|
|
|
|
Optoelectronics |
|
|
|
|
|
|
|
|
|
|
|
|
|
|
|
|
|
and |
|
|
|
|
|
|
|
|
|
|
|
Security |
|
Healthcare |
|
Manufacturing |
|
|
|
|
|
|
|
|||
|
|
|
Division |
|
Division |
|
Division |
|
Corporate |
|
Consolidated |
|
|||||
|
Accrued balance as of June 30, 2012 |
|
$ |
297 |
|
$ |
170 |
|
$ |
6 |
|
$ |
9 |
|
$ |
482 |
|
|
Expensed during the year |
|
|
|
|
|
|
|
|
|
|
|
|
|
|
|
|
|
Facility closure |
|
|
— |
|
|
2,309 |
|
|
344 |
|
|
— |
|
|
2,653 |
|
|
Employee termination costs |
|
|
781 |
|
|
57 |
|
|
246 |
|
|
— |
|
|
1,084 |
|
|
Charges related to contract settlement |
|
|
3,155 |
|
|
— |
|
|
— |
|
|
— |
|
|
3,155 |
|
|
Impairment of software development costs |
|
|
1,095 |
|
|
— |
|
|
— |
|
|
— |
|
|
1,095 |
|
|
Total expensed during year |
|
|
5,031 |
|
|
2,366 |
|
|
590 |
|
|
— |
|
|
7,987 |
|
|
Paid or incurred during the year |
|
|
4,285 |
|
|
897 |
|
|
530 |
|
|
9 |
|
|
5,721 |
|
|
Accrued balance as of June 30, 2013 |
|
$ |
1,043 |
|
$ |
1,639 |
|
$ |
66 |
|
|
— |
|
$ |
2,748 |
|
|
Expensed during the year |
|
|
|
|
|
|
|
|
|
|
|
|
|
|
|
|
|
Facility closure / consolidations |
|
|
— |
|
|
2,009 |
|
|
763 |
|
|
— |
|
|
2,772 |
|
|
Employee termination costs |
|
|
886 |
|
|
— |
|
|
669 |
|
|
— |
|
|
1,555 |
|
|
Charges related to government contract issues |
|
|
5,798 |
|
|
— |
|
|
— |
|
|
— |
|
|
5,798 |
|
|
Charges related to class action litigation |
|
|
— |
|
|
— |
|
|
— |
|
|
594 |
|
|
594 |
|
|
Debt restructuring |
|
|
— |
|
|
— |
|
|
— |
|
|
1,325 |
|
|
1,325 |
|
|
Total expensed during the year |
|
|
6,684 |
|
|
2,009 |
|
|
1,432 |
|
|
1,919 |
|
|
12,044 |
|
|
Paid or incurred during the year |
|
|
5,912 |
|
|
2,598 |
|
|
1,430 |
|
|
1,919 |
|
|
11,859 |
|
|
Accrued balance as of June 30, 2014 |
|
$ |
1,815 |
|
$ |
1,050 |
|
$ |
68 |
|
|
— |
|
$ |
2,933 |
|
F-17
OSI SYSTEMS, INC. AND SUBSIDIARIES
NOTES TO CONSOLIDATED FINANCIAL STATEMENTS—(Continued)
|
Expensed during the year |
|
|
|
|
|
|
|
|
|
|
|
|
|
|
|
|
|
Facility closure / consolidations |
|
|
— |
|
|
136 |
|
|
2,388 |
|
|
— |
|
|
2,524 |
|
|
Employee termination costs |
|
|
1,331 |
|
|
1,242 |
|
|
277 |
|
|
— |
|
|
2,850 |
|
|
Charges related to government contract issues |
|
|
3,772 |
|
|
— |
|
|
— |
|
|
— |
|
|
3,772 |
|
|
Charges related to class action litigation |
|
|
— |
|
|
— |
|
|
— |
|
|
704 |
|
|
704 |
|
|
Total expensed during the year |
|
|
5,103 |
|
|
1,378 |
|
|
2,665 |
|
|
704 |
|
|
9,850 |
|
|
Paid or incurred during the year |
|
|
3,542 |
|
|
2,375 |
|
|
2,733 |
|
|
704 |
|
|
9,354 |
|
|
Accrued balance as of June 30, 2015 |
|
$ |
3,376 |
|
$ |
53 |
|
$ |
— |
|
|
— |
|
$ |
3,429 |
|
6. LINE‑OF‑CREDIT BORROWINGS AND DEBT
The Company has a $450 million credit agreement maturing in May 2019. The credit agreement consists of a $450 million revolving credit facility, including a $375 million sub‑limit for letters of credit. The Company has the ability to increase the facility by $200 million under certain circumstances. Borrowings under this facility bear interest at LIBOR plus a margin of 1.25% as of June 30, 2015. This margin is determined by the Company’s consolidated leverage ratio and may range from 1.25% to 2.0%. Letters of credit reduce the amount available to borrow by their face value. As of June 30, 2015, the unused portion of the facility bears a commitment fee of 0.20%, but can range from 0.20% to 0.35% based on the Company’s consolidated leverage ratio. The Company’s borrowings under the credit agreement are guaranteed by the Company’s U.S.‑based subsidiaries and are secured by substantially all of the Company’s and certain subsidiaries’ assets. The agreement contains various representations, warranties, affirmative, negative and financial covenants, and conditions of default customary for financing agreements of this type. As of June 30, 2015, there was no borrowing outstanding under the revolving credit facility and letters‑of‑credit outstanding totaled $6.0 million. As of June 30, 2015, the Company believes that it is in material compliance with all related covenants to this credit facility.
Several of the Company’s foreign subsidiaries maintain bank lines‑of‑credit, denominated in local currencies and U.S. dollars, to meet short‑term working capital requirements and for the issuance of letters‑of‑credit. As of June 30, 2015, $46.3 million was outstanding under these lines‑of‑credit facilities, while no debt was outstanding. As of June 30, 2015, the total amount available under these credit facilities was $12.9 million, with a total cash borrowing sub‑limit of $1.6 million.
In September 2012, the Company entered into a term loan agreement for $11.1 million to fund the acquisition of land and a building in the state of Washington. The loan is payable over seven years and bears interest at LIBOR plus 1.25%, which is payable on a monthly basis. Concurrent with entering into the floating rate loan, the Company entered into an interest rate swap agreement that effectively locks the interest rate of the loan to 2.2% per annum for the term of the loan. As of June 30, 2015, $6.9 million remained outstanding under this loan.
F-18
OSI SYSTEMS, INC. AND SUBSIDIARIES
NOTES TO CONSOLIDATED FINANCIAL STATEMENTS—(Continued)
Long‑term debt consisted of the following at June 30 (in thousands):
|
|
|
|
|
|
|
|
|
|
|
|
2014 |
|
2015 |
|
||
|
Term loans |
|
$ |
10,921 |
|
$ |
8,935 |
|
|
Other long-term debt |
|
|
2,334 |
|
|
2,422 |
|
|
|
|
|
13,255 |
|
|
11,357 |
|
|
Less current portion of long-term debt |
|
|
2,819 |
|
|
2,801 |
|
|
Long-term portion of debt |
|
$ |
10,436 |
|
$ |
8,556 |
|
Fiscal year principal payments of long‑term debt as of June 30, 2015 are as follows (in thousands):
|
|
|
|
|
|
|
2016 |
|
$ |
2,801 |
|
|
2017 |
|
|
2,707 |
|
|
2018 |
|
|
2,249 |
|
|
2019 |
|
|
1,877 |
|
|
2020 |
|
|
746 |
|
|
Thereafter |
|
|
977 |
|
|
Total |
|
$ |
11,357 |
|
7. STOCK‑BASED COMPENSATION
As of June 30, 2015, the Company maintained two share‑based employee compensation plans (the “OSI Plans”): the 2012 Incentive Award Plan (“2012 Plan”) and the Amended and Restated 2006 Equity Participation Plan (“2006 Plan”). Upon stockholder approval of the 2012 Plan, the Company ceased to make grants under the 2006 Plan.
The Company recorded stock‑based‑compensation expense in the consolidated statement of operations as follows (in thousands):
|
|
|
|
|
|
|
|
|
|
|
|
|
|
|
2013 |
|
2014 |
|
2015 |
|
|||
|
Cost of goods sold |
|
$ |
820 |
|
$ |
887 |
|
$ |
1,037 |
|
|
Selling, general and administrative |
|
|
15,394 |
|
|
15,940 |
|
|
21,249 |
|
|
Research and development |
|
|
232 |
|
|
156 |
|
|
215 |
|
|
Stock based compensation expense |
|
|
16,446 |
|
|
16,983 |
|
|
22,501 |
|
|
Less: Related income tax benefit |
|
|
6,123 |
|
|
6,498 |
|
|
8,552 |
|
|
Stock based compensation expense, net |
|
$ |
10,323 |
|
$ |
10,485 |
|
$ |
13,949 |
|
As of June 30, 2015, total unrecognized compensation cost related to share‑based compensation grants were estimated at $0.9 million for stock options and $13.4 million for restricted stock and restricted stock units (“RSUs”) under the OSI Plans. The Company expects to recognize these costs over a weighted‑average period of 1.7 years with respect to the options and 2.0 years for grants of restricted stock and RSUs.
Employee Stock Purchase Plan—The Company has an employee stock purchase plan under which eligible employees may purchase a limited number of shares of Common Stock at a discount of up to 15% of the market value of such stock at pre‑determined, plan‑defined dates. During the three years ended June 30, 2013, 2014 and 2015, employees purchased 85,056, 29,185 and 65,706 shares, respectively. As of June 30, 2015, there were 953,494 shares of the Company’s Common Stock available for issuance under the plan.
F-19
OSI SYSTEMS, INC. AND SUBSIDIARIES
NOTES TO CONSOLIDATED FINANCIAL STATEMENTS—(Continued)
OSI Plans
In September 2012, the Company’s Board of Directors approved the 2012 Plan, and in December 2012 the stockholders adopted the 2012 Plan. The 2012 Plan serves as the successor to the 2006 Plan. No new awards will be issued under the 2006 Plan as of the date of stockholder approval of the 2012 Plan. Outstanding awards under the 2006 Plan continue to be subject to the terms and conditions of the 2006 Plan.
Under the 2012 Plan, the Company is authorized to grant awards in the form of incentive options, nonqualified options, restricted stock awards, stock appreciation rights, RSUs, performance shares and stock bonuses, amongst other forms of equity, to qualified employees, directors and consultants.
Under the OSI Plans, the exercise price of nonqualified options and incentive stock options may not be less than the fair market value of the Company’s Common Stock on the date of grant. The exercise price of nonqualified options and incentive stock options granted to individuals who own more than 10% of the Company’s voting stock may not be less than 110% of the fair market value of the Company’s Common Stock on the date of grant. Stock options granted under the OSI Plans typically vest over three years based on continued service. Restricted stock and RSUs typically vest over three to four years based on continued service. Certain restricted stock awards granted to senior management vest based on the achievement of pre‑established performance criteria.
Stock Option Fair Value Estimation Assumptions. The Company estimates the fair value of its stock options at the date of grant using the Black‑Scholes option‑pricing valuation model. The Company’s valuation model is affected by the Company’s stock price as well as weighted average assumptions for a number of subjective variables described below.
Expected Dividend. Expected dividend is based on historical patterns and the Company’s anticipated dividend payments over the expected holding period.
Risk‑Free Interest Rate. The risk‑free interest rate for stock options is based on U.S. Treasuries for a maturity matching the expected holding period.
Expected Volatility. Expected volatility is based on the Company’s historical share price volatility matching the expected holding period. No single method of estimating volatility is proper under all circumstances and to the extent that a company can derive implied volatility based on the trading of its financial instruments on a public market, it may be appropriate to use both implied and historical volatility in its assumptions. The Company has certain financial instruments that are publicly traded from which the Company can derive the implied volatility. Therefore, the Company used implied and historical volatility for valuing its stock options. The Company believes that implied and historical volatility is a better indicator of expected volatility because it is generally reflective of both historical volatility and expectations of how future volatility will differ from historical volatility.
Expected Holding Period. The Company uses historical stock option exercise data to estimate the expected holding period.
F-20
OSI SYSTEMS, INC. AND SUBSIDIARIES
NOTES TO CONSOLIDATED FINANCIAL STATEMENTS—(Continued)
Changes in assumptions can materially impact the estimated fair value of stock options. The weighted average assumptions used in the valuation model are presented in the table below.
|
|
|
|
|
|
|
|
|
|
|
|
2013 |
|
2014 |
|
2015 |
|
|
Expected dividend |
|
0 |
% |
0 |
% |
0 |
% |
|
Risk-free interest rate |
|
0.6 |
% |
1.3 |
% |
1.5 |
% |
|
Expected volatility |
|
33.0 |
% |
33.0 |
% |
31.0 |
% |
|
Expected holding period (in years) |
|
4.3 |
|
4.5 |
|
4.5 |
|
The following summarizes stock option activity for fiscal years 2013, 2014 and 2015:
|
|
|
|
|
|
|
|
|
|
|
|
|
|
|
|
|
|
Weighted- |
|
|
|
|
|
|
|
|
|
|
|
|
Average |
|
Weighted-Average |
|
Aggregate |
|
||
|
|
|
Number of |
|
Exercise |
|
Remaining Contractual |
|
Intrinsic Value |
|
||
|
|
|
Options |
|
Price |
|
Term |
|
(in thousands) |
|
||
|
Outstanding at June 30, 2012 |
|
1,059,397 |
|
|
23.01 |
|
|
|
|
|
|
|
Granted |
|
90,234 |
|
|
55.37 |
|
|
|
|
|
|
|
Exercised |
|
(117,705) |
|
|
15.59 |
|
|
|
|
|
|
|
Expired or forfeited |
|
(12,193) |
|
|
56.36 |
|
|
|
|
|
|
|
Outstanding at June 30, 2013 |
|
1,019,733 |
|
|
26.33 |
|
|
|
|
|
|
|
Granted |
|
10,294 |
|
|
70.59 |
|
|
|
|
|
|
|
Exercised |
|
(1,169) |
|
|
39.97 |
|
|
|
|
|
|
|
Expired or forfeited |
|
(5,867) |
|
|
54.06 |
|
|
|
|
|
|
|
Outstanding at June 30, 2014 |
|
1,022,991 |
|
|
26.60 |
|
|
|
|
|
|
|
Granted |
|
45,104 |
|
|
68.05 |
|
|
|
|
|
|
|
Exercised |
|
(38,907) |
|
|
41.20 |
|
|
|
|
|
|
|
Expired or forfeited |
|
(16,538) |
|
|
62.20 |
|
|
|
|
|
|
|
Outstanding at June 30, 2015 |
|
1,012,650 |
|
|
27.30 |
|
4.8 years |
|
$ |
44,041 |
|
|
Exercisable at June 30, 2015 |
|
947,575 |
|
$ |
24.80 |
|
4.5 years |
|
$ |
43,577 |
|
The per‑share weighted‑average grant‑date fair value of stock options granted under the OSI Plans was $15.33, $20.78 and $19.26 for fiscal 2013, 2014 and 2015, respectively. The total intrinsic value of options exercised during fiscal 2015 was $1,108,900.
F-21
OSI SYSTEMS, INC. AND SUBSIDIARIES
NOTES TO CONSOLIDATED FINANCIAL STATEMENTS—(Continued)
Restricted Stock Awards and Restricted Stock Units—A summary of restricted stock award and RSU activity for the periods indicated was as follows:
|
|
|
|
|
|
|
|
|
|
|
|
|
Weighted- |
|
|
|
|
|
|
|
Average |
|
|
|
|
|
Shares |
|
Fair Value |
|
|
|
Nonvested at June 30, 2012 |
|
580,468 |
|
$ |
28.93 |
|
|
Granted |
|
296,334 |
|
|
57.29 |
|
|
Vested |
|
(236,070) |
|
|
25.83 |
|
|
Forfeited |
|
(13,608) |
|
|
43.03 |
|
|
Nonvested at June 30, 2013 |
|
627,124 |
|
$ |
43.13 |
|
|
Granted |
|
322,275 |
|
|
63.73 |
|
|
Vested |
|
(283,091) |
|
|
39.40 |
|
|
Forfeited |
|
(4,908) |
|
|
49.22 |
|
|
Nonvested at June 30, 2014 |
|
661,400 |
|
$ |
54.78 |
|
|
Granted |
|
281,163 |
|
|
64.68 |
|
|
Vested |
|
(262,221) |
|
|
42.75 |
|
|
Forfeited |
|
(20,436) |
|
|
55.62 |
|
|
Nonvested at June 30, 2015 |
|
659,906 |
|
$ |
63.75 |
|
The per‑share weighted average grant‑date fair value of restricted stock and RSUs granted under the OSI Plans was $57.29, $63.73 and $64.68 for fiscal 2013, 2014 and 2015, respectively. The total fair value of shares vested during fiscal 2013, 2014 and 2015 was $6.1 million, $11.2 million and $11.2 million, respectively.
As of June 30, 2015, there were 3,020,206 shares available for grant under the 2012 Plan. Under the terms of the 2012 Plan, RSUs and restricted stock granted from the pool of shares available for grant reduce the pool by 1.87 shares for each award granted. RSUs and restricted stock forfeited and returned to the pool of shares available for grant increase the pool by 1.87 shares for each award forfeited.
The Company granted 178,500, 160,922 and 151,469 performance‑based awards during fiscal 2013, 2014 and 2015, respectively. These performance‑based restricted stock and RSU awards are contingent on the achievement of certain performance metrics. The payout can range from zero to 250% of the original number of shares or units awarded.
F-22
OSI SYSTEMS, INC. AND SUBSIDIARIES
NOTES TO CONSOLIDATED FINANCIAL STATEMENTS—(Continued)
8. INCOME TAXES
The following is a geographical breakdown of income before the provision for income taxes (in thousands):
|
|
|
|
|
|
|
|
|
|
|
|
|
|
|
2013 |
|
2014 |
|
2015 |
|
|||
|
Pre-tax income (loss): |
|
|
|
|
|
|
|
|
|
|
|
United States |
|
$ |
(13,111) |
|
$ |
(22,604) |
|
$ |
(16,428) |
|
|
Foreign |
|
|
82,525 |
|
|
98,459 |
|
|
105,281 |
|
|
Total pre-tax income |
|
$ |
69,414 |
|
$ |
75,855 |
|
$ |
88,853 |
|
The Company’s provision (benefit) for income taxes consists of the following (in thousands):
|
|
|
|
|
|
|
|
|
|
|
|
|
|
|
2013 |
|
2014 |
|
2015 |
|
|||
|
Current: |
|
|
|
|
|
|
|
|
|
|
|
Federal |
|
$ |
(2,214) |
|
$ |
(704) |
|
$ |
2,502 |
|
|
State |
|
|
(36) |
|
|
113 |
|
|
1,276 |
|
|
Foreign |
|
|
23,925 |
|
|
20,616 |
|
|
25,880 |
|
|
Total current provision |
|
|
21,675 |
|
|
20,025 |
|
|
29,658 |
|
|
Deferred: |
|
|
|
|
|
|
|
|
|
|
|
Federal |
|
$ |
(2,422) |
|
$ |
(5,366) |
|
$ |
(7,910) |
|
|
State |
|
|
337 |
|
|
(1,128) |
|
|
(1,180) |
|
|
Foreign |
|
|
5,689 |
|
|
14,430 |
|
|
3,134 |
|
|
Total deferred provision |
|
|
3,604 |
|
|
7,936 |
|
|
(5,956) |
|
|
Total provision |
|
$ |
25,279 |
|
$ |
27,961 |
|
$ |
23,702 |
|
As of June 30, 2014 and 2015, the Company’s liability for uncertain tax positions was $3.2 million and $6.7 million, respectively. Of the $6.7 million, $6.4 million represents the amount of unrecognized tax benefits that, if recognized, would affect the effective tax rate.
The Company recognizes potential interest and penalties related to income tax matters in income tax expense. As of June 30, 2015, the Company had accrued $0.4 million for interest and penalties. The Company’s uncertain tax positions are related to tax years that remain subject to examination by the relevant tax authorities. These include fiscal years after 2012 for federal purposes, fiscal years after 2011 for state purposes and fiscal years after 2006 for various foreign jurisdictions. Facts and circumstances could arise that could cause the Company to reduce the liability for unrecognized tax benefits, including, but not limited to, settlement of income tax positions or expiration of statutes of limitation. Since the ultimate resolution of uncertain tax positions depends on many factors and assumptions, the Company is not able to estimate the range of potential changes in the liability for unrecognized tax benefits or the timing of such changes.
F-23
OSI SYSTEMS, INC. AND SUBSIDIARIES
NOTES TO CONSOLIDATED FINANCIAL STATEMENTS—(Continued)
A summary of activity of unrecognized tax benefits for fiscal 2013, 2014 and 2015 is as follows (in thousands).
|
Balance at June 30, 2013 |
|
$ |
9,504 |
|
|
Additions on tax positions for the current year |
|
|
1,043 |
|
|
Additions on tax positions from prior years |
|
|
— |
|
|
Reduction in tax position from prior year |
|
|
(3,723) |
|
|
Balance at June 30, 2014 |
|
$ |
6,824 |
|
|
Additions on tax positions for the current year |
|
|
5,806 |
|
|
Additions on tax positions from prior years |
|
|
453 |
|
|
Reduction in tax position from prior year |
|
|
(2,034) |
|
|
Balance at June 30, 2015 |
|
$ |
11,049 |
|
The Company does not provide for U.S. income taxes on the undistributed earnings of its foreign subsidiaries as it is the Company’s intention to utilize those earnings in the foreign operations for an indefinite period of time. At June 30, 2015, undistributed earnings of the foreign subsidiaries amounted to approximately $523 million. The amount of unrecognized deferred tax liability related to these temporary differences is estimated to be approximately $183 million. The amount of tax payable could be significantly impacted by the source location and amount of the distribution, the underlying tax rate already paid on the earnings, foreign withholding taxes and the opportunity to use foreign tax credits.
Deferred income tax assets (liabilities) consisted of the following (in thousands):
|
|
|
|
|
|
|
|
|
|
|
|
June 30, |
|
||||
|
|
|
2014 |
|
2015 |
|
||
|
Deferred income tax assets: |
|
|
|
|
|
|
|
|
Tax credit carryforwards |
|
$ |
9,314 |
|
$ |
9,274 |
|
|
Net operating loss carryforwards |
|
|
5,868 |
|
|
5,915 |
|
|
Customer advances |
|
|
37,777 |
|
|
25,797 |
|
|
Allowance for doubtful accounts |
|
|
3,071 |
|
|
2,978 |
|
|
Inventory reserve |
|
|
8,832 |
|
|
9,308 |
|
|
Inventory capitalization |
|
|
2,814 |
|
|
3,257 |
|
|
Accrued liabilities |
|
|
5,040 |
|
|
6,221 |
|
|
Stock & deferred compensation |
|
|
13,167 |
|
|
21,087 |
|
|
Other assets |
|
|
9,372 |
|
|
5,904 |
|
|
Total deferred income tax assets |
|
|
95,255 |
|
|
89,741 |
|
|
Valuation allowance |
|
|
(13,344) |
|
|
(12,728) |
|
|
Net deferred income tax assets |
|
|
81,911 |
|
|
77,013 |
|
|
Deferred income tax liabilities: |
|
|
|
|
|
|
|
|
Depreciation |
|
|
(60,103) |
|
|
(50,029) |
|
|
State income taxes |
|
|
(1,471) |
|
|
(1,965) |
|
|
Amortization of intangible assets |
|
|
(11,702) |
|
|
(14,412) |
|
|
Prepaid expenses |
|
|
(7,957) |
|
|
(5,767) |
|
|
Other liabilities |
|
|
(561) |
|
|
(13) |
|
|
Total deferred income tax liabilities |
|
|
(81,794) |
|
|
(72,186) |
|
|
Net deferred tax asset |
|
$ |
117 |
|
$ |
4,827 |
|
F-24
OSI SYSTEMS, INC. AND SUBSIDIARIES
NOTES TO CONSOLIDATED FINANCIAL STATEMENTS—(Continued)
The components of the net deferred income tax asset are classified in the consolidated balance sheets as follows (in thousands):
|
|
|
|
|
|
|
|
|
|
|
|
2014 |
|
2015 |
|
||
|
Current deferred income tax asset |
|
$ |
60,401 |
|
$ |
44,887 |
|
|
Current deferred income tax liability, included in other accrued expenses and current liabilities |
|
|
(8,633) |
|
|
(7,638) |
|
|
Long term deferred income tax asset, included in other assets |
|
|
21,510 |
|
|
33,013 |
|
|
Long term deferred income tax liability |
|
|
(73,161) |
|
|
(65,435) |
|
|
Net deferred income tax asset |
|
$ |
117 |
|
$ |
4,827 |
|
The components of current taxes receivable and payable and prepaid taxes are classified in the consolidated balance sheets as follows (in thousands):
|
|
|
|
|
|
|
|
|
|
|
|
2014 |
|
2015 |
|
||
|
Current taxes receivable and prepaid taxes, included in prepaid expenses and other current assets |
|
$ |
13,126 |
|
$ |
12,784 |
|
|
Current taxes payable |
|
|
(20,556) |
|
|
(9,610) |
|
|
Net tax payable |
|
|
(7,430) |
|
|
3,174 |
|
As of June 30, 2015, the Company had domestic and foreign net operating loss carryforwards of approximately $25.1 million and $21.2 million, respectively. As of June 30, 2015, the Company had federal and state research and development tax credit carryforwards of approximately $8.4 million and $3.8 million, respectively. As of June 30, 2015, the Company had foreign tax credit carryforwards of $1.9 million. The Company’s credit carryforwards will begin to expire in the tax year ending June 30, 2017.
The Company has established valuation allowances that relate to the net operating loss of certain subsidiaries, foreign tax credits and R&D credits. During the year ended June 30, 2015, the Company recorded a net aggregated decrease of $0.6 million to these valuation allowances. The Company reviews the adequacy of individual valuation allowances and releases such allowances when it is determined that it is more likely than not that the related benefits will be realized.
The Company recognizes excess tax benefits associated with the exercise of stock options directly to stockholders’ equity only when realized. Accordingly, deferred tax assets are not recognized for net operating losses resulting from excess tax benefits. As of June 30, 2015, deferred tax assets do not include approximately $0.9 million of these excess tax benefits from employee stock option exercises that are a component of the Company’s net operating loss carry forwards. Accordingly, additional paid‑in capital will be increased up to an additional $0.9 million if and when such excess tax benefits are realized. However, to the extent additional paid‑in capital has been recognized for qualifying excess tax deductions from previous share‑based payments, the write off of the deferred tax asset when the tax deduction is less than recognized compensation cost is charged to additional paid‑in capital, with any remainder charged to provision for income taxes.
F-25
OSI SYSTEMS, INC. AND SUBSIDIARIES
NOTES TO CONSOLIDATED FINANCIAL STATEMENTS—(Continued)
The consolidated effective income tax rate differs from the federal statutory income tax rate due primarily to the following:
|
|
|
June 30, |
|
||||
|
|
|
2013 |
|
2014 |
|
2015 |
|
|
Provision for income taxes at federal statutory rate |
|
35.0 |
% |
35.0 |
% |
35.0 |
% |
|
UK patent box benefit |
|
— |
|
— |
|
(2.1) |
|
|
Impact to tax rate as a result of accelerating depreciation of certain foreign assets |
|
9.8 |
|
10.1 |
|
— |
|
|
Research and development tax credits |
|
(1.9) |
|
(0.7) |
|
(0.9) |
|
|
Foreign income subject to tax at other than federal statutory rate |
|
(8.9) |
|
(10.0) |
|
(9.4) |
|
|
Change in valuation allowance |
|
2.8 |
|
2.8 |
|
(1.1) |
|
|
Unrecognized tax benefit |
|
(2.0) |
|
(2.5) |
|
4.1 |
|
|
US tax on foreign earnings |
|
— |
|
0.3 |
|
4.9 |
|
|
Non-taxable earnings from acquisitions |
|
(0.4) |
|
(0.5) |
|
(2.3) |
|
|
Mexico imputed income (expense) |
|
— |
|
2.8 |
|
(0.7) |
|
|
Other |
|
2.0 |
|
(0.4) |
|
(0.8) |
|
|
Effective income tax rate |
|
36.4 |
% |
36.9 |
% |
26.7 |
% |
The provision for income taxes consists of provisions for federal, state, and foreign income taxes. The Company operates in an international environment with significant operations in various locations outside the U.S. Accordingly, the consolidated income tax rate is a composite rate reflecting the earnings in the various locations and the applicable rates.
9. COMMITMENTS AND CONTINGENCIES
The following is a summary of commitments as of June 30, 2015 (in thousands):
|
|
|
|
|
|
|
|
|
|
|
|
|
|
|
|
|
|
|
|
|
Payments Due by Period |
|
|||||||||||||
|
|
|
|
|
|
Less than |
|
|
|
|
|
After |
|
||||
|
|
|
Total |
|
1 year |
|
2 - 3 years |
|
4 - 5 years |
|
5 years |
|
|||||
|
Total debt |
|
$ |
11,357 |
|
$ |
2,801 |
|
$ |
4,956 |
|
$ |
2,623 |
|
$ |
977 |
|
|
Operating leases |
|
$ |
18,422 |
|
$ |
7,220 |
|
$ |
7,988 |
|
$ |
1,722 |
|
$ |
1,492 |
|
|
Defined benefit plan obligation |
|
$ |
9,435 |
|
$ |
153 |
|
$ |
412 |
|
$ |
2,086 |
|
|
6,784 |
|
Operating Leases—The Company leases facilities and certain equipment under various operating lease agreements. Certain leases provide for periodic rent increases and may contain escalation clauses and renewal options. Rent expense totaled $12.9 million, $9.9 million and $10.0 million for fiscal years 2013, 2014 and 2015, respectively.
Contingent Acquisition Obligations—Under the terms and conditions of the purchase agreements associated with certain acquisitions, the Company may be obligated to make additional payments based on the achievement by the acquired operations of certain sales or profitability milestones. The maximum amount of such future payments under arrangements with contingent consideration caps is $37.3 million as of June 30, 2015. In addition, one of the purchase agreements the Company entered into requires royalty payments through 2022 based on the license of, or sales of products containing, the technology of CXR Limited, a company acquired in 2004. For acquisitions that occurred prior to fiscal year 2010, the Company accounts for such contingent payments as an addition to the purchase price of the acquired business. Otherwise, the estimated fair value of these obligations is recorded in Other accrued expenses and current liabilities or in Other long-term liabilities in the accompanying consolidated balance sheets at the time of the acquisition
F-26
OSI SYSTEMS, INC. AND SUBSIDIARIES
NOTES TO CONSOLIDATED FINANCIAL STATEMENTS—(Continued)
with subsequent revisions reflected in Selling, general and administrative in the consolidated statements of operations. As of June 30, 2014 and 2015, $23.2 million and $17.2 million of contingent payment obligations, respectively, are included in the accompanying consolidated balance sheets. During fiscal 2014 and 2015, the fair values of these contingent obligations were revised or paid down and resulted in reductions of $3.9 million and $9.3 million, respectively.
Advances from Customers—The Company receives advances from customers associated with certain projects. In fiscal 2012, the Company entered into an agreement with the Mexican government to provide a turnkey security screening solution at various locations throughout the country. Associated with the agreement, the Company was provided an advance totaling $100 million. The Company is obligated to provide a guarantee until the advance has been amortized. As of June 30, 2015, $50.0 million of this advance remains outstanding.
Environmental Contingencies—The Company is subject to various environmental laws. The Company’s practice is to conduct appropriate environmental investigations at its manufacturing facilities in North America, Asia Pacific, and Europe, and, to the extent practicable, on all new properties in order to identify, as of the date of such report, potential areas of environmental concern related to past and present activities or from nearby operations. In certain cases, the Company has conducted further environmental assessments consisting of soil and groundwater testing and other investigations deemed appropriate by independent environmental consultants.
During one investigation at the Company’s Hawthorne, California facility, the Company discovered soil and groundwater contamination that it believes was the result of unspecified on- and off-site releases occurring prior to the Company’s occupancy. Historical usage of this site includes semiconductor and electronics manufacturing, dating back to the mid-1960s, as well as possible aircraft and related manufacturing dating to the early 1940s. Similar operations, including chemical manufacturing and storage, were conducted at neighboring sites throughout that period and into the 1990s. It is not presently known when the releases occurred or by whom they were caused, though Company records, in conjunction with data obtained from soil and groundwater surveys, support the Company’s assertion that these releases are historical in nature. Further, the groundwater contamination is a known regional issue, not limited to the Company’s premises or its immediate surroundings. The Company has filed all requisite reports with the appropriate environmental authorities and continues to cooperate with the local governing agency to develop a complete and accurate characterization of this site. Recent activities include the installation of groundwater monitoring wells, indoor air quality monitoring and additional soil and soil vapor studies. Results from these studies are being evaluated to determine the extent of the on-site releases as well as appropriate and cost-effective remedial action measures. Periodic groundwater monitoring is expected to continue until such time as the governing authority requests further action.
The Company has not accrued for loss contingencies relating to the Hawthorne facility or any other environmental matters because it believes that, although unfavorable outcomes may be possible, they are not considered by the Company’s management to be probable and reasonably estimable. If one or more of environmental matters are resolved in a manner adverse to the Company, the impact on the Company’s business, financial condition, results of operations, financial position and/or liquidity could be material.
Indemnifications—In the normal course of business, the Company has agreed to indemnify certain parties with respect to certain matters. The Company has agreed to hold certain parties harmless against losses arising from a breach of representations or covenants, or out of intellectual property infringement or other claims made by third parties. These agreements may limit the time within which an indemnification claim can be made and the amount of the claim. In addition, the Company has entered into indemnification agreements with its officers and directors. It is not possible to determine the maximum potential amount under these indemnification agreements due to the limited history of prior indemnification claims and the unique facts and circumstances involved in each particular agreement. The Company has not recorded any liability for costs related to indemnification as of June 30, 2015.
Legal Proceedings— On December 12, 2013, a class action complaint was filed against the Company and certain of its officers in the United States District Court for the Central District of California (the “Court”) captioned Roberti v.
F-27
OSI SYSTEMS, INC. AND SUBSIDIARIES
NOTES TO CONSOLIDATED FINANCIAL STATEMENTS—(Continued)
OSI Systems, Inc., et al. (the “Securities Class Action”). The Amended Complaint in the Securities Class Action, filed on May 20, 2014, alleges that the Company and the individual defendants violated the Exchange Act by misrepresenting or failing to disclose facts concerning the status of the Security division’s efforts to develop automated threat recognition software and the alleged use of unapproved parts in its baggage scanning systems in violation of its contract with the U.S. Transportation Security Administration (the “TSA”). The Amended Complaint also asserts that the individual defendants allegedly sold stock based on material non-public information. Following a mediation and further post-mediation settlement discussions, the parties to the litigation accepted settlement terms proposed by the mediator and entered into a stipulation and agreement of settlement (the “Settlement”), which was filed with the Court on August 21, 2015. The Settlement provides for the resolution of all of the pending claims in the Securities Class Action. The Company and the other defendants agreed to the Settlement Agreement to avoid further expense, inconvenience, and the distraction and inherent risks of burdensome and protracted litigation. Neither the Company nor the individual defendants conceded any wrongdoing or liability, and continue to believe that they have meritorious defenses to all claims alleged in the Securities Class Action. Pursuant to the Settlement, the defendants will pay $15.0 million (the “Settlement Amount”) for a full and complete release of all claims that were or could have been asserted against the Company or the other defendants in the Securities Class Action. The Company expects that the Settlement Amount will be fully covered and funded by the Company’s insurers pursuant to the applicable insurance policies. The Settlement remains subject to preliminary and final approval by the Court and certain other conditions, including notice to all class members.
Three shareholder derivative complaints (the “Derivative Actions”) have also been filed purportedly on behalf of the Company against the members of the Company’s Board of Directors (as individual defendants). Hagan v. Chopra et al. was filed in the Court on April 15, 2014, and was subsequently consolidated by the Court with City of Irving Benefit Plan v. Chopra et al., which was filed on December 29, 2014. Kocen v. Chopra et al. was filed in the Delaware Court of Chancery on July 14, 2015. The Derivative Actions generally assert the same factual allegations as those at issue in the related Securities Class Action and purport to allege claims for breach of fiduciary duties and unjust enrichment against the individual defendants on behalf of the Company. Plaintiffs in the Derivative Actions seek unspecified damages, restitution, injunctive relief, attorneys’ and experts’ fees, costs, expenses, and other unspecified relief. While the Company believes that the Derivative Actions are without merit and intends to defend the litigation vigorously, the Company expects to incur costs associated with the defense of the actions. At this early stage of litigation, the ultimate outcomes of the Derivative Actions are uncertain and the Company cannot reasonably predict the timing or outcomes, or estimate their effect, if any, on its financial statements.
The Company is involved in various other claims and legal proceedings arising in the ordinary course of business. In the Company’s opinion after consultation with legal counsel, the ultimate disposition of such proceedings is not likely to have a material adverse effect on its business, financial condition, results of operations or cash flows. The Company has not accrued for loss contingencies relating to such matters because it believes that, although unfavorable outcomes in the proceedings may be possible, they are not considered by management to be probable or reasonably estimable. If one or more of these matters are resolved in a manner adverse to the Company, the impact on the Company’s business, financial condition, results of operations and/or liquidity could be material.
Other Matters— On December 5, 2013, the Company’s Security division was notified by the TSA that a delivery order that it had received on September 26, 2013, for baggage and handling inspection systems was being terminated for default. The termination resulted from the use of an upgraded X-ray generator component. While the component had been vetted by the Security division’s internal quality assurance, the Security division had not met the contractual requirement of obtaining the TSA’s approval in advance. The upgraded X-ray generator component has since been approved for use by the TSA. The termination resulted in a claim by the TSA for compensation. This matter was resolved by mutual agreement in April 2015.
F-28
OSI SYSTEMS, INC. AND SUBSIDIARIES
NOTES TO CONSOLIDATED FINANCIAL STATEMENTS—(Continued)
10. STOCKHOLDERS’ EQUITY
Stock Repurchase Program
The Company’s Board of Directors has authorized a Common Stock repurchase program. During fiscal 2013, 2014 and 2015, the Company repurchased 200,732 shares, 165,845 shares and 454,635 shares, respectively, under this program. As of June 30, 2015, 764,560 shares were available for additional repurchase under the program. Upon repurchase, the shares were restored to the status of authorized but unissued shares in the accompanying Consolidated Financial Statements.
11. RELATED‑PARTY TRANSACTIONS
In 1994, the Company, together with an unrelated company, formed ECIL‑Rapiscan Security Products Limited, a joint venture organized under the laws of India. The Company owns a 36% interest in the joint venture, the Company’s Chairman and Chief Executive Officer owns a 10.5% interest, and the Company’s Executive Vice President and Director owns a 4.5% ownership interest. The Company’s initial investment was approximately $0.1 million. For the years ended June 30, 2013 and 2015, the Company’s equity earnings in the joint venture were approximately $0.1 million and $0.1 million, respectively. There was no equity earnings in the joint venture recognized for the year ended June 30, 2014. The Company, its Chairman and Chief Executive Officer and the Company’s Executive Vice President and Director collectively control less than 50% of the board of directors voting power in the joint venture. As a result, the Company accounts for the investment under the equity method of accounting. The joint venture was formed for the purpose of the manufacture, assembly, service and testing of security and inspection systems and other products. Some of the Company’s subsidiaries are suppliers to the joint venture partner, which in turn manufactures and sells the resulting products. Sales to the joint venture partner for fiscal 2013, 2014 and 2015 were approximately $5.7 million, $5.2 million and $7.3 million, respectively. Receivables from the joint venture were $0.6 million and $2.7 million as of June 30, 2014 and 2015, respectively.
The Company has contracted with entities owned by its Chief Executive Officer and/or his family members to provide messenger service, auto rental and printing services. Such expenses for fiscal 2013 and 2014 were approximately $76,000 and $31,000, respectively; while there were no expenses during fiscal 2015.
12. EMPLOYEE BENEFIT PLANS
Employee Retirement Savings Plans
The Company has various qualified employee retirement savings plans. Participants can contribute certain amounts to the plans and the Company matches a certain portion of employee contributions. The Company contributed approximately $3.7 million, $4.1 million and $4.5 million to the plans for the fiscal years ended June 30, 2013, 2014 and 2015, respectively.
Deferred Compensation Plan
The Company has a deferred compensation plan, which meets the requirements for deferred compensation under Section 409A of the Internal Revenue Code. The plan provides that selected employees are eligible to defer up to 80% of their salaries and up to 100% of their bonuses. The Company may also make employer contributions to participant accounts in certain circumstances. The benefits under this plan are unsecured. Participants are generally eligible to receive payment of their vested benefit at the end of their elected deferral period or after termination of their employment for any reason or at a later date to comply with the restrictions of Section 409A. Discretionary Company contributions and the related earnings are subject to a vesting schedule dependent upon years of service to the Company and, also, vest completely upon
F-29
OSI SYSTEMS, INC. AND SUBSIDIARIES
NOTES TO CONSOLIDATED FINANCIAL STATEMENTS—(Continued)
the participant’s disability or death while employed by the Company or immediately prior to a change of control. The Company made contributions of $0.6 million, $0.6 million and $0.7 million during fiscal year 2013, 2014 and 2015, respectively. As of June 30, 2015, the Company held assets of $14.3 million and liabilities of $14.3 million. Assets related to this plan are included in other assets and liabilities related to this plan are included in other long‑term liabilities in the consolidated balance sheets. The plan liabilities include accrued employer contributions not yet funded to the plan.
Employee Pension Plans
The Company sponsors a number of qualified and nonqualified pension plans for its employees at certain locations. In accordance with accounting standards for employee pension and postretirement benefits, the Company fully recognizes the overfunded or underfunded status of each of its defined benefit plans as an asset or liability in the consolidated balance sheets. The asset or liability equals the difference between the fair value of the plans’ assets and their benefit obligations. The liabilities associated with underfunded plans are classified as noncurrent, except to the extent the fair value of the plans’ assets is less than the plans’ estimated benefit payments over the next 12 months. The Company measures its pension and postretirement benefit plans’ assets and benefit obligations as of June 30.
The following provides a reconciliation of the changes in the plans’ benefit obligations and fair value of assets for fiscal years 2014 and 2015, and a statement of the funded status as of June 30, 2014 and 2015 (in thousands):
|
|
|
|
|
|
|
|
|
|
|
|
2014 |
|
2015 |
|
||
|
Change in Benefit Obligation |
|
|
|
|
|
|
|
|
Benefit obligation at beginning of year |
|
$ |
12,753 |
|
$ |
13,690 |
|
|
Translation adjustment |
|
|
568 |
|
|
(941) |
|
|
Service costs |
|
|
58 |
|
|
34 |
|
|
Interest costs |
|
|
697 |
|
|
671 |
|
|
Actuarial (gain) loss |
|
|
(196) |
|
|
585 |
|
|
Benefits paid |
|
|
(190) |
|
|
(143) |
|
|
Benefit obligation at end of year |
|
|
13,690 |
|
|
13,896 |
|
|
Change in Plan Assets |
|
|
|
|
|
|
|
|
Fair value of plan assets at beginning of year |
|
|
6,523 |
|
|
7,711 |
|
|
Translation adjustment |
|
|
512 |
|
|
(849) |
|
|
Actual return on plan assets |
|
|
479 |
|
|
366 |
|
|
Company contributions |
|
|
333 |
|
|
77 |
|
|
Benefits paid |
|
|
(136) |
|
|
(215) |
|
|
Fair value of plan assets at end of year |
|
|
7,711 |
|
|
7,090 |
|
|
Funded status |
|
|
(5,979) |
|
|
(6,806) |
|
|
Unrecognized net actuarial loss |
|
|
— |
|
|
— |
|
|
Net amount recognized |
|
$ |
(5,979) |
|
$ |
(6,806) |
|
|
Amount recognized in consolidated balance sheets consist of: |
|
|
|
|
|
|
|
|
Investments |
|
$ |
856 |
|
$ |
782 |
|
|
Accrued pension liability |
|
|
(6,835) |
|
|
(6,829) |
|
|
Accumulated other comprehensive income |
|
|
2,752 |
|
|
2,488 |
|
F-30
OSI SYSTEMS, INC. AND SUBSIDIARIES
NOTES TO CONSOLIDATED FINANCIAL STATEMENTS—(Continued)
The following table provides the net periodic benefit costs for each of the fiscal years ended June 30, (in thousands):
|
|
|
|
|
|
|
|
|
|
|
|
|
|
|
2013 |
|
2014 |
|
2015 |
|
|||
|
Net Periodic Benefit Costs |
|
|
|
|
|
|
|
|
|
|
|
Service costs |
|
$ |
70 |
|
$ |
58 |
|
$ |
34 |
|
|
Interest costs |
|
|
635 |
|
|
697 |
|
|
671 |
|
|
Expected return on plan assets |
|
|
(360) |
|
|
(393) |
|
|
(418) |
|
|
Amortization of prior service costs |
|
|
615 |
|
|
615 |
|
|
615 |
|
|
Recognized actuarial loss |
|
|
197 |
|
|
144 |
|
|
204 |
|
|
Net periodic benefit cost |
|
$ |
1,157 |
|
$ |
1,121 |
|
$ |
1,106 |
|
Plan Assumptions
|
|
|
|
|
|
|
|
|
|
2014 |
|
2015 |
|
|
Weighted average assumptions at year-end: |
|
|
|
|
|
|
Discount rate |
|
5.1 |
% |
4.5 |
% |
|
Expected return on plan assets |
|
5.7 |
% |
5.1 |
% |
|
Rate of compensation increase |
|
3.2 |
% |
2.0 |
% |
The long term return on assets has been derived from the weighted average of assumed returns on each of the major asset categories. The weighted average is based on the actual proportion of each major asset class held, rather than a benchmark portfolio of assets. The expected returns for each major asset class have been derived from a combination of both historical market returns and current market data as well as the views of a range of investment managers.
Plan Assets and Investment Policy
|
|
|
|
|
|
|
|
|
|
|
|
|
|
Fiscal year ended |
|
Fiscal year ended |
|
||||
|
|
|
June 30, 2014 |
|
June 30, 2015 |
|
||||
|
|
|
Proportion of |
|
Expected Rate |
|
Proportion of |
|
Expected Rate |
|
|
|
|
Fair Value |
|
of Return |
|
Fair Value |
|
of Return |
|
|
Equity securities |
|
55 |
% |
8 |
% |
56 |
% |
7 |
% |
|
Debt securities |
|
36 |
% |
2 |
% |
40 |
% |
2 |
% |
|
Other |
|
9 |
% |
5 |
% |
4 |
% |
4 |
% |
|
Combined |
|
100 |
% |
5.7 |
% |
100 |
% |
5.1 |
% |
The defined benefit plans’ assets are invested in a range of pooled investment funds that provide access to a diverse range of asset classes. The investment objective is to maximize the investment return over the long term without exposing the fund to an unnecessary level of risk. Within this objective, it is recognized that benefits will be secured by the purchase of annuities at the time of employee retirement.
The benchmark is to hold assets in both equity and debt securities. The proportion in each investment class is not mandated and is allowed to fluctuate with market movements. The equity holdings are maintained in balanced funds under the control of investment managers.
Day‑to‑day equities selection decisions are delegated to investment managers, although these are monitored against performance and risk targets. Due to the nature of the pooled funds, there are no significant holdings in any single company (greater than 5% of the total assets). The investment strategy is reviewed on a regular basis, based on the results of third‑party liability studies.
F-31
OSI SYSTEMS, INC. AND SUBSIDIARIES
NOTES TO CONSOLIDATED FINANCIAL STATEMENTS—(Continued)
Projected Benefit Payments
The following table reflects estimated benefits payments, based upon the same assumptions used to measure the benefit obligation and net pension cost, as of June 30, 2015 (in thousands):
|
|
|
|
|
|
|
|
|
Pension Benefits |
|
|
|
July 1, 2015 to June 30, 2016 |
|
$ |
153 |
|
|
July 1, 2016 to June 30, 2017 |
|
|
179 |
|
|
July 1, 2017 to June 30, 2018 |
|
|
233 |
|
|
July 1, 2018 to June 30, 2019 |
|
|
289 |
|
|
July 1, 2019 to June 30, 2020 |
|
|
1,797 |
|
|
July 1, 2020 to June 30, 2025 |
|
|
6,784 |
|
Company Contribution
As of June 30, 2015, the Company’s weighted average contribution rate is 1% of pensionable salaries. If Company contributions continue at the current rate, the estimated total Company contributions for fiscal 2016 will be approximately $0.1 million.
13. SEGMENT INFORMATION
The Company has determined that it operates in three identifiable industry segments: (a) security and inspection systems (Security division), (b) medical monitoring and anesthesia systems (Healthcare division) and (c) optoelectronic devices and manufacturing (Optoelectronics and Manufacturing division). The Company also has a corporate segment (Corporate) that includes executive compensation and certain other general and administrative expenses; expenses related to stock issuances and legal, audit and other professional service fees not allocated to product segments. Both the Security and Healthcare divisions comprise primarily end‑product businesses whereas the businesses of the Optoelectronics and Manufacturing division primarily supply components and subsystems to original equipment manufacturers, including to the Security and Healthcare divisions. Sales between divisions are at transfer prices that approximate market values. All other accounting policies of the segments are the same as described in Note 1, Summary of Significant Accounting Policies.
The following tables present the operations and identifiable assets by industry segment (in thousands):
|
|
|
|
|
|
|
|
|
|
|
|
|
|
|
|
|
|
|
|
|
|
|
|
2013 |
|
||||||||||||||||
|
|
|
|
|
|
|
|
|
Optoelectronics |
|
|
|
|
|
|
|
|
|
|
|
|
|
|
|
|
|
|
|
|
and |
|
|
|
|
|
|
|
|
|
|
|
|
|
|
Security |
|
Healthcare |
|
Manufacturing |
|
|
|
|
|
|
|
|
|
|
|||
|
|
|
Division |
|
Division |
|
Division |
|
Corporate |
|
Eliminations |
|
Consolidated |
|
||||||
|
Revenues: |
|
|
|
|
|
|
|
|
|
|
|
|
|
|
|
|
|
|
|
|
External customer revenue |
|
$ |
372,164 |
|
$ |
231,331 |
|
$ |
198,552 |
|
$ |
— |
|
$ |
— |
|
$ |
802,047 |
|
|
Revenue between product segments |
|
|
— |
|
|
— |
|
|
40,548 |
|
|
— |
|
|
(40,548) |
|
|
— |
|
|
Total revenues |
|
$ |
372,164 |
|
$ |
231,331 |
|
$ |
239,100 |
|
$ |
— |
|
|
(40,548) |
|
$ |
802,047 |
|
|
Income (loss) from operations |
|
$ |
43,748 |
|
$ |
25,224 |
|
$ |
18,213 |
|
$ |
(14,002) |
|
$ |
1,255 |
|
$ |
74,438 |
|
|
Segments assets |
|
$ |
519,081 |
|
$ |
192,994 |
|
$ |
156,784 |
|
$ |
79,372 |
|
$ |
4,508 |
|
$ |
952,739 |
|
|
Capital expenditures |
|
$ |
131,314 |
|
$ |
8,198 |
|
$ |
3,185 |
|
$ |
14,670 |
|
$ |
— |
|
$ |
157,367 |
|
|
Depreciation and amortization |
|
$ |
15,412 |
|
$ |
6,674 |
|
$ |
4,169 |
|
$ |
1,252 |
|
$ |
— |
|
$ |
27,507 |
|
F-32
OSI SYSTEMS, INC. AND SUBSIDIARIES
NOTES TO CONSOLIDATED FINANCIAL STATEMENTS—(Continued)
|
|
|
|
|
|
|
|
|
|
|
|
|
|
|
|
|
|
|
|
|
|
|
|
2014 |
|
||||||||||||||||
|
|
|
|
|
|
|
|
|
Optoelectronics |
|
|
|
|
|
|
|
|
|
|
|
|
|
|
|
|
|
|
|
|
and |
|
|
|
|
|
|
|
|
|
|
|
|
|
|
Security |
|
Healthcare |
|
Manufacturing |
|
|
|
|
|
|
|
|
|
|
|||
|
|
|
Division |
|
Division |
|
Division |
|
Corporate |
|
Eliminations |
|
Consolidated |
|
||||||
|
Revenues: |
|
|
|
|
|
|
|
|
|
|
|
|
|
|
|
|
|
|
|
|
External customer revenue |
|
$ |
440,439 |
|
$ |
222,313 |
|
$ |
243,990 |
|
$ |
— |
|
$ |
— |
|
$ |
906,742 |
|
|
Revenue between product segments |
|
|
— |
|
|
— |
|
|
40,506 |
|
|
— |
|
|
(40,506) |
|
|
— |
|
|
Total revenues |
|
$ |
440,439 |
|
$ |
222,313 |
|
$ |
284,496 |
|
$ |
— |
|
|
(40,506) |
|
$ |
906,742 |
|
|
Income (loss) from operations |
|
$ |
59,501 |
|
$ |
18,495 |
|
$ |
14,663 |
|
$ |
(11,497) |
|
$ |
133 |
|
$ |
81,295 |
|
|
Segments assets |
|
$ |
535,306 |
|
$ |
190,612 |
|
$ |
169,084 |
|
$ |
120,727 |
|
$ |
(4,652) |
|
$ |
1,011,077 |
|
|
Capital expenditures |
|
$ |
38,066 |
|
$ |
6,718 |
|
$ |
2,801 |
|
$ |
7,013 |
|
$ |
— |
|
$ |
54,598 |
|
|
Depreciation and amortization |
|
$ |
40,573 |
|
$ |
7,289 |
|
$ |
4,971 |
|
$ |
1,406 |
|
$ |
— |
|
$ |
54,239 |
|
|
|
|
|
|
|
|
|
|
|
|
|
|
|
|
|
|
|
|
|
|
|
|
|
|
|
|
2015 |
|
|||||||||||||||||
|
|
|
|
|
|
|
|
|
|
Optoelectronics |
|
|
|
|
|
|
|
|
|
|
||
|
|
|
|
|
|
|
|
|
|
and |
|
|
|
|
|
|
|
|
|
|
||
|
|
|
Security |
|
Healthcare |
|
|
Manufacturing |
|
|
|
|
|
|
|
|
|
|
||||
|
|
|
Division |
|
Division |
|
|
Division |
|
Corporate |
|
Eliminations |
|
Consolidated |
|
|||||||
|
Revenues: |
|
|
|
|
|
|
|
|
|
|
|
|
|
|
|
|
|
|
|
|
|
|
External customer revenue |
|
$ |
481,087 |
|
$ |
255,691 |
|
|
$ |
221,424 |
|
$ |
— |
|
$ |
— |
|
$ |
958,202 |
|
|
|
Revenue between product segments |
|
|
— |
|
|
— |
|
|
|
46,448 |
|
|
— |
|
|
(46,448) |
|
|
— |
|
|
|
Total revenues |
|
$ |
481,087 |
|
$ |
255,691 |
|
|
$ |
267,872 |
|
$ |
— |
|
|
(46,448) |
|
$ |
958,202 |
|
|
|
Income (loss) from operations |
|
$ |
67,804 |
|
$ |
24,666 |
|
|
$ |
17,533 |
|
$ |
(17,455) |
|
$ |
(440) |
|
$ |
92,108 |
|
|
|
Segments assets |
|
$ |
470,808 |
|
$ |
223,412 |
|
|
$ |
164,922 |
|
$ |
125,174 |
|
$ |
(4,642) |
|
$ |
979,674 |
|
|
|
Capital expenditures |
|
$ |
7,601 |
|
$ |
2,628 |
|
|
$ |
3,411 |
|
$ |
1,646 |
|
$ |
— |
|
$ |
15,286 |
|
|
|
Depreciation and amortization |
|
$ |
45,231 |
|
$ |
7,223 |
|
|
$ |
5,028 |
|
$ |
1,494 |
|
$ |
— |
|
$ |
58,976 |
|
|
The following tables present the revenues and identifiable assets by geographical area (in thousands):
|
|
|
|
|
|
|
|
|
|
|
|
|
|
|
|
|
|
|
|
|
2013 |
|
|||||||||||||
|
|
|
External |
|
Intersegment |
|
Total |
|
Long lived |
|
Long lived |
|
|||||
|
|
|
revenues |
|
revenues |
|
Consolidated |
|
tangible assets |
|
assets |
|
|||||
|
Geographic region: |
|
|
|
|
|
|
|
|
|
|
|
|
|
|
|
|
|
United States |
|
$ |
441,376 |
|
$ |
15,598 |
|
$ |
456,974 |
|
$ |
35,726 |
|
$ |
132,570 |
|
|
Mexico |
|
|
78,695 |
|
|
— |
|
|
78,695 |
|
|
201,469 |
|
|
201,469 |
|
|
Other Americas |
|
|
19,674 |
|
|
— |
|
|
19,674 |
|
|
10,057 |
|
|
11,395 |
|
|
Total Americas |
|
|
539,745 |
|
|
15,598 |
|
|
555,343 |
|
|
247,252 |
|
|
345,434 |
|
|
United Kingdom |
|
|
146,261 |
|
|
— |
|
|
146,261 |
|
|
10,816 |
|
|
26,183 |
|
|
Other Europe, Middle East and Africa |
|
|
17,673 |
|
|
— |
|
|
17,673 |
|
|
699 |
|
|
5,033 |
|
|
Total EMEA |
|
|
163,934 |
|
|
— |
|
|
163,934 |
|
|
11,515 |
|
|
31,216 |
|
|
Asia-Pacific |
|
|
98,368 |
|
|
24,950 |
|
|
123,318 |
|
|
13,984 |
|
|
16,448 |
|
|
Eliminations |
|
|
— |
|
|
(40,548) |
|
|
(40,548) |
|
|
N/A |
|
|
N/A |
|
|
Total |
|
$ |
802,047 |
|
$ |
— |
|
$ |
802,047 |
|
$ |
272,751 |
|
$ |
393,098 |
|
F-33
OSI SYSTEMS, INC. AND SUBSIDIARIES
NOTES TO CONSOLIDATED FINANCIAL STATEMENTS—(Continued)
|
|
|
|
|
|
|
|
|
|
|
|
|
|
|
|
|
|
|
|
|
2014 |
|
|||||||||||||
|
|
|
External |
|
Intersegment |
|
Total |
|
Long lived |
|
Long lived |
|
|||||
|
|
|
revenues |
|
revenues |
|
Consolidated |
|
tangible assets |
|
assets |
|
|||||
|
Geographic region: |
|
|
|
|
|
|
|
|
|
|
|
|
|
|
|
|
|
United States |
|
$ |
451,503 |
|
$ |
7,303 |
|
$ |
458,806 |
|
$ |
42,933 |
|
$ |
144,239 |
|
|
Mexico |
|
|
130,330 |
|
|
— |
|
|
130,330 |
|
|
191,512 |
|
|
191,512 |
|
|
Other Americas |
|
|
20,914 |
|
|
— |
|
|
20,914 |
|
|
7,059 |
|
|
7,059 |
|
|
Total Americas |
|
|
602,747 |
|
|
7,303 |
|
|
610,050 |
|
|
241,504 |
|
|
342,810 |
|
|
United Kingdom |
|
|
151,962 |
|
|
— |
|
|
151,962 |
|
|
24,257 |
|
|
52,110 |
|
|
Other Europe, Middle East and Africa |
|
|
18,543 |
|
|
— |
|
|
18,543 |
|
|
5,807 |
|
|
10,317 |
|
|
Total EMEA |
|
|
170,505 |
|
|
— |
|
|
170,505 |
|
|
30,064 |
|
|
62,427 |
|
|
Asia-Pacific |
|
|
133,490 |
|
|
33,203 |
|
|
166,693 |
|
|
15,657 |
|
|
18,210 |
|
|
Eliminations |
|
|
— |
|
|
(40,506) |
|
|
(40,506) |
|
|
N/A |
|
|
N/A |
|
|
Total |
|
$ |
906,742 |
|
$ |
— |
|
$ |
906,742 |
|
$ |
287,225 |
|
$ |
423,447 |
|
|
|
|
|
|
|
|
|
|
|
|
|
|
|
|
|
|
|
|
|
|
2015 |
|
|||||||||||||
|
|
|
External |
|
Intersegment |
|
Total |
|
Long lived |
|
Long lived |
|
|||||
|
|
|
revenues |
|
revenues |
|
Consolidated |
|
tangible assets |
|
assets |
|
|||||
|
Geographic region: |
|
|
|
|
|
|
|
|
|
|
|
|
|
|
|
|
|
United States |
|
$ |
472,990 |
|
$ |
6,583 |
|
$ |
479,573 |
|
$ |
48,203 |
|
$ |
154,338 |
|
|
Mexico |
|
|
120,582 |
|
|
— |
|
|
120,582 |
|
|
154,939 |
|
|
154,939 |
|
|
Other Americas |
|
|
21,035 |
|
|
— |
|
|
21,035 |
|
|
6,158 |
|
|
6,158 |
|
|
Total Americas |
|
|
614,607 |
|
|
6,583 |
|
|
621,190 |
|
|
209,300 |
|
|
315,435 |
|
|
United Kingdom |
|
|
159,127 |
|
|
333 |
|
|
159,460 |
|
|
31,467 |
|
|
58,594 |
|
|
Other Europe, Middle East and Africa |
|
|
31,238 |
|
|
— |
|
|
31,238 |
|
|
1,472 |
|
|
14,323 |
|
|
Total EMEA |
|
|
190,365 |
|
|
333 |
|
|
190,698 |
|
|
32,939 |
|
|
72,917 |
|
|
Asia-Pacific |
|
|
153,230 |
|
|
39,532 |
|
|
192,762 |
|
|
14,320 |
|
|
16,787 |
|
|
Eliminations |
|
|
— |
|
|
(46,448) |
|
|
(46,448) |
|
|
N/A |
|
|
N/A |
|
|
Total |
|
$ |
958,202 |
|
$ |
— |
|
$ |
958,202 |
|
$ |
256,559 |
|
$ |
405,139 |
|
Pursuant to Accounting Standards Codification 280 “Segment Reporting,” external revenues are attributed to individual countries based upon the location of the Company’s selling entity.
* * * * * *
F-34
SCHEDULE II—VALUATION AND QUALIFYING ACCOUNTS
(in thousands)
|
|
|
|
|
|
|
|
|
|
|
|
|
|
|
|
|
|
|
|
|
|
|
|
Additions |
|
|
|
|
|
|
|
||||
|
|
|
Balance at |
|
Charged |
|
Charged |
|
|
|
|
Balance at |
|
||||
|
|
|
beginning |
|
to costs |
|
in other |
|
Deductions- |
|
end of |
|
|||||
|
Description |
|
of period |
|
and expenses |
|
accounts |
|
Write-offs |
|
period |
|
|||||
|
Balance for doubtful accounts: |
|
|
|
|
|
|
|
|
|
|
|
|
|
|
|
|
|
Year ended June 30, 2013 |
|
$ |
5,054 |
|
$ |
3,563 |
|
$ |
— |
|
$ |
1,340 |
|
$ |
7,277 |
|
|
Year ended June 30, 2014 |
|
$ |
7,277 |
|
$ |
193 |
|
$ |
— |
|
$ |
1,779 |
|
$ |
5,691 |
|
|
Year ended June 30, 2015 |
|
$ |
5,691 |
|
$ |
340 |
|
$ |
— |
|
$ |
131 |
|
$ |
5,900 |
|
|
Balance for warranty reserve: |
|
|
|
|
|
|
|
|
|
|
|
|
|
|
|
|
|
Year ended June 30, 2013 |
|
$ |
17,562 |
|
$ |
1,948 |
|
$ |
— |
|
$ |
6,620 |
|
$ |
12,890 |
|
|
Year ended June 30, 2014 |
|
$ |
12,890 |
|
$ |
5,573 |
|
$ |
— |
|
$ |
6,540 |
|
$ |
11,923 |
|
|
Year ended June 30, 2015 |
|
$ |
11,923 |
|
$ |
6,043 |
|
$ |
— |
|
$ |
5,228 |
|
$ |
12,738 |
|
F-35
Pursuant to the requirements of Section 13 or 15(d) of the Securities Exchange Act of 1934, the registrant has caused this report to be signed on its behalf by the undersigned, thereunto duly authorized.
|
|
|
|
|
|
OSI SYSTEMS, INC. |
|
|
|
|
|
|
Date: August 24, 2015 |
By: |
/s/ Alan Edrick |
|
|
|
Alan Edrick, |
POWER OF ATTORNEY
KNOW ALL PERSONS BY THESE PRESENTS, that each person whose signature appears below does hereby constitute and appoint Deepak Chopra, Alan Edrick and Victor Sze, and each of them singly, our true and lawful attorneys with full power to them, and each of them singly, to sign for us and in our names in the capacities indicated below, the Form 10‑K filed herewith and any and all amendments to said Form 10‑K, and generally to do all such things in our names and in our capacities as officers and directors to enable OSI Systems, Inc. to comply with the provisions of the Securities Exchange Act of 1934, as amended, and all requirements of the Securities and Exchange Commission in connection therewith, hereby ratifying and confirming our signatures as they may be signed by our said attorneys, or any of them, to said Form 10‑K and any and all amendments thereto.
Pursuant to the requirements of the Securities Exchange Act of 1934, this report has been signed below by the following persons, on behalf of the registrant, and in the capacities and on the dates indicated.
|
|
|
|
|
|
|
|
|
|
|
|
|
|
|
Name |
|
Title |
|
Date |
||||||||
|
|
|
|
|
|
||||||||
|
/s/ Deepak Chopra Deepak Chopra |
|
Chairman of the Board, |
|
August 24, 2015 |
||||||||
|
|
|
|
|
|
||||||||
|
/s/ Alan Edrick Alan Edrick |
|
Executive Vice President and Chief |
|
August 24, 2015 |
||||||||
|
|
|
|
|
|
||||||||
|
/s/ Ajay Mehra Ajay Mehra |
|
Executive Vice President and Director |
|
August 24, 2015 |
||||||||
|
|
|
|
|
|
||||||||
|
/s/ William F. Ballhaus, Jr. William F. Ballhaus, Jr. |
|
Director |
|
August 24, 2015 |
||||||||
|
|
|
|
|
|
||||||||
|
/s/ David T. Feinberg David T. Feinberg |
|
Director |
|
August 24, 2015 |
||||||||
|
|
|
|
|
|
||||||||
|
/s/ Steven C. Good Steven C. Good |
|
Director |
|
August 24, 2015 |
||||||||
|
|
|
|
|
|
||||||||
|
/s/ Meyer Luskin Meyer Luskin |
|
Director |
|
August 24, 2015 |
||||||||
II-1
INDEX TO EXHIBITS
|
|
|
|
|
|
No. |
|
EXHIBIT |
|
|
3.1 |
|
Certificate of Incorporation of OSI Systems, Inc. (1) |
|
|
3.2 |
|
Bylaws of OSI Systems, Inc. (1) |
|
|
4.1 |
|
Form of Common Stock Certificate (1) |
|
|
10.1† |
|
Amended and Restated OSI Systems, Inc. Deferred Compensation Plan (2) |
|
|
10.2† |
|
OSI Systems, Inc. Nonqualified Defined Benefit Plan (3) |
|
|
10.3† |
|
Amended and Restated OSI Systems, Inc. 2008 Employee Stock Purchase Plan (4) |
|
|
10.4† |
|
Form of Indemnification Agreement for Directors and Executive Officers of OSI Systems, Inc. (5) |
|
|
10.5 |
|
Credit Agreement dated October 15, 2010, between Wells Fargo Bank, N.A. and OSI Systems, Inc. (6) |
|
|
10.6 |
|
First Amendment to Credit Agreement dated November 10, 2011, between Wells Fargo Bank, N.A. and OSI Systems, Inc. (7) |
|
|
10.7 |
|
Second Amendment to Credit Agreement dated December 15, 2011, between Wells Fargo Bank, N.A. and OSI Systems, Inc. (8) |
|
|
10.8 |
|
Third Amendment to Credit Agreement dated April 10, 2012, between Wells Fargo Bank, N.A. and OSI Systems, Inc. (9) |
|
|
10.9 |
|
Fourth Amendment to Credit Agreement dated May 28, 2014 between Wells Fargo Bank, N.A. and OSI Systems, Inc. (10) |
|
|
10.10† |
|
Amended and Restated 2006 Equity Participation Plan of OSI Systems, Inc. (11) |
|
|
10.11† |
|
Employment Agreement effective as of January 1, 2012 between Deepak Chopra and OSI Systems, Inc. (12) |
|
|
10.12† |
|
Employment Agreement effective as of January 1, 2012 between Alan Edrick and OSI Systems, Inc. (12) |
|
|
10.13† |
|
Employment Agreement effective as of January 1, 2012 between Ajay Mehra and OSI Systems, Inc. (12) |
|
|
10.14† |
|
Employment Agreement effective as of January 1, 2012 between Victor Sze and OSI Systems, Inc. (12) |
|
|
10.15† |
|
Employment Agreement effective as of January 1, 2012 between Manoocher Mansouri and OSI Optoelectronics Inc. (12) |
|
|
10.16† |
|
Retirement Benefit Award Agreement effective as of January 1, 2012 between Deepak Chopra and OSI Systems, Inc. (13) |
|
|
10.17† |
|
OSI Systems, Inc. 2012 Incentive Award Plan (14) |
|
|
10.18† |
|
Form of Restricted Stock Award Agreement (15) |
|
|
10.19† |
|
Form of Restricted Stock Unit Award Agreement (15) |
|
|
10.20† |
|
Form of Stock Option Agreement (15) |
|
|
14.1 |
|
OSI Systems, Inc. Code of Ethics and Conduct (16) |
|
|
21.1* |
|
Subsidiaries of the Company |
|
|
23.1* |
|
Consent of Independent Registered Public Accounting Firm |
|
|
24.1* |
|
Power of Attorney (included on the signature page of this Form 10‑K) |
|
|
31.1* |
|
Certification Pursuant to Section 302 |
|
|
31.2* |
|
Certification Pursuant to Section 302 |
|
|
32.1* |
|
Certification Pursuant to Section 906 |
|
|
32.2* |
|
Certification Pursuant to Section 906 |
|
|
101.1 |
|
The following financial information from the Registrant’s Annual Report on Form 10‑K for the year ended June 30, 2015 formatted in XBRL, as follows: |
|
|
|
|
(i) |
the consolidated balance sheets |
|
|
|
(ii) |
the consolidated statements of operations |
|
|
|
(iii) |
the consolidated statements of comprehensive income |
|
|
|
(iv) |
the consolidated statements of stockholders’ equity |
|
|
|
(v) |
the consolidated statements of cash flows |
|
|
|
(vi) |
the notes to the consolidated financial statements, tagged in summary and detail |
*Filed herewith
†Denotes a management contract or compensatory plan or arrangement.
|
(1) |
Previously filed with our Current Report on Form 8‑K filed on March 8, 2010. |
|
(2) |
Previously filed with our Quarterly Report on Form 10‑Q filed on May 2, 2014. |
|
(3) |
Previously filed with our Current Report on Form 8‑K filed on October 10, 2008. |
|
(4) |
Previously filed with our Quarterly Report on Form 10-Q filed on October 24, 2014. |
|
(5) |
Previously filed with our Annual Report on Form 10‑K filed on August 27, 2010. |
|
(6) |
Previously filed with our Current Report on Form 8‑K filed on October 19, 2010. |
|
(7) |
Previously filed with our Current Report on Form 8‑K filed on November 10, 2011. |
|
(8) |
Previously filed with our Quarterly Report on Form 10‑Q filed on January 25, 2012. |
|
(9) |
Previously filed with our Current Report on Form 8‑K filed on April 11, 2012. |
|
(10) |
Previously filed with our Current Report on Form 8‑K filed on May 29, 2014. |
|
(11) |
Previously filed with our Current Report on Form 8‑K filed on December 1, 2010. |
|
(12) |
Previously filed with our Current Report on Form 8‑K filed on April 6, 2012. |
|
(13) |
Previously filed with our Current Report on Form 8‑K filed on May 1, 2012. |
|
(14) |
Previously filed with our Proxy Statement on Schedule 14A filed on October 23, 2012. |
|
(15) |
Previously filed with our Registration Statement on Form S‑8 filed on August 16, 2013. |
|
(16) |
Previously filed with our Current Report on Form 8‑K filed on May 13, 2014. |