Attached files
| file | filename |
|---|---|
| EX-99.1 - EX-99.1 - Samson Resources Corp | d62705dex991.htm |
| EX-10.1 - EX-10.1 - Samson Resources Corp | d62705dex101.htm |
| 8-K - FORM 8-K - Samson Resources Corp | d62705d8k.htm |
 Supplemental Materials
August 2015 Exhibit 99.2 |
 Forward-Looking & Other Cautionary Statements
2 Samson Resources Corporation (“Samson” or the “Company”) is making this previously undisclosed information available
to its security holders in connection with Samson’s
previously disclosed evaluations of strategic alternatives with its existing creditors. This information is not an offer or the solicitation of an offer for any transaction and may not be used or relied on in connection with any transaction. Cautionary Statement Regarding Forward-Looking Statements The information in this presentation by Samson Resources Corporation (the “Company,” “we” or “our”)
includes “forward-looking statements” within the meaning of Section 27A of the Securities Act of 1933, as amended, and Section 21E of the Securities Exchange Act of 1934, as amended. All statements
included in this presentation, other than statements of
historical fact, may constitute forward-looking statements, including, but not limited to, statements or information regarding our future growth, results of operations, operational and financial performance, business prospects and opportunities and future events. Words such as, but
not limited to, “anticipate,” “continue,”
“estimate,” “expect,” “may,” “might,” “will,” “project,” “should,” “believe,” “intend,” “continue,” “could,” “plan,”
“predict,” “potential,” “goal,” “foresee” and negatives of these words and similar expressions are intended to identify forward-looking statements. In particular, statements about
our expectations, beliefs, plans, objectives, assumptions or
future events or performance contained in this presentation are forward-looking statements.
All forward-looking statements involve risks and uncertainties. The
occurrence of the events described and the achievement of the expected results depend on many events and assumptions, some or all of which are not predictable or within our control. Factors that may cause actual results to differ from
expected results include, but are not limited to: (i) our
substantial indebtedness; (ii) our ability to refinance, restructure or amend our indebtedness or otherwise improve our capital structure and liquidity; (iii) fluctuations in oil and natural gas prices; (iv) the uncertainty inherent in estimating our reserves, future net revenues and
PV-10; (v) the timing and amount of future production of oil
and natural gas; (vi) cash flow and changes in the availability and cost of capital; (vii) environmental, drilling and other operating risks, including liability claims as a result of our oil and natural gas operations; (viii) proved and unproved drilling locations and future drilling plans; (ix)
the effects of existing and future laws and governmental
regulations, including environmental, hydraulic fracturing and climate change regulation; (x) restrictions contained in our debt agreements; (xi) our ability to generate sufficient cash to service our indebtedness; (xii) our ability to make acquisitions and divestitures on favorable terms or at
all; and (xiii) any of the risk factors and other cautionary
statements, including under the heading “Risk Factors,” described in the Company’s Annual Report on form 10-K for the year ended December 31, 2014, and in the other documents and reports we file from time to time with the Securities and Exchange Commission. Readers are cautioned not to place undue reliance on forward-looking statements. Should one or more of the risks or uncertainties
referenced above occur, or should underlying assumptions prove
incorrect, our actual results and plans could differ materially from those expressed in any forward-looking statements. Further, new factors that could cause actual results to differ materially from those described in forward-looking statements emerge from time to time, and
it is not possible to predict all such factors, or the extent to
which any such factor or combination of factors may cause actual results to differ from those contained in any forward-looking statement.
Each forward-looking statement speaks only as of the
date of this presentation, and, except as otherwise required by applicable law, we disclaim any duty to update any forward-looking statements, all of which are expressly qualified by the statements in this section, to reflect events or
circumstances after the date of this presentation. The attached is a compilation of three sets of materials which were presented to (a) certain holders of under the Second Lien Term Loan
Credit Agreement and (b) a group of holders of Senior Notes due
2020 under the Senior Notes Indenture in June, July, and August of 2015. Non-GAAP Disclosures
This presentation refers to certain non-GAAP financial
measures. Definitions of these measures and reconciliation between U.S. GAAP and non-GAAP financial measures are included at the end of this presentation.
|
 Table of Contents
Business Plan Key Elements
Asset Review Business Plan and Long-Term Financial Forecast A&D Considerations Appendix 3 |
 Information on the Following Pages is as of
June 2015 4 |
 Business Plan Key Elements
5 |
 Key Elements of Business Plan
6 Restructure balance sheet Complete divestiture program Restart capital program in early 2016 East Texas and Bakken provide platform • Bolt-on acquisitions in East Texas and Bakken • Take advantage of Gas Option (Haynesville) when prices improve Methodically test upside from Fort Union, Granite Wash, and Mowry Add large resource play acquisition |
 Asset Review
7 |
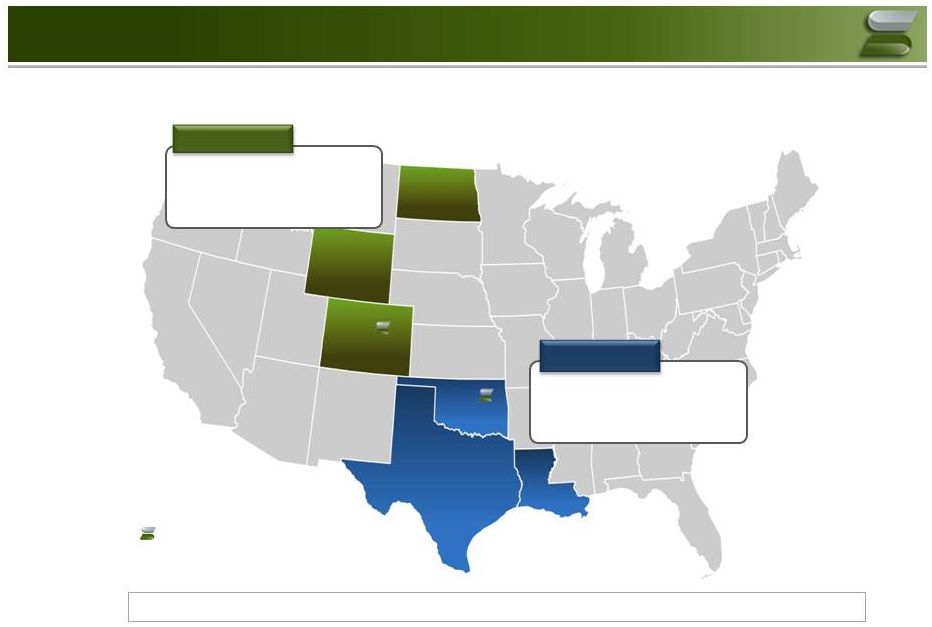 Company Overview
2014 Production: 170 MMcfe/d
Proved Reserves
(1) : 410 Bcfe Net Acreage (2) : 465,000 Gross Wells: 1,600 West Division 2014 Production: 323 MMcfe/d Proved Reserves (1) : 920 Bcfe Net Acreage (2) : 710,000 Gross Wells: 6,900 East Division Samson Corporate Offices (HQ: Tulsa, OK)
Total Co. 2014 Production
(3) : 493 MMcfe/d / Proved Reserves
: 1.26 Tcfe
with PV-10 of $1.26 Bn
(4) (1) Proved Reserves as of 12/31/2014 pro forma for divestitures through Arkoma sale.
(2) Net Acreage as of 12/31/2014 in shaded states pro forma for divestitures through Arkoma sale.
(3) 2014 production pro forma for divestures through Arkoma sale. (4) NSAI 12/31/2014 reserve report at 3/13/15 strip pricing and pro forma for Arkoma sale.
8 (1) |
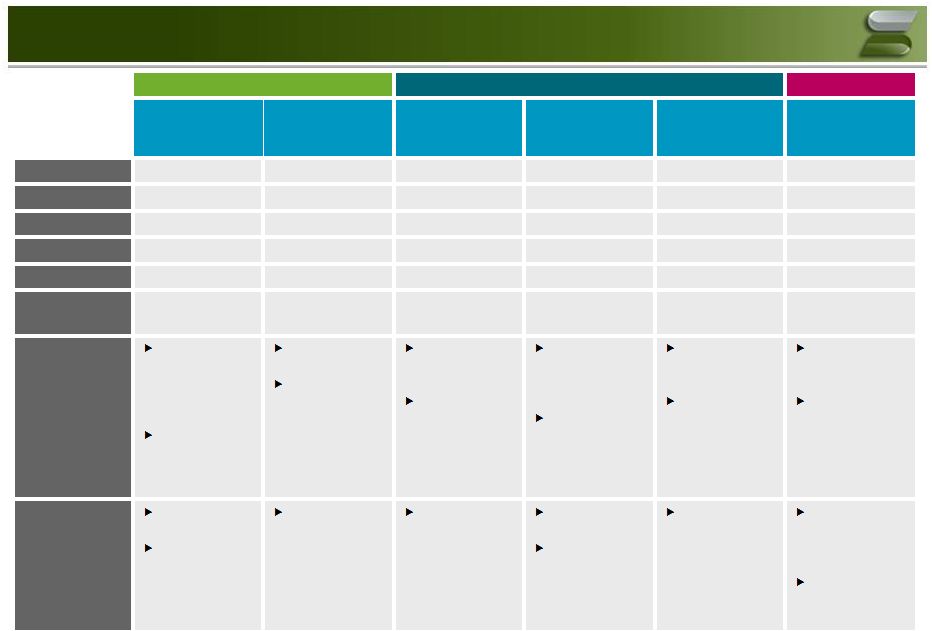 Asset Overview Core Assets Upside Assets Non-Core East Texas Williston Granite Wash / Mississippian Lime (3) Fort Union Powder River Basin / Mowry (4) Mid-Con Sales Package, Gas, Permian Proved Reserves (1) 499 Bcfe 12.2 MMboe 239 Bcfe 62 Bcfe 8.2 MMboe 406 Bcfe Pre-tax PV-10 (1) $428 MM $90 MM $219 MM $59 MM $100 MM $362 MM % PDP (2) 81% 52% 79% 70% 93% 95% 2014 Production 161 MMCFE/d 4.2 MBOE/d 100 MMCFE/d 31 MMCFE/d 4.5 MBOE/d 149 MMCFE/d Acreage 298,000 98,000 126,500 30,700 292,000 328,000 Well Count 1,670 Operated/ 1,030 NonOp 115 Operated/ 120 NonOp 700 Operated/ 1,000 NonOp 35 Operated/ 18 NonOp 150 Operated/ 345 NonOp 1,040 Operated/ 2,280 NonOp Advantages Taylor and Cotton Valley economic to drill at $3.00/Mcf gas Opportunity for bolt on acreage to increase inventory Predictable well results Changes in development strategy have yielded improved well results Active area for operating partners Continuation of Miss Lime program to be determined during 2015 Liquids-rich gas play with high impact potential Samson is the primary operator in the play Mowry has potential to be a resource play Potentially large drilling inventory Existing production can be monetized Natural buyers include royalty MLPs, non-op companies and private equity Disadvantages Heavy natural gas exposure Haynesville requires $4.00+ gas Outside of the basin’s “sweet spot” with significant Tier 2 acreage Repeatability needs to be demonstrated Constrained drilling season Repeatability needs to be proven Economic feasibility not yet demonstrated Scattered and undeveloped acreage and minerals High non-op interest ________________________________________________ (1) NSAI 12/31/2014 reserve report shown at 3/13/15 strip pricing and pro forma for Arkoma sale.
(2) Percentage of reserves. (3) Also includes Marmaton and other stacked production. (4) Future focus on Mowry; current production principally located in Frontier and Shannon/Sussex plays.
9 |
 Primary Areas of Operation
Core Assets Upside Assets Non-Core Assets Based upon the strategic review, the geographic profile of the assets is summarized below
Asset Characterization
10 Core Assets Predictability / institutional knowledge Contiguous acreage with opportunity for scale efficiency Access to midstream assets / distribution Attractive IRRs at a modest increase to strip pricing Upside Assets (Further Testing Required) Predictability needs to be proven Reasonable resource potential as techniques are perfected and consistent cost and reserves are achieved Breakeven price still to be determined Non-Core Assets Geographically dispersed Limited drilling inventory combined with low working interests Minimal PUD Reserves Generally well received in A&D market Difficult to aggregate positions |
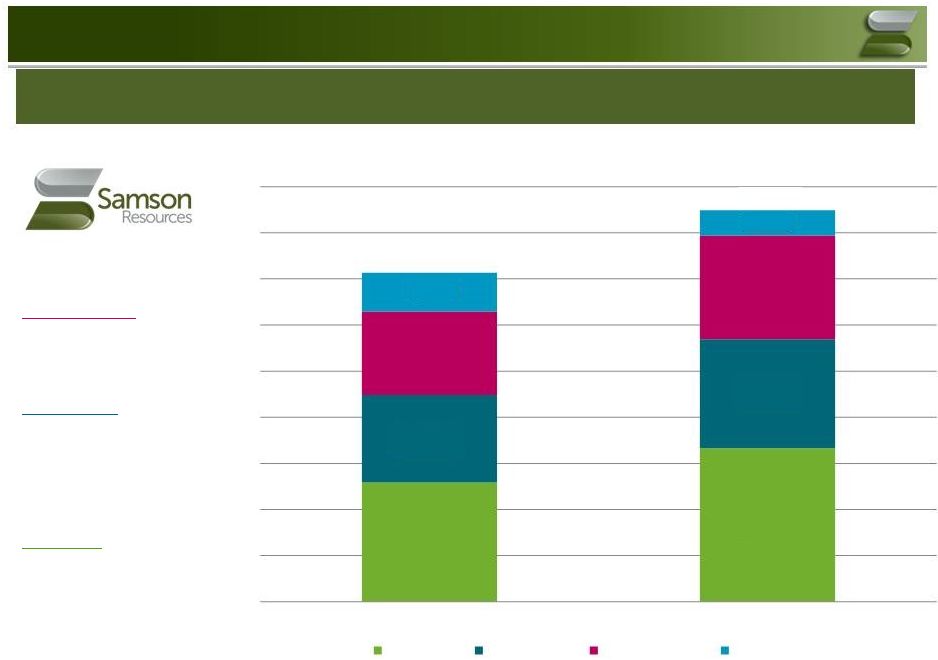 Pre-tax PV-10 Overview
Samson’s existing proved reserves at current strip have a pre-tax
PV-10 of approximately $1.4 billion (including hedges). At the
Business Plan price deck the pre-tax PV-10 increases to $1.7 billion. ________________________________________________ Non-Core Assets: • Mid-Con Sales Package • Wamsutter / San Juan • Permian Minerals Upside Assets: • Granite Wash / Mississippian Lime • Fort Union • Powder River Basin / Mowry Core Assets: • East Texas (incl. Haynesville) • Williston Pre-tax PV-10 $ in millions 11 $518 $666 $378 $473 $362 $450 $168 $109 $1,426 $1,697 – $200 $400 $600 $800 $1,000 $1,200 $1,400 $1,600 $1,800 3/13/15 Strip Business Plan Price Deck Core Assets Upside Assets Non-Core Assets Hedges Source: Company 12/31/14 reserve report run at each respective price deck and is pro forma for Arkoma sale. Note: Business Plan price deck assumes $3.50/Mcf gas and $65.00/bbl oil by year-end 2015, increasing to $3.75/$67.50 and $4.00/$70.00
in 2016 and 2017, respectively. |
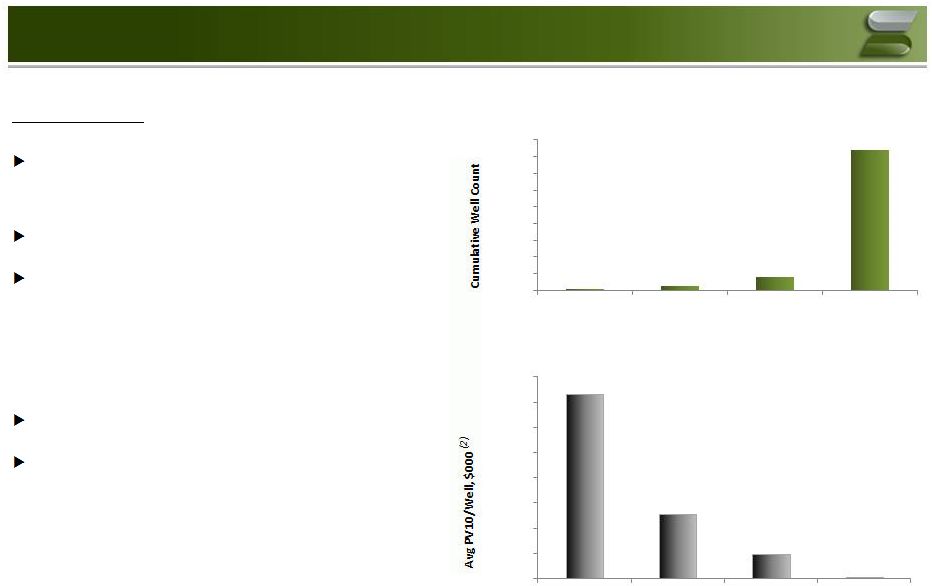 Significant Concentration of PV10
12 75% of reserve value is concentrated in less than 1,000 wells ~50% of top quartile are East Texas wells The lowest value quartile is comprised of ~8,000 wells with an average PV10 of $75,000/well however 5,000 of those wells have less than $10,000/well remaining in PV10 at recent SEC prices Average interest in bottom tier of assets is 30% Non-Core Assets (1) account for ~3,320 wells (1) Non-Core Defined as Mid-Con Sales Package, San Juan & Wamsutter
(2) SEC Pricing. Reserve Analysis 0 1,000 2,000 3,000 4,000 5,000 6,000 7,000 8,000 9,000 25% 50% 75% 100% % of Reserves Present Value 75% of PV10 Concentrated in <1000 Wells $0 $1,000 $2,000 $3,000 $4,000 $5,000 $6,000 $7,000 $8,000 25% 50% 75% 100% % of Reserves Present Value |
 Improving Margins
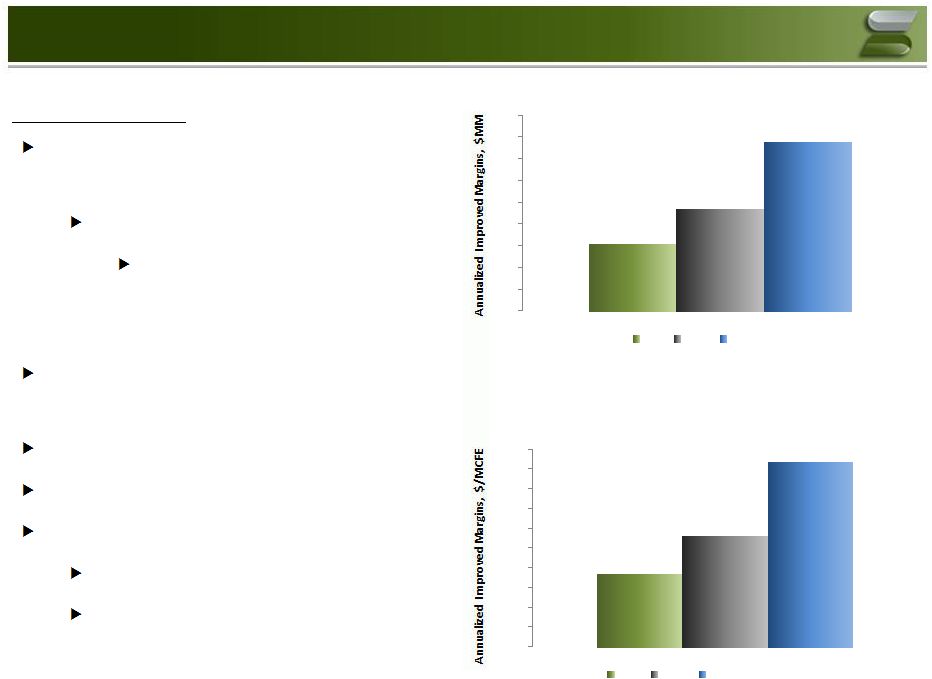
Cost reduction initiatives have resulted in
approximately $80 MM of annualized savings
375 total headcount reduction
Impacted positions include
management, technical, back office
& field operations
Closed small offices in The Woodlands &
Oklahoma City
Reduced ~100 vehicles from fleet
Consolidation of technical software applications
Shut in ~ 1,000 negative cash flow wells
~30% of gross operated well count
Less than 2% of 1
quarter net production
Cost Reduction Efforts
Savings Calculations exclude one time costs associated with debt
restructuring and other one time costs such as severance payments. $29 - $34 $45-$50 $74 -$84 $0 $10 $20 $30 $40 $50 $60 $70 $80 $90 Annualized Improved Margins LOE G&A Total $0.17 - $0.20 $0.27 - $0.30 $0.44 - $0.50 $0.00 $0.05 $0.10 $0.15 $0.20 $0.25 $0.30 $0.35 $0.40 $0.45 $0.50 $/MCFE Improved Margins LOE G&A Total $/MCFE 13 st |
 Core Assets 14 |
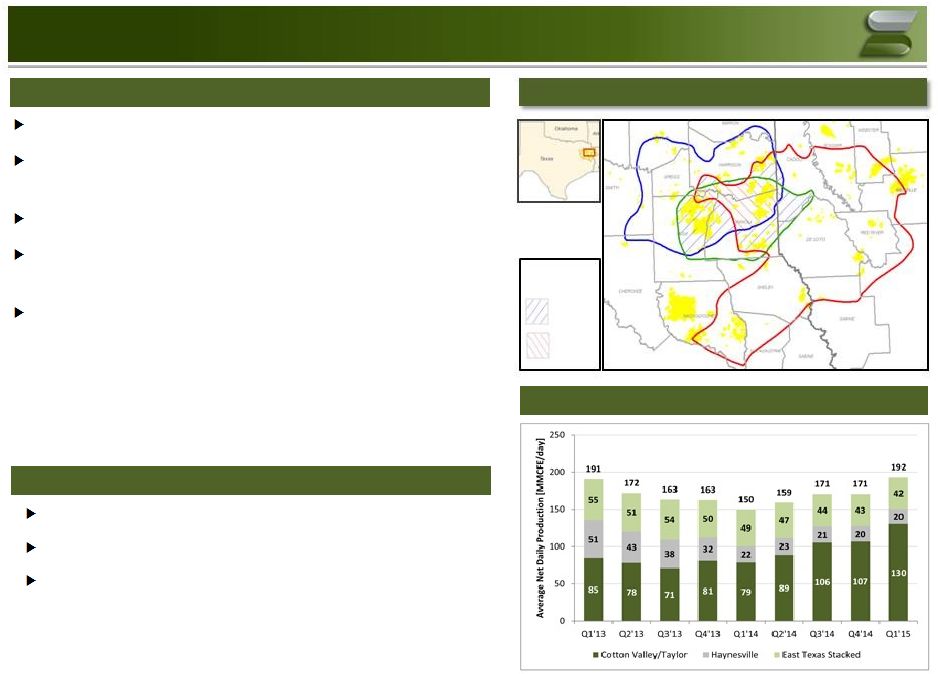 Asset delivers growth opportunity at consistent returns
Optimizing legacy leasehold position through horizontal
development of the Cotton Valley sands
Industry leader in East Texas Cotton Valley sand development
Exposure to significant resource in Haynesville at improved
prices Ability to add to position through acquisitions and leasing (1) Assumes 3/13/15 strip. Overview Overview Key Statistics Key Statistics Acreage Position Acreage Position Historical Production Historical Production East Texas: Summary 2014 Production: 161 MMcfe/d (15% Liquids) Net Acreage: 298,000 PV-10 Value: $428 Million (1) Taylor Upper CV Haynesville Two Three Stacked Formations 15 |
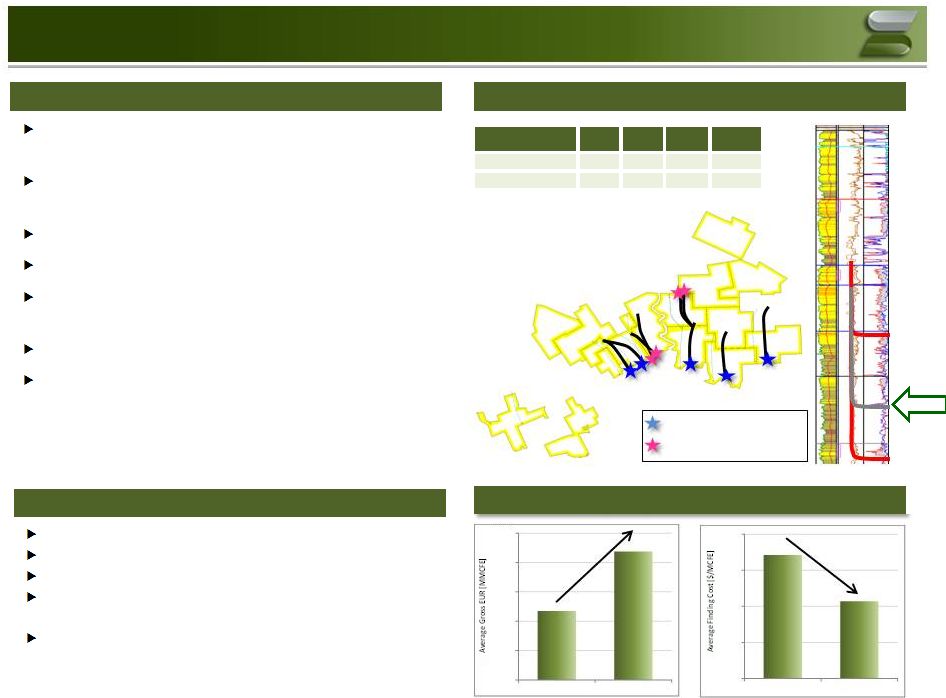 Subsurface model developed to maximize
performance Maximizing recovery through optimized lateral placement Well spacing based upon resource in place Identified liquids rich condensate fairways Improved drilling and completion techniques allowing for extended lateral lengths Exploiting vertical fields with horizontal infill program Leveraging existing infrastructure to lower facilities costs and reduce cycle times C Target (Lower Stack) B Target (Upper Stack) New Target Strategic Highlights Strategic Highlights Cotton Valley: Overview Driving Program Capital Efficiencies Driving Program Capital Efficiencies 16 SE Carthage Field CNVL Stacked C2-B2 Targets CNVL C1 Sand Target Top CNVL 1200’ to base of C2 Sand Development Optimization Development Optimization Accessing more reservoir by drilling multi-unit laterals Lateral lengths have increased by an average of 900’ Drilled longest lateral to date (8,550’) (1) in January 2015 1Q15 initial production rates averaged over 8 MMCFE/d Testing increased stimulation designs Operations Execution Operations Execution Target Type Well Count Gross Avg EUR Gross Avg CapEx Avg Finding Cost CV C1 Sand Targets 5 6,937 $6,735 $0.97 CV Stacked B2/C2 Targets 4 4,817 $6,451 $1.34 86% 37% (1) 2014 record lateral was 7,615’ effective completed length and 8,550’ from Kick off Point to TD
0 2,000 4,000 6,000 8,000 10,000 2014 2015 $0.00 $0.40 $0.80 $1.20 $1.60 2014 2015 |
 Cycle Time: 10-12 wells/rig/year
Differentials: $0.38/Mcf, $1.55/bbl, 33% NGL
LOE: Fixed $2,437/month + Variable: ($0.26/Mcf, $0.78/bw)
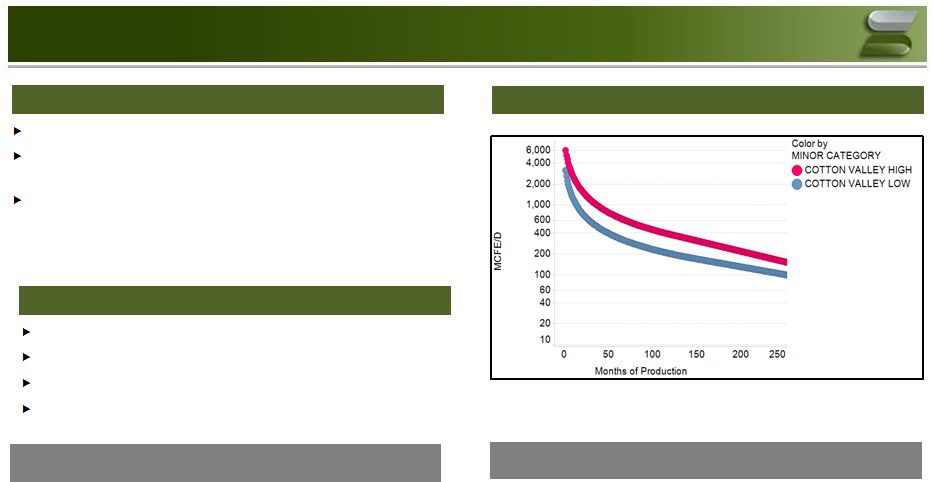
Shrink: CV High - 87% and CV Low – 98% Type Curve Breakeven Price (1) ($/mcf & $/bbl) P50 EUR (Bcfe) P50 D&C ($MM) Modeled Locations Cotton Valley High $3.05 / $56.5 5.58 $6.03 36 Cotton Valley Low $5.05 / $93.78 3.03 $6.35 296 Cotton Valley High Cotton Valley Low Well Spacing 1,500 feet 1,500 feet Avg WI 87.1% 100% Avg NRI 66.0% 76.7% Liquids 25% 21% Avg Lateral Length 5,749 ft 4,962 ft Cotton Valley High curve in line with 2014/15 single target results Cotton Valley Low curve identifies hydrocarbon in place, but is reduced for offset depletion Each location incorporating volumetric recoverable reserves estimates Cotton Valley: Inventory Type Curve Description Type Curve Description Average Well Metrics Average Well Metrics Type Curves Type Curves 17 (1) Breakeven defined as PV15 = 0; with D&C capital reduced by 15% to $5.1 MM to reflect vendor
savings. |
 Cycle Time: 10-12 wells/rig/year
Differentials: $0.38/Mcf, $2.65/bbl, 33% NGL
LOE: Fixed $2,027/month + Variable: ($0.12/Mcf, $0.22/bw)
Taylor High Taylor Med Taylor Low Well Spacing 1,500 feet 1,500 feet 1,500 feet Avg WI 100% 100% 100% Avg NRI 77.0% 79.5% 75.0% Liquids (2) 0% 0% 0% Avg Lateral Length 6,655 ft 5,786 ft 5,218 ft Type Curve Breakeven Price (1) ($/mcf & $/bbl) P50 EUR (Bcfe) P50 D&C ($MM) Modeled Locations Taylor High $2.92 / $54.22 6.05 $6.84 31 Taylor Med $3.87 / $71.87 4.28 $6.69 93 Taylor Low $8.21 / $152.47 1.89 $6.33 222 Taylor: Inventory Type Curve Description Type Curve Description Average Well Metrics Average Well Metrics Type Curves Type Curves Type Curves are truncated & high graded based on EUR Taylor High represents the top EURs available and would be the first locations drilled Each location incorporates volumetric recoverable reserves estimates 18 (1) Breakeven defined as PV15 = 0; with D&C capital reduced by 15% to $5.8 MM to reflect vendor savings. (2) Taylor produced liquids (condensate and NGL volumes) range from 16- 20% though a majority of wells are
unprocessed and settled under keepwhole contractual terms. |
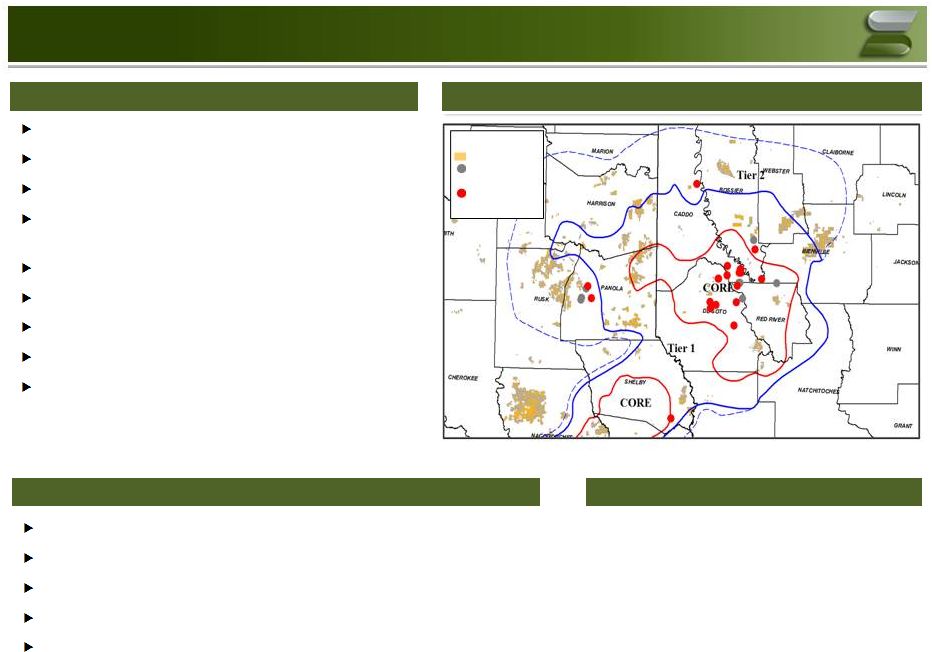 Core: >0.7 BCFE/sec/ft Tier 1: 0.5 - 0.7 BCFE/sec/ft Tier 2: <0.5 BCFE/sec/ft Increased average lateral lengths from ~4,500’ to ~6,000’ Increased average stimulation from 750 lbs/ft to 1,800 lbs/ft Increased well density from 4 to 8 wells per section 35% decrease in reported capital since start of horizontal development 200-250% increase in recovery through emerging re-stimulation Significant inventory exists in Core and Tier 1 acreage Well performance and cost reductions proven by industry Inventory economically viable at $4.00/mcfe 40% increase in offsetting well performance since 2010 largely due to evolving completion techniques Industry drilling wells at $7.5-$8.5MM Lease position allows for drilling of extended laterals Acreage positioned in liquids rich area of the play Bolt on acreage opportunities offsetting Core acreage Additional potential recovery increase via re-stimulation Haynesville: Overview Tier Definitions Tier Definitions Samson Inventory Upside Samson Inventory Upside Industry Development Enhancements Industry Development Enhancements Acreage Position Acreage Position 19 Rig Activity LEASEHOLD APRIL 2015 8 Rigs JULY 2014 19 Rigs |
 Cycle Time: 6-8 wells/rig/year
Differentials: $0.60/Mcf, $0.00/bbl, 0% NGL
LOE: Fixed $3,500/month + Variable: ($1.10/bw)
Shrink: 100% Type Curve Breakeven Price (1) ($/mcf & $/bbl) P50 EUR (Bcfe) P50 D&C ($MM) Modeled Locations Haynesville Core $4.17 / $77.40 4.77 $7.75 334 Haynesville Tier 1 $5.01 / $93.04 4.47 $8.00 81 Haynesville Tier 2 $6.03 / $112.00 4.20 $9.00 125 Haynesville Core Haynesville Tier 1 Haynesville Tier 2 Well Spacing 1,000 feet 1,000 feet 1,000 feet Avg WI 93.9% 87.0% 75.0% Avg NRI 74.6% 66.5% 57.7% Liquids 0% 0% 0% Avg Lateral Length 5,840 ft 4,633 ft 6,231 ft Haynesville Type curves were based on geologic parameters (thickness, pressure, clay content, and depth) and regional performance Type curves based on industry standard completion techniques (~1500 lbs prop/ft) versus vintage Samson completions Type Curve Description Type Curve Description Average Well Metrics Average Well Metrics Type Curves Type Curves Haynesville: Inventory (1) Breakeven defined as PV15= 0 with P50 Capital & EUR. 20 |
 Added ~44,000 net acres over the past year through targeted acquisitions
and grass roots leasing
Offset competitors identified and reviewed
- 8 Companies with sizeable and attractive positions - Greater than 560,000 net acres - Greater than 400 MMCFE/d gross operated volumes Strategic leasing program in place and can initiate with $7.5MM of funding
- Program will add 25 higher return drilling locations East Texas Acquisition Strategy Cotton Valley Cotton Valley *Based upon 01/2015 Reported Production Company Net Acres Grs Op Prod (MCFD)* A 37,500 13,500 B 35,000 60,000 C 72,000 90,000 D 135,000 80,000 E 33,400 19,000 F 28,000 30,000 G 16,000 23,000 H 207,000 95,000 Haynesville Haynesville Build upon existing Cotton Valley position leveraging technical staff and
operational presence
Anticipate larger Haynesville players to exit basin in the next several
years - 8 Companies identified - Greater than 550,000 net acres + 550,000 gross acres - Greater than 2 BCFE/d gross operated volumes Opportunities may exist to acquire assets with significant development locations at attractive valuations Company Net Acres Grs Op Prod (MCFD)* A 85,300 590,000 B 72,000 90,000 C 350,000** 375,000 D 50,000 140,000 E 206,000 420,000 F 190,000** 100,000 G 38,000 120,000 H 107,000 220,000 *Based upon 01/2015 Reported Production **Gross acreage position 21 |
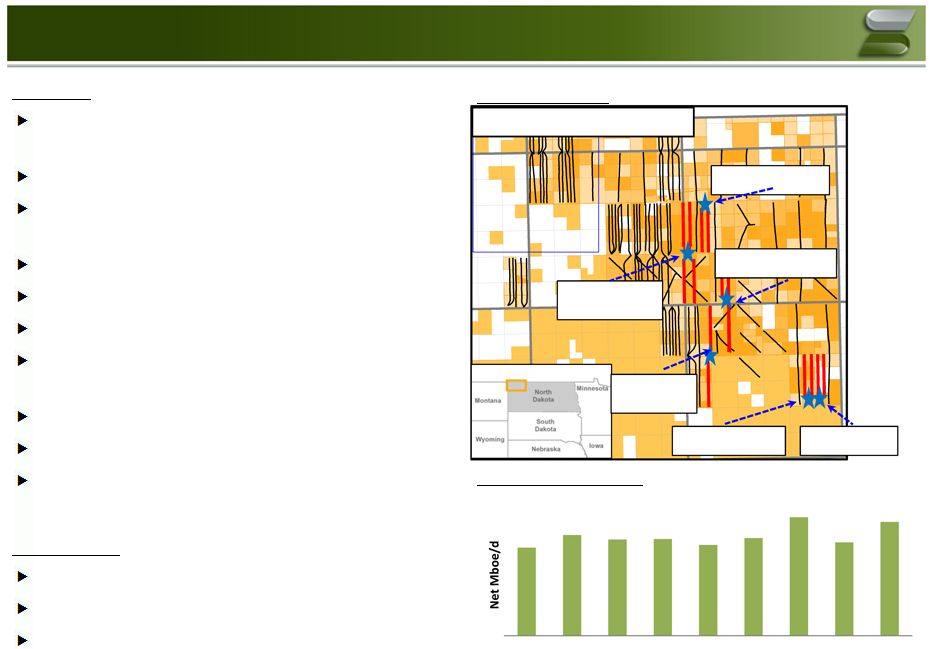 Bakken Overview Overview “Cracked the code” with change in completion methodology, IP’s 50% higher Predictable well results and costs Lower quality, higher water cut than core of basin Opportunities for bolt on acquisitions exist Optimizing performance for well spacing Continuously improve capital well costs Apply right sized artificial lift throughout well life cycle Agricultural surface owners No federal regulatory seasonal limitations Severe weather can limit operations Key Statistics 2014 Production: 4.2 Mboe/d (92% liquids) Net Acreage: 98,000 Pre-tax PV-10: $90 Million (1) Acreage Position Historical Production Beetle 3H, Strom 8H, Ranchero 2H, Coronet 8H Avg EUR 467 Mboe Ranchero 6H, Ranchero 8H First oil early May Ness 4H, Ness 6H, Odyssey 6H Avg EUR 471 Mboe Stingray 6H, Charger 8H Avg EUR 427 Mboe Dorado 6H, Dorado 8H Avg EUR ~400 Mboe Marauder 1H, Marauder 3H Avg EUR 438 Mboe Ambrose Field - Development (1) Assumes 3/13/15 strip. 3.6 4.1 3.9 4.0 3.7 4.0 4.9 3.8 4.7 Q1'13 Q2'13 Q3'13 Q4'13 Q1'14 Q2'14 Q3'14 Q4'14 Q1'15 22 |
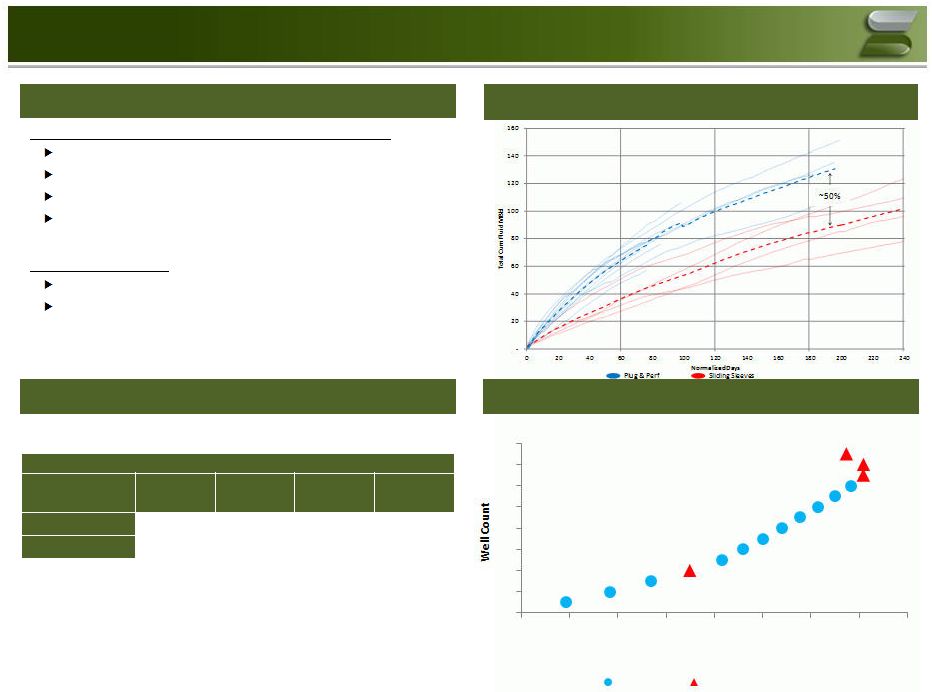 Bakken Technical Evolution
Cumulative production for first 6 months increased 50%
Multiple technical drilling/completion improvements
Changed completion to plug and perf from sliding sleeve
Optimizing well targeting, currently 1,200’ spacing vs
660’ Repeatable results throughout our acreage
position Artificial lift evolution
Utilizing jet pumps for high-rate early production
Shift to lower cost rod pumps as production declines
Bakken Highlights
Operated 2014 Spuds
(2) Wells on Production Count of Operated Wells on Production (2014 program) (1) 0 - 60 days 60 -120 days 120 -180 days 180+ days Plug & Perf 11 4 4 0 Sliding Sleeve 4 4 4 4 0 2 4 6 8 10 12 14 16 $0 $5 $10 $15 $20 $25 $30 $35 $40 Cumulative pre-tax PV-10, $ in millions Plug & Perf Sliding Sleeves ________________________________________________ Note: Data set consists of operated analogous wells. (1) As of 3/31/15. (2) Scorpion plot was run at 2014 SEC price deck. Cumulative Fluid vs. Producing Days 23 |
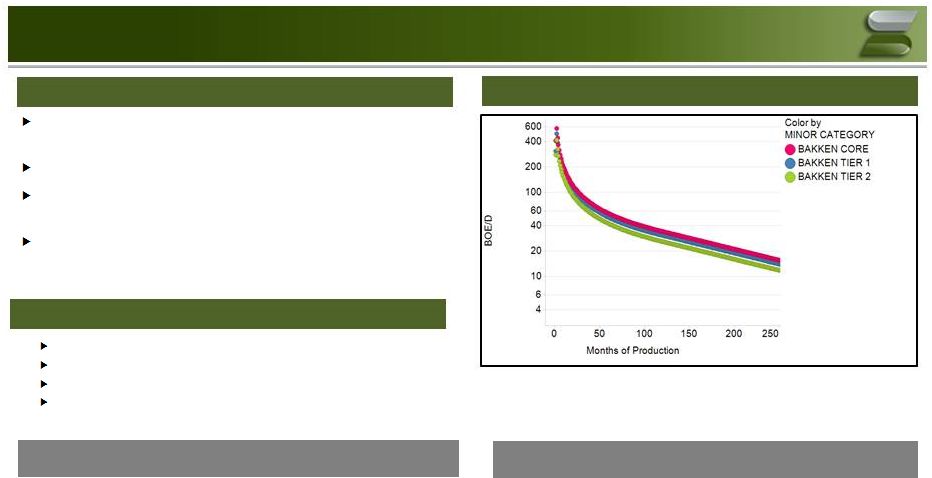 Type Curves Average Well Metrics Cycle Time: 18-24 wells/rig/year Differentials: $2.90/Mcf, $12.00/bbl, 45% NGL LOE: Fixed $13,760/month + Variable: ($0.10/bo, $1.75/bw) Shrink: 77% Type Curve Description Bakken Inventory Bakken type curves all based on Plug & Perf completion technique Bakken Core – 1,200’ spacing with higher (>40%) oil cut Bakken Tier 1 – 1,200’ spacing with lower (<40%) oil cut within operated production & increased risk factors Bakken Tier 2 – 600’ spacing – infill development program Bakken Core Bakken Tier 1 Bakken Tier 2 Well Spacing 1,200 feet 1,200 feet 600 feet Avg WI 47.2% 52.5% 47.2% Avg NRI 38.4% 43.0% 38.4% Liquids 92% 92% 92% Avg Lateral Length 10,000 ft 10,000 ft 10,000 ft Type Curve Breakeven Price (1) ($/mcf & $/bbl) P50 EUR (MBOE) P50 D&C ($MM) Modeled Locations Bakken Core $3.09/$57.50 430 $6.50 12 Bakken Tier 1 $3.32/$61.75 405 $6.50 34 Bakken Tier 2 $3.76/$70.00 345 $6.50 268 (1) Breakeven defined as PV15 = 0; with D&C capital reduced by 15% to $5.53 MM to reflect vendor savings.
24 |
 Upside Assets
25 |
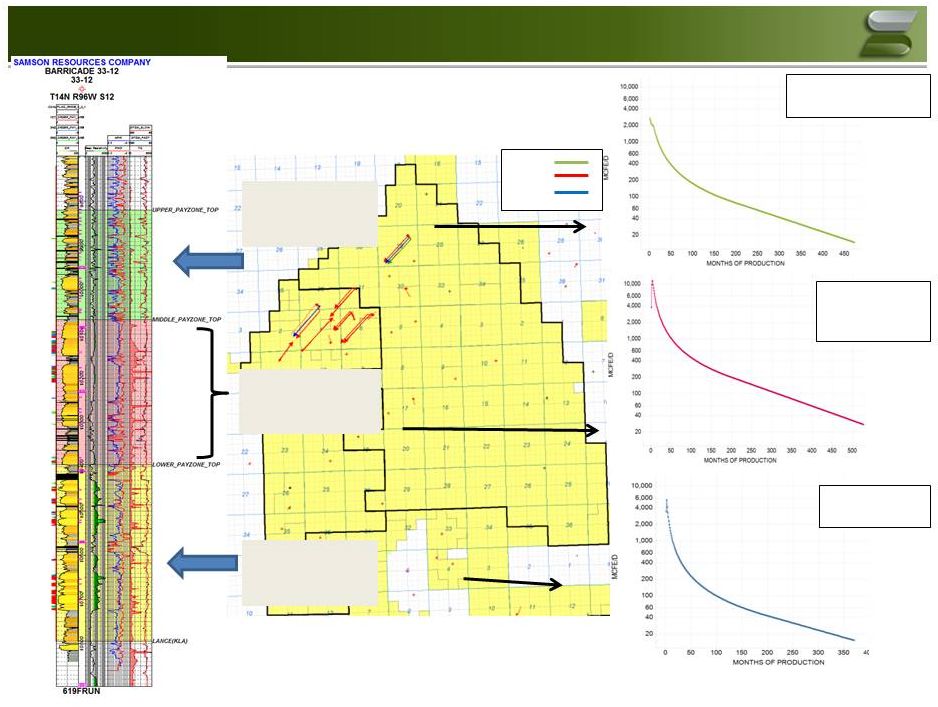 M1 M2 M3 Upper Pay Zone – 1 Target 1 Producing Well Middle Pay Zone – 3 Targets 10 Producing Wells Lower Pay Zone – 1 Target 2 Producing Wells Fort Union Geologic Overview EUR: ~2.0 BCF -Uneconomic EUR: ~7.8 BCF -Economic. -Primary target. EUR: ~2.6 BCF -Marginally economic Upper Middle Lower 26 |
 Prospect Review -
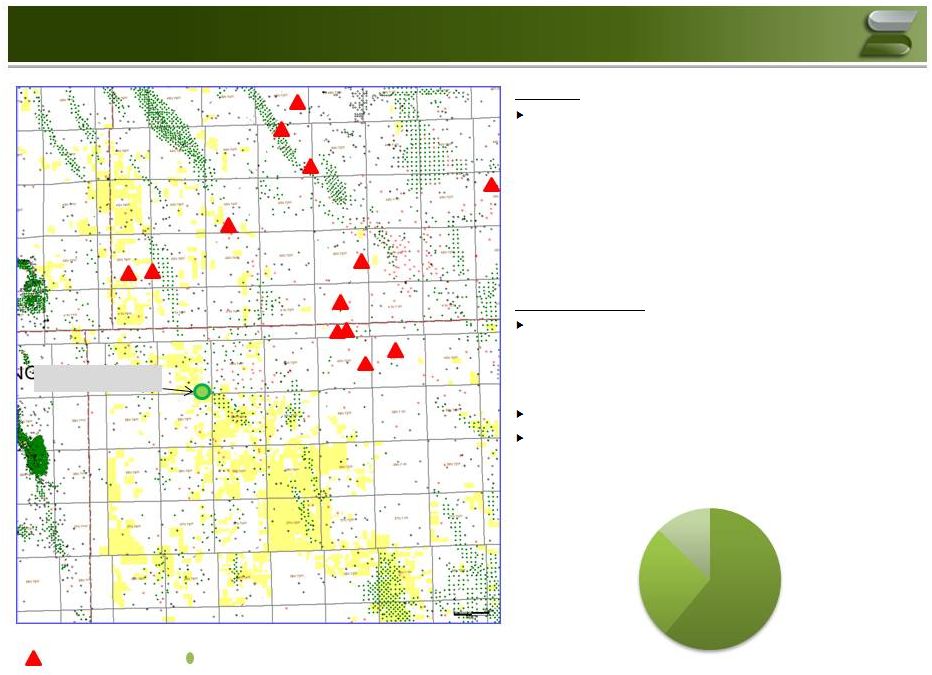
Mowry - Mowry Horizontal Wells Play Drivers and Risks Overview Emerging shale resource play • Regional marine shale documented by thousand of wells and completion tests. • Key resource play components comparable to other successful shale plays. • Significantly over-pressured. • 80+ Mowry permits in area of interest with 13 horizontal wells drilled or drilling. • Resource potential has been significantly de-risked by wells drilled
by offset operators.
Current Operations
2014 Mowry pilot well completed and producing • Successful hydraulic fracture completion and diagnostic work. • Production rate and formation pressure greater than expected. • Monitoring rates/pressure to estimate stimulated rock volume and estimate ultimate recovery from this single stage completion. Assessing economic viability and magnitude of resource Tracking ever increasing Industry activity. Mowry Pilot Well - Vertical wells to other horizons 27 HBP 61% Undeveloped 26% Expiring <12 Mo 13% Mowry Leasehold: 76,800 Net acres |
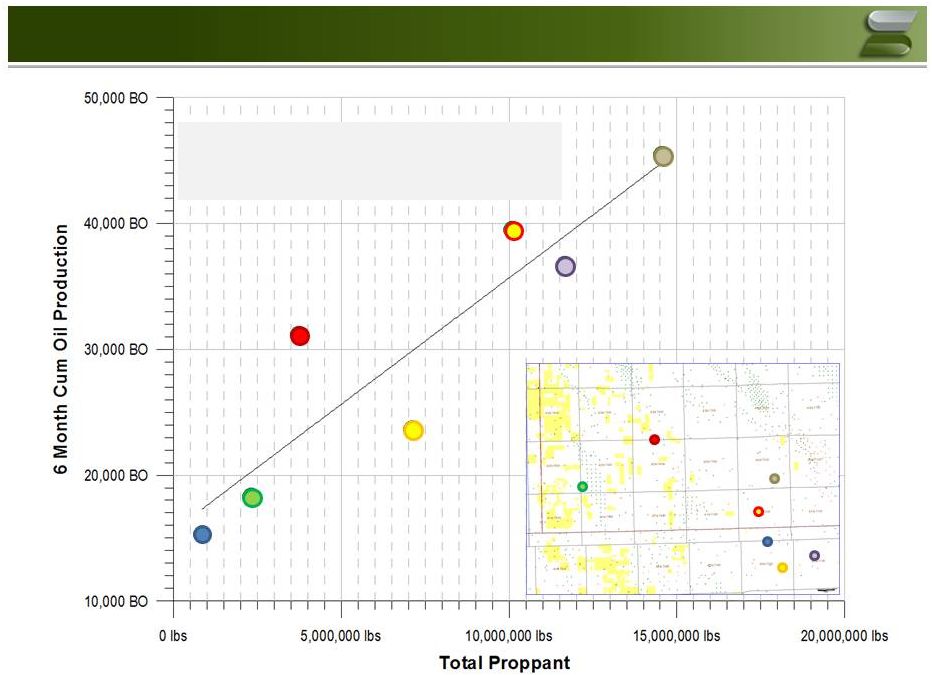 • Statistically significant correlation between frac size and well performance. • Common attribute of the best resource plays.
Mowry: Production vs Frac Size
28 |
 Significant resource potential held by historical vertical
development •
50,000 net acres with 90 sections operated
Wide range of results to date from horizontal program
• Well performance ranges from 0.5 Bcfe to greater than 6 Bcfe Need to de-risk development through technical work to create viable inventory
• Currently building sub-surface models. Unique recoveries predicted for each
location and for each zone
Drilling required to confirm technical models. Estimate 15-20 wells
required Opportunities exist to improve economics. Longer
laterals and larger stimulations Granite Wash:
Overview Inventory Assessment Strategy
Inventory Assessment Strategy
Granite Wash Position Detail
Granite Wash Position Detail
29 |
 Upside Assets -
Summary Mowry Development Preliminary analytical models being built to support estimates Acreage defined by maturity and pressure Geologic study and recent public production used to assign risk factor Fort Union Development Play based on 3 targeted horizons (Upper, Middle & Lower Ft Union) Risking assigned based on PDP offset data and normalized production Granite Wash Development Inventory consists of multiple stacked horizons based on geologic maturity
Spans Atokan, Desmoniesian & Missourian series
Upside Assets Approximately 2,500 gross un-risked locations 50% operated Upside of ~2.7 TCFE net ________________________________________________ (1) 3P Inventory will be updated routinely as new information becomes available
30 |
 Business Plan and
Long-Term Financial Forecast
31 |
 Business Plan & Long-Term Forecast Overview
32 The Company has prepared a three year business plan (the “Business Plan”)
In addition to the Business Plan, the Company has also prepared a long-term
forecast (the “Long Term Forecast”) through 2020 in
order to help evaluate the development of upside
opportunities Presented herein are the following
scenarios: •
No Drilling Snapshot
• Core Asset Development (Bakken / East Texas) • Core Asset + Gas Option (Haynesville) |
 Key Assumptions
33 Key Assumptions Pricing Business Plan Price Deck Base Production Based on Budget forecast Non D&C Capital Spend Non-D&C capital expenditures forecasted to be the greater of $40 million / year or
15% of annual D&C capital budget
LOE Base production lease operating expenses inline with historical per unit metrics,
escalated at 2% per year
New wells brought online 2016+ based on single well cost
assumptions 2015
2016 2017 2018 2019 2020 Gas ($/Mcf) $3.17 $3.75 $4.00 $4.00 $4.00 $4.00 Oil ($/bbl) $57.88 $67.50 $70.00 $70.00 $70.00 $70.00 |
 Key Assumptions (cont’d)
34 Key Assumptions G&A G&A reductions greater than $60 million (1) on an annual basis by April 2015 to run rate of ~$100 million (2) , excluding one-time costs 2016 & beyond G&A held constant at the revised G&A run-rate
Working Capital
Working capital assumptions reflect current efforts to manage working capital
and enhance liquidity
Beginning in 2016, working capital assumption return to normalized
levels A&D Activity
Arkoma sold for $48 million in Q1’15
No other assets sales incorporated in the forecast
________________________________________________
(1) $60 million of savings based on a combination of G&A and LOE savings. Shown together for modeling purposes.
(2) Including capitalized G&A. |
 No Drilling Snapshot
35 |
 No Drilling Snapshot
Daily Production (MMcfe/d)
Adjusted EBITDA ($MM)
Unlevered Free Cash Flow
(2) ($MM) Capital Incurred (1) ($MM) 36 (1) Capital shown does not represent cash capital spent and excludes capitalized G&A (does not account for changes in working capital). (2) Calculated as Adjusted EBITDA, plus proceeds from asset divestitures, less capital expenditures and changes in working capital.
Adjusted EBITDA excludes restructuring charges in 2015 and Q1 2016 of $110 million and $15 million, respectively.
|
 Financial Summary –
No Drilling ________________________________________________ (1) Represents capital expenditures incurred, inclusive of capitalized G&A.
(2) Excludes impact of working capital changes due to changes in accrued interest liability account.
37 ($ in millions) FY FY FY FY FY FY 2015 2016 2017 2018 2019 2020 PRICING Oil ($/bbl) 57.88 67.50 70.00 70.00 70.00 70.00 Gas ($/mcf) 3.17 3.75 4.00 4.00 4.00 4.00 NGL ($/bbl) 20.78 23.08 24.00 24.00 24.00 24.00 NET PRODUCTION Crude Oil (MMBbls) 4.2 2.9 2.3 1.9 1.6 1.5 Natural Gas (Bcf) 116.4 92.8 79.0 69.6 62.3 56.3 NGL (MMBbls) 4.2 3.1 2.5 2.2 1.9 1.7 TOTAL NET PRODUCTION (Bcfe) 166.9 128.7 107.6 94.0 83.6 75.5 Daily Rate (MMcfe/d) 457 352 295 257 229 206 % Liquids 30% 28% 27% 26% 26% 25% TOTAL NET REVENUE 694 550 466 405 359 323 ADJUSTED EBITDA 368 279 221 178 145 119 Capital Expenditures (174.2) (46.5) (45.0) (45.0) (45.0) (45.0) Working Capital (105.5) (18.4) (1.6) (3.0) (4.8) (2.4) Asset Sales 44.9 - - - - - UNLEVERED FREE CASH FLOW 133.2 214.3 174.7 129.8 94.9 71.9 1 2 |
 Core Asset Development
38 |
 Development Assumptions: Core Business Plan
Key Assumptions
2015 Drilling No drilling for remainder of 2015 East Texas Restart program 1/1/2016 (1) 2016 drilling program – 1 operated rig targeting Cotton Valley and 1 operated rig targeting Taylor wells 2017+ drilling program – rig counts held constant through 2020 Williston Restart program 1/1/2016 (1) 2016 drilling program – 2 operated rigs and 1.5 non-operated rigs in Bakken 2017 drilling program – 2 operated rigs and 1 non-operated rig in Bakken 2018+ drilling program – rig counts held constant at 2017 levels until locations depleted ________________________________________________ (1) Program restart dependent on two key factors: 1) appropriate commodity environment to achieve acceptable project returns and 2) ability
to spend preparatory capital in advance of the 1/1/16 start date,
such as building pad locations, ordering long lead items and appropriate title work. 39 |
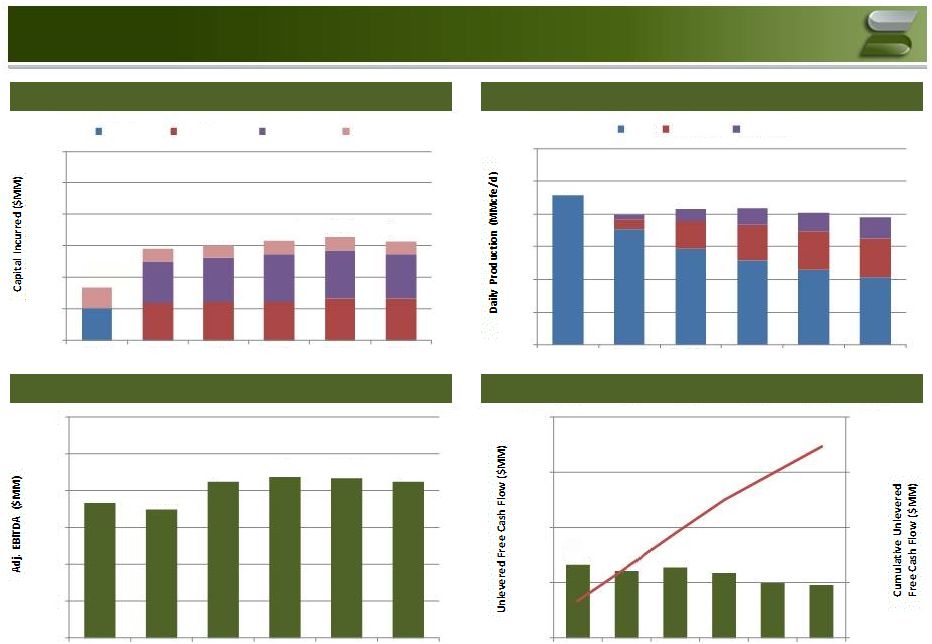 Core Asset Business Plan
Capital Incurred
(1) ($MM) Daily Production (MMcfe/d) Adjusted EBITDA ($MM) Unlevered Free Cash Flow (2) ($MM) ________________________________________________ 40 $166 $290 $303 $316 $328 $315 $100 $200 $300 $400 $500 $600 2015 2016 2017 2018 2019 2020 Budget CV/Taylor Williston Non D&C 457 397 416 417 404 389 - 100 200 300 400 500 600 2015 2016 2017 2018 2019 2020 Base CV/Taylor Williston $368 $349 $424 $440 $434 $425 $0 $100 $200 $300 $400 $500 $600 2015 2016 2017 2018 2019 2020 $133 $121 $128 $118 $99 $96 $0 $200 $400 $600 $800 $0 $100 $200 $300 $400 2015 2016 2017 2018 2019 2020 (1) Capital shown does not represent cash capital spent and excludes capitalized G&A (does not account for changes in working capital). (2) Calculated as Adjusted EBITDA, plus proceeds from asset divestitures, less capital expenditures and changes in working capital.
Adjusted EBITDA excludes restructuring charges in 2015 and
Q1 2016 of $110 million and $15 million, respectively. |
 Financial Summary –
Core Asset Business Plan
________________________________________________
(1) Represents capital expenditures incurred, inclusive of capitalized G&A.
(2) Excludes impact of working capital changes due to changes in accrued interest liability account.
41 ($ in millions) FY FY FY FY FY FY 2015 2016 2017 2018 2019 2020 PRICING Oil ($/bbl) 57.88 67.50 70.00 70.00 70.00 70.00 Gas ($/mcf) 3.17 3.75 4.00 4.00 4.00 4.00 NGL ($/bbl) 20.78 23.08 24.00 24.00 24.00 24.00 NET PRODUCTION Crude Oil (MMBbls) 4.2 3.6 4.4 4.7 4.9 5.1 Natural Gas (Bcf) 116.4 102.0 102.6 101.1 96.0 90.8 NGL (MMBbls) 4.2 3.6 3.7 3.8 3.7 3.5 TOTAL NET PRODUCTION (Bcfe) 166.9 145.3 151.7 152.1 147.5 142.3 Daily Rate (MMcfe/d) 457 397 416 417 404 389 % Liquids 30% 30% 32% 34% 35% 36% TOTAL NET REVENUE 694 634 711 725 717 706 ADJUSTED EBITDA 368 349 424 440 434 425 Capital Expenditures 1 (174.2) (295.2) (308.1) (321.3) (332.8) (320.0) Working Capital 2 (105.5) 66.9 11.8 (0.7) (2.0) (8.9) Asset Sales 44.9 - - - - - UNLEVERED FREE CASH FLOW 133.2 120.8 127.8 117.6 99.4 95.8 |
 Business Plan with Gas Option
42 |
 Development Assumptions: Gas Option
43 Key Assumptions Core Assets Consistent with Core Asset Business Plan presented on previous pages Haynesville Gas Option 1 rig running in 2018 and 2 rigs running in 2019 and beyond Each rig drills 11 wells / rig / year Learning curve on first 10 wells drilled with 25% higher D&C costs |
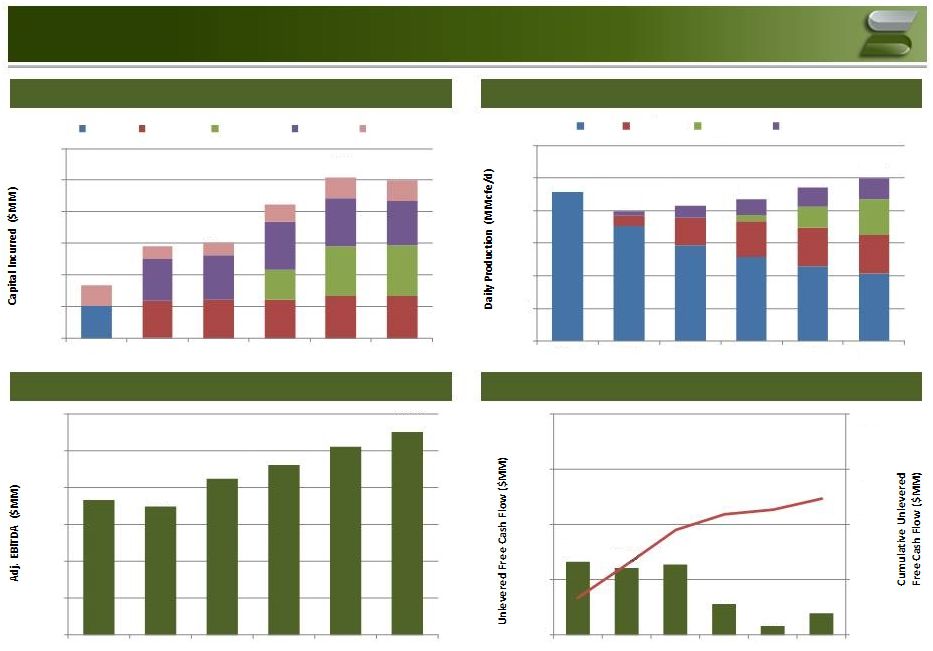 Core Asset Business Plan + Gas Option Case
Capital Incurred
(1) ($MM) Daily Production (MMcfe/d) Adjusted EBITDA ($MM) Unlevered Free Cash Flow (2) ($MM) ________________________________________________ 44 457 397 416 436 471 499 100 200 300 400 500 600 2015 2016 2017 2018 2019 2020 Base CV/Taylor Haynesville Williston $166 $290 $303 $424 $509 $499 $100 $200 $300 $400 $500 $600 2015 2016 2017 2018 2019 2020 Budget CV/Taylor Haynesville Williston Non D&C $368 $349 $424 $462 $512 $553 $0 $100 $200 $300 $400 $500 $600 2015 2016 2017 2018 2019 2020 $133 $121 $128 $56 $16 $40 $0 $200 $400 $600 $800 $0 $100 $200 $300 $400 2015 2016 2017 2018 2019 2020 (1) Capital shown does not represent cash capital spent and excludes capitalized G&A (does not account for changes in working capital). (2) Calculated as Adjusted EBITDA, plus proceeds from asset divestitures, less capital expenditures and changes in working capital.
Adjusted EBITDA excludes restructuring charges in 2015 and Q1
2016 of $110 million and $15 million, respectively. - |
 Financial Summary –
Gas Option Case
________________________________________________
(1) Represents capital expenditures incurred, inclusive of capitalized G&A.
(2) Excludes impact of working capital changes due to changes in accrued interest liability account.
45 ($ in millions) FY FY FY FY FY FY 2015 2016 2017 2018 2019 2020 PRICING Oil ($/bbl) 57.88 67.50 70.00 70.00 70.00 70.00 Gas ($/mcf) 3.17 3.75 4.00 4.00 4.00 4.00 NGL ($/bbl) 20.78 23.08 24.00 24.00 24.00 24.00 NET PRODUCTION Crude Oil (MMBbls) 4.2 3.6 4.4 4.7 4.9 5.1 Natural Gas (Bcf) 116.4 102.0 102.6 108.0 120.5 131.0 NGL (MMBbls) 4.2 3.6 3.7 3.8 3.7 3.5 TOTAL NET PRODUCTION (Bcfe) 166.9 145.3 151.7 159.0 171.9 182.5 Daily Rate (MMcfe/d) 457 397 416 436 471 499 % Liquids 30% 30% 32% 32% 30% 28% TOTAL NET REVENUE 694 634 711 749 803 847 ADJUSTED EBITDA 368 349 424 462 512 553 Capital Expenditures 1 (174.2) (295.2) (308.1) (428.6) (513.7) (504.2) Working Capital 2 (105.5) 66.9 11.8 22.8 17.0 (9.0) Asset Sales 44.9 - - - - - UNLEVERED FREE CASH FLOW 133.2 120.8 127.8 56.0 15.7 39.6 |
 Upside Asset Testing
46 |
 Upside Assets -
Summary Mowry Development Preliminary analytical models being built to support estimates Acreage defined by maturity and pressure Geologic study and recent public production used to assign risk factor Fort Union Development Play based on 3 targeted horizons (Upper, Middle & Lower Ft Union) Risking assigned based on PDP offset data and normalized production Granite Wash Development Inventory consists of multiple stacked horizons based on geologic maturity
Spans Atokan, Desmoniesian & Missourian series
Upside Assets (1) Approximately 2,500 gross un-risked locations 50% operated Upside of ~2.7 TCFE net ________________________________________________ (1) 3P Inventory will be updated routinely as new information becomes available
47 |
 Key Assumptions
Mowry Development Operated only development, 12 wells / rig / year Drilling pace: 1 well in 2016, 6 wells in 2017, 1 rig in 2018, 3 rigs in 2019,
5 rigs in 2020
Learning curve: 25% higher costs and 50% of expected EUR on first 20
wells drilled
Fort Union Development Operated only development, 4 wells / rig / year Drilling pace: 1 rig 2016, 2 rigs in 2017 & beyond Learning curve: 50% higher costs and 50% of expected EUR on first 5 wells
drilled Granite Wash Development Operated only development, 12 wells / rig / year Drilling pace: 2 rigs 2016 & beyond (one rig allocated to Atokan Granite Wash and one rig allocated to Des Moines Granite Wash) Learning curve: 20% higher costs and 75% of expected EUR on first 5 wells
drilled (for each target)
Cost to Test 48 |
 A&D Considerations
49 |
 A&D Strategy
Previously marketed assets can be sold at
proper time
San Juan, Wamsutter, Non-Core Mid-Con
Reduce scattered acreage & horizons to
simplify asset base
Leverage minerals & areas with limited
inventory to re-deploy capital into core
areas with upside potential
Focus on Bakken
& East Texas Reasonable leasing & acquisition prices in offsetting leasehold Utilize in house geologic and technical skills Clear line on growth possibilities through both small acquisitions and organic leasing efforts Targeting repeatable inventory High return projects needed Ability to ramp and sustain mid/high activity levels Strengthen portfolio by adding ability to transact in competitive environments Desire to consolidate following initial acquisition Most interested in basins where institutional knowledge has already been developed • Eagle Ford • Permian • East Texas • Bakken Divestitures Large Scale Transformation Bolt-On Acquisitions 50 |
 Sell Non-Core Assets
Mid-Con Sale Package
Gas Assets Permian Minerals Overview Acreage is primarily scattered and non-op San Juan and Wamsutter Generally mature producing assets Exposure to all major plays in the Permian basin 100% of current production is non-op 99% is net fee mineral coverage Current Operations Not an area of focus for development due to low working interests over multiple plays Continue to evaluate well proposals from outside operators Continue to assess behind pipe resource and workover candidates Few drilling opportunities remain Limited optimization opportunities Not part of future core area Acreage is scattered over 50 counties Interest is predominantly composed of royalties/overrides Minimal existing production Key Statistics Q4’14 Production: 61 MMcfe/d (30% Liquids) Net Acreage: 223,000 Proved Reserves: 179 Bcfe Q4’14 Production: 87 MMcfe/d (3% Liquids) Net Acreage: 43,000 Proved Reserves: 226 Bcfe Q4’14 Production: <1 MMcfe/d (75% Liquids) Net Acreage: 62,000 Proved Reserves: 1.2 Bcfe 51 |
 Appendix 52 |
 Hedge Position The company is well hedged through 2016 and has significant unrealized value in the hedge book.
________________________________________________
Unrealized Hedge Book
Production % Hedged
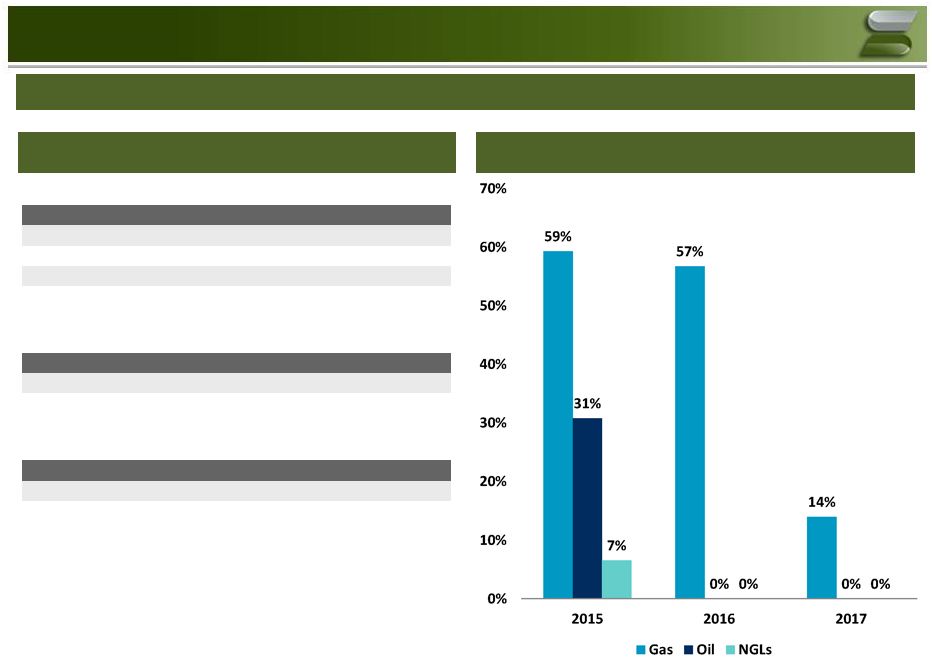
(2) 53 (1)
Natural Gas Collars: 2016 - 30,000 MMBtu/d in effect only if counterparty
elects to exercise (extendable collars).
(2)
% Hedged based on Business Plan. Natural Gas Swaps & Collars (1) Year Hedged (MMBtu/d) Wtd. Avg. Swap Price 2015 191,000 $4.05 2016 161,000 4.04 2017 40,000 3.92 Oil Swaps Year Hedged (Bbls/d) Wtd. Avg. Swap Price 2015 3,500 $90.91 NGL Swaps Year Hedged (Bbls/d) Wtd. Avg. Swap Price 2015 750 $37.07 |
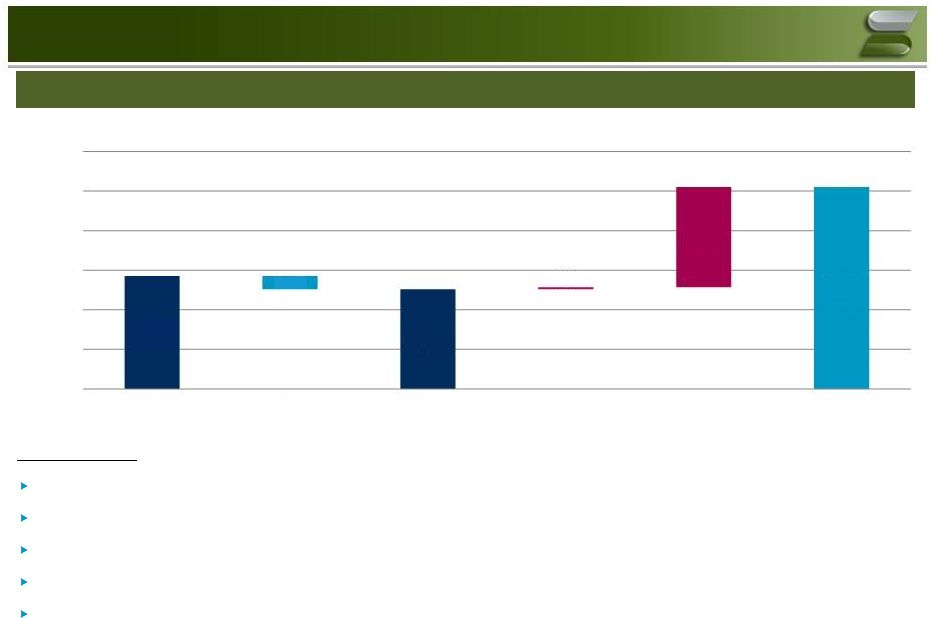 Reconciliation of Strip Pre-tax PV-10 + Hedges to SEC
PV-10 Proved Reserve Value:
Based on unrisked
1P Company Reserve Report with 3/13/15 strip pricing
Reserve report incorporates production taxes, ad valorem taxes, operating
expenses, AROs and capital expenditures Commodity price
differentials based on reserve report Shown incorporating 10%
discount rate Factors in hedges in place as of 12/31/2014, run at
3/13/15 strip pricing ($ in millions)
________________________________________________
Source: Company final 12/31/2014 reserve report run at 3/13/15 strip. Pro
forma for Arkoma sale. Note: PV-10 using 12/31/14 SEC
pricing displayed above for Proved Asset Values (Unrisked). Proved reserve value and hedges use 10% discount rate. Valuation date of 12/31/2014. Reconciliation of Pre-tax PV-10 at strip pricing to Pre-tax PV-10 at SEC pricing is illustrated below.
54 $1,258 $1,426 $168 $27 $1,267 $2,551 $500 $1,000 $1,500 $2,000 $2,500 $3,000 – Proved PV-10 @ Strip + Hedges Hedge Adjustment Proved PV-10 @ Strip Asset Sales Strip Adjustment Proved PV-10 @ SEC Pricing |
 Final NSAI 12/31/14 Reserve Report Summary
________________________________________________
Note: Reflects 3/13/15 strip pricing.
(1) Pro forma for the sale of the company’s Arkoma assets
(PV-10 of $28 million). The following reflects a summary of the
Company’s 12/31/14 reserve report as audited by NSAI. ($ in
000's) Granite Wash /
Powder Mid-Con, East Texas Williston Mississippi Lime Fort Union River / Mowry Gas, Permian (1) Total Proved Developed Producing Oil (MBbls) 2,147 5,285 3,301 592 6,249 2,661 20,234 NGLs (MBbls) 6,534 397 7,440 2,643 549 6,637 24,200 Natural Gas (MMcf) 352,424 4,151 124,244 24,071 4,688 328,255 837,833 Total (Mmcfe) 404,509 38,238 188,690 43,484 45,476 384,042 1,104,439 PV-10 ($ mm) $430,509 $81,400 $228,944 $52,901 $104,342 $362,558 $1,260,655 Proved Non-Producing Oil (MBbls) 0 0 0 97 0 0 97 NGLs (MBbls) 0 0 0 411 0 0 411 Natural Gas (MMcf) 0 0 0 3,028 0 0 3,028 Total (Mmcfe) 0 0 0 6,073 0 0 6,073 PV-10 ($ mm) – – – $4,933 – – $4,933 Proved Undeveloped Oil (MBbls) 654 5,112 1,054 257 579 499 8,155 NGLs (MBbls) 3,435 333 2,180 840 16 1,183 7,987 Natural Gas (MMcf) 70,262 2,560 31,101 6,164 110 11,976 122,174 Total (Mmcfe) 94,797 35,226 50,504 12,751 3,681 22,066 219,025 PV-10 ($ mm) ($2,949) $8,707 ($9,743) $1,202 ($4,095) ($587) ($7,464) Total Oil (MBbls) 2,801 10,396 4,354 946 6,828 3,160 28,486 NGLs (MBbls) 9,969 729 9,620 3,894 565 7,820 32,598 Natural Gas (MMcf) 422,685 6,711 155,345 33,263 4,798 340,231 963,034 Total (Mmcfe) 499,306 73,464 239,193 62,308 49,157 406,108 1,329,536 PV-10 ($ mm) $427,561 $90,107 $219,201 $59,037 $100,247 $361,971 $1,258,124 PV-10 of Hedges ($ 000's) $168,098 Total PV-10 ($ 000's) $1,426,222 55 |
 3/31/15 Reserve Report Summary
________________________________________________
Note: Reflects 6/5/15 strip pricing.
The following reflects a summary of the Company’s internal 3/31/15 reserve
report 56
($ in 000's) Granite Wash / Powder Mid-Con, East Texas Williston Mississippian Lime Fort Union River / Mowry Gas, Permian Total Proved Developed Producing Oil (Mbbls) 2,116 6,957 3,690 784 6,308 2,756 22,611 NGLs (Mbbls) 7,064 420 7,313 3,518 612 7,487 26,414 Natural Gas (MMcf) 344,717 4,279 125,311 29,801 5,739 330,305 840,151 Total (MMcfe) 399,796 48,541 191,330 55,609 47,257 391,765 1,134,299 PV-10 $411,110 $127,987 $230,754 $75,035 $118,089 $336,886 $1,299,860 Proved Non-Producing Oil (Mbbls) - - 13 - - - 13 NGLs (Mbbls) - - 11 - - - 11 Natural Gas (MMcf) - - 111 - - - 111 Total (MMcfe) - - 257 - - - 257 PV-10 - - $719 - - - $719 Proved Undeveloped Oil (Mbbls) 678 3,512 1,703 200 - 442 6,536 NGLs (Mbbls) 3,615 252 2,811 877 - 811 8,367 Natural Gas (MMcf) 74,479 1,795 36,383 6,444 - 9,167 128,269 Total (MMcfe) 100,241 24,382 63,468 12,905 - 16,687 217,683 PV-10 $15,367 $774 $9,663 $943 - ($7,445) $19,302 Total Oil (Mbbls) 2,794 10,469 5,407 984 6,308 3,198 29,160 NGLs (Mbbls) 10,679 672 10,135 4,394 612 8,298 34,791 Natural Gas (MMcf) 419,197 6,073 161,805 36,245 5,739 339,472 968,531 Total (MMcfe) 500,038 72,923 255,055 68,514 47,257 408,452 1,352,239 PV-10 $426,477 $128,760 $241,136 $75,978 $118,089 $329,441 $1,319,882 PV-10 of Hedges ($ 000's) 128,404 Total PV-10 ($ 000's) $1,448,285 |
 Net Operating Losses and Tax Basis Detail
NOL Schedule Asset Tax Basis as of 12/31/2014 Current Assets Accounts Receivable $ 174 Prepaid Expenses 11 Total 185 Property, Plant & Equipment
Lease and well equipment (net of depreciation)
$ 117 Producing leasehold cost (net of depletion) 475 Capitalized IDC (net of amortization)
235 Proved Undeveloped Leasehold
267 G&G (net of amortization)
2 Tax depletion carryover
9 Other PP&E
40 Total $ 1,143 Other Capitalized loan costs 195 Goodwill 6 Inventory in excess of book basis
10 Total $ 211 Total $ 1,539 Subject to 382 Limitation SRCorp SIC SCEEP PYR Total NOL as of 12/31/13 $ 862 $ 401 $ 55 $ 33 $ 1,350 Estimated NOL Generated 12/31/14 95 - - - 95 Estimated Total NOL 12/31/14
957 401 55 33 1,445 Yearly Limitation - Section 382 $ 133 $ 3 $ 2 138 Tax Year 2014 Analysis
Cumulative Section 382 Unused as of 12/31/14
- 401 19 15 435 Available for use 12/31/14
$ 957 $ 401 $ 19 $ 15 $ 1,392 57 |
 Information on the Following Page is as of
July 2015 58 |
 Play Cotton Valley Cotton Valley Haynesville Haynesville Haynesville Taylor Taylor Taylor Bakken Bakken Bakken Tier High Low Core Tier 1 Tier 2 High Medium Low Core Tier 1 Tier 2 Production Assumptions ARIES EUR (P50) Gas EUR / Well (Bcf) 5.4 2.9 4.8 4.5 4.2 5.8 4.1 1.8 0.3 0.3 0.2 Oil EUR / Well (MMBbls) 0.0 0.0 - - - 0.0 0.0 0.0 0.4 0.4 0.3 Total EUR (Bcfe) 5.6 3.0 4.8 4.5 4.2 6.0 4.3 1.9 2.6 2.4 2.1 NGL EUR / Well (MMBbls) 0.2 0.1 - - - 0.2 0.2 0.1 0.0 0.0 0.0 Water (MMBbls) 1.7 0.9 0.2 0.1 1.6 1.2 1.4 0.2 0.4 0.4 0.3 Lease Operating Expense Assumptions Fixed Operating Expenses ($ / Well / Month) $2,437 $2,437 $3,500 $3,500 $3,500 $2,027 $2,027 $2,027 $13,760 $13,760 $13,760 Natural Gas Operating Expenses ($ / Mcf) 0.26 0.26 - - - 0.12 0.12 0.12 - - - Crude Oil Operating Expenses ($ / Bbl) - - - - - - - - 0.10 0.10 0.10 Water Operating Expenses ($ / Bbl) 0.78 0.78 1.10 1.10 1.10 0.22 0.22 0.22 1.75 1.75 1.75 Production Tax Assumptions Severance Tax Natural Gas (%) 3.7% 3.7% 3.7% 3.7% 3.7% 3.7% 3.7% 3.7% 5.2% 5.2% 5.2% Severance Tax Crude Oil (%) 5.2% 5.2% 5.2% 5.2% 5.2% 5.2% 5.2% 5.2% 11.3% 11.3% 11.3% Severance Tax Crude NGL (%) 3.7% 3.7% 3.7% 3.7% 3.7% 3.7% 3.7% 3.7% 6.9% 6.9% 6.9% Ad Valorem Tax (%) 2.7% 2.7% 2.7% 2.7% 2.7% 2.7% 2.7% 2.7% 0.0% 0.0% 0.0% Differential Assumptions Natural Gas ($ / Mcf) ($0.38) ($0.38) ($0.60) ($0.60) ($0.60) ($0.38) ($0.38) ($0.38) ($2.90) ($2.90) ($2.90) Crude Oil ($ / Bbl) ($1.55) ($1.55) $0.00 $0.00 $0.00 ($2.65) ($2.65) ($2.65) ($12.00) ($12.00) ($12.00) NGL Realized Price (% of y-grade) 98.5% 98.5% 98.5% 98.5% 98.5% 98.5% 98.5% 98.5% 139.7% 139.7% 139.7% NGL Transportation + Fractionation ($5.70) ($5.70) ($5.70) ($5.70) ($5.70) ($5.70) ($5.70) ($5.70) ($21.30) ($21.30) ($21.30) Shrink Factor Assumptions Shrink Factor 86.9% 98.0% 100.0% 100.0% 100.0% 84.0% 84.0% 84.0% 77.0% 77.0% 77.0% Drilling & Completion Costs per Well ($mm) (1) Drilling $3.4 $3.8 $4.5 $4.5 $4.8 $4.0 $4.0 $3.8 $3.3 $3.3 $3.3 Completion 2.6 2.5 3.3 3.5 4.3 2.8 2.7 2.5 3.2 3.2 3.2 Total $6.0 $6.3 $7.8 $8.0 $9.0 $6.8 $6.7 $6.3 $6.5 $6.5 $6.5 Location Assumptions Gross Operated Wells 36 296 334 81 125 31 93 222 12 34 268 Working Interest (%) 87.1% 100.0% 93.9% 87.0% 75.0% 100.0% 100.0% 100.0% 47.2% 52.5% 47.2% Net Revenue Interest (%) 66.0% 76.7% 74.6% 66.5% 57.7% 77.0% 79.5% 75.0% 38.4% 43.0% 38.4% Drill Wedge Inputs & Assumptions 59 ________________________________________________ (1) D&C costs shown before 15% savings |
 Information on the Following Pages is as of
August 2015 60 |
 (1) As of 2Q Close Marginal Well Update Company has prioritized shut-in’s of wells which exhibit lifting costs in excess of current commodity prices
75% of Proven PV10 is concentrated in less than 800 wells
(1) Since Jan 2014, Samson has divested of 2,900 wells (580 Operated) Ongoing review for small divestiture packages Non-Operated wells are also under review in lower commodities ~ 1,000 wells – ~30% of gross operated inventory shut-in between April and May 2015
Aggregate net production of ~6 MMcfe/d in 2
Quarter Continue to produce marginal wells if: Negative Op income is largely due to onetime repair If lease operating efficiency is being improved Producing in paying quantities and holding lease Hedges in place may also influence shut-in strategy State regulations vary in timing but no expectation that P&A program increases significantly in near future
Following the shut in initiative, 80-90% of operated wells exhibit positive
cash flow at current pricing 61
nd |
 ________________________________________________
Note: PV10 data shown Pre-Tax, Pre-G&A. Excludes items
such as Non-D&C capital, midstream income and other corporate items. Core 6/30/15 PV10 at Various Prices 62 1,131 1,357 1,418 28 88 100 7 26 $1,159 $1,452 $1,544 0 200 400 600 800 1,000 1,200 1,400 1,600 1,800 2,000 $3/$55/$19.25 Flat $3/$55/$19.25 Through 2016, $3.50/$60/$21 Thereafter $3/$55/$19.25 Through 2016, $3.50/$65/$22.75 Thereafter BASE CV / Taylor Williston |
 Compensation Breakout
($ in MM) (1) Represents employees and related compensation as of August 3, 2015. (2) Benefits assumed to be 35% of employee wages. 63 Employee 1 Compensation 1 Function Count Wages Bonus Benefits 2 Total Petrotechnical Staff / Support 382 41.8 $ 11.5 $ 14.6 $ 67.8 $ Accounting / Finance 107 9.0 1.8 3.1 13.9 Information Systems 46 4.9 1.1 1.7 7.7 Regulatory 37 4.6 1.2 1.6 7.4 Executive 4 2.3 2.3 0.8 5.5 Corporate Other 27 2.8 0.8 1.0 4.5 Other 3 0.4 0.0 0.1 0.5 Total 606 65.7 $ 18.8 $ 23.0 $ 107.5 $ Employee 1 Compensation 1 Location Count Wages Bonus Benefits 2 Total Tulsa, OK 343 39.3 $ 12.2 $ 13.7 $ 65.2 $ Denver, CO 60 9.8 3.9 3.4 17.1 Perryton, TX 30 2.3 0.3 0.8 3.4 Longview, TX 75 6.4 1.0 2.2 9.6 Bayfield, CO 26 2.2 0.4 0.8 3.3 Casper, WY 22 1.8 0.3 0.6 2.8 Elk City, OK 22 1.9 0.3 0.7 2.8 Rawlins, WY 14 1.1 0.2 0.4 1.7 Crosby, ND 14 1.0 0.2 0.4 1.6 Total 606 65.7 $ 18.8 $ 23.0 $ 107.5 $ |
 Net Income to Adjusted EBITDA Reconciliations
64 ($ in millions) Note: Adjusted EBITDA is defined as net income (loss) before interest expense, income tax expense (benefit), depreciation and
amortization and other non-cash and non-recurring items.
No Drilling Core Asset Business Plan Gas Option Case Net Income (348.0) (288.7) (288.2) (277.8) (285.7) (292.0) + / (-) Interest (Income) Expense 335.8 346.0 354.7 328.4 332.9 337.2 + / (-) Income Tax Provision (Benefit) (195.7) (162.4) (162.1) (156.2) (160.7) (164.3) + DD&A 463.9 369.2 317.0 283.4 258.2 238.4 + Accretion of Asset Retirement Obligation 2.4 - - - - - + Restructuring Charges 109.6 15.0 - - - - ADJUSTED EBITDA 368.0 279.1 221.3 177.8 144.7 119.3 FY FY FY FY FY FY 2015 2016 2017 2018 2019 2020 Net Income (348.0) (274.2) (234.1) (208.1) (207.4) (208.2) + / (-) Interest (Income) Expense 335.8 346.0 354.7 328.4 332.9 337.2 + / (-) Income Tax Provision (Benefit) (195.7) (154.3) (131.7) (117.1) (116.7) (117.1) + DD&A 463.9 410.5 427.2 428.8 417.8 405.4 + Accretion of Asset Retirement Obligation 2.4 6.1 8.0 7.7 7.7 7.3 + Restructuring Charges 109.6 15.0 - - - - ADJUSTED EBITDA 368.0 349.1 424.1 439.6 434.2 424.7 Net Income (348.0) (274.2) (234.1) (205.5) (197.6) (191.7) + / (-) Interest (Income) Expense 335.8 346.0 354.7 328.4 332.9 337.2 + / (-) Income Tax Provision (Benefit) (195.7) (154.3) (131.7) (115.6) (111.2) (107.8) + DD&A 463.9 410.5 427.2 446.1 479.0 506.0 + Accretion of Asset Retirement Obligation 2.4 6.1 8.0 8.4 9.3 9.0 + Restructuring Charges 109.6 15.0 - - - - ADJUSTED EBITDA 368.0 349.1 424.1 461.8 512.3 552.8 FY FY FY FY FY FY 2015 2016 2017 2018 2019 2020 FY FY FY FY FY FY 2015 2016 2017 2018 2019 2020 |