Attached files
UNITED STATES
SECURITIES AND EXCHANGE COMMISSION
WASHINGTON, D.C. 20549
––––––––––––––––––––––
FORM 10-K
|
x
|
ANNUAL REPORT PURSUANT TO SECTION 13 OR 15(d) OF THE SECURITIES EXCHANGE ACT OF 1934
|
|
For the Fiscal Year Ended: June 2, 2015
|
OR
|
o
|
TRANSITION REPORT PURSUANT TO SECTION 13 OR 15(d) OF THE SECURITIES EXCHANGE ACT OF 1934
|
|
For the transition period from __________ to _________
|
RUBY TUESDAY, INC.
(Exact name of registrant as specified in charter)
|
GEORGIA
|
63-0475239
|
|
|
(State or other jurisdiction of incorporation or organization)
|
(I.R.S. Employer Identification No.)
|
150 West Church Avenue, Maryville, Tennessee 37801
(Address of principal executive offices and zip code)
(865) 379-5700
(Registrant’s telephone number, including area code)
Securities registered pursuant to Section 12(b) of the Act:
|
Title of each class
|
Name of each exchange on which registered
|
|
Common Stock, par value $0.01 per share
|
New York Stock Exchange
|
Securities registered pursuant to Section 12(g) of the Act:
None
Indicate by check mark if the registrant is a well-known seasoned issuer, as defined in Rule 405 of the Securities Act. Yeso Nox
Indicate by check mark if the registrant is not required to file reports pursuant to Section 13 or Section 15(d) of the Act. Yeso Nox
Indicate by check mark whether the registrant (1) has filed all reports required to be filed by Section 13 or 15(d) of the Securities Exchange Act of 1934 during the preceding 12 months (or for such shorter period that the registrant was required to file such reports), and (2) has been subject to such filing requirements for the past 90 days. Yes x No o
Indicate by check mark whether the registrant has submitted electronically and posted on its corporate Web site, if any, every Interactive Data File required to be submitted and posted pursuant to Rule 405 of Regulation S-T (§232.405 of this chapter) during the preceding 12 months (or for such shorter period that the registrant was required to submit and post such files). Yes x No o
Indicate by check mark if disclosure of delinquent filers pursuant to Item 405 of Regulation S-K (§229.405 of this chapter) is not contained herein, and will not be contained, to the best of registrant's knowledge, in definitive proxy or information statements incorporated by reference in Part III of this Form 10-K or any amendment to this Form 10-K. x
Indicate by check mark whether the registrant is a large accelerated filer, an accelerated filer, a non-accelerated filer, or a smaller reporting company. See the definitions of “large accelerated filer,” “accelerated filer,” and “smaller reporting company” in Rule 12b-2 of the Exchange Act.
Large accelerated filer o Accelerated filer x
Non-accelerated filer o (Do not check if a smaller reporting company) Smaller reporting company o
Indicate by check mark whether the registrant is a shell company (as defined in Rule 12b-2 of the Act). Yes o No x
The aggregate market value of the voting stock (which consists solely of shares of common stock) held by non-affiliates of the registrant as of the last day of the second fiscal quarter ended December 2, 2014 was $496,576,064 based on the closing stock price of $8.00 on December 2, 2014.
The number of shares of common stock outstanding as of August 12, 2015, was 61,959,543.
DOCUMENTS INCORPORATED BY REFERENCE
Portions of the registrant’s definitive Proxy Statement for the registrant’s 2015 Annual Meeting of Shareholders, to be filed pursuant to Regulation 14A under the Securities Exchange Act of 1934, as amended, are incorporated by reference into Part III of this Form 10-K.

|
Index
|
||
|
PART II
|
||
|
PART III
|
||
|
PART IV
|
||
Special Note Regarding Forward-Looking Information
This Annual Report on Form 10-K contains various forward-looking statements within the meaning of Section 27A of the Securities Act of 1933, as amended, and Section 21E of the Securities Exchange Act of 1934, as amended. Forward-looking statements represent our expectations or beliefs concerning future events, including one or more of the following: future financial performance (including our estimates of growth in same-restaurant sales, average unit volumes (average restaurant volumes), operating margins, expenses, and other items), future capital expenditures, the effect of strategic initiatives (including statements relating to cost savings initiatives and the benefits of our television marketing), the opening or closing of restaurants by us or our franchisees, sales of our real estate or purchases of new real estate, future borrowings and repayments of debt, availability of financing on terms attractive to the Company, compliance with financial covenants in our debt instruments, payment of dividends, stock and bond repurchases, restaurant acquisitions, and changes in senior management and in the Board of Directors. We caution the reader that a number of important factors and uncertainties could, individually or in the aggregate, cause our actual results to differ materially from those included in the forward-looking statements, including, without limitation, the risks and uncertainties described in the Risk Factors included in Part I, Item A of this Form 10-K and the following:
|
·
|
general economic conditions;
|
|
·
|
changes in promotional, couponing and advertising strategies;
|
|
·
|
changes in our customers’ disposable income;
|
|
·
|
consumer spending trends and habits;
|
|
·
|
increased competition in the restaurant market;
|
|
·
|
laws and regulations, including those affecting labor and employee benefit costs, such as further potential increases in state and federally mandated minimum wages and healthcare reform;
|
|
·
|
the impact of pending litigation;
|
|
·
|
customers’ acceptance of changes in menu items;
|
|
·
|
changes in the availability and cost of capital;
|
|
·
|
potential limitations imposed by debt covenants under our debt instruments;
|
|
·
|
weather conditions in the regions in which Company-owned and franchised restaurants are operated;
|
|
·
|
costs and availability of food and beverage inventory, including supply and delivery shortages or interruptions;
|
|
·
|
significant fluctuations in energy prices;
|
|
·
|
security breaches of our customers’ or employees’ confidential information or personal data or the failure of our information technology and computer systems;
|
|
·
|
our ability to attract and retain qualified managers, franchisees and team members;
|
|
·
|
impact of adoption of new accounting standards;
|
|
·
|
impact of food-borne illnesses resulting from an outbreak at either one of our restaurant concepts or other competing restaurant concepts; and
|
|
·
|
effects of actual or threatened future terrorist attacks in the United States.
|
-3-
PART I
Background
The first Ruby Tuesday® restaurant was opened in 1972 in Knoxville, Tennessee near the campus of the University of Tennessee. The Ruby Tuesday concept, which at the time consisted of 16 restaurants, was acquired by Morrison Restaurants Inc. (“Morrison”) in 1982. During the following years, Morrison grew the concept to over 300 restaurants with concentrations in the Northeast, Southeast, Mid-Atlantic and Midwest regions of the United States. In a spin-off transaction that occurred on March 9, 1996, shareholders of Morrison approved the distribution of two separate businesses of Morrison to its shareholders, Morrison Fresh Cooking, Inc. (“MFC”) and Morrison Health Care, Inc. (“MHC”). In conjunction with the spin-off, Morrison was reincorporated in the State of Georgia and changed its name to Ruby Tuesday, Inc. Ruby Tuesday, Inc. and its wholly-owned subsidiaries are sometimes referred to herein as “RTI,” the “Company,” “we” and/or “our.”
We began our traditional franchise program in 1997 with the opening of one domestic and two international franchised Ruby Tuesday restaurants. We do not own any equity in entities that hold franchises under our franchise programs. As of June 2, 2015, we had 30 Ruby Tuesday concept franchisees, comprised of 10 domestic and 20 international franchisees. We have signed agreements for the development of new franchised Ruby Tuesday restaurants with eight of the international franchisees. These eight international franchisees hold rights as of June 2, 2015 to develop Ruby Tuesday restaurants in 17 countries.
During fiscal 2011, we entered into a licensing agreement which allowed us to operate multiple Lime Fresh Mexican Grill® (“Lime Fresh”) restaurants, a fast casual Mexican concept. We opened four Lime Fresh restaurants during fiscal 2012 under the terms of the licensing agreement. On April 11, 2012, we completed the acquisition of Lime Fresh, including the assets of seven additional Lime Fresh concept restaurants, the royalty stream from five Lime Fresh concept franchised restaurants, and the Lime Fresh brand’s intellectual property. As of June 2, 2015, we had six Lime Fresh concept franchisees, none of which had signed agreements for the development of new franchised Lime Fresh restaurants.
Also in fiscal 2011, we began converting certain underperforming Ruby Tuesday restaurants to other concepts. To that end, we entered into a licensing agreement which allowed us to operate multiple Truffles® restaurants, an upscale café concept offering a diverse menu. Other conversion concepts available to us were Marlin & Ray’s™, an internally-developed seafood concept, and Wok Hay®, our full service Asian concept. We converted certain underperforming Ruby Tuesday restaurants to these concepts through fiscal year 2013, with Marlin & Ray’s being our primary conversion concept. However, as discussed further in Note 3 to the Consolidated Financial Statements, in an effort to focus primarily on the successful sales turnaround of our core Ruby Tuesday concept and secondly, to improve the financial performance of our Lime Fresh concept, in fiscal 2013 we closed all Marlin & Ray’s, Wok Hay, and Truffles restaurants.
Operations
We own, operate, and franchise the Ruby Tuesday casual dining restaurant chain and operate in the bar and grill segment of the casual dining industry. As of June 2, 2015, we owned and operated 658, and franchised 78, Ruby Tuesday restaurants. Of the 78 franchised Ruby Tuesday restaurants, 29 were operated by our domestic franchisees and 49 were operated by our international franchisees. Ruby Tuesday restaurants can be found in 44 states, 13 foreign countries, and Guam. Our Company-owned and operated restaurants are concentrated primarily in the Southeast, Northeast, Mid-Atlantic and Midwest of the United States, which we consider to be our core markets. A listing of the states and countries in which our franchisees operate is set forth below in Item 2 entitled “Properties.”
We also own, operate, and franchise the Lime Fresh fast casual restaurant concept. As of June 2, 2015, there were 19 Company-owned and operated Lime Fresh restaurants and seven Lime Fresh restaurants operated by domestic franchisees.
Our Core Ruby Tuesday Concept
Ruby Tuesday restaurants offer a wide variety of menu options, including handcrafted classic burgers made with fresh 100% USDA choice beef, fresh chicken options, our signature “fall-off-the-bone” baby-back ribs, as well as steaks, seafood, and appetizers. Our Garden Bar has been a significant point of differentiation for our brand and an enduring favorite of our customers. With up to 35 fresh, high quality salad ingredients, our Garden Bar exemplifies the key attributes of our brand of freshness and quality. Our Classic Burger choices include beef, turkey, and chicken offerings. Entree selections typically range in price from $8.99 to $20.99. Where appropriate, we also offer our RubyTueGo® curbside service and a delivered-meals catering program for businesses, organizations, and group events at both Company-owned and franchised restaurants.
In the mid-2000’s, under prior leadership, we began a shift in strategic direction to a more upscale, polished casual positioning, which resulted in what we believed to be fresher, higher quality food, remodeled restaurant interiors and exteriors, and service teams focused on providing a polished casual dining experience. While we maintain that these elements have resulted in an elevated and differentiated Ruby Tuesday brand compared to our bar and grill competitors, we believe the execution of this strategy strayed too far from our brand heritage and core customer base, leading to traffic declines over the last several years. Over the last several fiscal years we developed and have been implementing a brand transformation strategy which we believe will result in a more energetic, approachable, and casual brand position intended to appeal to a broader customer demographic and be more appropriate for a wide variety of dining occasions. Our brand transformation strategy is designed to stabilize and grow our customer counts, same-restaurant sales, and profitability, and is focused on four key pillars of menu, service, atmosphere, and communication. While the brand transformation strategy is a multi-year process, we have gained traction on the following initiatives since fiscal year 2014:
|
·
|
Menu Enhancements. Our menu objective is to offer a broadly-appealing menu which includes new takes on traditional favorites as well as innovative new food platforms with bold flavor profiles. We made significant progress in both fiscal years 2015 and 2014 in terms of menu enhancements. We have also shifted the emphasis of our drink menu away from an extensive wine selection and towards our selection of beers and premium cocktails. We remain focused on reengineering our core menu through both innovation and simplification, and ensuring that we have a wide range of price points and compelling value throughout the menu. We believe these efforts have the potential to drive core customer traffic growth from our current and lapsed customer base, as well as non-users of the brand.
|
|
·
|
Service and Atmosphere Enhancements. Over the past several fiscal years, we have made changes to our dining experience in certain areas including new music soundscapes and lighting improvements which are non-capital intensive in nature and should further enhance the customer dining experience. Additionally, we remain focused on having strong restaurant-level teams at our restaurants through the continued focus on high performance standards, advanced training, and a rigorous selection process in order to focus on high quality food and service.
|
|
·
|
Communication Program Enhancements. Our communication or marketing programs are a key component to our brand transformation strategy. Our most recent television commercials better reflect the variety on our menu and project a more casual, energetic, and approachable brand personality and dining experience. Additionally, as we look at opportunities to enhance our existing menu offerings, we will continue to focus on value which we believe our customers perceive as a combination of food quality, service, restaurant atmosphere, menu variety, and price. Lastly, we continue to build key capabilities in our marketing organization, strengthen our culinary innovation pipeline, and become more efficient, expansive and cost-effective with our marketing spend including leveraging digital and social media platforms.
|
Our Lime Fresh Concept
Lime Fresh is a fast casual fresh Mexican concept with restaurant operations in the Eastern United States, including a concentration in the vicinity of Miami, Florida. The Lime Fresh concept menu features diverse menu offerings such as homemade tortilla chips, customizable nachos, salads, soups, fajitas, quesadillas, tacos, burritos, salsa, and guacamole. This concept offers a unique experience by providing the speed of a fast casual restaurant, with the service and food quality of casual dining, in a fun and energetic atmosphere for customers.
On September 13, 2010, we entered into a licensing agreement with LFMG International, LLC, which allowed us to operate multiple restaurants under the Lime Fresh concept. As of April 10, 2012 we had opened four Lime Fresh restaurants under the terms of our licensing agreement. On April 11, 2012, we completed the acquisition of Lime Fresh for $24.1 million, which included the assets of seven additional Lime Fresh concept restaurants, the royalty stream from five Lime Fresh concept franchised restaurants (one of which opened in July 2012), and the Lime Fresh brand’s intellectual property. As of June 2, 2015, we owned and operated 19 Lime Fresh restaurants, and our franchisees operated seven domestic Lime Fresh restaurants.
As discussed further in Note 11 to the Consolidated Financial Statements, we consider our Ruby Tuesday concept and Lime Fresh concept to be our reportable operating segments.
Franchising
As previously noted, as of June 2, 2015, we had franchise arrangements with 30 franchise groups which operate Ruby Tuesday restaurants in 13 states, Guam, and 13 foreign countries. We also had franchise arrangements as of June 2, 2015 with six domestic franchise groups which operate seven Lime Fresh restaurants in Florida and Texas.
As of June 2, 2015, there were 78 Ruby Tuesday franchise restaurants operated by our domestic and international franchisees. Our franchisees opened six Ruby Tuesday restaurants in fiscal year 2015, seven Ruby Tuesday restaurants in fiscal year 2014, and two Ruby Tuesday restaurants in fiscal year 2013.
Generally, Ruby Tuesday concept franchise arrangements consist of a development agreement and a separate franchise agreement for each restaurant. Under a development agreement, a franchisee is granted the exclusive right and undertakes the obligation to develop multiple restaurants within a specifically-described geographic territory. The term of a domestic franchise agreement is generally 15 years, with two five-year renewal options.
For each Ruby Tuesday concept restaurant developed under a domestic development agreement, a franchisee is currently obligated to pay a development fee of $10,000 per restaurant (at the time of signing a development agreement), an initial license fee (which typically is $35,000 per restaurant to be developed for domestic franchisees), and a royalty fee equal to 4.0% of the restaurant’s monthly gross sales, as defined in the franchise agreement. Development and operating fees for international franchise restaurants vary.
During fiscal year 2015, we offered support service agreements for certain domestic Ruby Tuesday concept franchisees. Under those support services agreements, we had one level of support in which we provided specified services to assist the franchisees with various aspects of the business including, but not limited to, processing of payroll, basic bookkeeping, and cash management. Fees for these services were typically contracted to be about 1.5% of revenues, as defined in the franchise agreement. As of June 2, 2015, we had contracted with one domestic Ruby Tuesday concept franchise for such services and that contract expired on June 30, 2015. Separate from those support service agreements, there is also a required level of support services in which we charge a fee to cover certain information technology related support that we provide. All domestic Ruby Tuesday concept franchisees also are required to pay a marketing and purchasing fee of 1.5% of monthly gross sales. At times of economic downturn, we have occasionally chosen to temporarily lower these fees. Under the terms of the franchise agreements, we also require all domestic Ruby Tuesday concept franchisees to contribute a percentage of monthly gross sales, 1.5% as of June 2, 2015, to a national advertising fund formed to cover their pro rata portion of the costs associated with our national advertising campaign. Under these terms, we can charge up to 3.0% of monthly gross sales for this national advertising fund.
As of June 2, 2015, we had seven domestic Lime Fresh franchised restaurants in Florida and Texas. The term of a Lime Fresh domestic franchise agreement is generally 10 years, with one 10-year renewal option. For each Lime Fresh concept restaurant developed under a domestic development agreement, a franchisee is currently obligated to pay a development fee of $30,000 per restaurant (at the time of signing a development agreement), an initial license fee (which typically is $15,000 per restaurant to be developed for domestic franchisees), an initial marketing fee of at least $10,000, and a royalty fee equal to 5.25% of the restaurant’s monthly gross sales, as defined in the franchise agreement. Under the terms of the franchise agreements, we also require domestic franchisees to contribute a percentage of monthly gross sales, 1.5% as of June 2, 2015, to an advertising fund formed to cover their pro rata portion of the costs associated with our advertising campaign. Under these terms, we can charge up to 3.0% of monthly gross sales for this national advertising fund.
We provide ongoing training and assistance to our franchisees in connection with the operation and management of each restaurant through our training facility, meetings, on-premises visits, computer-based training (“CBT”), and by written or other material.
Training
Ruby Tuesday University, located in our Maryville, Tennessee Restaurant Support Services Center, serves as the centralized training center for all of our managers, multi-restaurant operators and other team members. Facilities include classrooms, a test kitchen, and the Ruby Tuesday Culinary Center. Ruby Tuesday University provides managers with the opportunity to assemble for intensive, ongoing instruction and hands-on interaction through our training sessions. Programs include classroom instruction and various team building activities and competitions, which are designed to contribute to the skill and enhance the dedication of the Company and franchise teams in addition to strengthening our corporate culture. In addition to the centralized training at Ruby Tuesday University, we periodically conduct field training classes. These field training classes have been held for team members, managers, general managers, and operations leadership. The field classes partner the training team along with operational leadership to provide direct training and development in order to reach a large audience faster, and make an immediate impact on our team.
Further contributing to the training experience is the Ruby Tuesday LodgeSM, which is located on a wooded campus just minutes from the Restaurant Support Services Center. The Ruby Tuesday Lodge serves as the lodging quarters and dining facility for those attending Ruby Tuesday University. After a day of instruction, trainees have the opportunity to dine and socialize with fellow team members in a relaxed and tranquil atmosphere where they are fully immersed in our culture. We believe our emphasis on training and retaining high quality restaurant managers is critical to our long-term success and we are committed to the ongoing development of our team members.
Research and Development
We do not engage in any material research and development activities. However, we do engage in ongoing studies to assist with food and menu development. Additionally, we conduct extensive consumer research to determine our customers’ preferences, trends, and opinions, as well as to better understand other competitive brands.
Raw Materials
We negotiate directly with our suppliers for the purchase of raw and processed materials and maintain contracts with select suppliers for both our Company-owned and franchised restaurants. These contracts may include negotiations for distribution of raw materials under a cost plus delivery fee basis and/or specifications that maintain a term-based contract with a renewal option. If any major supplier or distributor is unable to meet our supply needs, we would negotiate and enter into agreements with alternative providers to supply or distribute products to our restaurants.
We use purchase commitment contracts to stabilize the potentially volatile prices of certain food commodities. Because of the relatively short storage life of inventories, limited storage facilities at the restaurants, our requirement for fresh products and the numerous sources of goods, a minimum amount of inventory is maintained at our restaurants. In the event of a disruption of supply, all essential food, beverage and operational products can be obtained from secondary vendors and alternative suppliers. We believe these alternative suppliers can provide, upon short notice, items of comparable quality.
From time to time, we purchase lobster inventory in advance of our needs and store it in third-party facilities prior to our distributor taking possession of the inventory. Once the lobster is moved to our distributor’s facilities, we transfer ownership to the distributor. We later reacquire the inventory from our distributor upon its subsequent delivery to our restaurants.
Trade and Service Marks of the Company
We and our affiliates have registered certain trade and service marks with the United States Patent and Trademark Office, including the name “Ruby Tuesday.” RTI holds a license to use all such trade and service marks from our affiliates, including the right to sub-license the related trade and service marks. We believe that these and other related marks are of material importance to our business. Registration of the Ruby Tuesday trademark expires in our 2025 fiscal year, unless renewed. We expect to renew this registration at the appropriate time.
Seasonality
Our business is moderately seasonal. Average unit volumes of our mall-based restaurants, which represent approximately 17% of our total restaurants as of June 2, 2015, are slightly higher during the winter holiday season. Freestanding restaurant sales are generally higher in the spring and summer months.
Competition
Our business is subject to intense competition with respect to prices, services, locations, employees, and the types and quality of food. We are in competition with other food service operations, with locally-owned restaurants, and other national and regional restaurant chains that offer the same or similar types of services and products as we do. In times of economic uncertainty, restaurants also compete with grocery retailers as customers may choose to limit spending and eat at home. Some of our competitors may be more established in the markets where our restaurants are or may be located. Changes in consumer tastes, national, regional or local economic conditions, demographic trends, traffic patterns, and the types, numbers and locations of competing restaurants often affect the restaurant business. There is active competition for personnel and for attractive commercial real estate sites suitable for restaurants.
Government Regulation
We and our franchisees are subject to various licensing requirements and regulations at both the state and local levels, related to zoning, land use, sanitation, alcoholic beverage control, and health and fire safety. We have not encountered significant difficulties or failures in obtaining the required licenses or approvals that could delay the opening of a new restaurant or the operation of an existing restaurant nor do we presently anticipate the occurrence of any such difficulties in the future. Our business is subject to various other regulations by federal, state and local governments, such as compliance with various health care, minimum wage, citizenship, and fair labor standards. Compliance with these regulations has not had, and is not expected to immediately have, a material adverse effect on our operations.
We are subject to a variety of federal, state, and international laws governing franchise sales and the franchise relationship. In general, these laws and regulations impose certain disclosure and registration requirements prior to the offer and sale of franchises. Rulings of several state and federal courts and existing or proposed federal and state laws demonstrate a trend toward increased protection of the rights and interests of franchisees against franchisors. Such decisions and laws may limit the ability of franchisors to enforce certain provisions of franchise agreements or to alter or terminate franchise agreements. Due to the scope of our business and the complexity of franchise regulations, we may encounter minor compliance issues from time to time. We do not believe, however, that any of these issues will have a material adverse effect on our business.
Environmental Compliance
Compliance with federal, state and local laws and regulations that have been enacted or adopted regulating the discharge of materials into the environment, or otherwise relating to the protection of the environment, has not had, and is not expected to have a material effect on our capital expenditures, earnings or competitive position.
Personnel
As of June 2, 2015, we employed approximately 32,100 employees, including approximately 250 support center management and staff personnel. We believe that our employee relations are good and that working conditions and employee compensation are comparable with our major competitors. Our employees are not covered by a collective bargaining agreement.
Available Information
Through the “Investors” section of our website www.rubytuesday.com, we make available free of charge, annual reports on Form 10-K, quarterly reports on Form 10-Q, current reports on Form 8-K, Proxy Statements and all amendments to those reports filed or furnished pursuant to Section 13(a) or 15(d) of the Securities and Exchange Act of 1934, as amended, as soon as it is reasonably practicable after such material is electronically filed with or furnished to the Securities and Exchange Commission (“SEC”). Our reports and other materials filed with the SEC are also available at www.sec.gov. We are not including the information contained on or available through the aforementioned websites as a part of, or incorporating such information into, this Annual Report on Form 10-K. In addition, copies of our corporate governance materials, including Audit Committee Charter, Executive Compensation Committee Charter, Governance Committee Charter, Code of Business Conduct and Ethics, Corporate Governance Guidelines, Whistleblower Policy, and Categorical Standards for Director Independence, are available on the web site, free
of charge. We will make available on our web site any waiver of or substantive amendment to our Code of Business Conduct and Ethics within four business days following the date of such waiver or amendment.
A copy of the aforementioned documents will be made available without charge to all shareholders upon written request to the Company. Shareholders are encouraged to direct such requests to our Investor Relations department at the Restaurant Support Services Center, 150 West Church Avenue, Maryville, Tennessee 37801.
Executive Officers
Our executive officers are appointed by and serve at the discretion of our Board of Directors. Information regarding our executive officers as of August 17, 2015, is provided below.
|
Name
|
Age
|
Position
|
|
James J. Buettgen
|
55
|
Chairman of the Board, President, and Chief Executive Officer
|
|
Brett A. Patterson
|
46
|
Ruby Tuesday Concept President
|
|
Jill M. Golder
|
53
|
Executive Vice President, Chief Financial Officer, Treasurer, and Assistant Secretary
|
|
Rhonda J. Parish
|
59
|
Chief Legal Officer and Secretary
|
|
David W. Skena
|
45
|
Chief Marketing Officer
|
Mr. Buettgen joined the Company in December 2012 as President and Chief Executive Officer. On October 27, 2013, Mr. Buettgen was appointed by our Board of Directors to serve as Chairman of the Board. Prior to joining the Company, Mr. Buettgen served as Senior Vice President, Chief Marketing Officer of Darden Restaurants, Inc. (“Darden”) from June 2011 to November 2012 and as Senior Vice President, New Business Development of Darden from May 2007 to June 2011. Additionally, Mr. Buettgen served as President of Darden’s former Smokey Bones Barbeque & Grill concept from November 2004 to May 2007. Prior to his tenure at Darden, among other positions, Mr. Buettgen served as Senior Vice President of Marketing and Brand Development for Brinker International, Inc., Senior Vice President of Marketing and Sales for Disneyland Resorts, a division of the Walt Disney Company, Senior Vice President of Marketing for Hollywood Entertainment Group, and held various marketing positions with General Mills, Inc.
Mr. Patterson joined the Company in July 2013 and was named Ruby Tuesday Concept President in July 2015. Mr. Patterson served as Senior Vice President of Operations of the Company from September 2014 to July 2015 and served as Vice President of Operations from July 2013 to September 2014. Prior to joining the Company, between 1997 and 2013, Mr. Patterson served in various roles of increasing responsibility with Darden including Director of Operations for Bahama Breeze, Vice President of Operations for LongHorn Steakhouse, and Senior Vice President of Operations for Olive Garden.
Ms. Golder joined the Company in April 2013 and was named Executive Vice President, Chief Financial Officer, Treasurer, and Assistant Secretary in June 2014. Ms. Golder served as Senior Vice President, Finance, from April 2013 to June 2014. Prior to joining the Company, Ms. Golder served as Chief Financial Officer for Cooper’s Hawk Winery & Restaurants from December 2012 to April 2013. Prior to her tenure at Cooper’s Hawk Winery & Restaurants, Ms. Golder spent 23 years at Darden Restaurants, holding progressively responsible positions in finance. During her last 10 years with Darden, Ms. Golder held the position of Senior Vice President, Finance.
Ms. Parish joined the Company in March 2015 as Chief Legal Officer and Secretary. Prior to joining the Company, Ms. Parish served as Chief Legal, People and Risk Officer for Einstein Noah Restaurant Group from January 2010 to January 2015, and served as Executive Vice President, Chief Legal Officer and Secretary for Denny’s Corporation from July 1998 to July 2008. Prior to her tenure with Denny’s Corporation, Ms. Parish held a number of executive positions, including Assistant General Counsel for Wal-Mart Stores, Inc.
Mr. Skena joined the Company in July 2015 as Chief Marketing Officer. Prior to joining the Company, Mr. Skena served in various roles of increasing responsibility with PepsiCo, Inc. for the past nine years, most recently serving as Vice President of Premium and Value Brands. Prior to his tenure with PepsiCo, Inc., among other positions, Mr, Skena served over six years at Kraft Foods, Inc. in brand management for multiple product lines.
Our business and operations are subject to a number of risks and uncertainties. Additional risks and uncertainties not presently known to us or that we currently deem immaterial may also impair our business operations. If any of those risks actually occurs, our business, financial condition and results of operations would suffer. The risks discussed below also include forward-looking statements and our actual results may differ substantially from those discussed in these forward-looking statements. See “Special Note Regarding Forward-Looking Statements” in this Annual Report on Form 10-K.
We may be unsuccessful in driving short- and long-term profitable sales growth through our brand repositioning efforts, which may negatively impact our financial results.
We are in the process of executing a strategic brand transformation of the Ruby Tuesday concept which is designed to make our brand more energetic, affordable, and broadly appealing. We believe the execution of this strategy provides opportunities for increased customer counts, same-restaurant sales growth, and increased shareholder value. Our brand transformation strategy is centered around enhancements in four key areas: menu, service, atmosphere, and communication. This strategy involves numerous risks, and we may not be able to maintain the brand relevance and restaurant operating excellence required to achieve sustainable growth objectives with our Ruby Tuesday core brand. For example, short-term sales growth could be negatively affected if we are unable to drive near term customer count growth, and long-term sales growth could be negatively affected if we fail to extend our brand in ways that are relevant to our customers. A failure to define and deliver a clear, relevant brand that generates sustainable same-restaurant traffic growth and produces non-traditional sales and earnings growth opportunities, or a failure to evolve in-restaurant and brand support cost structures so that competitively strong sales growth results in stable and improving profit margins could have an adverse effect on our results of operations.
Competition may adversely affect our operations and financial results.
The restaurant industry is intensely competitive with respect to pricing, service, location, personnel, and type and quality of food. We compete within each market with national and regional restaurant chains and locally-owned restaurants. We also face growing competition as a result of the trend towards convergence in grocery, deli, and restaurant services, particularly in the supermarket industry which offers “convenient meals” in the form of improved entrées and side dishes from the deli section. Some of our competitors may be better established in the markets where our restaurants are or may be located. We also actively compete for management personnel and for attractive commercial real estate sites suitable for restaurants. In addition, factors such as inflation, increased food, labor, equipment, fixture and benefit costs, and difficulty in attracting qualified management and hourly employees may adversely affect the restaurant industry in general and our restaurants in particular.
We may not be successful at operating profitable restaurants, which could lead to impairment and other losses.
The success of our core Ruby Tuesday concept and our Lime Fresh concept, is dependent upon operating profitable restaurants. The profitability of our restaurants is dependent on numerous factors, including the following:
|
•
|
the ability to provide menu items with strong customer preference at attractive prices;
|
|
•
|
the ability to create and implement an effective marketing/advertising strategy;
|
|
•
|
the ability to adapt our brands in such a way that consumers see us as fresh and relevant;
|
|
•
|
the ability to timely and effectively meet customer demands and maintain our customer base;
|
|
•
|
the hiring, training, and retention of excellent restaurant managers and staff;
|
|
•
|
the ability to manage costs and prudently allocate capital resources;
|
|
•
|
the ability to achieve and/or maintain projected cost savings in a number of key areas, including labor, procurement, occupancy, and maintenance costs;
|
|
•
|
the ability to increase sales and improve margins following the opening of new restaurants; and
|
|
•
|
the ability to compete with other restaurants and retail businesses for desirable development sites, construction contractors, management personnel, hourly employees and other resources.
|
If we are unable to successfully manage these risks, we could face increased costs and lower than anticipated sales, cash flows, and earnings in future periods. Declining cash flows in particular can have an unfavorable impact on the carrying value of our long-lived assets, which, under generally accepted accounting principles, are required to be reviewed whenever adverse events or changes in circumstances indicate a possible impairment.
Impairment charges recorded in fiscal years 2015, 2014, and 2013 are discussed in Note 7 to the Consolidated Financial Statements. Further, as discussed within the Critical Accounting Policies section of our Management’s Discussion and Analysis of Financial Condition and Results of Operations, at June 2, 2015 we had 52 restaurants that had been open for more than six full quarters with rolling 12-month negative cash flows of which 34 have been impaired to salvage value.
If market conditions deteriorate at either the restaurant store level or system-wide, or if our operating results decline further, we may be required to record additional impairment charges.
Litigation could have an adverse impact on our business and our financial performance.
We are subject to lawsuits, administrative proceedings, and claims that arise in the regular course of business. These matters typically involve claims by customers, team members, and others regarding issues such as food borne illness, food safety, premises liability, “dram shop” statute liability, compliance with wage and hour requirements, work-related injuries, discrimination, harassment, wrongful termination, disability, and other operational issues common to the foodservice industry, as well as contract disputes and intellectual property infringement matters. We could be adversely affected by negative publicity and litigation costs resulting from these claims, regardless of their validity. Significant legal fees and costs in complex class action litigation or an adverse judgment or settlement that is not insured or is in excess of our insurance coverage could have an adverse effect on our financial position and results of operations.
Unfavorable publicity or a failure to respond effectively to adverse publicity, particularly on social media platforms, could harm our reputation and adversely impact our business and financial performance.
The good reputation of our restaurant concepts is a key factor in the success of our business. Actual or alleged incidents at any of our restaurants could result in harmful negative publicity. Even incidents occurring at restaurants operated by our competitors or in the supply chain generally could result in negative publicity that could harm the restaurant industry and thus, indirectly, our brands. Negative publicity may result from: allegations of illegal, unfair or inconsistent employment practices; employee dissatisfaction; guest discrimination; illness; injury; or any other matter that could give rise to litigation. Regardless of whether the allegations or complaints are valid, unfavorable publicity relating to a few of our restaurants, or even to a single restaurant, could adversely affect public perception of the entire brand.
Negative publicity also may result from the following: health concerns related to food safety and flu outbreaks; publication of government or industry findings concerning food products; environmental disasters; crime incidents; data privacy breaches; scandals involving our employees; or operational problems at our restaurants. All of these concerns could make our brands and menu offerings less appealing to our guests and negatively affect our business.
In recent years there has been an increase in the use of social media platforms and similar devices which allow individuals access to a broad audience of consumers and other interested persons. The availability of information on social media platforms is virtually immediate in its impact. A variety of risks are associated with the use of social media, including the improper disclosure of proprietary information, negative comments about our Company, exposure of personally identifiable information, fraud, or outdated information. The inappropriate use of social media platforms by our customers, employees, or other individuals could increase our costs, lead to litigation, or result in negative publicity that could damage our reputation. If we are unable to quickly and effectively respond, we may suffer declines in customer traffic which could affect our financial condition and results of operations.
A lack of availability of suitable locations for new restaurants or a decline in the quality of the locations of our current restaurants may adversely affect our sales and results of operations.
The success of our restaurants depends in large part on their locations. As demographic and economic patterns change, current locations may not continue to be attractive or profitable. Possible declines in neighborhoods where our restaurants are located or adverse economic conditions in areas surrounding those neighborhoods could result in reduced sales in those locations. In addition, desirable locations for new restaurant openings or for the relocation of existing restaurants may not be available at an acceptable cost when we identify a particular opportunity for a new restaurant or relocation. The occurrence of one or more of these events could have a significant adverse effect on our sales and results of operations.
Food safety and food-borne illness concerns in our restaurants or throughout the industry or supply chain may have an adverse effect on our business by reducing demand and/or increasing costs.
Regardless of the source or cause, any report of food-borne illnesses and other food safety issues, whether at one of our restaurants or in the industry or supply chain generally, could have a negative impact on our traffic and sales and adversely affect our suppliers and distributors and, as a result, be out of our control. Health concerns or outbreaks of disease in a food product could also reduce demand for particular menu offerings. Even in instances of food-borne illness, food tampering or food contamination occurring solely at restaurants of our competitors could result in negative publicity about the restaurant industry generally and adversely affect our sales. The occurrence of food-borne illnesses or food safety issues could also adversely affect the price and availability of affected ingredients, resulting in higher costs and lower margins.
Any material failure, weakness, interruption or security breach of our information technology systems could prevent us from effectively operating our business.
We rely heavily on information systems across our operations and corporate functions, including point-of-sale processing in our restaurants, management of our supply chain, payment of obligations, collection of cash, data warehousing to support analytics, finance and accounting systems and other various processes and procedures, some of which are handled by third parties. Our ability to efficiently and effectively manage our business depends significantly on the reliability and capacity of these systems. The failure of these systems to operate effectively, maintenance problems, upgrading or transitioning to new platforms, or a breach in security of these systems could result in delays in consumer service and reduce efficiency in our operations. These problems could adversely affect our results of operations, and remediation could result in significant unplanned capital investments. Additionally, our corporate systems and processes and corporate support for our restaurant operations are handled primarily at our Restaurant Support Services Center. We have disaster recovery procedures and business continuity plans in place to address events of a crisis nature, including tornadoes and other natural disasters, and back up and off-site locations for recovery of electronic and other forms of data and information. However, if we are unable to fully implement our disaster recovery plans, we may experience delays in recovery of data, inability to perform vital corporate functions, tardiness in required reporting and compliance, failures to adequately support field operations and other breakdowns in normal communication and operating procedures that could have a material adverse effect on our financial condition, results of operation and exposure to administrative and other legal claims.
We could be adversely affected if we fail to protect our customers’ credit card information or our employees’ personal data.
The majority of our restaurant sales are by credit or debit cards. Other restaurants and retailers have experienced security breaches in which credit and debit card information or other personal information of their customers has been stolen. We also maintain certain personal information regarding our employees. Despite our implementation of security measures, all of our technology systems are vulnerable to internal and external security breaches, employee error or malfeasance, denial of service attacks, viruses, worms, and other disruptive problems caused by hackers and cyber criminals. A breach in our systems that compromises the information of our consumers or employees could result in widespread negative publicity, damage to the reputation of our brands, a loss of consumers, and legal liabilities.
The potential for increases in key food, labor, energy, real estate and other costs may adversely affect our results of operations.
The performance of our restaurants depends on our ability to anticipate and react to changes in the price and availability of food, utilities, labor, marketing, insurance, real estate, and other commodities. Prices may be affected due to supply, market changes, increased competition, the general risk of inflation, changes in laws, shortages or interruptions in supply due to weather, disease or other conditions beyond our control, or other reasons. Increased prices or shortages could affect the cost and quality of the items we buy or require us to raise prices, limit our menu options, or implement alternative processes or products. We cannot provide any assurance that we would be able to successfully offset increased costs by increasing menu prices or by other measures, as our ability to do so depends on a variety of factors, many of which are beyond our control. As a result, these events, alone or in combination with other more general economic and demographic conditions, could impact our pricing and negatively affect our sales and profit margins.
The costs of compliance or noncompliance with government regulation related to our restaurant operations could adversely affect our business.
The restaurant industry is subject to extensive federal, state, local, and international laws and regulations, including but not limited to:
|
·
|
Federal and state laws governing minimum wages, health care, unionization, and other labor issues. These include the Fair Labor Standards Act of 1938 and requirements concerning overtime, paid or family leave, tip credits, working conditions, and safety standards. They include the Immigration Reform and Control Act of 1986, which requires among other things the preparation of Form I-9 to verify that employees are authorized to accept employment in the United States. They also include the Patient Protection and Affordable Care Act of 2010 which mandates minimum employee health care coverage and could significantly increase our employee health benefit costs over the coming years;
|
|
·
|
Building, zoning, land use, environmental, and other regulations and requirements that impact the development and operation of restaurants;
|
|
·
|
Licensing and regulation by state and local authorities relating to health, sanitation, safety, and fire standards and the sale of alcoholic beverages. If we fail to comply with federal, state, or local regulations, our licenses may be revoked and we may be forced to close one or more of our restaurants;
|
|
·
|
"Dram Shop" statutes in certain states. These statutes generally provide a person injured by an intoxicated person the right to recover damages from an establishment that wrongfully served alcoholic beverages to the intoxicated person;
|
|
·
|
Laws and regulations relating to the preparation and sale of food, including regulations regarding product safety, nutritional content, and menu labeling. The Food and Drug Administration recently adopted final regulations to implement federal nutrition disclosure requirements. If costs of implementing or complying with these new requirements exceed our expectations our results of operations could be adversely affected. Furthermore, the effect of such labeling requirements on consumer choices, if any, is unclear;
|
|
·
|
Federal and state laws which prohibit discrimination, including employment discrimination, and other laws regulating the design and operation of facilities, such as the Americans with Disabilities Act. Compliance with these laws and regulations can be costly and increase our exposure to litigation and governmental proceedings, and a failure or perceived failure to comply with these laws could result in negative publicity that could harm our reputation;
|
|
·
|
Federal, state and local laws governing the use, storage, discharge, emission, and disposal of hazardous materials. There also has been increasing focus by United States and overseas governmental authorities on other environmental matters, such as climate change, the reduction of greenhouse gases, and water consumption. This increased focus may lead to new initiatives directed at regulating a yet to be specified array of environmental matters, such as the emission of greenhouse gases, that could effectively impose a new or increased tax on the Company or its suppliers, which may pass the increased cost to the Company. Legislative, regulatory, or other efforts to combat climate change or other environmental concerns could result in future increases in the cost of raw materials, taxes, transportation, and utilities, which could decrease our operating profits and necessitate future investments in facilities and equipment; and
|
|
·
|
Regulations throughout the world affecting the way we do business with our international franchisees. These include antitrust and tax requirements, anti-boycott regulations, import/export/customs and other international
|
|
|
trade regulations, the USA Patriot Act, and the Foreign Corrupt Practices Act. Failure to comply with any such legal requirements could subject us to monetary liabilities and other sanctions, which could adversely affect our business and financial performance.
|
A failure to comply with these or other government regulations could adversely affect our financial condition and results of operations.
Shortages or interruptions in the availability and delivery of food and other products may increase costs or reduce revenues.
Possible shortages or interruptions in the supply of food items and other products to our restaurants caused by inclement weather and natural disasters such as floods, drought, earthquakes and hurricanes; the inability of our suppliers to obtain credit in a tight credit market or remain solvent given disruptions in the financial markets; food safety warnings or advisories or the prospect of such pronouncements; or other conditions beyond our control, could adversely affect the availability, quality, and cost of items we buy and the operations of our restaurants. Our inability to effectively manage supply chain risk could increase our costs and limit the availability of products critical to our restaurant operations.
In addition, we have a limited number of suppliers for our major products and rely on one custom distribution company for our national distribution program in the U.S. If our suppliers or custom distributor are unable to fulfill their obligations under their contracts or we are unable to develop or maintain relationships with these or new suppliers or distributors, if needed, we could encounter supply shortages and incur higher costs.
Ineffective or increased costs of advertising and marketing may negatively affect our financial and operational success.
If our advertising and promotions become less effective than those of our competitors, or more costly, or if we do not adequately develop or utilize technology and data analytic capabilities needed to generate concise competitive insight, we could experience an adverse effect on our results of operations. A failure to sufficiently innovate, develop customer relationship initiatives, or maintain adequate and cost-effective advertising could inhibit our ability to maintain brand relevance and drive increased sales.
Our debt agreements contain restrictions that limit our flexibility in operating our business.
The indenture governing our senior unsecured notes, the agreement governing our December 2013 four-year revolving credit agreement (the “Senior Credit Facility”), and our mortgage loan obligations contain various covenants that limit our ability to engage in specified types of transactions, including transactions that may be in our long-term best interest. These covenants limit our ability to, among other things:
|
•
|
make certain investments, including investments in our restaurant facilities;
|
|
•
|
incur or guarantee additional indebtedness;
|
|
•
|
declare or pay dividends, redeem stock or make other distributions to stockholders;
|
|
•
|
create liens or use assets as security in other transactions;
|
|
•
|
merge or consolidate, or sell, transfer, lease or dispose of substantially all of our assets;
|
|
•
|
enter into transactions with affiliates; and
|
|
•
|
sell or transfer certain assets.
|
Additionally, the agreement governing the Senior Credit Facility and our mortgage loan obligations require us to maintain certain financial ratios. A breach of any of these covenants could result in a default under the indenture and the Senior Credit Facility, which could have a material adverse effect on us. We may also be unable to take advantage of business opportunities that arise because of the limitations imposed on us by the restrictive covenants under our indebtedness.
-14-
Our ability to raise capital in the future may be limited or become more costly, which could make us unable to fund our capital requirements.
As of June 2, 2015, we had $245.0 million of outstanding indebtedness, including $215.0 million of senior unsecured notes. Our substantial indebtedness could have any or all of the following consequences:
|
•
|
there would be a material adverse effect on our business and financial condition if we were unable to service our indebtedness or obtain additional financing, as needed;
|
|
•
|
it may limit our ability to borrow money or sell stock to fund our working capital, capital expenditures, and debt service requirements;
|
|
•
|
a substantial portion of our cash flow from operations could be dedicated to the repayment of our indebtedness and would not be available for other purposes;
|
|
•
|
it may limit our flexibility in planning for, or reacting to, changes in our business;
|
|
•
|
we may be more highly leveraged than some of our competitors, which may place us at a competitive disadvantage; and
|
|
•
|
it may make us more vulnerable to a downturn in our business or the economy.
|
In the future, we may need to raise additional funds through the issuance of new equity securities, debt or a combination of both. Additional financing may not be available on favorable terms or at all. If adequate funds are not available on acceptable terms, we may be unable to fund our capital requirements.
Loss of key management personnel could hurt our business and limit our ability to operate and grow successfully.
Our success depends, to a significant extent, on our leadership team and other key management personnel. These personnel serve to maintain a corporate vision for our Company, execute our business strategy, and maintain consistency in the operating standards of our restaurants. If we are unable to attract and retain sufficiently experienced and capable management personnel, our business and financial results may suffer.
A material weakness in our internal control over financial reporting could significantly affect our financial results.
Internal control over financial reporting is a process to provide reasonable assurance regarding the reliability of external financial reports in accordance with accounting principles generally accepted in the United States of America. Because of its inherent limitations, internal control over financial reporting is not intended to provide absolute assurance that we would prevent or detect a misstatement of our financial statements or fraud. Any failure to maintain an effective system of internal control over financial reporting could limit our ability to report our financial results accurately and timely or to detect and prevent fraud. A significant financial reporting failure or material weakness in internal control over financial reporting could cause a loss of investor confidence and declines in the market price of our common stock.
Future deterioration or prolonged difficulty in economic conditions could adversely affect our business, results of operations, liquidity, and capital resources.
Job losses, foreclosures, bankruptcies, and falling home prices could cause customers to make fewer discretionary purchases, which could cause a decrease in our customer traffic and our average profit per transaction, which would in turn negatively affect our results of operations. In addition, if gasoline, natural gas, electricity and other energy costs increase, and credit card, home mortgage, and other borrowing costs increase with rising interest rates, our customers may have lower disposable income and reduce the frequency with which they dine out, spend less on each dining out occasion, or choose more inexpensive restaurants. Unfavorable changes in the above factors or in other business and economic conditions affecting our customers could increase our costs, reduce traffic in some or all of our restaurants, or impose practical limits on pricing, any of which could lower our profit margins and have a material adverse effect on our financial condition and results of operations.
Our insurance policies may not provide adequate levels of coverage against all claims, and fluctuating insurance requirements and costs could negatively impact our profitability.
We self-insure a significant portion of expected losses under our health, workers’ compensation, certain types of general liability claims, employment practices liability, and property insurance programs. However, there are types of losses we may incur that cannot be insured against or that we believe are not commercially reasonable to insure, including wage and hour claims. These losses, if they occur, could have a material and adverse effect on our business and results of operations. Unanticipated changes in the actuarial assumptions and management estimates underlying our reserves for these losses could result in materially different amounts of expense under these programs, which could have a material adverse effect on our financial condition, results of operations and liquidity. Additionally, if our insurance costs increase, there can be no assurance that we will be able to successfully offset the effect of such increases and our results of operations may be adversely affected.
Changing health or dietary preferences may cause consumers to avoid our products in favor of alternative foods.
Consumer tastes, demographic trends, and health needs could reduce sales. For instance, if prevailing health or dietary preferences cause consumers to avoid certain menu items we offer in favor of foods that are perceived as more healthy, our business and operating results could be harmed. The increasing prevalence of food allergies and other dietary restrictions or preferences, for example, may cause consumers to choose to dine out less frequently or choose other restaurants with different menu options.
Adverse weather conditions, natural disasters, and terrorism could adversely affect our results of operations.
Adverse weather conditions and natural disasters and other unforeseen events, such as winter storms, severe temperatures, thunderstorms, floods, hurricanes and earthquakes, terror attacks, war and widespread/pandemic illness, and the effects of such events on economic conditions and consumer spending patterns, could negatively impact our results of operations. Temporary and prolonged restaurant closures may occur and customer traffic may decline due to the actual or perceived effects from these events.
Changes in financial accounting standards or management assumptions related to complex accounting matters could significantly affect our financial results.
A change in accounting standards can have a significant effect on our reported results and may affect our reporting of transactions completed before the change is effective. Additionally, our assumptions, estimates, and judgments related to complex accounting matters could significantly affect our financial results. Significant accounting judgments relevant to our business, include but are not limited to, impairment of long-lived assets, income tax matters, lease obligations, share-based compensation, and self-insured losses. Changes in accounting standards or changes in underlying assumptions, estimates, and judgments by our management could significantly change our reported or expected financial performance.
Changes in tax laws and unanticipated tax liabilities could adversely affect the taxes we pay and our profitability.
We are subject to income and other taxes in the United States and certain foreign jurisdictions. Our effective income tax rate in the future could be adversely affected by a number of factors, including changes in the valuation of deferred tax assets and liabilities, changes in tax laws, and the outcome of income tax audits. Although we believe our tax estimates are reasonable, the final determination of tax audits could be materially different from our historical income tax provisions and accruals. The results of a tax audit could have a material effect on our results of operations or cash flows in the period or periods for which that determination is made. In addition, our effective income tax rate and our results may be impacted by our ability to realize deferred tax benefits and by any increases or decreases of our valuation allowances applied to our existing deferred tax assets.
None.
Information regarding the locations of our restaurants is shown in the list below. Of the 677 Company-owned and operated restaurants as of June 2, 2015, we owned the land and buildings for 303 restaurants, owned the buildings and held non-cancelable long-term land leases for 257 restaurants, and held non-cancelable leases covering land and buildings for 117 restaurants. Our Restaurant Support Services Center in Maryville, Tennessee, which was opened in fiscal year 1998, consists of two office buildings owned by the Company. During fiscal year 2015, we opened a leased satellite office in Orlando, Florida.
Additional information concerning our properties and leasing arrangements is included in Note 5 to the Consolidated Financial Statements appearing in Part II, Item 8 of this Annual Report on Form 10-K.
Under our franchise agreements, we have certain rights to gain control of a restaurant site in the event of default under the franchise agreements.
Ruby Tuesday Concept
The following table lists the locations of the Company-owned and franchised Ruby Tuesday restaurants as of June 2, 2015.
|
Number of Ruby Tuesday Restaurants
|
|||||
|
State
|
Company
|
Franchise
|
Total
|
||
|
Domestic:
|
|||||
|
Alabama
|
36
|
–
|
36
|
||
|
Arizona
|
4
|
–
|
4
|
||
|
Arkansas
|
7
|
–
|
7
|
||
|
Colorado
|
9
|
–
|
9
|
||
|
Connecticut
|
14
|
–
|
14
|
||
|
Delaware
|
6
|
–
|
6
|
||
|
Florida
|
68
|
1
|
69
|
||
|
Georgia
|
46
|
–
|
46
|
||
|
Idaho
|
–
|
1
|
1
|
||
|
Illinois
|
3
|
11
|
14
|
||
|
Indiana
|
12
|
–
|
12
|
||
|
Iowa
|
1
|
2
|
3
|
||
|
Kansas
|
1
|
–
|
1
|
||
|
Kentucky
|
8
|
–
|
8
|
||
|
Louisiana
|
3
|
–
|
3
|
||
|
Maine
|
10
|
–
|
10
|
||
|
Maryland
|
30
|
–
|
30
|
||
|
Massachusetts
|
9
|
–
|
9
|
||
|
Michigan
|
23
|
1
|
24
|
||
|
Minnesota
|
12
|
–
|
12
|
||
|
Mississippi
|
8
|
–
|
8
|
||
|
Missouri
|
25
|
–
|
25
|
||
|
Nebraska
|
6
|
–
|
6
|
||
|
Nevada
|
1
|
–
|
1
|
||
|
New Hampshire
|
3
|
–
|
3
|
||
|
New Jersey
|
26
|
1
|
27
|
||
|
New Mexico
|
–
|
1
|
1
|
||
|
New York
|
29
|
–
|
29
|
||
|
North Carolina
|
53
|
–
|
53
|
||
|
North Dakota
|
–
|
4
|
4
|
||
-17-
|
Ohio
|
29
|
–
|
29
|
||
|
Oklahoma
|
–
|
1
|
1
|
||
|
Oregon
|
3
|
–
|
3
|
||
|
Pennsylvania
|
40
|
–
|
40
|
||
|
Rhode Island
|
2
|
–
|
2
|
||
|
South Carolina
|
31
|
–
|
31
|
||
|
South Dakota
|
–
|
4
|
4
|
||
|
Tennessee
|
31
|
–
|
31
|
||
|
Texas
|
1
|
1
|
2
|
||
|
Utah
|
1
|
–
|
1
|
||
|
Virginia
|
58
|
–
|
58
|
||
|
West Virginia
|
8
|
–
|
8
|
||
|
Wisconsin
|
1
|
1
|
2
|
||
|
Total Domestic
|
658
|
29
|
687
|
|
Number of Ruby Tuesday Restaurants
|
||||||
|
Country
|
Company
|
Franchise
|
Total
|
|||
|
International:
|
||||||
|
Canada
|
–
|
1
|
1
|
|||
|
Chile
|
–
|
10
|
10
|
|||
|
Egypt
|
–
|
5
|
5
|
|||
|
El Salvador
|
–
|
1
|
1
|
|||
|
Guam*
|
–
|
1
|
1
|
|||
|
Hawaii*
|
–
|
5
|
5
|
|||
|
Honduras
|
–
|
1
|
1
|
|||
|
Hong Kong
|
–
|
8
|
8
|
|||
|
Iceland
|
–
|
2
|
2
|
|||
|
Kuwait
|
–
|
6
|
6
|
|||
|
Panama
|
–
|
1
|
1
|
|||
|
Romania
|
–
|
2
|
2
|
|||
|
Saudi Arabia
|
–
|
2
|
2
|
|||
|
Trinidad
|
–
|
3
|
3
|
|||
|
United Kingdom
|
–
|
1
|
1
|
|||
|
Total International
|
–
|
49
|
49
|
|||
|
658
|
78
|
736
|
||||
|
* Guam and Hawaii are treated as international locations for internal purposes.
|
||||||
Lime Fresh
The following table lists the locations of the Company-owned and domestic franchised Lime Fresh concept restaurants as of June 2, 2015.
|
Number of Lime Fresh Restaurants
|
|||||||
|
State
|
Company
|
Franchise
|
Total
|
||||
|
Alabama
|
1
|
–
|
1
|
||||
|
Florida
|
11
|
6
|
17
|
||||
|
North Carolina
|
3
|
–
|
3
|
||||
|
Ohio
|
2
|
–
|
2
|
||||
|
Texas
|
–
|
1
|
1
|
||||
|
Virginia
|
1
|
–
|
1
|
||||
|
Washington, DC
|
1
|
–
|
1
|
||||
|
Total
|
19
|
7
|
26
|
||||
We are presently, and from time to time, subject to pending claims and lawsuits arising in the ordinary course of business, including claims relating to injury or wrongful death under “dram shop” laws, workers’ compensation and employment matters, claims relating to lease and contractual obligations, and claims from customers alleging illness or injury. We provide reserves for such claims when payment is probable and estimable in accordance with U.S. generally accepted accounting principles. At this time, in the opinion of management, the ultimate resolution of pending legal proceedings will not have a material adverse effect on our consolidated operations, financial position or cash flows.
On July 23, 2014, a case styled Kimberly LaFrance, et al. v. Ruby Tuesday, Inc., was filed against the Company in the State of New York Supreme Court, County of Onondaga on behalf of the plaintiff and all other similarly situated individuals. The plaintiff is alleging violations of certain wage notice requirements under New York law and is seeking wages, liquidated damages and attorneys’ fees. The matter has been removed to the United States District Court for the Northern District of New York. On November 20, 2014, we filed a motion to dismiss, which was followed by motions filed by the plaintiff on December 29, 2014, for class certification, and on December 31, 2014, for partial summary judgment. The parties agreed to mediate the case, and on March 5, 2015, the court stayed all deadlines in the matter pending the completion of mediation. On August 5, 2015, the parties agreed to resolve the matter, but the agreement requires court approval and will take several months to finalize. We believe that we have accrued an appropriate amount based on the agreement in principle.
See Note 12 to the Consolidated Financial Statements appearing in Part II, Item 8 of this Annual Report on Form 10-K, for more information about our legal proceedings as of June 2, 2015.
Not applicable.
PART II
Related Stockholder Matters and Issuer Purchases of Equity Securities
Market for Registrant’s Common Equity and Related Stockholder Matters
Ruby Tuesday, Inc. common stock is publicly traded on the New York Stock Exchange under the ticker symbol RT.
The following table sets forth the reported high and low intraday prices of our common stock and cash dividends paid thereon for each quarter during fiscal years 2015 and 2014.
|
Fiscal Year Ended June 2, 2015
|
Fiscal Year Ended June 3, 2014
|
||||||||||||||||||||||||
|
Per Share
|
Per Share
|
||||||||||||||||||||||||
|
Cash
|
Cash
|
||||||||||||||||||||||||
|
Quarter
|
High
|
Low
|
Dividends
|
Quarter
|
High
|
Low
|
Dividends
|
||||||||||||||||||
|
First
|
$ | 8.13 | $ | 5.43 | -- |
First
|
$ | 9.90 | $ | 7.03 | -- | ||||||||||||||
|
Second
|
$ | 8.57 | $ | 5.72 | -- |
Second
|
$ | 7.96 | $ | 5.40 | -- | ||||||||||||||
|
Third
|
$ | 8.39 | $ | 5.73 | -- |
Third
|
$ | 7.68 | $ | 5.14 | -- | ||||||||||||||
|
Fourth
|
$ | 7.65 | $ | 5.92 | -- |
Fourth
|
$ | 8.22 | $ | 5.17 | -- | ||||||||||||||
As of August 12, 2015, there were approximately 2,671 holders of record of the Company’s common stock.
Our Board of Directors has approved a dividend policy as an additional means of returning capital to our shareholders. The payment of a dividend in any particular future period and the actual amount thereof remains at the discretion of the Board of Directors and is restricted by the covenants of certain of our debt agreements. Our last dividend was paid on August 7, 2007 and no assurance can be given that dividends will be paid in the future.
Issuer Purchases of Equity Securities
The following table includes information regarding purchases of our common stock made by us during the fourth fiscal quarter ending June 2, 2015:
|
(a)
|
(b)
|
(c)
|
(d)
|
||||||||||
|
Total number
|
Average
|
Total number of shares
|
Maximum number of shares
|
||||||||||
|
of shares
|
price paid
|
purchased as part of publicly
|
that may yet be purchased
|
||||||||||
|
Period
|
purchased (1)
|
per share
|
announced plans or programs (1)
|
under the plans or programs (2)
|
|||||||||
|
Month #1
|
|||||||||||||
|
(March 4 to April 7)
|
– | $ | – | – | 11,764,096 | ||||||||
|
Month #2
|
|||||||||||||
|
(April 8 to May 5)
|
– | – | – | 11,764,096 | |||||||||
|
Month #3
|
|||||||||||||
|
(May 6 to June 2)
|
– | – | – | 11,764,096 | |||||||||
|
Total
|
– | $ | – | – | |||||||||
(1) No shares were repurchased other than through our publicly-announced repurchase programs and authorizations during our fiscal year ended June 2, 2015.
(2) As of June 2, 2015, 11.8 million shares remained available for purchase under existing programs, which consists of 1.8 million shares remaining under a July 11, 2007 authorization by the Board of Directors to repurchase 6.5 million shares and a January 8, 2013 authorization by the Board of Directors, not yet begun, to repurchase 10.0 million shares. The timing, price, quantity, and manner of the purchases to be made are at the discretion of management upon instruction from the Board of Directors, depending upon market conditions. The repurchase of shares in any particular future period and the actual amount thereof remain at the discretion of the Board of Directors, and no assurance can be given that shares will be repurchased in the future.
Stock Performance Graph
The following chart and table compare the cumulative total return of the Company’s common stock with the cumulative total return of the NYSE Composite Index and a peer group consisting of companies included in the same standard industrial classification (“SIC”) industry group as the Company’s business (SIC industry group 5812, Eating Places). The graph assumes the values of the investment in our common stock and each index was $100 at June 1, 2010 and that all dividends were reinvested.
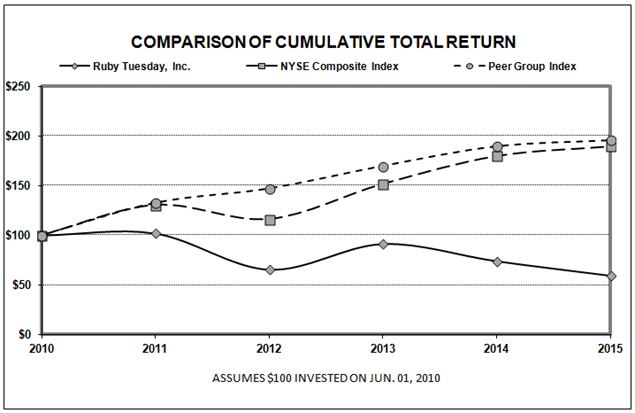
|
06/01/2010
|
05/31/2011
|
06/05/2012
|
06/04/2013
|
06/03/2014
|
06/02/2015
|
|||||||||||||||||||
|
Ruby Tuesday, Inc.
|
$ | 100.00 | $ | 101.92 | $ | 65.38 | $ | 91.35 | $ | 73.94 | $ | 59.23 | ||||||||||||
|
NYSE Composite Index
|
$ | 100.00 | $ | 130.59 | $ | 116.33 | $ | 151.87 | $ | 180.05 | $ | 189.80 | ||||||||||||
|
Peer Group Index (SIC
|
$ | 100.00 | $ | 132.66 | $ | 147.19 | $ | 170.03 | $ | 189.83 | $ | 195.95 | ||||||||||||
| 5812 – Eating Places) | ||||||||||||||||||||||||
Summary of Operations
(In thousands except per-share data)
|
Fiscal Year
|
||||||||||||||||||||
|
2015
|
2014
|
2013
|
2012
|
2011
|
||||||||||||||||
|
Revenue:
|
||||||||||||||||||||
|
Restaurant sales and operating revenue
|
$ | 1,120,142 | $ | 1,162,423 | $ | 1,245,226 | $ | 1,306,025 | $ | 1,254,026 | ||||||||||
|
Franchise revenue
|
6,424 | 6,323 | 6,261 | 5,738 | 7,147 | |||||||||||||||
|
Total revenue
|
$ | 1,126,566 | $ | 1,168,746 | $ | 1,251,487 | $ | 1,311,763 | $ | 1,261,173 | ||||||||||
|
(Loss)/income from continuing operations
|
||||||||||||||||||||
|
before income taxes
|
$ | (5,105 | ) | $ | (69,575 | ) | $ | (21,934 | ) | $ | (8,626 | ) | $ | 57,118 | ||||||
|
(Benefit)/provision for income taxes from
|
||||||||||||||||||||
|
continuing operations
|
(1,911 | ) | (4,665 | ) | 1,500 | (12,152 | ) | 7,563 | ||||||||||||
|
(Loss)/income from continuing operations
|
(3,194 | ) | (64,910 | ) | (23,434 | ) | 3,526 | 49,555 | ||||||||||||
|
Income/(loss) from discontinued operations, net
|
||||||||||||||||||||
|
of tax (a)
|
– | 564 | (15,979 | ) | (3,714 | ) | (2,677 | ) | ||||||||||||
|
Net (loss)/income
|
$ | (3,194 | ) | $ | (64,346 | ) | $ | (39,413 | ) | $ | (188 | ) | $ | 46,878 | ||||||
|
Basic (loss)/earnings per share:
|
||||||||||||||||||||
|
(Loss)/income from continuing operations
|
$ | (0.05 | ) | $ | (1.08 | ) | $ | (0.38 | ) | $ | 0.06 | $ | 0.77 | |||||||
|
Income/(loss) from discontinued operations
|
– | 0.01 | (0.27 | ) | (0.06 | ) | (0.04 | ) | ||||||||||||
|
Net (loss)/earnings per share
|
$ | (0.05 | ) | $ | (1.07 | ) | $ | (0.65 | ) | $ | (0.00 | ) | $ | 0.73 | ||||||
|
Diluted (loss)/earnings per share:
|
||||||||||||||||||||
|
(Loss)/income from continuing operations
|
$ | (0.05 | ) | $ | (1.08 | ) | $ | (0.38 | ) | $ | 0.06 | $ | 0.76 | |||||||
|
Income/(loss) from discontinued operations
|
– | 0.01 | (0.27 | ) | (0.06 | ) | (0.04 | ) | ||||||||||||
|
Net (loss)/earnings per share
|
$ | (0.05 | ) | $ | (1.07 | ) | $ | (0.65 | ) | $ | (0.00 | ) | $ | 0.72 | ||||||
|
Weighted average common and common
|
||||||||||||||||||||
|
equivalent shares:
|
||||||||||||||||||||
|
Basic
|
60,580 | 60,231 | 61,040 | 62,916 | 64,029 | |||||||||||||||
|
Diluted
|
60,580 | 60,231 | 61,040 | 63,508 | 64,948 | |||||||||||||||
|
Fiscal years 2015, 2014, 2013, and 2011 each include 52 weeks. Fiscal year 2012 includes 53 weeks. The extra week in fiscal year 2012 added
|
|
$22.9 million to revenue and $0.03 to diluted earnings per share.
|
|
(a) See Note 3 to the Consolidated Financial Statements for a discussion of our discontinued operations.
|
|
Fiscal Year
|
||||||||||||||||||
| 2015 | 2014 | 2013 | 2012 | 2011 | ||||||||||||||
|
Other Data
|
||||||||||||||||||
|
Cash dividends per share of common stock
|
$ | – | $ | – | $ | – | $ | – | $ | – | ||||||||
|
Number of Company-owned Ruby Tuesday
|
||||||||||||||||||
|
restaurants
|
658 | 668 | 706 | 714 | 750 | |||||||||||||
|
Company-owned Ruby Tuesday same-
|
||||||||||||||||||
|
restaurant sales change
|
(0.5 | )% | (5.3 | )% | (1.0 | )% | (4.5 | ) | 0.9 | % | ||||||||
|
Number of Company-owned Lime Fresh
|
||||||||||||||||||
|
restaurants
|
19 | 20 | 18 | 13 | – | |||||||||||||
|
Balance Sheet Data (at year end):
|
||||||||||||||||||
|
Total assets
|
$ | 929,391 | $ | 956,427 | $ | 1,043,183 | $ | 1,173,537 | $ | 1,187,026 | ||||||||
|
Long-term debt and capital leases, less current
|
||||||||||||||||||
|
maturities
|
$ | 234,173 | $ | 253,875 | $ | 290,515 | $ | 314,209 | $ | 329,184 | ||||||||
|
Shareholders’ equity
|
$ | 465,583 | $ | 461,209 | $ | 516,835 | $ | 576,224 | $ | 591,713 | ||||||||
|
Statement of Operations Data:
|
||||||||||||||||||
|
Closures and impairments, net (b)
|
$ | 10,542 | $ | 32,831 | $ | 14,656 | $ | 16,751 | $ | 4,175 | ||||||||
|
Goodwill and trademark impairments (b)
|
$ | – | $ | 855 | $ | 14,058 | $ | 16,919 | $ | – | ||||||||
|
Interest expense, net
|
$ | 22,735 | $ | 24,945 | $ | 26,576 | $ | 23,312 | $ | 13,508 | ||||||||
|
Cash Flow Data:
|
||||||||||||||||||
|
Net cash provided/(used) by:
|
||||||||||||||||||
|
Operating activities
|
$ | 54,911 | $ | 45,375 | $ | 35,954 | $ | 112,251 | $ | 116,292 | ||||||||
|
Investing activities
|
$ | (17,497 | ) | $ | (6,203 | ) | $ | 22,113 | $ | (33,755 | ) | $ | (24,492 | ) | ||||
|
Financing activities
|
$ | (13,409 | ) | $ | (40,753 | ) | $ | (53,344 | ) | $ | (40,034 | ) | $ | (91,647 | ) | |||
|
Purchases of property and equipment
|
$ | 31,010 | $ | 28,339 | $ | 37,117 | $ | 37,966 | $ | 26,684 | ||||||||
(b) See Note 7 to the Consolidated Financial Statements for a description of closures and impairments expenses in fiscal years 2015, 2014, and 2013 and discussion of the goodwill and trademark impairments in fiscal years 2014 and 2013.
Item 7. Management's Discussion and Analysis
of Financial Condition and Results of Operations
Introduction
Ruby Tuesday, Inc., including its wholly-owned subsidiaries (“RTI,” the “Company,” “we” and/or “our”), owns and operates Ruby Tuesday® casual dining and Lime Fresh Mexican Grill® (“Lime Fresh”) fast casual restaurants. We also franchise the Ruby Tuesday and Lime Fresh concepts in select domestic and international markets. As of June 2, 2015, we owned and operated 658 Ruby Tuesday restaurants located in 38 states. Our franchisees operated 29 domestic and 49 international Ruby Tuesday restaurants in 13 states, Guam, and 13 foreign countries. The Company-owned and operated restaurants are concentrated primarily in the Southeast, Northeast, Mid-Atlantic, and Midwest regions of the United States. We consider these regions to be our core markets.
As of June 2, 2015, there were 19 Company-owned and operated Lime Fresh restaurants, as well as seven domestic Lime Fresh restaurants operated by franchisees.
Our same-restaurant sales for Company-owned Ruby Tuesday restaurants decreased 0.5% in fiscal year 2015 compared to fiscal year 2014, and our diluted loss per share was $0.05 in fiscal year 2015 compared to diluted loss per share of $1.07 in fiscal year 2014. Throughout this Management’s Discussion and Analysis of Financial Condition and Results of Operations (“MD&A”), we discuss our fiscal year 2015 financial results in detail, provide insight for fiscal years 2014 and 2013, as well as discuss known events, uncertainties, and trends. We believe our commentary provides insight as to the factors which impacted our performance. We remind you, that, in order to best obtain an understanding of our financial performance during the last three fiscal years, this MD&A should be read in conjunction with the Consolidated Financial Statements and related Notes appearing in Part II, Item 8 of this Annual Report on Form 10-K.
References to franchise system revenue contained in this section are presented solely for the purposes of enhancing the investor's understanding of the franchise system, which includes our traditional domestic and international franchisees. Franchise system revenue is not included in, and is not, revenue of Ruby Tuesday, Inc. However, we believe that such information does provide the investor with a basis for a better understanding of our revenue from franchising activities, which includes royalties. Franchise system revenue contained in this section is based upon or derived from information that we obtain from our franchisees in our capacity as franchisor.
Overview and Strategies
The bar and grill segment of the casual dining industry in which we primarily operate is intensely competitive with respect to prices, services, convenience, locations, employees, advertising and promotion, and the types and quality of food. We compete with other food service operations, including locally-owned restaurants, and other national and regional restaurant chains that offer similar types of services and products as we do. We continue to believe there are opportunities to grow our business, strengthen our competitive position, enhance our profitability, and create value through the execution of the following strategies:
Enhancing Our Business Model
Over the past year, we made significant progress towards lowering our overall cost structure with identified reductions in cost of goods sold, payroll and related costs, and selling, general, and administrative expenses. In April 2014, we implemented a new labor management system to facilitate more efficient staffing that is contributing to lower labor costs. Further, we are in the process of implementing enhanced business processes and capabilities, such as an inventory/food waste management system that should benefit our business model by reducing food waste and manager time on inventory management leading to a better customer experience and improved profitability. We believe there is opportunity to further improve our business model with a continued focus on improving our restaurant level margins through the implementation of business technology platforms and through a continued focus on lowering our overall cost structure.
Enhance Sales and Margins Through Repositioning of Our Core Brand
We are in the process of executing a strategic brand transformation of the Ruby Tuesday concept which is designed to make our brand more energetic, affordable, and broadly appealing. We believe the execution of this strategy provides opportunities for increased customer counts, same-restaurant sales growth, and increased shareholder value. Our brand transformation is supported by four key pillars: food, service, atmosphere, and communication.
As part of our transformation strategy, we have taken what we believe to be meaningful steps to improve our food, customer experience, organizational capabilities, and business model. We continue to transform our menu to be broadly appealing, approachable, and affordable by offering compelling value throughout the menu at a wide-range of price points. Our intent is to incorporate customer feedback to continue to evolve our menu as well as to promote menu items that customers find highly satisfying.
Enhancing our service is also a critical component of our brand transformation strategy. As we introduced new menu and culinary platforms, we also simplified recipes and operational processes which we believe will result in better and more consistent food and service execution. Further, in January 2015, we rolled-out a new service training platform which encourages our restaurant teams to provide a genuine, customized experience to our customers while also reinforcing techniques to build add-on sales for beverages, appetizers and desserts.
To further enhance the atmosphere of our restaurants, we also introduced more casual and colorful new team uniforms and have evolved the menu design, both of which better reflect our brand personality. In addition, we are currently developing a remodel plan and we expect to begin testing prototypes in fiscal year 2016 to determine sales building potential, cost effectiveness, and return on investment. We believe these combined changes will deliver an improved customer experience and create a more energetic dining atmosphere for our customers.
The fourth pillar of our brand transformation strategy is our communication and marketing programs. The program is designed to reshape consumer perceptions of the Ruby Tuesday brand and enhance our Fresh American Grill positioning by showcasing our brand personality in a fresh and energetic way, featuring compelling new food products, highlighting the freshness and variety of our Garden Bar, and effectively communicating value and affordability. We continue to build key capabilities in our marketing organization, strengthen our culinary innovation pipeline, and become more efficient, expansive and cost-effective with our marketing spend including leveraging digital and social media platforms.
The four key areas of menu, service, atmosphere, and communication will continue to be foundational drivers of our brand transformation and key to building a stronger business model. We expect the culmination of the four pillars working fluidly together in conjunction with engaged restaurant and support teams will ultimately drive customer counts, sales, and average check.
Strengthen our Balance Sheet to Facilitate Growth and Value Creation
Our objective over the next several years is to grow our net cash provided by operating activities, which will provide us with funds that can be used to reinvest in our restaurants to support the business. We also plan to continue to reduce outstanding debt levels in order to improve our credit metrics to ensure access to capital at reasonable rates while providing flexibility for overall business needs and economic conditions. Our success in the key strategic initiatives outlined above should enable us to improve both our returns on assets and equity and create additional shareholder value.
During the second quarter of fiscal year 2014, we entered into a four-year $50.0 million revolving credit agreement (the “Senior Credit Facility”). Our Senior Credit Facility, which is secured by substantially all of the shares of capital stock of the Company’s subsidiaries, real property, improvements and fixtures of 49 Ruby Tuesday restaurants, and substantially all of the personal property of the Company and each of its present and future subsidiaries, was obtained to provide access to capital for general corporate purposes and provides us with more covenant flexibility than our previous revolving credit facility. The Senior Credit Facility has a $35.0 million accordion feature which provides us with additional liquidity if needed. Aside from the $12.5 million allocated to letters of credit issued primarily in conjunction with our insurance programs, the $50.0 million revolving Senior Credit Facility has remained undrawn.
Results of Operations
Ruby Tuesday Restaurants
The table below presents the number of Ruby Tuesday concept restaurants at each fiscal year end from fiscal 2011 through fiscal 2015:
|
Fiscal Year
|
Company-Owned
|
Domestic Franchise
|
International
Franchise
|
Total
|
|
2015
|
658
|
29
|
49
|
736
|
|
2014
|
668
|
31
|
48
|
747
|
|
2013
|
706
|
33
|
44
|
783
|
|
2012
|
714
|
36
|
43
|
793
|
|
2011
|
750
|
43
|
53
|
846
|
Other Concept Restaurants
The table below presents the number of other concept restaurants at each fiscal year end from fiscal 2011 through fiscal 2015:
|
Lime Fresh
|
Restaurants in
|
||||
|
Fiscal Year
|
Company-Owned
|
Franchise*
|
Total Lime Fresh
|
Discontinued Concepts**
|
|
|
2015
|
19
|
7
|
26
|
–
|
|
|
2014
|
20
|
6
|
26
|
–
|
|
|
2013
|
18
|
6
|
24
|
–
|
|
|
2012
|
13
|
4
|
17
|
14
|
|
|
2011
|
–
|
–
|
–
|
4
|
|
*Fiscal 2013 includes one international Lime Fresh franchise restaurant.
**Discontinued concepts include Marlin & Ray’s, Truffles, and Wok Hay.
During fiscal 2015:
|
·
|
Same-restaurant sales* at Company-owned Ruby Tuesday restaurants decreased 0.5% as compared to the prior year, while same-restaurant sales at domestic franchise Ruby Tuesday restaurants increased 4.7%;
|
|
·
|
One Company-owned Ruby Tuesday restaurant was opened and 11 were closed;
|
|
·
|
Six franchised Ruby Tuesday restaurants were opened and seven were closed;
|
|
·
|
One Company-owned Lime Fresh restaurant was closed;
|
|
·
|
Two franchised Lime Fresh restaurants were opened and one was closed;
|
|
·
|
We prepaid and retired ten mortgage loan obligations for $9.0 million plus prepayment penalties of $1.0 million and negligible accrued interest;
|
|
·
|
John Connelly was appointed Senior Vice President and Chief Marketing Officer on December 29, 2014 and left the Company on April 27, 2015;
|
|
·
|
Scarlett A. May, our former Senior Vice President, Chief Legal Officer, and Secretary, left the Company on December 12, 2014;
|
|
·
|
Rhonda J. Parish was appointed Chief Legal Officer on March 16, 2015 and Secretary on April 8, 2015;
|
|
·
|
Michael O. Moore stepped down as our Chief Financial Officer on June 26, 2014 and Jill M. Golder was appointed Executive Vice President, Chief Financial Officer, and Treasurer on the same date. Mr. Moore retired from the Company on August 4, 2014;
|
|
·
|
Jeffrey C. Wood, our former Senior Vice President and Chief Development Officer, left the Company on July 24, 2014, and
|
|
·
|
On July 25, 2015, Todd A. Burrowes voluntarily resigned as the Company's President, Ruby Tuesday Concept and Chief Operations Officer. Then, on July 27, 2015, Brett A Patterson, our then Senior Vice President of Operations, was appointed Ruby Tuesday Concept President.
|
-26-
During fiscal 2014:
|
·
|
Same-restaurant sales* at Company-owned Ruby Tuesday restaurants decreased 5.3%, while same-restaurant sales at domestic franchise Ruby Tuesday restaurants decreased 3.0%;
|
|
·
|
Incurred severance, payroll tax, share-based compensation, and other charges of $4.3 million in connection with the elimination of management and staff personnel at our Restaurant Support Services Center, including approximately 82 positions since November;
|
|
·
|
Four Company-owned Lime Fresh restaurants were opened and two were closed;
|
|
·
|
38 Company-owned Ruby Tuesday restaurants were closed, including two as a result of severe weather in Pensacola, Florida;
|
|
·
|
Two franchised Lime Fresh restaurants were opened and two were closed;
|
|
·
|
Seven franchised Ruby Tuesday restaurants were opened and five were closed;
|
|
·
|
We replaced our $200.0 million credit facility with the $50.0 million Senior Credit Facility;
|
|
·
|
We repurchased $20.0 million of our 7.625% senior notes due 2020 (the “Senior Notes”). The repurchases settled for $20.0 million plus $0.2 million of accrued interest. We realized losses of $0.7 million on these transactions;
|
|
·
|
We prepaid and retired 18 mortgage loan obligations for $14.9 million plus prepayment penalties of $1.1 million and accrued interest of $0.1 million;
|
|
·
|
Our President and Chief Executive Officer, James J. Buettgen, was appointed Chairman of the Board of Directors and Stephen Sadove was appointed Lead Director in connection with the resignation of Matthew Drapkin from the Board;
|
|
·
|
We appointed Mark Addicks and Donald Hess to the Board of Directors;
|
|
·
|
Our former Executive Vice President, Chief Operations Officer, Kimberly Grant, left the Company on June 7, 2013 and Todd Burrowes was appointed President – Ruby Tuesday Concept and Chief Operations Officer on June 11, 2013; and
|
|
·
|
Our former Senior Vice President, Chief People Officer, Robert LeBoeuf, left the Company on October 30, 2013.
|
* We define same-restaurant sales as a year-over-year comparison of sales volumes for restaurants that, in the current year have been open at least 18 months, in order to remove the impact of new openings in comparing the operations of existing restaurants.
Restaurant Sales
Restaurant sales in fiscal year 2015 decreased 3.6% from fiscal year 2014 for Company-owned restaurants and increased 5.8% for domestic and international franchised restaurants as explained below. The tables presented below reflect restaurant sales for the last five fiscal years, and other revenue information for the last three fiscal years.
Restaurant Sales (in millions):
|
Ruby Tuesday Concept
|
Lime Fresh Concept
|
||||||||||||
|
Fiscal Year
|
Company-Owned
|
Franchise (a)
|
Company-Owned
|
Franchise (a)
|
|||||||||
|
2015
|
$ | 1,100.7 | $ | 171.7 | $ | 19.4 | $ | 15.3 | |||||
|
2014
|
1,141.8 | 162.2 | 20.7 | 14.5 | |||||||||
|
2013
|
1,229.1 | 158.0 | 16.1 | 12.0 | |||||||||
|
2012
|
1,302.7 | 172.6 | 3.3 | 1.6 | |||||||||
|
2011
|
1,254.0 | 289.4 | – | – | |||||||||
|
(a)
|
Includes sales of all domestic and international franchised Ruby Tuesday and Lime Fresh restaurants.
|
Other Revenue Information:
|
2015
|
2014
|
2013
|
||||||||
|
Company restaurant sales (in thousands)
|
||||||||||
|
Ruby Tuesday concept
|
$ | 1,100,702 | $ | 1,141,771 | $ | 1,229,097 | ||||
|
Lime Fresh concept
|
19,440 | 20,652 | 16,129 | |||||||
|
Total restaurant sales
|
$ | 1,120,142 | $ | 1,162,423 | $ | 1,245,226 | ||||
|
Company restaurant sales growth-percentage
|
(3.6)% | (6.6)% | (4.7)% | |||||||
-27-
| 2015 | 2014 | 2013 | ||||||||
|
Franchise revenue (in thousands)
|
||||||||||
|
Ruby Tuesday concept
|
$ | 5,602 | $ | 5,577 | $ | 5,633 | ||||
|
Lime Fresh concept
|
822 | 746 | 628 | |||||||
|
Total franchise revenue (a)
|
$ | 6,424 | $ | 6,323 | $ | 6,261 | ||||
|
Franchise revenue growth-percentage
|
1.6% | 1.0% | 9.1% | |||||||
|
Total revenue (in thousands)
|
||||||||||
|
Ruby Tuesday concept
|
$ | 1,106,304 | $ | 1,147,348 | $ | 1,234,730 | ||||
|
Lime Fresh concept
|
20,262 | 21,398 | 16,757 | |||||||
|
Total revenue
|
$ | 1,126,566 | $ | 1,168,746 | $ | 1,251,487 | ||||
|
Total revenue growth-percentage
|
(3.6)% | (6.6)% | (4.6)% | |||||||
|
Ruby Tuesday concept same-restaurant sales growth
|
||||||||||
|
percentage
|
(0.5)% | (5.3)% | (1.0)% | |||||||
|
Company average unit volumes
|
$1.66 million
|
$1.67 million
|
$1.73 million
|
|||||||
|
Company average unit volumes growth percentage
|
(0.1)% | (3.8)% | (0.8)% | |||||||
|
(a)
|
Franchise revenue includes royalty, license, and development fees paid to us by our franchisees, exclusive of support service fees of $1.3 million, $1.0 million, and $0.9 million, in fiscal years 2015, 2014, and 2013, respectively, which are recorded as an offset to selling, general, and administrative expenses.
|
Our Company restaurant sales and operating revenue for the year ended June 2, 2015 decreased 3.6% to $1,120.1 million compared to the prior fiscal year. This decrease is primarily a result of restaurant closings since the prior fiscal year coupled with a 0.5% decrease in same-restaurant sales at Company-owned Ruby Tuesday restaurants. The decrease in Ruby Tuesday concept same-restaurant sales is attributable to a 1.4% decrease in customer traffic offset by a 1.0% increase in net check since the prior fiscal year.
Our Company restaurant sales and operating revenue for the year ended June 3, 2014 decreased 6.6% to $1,162.4 million compared to fiscal year 2013. This decrease is primarily a result of a 5.3% decrease in same-restaurant sales at Company-owned Ruby Tuesday restaurants, offset by an increase in Lime Fresh concept revenues of $4.6 million due in part to a net increase of two Lime Fresh restaurants since fiscal year 2013. The decrease in Ruby Tuesday concept same-restaurant sales is attributable to lower customer counts coupled with a decrease in average net check during fiscal year 2014 compared to fiscal year 2013.
Franchise development and license fees received are recognized when we have substantially performed all material services and the restaurant has opened for business. Franchise royalties (generally 4.0% of monthly sales for franchised Ruby Tuesday concept restaurants and 5.25% of monthly sales for franchised Lime Fresh concept restaurants) are recognized as franchise revenue on the accrual basis. Franchise revenue increased 1.6% to $6.4 million in fiscal year 2015 and 1.0% to $6.3 million in fiscal year 2014. Franchise revenue is predominantly comprised of domestic and international royalties, which totaled $6.2 million and $6.1 million in fiscal year 2015 and 2014, respectively.
Total franchise restaurant sales are shown in the table below.
|
2015
|
2014
|
2013
|
||||||||
|
Franchise restaurant sales (in thousands)
|
||||||||||
|
Ruby Tuesday concept
|
$ | 171,668 | $ | 162,233 | $ | 158,001 | ||||
|
Lime Fresh concept
|
15,338 | 14,493 | 12,003 | |||||||
|
Total franchise restaurant sales (a)
|
$ | 187,006 | $ | 176,726 | $ | 170,004 | ||||
|
Franchise restaurant sales growth-percentage
|
5.8% | 4.0% | (2.4)% | |||||||
|
(a)
|
Includes sales of all domestic and international franchised Ruby Tuesday and Lime Fresh restaurants.
|
-28-
Segment Profit
Our President and Chief Executive Officer, who is our chief operating decision maker, with the assistance of our senior management, reviews discrete financial information for both the Ruby Tuesday and Lime Fresh restaurant concepts to assess performance and allocate resources. We consider the Ruby Tuesday and Lime Fresh concepts to be our reportable segments as we do not believe they have similar economic and other characteristics to be aggregated into a single reportable segment. Segment profit/(loss) by reportable segment for fiscal 2015, 2014, and 2013 is as follows (in thousands):
|
2015
|
2014
|
2013
|
|||||||||||||
|
Segment profit/(loss):
|
|||||||||||||||
|
Ruby Tuesday concept
|
$ | 116,408 | $ | 69,543 | $ | 111,367 | |||||||||
|
Lime Fresh concept
|
(2,630 | ) | (6,070 | ) | (10,204 | ) | |||||||||
|
Total segment profit
|
$ | 113,778 | $ | 63,473 | $ | 101,163 | |||||||||
Segment profit for the year ended June 2, 2015 for the Ruby Tuesday concept increased $46.9 million to $116.4 million compared to fiscal year 2014 due primarily to reductions in cost of goods sold, payroll and related costs, and other restaurant operating costs due to initiatives discussed later within this MD&A, and decreases in closures and impairments expense of $20.7 million and advertising expense of $17.5 million. The reduction in closures and impairments expense compared to the prior fiscal year is primarily attributable to a decrease of impairments in connection with open restaurants with deteriorating operational performance ($8.7 million), early restaurant closures ($5.4 million), and upcoming lease terminations ($1.4 million). The higher closures and impairments in fiscal year 2014 were primarily a result of prior fiscal year same-restaurant sales declines of 5.3% and the closure of 38 Ruby Tuesday restaurants. The reduction in advertising spending relates to reduced cable and television advertising.
Segment losses for the year ended June 2, 2015 for the Lime Fresh concept decreased $3.4 million compared to fiscal year 2014 to $2.6 million due primarily to decreases in closures and impairments expense of $2.1 million as the prior fiscal year Lime Fresh segment losses included lease reserve charges related to four undeveloped sites for which management decided to forego restaurant development and a lease reserve charge on a Lime Fresh restaurant contracted to be sold. This was coupled with reductions in cost of goods sold, payroll and related costs, and other restaurant operating costs due to initiatives discussed later within this MD&A.
Segment profit for the year ended June 3, 2014 for the Ruby Tuesday concept decreased $41.8 million to $69.5 million compared to fiscal 2013 due primarily to the 5.3% decrease in same-restaurant sales at Company-owned Ruby Tuesday restaurants and a net reduction of 38 Company-owned restaurants since fiscal year 2013, higher closures and impairments expense ($21.2 million) as we recorded impairments in connection with the closure of 38 Ruby Tuesday restaurants during fiscal year 2014 and also recorded impairments on 32 open Ruby Tuesday restaurants not planned for closure with deteriorating operational performance, and higher other restaurant operating costs ($2.0 million) primarily due to higher legal fees associated with litigation. These were partially offset by lower cost of goods sold ($21.8 million) and payroll and related costs ($16.8 million) compared to fiscal year 2013 as a result of restaurant closures, declines in customer traffic, reductions in general and administrative expenses, net ($26.9 million) due to lower allocations of support center costs, and a decrease in advertising spending ($3.5 million), primarily due to reduced television advertising.
Segment losses for the year ended June 3, 2014 for the Lime Fresh concept decreased $4.1 million compared to fiscal year 2013 to $6.1 million. Excluding the impact of closures and impairments charges of $5.2 million and $8.1 million for fiscal years 2014 and 2013, respectively, segment losses would have decreased $1.2 million due primarily to lower advertising fees of $0.8 million, due in part to the termination of a marketing agreement with an agency whose Chief Executive Officer previously sold the Lime Fresh restaurant concept to us. The reduction in closures and impairments charges of $2.9 million is due to lower restaurant impairments charges of $4.0 million offset by increased charges for lease reserves ($1.0 million) due predominantly to four undeveloped sites for which a management decision was reached to forego restaurant development.
-29-
The following is a reconciliation of segment profit to loss from continuing operations before taxes for fiscal 2015, 2014, and 2013 (in thousands):
|
2015
|
2014
|
2013
|
||||||||||
|
Segment profit
|
$ | 113,778 | $ | 63,473 | $ | 101,163 | ||||||
|
Less:
|
||||||||||||
|
Depreciation and amortization
|
(52,391 | ) | (57,347 | ) | (62,398 | ) | ||||||
|
Unallocated selling, general and administrative expenses
|
(42,710 | ) | (47,946 | ) | (18,026 | ) | ||||||
|
Preopening expenses
|
(290 | ) | (395 | ) | (761 | ) | ||||||
|
Goodwill and trademark impairments
|
– | (855 | ) | (14,058 | ) | |||||||
|
Interest expense, net
|
(22,735 | ) | (24,945 | ) | (26,576 | ) | ||||||
|
Other expense, net
|
(757 | ) | (1,560 | ) | (1,278 | ) | ||||||
|
Loss from continuing operations before income taxes
|
$ | (5,105 | ) | $ | (69,575 | ) | $ | (21,934 | ) | |||
Operating Profits
The following table sets forth selected restaurant operating data as a percentage of restaurant sales and operating revenue or total revenue, as appropriate, for the periods indicated. All information is derived from our Consolidated Financial Statements located in Part II, Item 8 of this Annual Report on Form 10-K.
|
2015
|
2014
|
2013
|
||||
|
Restaurant sales and operating revenue
|
99.4
|
%
|
99.5
|
%
|
99.5
|
%
|
|
Franchise revenue
|
0.6
|
0.5
|
0.5
|
|||
|
Total revenue
|
100.0
|
100.0
|
100.0
|
|||
|
Operating costs and expenses:
|
||||||
|
Cost of goods sold (1)
|
27.3
|
27.7
|
27.4
|
|||
|
Payroll and related costs (1)
|
34.2
|
34.8
|
33.7
|
|||
|
Other restaurant operating costs (1)
|
21.8
|
22.4
|
20.8
|
|||
|
Depreciation (1)
|
4.5
|
4.7
|
4.7
|
|||
|
Selling, general, and administrative, net
|
10.2
|
11.7
|
11.1
|
|||
|
Closures and impairments, net
|
0.9
|
2.8
|
1.2
|
|||
|
Goodwill and trademark impairments
|
–
|
0.1
|
1.1
|
|||
|
Interest expense, net
|
2.0
|
2.1
|
2.1
|
|||
|
Loss on extinguishment of debt
|
–
|
0.1
|
0.0
|
|||
|
Total operating costs and expenses
|
100.5
|
106.0
|
101.8
|
|||
|
Loss from continuing operations before income taxes
|
(0.5
|
)
|
(6.0
|
)
|
(1.8
|
)
|
|
(Benefit)/provision for income taxes from continuing operations
|
(0.2
|
)
|
(0.4
|
)
|
0.1
|
|
|
Loss from continuing operations
|
(0.3
|
)
|
(5.6
|
)
|
(1.9
|
)
|
|
Income/(loss) from discontinued operations, net of tax
|
–
|
0.0
|
(1.3
|
)
|
||
|
Net loss
|
(0.3
|
)%
|
(5.5
|
)%
|
(3.1
|
)%
|
(1) As a percentage of restaurant sales and operating revenue.
Pre-tax Loss from Continuing Operations
Pre-tax loss from continuing operations decreased $64.5 million from fiscal year 2014 to $5.1 million for the year ended June 2, 2015. The lower pre-tax loss is due to reductions in closures and impairments expense ($22.3 million) and interest expense ($2.2 million) and decreases, as a percentage of restaurant sales and operating revenue or total revenue, as appropriate, of cost of goods sold, payroll and related costs, other restaurant operating costs, depreciation, and selling, general, and administrative, net. In addition, fiscal year 2014 included losses on the extinguishment of debt ($1.4 million) and a charge for the partial impairment of the Lime Fresh trademark ($0.9 million).
Pre-tax loss from continuing operations increased $47.6 million from fiscal year 2013 to $69.6 million for the year ended June 3, 2014. The higher pre-tax loss is due to a decrease in same-restaurant sales of 5.3% at Company-owned Ruby Tuesday restaurants, higher closures and impairments expense ($18.2 million), a partial impairment of the Lime Fresh trademark during the current year, increased losses on the extinguishment of debt ($1.3 million), and increases, as a percentage of restaurant sales and operating revenue or total revenue, as appropriate, of cost of goods sold, payroll
-30-
and related costs, other restaurant operating costs, and selling, general, and administrative, net. These higher costs were partially offset by lower interest expense ($1.8 million).
In the paragraphs that follow, we discuss in more detail the components of the changes in pre-tax loss from continuing operations for years ended June 2, 2015 and June 3, 2014 as compared to the comparable prior year. Because a significant portion of the costs recorded in the cost of goods sold, payroll and related costs, other restaurant operating costs, and depreciation categories are either variable or highly correlate with the number of restaurants we operate, we evaluate our trends by comparing the costs as a percentage of restaurant sales and operating revenue, as well as the absolute dollar change, to the comparable prior year.
Cost of Goods Sold
Cost of goods sold decreased $16.2 million (5.0%) from the prior year to $305.3 million for the year ended June 2, 2015. As a percentage of restaurant sales and operating revenue, cost of goods sold decreased from 27.7% to 27.3%.
The absolute dollar decrease for the year ended June 2, 2015 was the result of restaurant closures and cost savings on certain products due to renegotiated contracts with certain vendors since fiscal year 2014. These were partially offset by price increases on beef, seafood, poultry, and certain other products since the prior fiscal year.
As a percentage of restaurant sales and operating revenue, the decrease in cost of goods sold for the year ended June 2, 2015 is primarily the result of renegotiated contracts with certain vendors since fiscal year 2014.
Cost of goods sold decreased $20.0 million (5.9%) from fiscal year 2013 to $321.5 million for the year ended June 3, 2014. As a percentage of restaurant sales and operating revenue, cost of goods sold increased from 27.4% to 27.7%.
The absolute dollar decrease for the year ended June 3, 2014 was the result of lower sales volumes, restaurant closures, and cost savings on certain products as a result of renegotiated contracts with certain vendors since fiscal year 2013. These were partially offset by price increases on beef, poultry, and certain other products since the prior year.
As a percentage of restaurant sales and operating revenue, the increase in cost of goods sold for the year ended June 3, 2014 is primarily the result of a shift in menu mix with the introduction of new menu items during the first half of fiscal year 2014 and price increases in the cost of certain products.
Payroll and Related Costs
Payroll and related costs decreased $21.1 million (5.2%) from the prior year to $383.3 million for the year ended June 2, 2015. As a percentage of restaurant sales and operating revenue, payroll and related costs decreased from 34.8% to 34.2%.
The absolute dollar decrease in payroll and related costs for the year ended June 2, 2015 was primarily due to restaurant closures, decreases in hourly labor as a result of scheduling improvements with the rollout of a new labor forecasting system in our restaurants, and lower management labor, which were partially offset by higher health insurance costs as a result of unfavorable claims experience and higher bonus expense as more restaurants achieved the performance goals as compared to the prior fiscal year.
As a percentage of restaurant sales and operating revenue, the decrease in payroll and related costs for the year ended June 2, 2015 was primarily the result of decreased hourly and management labor due to reasons discussed above.
Payroll and related costs decreased $15.3 million (3.6%) from fiscal year 2013 to $404.4 million for the year ended June 3, 2014. As a percentage of restaurant sales and operating revenue, payroll and related costs increased from 33.7% to 34.8%.
The absolute dollar decrease in payroll and related costs for the year ended June 3, 2014 was due to lower hourly restaurant labor in connection with lower sales volumes and restaurant closures since fiscal year 2013. Other factors contributing to the declines included lower restaurant management labor due to a reduction in the average number of managers per restaurant as compared to fiscal year 2013 and lower bonus expense as fewer restaurants achieved the performance goals. These reductions were partially offset by minimum wage increases in certain states and merit
increases since fiscal year 2013 and higher health insurance during fiscal year 2014 due to unfavorable claims experience.
As a percentage of restaurant sales and operating revenue, the increase in payroll and related costs for the year ended June 3, 2014 is primarily the result of loss of leveraging associated with lower sales volumes.
Other Restaurant Operating Costs
Other restaurant operating costs decreased $16.1 million (6.2%) from the prior year to $244.4 million for the year ended June 2, 2015. As a percentage of restaurant sales and operating revenue, other restaurant operating costs decreased from 22.4% to 21.8%.
For the year ended June 2, 2015, the decrease in other restaurant operating costs related to the following (in thousands):
|
Repairs
|
$ | 5,001 | ||
|
Utilities
|
3,960 | |||
|
Rent and leasing
|
2,053 | |||
|
Legal
|
1,698 | |||
|
Gift card breakage
|
1,388 | |||
|
Business interruption recoveries
|
1,060 | |||
|
Other decreases, net
|
1,945 | |||
|
Insurance
|
(1,010 | ) | ||
|
Net decrease
|
$ | 16,095 |
In both absolute dollars and as a percentage of restaurant sales and operating revenue for the year ended June 2, 2015, the decrease in other operating costs was primarily a result of reduced building repairs, utilities, and rent and leasing due primarily to restaurant closures since the prior fiscal year, lower legal costs related to pending litigation, higher gift card breakage income, and business interruption recoveries related to claims collected for certain of our restaurants in the Gulf Coast area. These changes were partially offset by higher insurance due in part to unfavorable general liability claims experience in the current fiscal year.
Other restaurant operating costs increased $1.4 million (0.6%) from fiscal year 2013 to $260.4 million for the year ended June 3, 2014. As a percentage of restaurant sales and operating revenue, other restaurant operating costs increased from 20.8% to 22.4%.
For the year ended June 3, 2014, the increase in other restaurant operating costs related to the following (in thousands):
|
Legal
|
$ | 2,485 | ||
|
Rent and leasing
|
1,289 | |||
|
Repairs
|
677 | |||
|
Other increases, net
|
344 | |||
|
Utilities
|
(2,069 | ) | ||
|
Amortization of intangibles
|
(759 | ) | ||
|
Insurance
|
(534 | ) | ||
|
Net increase
|
$ | 1,433 |
In both absolute dollars and as a percentage of restaurant sales and operating revenue for the year ended June 3, 2014, the increase in other operating costs was primarily a result of higher legal costs related to pending litigation, rent and leasing as a result of sale-leaseback transactions, and repairs due to building maintenance. These increased costs were partially offset by restaurant closures since fiscal year 2013, reduced utilities as a result of reduced rates with new contracts, a decrease in amortization of intangibles due in part to two partial impairments of the Lime Fresh trademark, the first of which was recorded during the fourth quarter of fiscal year 2013, and lower insurance due to favorable general liability claims experience during fiscal year 2014.
Depreciation
Depreciation expense decreased $4.7 million (8.5%) to $50.1 million for the year ended June 2, 2015, compared to the prior year. As a percentage of restaurant sales and operating revenue, depreciation expense decreased from 4.7% to 4.5%.
In terms of absolute dollars, the decrease for the year ended June 2, 2015 is due primarily to assets that became fully depreciated since the prior fiscal year coupled with restaurant closures.
Depreciation expense decreased $4.3 million (7.3%) to $54.8 million for the year ended June 3, 2014, compared to fiscal year 2013. As a percentage of restaurant sales and operating revenue, depreciation expense was consistent with fiscal year 2013 at 4.7%.
In terms of absolute dollars, the decrease for the year ended June 3, 2014 is due primarily to assets that became fully depreciated since fiscal year 2013 coupled with sale-leaseback transactions and restaurant closures.
Selling, General, and Administrative Expenses, Net
Selling, general, and administrative expenses, net decreased $21.8 million (15.9%) from the prior year to $115.3 million for the year ended June 2, 2015.
The decrease for the year ended June 2, 2015 is due to lower advertising costs ($17.7 million) primarily as a result of decreased television advertising, and a reduction in general and administrative costs ($4.1 million) due to lower management labor from reductions in staffing, a decrease in consulting fees, and lower legal fees. The decrease in overall television advertising is attributable to management’s desire to spend marketing dollars more efficiently, with an increased focus on supporting our national cable television advertising with print and electronic promotions. These were partially offset by higher accruals for support center bonus.
Selling, general, and administrative expenses, net decreased $1.6 million (1.2%) from fiscal 2013 to $137.2 million for the year ended June 3, 2014.
The decrease for the year ended June 3, 2014 is due to lower advertising costs ($4.3 million) primarily as a result of decreased television advertising and reduced direct mail and other promotional activity as compared to fiscal year 2013, which was partially offset by higher cable television advertising in order to promote our newer menu items. The lower advertising costs were partially offset by higher general and administrative costs ($2.6 million) which was due in part to severance, payroll tax, share-based compensation, and other charges in connection with the elimination of management and staff personnel at our Restaurant Support Services Center.
Closures and Impairments, Net
Closures and impairments decreased $22.3 million to $10.5 million for the year ended June 2, 2015, as compared to the prior year. The decrease is primarily due to lower property impairment charges ($14.5 million), closed restaurant lease reserve expense ($5.8 million), and other closing costs ($1.2 million) coupled with higher gains on the sale of surplus properties ($0.7 million).
The decrease in closures and impairments for the year ended June 2, 2015 is primarily due to lower property impairment charges as the same periods of the prior fiscal year included, among other charges, larger impairments attributable to open Ruby Tuesday concept restaurants experiencing deteriorating operational performance and related to early restaurant closures as discussed below. The prior fiscal year charges were also due to a plan to close approximately 30 Ruby Tuesday concept restaurants by the end of fiscal year 2014.
Closures and impairments increased $18.2 million to $32.8 million for the year ended June 3, 2014, as compared to fiscal year 2013. The increase is primarily due to higher property impairment charges ($13.0 million), closed restaurant lease reserve expense ($4.5 million), and other closing costs ($1.0 million), which were partially offset by higher gains on the sale of surplus properties ($0.3 million).
The higher property impairment charges in fiscal year 2014 were due in part to the closing of 33 Ruby Tuesday concept restaurants in connection with a plan approved by our Board of Directors on January 7, 2014. Of these closures, 11 of these restaurants closed upon expiration of their lease. As a result of the plan, included within Closures
-33-
and impairments, net for fiscal year 2014 are impairment charges of $4.8 million in connection with the early restaurant closures. Additionally, during fiscal year 2014 we recorded impairments of $13.5 million relating to 32 open restaurants, with deteriorating operational performance.
Goodwill and Trademark Impairments
Using entity specific projections for undiscounted cash flows that incorporated only those Lime Fresh assets existing as of the measurement date, we concluded during the third quarter of fiscal 2014 that the Lime Fresh trademark was partially impaired. Accordingly, we recorded a non-cash charge of $0.9 million representing a partial impairment of the Lime Fresh trademark. A similarly-measured impairment charge of $5.0 million had previously been recorded on the Lime Fresh trademark during fiscal year 2013. Following these impairments, the net book value of the Lime Fresh trademark remaining as of June 2, 2015 is $3.1 million.
We separately concluded during the fourth quarter of fiscal year 2013 that the goodwill associated with our Lime Fresh concept was fully impaired. Accordingly, we recorded a fourth quarter fiscal year 2013 non-cash charge of $9.0 million ($5.4 million, net of tax) representing the full value of our Lime Fresh concept goodwill.
See Note 7 to our Consolidated Financial Statements for further information on our goodwill and trademark impairment charges recorded during fiscal years 2014 and 2013.
Interest Expense, Net
Interest expense, net decreased $2.2 million to $22.7 million for the year ended June 2, 2015, primarily due to lower interest expense on our Senior Notes due to repurchases during the prior fiscal year and the early payoff of certain mortgage loans since fiscal year 2014.
Interest expense, net decreased $1.6 million to $24.9 million for the year ended June 3, 2014, primarily due to lower interest expense on our Senior Notes due to repurchases and the early payoff of certain mortgage loans since fiscal year 2013.
Loss on Extinguishment of Debt
Loss on extinguishment of debt was $1.4 million for the year ended June 3, 2014 due to our repurchase of $20.0 million of the Senior Notes for $20.0 million plus $0.2 million of accrued interest. We realized losses of $0.7 million on these transactions. Additionally, we incurred a $0.7 million charge in the second quarter of fiscal year 2014 relating to the write-off of the pro rata portion of unamortized debt issuance costs associated with the previous credit facility.
During the year ended June 4, 2013, we repurchased $15.0 million of our Senior Notes. The repurchases settled for $14.5 million plus $0.2 million of accrued interest. We realized a minimal loss on these transactions.
(Benefit)/Provision for Income Taxes from Continuing Operations
We regularly evaluate the need for a valuation allowance for deferred tax assets by assessing whether it is more likely than not that we will realize the deferred tax assets in the future. A valuation allowance assessment is performed each reporting period, with any additions or adjustments reflected in earnings in the period of assessment. In assessing the need for a valuation allowance, we consider both positive and negative evidence related to the likelihood of realization of the deferred tax assets for each jurisdiction.
Prior to the fourth quarter of fiscal year 2013, we concluded that objective and subjective positive evidence outweighed negative evidence, and it was more likely than not that we would realize all of our federal and most of our state deferred tax assets, except for loss carryforwards in certain states that have had cumulative losses and/or relatively short carryforward periods and annual limits of loss carryforward that is available for use to offset future taxable income. During the fourth quarter of fiscal year 2013, we recorded a valuation allowance following the conclusion that the negative evidence outweighed the positive evidence.
We recorded a tax benefit from continuing operations of $1.9 million for the year ended June 2, 2015, compared to a tax benefit from continuing operations of $4.7 million for the year ended June 3, 2014. Included in our $1.9 million tax benefit from continuing operations for the year ended June 2, 2015 was a benefit of $3.2 million recorded during the first quarter of fiscal year 2015 representing an immaterial prior period correction to our deferred tax asset
-34-
valuation allowance. The remaining $1.3 million in net expense is attributable to decreased pre-tax losses and changes in uncertain tax reserves for fiscal year 2015.
We recorded a tax benefit from continuing operations of $4.7 million for the year ended June 3, 2014, compared to tax expense from continuing operations of $1.5 million for the year ended June 4, 2013, to reflect the current benefit of federal and certain state net operating loss carrybacks as well as the recognition of unrecognized tax benefits. The change in income taxes is attributable to increased pre-tax losses for fiscal year 2014 as compared to fiscal year 2013 offset by an increase in the valuation allowance for deferred tax assets.
Our valuation allowance for deferred tax assets totaled $62.8 million and $54.6 million as of June 2, 2015 and June 3, 2014, respectively. Included within our income tax (benefit)/provision from continuing operations is the expense from the additional valuation allowance of $9.1 million, $31.2 million, and $20.9 million for fiscal years 2015, 2014, and 2013, respectively, representing the amount reserved for the increase in net deferred tax assets during the periods (primarily related to general business credit carryforwards and state net operating loss carryforwards). Additionally, a valuation allowance (benefit)/expense of $(0.3) million and $1.3 million was included within the income tax benefit from discontinued operations in fiscal 2014 and 2013, respectively.
Under ASC 740, “Income Taxes,” we are required to assess whether a valuation allowance should be established against our deferred tax assets based on the consideration of all available evidence using a “more likely than not” standard. In making such judgments, significant weight is given to evidence that can be objectively verified. As a result of losses from discontinued operations, as well as goodwill and trademark impairment charges, among other charges, we currently reflect a three-year cumulative pre-tax loss. A cumulative pre-tax loss is given more weight than projections of future income, and a recent historical cumulative loss is considered a significant factor that is difficult to overcome. Before consideration of the valuation allowance expense, we had an income tax benefit of $11.0 million, $35.9 million, and $19.4 million, including the tax credits, in fiscal years 2015, 2014, and 2013, respectively.
The deferred tax valuation allowance may be released in future years when we consider that it is more likely than not that some portion or all of the deferred tax assets will be realized. To form a conclusion that some or all of the deferred tax assets will be realized, we will need to generate a three-year cumulative pre-tax income, and we will need to evaluate whether or not all available evidence, such as future taxable income, reversal of temporary differences, and other tax planning strategies provides sufficient positive evidence to offset any other potential negative evidence that may exist at such time. In the event the deferred tax valuation allowance is released, we would record an income tax benefit for the portion or all of the deferred tax valuation allowance released.
Discontinued Operations
In an effort to focus primarily on the sales turnaround of our core Ruby Tuesday concept and secondly, to improve the financial performance of our Lime Fresh concept, we completed the closure of our Marlin & Ray’s, Wok Hay, and Truffles restaurants during fiscal year 2013. We have classified the results of operations of our Company-owned Marlin & Ray’s, Wok Hay, and Truffles concepts as discontinued operations for the fiscal years ended June 3, 2014 and June 4, 2013. The results of operations of our discontinued operations are as follows (in thousands):
|
June 3, 2014
|
June 4, 2013
|
|||||||
|
Restaurant sales and operating revenue
|
$ | – | $ | 11,884 | ||||
|
Income/(loss) before income taxes
|
$ | 458 | $ | (24,498 | ) | |||
|
Benefit for income taxes
|
(106 | ) | (8,519 | ) | ||||
|
Income/(loss) from discontinued operations
|
$ | 564 | $ | (15,979 | ) | |||
Liquidity and Capital Resources
Sources and Uses of Cash
Our primary source of liquidity is cash provided by operations. The following table presents a summary of our cash flows from operating, investing, and financing activities for the last three fiscal years (in thousands).
|
2015
|
2014
|
2013
|
||||||||||
|
Net cash provided by operating activities
|
$ | 54,911 | $ | 45,375 | $ | 35,954 | ||||||
|
Net cash (used)/provided by investing activities
|
(17,497 | ) | (6,203 | ) | 22,113 | |||||||
|
Net cash used by financing activities
|
(13,409 | ) | (40,753 | ) | (53,344 | ) | ||||||
|
Net increase/(decrease) in cash and cash equivalents
|
$ | 24,005 | $ | (1,581 | ) | $ | 4,723 | |||||
Operating Activities
Our cash provided by operations is generally derived from cash receipts generated by our restaurant customers and franchisees. Substantially all of the $1,120.1 million, $1,162.4 million, and $1,245.2 million of restaurant sales and operating revenue disclosed in our Consolidated Statements of Operations and Comprehensive Loss for fiscal years 2015, 2014, and 2013, respectively, was received in cash either at the point of sale or within two to four days (when our customers paid with debit or credit cards). Our primary uses of cash for operating activities are food and beverage purchases, payroll and benefit costs, restaurant operating costs, general and administrative expenses, and marketing, a significant portion of which are incurred and paid in the same period.
Cash provided by operating activities for fiscal year 2015 increased $9.5 million (21.0%) from the prior fiscal year to $54.9 million. The increase is primarily the result of higher Earnings Before Interest, Taxes, Depreciation, and Amortization (“EBITDA”) due in part to restaurant-level cost improvements and reductions in amounts spent on media advertising. These increases were partially offset by decreases in accounts payable, accrued, and other liabilities due to the timing of payments (approximately $11.4 million) and inventory (approximately $8.9 million) as amounts for fiscal year 2014 related to levels of lobster held in inventory that were significantly lower than those of the preceding year.
Cash provided by operating activities for fiscal year 2014 increased $9.4 million (26.2%) from fiscal year 2013 to $45.4 million. The increase is due primarily to increases in accounts payable, accrued, and other liabilities due to the timing of payments (approximately $22.2 million), reductions in amounts spent to acquire inventory (approximately $11.5 million) as we suspended the advance purchasing of lobster in order to utilize the lobster that was on hand, decreases in amounts spent on media advertising (approximately $3.3 million), lower cash paid for income taxes ($3.1 million), and a decrease in cash paid for interest ($2.1 million) which resulted from lower interest payments on our Senior Notes due to note repurchases since fiscal year 2013. These were partially offset by lower EBITDA as a result of a 5.3% decrease in same-restaurant sales at Company-owned Ruby Tuesday concept restaurants.
Our working capital and current ratio as of June 2, 2015 were $8.5 million and 1.08:1, respectively. While we typically carry current liabilities in excess of current assets as is common in the restaurant industry, we have grown our cash accounts since the prior year and simultaneously reduced our accounts payable.
Investing Activities
We require capital principally for the maintenance and upkeep of our existing restaurants, limited new restaurant construction, investments in technology, equipment, remodeling of existing restaurants, and on occasion for the acquisition of franchisees or other restaurant concepts. Property and equipment expenditures purchased primarily with internally-generated cash flows and/or proceeds from sale-leaseback transactions for fiscal years 2015, 2014, and 2013 were $31.0 million, $28.3 million, and $37.1 million, respectively. In addition, proceeds from the disposal of assets produced $11.3 million, $15.5 million, and $7.0 million of cash in fiscal years 2015, 2014, and 2013, respectively, following actions taken to more aggressively market surplus properties in order to pay down debt.
During the years ended June 3, 2014 and June 4, 2013, we completed sale-leaseback transactions of the land and building for three and 24 Company-owned Ruby Tuesday concept restaurants, respectively, for gross cash proceeds of $5.9 million and $54.4 million, respectively, exclusive of transaction costs of approximately $0.3 million and $2.6 million, respectively. Equipment was not included. The net proceeds from the sale-leaseback transactions were used
-36-
for general corporate purposes, including capital expenditures, debt payments, and the repurchase of shares of our common stock. See Note 5 to the Consolidated Financial Statements for further discussion of these transactions.
Capital expenditures for fiscal year 2016 are estimated to be in the range of between $34.0 million to $38.0 million. We intend to fund our investing activities with cash currently on hand, cash provided by operations, or borrowings on the Senior Credit Facility.
Financing Activities
Historically our primary sources of cash have been operating activities, coupled with sale-leaseback transactions and sales of surplus properties. When these alone have not provided sufficient funds for both our capital and other needs, we have obtained funds through the issuance of indebtedness or through the issuance of additional shares of common stock. Our current borrowings and credit facilities are described below.
On May 14, 2012, we entered into an indenture (the “Indenture”) among the Company, certain subsidiaries of the Company as guarantors and Wells Fargo Bank, National Association as trustee, governing the Company’s $250.0 million aggregate principal amount of 7.625% senior notes due 2020 (the “Senior Notes”). The Senior Notes were issued at a discount of $3.7 million, which is being amortized using the effective interest method over the eight-year term of the notes.
The Senior Notes are guaranteed on a senior unsecured basis by our existing and future domestic restricted subsidiaries, subject to certain exceptions. They rank equal in right of payment with our existing and future senior indebtedness and senior in right of payment to any of our future subordinated indebtedness. The Senior Notes are effectively subordinated to all of our secured debt, including borrowings outstanding under our revolving credit facility, to the extent of the value of the assets securing such debt and structurally subordinated to all of the liabilities of our existing and future subsidiaries that do not guarantee the Senior Notes.
Interest on the Senior Notes is calculated at 7.625% per annum, payable semiannually on each May 15 and November 15 to holders of record on the May 1 or November 1 immediately preceding the interest payment date. Accrued interest on the Senior Notes and our other long-term debt and capital lease obligations is included in Accrued liabilities – Rent and other in our Consolidated Balance Sheets. The Senior Notes mature on May 15, 2020.
At any time prior to May 15, 2016, we may redeem the Senior Notes, in whole or in part, at a redemption price equal to 100% of the principal amount, plus an applicable “make-whole” premium and accrued and unpaid interest. At any time on or after May 15, 2016, we may redeem the Senior Notes, in whole or in part, at the redemption prices specified in the Indenture plus accrued and unpaid interest. We may redeem up to 35% of the Senior Notes from the proceeds of certain equity offerings. There is no sinking fund for the Senior Notes.
The Indenture contains covenants that limit, among other things, our ability and the ability of certain of our subsidiaries to (i) incur or guarantee additional indebtedness; (ii) declare or pay dividends, redeem stock or make other distributions to stockholders; (iii) make certain investments; (iv) create liens or use assets as security in other transactions; (v) merge or consolidate, or sell, transfer, lease or dispose of substantially all of their assets; (vi) enter into transactions with affiliates; and (vii) sell or transfer certain assets. The Indenture also restricts the declaration and payment of a dividend or other distribution on, and/or repurchase by RTI in respect of, its outstanding common stock at any time and from time to time. These covenants are subject to a number of important exceptions and qualifications, as described in the Indenture, and certain covenants will not apply at any time when the Senior Notes are rated investment grade by the Rating Agencies, as defined in the Indenture. The Indenture also provides for events of default, which, if any of them occurs, would permit or require the principal, premium, if any, interest and any other monetary obligations on all the then outstanding Senior Notes to be due and payable immediately.
On December 3, 2013, we entered into the Senior Credit Facility under which we may borrow up to $50.0 million with the option, subject to certain conditions, to increase the facility by up to $35.0 million. The Senior Credit Facility, which was obtained to provide access to capital for general corporate purposes, replaced a previous five-year $200.0 million credit facility that was set to expire in December 2015. The terms of the Senior Credit Facility provide for a $25.0 million sublimit for the issuance of standby letters of credit. In connection with entering into the Senior Credit Facility, included within Interest expense, net and Loss on extinguishment of debt in our Consolidated Statements of
-37-
Operations and Comprehensive Loss for the year ended June 3, 2014 are charges of $0.7 million relating to the write-off of the pro rata portion of unamortized debt issuance costs associated with our previous credit facility.
Under the terms of the Senior Credit Facility, interest rates charged on borrowings can vary depending on the interest rate option we choose to utilize. Our options for the rate are a Base Rate or LIBOR plus an applicable margin, provided that the rate shall not be less than zero. The Base Rate is defined as the highest of the issuing bank’s prime rate, the Federal Funds rate plus 0.50%, or the Adjusted LIBO rate (as defined in the Senior Credit Facility) plus 1.0%. The applicable margin for the LIBOR rate-based option is a percentage ranging from 2.50% to 3.50% and for the Base Rate option is a percentage ranging from 1.50% to 2.50%. We pay commitment fees quarterly ranging from 0.40% to 0.75% on the unused portion of the Senior Credit Facility.
As security for the Senior Credit Facility, we granted the lenders liens and security interests in substantially all of the shares of capital stock of the Company and each of our present and future subsidiaries, substantially all of the personal property of the Company and each of our present and future subsidiaries, and the real property, improvements, and fixtures of 49 Ruby Tuesday restaurants. The real property, improvements, and fixtures of the 49 restaurants pledged as collateral appraised at $101.4 million at the time of the transaction and have a June 2, 2015 net book value of $79.2 million.
We had no borrowings outstanding under the Senior Credit Facility at June 2, 2015. After consideration of letters of credit outstanding, we had $37.5 million available under the Senior Credit Facility as of June 2, 2015.
The Senior Credit Facility contains a number of customary affirmative and negative covenants that, among other things, limit or restrict our ability to incur liens, engage in mergers or other fundamental changes, make acquisitions, investments, loans and advances, pay dividends or other distributions, sell or otherwise dispose of certain assets, engage in certain transactions with affiliates, enter into burdensome agreements or certain hedging agreements, amend organizational documents, change accounting practices, incur additional indebtedness and prepay other indebtedness. Under the terms of the Senior Credit Facility we are allowed, under certain circumstances, to repurchase up to $20.0 million of the Senior Notes in any fiscal year. We did not repurchase any Senior Notes during the year ended June 2, 2015. During the year ended June 3, 2014, we repurchased $20.0 million of the Senior Notes for $20.0 million plus $0.2 million of accrued interest. We realized losses of $0.7 million on these transactions. The balance on the Senior Notes was $215.0 million at June 2, 2015.
Under the Senior Credit Facility, we are required to comply with financial covenants relating to the maintenance of a maximum leverage ratio and a minimum fixed charge coverage ratio. The terms of the Senior Credit Facility require us to maintain a maximum leverage ratio of no more than 4.75 to 1.0 and a minimum fixed charge coverage ratio of 1.4 to 1.0 for the quarter ended June 2, 2015. The minimum required ratios fluctuate thereafter as provided in the Senior Credit Facility.
The Senior Credit Facility terminates no later than December 3, 2017. Upon the occurrence of an event of default, the lenders may terminate the loan commitments, accelerate all loans and exercise any of their rights under the Senior Credit Facility and any ancillary loan documents.
On December 3, 2013, in connection with our entry into the Senior Credit Facility, the Company and certain of its subsidiaries entered into loan modification agreements (the “Loan Modification Agreements”) with certain mortgage lenders to, among other things, provide waivers and consents under certain of our mortgage loan obligations to enter into the Senior Credit Facility. The Loan Modification Agreements also, among other things, amend certain financial reporting requirements under the specified loans and modify and/or provide for certain financial covenants for the specified loans, including the maximum funded debt covenant and the minimum consolidated fixed charge coverage ratio.
We were in compliance with our maximum funded debt covenant and our minimum consolidated fixed charge coverage ratio as of June 2, 2015.
Our $31.6 million in mortgage loan obligations as of June 2, 2015 consists of various loans acquired upon franchise acquisitions. These loans, which mature between January 2017 and July 2022, have balances which range from $0.3
million to $7.3 million and interest rates of 7.60% to 10.17%. Many of the properties acquired from franchisees collateralize the loans outstanding.
During fiscal year 2015, we prepaid and retired ten mortgage loan obligations with an aggregate balance of $9.0 million using cash on hand. In connection with the retirement of these obligations, we paid $1.0 million in prepayment premiums and an insignificant amount of accrued interest. Additionally, as further discussed in Note 16 to the Consolidated Financial Statements, on July 9, 2015, we prepaid and retired an additional ten mortgage loan obligations with an aggregate balance of $8.3 million as of June 2, 2015. The prepayment of this debt eliminated one mortgage lender and allowed for the release of 26 properties which had served as collateral.
During fiscal years 2015, 2014, and 2013, we repurchased an insignificant number, 0.1 million, and 4.1 million shares of RTI common stock, respectively, at an aggregate cost of $0.1 million, $0.6 million, and $30.3 million, respectively. As of June 2, 2015, the total number of shares authorized to be repurchased was 11.8 million. Additionally, there were no dividends paid during fiscal years 2015, 2014, or 2013.
Covenant Compliance
Under the terms of the Senior Credit Facility, we are required to satisfy and maintain specified financial ratios and other financial condition tests and covenants. The financial ratios include maximum funded debt and minimum fixed charge coverage covenants. While as of June 2, 2015 we were in compliance with the financial ratios contained in our Senior Credit Facility, our continued ability to meet those financial ratios, tests, and covenants can be affected by events beyond our control, and we cannot assure you that we will meet those ratios, tests, and covenants.
Maximum Funded Debt Covenant
Our maximum funded debt covenant is an Adjusted Total Debt to Consolidated EBITDAR ratio. Adjusted Total Debt, as defined in our covenants, includes items both on-balance sheet (debt and capital lease obligations) and off-balance sheet (such as the present value of leases, letters of credit and guarantees). Consolidated EBITDAR is consolidated net loss (for the Company and its majority-owned subsidiaries) plus interest charges, income tax, depreciation, amortization, rent and other non-cash charges. Among other charges, we have reflected share-based compensation, asset impairment and bad debt expense, as non-cash.
Consolidated EBITDAR and Adjusted Total Debt are not presentations made in accordance with U.S. generally accepted accounting principles (“GAAP”), and, as such, should not be considered a measure of financial performance or condition, liquidity or profitability. They also should not be considered alternatives to GAAP-based net income or balance sheet amounts or operating cash flows or indicators of the amount of free cash flow available for discretionary use by management, as Consolidated EBITDAR does not consider certain cash requirements such as interest payments, tax payments or debt service requirements and Adjusted Total Debt includes certain off-balance sheet items. Further, because not all companies use identical calculations, amounts reflected by RTI as Consolidated EBITDAR or Adjusted Total Debt may not be comparable to similarly titled measures of other companies. We believe the information shown below is relevant as it presents the amounts used to calculate covenants which are provided to our lenders. Non-compliance with our debt covenants could result in the requirement to immediately repay all amounts outstanding under such agreements.
The following is a reconciliation of our total long-term debt and capital leases, which are GAAP-based, to Adjusted Total Debt as defined in our bank covenants (in thousands):
|
June 2, 2015
|
||||
|
Current portion of long-term debt
|
$ | 10,861 | ||
|
Long-term debt and capital leases, less current maturities
|
234,173 | |||
|
Total long-term debt and capital leases
|
245,034 | |||
|
Present value of operating leases*
|
202,778 | |||
|
Letters of credit*
|
12,501 | |||
|
Unrestricted cash in excess of $10.0 million
|
(65,291 | ) | ||
|
Unamortized discount of senior unsecured notes
|
2,162 | |||
|
Unamortized premium of mortgage loan obligations
|
(383 | ) | ||
|
Adjusted Total Debt
|
$ | 396,801 | ||
-39-
* Non-GAAP measure. See below for discussion regarding reconciliation to GAAP-based amounts.
The following is a reconciliation of net loss, which is a GAAP-based measure of our operating results, to Consolidated EBITDAR as defined in our bank covenants (in thousands):
|
Twelve Months
|
||||
|
Ended
|
||||
|
June 2, 2015
|
||||
|
Net loss
|
$ | (3,194 | ) | |
|
Rent expense
|
51,885 | |||
|
Depreciation
|
50,148 | |||
|
Interest expense
|
22,762 | |||
|
Asset impairments
|
9,822 | |||
|
Share-based compensation expense
|
7,112 | |||
|
Amortization of intangibles
|
2,243 | |||
|
Non-cash accruals
|
1,507 | |||
|
Restaurant closing costs
|
641 | |||
|
Other, net
|
1,021 | |||
|
Income taxes
|
(1,911 | ) | ||
|
Consolidated EBITDAR
|
$ | 142,036 | ||
|
Adjusted Total Debt to Consolidated EBITDAR – Actual
|
2.79 | x | ||
|
Maximum allowed per covenant (1)
|
4.75 | x | ||
(1) For fiscal year 2016, the Senior Credit Facility requires us to maintain quarterly maximum Adjusted Total Debt to EBITDAR ratios of less than or equal to 4.75x (for our first fiscal quarter), 4.50x (for our second and third fiscal quarters), and 4.40x (for our fourth fiscal quarter). For fiscal year 2017 and thereafter, the maximum Adjusted Total Debt to EBITDAR ratio fluctuates as provided in Article VII of the Senior Credit Facility.
Minimum Fixed Charge Coverage
Our fixed charge coverage ratio compares Consolidated EBITDAR (as discussed above) to interest and cash-based rents.
The following shows our computation of our fixed charge coverage ratio (in thousands):
|
Twelve Months
|
||||
|
Ended
|
||||
|
June 2, 2015
|
||||
|
Consolidated EBITDAR
|
$ | 142,036 | ||
|
Interest*
|
$ | 20,277 | ||
|
Cash rents*
|
51,425 | |||
|
Total
|
$ | 71,702 | ||
* Non-GAAP measure. See below for discussion regarding reconciliation to GAAP-based amounts.
|
Fixed Charge Covenant – Actual
|
1.98x
|
||
|
Minimum allowed per covenant (2)
|
1.40x
|
(2) For fiscal year 2016, the Senior Credit Facility requires us to maintain quarterly minimum fixed charge coverage ratios of greater than or equal to 1.45x (for our first fiscal quarter), 1.50x (for our second fiscal quarter), 1.55x (for our third fiscal quarter), and 1.60x (for our fourth fiscal quarter). For fiscal year 2017 and thereafter, the minimum fixed charge coverage ratio fluctuates as provided in Article VII of the Senior Credit Facility.
Non-GAAP Amounts Used in Debt Covenant Calculations
As previously discussed, we use various non-GAAP amounts in our Adjusted Total Debt, Consolidated EBITDAR, and Fixed Charge covenant calculations. Two of the amounts presented in the Adjusted Total Debt calculation, the
-40-
present value of operating leases and letters of credit, are off-balance sheet and there is no corresponding amount presented in our Condensed Consolidated Balance Sheets.
Our Minimum Fixed Charge Coverage ratio requires interest to be included in the denominator. The amount we reflect for interest in the denominator of this calculation ($20.3 million on a rolling 12 month basis) differs from interest expense determined in accordance with GAAP ($22.8 million) because of three adjustments we make. As shown below, we exclude brokerage fees, prepayment penalties, and the amortization of loan fees and fair market value adjustments. While these items are reflected as interest expense in our Condensed Consolidated Statements of Operations and Comprehensive Loss, they do not require on-going cash payments for servicing and therefore are not impacted by future Consolidated EBITDAR. The table below reconciles debt covenant interest for the preceding 12 months to GAAP interest for the same time period (amounts in thousands):
|
Interest
|
$ | 20,277 | ||
|
Brokerage fees
|
1,484 | |||
|
Prepayment penalties
|
1,020 | |||
|
Amortization of loan fees and fair market
|
||||
|
value adjustments
|
(19 | ) | ||
|
GAAP-based interest expense
|
$ | 22,762 |
Our Minimum Fixed Charge Coverage ratio also allows for recurring cash rents to be included in the denominator. Cash rents ($51.4 million on a rolling 12 month basis) differ from rents determined in accordance with GAAP ($51.9 million) by the following (amounts in thousands):
|
Cash rents
|
$ | 51,425 | ||
|
Change in rent accruals
|
(1,188 | ) | ||
|
Rent settlement payments
|
1,648 | |||
|
GAAP-based rent expense
|
$ | 51,885 |
Significant Contractual Obligations and Commercial Commitments
Long-term financial obligations were as follows as of June 2, 2015 (in thousands):
|
Payments Due By Period
|
||||||||||||||||||||
|
Less than
|
1-3 | 3-5 |
More than 5
|
|||||||||||||||||
|
Total
|
1 year
|
years
|
years
|
years
|
||||||||||||||||
|
Notes payable and other
|
||||||||||||||||||||
|
long-term debt, including
|
||||||||||||||||||||
|
current maturities (a)
|
$ | 31,813 | $ | 10,975 | $ | 14,445 | $ | 4,770 | $ | 1,623 | ||||||||||
|
Senior unsecured notes (a)
|
215,000 | – | – | 215,000 | – | |||||||||||||||
|
Interest (b)
|
89,091 | 19,126 | 34,886 | 33,553 | 1,526 | |||||||||||||||
|
Operating leases (c)
|
676,202 | 48,974 | 90,253 | 79,368 | 457,607 | |||||||||||||||
|
Purchase obligations (d)
|
82,792 | 53,168 | 23,636 | 4,500 | 1,488 | |||||||||||||||
|
Pension obligations (e)
|
38,071 | 3,794 | 3,715 | 3,942 | 26,620 | |||||||||||||||
|
Total (f)
|
$ | 1,132,969 | $ | 136,037 | $ | 166,935 | $ | 341,133 | $ | 488,864 | ||||||||||
|
(a)
|
See Note 6 to the Consolidated Financial Statements for more information on our debt.
|
|
(b)
|
Amounts represent contractual interest payments on our fixed-rate debt instruments. Interest payments on our variable-rate notes payable with balances of $1.3 million, as of June 2, 2015 have been excluded from the amounts shown above, primarily because the balances outstanding can fluctuate monthly. Additionally, the amounts shown above include interest payments on the Senior Notes at the current interest rate of 7.625%. Included within interest payments in the table above are $0.9 million in prepayment premiums paid on July 9, 2015 in connection with the retirement of ten mortgage loan obligations.
|
|
(c)
|
This amount includes lease payments for certian optional renewal periods for which exercise is considered reasonably assured as well as operating leases totaling $3.0 million for which sublease income from franchisees or others is expected. Certain of these leases obligate us to pay maintenance costs, utilities, real estate taxes, and insurance, which are excluded from the amounts shown above. See Note 5 to the Consolidated Financial Statements for more information.
|
-41-
|
(d)
|
The amounts for purchase obligations include cash commitments under contract for food items and supplies, advertising, utility contracts, and other miscellaneous commitments.
|
|
(e)
|
See Note 8 to the Consolidated Financial Statements for more information.
|
|
(f)
|
This amount excludes $3.9 million of unrecognized tax benefits due to the uncertainty regarding the timing of future cash outflows associated with such obligations.
|
Commercial commitments were as follows as of June 2, 2015 (in thousands):
|
Payments Due By Period
|
||||||||||||||||||
|
Less than
|
1-3 | 3-5 | More than 5 |
|
||||||||||||||
|
Total
|
1 year
|
years |
years
|
years |
|
|||||||||||||
|
Letters of credit
|
$ | 12,502 | $ | 5,402 | $ | 7,100 | $ | – | $ | – | ||||||||
|
Divestiture guarantees
|
7,612 | 707 | 1,141 | 1,070 | 4,694 | |||||||||||||
|
Lease guarantee
|
1,342 | 269 | 544 | 426 | 103 | |||||||||||||
|
Total
|
$ | 21,456 | $ | 6,378 | $ | 8,785 | $ | 1,496 | $ | 4,797 | ||||||||
At June 2, 2015, we had divestiture guarantees, which arose in fiscal 1996, when our shareholders approved the distribution of our family dining restaurant business (Morrison Fresh Cooking, Inc., “MFC”) and our health care food and nutrition services business (Morrison Health Care, Inc., “MHC”). Subsequent to that date Piccadilly Cafeterias, Inc. (“Piccadilly”) acquired MFC and Compass Group (“Compass”) acquired MHC. As agreed upon at the time of the distribution, we have been contingently liable for payments to MFC and MHC employees retiring under MFC’s and MHC’s versions of the Management Retirement Plan and the Executive Supplemental Pension Plan (the two non-qualified defined benefit plans) for the accrued benefits earned by those participants as of March 1996.
We estimated our divestiture guarantees at June 2, 2015 to be $7.3 million for employee benefit plans (all of which resides with MHC following Piccadilly’s bankruptcy in fiscal 2004). We believe the likelihood of being required to make payments for MHC’s portion to be remote due to the size and financial strength of MHC and Compass.
As of June 2, 2015, we are the guarantor of two third-party leases associated with closed concept restaurants. Lease guarantee amounts in the table above represent lease payments for which we are contingently liable. While we believe that the likelihood of being required to make these lease payments is remote, we recorded a guarantee liability of $0.1 million in our Consolidated Balance Sheets at both June 2, 2015 and June 3, 2014.
Off-Balance Sheet Arrangements
See Note 5 to the Consolidated Financial Statements for information regarding our operating leases.
Recently Issued Accounting Pronouncements
Accounting Pronouncements Adopted During Fiscal 2015
As discussed further in Note 9 to the Consolidated Financial Statements, we adopted Accounting Standards Update (“ASU”) 2013-11, Income Taxes (Topic 740): Presentation of an Unrecognized Tax Benefit When a Net Operating Loss Carryforward, a Similar Tax Loss, or a Tax Credit Carryforward Exists during the first quarter of fiscal year 2015.
As discussed further in Note 8 to the Consolidated Financial Statements, we adopted ASU 2015-04, Compensation – Retirement Benefits (Topic 715): Practical Expedient for the Measurement Date of an Employer’s Defined Benefit Obligation and Plan Assets, during the fourth quarter of fiscal year 2015.
Accounting Pronouncements Not Yet Adopted
In August 2014, the Financial Accounting Standards Board (“FASB”) issued ASU 2014-15, Presentation of Financial Statements – Going Concern (Subtopic 205-40): Disclosure of Uncertainties about an Entity’s Ability to Continue as a Going Concern (“ASU 2014-15”). The guidance requires an entity to evaluate whether there are conditions or events, in the aggregate, that raise substantial doubt about the entity’s ability to continue as a going concern within one year after the date that the financial statements are issued and to provide related footnote disclosures in certain circumstances. The guidance is effective for the annual period ending after December 15, 2016, and for annual and
-42-
interim periods thereafter (our fiscal year 2017). Early application is permitted. We do not believe the adoption of this guidance will have an impact on our Consolidated Financial Statements.
In May 2014, the FASB and International Accounting Standards Board (“IASB”) jointly issued ASU 2014-09, Revenue from Contracts with Customers (Topic 606) (“ASU 2014-09”). ASU 2014-09 will replace almost all existing revenue recognition guidance, including industry specific guidance, upon its effective date. The standard’s core principle is for a company to recognize revenue when it transfers goods or services to customers in amounts that reflect the consideration to which the company expects to be entitled. A company may also need to use more judgment and make more estimates when recognizing revenue, which could result in additional disclosures. ASU 2014-09 also provides guidance for transactions that were not addressed comprehensively in previous guidance, such as the recognition of breakage income from the sale of gift cards. The standard permits the use of either the retrospective or cumulative effect transition method. The guidance is effective for fiscal years, and interim periods within those years, beginning after December 15, 2017 (the first quarter of our fiscal year 2019). During the fourth quarter of fiscal year 2015, the FASB and IASB proposed a revision to ASU 2014-09 which would allow companies to defer adoption of this standard for up to one year. We have not yet selected a transition method and are currently evaluating the impact of this guidance on our Consolidated Financial Statements.
In April 2015, the FASB issued ASU 2015-03, Interest-Imputation of Interest (Subtopic 835-30): Simplifying the Presentation of Debt Issuance Costs (“ASU 2015-03”). The guidance requires an entity to present debt issuance costs in the balance sheet as a direct reduction from the carrying amount of the debt liability, consistent with debt discounts or premiums, rather than as an asset. Amortization of debt issuance costs will continue to be reported as interest expense. Debt issuance costs related to revolving credit arrangements, however, will continue to be presented as an asset and amortized ratably over the term of the arrangement. The guidance is effective for annual periods beginning after December 15, 2015, and for interim periods within those fiscal years (our fiscal year 2017). Early adoption is permitted. If we had adopted ASU 2015-03 as of June 2, 2015, $0.8 million and $3.2 million of debt issuance costs would have been reclassified from Prepaid rent and other expenses and Other assets, respectively, to a reduction in the carrying amount of our debt in our June 2, 2015 Consolidated Balance Sheet.
Critical Accounting Policies
Our MD&A is based upon our Consolidated Financial Statements, which have been prepared in accordance with accounting principles generally accepted in the United States of America. The preparation of these financial statements requires us to make subjective or complex judgments that may affect the reported financial condition and results of operations. We base our estimates on historical experience and other assumptions that we believe to be reasonable in the circumstances, the results of which form the basis for making judgments about carrying values of assets and liabilities that are not readily apparent from other sources. Actual results may differ from these estimates under different assumptions or conditions. We periodically evaluate the information used to make these estimates as our business and the economic environment changes.
We believe that of our significant accounting policies, the following may involve a higher degree of judgment and complexity. Our significant accounting policies are more fully described in Note 1 to the Consolidated Financial Statements.
Impairment of Long-Lived Assets
We evaluate the carrying value of any individual restaurant when the cash flows of such restaurant have deteriorated and we believe the probability of continued operating and cash flow losses indicate that the net book value of the restaurant may not be recoverable. In performing the review for recoverability, we consider the forecasted future cash flows expected to result from the use of the restaurant and its eventual disposition. If the sum of the expected future cash flows (undiscounted and without interest charges) is less than the carrying value of the restaurant, an impairment loss is recognized for the amount by which the net book value of the assets exceeds their fair value. Otherwise, an impairment loss is not recognized. Fair value is market participant-based upon estimated discounted future cash flows expected to be generated from continuing use through the expected disposal date and the expected salvage value.
Under our policies, recurring or projected annual negative cash flow signals a potential impairment. If a restaurant that has been open for at least six full quarters shows negative cash flow results, we evaluate the plan to reverse the negative performance. Both qualitative and quantitative information are considered when evaluating for potential impairments.
At June 2, 2015, we had 52 restaurants that had been open for more than six full quarters with rolling 12-month negative cash flows of which 34 have been impaired to salvage value. Of the 18 which remained, we reviewed the plans to improve cash flows and determined that no impairment was necessary. The remaining net book value of these 18 restaurants, four of which are located on owned properties, was $13.8 million at June 2, 2015.
Should cash flows at these 18 cash flow negative restaurants not improve within a reasonable period of time, further impairment charges are possible. Considerable management judgment is necessary to estimate future cash flows, including cash flows from continuing use, terminal value, closure costs, salvage value, and sublease income. Accordingly, actual results could vary significantly from our estimates.
We perform tests for impairment of intangible assets when events or circumstances indicate it might be impaired. As also discussed in Note 7 to the Consolidated Financial Statements, we tested the Lime Fresh trademark for impairment during fiscal years 2014 and 2013 as factors were present which indicated the trademark may be impaired. We determined that the Lime Fresh trademark was partially impaired and recorded charges of $0.9 million and $5.0 million during fiscal years 2014 and 2013, respectively.
Income Tax Valuation Allowances and Tax Accruals
We record deferred tax assets for various items and a valuation allowance against those deferred tax assets when current available information raises doubt as to their ultimate realization. Despite the existence of long carryforward periods for some of our largest deferred tax assets, such as unused employment tax credits and federal and/or state net operating losses, and a history of realizing our deferred tax assets by utilizing those credits and losses in subsequent or carryback years, a three-year cumulative pre-tax loss is an example of negative evidence that raises doubt as to the realization of the deferred tax assets. To determine the appropriate amount of the valuation allowance, we schedule a year-by-year estimation of the reversal of existing taxable temporary differences in order to determine the availability of future taxable income which would allow for the realization of our existing deferred tax assets. While we are able to incorporate tax planning strategies into our analysis, we do not factor projected future income until such time that the positive evidence supporting realization outweighs the negative evidence (most significantly, the three-year cumulative pre-tax loss).
We recorded a valuation allowance for deferred tax assets of $62.8 million and $54.6 million as of June 2, 2015 and June 3, 2014, respectively. Included in income tax expense from continuing operations is the expense from the additional valuation allowance of $9.1 million, $31.2 million, and $20.9 million for fiscal years 2015, 2014, and 2013, respectively. Additionally, a valuation allowance (benefit)/expense of $(0.3) million and $1.3 million was included in income tax expense from discontinued operations in fiscal 2014 and 2013, respectively. Given that we last recorded pre-tax income in fiscal 2011, we will likely not be able to reverse the significant valuation allowance recorded in the near future. Our recorded valuation allowance may be subject to material changes in the future, as our ability to utilize deferred tax assets can significantly change based on future events, including our determinations as to the feasibility of certain tax planning strategies. Upon such time that we are able to reverse the deferred tax asset valuation allowance, income tax expense will be reduced, and net income will correspondingly be increased, by the amount we are able to reverse.
Lease Obligations
We lease a significant number of our restaurant properties. At the inception of the lease, each property is evaluated to determine whether the lease will be accounted for as an operating or capital lease. The term used for this evaluation includes renewal option periods only in instances in which the exercise of the renewal option can be reasonably assured and failure to exercise such option would result in an economic penalty. The primary penalty to which we are subject is the economic detriment associated with our investment into leasehold improvements which might become impaired should we choose not to continue the use of the leased property.
Our lease term used for straight-line rent expense is calculated from the date we take possession of the leased premises through the end of the lease term. There is potential for variability in our “rent holiday” period which begins on the possession date and ends on the earlier of the restaurant open date or the commencement of rent payments. Factors that
-44-
may affect the length of the rent holiday period generally relate to construction-related delays. Extension of the rent holiday period due to delays in restaurant opening will result in greater preopening rent expense recognized during the rent holiday period.
For leases that contain predetermined fixed rent escalations, we record the total rent payable during the lease term, as determined above, on the straight-line basis over the term of the lease (including the “rent holiday” period beginning upon possession of the premises), and we record the difference between the minimum rents paid and the straight-line rent as deferred escalating minimum rent.
Certain leases contain provisions that require additional rental payments, called "contingent rents," when the associated restaurants' sales volumes exceed agreed-upon levels. We recognize contingent rental expense (in annual as well as interim periods) prior to the achievement of the specified target that triggers the contingent rental expense, provided that achievement of that target is considered probable.
The judgment regarding the probable term for each restaurant property lease impacts the classification and accounting for a lease as capital or operating, the rent holiday and/or escalation in payments that are taken into consideration when calculating straight-line rent and the term over which leasehold improvements for each restaurant amortized. The material factor we consider when making this judgment is the total amount invested in the restaurant at the inception of the lease and whether management believes that renewal appears reasonably assured. While a different term may produce materially different amounts of depreciation, amortization, and rent expense than reported, our historical lease renewal rates support the judgments made. We have not made any changes to the nature of the assumptions used to account for leases in any of the fiscal years presented in our Consolidated Financial Statements.
We record the estimated future lease obligations on closed leased restaurants for which we have not sublet or settled the lease with the respective landlord as of a quarter end date. Inherent in these estimates is an assumption on the time period we anticipate it will take to reach a settlement with our landlord or to execute on a sublease agreement. We calculate the lease obligation as the present value of future minimum net lease or settlement payments using a discount rate that takes into account the remaining time period prior to the estimated date of resolution. As further discussed in Note 7 to the Consolidated Financial Statements, our estimated lease obligations for closed restaurants as of June 2, 2015 and June 3, 2014 were $7.1 million and $10.9 million, respectively.
We self-insure a portion of our expected losses under our workers’ compensation, general liability, and property insurance programs. Specifically with our workers’ compensation and general liability coverages, we have stop loss insurance for individual claims in excess of stated loss amounts. Insurance liabilities are recorded based on third-party actuarial estimates of the ultimate incurred losses, net of payments made. The estimates themselves are based on standard actuarial techniques that incorporate both the historical loss experience of the Company and supplemental information as appropriate.
The analysis performed in calculating the estimated liability is subject to various assumptions including, but not limited to, (a) the quality of historical loss and exposure information, (b) the reliability of historical loss experience to serve as a predictor of future experience, (c) the reasonableness of insurance trend factors and governmental indices as applied to the Company, and (d) projected payrolls and revenue. As claims develop, the actual ultimate losses may differ from actuarial estimates. Therefore, an analysis is performed quarterly to determine if modifications to the accrual are required.
Cash and cash equivalents as of June 2, 2015 has increased to $75.3 million. Our overall goal is to invest in our brand and to strengthen our balance sheet to improve credit metrics. As such, our first priority is to ensure that we have adequate cash levels to run the business and internally fund our capital expenditures. Our second priority is to reduce our outstanding debt to help improve our credit metrics with the goal of improved flexibility and access to capital at reasonable rates. As discussed further in Note 16 to the Consolidated Financial Statements, to that end we prepaid and retired ten additional mortgage loan obligations with an aggregate June 2, 2015 balance of $8.3 million subsequent to the end of fiscal year 2015. Lastly, we would consider share repurchase within the limitations of our debt covenants to return capital to shareholders. Any of these actions, in any particular period and the actual amount thereof, remain at
-45-
the discretion of the Board of Directors, and no assurance can be given that any such actions will be taken in the future.
Repurchases of Senior Notes
We are allowed under the terms of the Senior Credit Facility to prepay up to $20.0 million of indebtedness in any fiscal year to various holders of the Senior Notes. While we did not repurchase any of our Senior Notes in fiscal year 2015, as discussed in Note 6 to the Consolidated Financial Statements, we repurchased $20.0 million of the Senior Notes during the year ended June 3, 2014 for $20.0 million plus $0.2 million of accrued interest. We realized losses of $0.7 million on these transactions. As of the date of this filing, we may repurchase an additional $20.0 million of the Senior Notes during the remainder of fiscal year 2016. Any future repurchases of the Senior Notes, if any, will likely be funded with available cash on hand.
Dividends
During fiscal 1997, our Board of Directors approved a dividend policy as an additional means of returning capital to our shareholders. No dividends were declared or paid during the three year period ended June 2, 2015. The payment of a dividend in any particular future period and the actual amount thereof remains at the discretion of the Board of Directors and is restricted by the covenants in certain of our debt agreements, and no assurance can be given that dividends will be paid in the future.
Fiscal Year
Our fiscal year 2016 will contain 52 weeks and end on May 31, 2016.
Impact of Inflation
The impact of inflation on the cost of food, labor, supplies, utilities, real estate, and construction costs could adversely impact our operating results. Historically, we have been able to recover certain inflationary cost increases through increased menu prices coupled with more efficient purchasing practices and productivity improvements. Competitive pressures may limit our ability to completely recover such cost increases. Historically, the effect of inflation has not significantly impacted our net income.
Item 7A. Quantitative and Qualitative
Disclosure About Market Risk
We are exposed to market risk from fluctuations in interest rates and changes in commodity prices. The interest rate charged on our Senior Credit Facility can vary based on the interest rate option we choose to utilize. Our options for the rate are LIBOR or a Base Rate plus an applicable margin provided that the rate shall not be less than zero. The Base Rate is defined as the highest of the issuing bank’s prime rate, the Federal Funds rate plus 0.50%, or the Adjusted LIBO rate (as defined in the Senior Credit Facility) plus 1.0%. The applicable margin for the LIBOR rate-based option is a percentage ranging from 2.50% to 3.50% and for the Base Rate option is a percentage ranging from 1.50% to 2.50%. As of June 2, 2015, the total amount of outstanding debt subject to interest rate fluctuations was $1.3 million. A hypothetical 100 basis point change in short-term interest rates would result in an increase or decrease in interest expense of an insignificant amount per year, assuming a consistent capital structure.
Many of the ingredients used in the products we sell in our restaurants are commodities that are subject to unpredictable price volatility. This volatility may be due to factors outside our control such as weather and seasonality. We attempt to minimize the effect of price volatility by negotiating fixed price contracts for the supply of key ingredients. Historically, and subject to competitive market conditions, we have been able to mitigate the negative impact of price volatility through adjustments to average check or menu mix.
-46-
Item 8. Financial Statements and Supplementary Data
Ruby Tuesday, Inc. and Subsidiaries
Index to Consolidated Financial Statements
|
Consolidated Financial Statements
|
||||||||||||
|
Consolidated Statements of Operations and Comprehensive Loss
|
||||||||||||
|
(In thousands, except per-share data)
|
||||||||||||
|
For the Fiscal Year Ended
|
||||||||||||
|
June 2,
|
June 3,
|
June 4,
|
||||||||||
|
2015
|
2014
|
2013
|
||||||||||
|
Revenue:
|
||||||||||||
|
Restaurant sales and operating revenue
|
$ | 1,120,142 | $ | 1,162,423 | $ | 1,245,226 | ||||||
|
Franchise revenue
|
6,424 | 6,323 | 6,261 | |||||||||
| 1,126,566 | 1,168,746 | 1,251,487 | ||||||||||
|
Operating costs and expenses:
|
||||||||||||
|
Cost of goods sold (excluding depreciation shown below)
|
305,306 | 321,521 | 341,512 | |||||||||
|
Payroll and related costs
|
383,261 | 404,379 | 419,679 | |||||||||
|
Other restaurant operating costs
|
244,352 | 260,447 | 259,014 | |||||||||
|
Depreciation
|
50,148 | 54,828 | 59,122 | |||||||||
|
Selling, general, and administrative, net
|
115,327 | 137,151 | 138,782 | |||||||||
|
Closures and impairments, net
|
10,542 | 32,831 | 14,656 | |||||||||
|
Goodwill and trademark impairments
|
– | 855 | 14,058 | |||||||||
|
Interest expense, net
|
22,735 | 24,945 | 26,576 | |||||||||
|
Loss on extinguishment of debt
|
– | 1,364 | 22 | |||||||||
| 1,131,671 | 1,238,321 | 1,273,421 | ||||||||||
|
Loss from continuing operations before income taxes
|
(5,105 | ) | (69,575 | ) | (21,934 | ) | ||||||
|
(Benefit)/provision for income taxes from continuing
|
||||||||||||
|
operations
|
(1,911 | ) | (4,665 | ) | 1,500 | |||||||
|
Loss from continuing operations
|
(3,194 | ) | (64,910 | ) | (23,434 | ) | ||||||
|
Income/(loss) from discontinued operations, net of tax
|
– | 564 | (15,979 | ) | ||||||||
|
Net loss
|
$ | (3,194 | ) | $ | (64,346 | ) | $ | (39,413 | ) | |||
|
Other comprehensive (loss)/income:
|
||||||||||||
|
Pension liability reclassification, net of tax
|
(40 | ) | 45 | 3,312 | ||||||||
|
Total comprehensive loss
|
$ | (3,234 | ) | $ | (64,301 | ) | $ | (36,101 | ) | |||
|
Basic loss per share:
|
||||||||||||
|
Loss from continuing operations
|
$ | (0.05 | ) | $ | (1.08 | ) | $ | (0.38 | ) | |||
|
Income/(loss) from discontinued operations
|
– | 0.01 | (0.27 | ) | ||||||||
|
Net loss per share
|
$ | (0.05 | ) | $ | (1.07 | ) | $ | (0.65 | ) | |||
|
Diluted loss per share:
|
||||||||||||
|
Loss from continuing operations
|
$ | (0.05 | ) | $ | (1.08 | ) | $ | (0.38 | ) | |||
|
Income/(loss) from discontinued operations
|
– | 0.01 | (0.27 | ) | ||||||||
|
Net loss per share
|
$ | (0.05 | ) | $ | (1.07 | ) | $ | (0.65 | ) | |||
|
Weighted average shares:
|
||||||||||||
|
Basic
|
60,580 | 60,231 | 61,040 | |||||||||
|
Diluted
|
60,580 | 60,231 | 61,040 | |||||||||
|
The accompanying notes are an integral part of the consolidated financial statements.
|
||||||||||||
Consolidated Balance Sheets
(In thousands, except per-share data)
|
June 2,
2015
|
June 3,
2014
|
|||||||
|
Assets:
|
||||||||
|
Current assets:
|
||||||||
|
Cash and cash equivalents
|
$ | 75,331 | $ | 51,326 | ||||
|
Accounts receivable
|
5,287 | 4,861 | ||||||
|
Inventories:
|
||||||||
|
Merchandise
|
12,861 | 12,924 | ||||||
|
China, silver and supplies
|
7,550 | 8,250 | ||||||
|
Income tax receivable
|
– | 2,133 | ||||||
|
Deferred income taxes
|
– | 3,397 | ||||||
|
Prepaid rent and other expenses
|
13,181 | 12,216 | ||||||
|
Assets held for sale
|
5,453 | 4,683 | ||||||
|
Total current assets
|
119,663 | 99,790 | ||||||
|
Property and equipment, net
|
752,174 | 794,846 | ||||||
|
Other assets
|
57,554 | 61,791 | ||||||
|
Total assets
|
$ | 929,391 | $ | 956,427 | ||||
|
Liabilities and Shareholders' Equity:
|
||||||||
|
Current liabilities:
|
||||||||
|
Accounts payable
|
$ | 23,005 | $ | 26,201 | ||||
|
Accrued liabilities:
|
||||||||
|
Taxes, other than income and payroll
|
11,067 | 11,221 | ||||||
|
Payroll and related costs
|
20,351 | 22,637 | ||||||
|
Insurance
|
7,633 | 5,962 | ||||||
|
Deferred revenue – gift cards
|
16,636 | 16,584 | ||||||
|
Rent and other
|
20,535 | 26,402 | ||||||
|
Current maturities of long-term debt, including capital leases
|
10,861 | 4,816 | ||||||
|
Income tax payable
|
1,069 | – | ||||||
|
Deferred income taxes, net
|
7 | – | ||||||
|
Total current liabilities
|
111,164 | 113,823 | ||||||
|
Long-term debt and capital leases, less current maturities
|
234,173 | 253,875 | ||||||
|
Deferred income taxes, net
|
1,442 | 3,500 | ||||||
|
Deferred escalating minimum rent
|
50,768 | 48,827 | ||||||
|
Other deferred liabilities
|
66,261 | 75,193 | ||||||
|
Total liabilities
|
463,808 | 495,218 | ||||||
|
Commitments and contingencies (Note 12)
|
||||||||
|
Shareholders’ equity:
|
||||||||
|
Common stock, $0.01 par value; (authorized: 100,000 shares;
|
||||||||
|
issued: 2015 – 62,098 shares, 2014 – 61,442 shares)
|
621 | 614 | ||||||
|
Capital in excess of par value
|
83,870 | 76,269 | ||||||
|
Retained earnings
|
392,032 | 395,226 | ||||||
|
Deferred compensation liability payable in Company stock
|
681 | 622 | ||||||
|
Company stock held by Deferred Compensation Plan
|
(681 | ) | (622 | ) | ||||
|
Accumulated other comprehensive loss
|
(10,940 | ) | (10,900 | ) | ||||
| 465,583 | 461,209 | |||||||
|
Total liabilities and shareholders' equity
|
$ | 929,391 | $ | 956,427 | ||||
The accompanying notes are an integral part of the consolidated financial statements.
-49-
The accompanying notes are an integral part of the consolidated financial statements.
-50-
Consolidated Statements of Cash Flows
|
(In thousands)
|
For the Fiscal Year Ended
|
|||||||||||
|
June 2, 2015
|
June 3, 2014
|
June 4, 2013
|
||||||||||
|
Operating activities:
|
||||||||||||
|
Net loss
|
$ | (3,194 | ) | $ | (64,346 | ) | $ | (39,413 | ) | |||
|
Adjustments to reconcile net loss to net cash provided by operating activities:
|
||||||||||||
|
Depreciation
|
50,148 | 54,828 | 60,018 | |||||||||
|
Amortization of intangibles
|
2,243 | 2,519 | 3,287 | |||||||||
|
Deferred income taxes
|
(3,695 | ) | 1,646 | (15,771 | ) | |||||||
|
Loss on impairments, including disposition of assets
|
10,896 | 24,132 | 30,369 | |||||||||
|
Goodwill and trademark impairments
|
– | 855 | 14,058 | |||||||||
|
Loss on extinguishment of debt
|
– | 1,364 | 22 | |||||||||
|
Share-based compensation expense
|
7,112 | 7,579 | 4,481 | |||||||||
|
Excess tax benefits from share-based compensation
|
(39 | ) | (284 | ) | (382 | ) | ||||||
|
Lease reserve adjustments
|
1,460 | 6,815 | 4,248 | |||||||||
|
Deferred escalating minimum rent
|
2,342 | 2,733 | 3,110 | |||||||||
|
Pension curtailment expense
|
– | – | 2,481 | |||||||||
|
Other, net
|
2,728 | 5,032 | 2,242 | |||||||||
|
Changes in operating assets and liabilities:
|
||||||||||||
|
Receivables
|
(440 | ) | (204 | ) | (311 | ) | ||||||
|
Inventories
|
763 | 9,698 | (1,842 | ) | ||||||||
|
Income taxes
|
3,202 | (233 | ) | (1,063 | ) | |||||||
|
Prepaid and other assets
|
(1,875 | ) | (1,392 | ) | (2,036 | ) | ||||||
|
Accounts payable, accrued and other liabilities
|
(16,740 | ) | (5,367 | ) | (27,544 | ) | ||||||
|
Net cash provided by operating activities
|
54,911 | 45,375 | 35,954 | |||||||||
|
Investing activities:
|
||||||||||||
|
Purchases of property and equipment
|
(31,010 | ) | (28,339 | ) | (37,117 | ) | ||||||
|
Proceeds from sale-leaseback transactions, net
|
– | 5,637 | 51,765 | |||||||||
|
Proceeds from disposal of assets
|
11,260 | 15,526 | 6,997 | |||||||||
|
Insurance proceeds from property claims
|
145 | 218 | – | |||||||||
|
Reductions in Deferred Compensation Plan assets
|
1,318 | 901 | 840 | |||||||||
|
Other, net
|
790 | (146 | ) | (372 | ) | |||||||
|
Net cash (used)/provided by investing activities
|
(17,497 | ) | (6,203 | ) | 22,113 | |||||||
|
Financing activities:
|
||||||||||||
|
Principal payments on long-term debt
|
(13,638 | ) | (40,232 | ) | (27,180 | ) | ||||||
|
Stock repurchases
|
(73 | ) | (579 | ) | (30,278 | ) | ||||||
|
Payments for debt issuance costs
|
(293 | ) | (1,802 | ) | (358 | ) | ||||||
|
Proceeds from exercise of stock options
|
556 | 1,576 | 4,090 | |||||||||
|
Excess tax benefits from share-based compensation
|
39 | 284 | 382 | |||||||||
|
Net cash used by financing activities
|
(13,409 | ) | (40,753 | ) | (53,344 | ) | ||||||
|
Increase/(decrease) in cash and cash equivalents
|
24,005 | (1,581 | ) | 4,723 | ||||||||
|
Cash and cash equivalents:
|
||||||||||||
|
Beginning of year
|
51,326 | 52,907 | 48,184 | |||||||||
|
End of year
|
$ | 75,331 | $ | 51,326 | $ | 52,907 | ||||||
|
Supplemental disclosure of cash flow information:
|
||||||||||||
|
Cash paid for:
|
||||||||||||
|
Interest, net of amount capitalized
|
$ | 20,804 | $ | 22,638 | $ | 24,771 | ||||||
|
Income taxes, net
|
$ | 543 | $ | 727 | $ | 3,833 | ||||||
|
Significant non-cash investing and financing activities:
|
||||||||||||
|
Retirement of fully depreciated assets
|
$ | 23,842 | $ | 44,775 | $ | 46,793 | ||||||
|
Reclassification of properties to assets held for sale
|
$ | 7,218 | $ | 9,982 | $ | 11,257 | ||||||
|
Changes in property and equipment included in accounts payable
|
$ | – | $ | 1,443 | $ | – | ||||||
|
Monetization of, and subsequent reinvestment into, life insurance policies
|
$ | 6,851 | $ | 7,972 | $ | – | ||||||
|
The accompanying notes are an integral part of the consolidated financial statements.
|
||||||||||||
Ruby Tuesday, Inc. and Subsidiaries
1. Summary of Significant Accounting Policies
The preparation of financial statements in conformity with U.S. generally accepted accounting principles (“GAAP”) requires management to make estimates and assumptions that affect the amounts reported in the consolidated financial statements and accompanying notes. Actual results could differ from those estimates.
Description of Business and Principles of Consolidation
Ruby Tuesday, Inc. including its wholly-owned subsidiaries (“RTI,” the “Company,” “we” and/or “our”) develops, operates and franchises casual dining restaurants in the United States, Guam, and 13 foreign countries under the Ruby Tuesday® brand. We also own and operate 19 Lime Fresh Mexican Grill® (“Lime Fresh”) fast casual restaurants. At June 2, 2015, we owned and operated 658 Ruby Tuesday restaurants concentrated primarily in the Southeast, Northeast, Mid-Atlantic, and Midwest of the United States, which we consider to be our core markets. As of our fiscal year end, there were 78 domestic and international franchise Ruby Tuesday restaurants located in 13 states primarily outside of our existing core markets (primarily the Western United States and portions of the Midwest) and in the Asia Pacific Region, Middle East, Canada, Iceland, Eastern Europe, the United Kingdom, and Central and South America. Also at fiscal year end, there were seven domestic franchise Lime Fresh restaurants located in Florida and Texas.
RTI consolidates its wholly-owned subsidiaries. All significant intercompany accounts and transactions have been eliminated.
Fiscal Year
Our fiscal year ends on the first Tuesday following May 30 and, as a result, a 53rd week is added every five or six years. The fiscal years ended June 2, 2015, June 3, 2014, and June 4, 2013 each contained 52 weeks.
Cash and Cash Equivalents
Our cash management program provides for the investment of excess cash balances in short-term money market instruments. These money market instruments are stated at cost, which approximates market value. We consider amounts receivable from credit card companies and marketable securities with a maturity of three months or less when purchased to be cash equivalents. Book overdrafts are recorded in accounts payable and are included within operating cash flows.
Inventories
Inventories consist of food, supplies, china and silver and are stated at the lower of cost (first-in, first-out) or market.
Property and Equipment and Depreciation
Property and equipment, net, is reported at cost less accumulated depreciation. Expenditures for major renewals and betterments are capitalized while expenditures for repairs and maintenance are expensed as incurred. Depreciation is computed using the straight-line method over the estimated useful lives of the assets. Estimated useful lives of depreciable assets generally range from three to 35 years for buildings and improvements and from three to 15 years for restaurant and other equipment. See Note 5 to the Consolidated Financial Statements for further discussion regarding our property and equipment.
Impairment or Disposal of Long-Lived Assets
We review our long-lived assets related to each restaurant to be held and used in the business, including any allocated intangible assets subject to amortization whenever events or changes in circumstances indicate that the carrying amount of a restaurant may not be recoverable. We evaluate restaurants based upon cash flows as our primary indicator of impairment. Assets are reviewed at the lowest level for which cash flows can be identified, which, for property and equipment, net, is the individual restaurant level. If the carrying amount of the restaurant is not recoverable, we record an impairment loss for the excess of the carrying amount over the fair value.
-52-
When we decide to close a restaurant it is reviewed for impairment and depreciable lives are considered for adjustment. The impairment evaluation is based on the estimated cash flows from continuing use through the expected disposal date and the expected terminal value. Any gain or loss recognized upon disposal of the assets associated with a closed restaurant is recorded as a component of Closures and impairments, net in our Consolidated Statements of Operations and Comprehensive Loss.
See Note 7 to the Consolidated Financial Statements for a further discussion regarding our closures and impairments, including the impairments of goodwill and other long-lived assets.
Other Intangible Assets
Other intangible assets which are included in Other assets, net in the Consolidated Balance Sheets consist of the following (in thousands):
|
2015
|
2014
|
|||||||||||||||
|
Gross Carrying
Amount
|
Accumulated
Amortization
|
Gross Carrying
Amount
|
Accumulated
Amortization
|
|||||||||||||
|
Reacquired franchise rights
|
$ | 14,417 | $ | 9,871 | $ | 14,460 | $ | 8,371 | ||||||||
|
Trademarks
|
4,208 | 862 | 4,194 | 390 | ||||||||||||
|
Favorable leases *
|
2,059 | 403 | 2,059 | 322 | ||||||||||||
|
Acquired franchise agreements
|
1,500 | 677 | 1,500 | 463 | ||||||||||||
|
Other
|
– | – | 100 | 41 | ||||||||||||
| $ | 22,184 | $ | 11,813 | $ | 22,313 | $ | 9,587 | |||||||||
* As of June 2, 2015 and June 3, 2014, we also had $0.8 million and $0.9 million, respectively, of unfavorable lease liabilities which resulted from the terms of acquired franchise operating lease contracts being unfavorable relative to market terms of comparable leases on the acquisition date. The majority of these liabilities are included within Other deferred liabilities in our Consolidated Balance Sheets.
The reacquired franchise rights reflected in the table above were acquired as part of certain franchise acquisitions. Trademarks consist primarily of the Lime Fresh trademark that was acquired as part of the Lime Fresh acquisition in fiscal 2012. The favorable leases resulted from the terms of acquired franchise operating lease contracts being favorable relative to market terms of comparable leases on the acquisition date.
Amortization expense of other intangible assets for fiscal years 2015, 2014, and 2013 totaled $2.2 million, $2.5 million, and $3.3 million, respectively. We amortize acquired and reacquired franchise rights on a straight-line basis over the remaining term of the franchise operating agreements. The weighted average amortization period of acquired and reacquired franchise rights is 7.3 years and 8.4 years, respectively. We amortize favorable leases as a component of rent expense on a straight-line basis over the remaining lives of the leases. The weighted average amortization period of the favorable leases is 25.6 years. We amortize trademarks on a straight-line basis over the life of the trademarks, typically 10 years. Amortization expense for intangible assets for each of the next five years is expected to be $1.9 million in fiscal year 2016, $1.6 million in fiscal year 2017, $1.3 million in fiscal year 2018, $1.3 million in fiscal year 2019, and $1.1 million in fiscal year 2020. Rent expense resulting from amortization of favorable leases, net of the amortization of unfavorable leases, is expected to be insignificant for each of the next five years.
We evaluate reacquired franchise rights and favorable leases for impairment as part of our evaluation of restaurant-level impairments.
Debt Acquisition Costs
We defer debt acquisition costs and amortize them over the terms of the related agreements using a method that approximates the effective interest method. Unamortized debt acquisition costs of $1.5 million and $1.3 million were included within Prepaid rent and other expenses and $4.3 million and $5.7 million were included within Other assets in our Consolidated Balance Sheets as of June 2, 2015 and June 3, 2014, respectively.
-53-
Lease Obligations
Approximately 55% of our 677 Company-owned restaurants are located on leased properties. Of these, approximately 69% are land leases only; the other 31% are for both land and building. The initial terms of these leases expire at various dates over the next 21 years. At the inception of the lease, each property is evaluated to determine whether the lease will be accounted for as an operating or capital lease. The term used for this evaluation includes renewal option periods only in instances in which the exercise of the renewal option can be reasonably assured and failure to exercise such option would result in an economic penalty. The primary penalty to which we are subject is the economic detriment associated with our investment into leasehold improvements which might become impaired should we choose not to continue the use of the leased property.
These leases may also contain required increases in minimum rent at varying times during the lease term and have options to extend the terms of the leases at a rate that is included in the original lease agreement. Most of our leases require the payment of additional (contingent) rent that is based upon a percentage of restaurant sales above agreed upon sales levels for the year. These sales levels vary for each restaurant and are established in the lease agreements. We recognize contingent rental expense (in annual as well as interim periods) prior to the achievement of the specified target that triggers the contingent rental expense, provided that achievement of that target is considered probable.
Certain of our operating leases contain predetermined fixed escalations of the minimum rentals during the term of the lease, which includes option periods where failure to exercise such options would result in an economic penalty. For these leases, we recognize the related rental expense on a straight-line basis over the term of the lease, beginning with the point at which we obtain control and possession of the leased properties, and record the difference between the amounts charged to operations and amounts paid as deferred escalating minimum rent. Any lease incentives received are deferred and subsequently amortized on a straight-line basis over the term of the lease as a reduction to rent expense.
Estimated Liability for Self-Insurance
We self-insure a portion of our expected losses under our workers’ compensation, general liability, and property insurance programs. Specifically with our workers’ compensation and general liability coverages, we have stop loss insurance for individual claims in excess of stated loss amounts. Insurance liabilities are recorded based on third-party actuarial estimates of the ultimate incurred losses, net of payments made. The estimates themselves are based on standard actuarial techniques that incorporate both the historical loss experience of the Company and supplemental information as appropriate.
Pensions and Post-Retirement Medical Benefits
As discussed further in Note 8 to the Consolidated Financial Statements, during the fourth quarter of fiscal year 2015 we adopted Accounting Standards Update (“ASU”) 2015-04, Compensation – Retirement Benefits (Topic 715): Practical Expedient for the Measurement Date of an Employer’s Defined Benefit Obligation and Plan Assets. As a result, beginning with fiscal year 2015, we measure and recognize the funded status of our defined benefit and postretirement plans in our Consolidated Balance Sheets as of May 31. The funded status represents the difference between the projected benefit obligation and the fair value of plan assets. The projected benefit obligation is the present value of benefits earned to date by plan participants, including the effect of future salary increases and years of service, as applicable. The difference between the projected benefit obligation and the fair value of assets that has not previously been recognized as expense is recorded as a component of other comprehensive loss. We record a curtailment when an event occurs that significantly reduces the accrual of defined benefits.
Revenue Recognition
Revenue from restaurant sales is recognized when food and beverage products are sold. We present sales net of coupons, discounts, sales tax, and other sales-related taxes. Deferred revenue-gift cards primarily represents our liability for gift cards that have been sold, but not yet redeemed, and is recorded at the expected redemption value. When the gift cards are redeemed, we recognize restaurant sales and reduce the deferred revenue. Gift cards sold at a discount are recorded as revenue upon redemption of the associated gift cards at an amount net of the related discount.
Breakage income represents the value associated with the portion of gift cards sold that will most likely never be redeemed. Using gift card redemption history, we have determined that substantially all of our customers utilize their gift cards within two years from the date of purchase. Accordingly, we recognize gift card breakage income for non-escheatable amounts beginning 24 months after the date of activation.
-54-
We recognized gift card breakage income of $2.0 million, $0.6 million, and $1.9 million during fiscal years 2015, 2014, and 2013, respectively. This income is included as an offset to Other Restaurant Operating Costs in the Consolidated Statements of Operations and Comprehensive Loss.
Franchise development and license fees received are recognized when substantially all of our material obligations under the franchise agreements have been performed and the restaurant has opened for business. Franchise royalties are recognized as franchise revenue on the accrual basis. Advertising amounts received from domestic franchisees are considered by us to be reimbursements, recorded on an accrual basis when earned, and have been netted against selling, general, and administrative expenses in the Consolidated Statements of Operations and Comprehensive Loss.
We charge our franchisees various monthly fees that are calculated as a percentage of the respective franchise’s monthly sales. Our Ruby Tuesday concept franchise agreements allow us to charge up to a 4.0% royalty fee, a 1.5% support service fee, a 1.5% marketing and purchasing fee, and an advertising fee of up to 3.0%. Our Lime Fresh concept franchise agreements allow us to charge up to a 5.25% royalty fee and an advertising fee of up to 3.0%. We defer recognition of franchise fee revenue for any amounts greater than 60 days past due.
A further description of our franchise programs is provided in Note 2 to the Consolidated Financial Statements.
Pre-Opening Expenses
Salaries, personnel training costs, pre-opening rent, and other expenses of opening new facilities are charged to expense as incurred.
Share-Based Employee Compensation Plans
We measure and recognize share-based payment transactions, including grants of employee stock options and restricted stock, as compensation expense based on the fair value of the equity award on the grant date. We estimate the fair value of service-based stock option awards using the Black-Scholes option pricing model. The fair values of restricted stock awards are based on the closing prices of our common stock on the dates prior to the grant date. We estimate the grant date fair value of market-based awards using the Monte-Carlo simulation model. This compensation expense is recognized over the service period on a straight-line basis for all awards except those awarded to retirement-eligible individuals, which are recognized on the grant date at estimated fair value. We classify share-based compensation expense consistent with all other compensation expenses in Selling, general, and administrative, net in our Consolidated Statements of Operations and Comprehensive Loss. See Note 10 to the Consolidated Financial Statements for further discussion regarding our share-based employee compensation plans.
Marketing Costs
Except for television and radio advertising production costs which we expense when the advertisement is first shown, we expense marketing costs as incurred. Marketing expenses, net of franchise reimbursements, which are included in Selling, general, and administrative expense in the Consolidated Statements of Operations and Comprehensive Loss, totaled $49.4 million, $67.2 million, and $71.4 million for fiscal years 2015, 2014, and 2013, respectively.
Income Taxes
Our deferred income taxes are determined utilizing the asset and liability approach. This method gives consideration to the future tax consequences associated with differences between financial accounting and tax bases of assets and liabilities and operating loss and tax credit carry forwards. Temporary differences represent the cumulative taxable or deductible amounts recorded in the consolidated financial statements in different years than recognized in the tax returns. Deferred tax assets and liabilities are measured using enacted tax rates expected to apply to taxable income in the years in which those temporary differences are expected to be recovered or settled. If, after consideration of all available positive and negative evidence, current available information raises doubt as to the realization of the deferred tax assets, the need for a valuation allowance is addressed. A valuation allowance for deferred tax assets may be required if the amount of taxes recoverable through loss carry-back declines, if we project lower levels of future taxable income, or if we have recently experienced pretax losses. Such a valuation allowance is established through a charge to income tax expense which adversely affects our reported operating results. The judgments and estimates utilized when establishing, and subsequently adjusting, a deferred tax asset valuation allowance are reviewed on a periodic basis as regulatory and business factors change.
-55-
The effect on the deferred tax assets and liabilities of a change in tax rates is recognized in income in the period that includes the enactment date. We recognize interest and penalties accrued related to unrecognized tax benefits as components of our income tax expense in the Consolidated Statements of Operations and Comprehensive Loss.
We recognize in our consolidated financial statements the benefit of a position taken or expected to be taken in a tax return when it is more likely than not (i.e. a likelihood of more than 50%) that the position would be sustained upon examination by tax authorities. A recognized tax position is then measured at the largest amount of benefit that is greater than 50% likely of being realized upon settlement. Changes in judgment that result in subsequent recognition, derecognition or change in a measurement of a tax position taken in a prior annual period (including any related interest and penalties) are recognized as a discrete item in the interim period in which the change occurs.
See Note 9 to the Consolidated Financial Statements for a further discussion of our income taxes.
Loss Per Share
Basic loss per share is computed by dividing net loss by the weighted average number of common shares outstanding during each period presented. Diluted earnings per share gives effect to stock options and restricted stock outstanding during the applicable periods, except during loss periods as the effect would be anti-dilutive. The following table reflects the calculation of weighted average common and dilutive potential common shares outstanding as presented in the accompanying Consolidated Statements of Operations and Comprehensive Loss (in thousands, except per-share data):
|
2015
|
2014
|
2013
|
||||||||||
|
Loss from continuing operations
|
$ | (3,194 | ) | $ | (64,910 | ) | $ | (23,434 | ) | |||
|
Income/(loss) from discontinued operations
|
– | 564 | (15,979 | ) | ||||||||
|
Net loss
|
$ | (3,194 | ) | $ | (64,346 | ) | $ | (39,413 | ) | |||
|
|
||||||||||||
|
Weighted average common shares outstanding
|
60,580 | 60,231 | 61,040 | |||||||||
|
Dilutive effect of stock options and restricted stock
|
– | – | – | |||||||||
|
Weighted average common and dilutive potential
|
||||||||||||
|
common shares outstanding
|
60,580 | 60,231 | 61,040 | |||||||||
|
Loss per share – Basic
|
||||||||||||
|
Loss from continuing operations
|
$ | (0.05 | ) | $ | (1.08 | ) | $ | (0.38 | ) | |||
|
Income/(loss) from discontinued operations
|
– | 0.01 | (0.27 | ) | ||||||||
|
Net loss per share
|
$ | (0.05 | ) | $ | (1.07 | ) | $ | (0.65 | ) | |||
|
Loss per share – Diluted
|
||||||||||||
|
Loss from continuing operations
|
$ | (0.05 | ) | $ | (1.08 | ) | $ | (0.38 | ) | |||
|
Income/(loss) from discontinued operations
|
– | 0.01 | (0.27 | ) | ||||||||
|
Net loss per share
|
$ | (0.05 | ) | $ | (1.07 | ) | $ | (0.65 | ) | |||
-56-
Stock options with an exercise price greater than the average market price of our common stock and certain options and restricted stock with unrecognized compensation expense do not impact the computation of diluted loss per share because the effect would be anti-dilutive. The following table summarizes stock options and restricted shares that were excluded from the computation of diluted loss per share because their inclusion would have had an anti-dilutive effect (in thousands):
|
2015
|
2014
|
2013
|
||||
|
Stock options
|
3,057
|
2,833
|
2,161
|
|||
|
Restricted shares
|
1,352
|
1,121
|
1,492
|
|||
|
Total
|
4,409
|
3,954
|
3,653
|
Comprehensive Loss
Comprehensive loss includes net loss adjusted for certain revenue, expenses, gains and losses that are excluded from net loss in accordance with U.S. GAAP, such as pension and other postretirement medical plan adjustments. Comprehensive loss is shown as a separate component in the Consolidated Statements of Operations and Comprehensive Loss.
Fair Value of Financial Instruments
Fair value is the price that we would receive to sell an asset or pay to transfer a liability (an exit price) in the principal or most advantageous market for the asset or liability in an orderly transaction between market participants at the measurement date. For assets and liabilities we record or disclose at fair value, we determine the fair value based upon the quoted market price, if available. If a quoted market price is not available, we determine the fair value based upon the quoted market price of similar assets or the present value of expected future cash flows using discount rates appropriate for the duration.
The fair values are assigned a level within the following fair value hierarchy to prioritize the inputs used to measure the fair value of assets or liabilities:
|
·
|
Level 1 – Observable inputs based on quoted prices in active markets for identical assets or liabilities;
|
|
·
|
Level 2 – Inputs other than quoted prices included within Level 1 that are observable for the asset or liability, either directly or indirectly; and
|
|
·
|
Level 3 – Unobservable inputs in which little or no market data exists which require the reporting entity to develop its own assumptions.
|
See Notes 8 and 13 to the Consolidated Financial Statements for a further discussion of our fair value measurements.
Segment Reporting
Operating segments are components of an entity that engage in business activities with discrete financial information available that is regularly reviewed by the chief operating decision maker (“CODM”) in order to assess performance and allocate resources. Our CODM is the Company’s President and Chief Executive Officer. We consider our Ruby Tuesday and Lime Fresh concepts to be our reportable operating segments.
Accounting Pronouncements Adopted During Fiscal 2015
As discussed further in Note 9 to the Consolidated Financial Statements, we adopted ASU 2013-11, Income Taxes (Topic 740): Presentation of an Unrecognized Tax Benefit When a Net Operating Loss Carryforward, a Similar Tax Loss, or a Tax Credit Carryforward Exists during the first quarter of fiscal year 2015.
As discussed further in Note 8 to the Consolidated Financial Statements, we adopted ASU 2015-04, Compensation – Retirement Benefits (Topic 715): Practical Expedient for the Measurement Date of an Employer’s Defined Benefit Obligation and Plan Assets (“ASU 2015-04”) during the fourth quarter of fiscal year 2015.
Accounting Pronouncements Not Yet Adopted
In August 2014, the FASB issued ASU 2014-15, Presentation of Financial Statements – Going Concern (Subtopic 205-40): Disclosure of Uncertainties about an Entity’s Ability to Continue as a Going Concern (“ASU 2014-15”). The guidance requires an entity to evaluate whether there are conditions or events, in the aggregate, that raise substantial doubt about the entity’s ability to continue as a going concern within one year after the date that the financial statements are issued and to provide related footnote disclosures in certain circumstances. The guidance is
-57-
effective for the annual period ending after December 15, 2016, and for annual and interim periods thereafter (our fiscal year 2017). Early application is permitted. We do not believe the adoption of this guidance will have an impact on our Consolidated Financial Statements.
In May 2014, the FASB and International Accounting Standards Board (“IASB”) jointly issued ASU 2014-09, Revenue from Contracts with Customers (Topic 606) (“ASU 2014-09”). ASU 2014-09 will replace almost all existing revenue recognition guidance, including industry specific guidance, upon its effective date. The standard’s core principle is for a company to recognize revenue when it transfers goods or services to customers in amounts that reflect the consideration to which the company expects to be entitled. A company may also need to use more judgment and make more estimates when recognizing revenue, which could result in additional disclosures. ASU 2014-09 also provides guidance for transactions that were not addressed comprehensively in previous guidance, such as the recognition of breakage income from the sale of gift cards. The standard permits the use of either the retrospective or cumulative effect transition method. The guidance is effective for fiscal years, and interim periods within those years, beginning after December 15, 2017 (the first quarter of our fiscal year 2019). During the fourth quarter of fiscal year 2015, the FASB and IASB proposed a revision to ASU 2014-09 which would allow companies to defer adoption of this standard for up to one year. We have not yet selected a transition method and are currently evaluating the impact of this guidance on our Consolidated Financial Statements.
In April 2015, the FASB issued ASU 2015-03, Interest-Imputation of Interest (Subtopic 835-30): Simplifying the Presentation of Debt Issuance Costs (“ASU 2015-03”). The guidance requires an entity to present debt issuance costs in the balance sheet as a direct reduction from the carrying amount of the debt liability, consistent with debt discounts or premiums, rather than as an asset. Amortization of debt issuance costs will continue to be reported as interest expense. Debt issuance costs related to revolving credit arrangements, however, will continue to be presented as an asset and amortized ratably over the term of the arrangement. The guidance is effective for annual periods beginning after December 15, 2015, and for interim periods within those fiscal years (our fiscal year 2017). Early adoption is permitted. If we had adopted ASU 2015-03 as of June 2, 2015, $0.8 million and $3.2 million of debt issuance costs would have been reclassified from Prepaid rent and other expenses and Other assets, respectively, to a reduction in the carrying amount of our debt in our June 2, 2015 Consolidated Balance Sheet.
2. Franchise Programs
As of June 2, 2015, our franchise programs included arrangements with 30 domestic and international Ruby Tuesday concept franchisees and six domestic Lime Fresh franchisees. At the end of fiscal year 2015, our franchisees collectively operated 78 Ruby Tuesday and seven Lime Fresh restaurants. We do not own any equity interest in our existing franchisees.
We enter into development agreements with our franchisees that require them to open varying numbers of Ruby Tuesday or Lime Fresh restaurants. As of June 2, 2015, eight of our 30 Ruby Tuesday concept franchisees had agreements to develop new franchised Ruby Tuesday restaurants. None of our six Lime Fresh concept domestic franchisees had an agreement to develop new Lime Fresh restaurants as of June 2, 2015. During fiscal 2015, 2014, and 2013, our Ruby Tuesday franchisees opened six, seven, and two restaurants, respectively, pursuant to development agreements, as follows:
|
Ruby Tuesday
|
Lime Fresh
|
||||||||
|
Fiscal Year
|
Domestic
|
International
|
Total
|
||||||
|
2015
|
–
|
6
|
6
|
2
|
|||||
|
2014
|
1
|
6
|
7
|
2*
|
|||||
|
2013
|
–
|
2
|
2
|
2*
|
|||||
*One of the Lime Fresh franchise restaurant openings in each of fiscal year 2014 and 2013 was opened in Chile by an international franchisee. Both of these restaurants closed during the fourth quarter of fiscal year 2014.
-58-
In conjunction with these openings, we recognized development and licensing fee income totaling $0.2 million in each of fiscal 2015, 2014, and 2013.
Deferred development and licensing fees associated with all franchisees, which are reported as a component of Other deferred liabilities in our Consolidated Balance Sheets, totaled $0.6 million and $0.8 million as of June 2, 2015 and June 3, 2014, respectively. We will recognize these fees as income when we have substantially performed all material services and the restaurant has opened for business.
3. Discontinued Operations
In an effort to focus primarily on the sales turnaround of our core Ruby Tuesday concept and secondly, to improve the financial performance of our Lime Fresh concept, we completed the closure of our Marlin & Ray’s, Wok Hay, and Truffles restaurants during fiscal year 2013. We have classified the results of operations of these concepts as discontinued operations for the fiscal years ended June 3, 2014 and June 4, 2013. The results of operations of our discontinued operations are as follows (in thousands):
|
June 3, 2014
|
June 4, 2013
|
|||||||
|
Restaurant sales and operating revenue
|
$ | – | $ | 11,884 | ||||
|
Income/(loss) before income taxes
|
$ | 458 | $ | (24,498 | ) | |||
| Benefit for income taxes | (106 | ) | (8,519 | ) | ||||
|
Income/(loss) from discontinued operations
|
$ | 564 | $ | (15,979 | ) | |||
4. Accounts Receivable
Accounts receivable consist of the following (in thousands):
|
2015
|
2014
|
|||||||
|
Rebates receivable
|
$ | 943 | $ | 930 | ||||
|
Amounts due from franchisees
|
1,995 | 1,281 | ||||||
|
Third-party gift card sales
|
1,330 | 1,636 | ||||||
|
Other receivables
|
1,019 | 1,014 | ||||||
| $ | 5,287 | $ | 4,861 | |||||
We negotiate purchase arrangements, including price terms, with designated and approved suppliers on behalf of us and our franchise system. We receive various volume discounts and rebates based on purchases for our Company-owned restaurants from numerous suppliers.
Amounts due from franchisees consist of royalties, license and other miscellaneous fees, a substantial portion of which represents current and recently-invoiced billings.
-59-
5. Property, Equipment, Assets Held for Sale, Operating Leases, and Sale-Leaseback Transactions
Property and equipment, net, is comprised of the following (in thousands):
|
2015
|
2014
|
|||||||
|
Land
|
$ | 212,073 | $ | 214,277 | ||||
|
Buildings
|
426,813 | 430,988 | ||||||
|
Improvements
|
358,549 | 365,599 | ||||||
|
Restaurant equipment
|
247,775 | 248,852 | ||||||
|
Other equipment
|
87,782 | 84,876 | ||||||
|
Surplus properties*
|
10,504 | 18,351 | ||||||
|
Construction in progress and other
|
4,316 | 3,895 | ||||||
| 1,347,812 | 1,366,838 | |||||||
|
Less accumulated depreciation
|
595,638 | 571,992 | ||||||
| $ | 752,174 | $ | 794,846 | |||||
* Surplus properties represent assets held for sale that are not classified as such in the Consolidated Balance Sheets as we do not expect to sell these assets within the next 12 months. These assets primarily consist of parcels of land upon which we have no intention to build restaurants, closed properties which include a building, and liquor licenses not needed for operations.
Included within the current assets section of our Consolidated Balance Sheets at June 2, 2015 and June 3, 2014 are amounts classified as assets held for sale totaling $5.5 million and $4.7 million, respectively. Assets held for sale primarily consist of parcels of land upon which we have no intention to build restaurants, land and buildings of closed restaurants, and various liquor licenses. In addition to operating restaurants sold and leased back, as discussed below, during fiscal years 2015, 2014, and 2013 we sold surplus properties with carrying values of $9.5 million, $14.0 million, and $6.4 million, respectively, at net gains of $1.7 million, $1.5 million, and $0.6 million, respectively. Cash proceeds, net of broker fees, from these sales totaled $11.2 million, $15.4 million, and $7.0 million, respectively.
During the fiscal years ended June 3, 2014 and June 4, 2013, we completed sale-leaseback transactions of the land and building for three and 24 Company-owned Ruby Tuesday concept restaurants, respectively, for gross cash proceeds of $5.9 million and $54.4 million, respectively, exclusive of transaction costs of approximately $0.3 million and $2.6 million, respectively. Equipment was not included. The carrying value of the properties sold was $4.8 million and $41.4 million, respectively. The leases have been classified as operating leases and have initial terms of 15 years, with renewal options of up to 20 years. Net proceeds from the sale-leaseback transactions were used for general corporate purposes, including capital expenditures, debt payments, and the repurchase of shares of our common stock.
We realized gains during fiscal years 2014 and 2013 on the sale-leaseback transactions of $0.8 million and $10.4 million, respectively, which have been deferred and are being recognized on a straight-line basis over the initial terms of the leases. The current portion of the deferred gains on all sale-leaseback transactions to date was $1.1 million as of both June 2, 2015 and June 3, 2014, and is included in Accrued liabilities – Rent and other in our Consolidated Balance Sheets. The long-term portion of the deferred gains on all sale-leaseback transactions to date was $11.9 million and $13.0 million as of June 2, 2015 and June 3, 2014, respectively, and is included in Other deferred liabilities in our Consolidated Balance Sheets. Amortization of the deferred gains of $1.1 million, $1.1 million, and $0.8 million is included within Other restaurant operating costs in our Consolidated Statements of Operations and Comprehensive Loss for the fiscal years ended June 2, 2015, June 3, 2014, and June 4, 2013, respectively.
The following is a schedule by year of future minimum lease payments under operating leases that have initial lease terms in excess of one year as of June 2, 2015 (in thousands):
|
2016
|
$ | 48,974 | ||
|
2017
|
46,198 | |||
|
2018
|
44,055 | |||
|
2019
|
41,327 | |||
|
2020
|
38,041 | |||
|
Subsequent years
|
457,607 | |||
|
Total minimum lease payments
|
$ | 676,202 | ||
-60-
The amounts included in the table above include lease payments for certain optional renewal periods for which exercise is considered reasonably assured as well as operating leases totaling $3.0 million as discussed below for which sublease income from franchisees or others is expected.
The following schedule shows the future minimum sub-lease payments contractually due from franchisees and others for the next five years and thereafter under noncancelable sub-lease agreements (in thousands):
|
Franchisees
|
Others
|
Total
|
||||||||||
|
2016
|
$ | 247 | $ | 493 | $ | 740 | ||||||
|
2017
|
247 | 352 | 599 | |||||||||
|
2018
|
247 | 276 | 523 | |||||||||
|
2019
|
208 | 182 | 390 | |||||||||
|
2020
|
27 | 182 | 209 | |||||||||
|
Subsequent years
|
– | 565 | 565 | |||||||||
|
Total minimum sub-lease payments
|
$ | 976 | $ | 2,050 | $ | 3,026 | ||||||
The following table summarizes our minimum and contingent rent expense and our sublease rental income under our operating leases (in thousands):
|
2015
|
2014
|
2013
|
||||||||||
|
Included within continuing operations
|
||||||||||||
|
Minimum rent
|
$ | 50,489 | $ | 52,774 | $ | 51,398 | ||||||
|
Contingent rent
|
745 | 430 | 472 | |||||||||
| 51,234 | 53,204 | 51,870 | ||||||||||
|
Sublease rental income
|
(504 | ) | (409 | ) | (357 | ) | ||||||
| $ | 50,730 | $ | 52,795 | $ | 51,513 | |||||||
|
Included within discontinued operations
|
$ | – | $ | 546 | ||||||||
The amounts shown for fiscal years 2015, 2014, and 2013 above exclude rent expense of $1.2 million, $5.7 million, and $2.0 million, respectively, relating to lease reserves established for closed restaurants or dead sites, which is included within Closures and impairments expense in our Consolidated Statements of Operations and Comprehensive Loss.
6. Long-Term Debt and Capital Leases
Long-term debt and capital lease obligations consist of the following (in thousands):
|
2015
|
2014
|
|||||||
|
Senior unsecured notes
|
$ | 215,000 | $ | 215,000 | ||||
|
Unamortized discount
|
(2,162 | ) | (2,503 | ) | ||||
|
Senior unsecured notes less unamortized discount
|
212,838 | 212,497 | ||||||
|
Revolving credit facility
|
– | – | ||||||
|
Mortgage loan obligations
|
31,607 | 45,252 | ||||||
|
Unamortized premium on mortgage loan obligations
|
383 | 741 | ||||||
|
Capital lease obligations
|
206 | 201 | ||||||
| 245,034 | 258,691 | |||||||
|
Less current maturities
|
10,861 | 4,816 | ||||||
| $ | 234,173 | $ | 253,875 | |||||
-61-
Estimated annual maturities of long-term debt and capital lease obligations at June 2, 2015 are as follows (in thousands):
|
2016
|
$ | 10,975 | * | |
|
2017
|
11,875 | |||
|
2018
|
2,570 | |||
|
2019
|
2,617 | |||
|
2020
|
217,153 | |||
|
Subsequent years
|
1,623 | |||
| $ | 246,813 |
* As further discussed in Note 16 to the Consolidated Financial Statements, we prepaid and retired $8.3 million of our mortgage loan obligations subsequent to June 2, 2015.
On May 14, 2012, we entered into an indenture (the “Indenture”) among the Company, certain subsidiaries of the Company as guarantors and Wells Fargo Bank, National Association as trustee, governing the Company’s $250.0 million aggregate principal amount of 7.625% senior notes due 2020 (the “Senior Notes”). The Senior Notes were issued at a discount of $3.7 million, which is being amortized using the effective interest method over the eight-year term of the notes.
The Senior Notes are guaranteed on a senior unsecured basis by our existing and future domestic restricted subsidiaries, subject to certain exceptions. They rank equal in right of payment with our existing and future senior indebtedness and senior in right of payment to any of our future subordinated indebtedness. The Senior Notes are effectively subordinated to all of our secured debt, including borrowings outstanding under our revolving credit facility, to the extent of the value of the assets securing such debt and structurally subordinated to all of the liabilities of our existing and future subsidiaries that do not guarantee the Senior Notes.
Interest on the Senior Notes is calculated at 7.625% per annum, payable semiannually on each May 15 and November 15 to holders of record on the May 1 or November 1 immediately preceding the interest payment date. Accrued interest on the Senior Notes and our other long-term debt and capital lease obligations is included in Accrued liabilities – Rent and other in our Consolidated Balance Sheets. The Senior Notes mature on May 15, 2020.
At any time prior to May 15, 2016, we may redeem the Senior Notes, in whole or in part, at a redemption price equal to 100% of the principal amount, plus an applicable “make-whole” premium and accrued and unpaid interest. At any time on or after May 15, 2016, we may redeem the Senior Notes, in whole or in part, at the redemption prices specified in the Indenture plus accrued and unpaid interest. We may redeem up to 35% of the Senior Notes from the proceeds of certain equity offerings. There is no sinking fund for the Senior Notes.
The Indenture contains covenants that limit, among other things, our ability and the ability of certain of our subsidiaries to (i) incur or guarantee additional indebtedness; (ii) declare or pay dividends, redeem stock or make other distributions to stockholders; (iii) make certain investments; (iv) create liens or use assets as security in other transactions; (v) merge or consolidate, or sell, transfer, lease or dispose of substantially all of their assets; (vi) enter into transactions with affiliates; and (vii) sell or transfer certain assets. The Indenture also restricts the declaration and payment of a dividend or other distribution on, and/or repurchase by RTI in respect of, its outstanding common stock at any time and from time to time. These covenants are subject to a number of important exceptions and qualifications, as described in the Indenture, and certain covenants will not apply at any time when the Senior Notes are rated investment grade by the Rating Agencies, as defined in the Indenture. The Indenture also provides for events of default, which, if any of them occurs, would permit or require the principal, premium, if any, interest and any other monetary obligations on all the then outstanding Senior Notes to be due and payable immediately.
On December 3, 2013, we entered into the four-year revolving credit agreement (the “Senior Credit Facility”) under which we may borrow up to $50.0 million with the option, subject to certain conditions, to increase the facility by up to $35.0 million. The Senior Credit Facility, which was obtained to provide access to capital for general corporate purposes, replaced a previous five-year $200.0 million credit facility that was set to expire in December 2015. The terms of the Senior Credit Facility provide for a $25.0 million sublimit for the issuance of standby letters of credit. In connection with entering into the Senior Credit Facility, included within Interest expense, net and Loss on extinguishment of debt in our Consolidated Statements of Operations and Comprehensive Loss for the year ended June
-62-
3, 2014 are charges of $0.7 million relating to the write-off of the pro rata portion of unamortized debt issuance costs associated with our previous credit facility.
Under the terms of the Senior Credit Facility, interest rates charged on borrowings can vary depending on the interest rate option we choose to utilize. Our options for the rate are a Base Rate or LIBOR plus an applicable margin, provided that the rate shall not be less than zero. The Base Rate is defined as the highest of the issuing bank’s prime rate, the Federal Funds rate plus 0.50%, or the Adjusted LIBO rate (as defined in the Senior Credit Facility) plus 1.0%. The applicable margin for the LIBOR rate-based option is a percentage ranging from 2.50% to 3.50% and for the Base Rate option is a percentage ranging from 1.50% to 2.50%. We pay commitment fees quarterly ranging from 0.40% to 0.75% on the unused portion of the Senior Credit Facility.
As security for the Senior Credit Facility, we granted the lenders liens and security interests in substantially all of the shares of capital stock of the Company and each of our present and future subsidiaries, substantially all of the personal property of the Company and each of our present and future subsidiaries, and the real property, improvements, and fixtures of 49 Ruby Tuesday restaurants. The real property, improvements, and fixtures of the 49 restaurants pledged as collateral appraised at $101.4 million at the time of the transaction and have a June 2, 2015 net book value of $79.2 million.
We had no borrowings outstanding under the Senior Credit Facility at June 2, 2015. After consideration of letters of credit outstanding, we had $37.5 million available under the Senior Credit Facility as of June 2, 2015.
The Senior Credit Facility contains a number of customary affirmative and negative covenants that, among other things, limit or restrict our ability to incur liens, engage in mergers or other fundamental changes, make acquisitions, investments, loans and advances, pay dividends or other distributions, sell or otherwise dispose of certain assets, engage in certain transactions with affiliates, enter into burdensome agreements or certain hedging agreements, amend organizational documents, change accounting practices, incur additional indebtedness and prepay other indebtedness. Under the terms of the Senior Credit Facility we are allowed, under certain circumstances, to repurchase up to $20.0 million of the Senior Notes in any fiscal year. We did not repurchase any Senior Notes during the year ended June 2, 2015. During the year ended June 3, 2014, we repurchased $20.0 million of the Senior Notes for $20.0 million plus $0.2 million of accrued interest. We realized losses of $0.7 million on these transactions. The balance on the Senior Notes was $215.0 million at June 2, 2015.
Under the Senior Credit Facility, we are required to comply with financial covenants relating to the maintenance of a maximum leverage ratio and a minimum fixed charge coverage ratio. The terms of the Senior Credit Facility require us to maintain a maximum leverage ratio of no more than 4.75 to 1.0 and a minimum fixed charge coverage ratio of 1.4 to 1.0 for the quarter ended June 2, 2015. The minimum required ratios fluctuate thereafter as provided in the Senior Credit Facility.
The Senior Credit Facility terminates no later than December 3, 2017. Upon the occurrence of an event of default, the lenders may terminate the loan commitments, accelerate all loans and exercise any of their rights under the Senior Credit Facility and any ancillary loan documents.
On December 3, 2013, in connection with our entry into the Senior Credit Facility, the Company and certain of its subsidiaries entered into loan modification agreements (the “Loan Modification Agreements”) with certain mortgage lenders to, among other things, provide waivers and consents under certain of our mortgage loan obligations to enter into the Senior Credit Facility. The Loan Modification Agreements also, among other things, amend certain financial reporting requirements under the specified loans and modify and/or provide for certain financial covenants for the specified loans, including the maximum funded debt covenant and the minimum consolidated fixed charge coverage ratio.
We were in compliance with our maximum funded debt covenant and our minimum consolidated fixed charge coverage ratio as of June 2, 2015.
Our $31.6 million in mortgage loan obligations as of June 2, 2015 consists of various loans acquired upon franchise acquisitions. These loans, which mature between January 2017 and July 2022, have balances which range from $0.3
-63-
million to $7.3 million and interest rates of 7.60% to 10.17%. Many of the properties acquired from franchisees collateralize the loans outstanding.
During fiscal year 2015, we prepaid and retired ten mortgage loan obligations with an aggregate balance of $9.0 million using cash on hand. In connection with the retirement of these obligations, we paid $1.0 million in prepayment premiums and an insignificant amount of accrued interest. Additionally, as further discussed in Note 16 to the Consolidated Financial Statements, on July 9, 2015, we prepaid and retired an additional ten mortgage loan obligations with an aggregate balance of $8.3 million as of June 2, 2015. The prepayment of this debt eliminated one mortgage lender and allowed for the release of 26 properties which had served as collateral.
7. Closures and Impairments Expense, Including Goodwill and Trademark Impairments
Closures and impairments, net include the following (in thousands):
|
2015
|
2014
|
2013
|
||||||||||
|
Closures and impairments from continuing operations:
|
||||||||||||
|
Property impairments
|
$ | 9,822 | $ | 24,335 | $ | 11,325 | ||||||
|
Closed restaurant lease reserves
|
1,461 | 7,302 | 2,844 | |||||||||
|
Other closing expense
|
966 | 2,181 | 1,152 | |||||||||
|
Gain on sale of surplus properties
|
(1,707 | ) | (987 | ) | (665 | ) | ||||||
|
Closures and impairments, net
|
$ | 10,542 | $ | 32,831 | $ | 14,656 | ||||||
|
Closures and impairments from discontinued operations
|
$ | (468 | ) | $ | 21,674 | |||||||
Included within Closures and impairments, net for fiscal year 2015 are impairments of $7.7 million related to restaurants with deteriorating operational performance, $1.8 million related to surplus properties, and $0.3 million associated with lease expirations and restaurant closures.
During fiscal year 2014, we closed 33 Ruby Tuesday concept restaurants in connection with a plan approved by the Board of Directors of Ruby Tuesday, Inc.. Of these closures, 11 of the restaurants closed upon expiration of their lease. Included within Closures and impairments, net for fiscal year 2014 are impairment charges of $4.8 million in connection with early restaurant closures.
In addition to impairment charges recorded in connection with the planned closures discussed above, during fiscal year 2014, we recorded $13.5 million of impairments relating to 32 open restaurants with deteriorating operational performance and a $0.9 million impairment charge for the Lime Fresh trademark. The Lime Fresh trademark, which previously had been impaired by $5.0 million in fiscal year 2013, has a net book value of $3.1 million remaining at June 2, 2015.
Included in Closures and impairments, net from continuing operations for fiscal year 2013 are $4.3 million of impairment and lease charges relating to the closing of four Lime Fresh concept restaurants and $3.6 million of impairment charges for four underperforming Lime Fresh open restaurants, two of which closed during fiscal year 2014.
As discussed further in Note 3 to the Consolidated Financial Statements, in an effort to focus primarily on the sales turnaround of our core Ruby Tuesday concept and secondly, to improve the financial performance of our Lime Fresh concept, we completed the closure of our Marlin & Ray’s, Wok Hay, and Truffles restaurants during fiscal year 2013. As a result of these decisions, pre-tax charges of $21.7 million were recognized for asset impairments, lease reserves, and other closing costs within Loss from discontinued operations, net of tax for the fiscal year ended June 4, 2013.
-64-
A rollforward of our future lease obligations associated with closed restaurants is as follows (in thousands):
|
Reserve for
Lease Obligations
|
||||
|
Balance at June 4, 2013
|
$ | 8,727 | ||
|
Closing expense including rent and other lease charges
|
6,815 | |||
|
Payments
|
(5,805 | ) | ||
|
Other adjustments
|
1,136 | |||
|
Balance at June 3, 2014
|
10,873 | |||
|
Closing expense including rent and other lease charges
|
1,461 | |||
|
Payments
|
(4,807 | ) | ||
|
Other adjustments
|
(476 | ) | ||
|
Balance at June 2, 2015
|
$ | 7,051 | ||
The amounts comprising future lease obligations in the table above are estimated using certain assumptions, including the period of time it will take to settle the lease with the landlord or find a suitable sublease tenant, and the amount of actual future cash payments could differ from our recorded lease obligations. Of the total future lease obligations included in the table above, $7.0 million and $10.5 million are included within the Accrued liabilities – Rent and other caption in our Consolidated Balance Sheets as of June 2, 2015 and June 3, 2014, respectively. For fiscal year 2016 and beyond, our focus will be on obtaining settlements, or subleases as necessary, on as many of these leases as possible and these settlements could be higher or lower than the amounts recorded. The actual amount of any cash payments made by the Company for lease contract termination costs will be dependent upon ongoing negotiations with the landlords of the leased restaurant properties.
Goodwill
Goodwill represents the excess of costs over the fair market value of assets of businesses acquired. We recorded goodwill with the acquisition of Lime Fresh during fiscal 2012. Impairment tests for goodwill require a two-step process and are performed after testing of all other assets is complete. Under the first step, the estimation of fair value of the reporting unit is compared with its carrying value, including goodwill. If the carrying value of the reporting unit is higher than its fair value, there is an indication that impairment may exist and the second step must be performed to measure the amount of impairment loss, if any. Goodwill impairment exists when the implied fair value of goodwill is less than its carrying value. The implied fair value of goodwill is determined by allocating the fair value of the reporting unit in a manner similar to a purchase price allocation.
During the fourth quarter of fiscal year 2013, we tested the goodwill associated with the fiscal year 2012 acquisition of our Lime Fresh concept using the two-step method as discussed above. The results of the first step indicated a potential goodwill impairment as the fair value of the Lime Fresh concept was less than its carrying value. We determined the fair value of the Lime Fresh concept using the discounted cash flow method. The results of the second step indicated that all of the goodwill recorded in connection with the Lime Fresh acquisition was impaired. Accordingly, we recorded a fiscal year 2013 charge of $9.0 million ($5.4 million, net of tax) representing the full value of our Lime Fresh concept goodwill.
8. Employee Post-Employment Benefits
In April 2015, the FASB issued ASU 2015-04, Compensation – Retirement Benefits (Topic 715): Practical Expedient for the Measurement Date of an Employer’s Defined Benefit Obligation and Plan Assets (“ASU 2015-04”). The guidance permits entities with a fiscal year-end that does not coincide with a month-end to measure defined benefit plan assets and obligations using the month-end that is closest to the entity’s fiscal year-end and to apply that practical expedient consistently from year to year. ASU 2015-04 is to be applied on a prospective basis and to all plans if an entity has more than one plan. The guidance is effective for the annual periods beginning after December 15, 2015, and for interim periods within those fiscal years (our fiscal year 2016). Early application of this guidance is permitted, and we early adopted ASU 2015-04 during the fourth quarter of our fiscal year 2015. As a result of our early adoption, the date used to measure our fiscal year 2015 plan assets and obligations for all plans was May 31, 2015. The adoption of ASU 2015-04 did not have a significant impact on our Consolidated Financial Statements.
-65-
Pension and Postretirement Medical and Life Benefits
We sponsor three defined benefit pension plans for active employees and offer certain postretirement benefits for retirees. A summary of each of these is presented below.
Retirement Plan
RTI sponsors the Morrison Restaurants Inc. Retirement Plan (the "Retirement Plan"). Effective December 31, 1987, the Retirement Plan was amended so that no additional benefits would accrue and no new participants could enter the Retirement Plan after that date. Participants receive benefits based upon salary and length of service.
Minimum funding for the Retirement Plan is determined in accordance with the guidelines set forth in employee benefit and tax laws. From time to time we may contribute additional amounts as we deem appropriate. We estimate that we will be required to make contributions totaling $0.2 million to the Retirement Plan in fiscal year 2016.
The Retirement Plan’s assets are held in a trust and were allocated as follows on the measurement dates:
|
2015
|
2014
|
||||
|
Target
Allocation
|
Actual Allocation
|
Target
Allocation
|
Actual
Allocation
|
||
|
Equity securities
|
39-69%
|
58%
|
60-80%
|
71%
|
|
|
Fixed income securities
|
12-42%
|
23%
|
20-40%
|
22%
|
|
|
Public real estate investment trusts
|
0-10%
|
5%
|
0-10%
|
4%
|
|
|
Cash and cash equivalents
|
0-20%
|
1%
|
0%
|
2%
|
|
|
Other
|
0-24%
|
13%
|
0-10%
|
1%
|
|
|
Total
|
100%
|
|
100%
|
||
The Retirement Plan fiduciaries set investment policies and strategies for the Retirement Plan’s trust. The overall investment objective is to invest the Retirement Plan’s assets in a structure designed to produce returns, over a long-term horizon (greater than 10 years), that meets the actuarially assumed rate of return. The Retirement Plan’s fiduciaries oversee the investment allocation process, which includes selecting investment managers, commissioning periodic asset-liability studies, setting long-term strategic targets, and monitoring asset allocations. Target allocation ranges are guidelines, not limitations, and occasionally the Retirement Plan’s fiduciaries will approve allocations above or below a target range. In fiscal year 2015, we changed our target allocation to reduce the Retirement Plan’s exposure to equity securities risk. The target allocation percentages presented above reflect an objective focused on capital appreciation with a secondary focus on current income through a higher allocation to equities than fixed income, and where appropriate, other asset classes.
Under the terms of the investment policy statement, plan assets are comprised of two major classes: equity and fixed income securities. The goal of the equity portfolio is to produce a total return that will provide a hedge against inflation. Equity securities can include both domestic and international securities with a long-term strategic target to maintain an equity allocation of approximately 54% of the total market value of plan assets.
The goal of the fixed income portfolio is to reduce the overall volatility of the Retirement Plan, provide a stable stream of income, and provide a hedge against deflation without exposure to excessive interest rate or credit rate risk. Fixed income securities should be primarily U.S. Treasury or Government Agency securities and investment-grade corporate bonds at the time of purchase with a long-term strategic target to maintain a fixed income allocation of approximately 27% of the total market value of plan assets.
Aside from equity and fixed income securities, the trust may also invest in alternative investments, such as public real estate investment trusts and mutual funds investing in hedge funds and commodities, with a long-term strategic target to maintain an allocation of approximately 19% of the total market value of plan assets.
The fair values of assets held by the Retirement Plan by asset category are as follows (in thousands):
|
2015
|
2014
|
|||||||
|
Level 2:
|
||||||||
|
Cash and cash equivalents
|
$ | 78 | $ | 108 | ||||
|
Level 1:
|
||||||||
|
Equity securities
|
||||||||
|
U.S.-based companies
|
2,701 | 3,798 | ||||||
|
International-based companies
|
1,277 | 1,161 | ||||||
|
Fixed income securities
|
1,584 | 1,546 | ||||||
|
Public real estate investment trusts
|
328 | 303 | ||||||
|
Other
|
883 | 104 | ||||||
|
Fair value of plan assets as of measurement date
|
$ | 6,851 | $ | 7,020 | ||||
|
Benefit payments after measurement date
|
(65 | ) | – | |||||
|
Total assets reported as of fiscal year end
|
$ | 6,786 | $ | 7,020 | ||||
Executive Supplemental Pension Plan and Management Retirement Plan
Under these unfunded defined benefit pension plans, eligible employees earn supplemental retirement income based upon salary and length of service, reduced by social security benefits and amounts otherwise receivable under other specified Company retirement plans. Effective June 1, 2001, the Management Retirement Plan was amended so that no additional benefits would accrue and no new participants could enter the plan after that date.
On November 30, 2012, Samuel E. Beall, III, our former Chief Executive Officer (“CEO”), stepped down from management and the Board of Directors. Mr. Beall was paid a lump-sum pension payment of $8.1 million on June 4, 2013. Additionally, we recorded a pre-tax curtailment expense of $2.5 million during fiscal year 2013 representing the recognition of a pro rata portion (calculated as the percentage reduction in the projected benefit obligation due to Mr. Beall’s lump-sum pension payment on June 4, 2013) of the unrecognized loss recorded within accumulated other comprehensive loss.
Although considered to be unfunded, we own whole-life insurance contracts in order to provide a source of funding for benefits due under the terms of the Executive Supplemental Pension Plan and the Management Retirement Plan. Benefits payable under these two plans are paid from a rabbi trust which holds the insurance contracts. We will on occasion contribute additional amounts into the rabbi trust in the event of a liquidity shortfall. We currently project that benefit payments from the rabbi trust for these two plans will approximate $3.2 million in fiscal year 2016.
Postretirement Medical and Life Benefits
Our Postretirement Medical and Life Benefits plans provide medical benefits to substantially all retired employees and life insurance benefits to certain retirees. The medical plan requires retiree cost sharing provisions that are more substantial for employees who retire after January 1, 1990.
The following tables detail the components of net periodic benefit cost for the Retirement Plan, Management Retirement Plan, and the Executive Supplemental Pension Plan (collectively, the "Pension Plans") and the Postretirement Medical and Life Benefits plans, which is recorded as a component of Selling, general, and administrative expense, net in our Consolidated Statements of Operations and Comprehensive Loss (in thousands):
|
Pension Benefits
|
||||||||||||
|
2015
|
2014
|
2013
|
||||||||||
|
Service cost
|
$ | 301 | $ | 356 | $ | 460 | ||||||
|
Interest cost
|
1,773 | 1,737 | 2,100 | |||||||||
|
Expected return on plan assets
|
(498 | ) | (444 | ) | (409 | ) | ||||||
|
Amortization of prior service cost (a)
|
1 | 1 | 106 | |||||||||
|
Recognized actuarial loss
|
1,718 | 1,711 | 2,259 | |||||||||
|
Curtailment expense
|
– | – | 2,481 | |||||||||
|
Net periodic benefit cost
|
$ | 3,295 | $ | 3,361 | $ | 6,997 | ||||||
-67-
|
Postretirement Medical and Life Benefits
|
||||||||||||
|
2015
|
2014
|
2013
|
||||||||||
|
Service cost
|
$ | 4 | $ | 13 | $ | 10 | ||||||
|
Interest cost
|
46 | 67 | 60 | |||||||||
|
Amortization of prior service cost (a)
|
– | (46 | ) | (56 | ) | |||||||
|
Recognized actuarial loss
|
134 | 244 | 214 | |||||||||
|
Net periodic benefit cost
|
$ | 184 | $ | 278 | $ | 229 | ||||||
(a) Prior service costs are amortized on a straight-line basis over the average remaining service period of employees expected to receive benefits.
The following table details changes in the amounts recognized in accumulated other comprehensive loss in our 2015 and 2014 Consolidated Financial Statements for the Pension Plans and the Postretirement Medical and Life Benefits plans (in thousands):
| Pension Benefits |
Postretirement Medical
and Life Benefits
|
|||||||||||||||
|
2015
|
2014
|
2015
|
2014
|
|||||||||||||
|
Beginning of year
|
$ | (17,086 | ) | $ | (16,419 | ) | $ | (1,017 | ) | $ | (1,729 | ) | ||||
|
Net actuarial loss/(gain)
|
(1,782 | ) | (2,379 | ) | (111 | ) | 514 | |||||||||
|
Amortization of prior service (cost)/credit
|
1 | 1 | – | (46 | ) | |||||||||||
|
Amortization of actuarial gain
|
1,718 | 1,711 | 134 | 244 | ||||||||||||
|
End of year
|
$ | (17,149 | ) | $ | (17,086 | ) | $ | (994 | ) | $ | (1,017 | ) | ||||
The change in benefit obligation and plan assets and reconciliation of funded status is as follows (in thousands):
| Pension Benefits |
Postretirement Medical
and Life Benefits
|
|||||||||||||||
|
2015
|
2014
|
2015
|
2014
|
|||||||||||||
|
Change in benefit obligation:
|
||||||||||||||||
|
Beginning projected benefit obligation
|
$ | 42,774 | $ | 40,308 | $ | 1,376 | $ | 1,896 | ||||||||
|
Service cost
|
301 | 356 | 4 | 13 | ||||||||||||
|
Interest cost
|
1,773 | 1,737 | 46 | 67 | ||||||||||||
|
Plan participant contributions
|
– | – | 78 | 91 | ||||||||||||
|
Actuarial loss/(gain)
|
1,620 | 2,736 | 111 | (514 | ) | |||||||||||
|
Benefits paid
|
(2,625 | ) | (2,363 | ) | (211 | ) | (177 | ) | ||||||||
|
Benefit obligation at end of year
|
$ | 43,843 | $ | 42,774 | $ | 1,404 | $ | 1,376 | ||||||||
|
Change in plan assets:
|
||||||||||||||||
|
Beginning fair value of plan assets
|
$ | 7,020 | $ | 6,506 | $ | – | $ | – | ||||||||
|
Actual return on plan assets
|
336 | 800 | – | – | ||||||||||||
|
Employer contributions
|
2,055 | 2,077 | 133 | 86 | ||||||||||||
|
Plan participant contributions
|
– | – | 78 | 91 | ||||||||||||
|
Benefits paid
|
(2,625 | ) | (2,363 | ) | (211 | ) | (177 | ) | ||||||||
|
Fair value of plan assets at
|
||||||||||||||||
|
end of year
|
$ | 6,786 | $ | 7,020 | $ | – | $ | – | ||||||||
|
Funded status at end of year
|
$ | (37,057 | )* | $ | (35,754 | )* | $ | (1,404 | ) | $ | (1,376 | ) | ||||
|
Amounts recognized in the
Consolidated Balance Sheets:
|
||||||||||||||||
|
Accrued liabilities – payroll and related
|
||||||||||||||||
|
costs
|
$ | (3,185 | ) | $ | (3,277 | ) | $ | (137 | ) | $ | (128 | ) | ||||
|
Other deferred liabilities
|
(33,872 | ) | (32,477 | ) | (1,267 | ) | (1,248 | ) | ||||||||
|
Net amount recognized at year-end
|
$ | (37,057 | ) | $ | (35,754 | ) | $ | (1,404 | ) | $ | (1,376 | ) | ||||
|
Amounts recognized in accumulated other comprehensive loss:
|
||||||||||||||||
|
Prior service credit
|
$ | (1 | ) | $ | (2 | ) | $ | – | $ | – | ||||||
|
Net actuarial loss
|
(17,148 | ) | (17,084 | ) | (994 | ) | (1,017 | ) | ||||||||
|
Total amount recognized
|
$ | (17,149 | ) | $ | (17,086 | ) | $ | (994 | ) | $ | (1,017 | ) | ||||
|
*
|
The funded status reflected above includes the liabilities attributable to all of the Pension Plans but only the assets of the Retirement Plan as the other plans are not considered funded for Employee Retirement Income Security Act purposes. To provide a source for the payment of benefits under the Executive Supplemental Pension Plan and the Management Retirement Plan, we own whole-life insurance contracts on some of the participants. The cash value of these policies, which are included within the Other Assets caption in our Consolidated Balance Sheets, was $29.5 million and $29.7 million at June 2, 2015 and June 3, 2014, respectively. In addition, we held in trust a negligible amount and $0.2 million of cash and cash equivalents as of June 2, 2015 and June 3, 2014, respectively, relating to these policies. We maintain a rabbi trust to hold the policies and death benefits as they are received.
|
During fiscal years 2015, 2014, and 2013, we reclassified the following items out of accumulated other comprehensive loss and into Pension and Postretirement Medical and Life Benefits expense, which is included in Selling, general and administrative, net within our Consolidated Statements of Operations and Comprehensive Loss, as follows (in thousands):
|
2015
|
2014
|
2013
|
||||||||||
|
Recognized actuarial loss
|
$ | 1,852 | $ | 1,955 | $ | 2,473 | ||||||
|
Amortization of prior service cost/(credit)
|
1 | (46 | ) | 50 | ||||||||
|
Curtailment expense
|
– | – | 2,481 | |||||||||
|
|
1,853 | 1,909 | 5,004 | |||||||||
|
Income taxes
|
– | – | (1,986 | ) | ||||||||
|
Pension reclassification, net of tax
|
$ | 1,853 | $ | 1,909 | $ | 3,018 | ||||||
The estimated prior service cost for the Pension and the Postretirement Medical and Life Benefits plans that will amortized from accumulated other comprehensive income into net periodic pension cost in fiscal year 2016 is insignificant. The estimated net loss for the Pension and the Postretirement Medical and Life Benefits plans that will be amortized from accumulated other comprehensive loss into net periodic pension cost in fiscal year 2016 is $2.0 million.
Additional measurement date information for the Pension and Postretirement Medical and Life Benefits plans which have benefit obligations in excess of plan assets (in thousands):
|
Pension Plans
|
Postretirement Medical
and Life Benefits
|
|||||||||||||||
|
June 2, 2015
|
June 3, 2014
|
June 2, 2015
|
June 3, 2014
|
|||||||||||||
|
Projected benefit obligation
|
$ | 43,843 | $ | 42,774 | $ | 1,404 | $ | 1,376 | ||||||||
|
Accumulated benefit
|
||||||||||||||||
|
obligation
|
43,518 | 42,002 | 1,404 | 1,376 | ||||||||||||
|
Fair value of plan assets
|
6,786 | 7,020 | – | – | ||||||||||||
The weighted average assumptions used to determine the net periodic benefit cost for fiscal years are set forth below:
|
Pension Plans
|
|||
|
2015
|
2014
|
2013
|
|
|
Discount rate
|
4.4%
|
4.5%
|
4.5%
|
|
Expected return on plan assets
|
7.0%
|
7.0%
|
7.3%
|
|
Rate of compensation increase
|
2.0%
|
2.0%
|
2.0%
|
|
Postretirement Medical and Life Benefits
|
|||
|
2015
|
2014
|
2013
|
|
|
Discount rate
|
3.5%
|
3.7%
|
3.9%
|
|
Rate of compensation increase
|
2.0%
|
2.0%
|
2.0%
|
Our estimated long-term rate of return on plan assets represents the weighted average of expected future returns on the asset categories included in our target investment allocation based primarily on the historical returns for each asset category, adjusted for an assessment of current market conditions.
The weighted average assumptions used to determine benefit obligations at the measurement dates are set forth below:
|
Pension Plans
|
||
|
2015
|
2014
|
|
|
Discount rate
|
4.2%
|
4.4%
|
|
Rate of compensation increase
|
2.0%
|
2.0%
|
|
Postretirement Medical and Life Benefits
|
||
|
2015
|
2014
|
|
|
Discount rate
|
3.6%
|
3.5%
|
|
Rate of compensation increase
|
2.0%
|
2.0%
|
We currently are assuming a gross medical trend rate of 7.0% for fiscal 2016. We expect this rate to decrease approximately 0.25% per year for an ultimate trend rate of 5.0% in fiscal 2024. A change in this rate of 1.0% would have no significant impact on our net periodic postretirement benefit expense or our accrued postretirement benefits liability.
The benefits expected to be paid in each of the next five years and in the aggregate for the five years thereafter are set forth below (in thousands):
|
Pension Plans
|
Postretirement Medical
and Life Benefits
|
|||||||
|
2016
|
$ | 3,911 | $ | 137 | ||||
|
2017
|
2,425 | 132 | ||||||
|
2018
|
2,368 | 147 | ||||||
|
2019
|
2,318 | 129 | ||||||
|
2020
|
2,276 | 122 | ||||||
|
2021-2025
|
20,126 | 568 | ||||||
Expected benefits are estimated based on the same assumptions used to measure our benefit obligation on our measurement date of May 31, 2015 and, where applicable, include benefits attributable to estimated further employee service.
Defined Contribution Plans
We sponsor two defined contribution plans for active employees, as summarized below.
Salary Deferral Plan
RTI offers certain employees a 401(k) plan called the Ruby Tuesday, Inc. Salary Deferral Plan (“401(k) Plan”). We make matching contributions to the 401(k) Plan based on each eligible employee's pre-tax contribution and years of service. We match in cash each fiscal quarter a specified percentage of the participating employee's first 6% of pre-tax
-70-
contribution based on achievement of a same-restaurant sales performance factor. Company matches do not vest until the employees have worked for us three years. Given that the Company did not achieve the 2015, 2014, or 2013 same-restaurant sales performance factor in order for there to be an employer match, we had no expense related to the 401(k) Plan for fiscal years 2015, 2014, or 2013.
Deferred Compensation Plan
On January 5, 2005, our Board of Directors approved the adoption of the Ruby Tuesday, Inc. 2005 Deferred Compensation Plan (the “Deferred Compensation Plan”), effective as of January 1, 2005, and froze the existing deferred compensation plan, the Ruby Tuesday, Inc. Restated Deferred Compensation Plan (the “Predecessor Plan”), effective as of December 31, 2004, in order to satisfy the requirements of Section 409A of the Internal Revenue Code of 1986, as amended, enacted as part of the American Jobs Creation Act of 2004.
Like the Predecessor Plan, the Deferred Compensation Plan is an unfunded, non-qualified deferred compensation plan for eligible employees. The Company matching provisions of the Deferred Compensation Plan are similar to those of the 401(k) Plan. We had no expenses for Company match under the Deferred Compensation Plan for fiscal years 2015, 2014, or 2013. Assets earmarked to pay benefits under the Deferred Compensation Plan are held by a rabbi trust. Assets and liabilities of a rabbi trust must be accounted for as if they are Company assets or liabilities and are therefore reported on our Consolidated Balance Sheets. Furthermore, all Deferred Compensation Plan earnings and expenses are recorded in our Consolidated Statements of Operations and Comprehensive Loss. The Deferred Compensation Plan’s assets and liabilities approximated $8.0 million and $9.6 million as of June 2, 2015 and June 3, 2014, respectively. Of these amounts, $0.7 million and $0.5 million was included in Prepaid and other expenses and Accrued liabilities – Payroll and related costs, and $7.3 million and $8.4 million was included in Other assets, net and Other deferred liabilities in the June 2, 2015 and June 3, 2014 Consolidated Balance Sheets, respectively. The investment in RTI common stock and the related liability payable in RTI common stock, which totaled $0.7 million and $0.6 million as of June 2, 2015 and June 3, 2014, respectively, is reflected in Shareholders’ Equity in the Consolidated Balance Sheets.
Executive Separations and Corporate Support Services Restructuring
Fiscal 2015
On June 26, 2014, our then Executive Vice President, Chief Financial Officer stepped down as Chief Financial Officer and subsequently retired from the Company on August 4, 2014. Additionally, three Senior Vice Presidents, our Chief Development Officer, Chief Legal Officer and Secretary, and Chief Marketing Officer left the Company on July 24, 2014, December 12, 2014, and April 27, 2015, respectively. During the year ended June 2, 2015, we recorded severance expense and made severance payments of $0.3 million in connection with the separation agreements for certain of these former executives.
Fiscal 2014
On June 7, 2013, our then President, Ruby Tuesday Concept, Chief Operations Officer left the Company. During fiscal 2014, we recorded severance expense of $0.9 million in connection with the separation agreement for the former executive, which represents obligations pursuant to the Ruby Tuesday, Inc. Severance Pay Plan (the “Severance Plan”) of two times base salary. The Severance Plan was subsequently terminated on October 7, 2013.
On October 30, 2013, our then Senior Vice President, Chief People Officer left the Company. During the second quarter of fiscal 2014, we recorded severance expense of $0.4 million in connection with his separation agreement, an amount representing one year of his annual base salary plus his remaining vacation for fiscal 2014.
Between November 20, 2013 and June 3, 2014, we eliminated approximately 82 management and staff personnel, respectively, at our Restaurant Support Services Center in Maryville, Tennessee. These reductions occurred in connection with an ongoing comprehensive review of our cost structure. These executive and other employee separations resulted in transition-related costs during the year ended June 3, 2014 of $4.3 million for employee severance and unused vacation.
Fiscal 2013
On November 30, 2012, Sandy E. Beall, III, our founder and former President, CEO, and Chairman of the Board of Directors stepped down from management and the Board of Directors. In connection with a transition agreement between the Company and Mr. Beall, the material terms of which were finalized as of June 5, 2012, we accrued $2.2 million of severance during the fourth quarter of fiscal 2012. Mr. Beall’s severance was paid during the third quarter
-71-
of fiscal 2013. As previously mentioned, on June 4, 2013, Mr. Beall received a lump sum payment of $8.1 million, representing the full amount due to him under the Executive Supplemental Pension Plan, six-months following his retirement.
As of June 2, 2015, liabilities of $0.3 million, representing unpaid obligations in connection with the separations and restructurings, were included within Accrued liabilities: Payroll and related costs in our Consolidated Balance Sheet. Costs reflected in the table below related to employee severance and unused vacation accruals are included within Selling, general, and administrative, net in our Consolidated Statements of Operations and Comprehensive Loss. A roll forward of our obligations in connection with employee separations is as follows (in thousands):
|
Balance at June 4, 2013
|
$ | 310 | ||
|
Employee severance and unused vacation accruals
|
4,294 | |||
|
Cash payments
|
(3,549 | ) | ||
|
Balance at June 3, 2014
|
$ | 1,055 | ||
|
Employee severance and unused vacation accruals
|
1,211 | |||
|
Cash payments
|
(1,953 | ) | ||
|
Balance at June 2, 2015
|
$ | 313 |
See Note 10 to the Consolidated Financial Statements for discussion of the impact of executive separations to our share-based employee compensation costs.
9. Income Taxes
Income tax benefit for fiscal years 2015, 2014, and 2013 was allocated as follows (in thousands):
|
2015
|
2014
|
2013
|
||||||||||
|
(Benefit)/provision for income taxes from
|
||||||||||||
|
continuing operations
|
$ | (1,911 | ) | $ | (4,665 | ) | $ | 1,500 | ||||
|
Benefit for income taxes from
|
||||||||||||
|
discontinued operations
|
– | (106 | ) | (8,519 | ) | |||||||
|
Total benefit for income taxes
|
$ | (1,911 | ) | $ | (4,771 | ) | $ | (7,019 | ) | |||
Income tax (benefit)/expense from continuing operations includes the following components (in thousands):
|
2015
|
2014
|
2013
|
||||||||||
|
Current:
|
||||||||||||
|
Federal
|
$ | 1,714 | $ | (5,047 | ) | $ | 8,966 | |||||
|
State
|
(48 | ) | (1,586 | ) | 1,200 | |||||||
|
Foreign
|
118 | 322 | 163 | |||||||||
| 1,784 | (6,311 | ) | 10,329 | |||||||||
|
Deferred:
|
||||||||||||
|
Federal
|
(3,254 | ) | 2,346 | (8,397 | ) | |||||||
|
State
|
(441 | ) | (700 | ) | (432 | ) | ||||||
| (3,695 | ) | 1,646 | (8,829 | ) | ||||||||
| $ | (1,911 | ) | $ | (4,665 | ) | $ | 1,500 | |||||
Deferred tax assets and liabilities are comprised of the following (in thousands):
|
2015
|
2014
|
|
|
Deferred tax assets:
|
||
|
General business credits carryforward
|
$ 53,955
|
$ 48,007
|
|
Employee benefits
|
25,343
|
22,748
|
|
Deferred escalating minimum rents
|
20,536
|
19,832
|
|
Goodwill
|
10,813
|
11,691
|
|
State net operating losses
|
7,821
|
10,260
|
|
Insurance reserves
|
6,062
|
6,267
|
|
Deferred gain on sale-leaseback transactions
|
5,148
|
5,148
|
|
Closed restaurant lease reserves
|
2,798
|
4,316
|
|
Other
|
7,656
|
13,202
|
|
Gross deferred tax assets
|
140,132
|
141,471
|
|
Deferred tax asset valuation allowances
|
(62,799)
|
(54,582)
|
|
Net deferred tax assets
|
77,333
|
86,889
|
|
Deferred tax liabilities:
|
||
|
Depreciable property and equipment
|
(64,204)
|
(73,954)
|
|
Other
|
(14,578)
|
(13,038)
|
|
Total deferred tax liabilities
|
(78,782)
|
(86,992)
|
|
Net deferred tax liability
|
$ (1,449)
|
$ (103)
|
|
Reported in Consolidated Balance Sheets as:
|
||
|
Deferred income taxes – current (liability)/asset
|
$ (7)
|
$ 3,397
|
|
Deferred income taxes – noncurrent liability
|
(1,442)
|
(3,500)
|
|
|
$ (1,449)
|
$ (103)
|
In July 2013, the FASB issued ASU 2013-11, Income Taxes (Topic 740): Presentation of an Unrecognized Tax Benefit When a Net Operating Loss Carryforward, a Similar Tax Loss, or a Tax Credit Carryforward Exists (“ASU 2013-11”). The guidance requires an entity to present its deferred tax asset for a net operating loss carryforward, similar tax loss, or a tax credit carryforward net of unrecognized tax benefits when settlement in this manner is available under the tax law, which would be based on facts and circumstances as of the balance sheet reporting date and would not consider future events. We adopted ASU 2013-11 on a prospective basis during the first quarter of fiscal year 2015. The adoption of this standard in the first quarter of fiscal year 2015 resulted in a reclassification of $5.0 million of our liability for unrecognized tax benefits against our deferred tax assets.
The above deferred tax assets and liabilities include the income tax effect of temporary differences between financial reporting and tax reporting. Temporary differences represent the cumulative taxable or deductible amounts recorded in the consolidated financial statements in different years than recognized in the tax returns. General business credits carryforward and state net operating losses may be used to offset future taxable income, and their benefit is reflected in the deferred tax assets. Other deferred tax assets, such as employee benefits, escalating minimum rents, and certain others listed, become deductible in the tax return upon payment or funding in qualified trusts. The depreciable property and equipment temporary difference represents generally tax depreciation in excess of financial statement depreciation.
We regularly evaluate the need for a valuation allowance for deferred tax assets by assessing whether it is more likely than not that we will realize the deferred tax assets in the future. A valuation allowance assessment is performed each reporting period, with any additions or adjustments reflected in earnings in the period of assessment. In assessing the need for a valuation allowance, we consider both positive and negative evidence related to the likelihood of realization of the deferred tax assets for each jurisdiction.
Through the third quarter of fiscal 2013, we concluded that objective and subjective positive evidence outweighed negative evidence, and it was more likely than not we would realize all of our federal and most of our state deferred
-73-
tax assets, except for loss carryforwards in certain states that have had cumulative losses and/or relatively short carryforward periods and annual limits of loss carryforward available for use to offset future taxable income. As of June 4, 2013, we recorded a valuation allowance following the conclusion that the negative evidence outweighed the positive evidence. This conclusion was reached primarily as a result of changes in our rolling three-year historical operating losses, as decisions made then by our new senior management team to discontinue certain concepts and slow down the growth of our Lime Fresh concept led to impairment and other losses and caused our three-year cumulative pre-tax income as of the third quarter end to swing to a three-year cumulative pre-tax loss as of the fourth quarter end.
In accordance with the applicable accounting standards, we are unable to use future income projections to support the realization of our deferred tax assets as a consequence of the above conclusion. Instead, in determining the appropriate amount of the valuation allowance, we considered the timing of future reversal of our taxable temporary differences and available tax strategies that, if implemented, would result in the realization of deferred tax assets.
A rollforward of our valuation allowance is as follows (in thousands):
|
2015
|
2014
|
2013
|
||||||||||
|
Beginning of year
|
$ | (54,582 | ) | $ | (24,566 | ) | $ | (2,392 | ) | |||
|
Changes in estimated realization of deferred tax assets:
|
||||||||||||
|
Continuing operations
|
(9,138 | ) | (31,187 | ) | (20,885 | ) | ||||||
|
Discontinued operations
|
– | 288 | (1,289 | ) | ||||||||
|
Other reductions
|
921 | 883 | – | |||||||||
|
End of year
|
$ | (62,799 | ) | $ | (54,582 | ) | $ | (24,566 | ) | |||
As of June 2, 2015, we had state net operating loss carryforwards of approximately $208.0 million which expire at varying times between fiscal years 2016 and 2035. The above accounting has no effect on our ability to use our state operating loss carryforwards or general business carryforward credits, which begin to expire in fiscal year 2032, in the future to reduce cash tax payments.
A reconciliation from the statutory federal income tax benefit to the reported income tax (benefit)/expense from continuing operations is as follows (in thousands):
|
2015
|
2014
|
2013
|
||||||||||
|
Statutory federal income taxes
|
$ | (1,787 | ) | $ | (24,351 | ) | $ | (7,677 | ) | |||
|
State income taxes, net of federal income tax benefit
|
(711 | ) | (3,564 | ) | (1,484 | ) | ||||||
|
FICA tip credit
|
(7,280 | ) | (7,533 | ) | (8,189 | ) | ||||||
|
Work opportunity tax credit
|
(1,899 | ) | (1,233 | ) | (1,366 | ) | ||||||
|
Increase in valuation allowance
|
9,138 | 31,187 | 20,885 | |||||||||
|
Permanent differences
|
528 | 2,243 | 339 | |||||||||
|
Other, net
|
100 | (1,414 | ) | (1,008 | ) | |||||||
| $ | (1,911 | ) | $ | (4,665 | ) | $ | 1,500 | |||||
We had a gross liability for unrecognized tax benefits, exclusive of accrued interest and penalties, of $3.9 million at June 2, 2015, $2.4 million of which, if recognized, would impact our effective tax rate. Pursuant to ASU 2013-11, we reclassified $3.3 million of our liability for unrecognized tax benefits as of June 2, 2015 against our deferred tax assets. A reconciliation of the beginning and ending amount of unrecognized tax benefits for fiscal years 2015 and 2014 follows (in thousands):
|
2015
|
2014
|
|||||||
|
Beginning of year
|
$ | 6,965 | $ | 13,016 | ||||
|
Additions for tax positions related to the current year
|
428 | 532 | ||||||
|
Additions for tax positions of prior years
|
114 | 321 | ||||||
|
Reductions for tax positions of prior years
|
(2,690 | ) | (5,186 | ) | ||||
|
Reductions for settlements with taxing authorities
|
(295 | ) | (619 | ) | ||||
|
Reductions due to statute settlements
|
(652 | ) | (1,099 | ) | ||||
| $ | 3,870 | $ | 6,965 | |||||
-74-
The liability for unrecognized tax benefits as of June 2, 2015 includes a negligible amount related to tax positions for
which it is reasonably possible that the total amounts could change within the next twelve months based on the outcome of examinations and negotiations with tax authorities.
As discussed in Note 1 to the Consolidated Financial Statements, our policy is to accrue interest related to potential underpayment of income taxes within the provision for income taxes. Interest is computed on the difference between our uncertain tax benefit positions and the amount deducted or expected to be deducted in our tax returns. At June 2, 2015, we had $0.4 million of accrued interest and penalties related to unrecognized tax benefits.
During fiscal year 2015, accrued interest and penalties decreased by an insignificant amount. If we were to prevail on all uncertain tax positions, the reversal of this accrual would also be a benefit to our effective tax rate. At June 2, 2015, total liabilities of $1.0 million, including the above-mentioned $0.4 million for the payment of accrued interest and penalties, are included in Accrued liabilities – Rent and other and Other deferred liabilities as reported on the Consolidated Balance Sheets.
At June 2, 2015, we are no longer subject to U.S. federal income tax examinations by tax authorities for fiscal years prior to 2012, and with few exceptions, state and local examinations by tax authorities prior to fiscal year 2012.
10. Share-Based Employee Compensation
Preferred Stock
RTI is authorized, under its Certificate of Incorporation, to issue up to 250,000 shares of preferred stock with a par value of $0.01. These shares may be issued from time to time in one or more series. Each series will have dividend rates, rights of conversion and redemption, liquidation prices, and other terms or conditions as determined by the Board of Directors. No preferred shares have been issued as of June 2, 2015 and June 3, 2014.
The Ruby Tuesday, Inc. Stock Incentive Plan and the Ruby Tuesday, Inc. 1996 Stock Incentive Plan
A committee, appointed by the Board of Directors, administers the Ruby Tuesday, Inc. Stock Incentive Plan (“SIP”) and the Ruby Tuesday, Inc. 1996 Stock Incentive Plan (“1996 SIP”), and has full authority in its discretion to determine the key employees, officers, and non-employee directors to whom share-based incentives are granted and the terms and provisions of share-based incentives. Option grants under the SIP and 1996 SIP can have varying vesting provisions and exercise periods as determined by such committee. A majority of currently outstanding service-based stock options granted under the SIP and 1996 SIP vest within three years following the date of grant and expire seven years after the date of grant. All currently outstanding market-based stock options will cliff vest if the Company’s stock price appreciates to $14 per share for a period of 20 consecutive days by December 3, 2015. The SIP and 1996 SIP permit the committee to make awards of shares of common stock, awards of stock options or other derivative securities related to the value of the common stock, and certain cash awards to eligible persons. These discretionary awards may be made on an individual basis or for the benefit of a group of eligible persons. All options awarded under the SIP and 1996 SIP have been awarded with an exercise price equal to the fair market value at the time of grant.
At June 2, 2015, we had reserved a total of 4,327,000 shares of common stock for the SIP and 1996 SIP. Of the reserved shares at June 2, 2015, 2,203,000 were subject to options outstanding. Stock option exercises are settled with the issuance of new shares. Net shares of common stock available for issuance at June 2, 2015 were 2,124,000.
Chief Executive Officer Awards
On December 1, 2012, James J. Buettgen became President and CEO of the Company. In connection with Mr. Buettgen’s appointment as CEO, on December 3, 2012 he received an initial award of approximately 68,000 service-based restricted shares and 102,000 performance-based restricted shares. Pursuant to the terms of Mr. Buettgen’s employment agreement, the Company guaranteed the earning of the performance-based restricted shares as the greater of the target value of the award or based on the Company’s achievement of certain performance conditions related to fiscal 2013. During the first quarter of fiscal year 2014, the Executive Compensation Committee of the Board of Directors determined that the performance conditions were not achieved for 34,000 shares of restricted stock awarded to our President and CEO during fiscal year 2013, and these shares were cancelled and retired accordingly. Both the service-based and performance-based awards cliff vested on June 1, 2015.
In addition to the above, on December 3, 2012, Mr. Buettgen received a one-time make-whole equity award which was comprised of approximately 179,000 service-based restricted shares and 253,000 service-based stock options. The restricted shares also cliff vested on June 1, 2015. The stock options vest in three equal annual installments following the date of grant.
Finally, on that same date, Mr. Buettgen received a one-time high-performance and inducement award which was comprised of approximately 250,000 service-based restricted shares, 250,000 service-based stock options, and 250,000 market-based stock options. Similar to the previously mentioned awards, the restricted shares cliff vested on June 1, 2015 while the service-based stock options vest in three equal annual installments following the date of grant. The market-based stock options will cliff vest if and when the Company’s stock price appreciates to $14 per share for a period of 20 consecutive days within Mr. Buettgen’s first three years of employment.
Stock Options
The following table summarizes our stock option activity under these stock option plans (Stock Options and Aggregate Intrinsic Value are in thousands):
|
Stock Options
|
Weighted
Average
Exercise
Price
|
Weighted Average Remaining Contractual Term (years)
|
Aggregate Intrinsic Value
|
|||||||||||||
|
Service-based vesting:
|
||||||||||||||||
|
Balance at June 5, 2012
|
2,716 | $ | 8.79 | |||||||||||||
|
Granted
|
503 | 7.81 | ||||||||||||||
|
Exercised
|
(591 | ) | 6.93 | |||||||||||||
|
Cancellations and forfeitures
|
(717 | ) | 11.03 | |||||||||||||
|
Balance at June 4, 2013
|
1,911 | $ | 8.27 | |||||||||||||
|
Granted
|
601 | 9.34 | ||||||||||||||
|
Exercised
|
(244 | ) | 6.45 | |||||||||||||
|
Cancellations and forfeitures
|
(315 | ) | 9.29 | |||||||||||||
|
Balance at June 3, 2014
|
1,953 | $ | 8.66 | |||||||||||||
|
Granted
|
875 | 5.94 | ||||||||||||||
|
Exercised
|
(90 | ) | 6.20 | |||||||||||||
|
Cancellations and forfeitures
|
(297 | ) | 8.65 | |||||||||||||
|
Balance at June 2, 2015
|
2,441 | $ | 7.78 | 4.39 | $ | 223 | ||||||||||
|
Exercisable
|
1,288 | $ | 8.55 | 3.19 | $ | 2 | ||||||||||
|
Market-based vesting:
|
||||||||||||||||
|
Balance at June 4, 2013
|
250 | $ | 7.81 | |||||||||||||
|
Granted
|
570 | 9.34 | ||||||||||||||
|
Cancellations and forfeitures
|
(85 | ) | 9.34 | |||||||||||||
|
Balance at June 3, 2014
|
735 | $ | 8.82 | |||||||||||||
|
Forfeited
|
(220 | ) | 9.34 | |||||||||||||
|
Balance at June 2, 2015
|
515 | $ | 8.60 | 4.84 | $ | – | ||||||||||
|
Exercisable
|
– | $ | – | – | $ | – | ||||||||||
The aggregate intrinsic value represents the closing stock price as of June 2, 2015 less the strike price, multiplied by the number of stock options that have a strike price that is less than that closing stock price. The total intrinsic value of stock options exercised during fiscal years 2015, 2014, and 2013 was $0.1 million, $0.7 million, and $1.0 million, respectively.
At June 2, 2015, there was approximately $1.4 million of unrecognized pre-tax compensation expense related to non-vested stock options. This cost is expected to be recognized over a weighted average period of 1.3 years. The total
-76-
fair value at grant date of awards vested during fiscal years 2015, 2014, and 2013 totaled $1.9 million, $1.0 million, and $2.2 million, respectively.
The service-based stock options awarded in fiscal years 2015, 2014, and 2013 vest in equal annual installments over a three-year period following grant of the award, and have a maximum life of seven years. There are no performance-based vesting requirements associated with these stock options. During fiscal 2014, we granted 570,000 market-based stock options to certain employees under the terms of the SIP. The market-based stock options vest if a share of our common stock appreciates to $14 per share or more for a period of 20 consecutive trading days on or before December 3, 2015. The stock options have a maximum life of seven years.
The weighted average Black-Scholes grant date fair value for options awarded during fiscal years 2015, 2014, and 2013 was $2.27, $4.43, and $4.37 per share, respectively. The grant date fair values of unvested stock options are amortized over the respective vesting period of the awards unless a recipient becomes retirement eligible during the vesting period. For retirement eligible individuals, the grant date fair value of the award is amortized from the period of the date of grant through the date upon which the individual becomes retirement eligible. The weighted average assumptions used in our Black-Scholes option-pricing model are as follows:
|
2015
|
2014
|
2013
|
|
|
Risk-free interest rate
|
1.48%
|
1.17%
|
0.62%
|
|
Expected dividend yield
|
0%
|
0%
|
0%
|
|
Expected stock price volatility
|
44.27%
|
58.03%
|
71.84%
|
|
Expected life (in years)
|
4.50
|
4.50
|
4.50
|
As previously mentioned, we awarded 570,000 market-based stock options to certain employees during fiscal 2014 and 250,000 market-based stock options to our CEO during fiscal 2013. We estimated the grant date fair value of these awards at $2.42 and $2.14 per share, respectively, using the Monte-Carlo simulation model. The primary assumptions used in our Monte-Carlo simulation model are as follows:
|
2014
|
2013
|
|
|
Risk-free interest rate
|
0.45%
|
0.34%
|
|
Expected dividend yield
|
0%
|
0%
|
|
Expected stock price volatility
|
42.86%
|
46.71%
|
|
Expected life (in years)
|
2.40
|
1.52
|
Restricted Stock
The following table summarizes the status of our restricted stock activity (in thousands, except per-share data):
|
2015
|
2014
|
2013
|
||||||||||||
|
Shares
|
Weighted
Average
Fair Value
|
Shares
|
Weighted
Average
Fair Value
|
Shares
|
Weighted
Average
Fair Value
|
|||||||||
|
Performance-Based Vesting:
|
||||||||||||||
|
Unvested at beginning of year
|
68
|
$
|
7.81
|
356
|
$
|
7.06
|
423
|
$
|
7.75
|
|||||
|
Granted
|
–
|
–
|
–
|
–
|
344
|
6.99
|
||||||||
|
Vested
|
(68
|
)
|
7.81
|
(18
|
) |
7.87
|
(89
|
) |
7.31
|
|||||
|
Forfeited
|
–
|
|
–
|
(270
|
) |
6.81
|
(322
|
) |
7.82
|
|||||
|
Unvested at end of year
|
–
|
$
|
–
|
68
|
$
|
7.81
|
356
|
$
|
7.06
|
|||||
|
Service-Based Vesting:
|
||||||||||||||
|
Unvested at beginning of year
|
1,008
|
$
|
8.11
|
1,136
|
$
|
7.92
|
797
|
$
|
8.37
|
|||||
|
Granted
|
629
|
6.03
|
423
|
8.83
|
795
|
7.47
|
||||||||
|
Vested
|
(780
|
)
|
7.69
|
(411)
|
8.10
|
(340
|
) |
7.56
|
||||||
|
Forfeited
|
(54
|
)
|
6.84
|
(140)
|
8.76
|
(116
|
) |
8.92
|
||||||
|
Unvested at end of year
|
803
|
$
|
6.98
|
1,008
|
$
|
8.11
|
1,136
|
$
|
7.92
|
|||||
-77-
The fair value of restricted share awards is based on the closing price of our common stock on the date prior to the grant date. The total intrinsic value of restricted shares vesting during fiscal years 2015, 2014, and 2013 was $5.4 million, $3.4 million, and $2.9 million, respectively. At June 2, 2015, unrecognized compensation expense related to restricted stock grants expected to vest totaled $2.5 million and will be recognized over a weighted average vesting period of 1.4 years.
Aside from the previously discussed December 1, 2012 inducement awards to our CEO, during fiscal years 2015, 2014, and 2013, we granted to certain employees under the terms of the SIP and 1996 SIP 402,000, 189,000, and 235,000, respectively, service-based restricted shares which cliff vest 2.5 years following the grant date, and 118,000, 174,000, and zero, respectively, service-based restricted shares which vest in three equal installments over a three-year period following the grant date. Additionally, during fiscal year 2013 we granted 242,000 performance-based restricted shares of our common stock to certain employees under the terms of the SIP and 1996 SIP. Vesting of the performance-based restricted shares was contingent upon the Company’s achievement of certain performance conditions related to fiscal year 2013. The Executive Compensation Committee of the Board of Directors determined during the first quarter of fiscal year 2014 that the performance conditions for the fiscal year 2013 performance-based awards were not achieved, and as a result the 242,000 performance-based shares were cancelled and returned to the pool of shares available for grant under the SIP and 1996 SIP.
During fiscal years 2015, 2014, and 2013, we granted 109,000, 60,000, and 63,000 restricted shares, respectively, to non-employee directors. The shares cliff vest over a one year period following the grant of the award.
Included within Selling, general, and administrative, net in our Consolidated Statements of Operations and Comprehensive Loss is share-based compensation expense of $7.1 million, $7.6 million, and $4.5 million for the fiscal years ended June 2, 2015, June 3, 2014, and June 4, 2013, respectively.
As discussed further in Note 8 to the Consolidated Financial Statements, various management personnel left the Company during fiscal years 2015 and 2014. Several of these individuals held share-based compensation awards at the times of their separations, and these awards were either vested or forfeited in accordance with the terms of the original awards.
Included within share-based compensation expense for fiscal years 2015 and 2014 were charges of $0.2 million and $0.3 million, respectively, representing the incremental costs resulting from accelerated vesting, net of forfeitures, primarily related to departure of certain employees.
11. Segment Reporting
Financial results by reportable segment for fiscal years 2015, 2014, and 2013 are as follows (in thousands):
|
Fiscal Year
|
||||||||||||
|
2015
|
2014
|
2013
|
||||||||||
|
Revenues:
|
||||||||||||
|
Ruby Tuesday concept
|
$ | 1,106,304 | $ | 1,147,348 | $ | 1,234,730 | ||||||
|
Lime Fresh concept
|
20,262 | 21,398 | 16,757 | |||||||||
|
Total revenues
|
$ | 1,126,566 | $ | 1,168,746 | $ | 1,251,487 | ||||||
|
Segment profit/(loss):
|
||||||||||||
|
Ruby Tuesday concept
|
$ | 116,408 | $ | 69,543 | $ | 111,367 | ||||||
|
Lime Fresh concept
|
(2,630 | ) | (6,070 | ) | (10,204 | ) | ||||||
|
Total segment profit
|
$ | 113,778 | $ | 63,473 | $ | 101,163 | ||||||
|
Depreciation and amortization:
|
||||||||||||
|
Ruby Tuesday concept
|
$ | 48,552 | $ | 52,990 | $ | 57,900 | ||||||
|
Lime Fresh concept
|
1,687 | 2,007 | 2,196 | |||||||||
|
Support center and other
|
2,152 | 2,350 | 2,302 | |||||||||
|
Total depreciation and amortization
|
$ | 52,391 | $ | 57,347 | $ | 62,398 | ||||||
| 2015 | 2014 | 2013 | ||||||||||
|
Closures and impairments, net:
|
||||||||||||
|
Ruby Tuesday concept
|
$ | 6,940 | $ | 27,617 | $ | 6,421 | ||||||
|
Lime Fresh concept
|
3,078 | 5,214 | 8,144 | |||||||||
|
Support center and other
|
524 | – | 91 | |||||||||
|
Total closures and impairments, net
|
$ | 10,542 | $ | 32,831 | $ | 14,656 | ||||||
|
Capital expenditures:
|
||||||||||||
|
Ruby Tuesday concept
|
$ | 29,509 | $ | 24,553 | $ | 22,609 | ||||||
|
Lime Fresh concept
|
1,293 | 2,742 | 10,036 | |||||||||
|
Support center and other
|
208 | 1,044 | 4,472 | |||||||||
|
Total capital expenditures
|
$ | 31,010 | $ | 28,339 | $ | 37,117 | ||||||
|
Total assets:
|
||||||||||||
|
Ruby Tuesday concept
|
$ | 787,214 | $ | 824,293 | $ | 893,750 | ||||||
|
Lime Fresh concept
|
10,839 | 15,203 | 18,943 | |||||||||
|
Support center and other
|
131,338 | 116,931 | 130,490 | |||||||||
|
Total assets
|
$ | 929,391 | $ | 956,427 | $ | 1,043,183 |
The following is a reconciliation of segment profit to loss from continuing operations before taxes for fiscal years 2015, 2014, and 2013 (in thousands):
|
2015
|
2014
|
2013
|
||||||||||
|
Segment profit
|
$ | 113,778 | $ | 63,473 | $ | 101,163 | ||||||
|
Less:
|
||||||||||||
|
Depreciation and amortization
|
(52,391 | ) | (57,347 | ) | (62,398 | ) | ||||||
|
Unallocated general and administrative expenses
|
(42,710 | ) | (47,946 | ) | (18,026 | ) | ||||||
|
Preopening expenses
|
(290 | ) | (395 | ) | (761 | ) | ||||||
|
Goodwill and trademark impairments
|
– | (855 | ) | (14,058 | ) | |||||||
|
Interest expense, net
|
(22,735 | ) | (24,945 | ) | (26,576 | ) | ||||||
|
Other expense, net
|
(757 | ) | (1,560 | ) | (1,278 | ) | ||||||
|
Loss from continuing operations before income taxes
|
$ | (5,105 | ) | $ | (69,575 | ) | $ | (21,934 | ) | |||
12. Commitments and Contingencies
Litigation
We are presently, and from time to time, subject to pending claims and lawsuits arising in the ordinary course of business. We provide reserves for such claims when payment is probable and estimable in accordance with GAAP. At this time, in the opinion of management, the ultimate resolution of pending legal proceedings, including the matter referred to below, will not have a material adverse effect on our operations, financial position, or cash flows.
On July 23, 2014, a case styled Kimberly LaFrance, et al. v. Ruby Tuesday, Inc., was filed against the Company in the State of New York Supreme Court, County of Onondaga on behalf of the plaintiff and all other similarly situated individuals. The plaintiff is alleging violations of certain wage notice requirements under New York law and is seeking wages, liquidated damages and attorneys’ fees. The matter has been removed to the United States District Court for the Northern District of New York. On November 20, 2014, we filed a motion to dismiss, which was followed by motions filed by the plaintiff on December 29, 2014, for class certification, and on December 31, 2014, for partial summary judgment. The parties agreed to mediate the case, and on March 5, 2015, the court stayed all deadlines in the matter pending the completion of mediation. On August 5, 2015, the parties agreed to resolve the matter, but the agreement requires court approval and will take several months to finalize. We believe that we have accrued an appropriate amount based on the agreement in principle.
Insurance Programs
We are currently self-insured for a portion of our expected workers’ compensation, employment practices liability, general liability, and automobile liability losses (collectively, “casualty losses”) as well as property losses and certain other insurable risks. To mitigate the cost of our exposures for certain property and casualty losses, we make annual
-79-
decisions to either retain the risks of loss up to a certain maximum per occurrence, aggregate loss limits negotiated with our insurance carriers, or fully insure those risks. We are also self-insured for healthcare claims for eligible participating employees subject to certain deductibles and limitations. We have accounted for our retained liabilities for casualty losses and healthcare claims, including reported and incurred but not reported claims, based on information provided by third-party actuaries. At June 2, 2015, we were committed under letters of credit totaling $12.5 million issued primarily in connection with our workers’ compensation and casualty insurance programs.
Purchase Commitments
We have minimum purchase commitments with various vendors. Outstanding commitments as of June 2, 2015 were approximately $82.8 million. These obligations consist of supplies, advertising, utility contracts, and various types of meat, beverages, and other food products, which are an integral part of our business operations.
13. Fair Value Measurements
The following table presents the fair values of our financial assets and liabilities measured at fair value on a recurring basis and the level within the fair value hierarchy in which the measurements fall (in thousands):
|
Level
|
June 2, 2015
|
June 3, 2014
|
|||||||
|
Deferred compensation plan – Assets
|
1
|
$
|
8,017
|
$
|
8,930
|
||||
|
Deferred compensation plan – Liabilities
|
1
|
(8,017
|
)
|
(8,930
|
)
|
||||
There were no transfers among levels within the fair value hierarchy during fiscal years 2015 or 2014.
The Deferred Compensation Plan and the Ruby Tuesday, Inc. Restated Deferred Compensation Plan (the “Predecessor Plan”) are unfunded, non-qualified deferred compensation plans for eligible employees. Assets earmarked to pay benefits under the Deferred Compensation Plan and Predecessor Plan are held by a rabbi trust. We report the accounts of the rabbi trust in our Consolidated Financial Statements. The investments held by these plans are considered trading securities and are reported at fair value based on third-party broker statements. The realized and unrealized holding gains and losses related to these other investments, as well as the offsetting compensation expense, is recorded in Selling, general, and administrative expense, net in the Consolidated Financial Statements.
The investment in RTI common stock and related liability payable in RTI common stock, which are reflected in Shareholders’ Equity in the Consolidated Balance Sheets, are excluded from the fair value table above as these are considered treasury shares and reported at cost.
The following table presents the fair values on our Consolidated Balance Sheets as of June 2, 2015 and June 3, 2014 for those assets and liabilities measured on a non-recurring basis(in thousands):
|
Fair Value Measurements
|
|||||||||
|
Level
|
June 2, 2015
|
June 3, 2014
|
|||||||
|
Long-lived assets held for sale
|
2
|
$
|
3,708
|
$
|
23,035
|
||||
|
Long-lived assets held for use
|
2
|
3,283
|
8,882
|
||||||
|
Total
|
$
|
6,991
|
$
|
31,917
|
|||||
-80-
The following table presents the losses recognized during the fiscal years ended June 2, 2015, June 3, 2014, and June 4, 2013 resulting from fair value measurements of assets and liabilities measured on a non-recurring basis. The losses associated with continuing operations are included in Closures and impairments, net and Goodwill and trademark impairments, and the losses associated with discontinued operations are included in Loss from discontinued operations in our Consolidated Statements of Operations and Comprehensive Loss (in thousands):
|
2015
|
2014
|
2013
|
||||||||||
|
Included within continuing operations
|
||||||||||||
|
Long-lived assets held for sale
|
$ | 1,830 | $ | 872 | $ | 3,556 | ||||||
|
Long-lived assets held for use
|
7,992 | 24,319 | 12,804 | |||||||||
| $ | 9,822 | $ | 25,191 | $ | 16,360 | |||||||
|
Included within discontinued operations
|
$ | 177 | $ | 18,842 | ||||||||
Long-lived assets held for sale are valued using Level 2 inputs, primarily from information obtained through broker listings and sales agreements. Costs to market and/or sell are factored into the estimates of fair value for those properties included in Assets held for sale on our Consolidated Balance Sheets.
We review our long-lived assets (primarily property, equipment, and, as appropriate, reacquired franchise rights and favorable leases) related to each restaurant to be held and used in the business, whenever events or changes in circumstances indicate that the carrying amount of a restaurant may not be recoverable.
Long-lived assets held for use presented in the table above includes restaurants or groups of restaurants that we have impaired. From time to time, the table will also include closed restaurants or surplus sites not meeting held for sale criteria that have been offered for sale at a price less than their carrying value. Included within discontinued operations in the table above are charges related to restaurants that were impaired as a result of the closing of all Marlin & Ray’s, Truffles, and Wok Hay restaurants during fiscal year 2013.
The fair values of our long-lived assets held for use are also based on broker estimates of the value of the land, building, leasehold improvements, and other residual assets (Level 2) or discounted cash flow estimates using unobservable inputs (Level 3).
Our financial instruments at June 2, 2015 and June 3, 2014 consisted of cash and cash equivalents, accounts receivable and payable, and long-term debt. The fair values of cash and cash equivalents and accounts receivable and payable approximated their carrying values because of the short-term nature of these instruments. The carrying amounts and fair values of our long-term debt, which are not measured on a recurring basis using fair value, are as follows (in thousands):
|
June 2, 2015
|
June 3, 2014
|
|||||||||||||||
|
Carrying
Amount
|
Fair
Value
|
Carrying
Amount
|
Fair
Value
|
|||||||||||||
|
Long-term debt (Level 2)
|
$ | 244,828 | $ | 255,194 | $ | 258,490 | $ | 262,985 | ||||||||
We estimated the fair value of debt using market quotes and calculations based on market rates.
-81-
14. Supplemental Condensed Consolidating Financial Statements
As discussed in Note 6 to the Consolidated Financial Statements, the Senior Notes are a liability of Ruby Tuesday, Inc. (the “Parent”) and are guaranteed on a senior unsecured basis by our existing and future domestic restricted subsidiaries, subject to certain exceptions (the “Guarantors”). Each of the Guarantors is wholly-owned by Ruby Tuesday, Inc. None of the few remaining subsidiaries of Ruby Tuesday, Inc., which were primarily created to hold liquor license assets, guarantee the Senior Notes (the “Non-Guarantors”). Our Non-Guarantor subsidiaries are immaterial and are aggregated within the Parent information disclosed below.
The following condensed consolidating financial information, which has been prepared in accordance with the requirements for presentation of Rule 3-10(f) of Regulation S-X promulgated by the Securities and Exchange Commission, presents the condensed consolidating financial information separately for the Parent, the Guarantors, and elimination entries necessary to consolidate the Parent and Guarantors. Investments in wholly-owned subsidiaries are accounted for using the equity method for purposes of the consolidated presentation. The principal elimination entries eliminate investments in subsidiaries and intercompany balances and transactions.
-82-
Condensed Consolidating Balance Sheet
As of June 2, 2015
(In thousands)
|
Parent
|
Guarantors
|
Eliminations
|
Consolidated
|
|||||||||||||
|
Assets
|
||||||||||||||||
|
Current assets:
|
||||||||||||||||
|
Cash and cash equivalents
|
$ | 75,034 | $ | 297 | $ | – | $ | 75,331 | ||||||||
|
Accounts receivable
|
1,557 | 3,730 | – | 5,287 | ||||||||||||
|
Inventories
|
14,581 | 5,830 | – | 20,411 | ||||||||||||
|
Income tax receivable
|
153,146 | – | (153,146 | ) | – | |||||||||||
|
Other current assets
|
16,169 | 2,465 | – | 18,634 | ||||||||||||
|
Total current assets
|
260,487 | 12,322 | (153,146 | ) | 119,663 | |||||||||||
|
|
||||||||||||||||
|
Property and equipment, net
|
554,089 | 198,085 | – | 752,174 | ||||||||||||
|
Investment in subsidiaries
|
128,824 | – | (128,824 | ) | – | |||||||||||
|
Due from/(to) subsidiaries
|
66,019 | 215,373 | (281,392 | ) | – | |||||||||||
|
Other assets
|
47,148 | 10,406 | – | 57,554 | ||||||||||||
|
Total assets
|
$ | 1,056,567 | $ | 436,186 | $ | (563,362 | ) | $ | 929,391 | |||||||
|
Liabilities & Shareholders’ Equity
|
||||||||||||||||
|
Current liabilities:
|
||||||||||||||||
|
Accounts payable
|
$ | 18,533 | $ | 4,472 | $ | – | $ | 23,005 | ||||||||
|
Accrued and other current liabilities
|
42,458 | 33,764 | – | 76,222 | ||||||||||||
|
Current maturities of long-term debt,
|
||||||||||||||||
|
including capital leases
|
(368 | ) | 11,229 | – | 10,861 | |||||||||||
|
Income tax payable
|
– | 154,215 | (153,146 | ) | 1,069 | |||||||||||
| Deferred income taxes | 2,839 | (2,832 | ) | – | 7 | |||||||||||
|
Total current liabilities
|
63,462 | 200,848 | (153,146 | ) | 111,164 | |||||||||||
|
|
||||||||||||||||
|
Long-term debt and capital leases,
|
||||||||||||||||
|
less current maturities
|
213,412 | 20,761 | – | 234,173 | ||||||||||||
|
Deferred income taxes
|
(3,865 | ) | 5,307 | – | 1,442 | |||||||||||
|
Due to/(from) subsidiaries
|
215,373 | 66,019 | (281,392 | ) | – | |||||||||||
|
Other deferred liabilities
|
102,602 | 14,427 | – | 117,029 | ||||||||||||
|
Total liabilities
|
590,984 | 307,362 | (434,538 | ) | 463,808 | |||||||||||
|
Shareholders’ equity:
|
||||||||||||||||
|
Common stock
|
621 | – | – | 621 | ||||||||||||
|
Capital in excess of par value
|
83,870 | – | – | 83,870 | ||||||||||||
|
Retained earnings
|
392,032 | 128,824 | (128,824 | ) | 392,032 | |||||||||||
|
Accumulated other comprehensive loss
|
(10,940 | ) | – | – | (10,940 | ) | ||||||||||
|
Total shareholders’ equity
|
465,583 | 128,824 | (128,824 | ) | 465,583 | |||||||||||
|
|
||||||||||||||||
|
Total liabilities & shareholders’ equity
|
$ | 1,056,567 | $ | 436,186 | $ | (563,362 | ) | $ | 929,391 | |||||||
-83-
Condensed Consolidating Balance Sheet
As of June 3, 2014
(In thousands)
|
Parent
|
Guarantors
|
Eliminations
|
Consolidated
|
|||||||||||||
|
Assets
|
||||||||||||||||
|
Current assets:
|
||||||||||||||||
|
Cash and cash equivalents
|
$ | 51,012 | $ | 314 | $ | – | $ | 51,326 | ||||||||
|
Accounts receivable
|
1,725 | 3,136 | – | 4,861 | ||||||||||||
|
Inventories
|
15,114 | 6,060 | – | 21,174 | ||||||||||||
|
Income tax receivable
|
138,524 | – | (136,391 | ) | 2,133 | |||||||||||
|
Deferred income taxes
|
(548 | ) | 3,945 | – | 3,397 | |||||||||||
|
Other current assets
|
14,610 | 2,289 | – | 16,899 | ||||||||||||
|
Total current assets
|
220,437 | 15,744 | (136,391 | ) | 99,790 | |||||||||||
|
|
||||||||||||||||
|
Property and equipment, net
|
587,783 | 207,063 | – | 794,846 | ||||||||||||
|
Investment in subsidiaries
|
158,266 | – | (158,266 | ) | – | |||||||||||
|
Due from/(to) subsidiaries
|
78,612 | 243,665 | (322,277 | ) | – | |||||||||||
|
Other assets
|
48,780 | 13,011 | – | 61,791 | ||||||||||||
|
Total assets
|
$ | 1,093,878 | $ | 479,483 | $ | (616,934 | ) | $ | 956,427 | |||||||
|
Liabilities & Shareholders’ Equity
|
||||||||||||||||
|
Current liabilities:
|
||||||||||||||||
|
Accounts payable
|
$ | 20,545 | $ | 5,656 | $ | – | $ | 26,201 | ||||||||
|
Accrued and other current liabilities
|
46,450 | 36,356 | – | 82,806 | ||||||||||||
|
Current maturities of long-term debt,
|
||||||||||||||||
|
including capital leases
|
(341 | ) | 5,157 | 4,816 | ||||||||||||
|
Income tax payable
|
– | 136,391 | (136,391 | ) | – | |||||||||||
|
Total current liabilities
|
66,654 | 183,560 | (136,391 | ) | 113,823 | |||||||||||
|
|
||||||||||||||||
|
Long-term debt and capital leases,
|
||||||||||||||||
|
less current maturities
|
213,039 | 40,836 | – | 253,875 | ||||||||||||
|
Deferred income taxes
|
(445 | ) | 3,945 | – | 3,500 | |||||||||||
|
Due to/(from) subsidiaries
|
243,665 | 78,612 | (322,277 | ) | – | |||||||||||
|
Other deferred liabilities
|
109,756 | 14,264 | – | 124,020 | ||||||||||||
|
Total liabilities
|
632,669 | 321,217 | (458,668 | ) | 495,218 | |||||||||||
|
Shareholders’ equity:
|
||||||||||||||||
|
Common stock
|
614 | – | – | 614 | ||||||||||||
|
Capital in excess of par value
|
76,269 | – | – | 76,269 | ||||||||||||
|
Retained earnings
|
395,226 | 158,266 | (158,266 | ) | 395,226 | |||||||||||
|
Accumulated other comprehensive loss
|
(10,900 | ) | – | – | (10,900 | ) | ||||||||||
|
Total shareholders’ equity
|
461,209 | 158,266 | (158,266 | ) | 461,209 | |||||||||||
|
|
||||||||||||||||
|
Total liabilities & shareholders’ equity
|
$ | 1,093,878 | $ | 479,483 | $ | (616,934 | ) | $ | 956,427 | |||||||
-84-
Condensed Consolidating Statement of Operations and
Comprehensive (Loss)/Income
For the Fiscal Year Ended June 2, 2015
(In thousands)
|
Parent
|
Guarantors |
Eliminations
|
Consolidated | |||||||||||||
|
Revenue:
|
||||||||||||||||
|
Restaurant sales and operating revenue
|
$ | 809,171 | $ | 310,971 | $ | – | $ | 1,120,142 | ||||||||
|
Franchise revenue
|
238 | 6,186 | – | 6,424 | ||||||||||||
|
|
809,409 | 317,157 | – | 1,126,566 | ||||||||||||
|
|
||||||||||||||||
|
Operating costs and expenses:
|
||||||||||||||||
|
Cost of goods sold
|
220,537 | 84,769 | – | 305,306 | ||||||||||||
|
Payroll and related costs
|
270,535 | 112,726 | – | 383,261 | ||||||||||||
|
Other restaurant operating costs
|
176,130 | 68,222 | – | 244,352 | ||||||||||||
|
Depreciation
|
37,155 | 12,993 | – | 50,148 | ||||||||||||
|
Selling, general, and administrative
|
75,418 | 39,909 | – | 115,327 | ||||||||||||
|
Intercompany selling, general, and
|
||||||||||||||||
|
administrative allocations
|
44,768 | (44,768 | ) | – | – | |||||||||||
|
Closures and impairments, net
|
7,914 | 2,628 | – | 10,542 | ||||||||||||
|
Equity in earnings of subsidiaries
|
(28,148 | ) | – | 28,148 | – | |||||||||||
|
Interest expense, net
|
18,489 | 4,246 | – | 22,735 | ||||||||||||
|
Intercompany interest expense/(income)
|
12,009 | (12,009 | ) | – | – | |||||||||||
|
|
834,807 | 268,716 | 28,148 | 1,131,671 | ||||||||||||
|
(Loss)/income before income taxes
|
(25,398 | ) | 48,441 | (28,148 | ) | (5,105 | ) | |||||||||
|
(Benefit)/provision for income taxes
|
(22,204 | ) | 20,293 | – | (1,911 | ) | ||||||||||
|
Net (loss)/income
|
$ | (3,194 | ) | $ | 28,148 | (28,148 | ) | $ | (3,194 | ) | ||||||
|
Other comprehensive loss:
|
||||||||||||||||
|
Pension liability reclassification, net of tax
|
(40 | ) | – | – | $ | (40 | ) | |||||||||
|
Total comprehensive (loss)/income
|
$ | (3,234 | ) | $ | 28,148 | $ | (28,148 | ) | $ | (3,234 | ) | |||||
-85-
Condensed Consolidating Statement of Operations and
Comprehensive (Loss)/Income
For the Fiscal Year Ended June 3, 2014
(In thousands)
|
Parent
|
Guarantors
|
Eliminations
|
Consolidated
|
|||||||||||||
|
Revenue:
|
||||||||||||||||
|
Restaurant sales and operating revenue
|
$ | 842,842 | $ | 319,581 | $ | – | $ | 1,162,423 | ||||||||
|
Franchise revenue
|
223 | 6,100 | – | 6,323 | ||||||||||||
|
|
843,065 | 325,681 | – | 1,168,746 | ||||||||||||
|
|
||||||||||||||||
|
Operating costs and expenses:
|
||||||||||||||||
|
Cost of merchandise
|
233,562 | 87,959 | – | 321,521 | ||||||||||||
|
Payroll and related costs
|
287,358 | 117,021 | – | 404,379 | ||||||||||||
|
Other restaurant operating costs
|
187,055 | 73,392 | – | 260,447 | ||||||||||||
|
Depreciation
|
40,188 | 14,640 | – | 54,828 | ||||||||||||
|
Selling, general, and administrative
|
87,248 | 49,903 | – | 137,151 | ||||||||||||
|
Intercompany selling, general, and
|
||||||||||||||||
|
administrative allocations
|
59,257 | (59,257 | ) | – | – | |||||||||||
|
Closures and impairments
|
18,904 | 13,927 | – | 32,831 | ||||||||||||
|
Trademark impairment
|
– | 855 | – | 855 | ||||||||||||
|
Equity in earnings of subsidiaries
|
(21,005 | ) | – | 21,005 | – | |||||||||||
|
Interest expense, net
|
19,978 | 4,967 | – | 24,945 | ||||||||||||
|
Intercompany interest expense/(income)
|
13,081 | (13,081 | ) | – | – | |||||||||||
|
Loss on extinguishment of debt
|
1,364 | – | – | 1,364 | ||||||||||||
|
|
926,990 | 290,326 | 21,005 | 1,238,321 | ||||||||||||
|
(Loss)/income from continuing operations
|
||||||||||||||||
|
before income taxes
|
(83,925 | ) | 35,355 | (21,005 | ) | (69,575 | ) | |||||||||
|
(Benefit)/provision for income taxes from
|
||||||||||||||||
|
continuing operations
|
(19,015 | ) | 14,350 | – | (4,665 | ) | ||||||||||
|
(Loss)/income from continuing operations
|
(64,910 | ) | 21,005 | (21,005 | ) | (64,910 | ) | |||||||||
|
|
||||||||||||||||
|
Income from discontinued operations, net of tax
|
564 | – | – | 564 | ||||||||||||
|
Net (loss)/income
|
$ | (64,346 | ) | $ | 21,005 | $ | (21,005 | ) | $ | (64,346 | ) | |||||
|
Other comprehensive income:
|
||||||||||||||||
|
Pension liability reclassification, net of tax
|
45 | – | – | 45 | ||||||||||||
|
Total comprehensive (loss)/income
|
$ | (64,301 | ) | $ | 21,005 | $ | (21,005 | ) | $ | (64,301 | ) | |||||
-86-
Condensed Consolidating Statement of Operations and
Comprehensive (Loss)/Income
For the Fiscal Year Ended June 4, 2013
(In thousands)
|
Parent
|
Guarantors
|
Eliminations
|
Consolidated
|
|||||||||||||
|
Revenue:
|
||||||||||||||||
|
Restaurant sales and operating revenue
|
$ | 904,761 | $ | 340,465 | $ | – | $ | 1,245,226 | ||||||||
|
Franchise revenue
|
188 | 6,073 | – | 6,261 | ||||||||||||
|
|
904,949 | 346,538 | – | 1,251,487 | ||||||||||||
|
|
||||||||||||||||
|
Operating costs and expenses:
|
||||||||||||||||
|
Cost of merchandise
|
248,378 | 93,134 | – | 341,512 | ||||||||||||
|
Payroll and related costs
|
298,194 | 121,485 | – | 419,679 | ||||||||||||
|
Other restaurant operating costs
|
185,224 | 73,790 | – | 259,014 | ||||||||||||
|
Depreciation
|
43,541 | 15,581 | – | 59,122 | ||||||||||||
|
Selling, general, and administrative
|
91,587 | 47,195 | – | 138,782 | ||||||||||||
|
Intercompany selling, general, and
|
||||||||||||||||
|
administrative allocations
|
68,466 | (68,466 | ) | – | – | |||||||||||
|
Closures and impairments
|
13,181 | 1,475 | – | 14,656 | ||||||||||||
|
Goodwill and trademark impairments
|
9,023 | 5,035 | – | 14,058 | ||||||||||||
|
Equity in earnings of subsidiaries
|
(38,485 | ) | – | 38,485 | – | |||||||||||
|
Interest expense, net
|
20,920 | 5,656 | – | 26,576 | ||||||||||||
|
Intercompany interest expense/(income)
|
13,826 | (13,826 | ) | – | – | |||||||||||
|
Loss on extinguishment of debt
|
22 | – | – | 22 | ||||||||||||
|
|
953,877 | 281,059 | 38,485 | 1,273,421 | ||||||||||||
|
(Loss)/income from continuing operations
|
||||||||||||||||
|
before income taxes
|
(48,928 | ) | 65,479 | (38,485 | ) | (21,934 | ) | |||||||||
|
Provision/(benefit) for income taxes from
|
||||||||||||||||
|
continuing operations
|
(25,494 | ) | 26,994 | – | 1,500 | |||||||||||
|
(Loss)/income from continuing operations
|
(23,434 | ) | 38,485 | (38,485 | ) | (23,434 | ) | |||||||||
|
|
||||||||||||||||
|
Loss from discontinued operations, net of tax
|
(15,979 | ) | (810 | ) | 810 | (15,979 | ) | |||||||||
|
Net (loss)/income
|
$ | (39,413 | ) | $ | 37,675 | $ | (37,675 | ) | $ | (39,413 | ) | |||||
|
Other comprehensive income:
|
||||||||||||||||
|
Pension liability reclassification, net of tax
|
3,312 | – | – | 3,312 | ||||||||||||
|
Total comprehensive (loss)/income
|
$ | (36,101 | ) | $ | 37,675 | $ | (37,675 | ) | $ | (36,101 | ) | |||||
-87-
Condensed Consolidating Statement of Cash Flows
For the Fiscal Year Ended June 2, 2015
(In thousands)
| Parent |
Guarantors
|
Eliminations
|
Consolidated
|
|||||||||||||
|
Net cash provided by operating activities
|
$ | 63,076 | $ | 77,717 | $ | (85,882 | ) | $ | 54,911 | |||||||
|
|
||||||||||||||||
|
Investing activities:
|
||||||||||||||||
|
Purchases of property and equipment
|
(23,326 | ) | (7,684 | ) | – | (31,010 | ) | |||||||||
|
Proceeds from disposal of assets
|
10,213 | 1,047 | – | 11,260 | ||||||||||||
|
Other, net
|
2,118 | 135 | – | 2,253 | ||||||||||||
|
Net cash used by investing activities
|
(10,995 | ) | (6,502 | ) | – | (17,497 | ) | |||||||||
|
Financing activities:
|
||||||||||||||||
|
Principal payments on long-term debt
|
4 | (13,642 | ) | – | (13,638 | ) | ||||||||||
|
Stock repurchases
|
(73 | ) | – | – | (73 | ) | ||||||||||
|
Payments for debt issuance costs
|
(293 | ) | – | – | (293 | ) | ||||||||||
|
Proceeds from exercise of stock options
|
556 | – | – | 556 | ||||||||||||
|
Excess tax benefits from share-based
|
||||||||||||||||
|
compensation
|
39 | – | – | 39 | ||||||||||||
|
Intercompany transactions
|
(28,292 | ) | (57,590 | ) | 85,882 | – | ||||||||||
|
Net cash used by financing activities
|
(28,059 | ) | (71,232 | ) | 85,882 | (13,409 | ) | |||||||||
|
Increase/(decrease) in cash and cash equivalents
|
24,022 | (17 | ) | – | 24,005 | |||||||||||
|
Cash and cash equivalents:
|
||||||||||||||||
|
Beginning of year
|
51,012 | 314 | – | 51,326 | ||||||||||||
|
End of year
|
$ | 75,034 | $ | 297 | $ | – | $ | 75,331 |
-88-
Condensed Consolidating Statement of Cash Flows
For the Fiscal Year Ended June 3, 2014
(In thousands)
| Parent |
Guarantors
|
Eliminations
|
Consolidated
|
|||||||||||||
|
Net cash provided by operating activities
|
$ | 5,854 | $ | 57,064 | $ | (17,543 | ) | $ | 45,375 | |||||||
|
|
||||||||||||||||
|
Investing activities:
|
||||||||||||||||
|
Purchases of property and equipment
|
(21,132 | ) | (7,207 | ) | – | (28,339 | ) | |||||||||
|
Proceeds from sale-leaseback transactions, net
|
5,637 | – | – | 5,637 | ||||||||||||
|
Proceeds from disposal of assets
|
14,503 | 1,023 | – | 15,526 | ||||||||||||
|
Other, net
|
973 | – | – | 973 | ||||||||||||
|
Net cash used by investing activities
|
(19 | ) | (6,184 | ) | – | (6,203 | ) | |||||||||
|
Financing activities:
|
||||||||||||||||
|
Principal payments on long-term debt
|
(20,019 | ) | (20,213 | ) | – | (40,232 | ) | |||||||||
|
Stock repurchases
|
(579 | ) | – | – | (579 | ) | ||||||||||
|
Payments for debt issuance costs
|
(1,802 | ) | – | – | (1,802 | ) | ||||||||||
|
Proceeds from exercise of stock options
|
1,576 | – | – | 1,576 | ||||||||||||
|
Excess tax benefits from share-based
|
||||||||||||||||
|
compensation
|
284 | – | – | 284 | ||||||||||||
|
Intercompany transactions
|
13,082 | (30,625 | ) | 17,543 | – | |||||||||||
|
Net cash used by financing activities
|
(7,458 | ) | (50,838 | ) | 17,543 | (40,753 | ) | |||||||||
|
(Decrease)/increase in cash and cash equivalents
|
(1,623 | ) | 42 | – | (1,581 | ) | ||||||||||
|
Cash and cash equivalents:
|
||||||||||||||||
|
Beginning of year
|
52,635 | 272 | – | 52,907 | ||||||||||||
|
End of year
|
$ | 51,012 | $ | 314 | $ | – | $ | 51,326 |
-89-
Condensed Consolidating Statement of Cash Flows
For the Fiscal Year Ended June 4, 2013
(In thousands)
|
Parent
|
Guarantors
|
Eliminations
|
Consolidated
|
|||||||||||||
|
Net cash provided by operating activities
|
$ | 34,877 | $ | 89,925 | $ | (88,848 | ) | $ | 35,954 | |||||||
|
|
||||||||||||||||
|
Investing activities:
|
||||||||||||||||
|
Purchases of property and equipment
|
(31,531 | ) | (5,586 | ) | – | (37,117 | ) | |||||||||
|
Proceeds from sale-leaseback transactions, net
|
51,765 | – | – | 51,765 | ||||||||||||
|
Proceeds from disposal of assets
|
4,421 | 2,576 | – | 6,997 | ||||||||||||
|
Other, net
|
468 | – | – | 468 | ||||||||||||
|
Net cash used by investing activities
|
25,123 | (3,010 | ) | – | 22,113 | |||||||||||
|
Financing activities:
|
||||||||||||||||
|
Principal payments on long-term debt
|
(14,514 | ) | (12,666 | ) | – | (27,180 | ) | |||||||||
|
Stock repurchases
|
(30,278 | ) | – | – | (30,278 | ) | ||||||||||
|
Payments for debt issuance costs
|
(358 | ) | – | – | (358 | ) | ||||||||||
|
Proceeds from exercise of stock options
|
4,090 | – | – | 4,090 | ||||||||||||
|
Excess tax benefits from share-based
|
||||||||||||||||
|
compensation
|
382 | – | – | 382 | ||||||||||||
|
Intercompany transactions
|
(14,673 | ) | (74,175 | ) | 88,848 | – | ||||||||||
|
Net cash used by financing activities
|
(55,351 | ) | (86,841 | ) | 88,848 | (53,344 | ) | |||||||||
|
Increase in cash and cash equivalents
|
4,649 | 74 | – | 4,723 | ||||||||||||
|
Cash and cash equivalents:
|
||||||||||||||||
|
Beginning of year
|
47,986 | 198 | – | 48,184 | ||||||||||||
|
End of year
|
$ | 52,635 | $ | 272 | $ | – | $ | 52,907 |
-90-
15. Supplemental Quarterly Financial Data (Unaudited)
Quarterly financial results for the years ended June 2, 2015 and June 3, 2014, are summarized below.
(In thousands, except per-share data)
|
For the Year Ended June 2, 2015
|
||||||||||||||||||||
|
First
Quarter
|
Second
Quarter
|
Third
Quarter
|
Fourth
Quarter
|
Total
|
||||||||||||||||
|
Revenues
|
$ | 281,182 | $ | 262,659 | $ | 285,913 | $ | 296,812 | $ | 1,126,566 | ||||||||||
|
Gross profit*
|
$ | 50,394 | $ | 36,952 | $ | 49,909 | $ | 56,392 | $ | 193,647 | ||||||||||
|
(Loss)/income from continuing
|
||||||||||||||||||||
|
operations before income taxes
|
$ | (69 | ) | $ | (9,868 | ) | $ | (881 | ) | $ | 5,713 | $ | (5,105 | ) | ||||||
|
(Benefit)/provision for income taxes from
|
||||||||||||||||||||
|
continuing operations
|
(2,634 | ) | (595 | ) | (112 | ) | 1,430 | (1,911 | ) | |||||||||||
|
Net income/(loss)
|
$ | 2,565 | $ | (9,273 | ) | $ | (769 | ) | $ | 4,283 | $ | (3,194 | ) | |||||||
|
Basic loss per share:
|
||||||||||||||||||||
|
Net income/(loss) per share
|
$ | 0.04 | $ | (0.15 | ) | $ | (0.01 | ) | $ | 0.07 | $ | (0.05 | ) | |||||||
|
Diluted loss per share:
|
||||||||||||||||||||
|
Net income/(loss) per share
|
$ | 0.04 | $ | (0.15 | ) | $ | (0.01 | ) | $ | 0.07 | $ | (0.05 | ) | |||||||
-91-
|
For the Year Ended June 3, 2014
|
||||||||||||||||||||
|
First
Quarter
|
Second
Quarter
|
Third
Quarter
|
Fourth
Quarter
|
Total
|
||||||||||||||||
|
Revenues
|
$ | 289,674 | $ | 276,209 | $ | 295,552 | $ | 307,311 | $ | 1,168,746 | ||||||||||
|
Gross profit*
|
$ | 39,469 | $ | 35,734 | $ | 49,060 | $ | 58,136 | $ | 182,399 | ||||||||||
|
(Loss)/income from continuing
|
||||||||||||||||||||
|
operations before income taxes
|
$ | (27,052 | ) | $ | (36,647 | ) | $ | (8,200 | ) | $ | 2,324 | $ | (69,575 | ) | ||||||
|
(Benefit)/provision for income taxes
|
||||||||||||||||||||
|
from continuing operations
|
(5,153 | ) | (1,910 | ) | (807 | ) | 3,205 | (4,665 | ) | |||||||||||
|
Loss from continuing operations
|
$ | (21,899 | ) | $ | (34,737 | ) | $ | (7,393 | ) | $ | (881 | ) | $ | (64,910 | ) | |||||
|
(Loss)/income from discontinued
|
||||||||||||||||||||
|
operations, net of tax
|
(343 | ) | 354 | 86 | 467 | 564 | ||||||||||||||
|
Net loss
|
$ | (22,242 | ) | $ | (34,383 | ) | $ | (7,307 | ) | $ | (414 | ) | $ | (64,346 | ) | |||||
|
Basic loss per share:
|
||||||||||||||||||||
|
Loss from continuing operations **
|
$ | (0.36 | ) | $ | (0.58 | ) | $ | (0.12 | ) | $ | (0.01 | ) | $ | (1.08 | ) | |||||
|
(Loss)/income from discontinued
|
||||||||||||||||||||
|
operations **
|
(0.01 | ) | 0.01 | 0.00 | 0.00 | 0.01 | ||||||||||||||
|
Net loss per share
|
$ | (0.37 | ) | $ | (0.57 | ) | $ | (0.12 | ) | $ | (0.01 | ) | $ | (1.07 | ) | |||||
|
Diluted loss per share:
|
||||||||||||||||||||
|
Loss from continuing operations **
|
$ | (0.36 | ) | $ | (0.58 | ) | $ | (0.12 | ) | $ | (0.01 | ) | $ | (1.08 | ) | |||||
|
(Loss)/income from discontinued
|
||||||||||||||||||||
|
operations **
|
(0.01 | ) | 0.01 | 0.00 | 0.00 | 0.01 | ||||||||||||||
|
Net loss per share
|
$ | (0.37 | ) | $ | (0.57 | ) | $ | (0.12 | ) | $ | (0.01 | ) | $ | (1.07 | ) | |||||
* We define gross profit as revenue less cost of goods sold, payroll and related costs, and other restaurant operating costs.
** The sum of the quarterly income/(loss) per share does not equal the reported annual amount as each is computed independently based upon the weighted average number of shares outstanding for the period.
16. Subsequent Events
Prepayment of mortgage loan obligations
On July 9, 2015, we prepaid and retired ten mortgage loan obligations with an aggregate June 2, 2015 balance of $8.3 million using cash on hand. Additionally, we paid $0.9 million in prepayment premiums and an insignificant amount of accrued interest in connection with the retirement of these obligations. The prepayment of this debt eliminated one mortgage lender and allowed for the release of 26 properties which had served as collateral.
-92-
Report of Independent Registered Public Accounting Firm
The Board of Directors and Stockholders
Ruby Tuesday, Inc.:
We have audited the accompanying consolidated balance sheets of Ruby Tuesday, Inc. and subsidiaries (the Company) as of June 2, 2015 and June 3, 2014, and the related consolidated statements of operations and comprehensive loss, shareholders’ equity, and cash flows for each of the years in the three-year period ended June 2, 2015. In connection with our audits of the consolidated financial statements, we also have audited the accompanying financial statement schedule. These consolidated financial statements and financial statement schedule are the responsibility of the Company’s management. Our responsibility is to express an opinion on these consolidated financial statements and financial statement schedule based on our audits.
We conducted our audits in accordance with the standards of the Public Company Accounting Oversight Board (United States). Those standards require that we plan and perform the audit to obtain reasonable assurance about whether the financial statements are free of material misstatement. An audit includes examining, on a test basis, evidence supporting the amounts and disclosures in the financial statements. An audit also includes assessing the accounting principles used and significant estimates made by management, as well as evaluating the overall financial statement presentation. We believe that our audits provide a reasonable basis for our opinion.
In our opinion, the consolidated financial statements referred to above present fairly, in all material respects, the financial position of Ruby Tuesday, Inc. and subsidiaries as of June 2, 2015 and June 3, 2014, and the results of their operations and their cash flows for each of the years in the three-year period ended June 2, 2015, in conformity with U.S. generally accepted accounting principles. Also in our opinion, the related financial statement schedule, when considered in relation to the basic consolidated financial statements taken as a whole, presents fairly, in all material respects, the information set forth therein.
We also have audited, in accordance with the standards of the Public Company Accounting Oversight Board (United States), Ruby Tuesday, Inc.’s internal control over financial reporting as of June 2, 2015, based on criteria established in Internal Control – Integrated Framework (2013) issued by the Committee of Sponsoring Organizations of the Treadway Commission (COSO), and our report dated August 17, 2015 expressed an unqualified opinion on the effectiveness of Ruby Tuesday Inc.’s internal control over financial reporting.
/s/ KPMG LLP
Knoxville, Tennessee
August 17, 2015
-93-
Report of Independent Registered Public Accounting Firm
The Board of Directors and Stockholders
Ruby Tuesday, Inc.:
We have audited Ruby Tuesday, Inc.’s (the Company) internal control over financial reporting as of June 2, 2015, based on criteria established in Internal Control – Integrated Framework (2013) issued by the Committee of Sponsoring Organizations of the Treadway Commission (COSO). The Company’s management is responsible for maintaining effective internal control over financial reporting and for its assessment of the effectiveness of internal control over financial reporting, included in the accompanying Item 9A, “Management’s Report on Internal Control over Financial Reporting.” Our responsibility is to express an opinion on the Company’s internal control over financial reporting based on our audit.
We conducted our audit in accordance with the standards of the Public Company Accounting Oversight Board (United States). Those standards require that we plan and perform the audit to obtain reasonable assurance about whether effective internal control over financial reporting was maintained in all material respects. Our audit included obtaining an understanding of internal control over financial reporting, assessing the risk that a material weakness exists, and testing and evaluating the design and operating effectiveness of internal control based on the assessed risk. Our audit also included performing such other procedures as we considered necessary in the circumstances. We believe that our audit provides a reasonable basis for our opinion.
A company’s internal control over financial reporting is a process designed to provide reasonable assurance regarding the reliability of financial reporting and the preparation of financial statements for external purposes in accordance with generally accepted accounting principles. A company’s internal control over financial reporting includes those policies and procedures that (1) pertain to the maintenance of records that, in reasonable detail, accurately and fairly reflect the transactions and dispositions of the assets of the company; (2) provide reasonable assurance that transactions are recorded as necessary to permit preparation of financial statements in accordance with generally accepted accounting principles, and that receipts and expenditures of the company are being made only in accordance with authorizations of management and directors of the company; and (3) provide reasonable assurance regarding prevention or timely detection of unauthorized acquisition, use, or disposition of the company’s assets that could have a material effect on the financial statements.
Because of its inherent limitations, internal control over financial reporting may not prevent or detect misstatements. Also, projections of any evaluation of effectiveness to future periods are subject to the risk that controls may become inadequate because of changes in conditions, or that the degree of compliance with the policies or procedures may deteriorate.
In our opinion, the Company maintained, in all material respects, effective internal control over financial reporting as of June 2, 2015, based on criteria established in Internal Control – Integrated Framework (2013) issued by COSO.
We also have audited, in accordance with the standards of the Public Company Accounting Oversight Board (United States), the consolidated balance sheets of Ruby Tuesday, Inc. and subsidiaries as of June 2, 2015 and June 3, 2014, and the related consolidated statements of operations and comprehensive loss, shareholders’ equity, and cash flows for each of the years in the three-year period ended June 2, 2015, and our report dated August 17, 2015 expressed an unqualified opinion on those consolidated financial statements.
/s/ KPMG LLP
Knoxville, Tennessee
August 17, 2015
-94-
Accounting and Financial Disclosure
None.
Item 9A. Controls and Procedures
Evaluation of Disclosure Controls and Procedures
The Company’s management, with the participation of the Chief Executive Officer and Chief Financial Officer, evaluated the effectiveness of the design and operation of the Company’s disclosure controls and procedures as of the end of the period covered by this report. Based on that evaluation, the Chief Executive Officer and the Chief Financial Officer have concluded that the Company’s disclosure controls and procedures are operating effectively and are properly designed to ensure that information required to be disclosed is accumulated and communicated to the Company’s management to allow timely decisions regarding required disclosure in the reports filed or submitted under the Securities Exchange Act of 1934, as amended.
Management’s Report on Internal Control over Financial Reporting
Under Section 404 of The Sarbanes-Oxley Act of 2002, our management is required to assess the effectiveness of the Company's internal control over financial reporting as of the end of each fiscal year and report, based on that assessment, whether the Company's internal control over financial reporting is effective.
Management of the Company is responsible for establishing and maintaining adequate internal control over financial reporting. As defined in Rule 13a-15(f) of the Securities Exchange Act of 1934, internal control over financial reporting is a process designed by, or under the supervision of, our principal executive and principal financial officers and effected by our board of directors, management and other personnel, to provide reasonable assurance regarding the reliability of financial reporting and the preparation of financial statements for external purposes in accordance with generally accepted accounting principles. Internal control over financial reporting, no matter how well designed, has inherent limitations. Therefore, internal control over financial reporting determined to be effective can provide only reasonable assurance with respect to financial statement preparation and may not prevent or detect all misstatements.
Under the supervision and with the participation of our management, including our Chief Executive Officer and Chief Financial Officer, we assessed the effectiveness of the Company’s internal control over financial reporting as of June 2, 2015 using the criteria based on the “Internal Control - Integrated Framework (2013)” issued by the Committee of Sponsoring Organizations of the Treadway Commission. Based upon our assessment, management concluded that our internal control over financial reporting was effective as of June 2, 2015.
KPMG LLP, the independent registered public accounting firm that audited our consolidated financial statements included in this Annual Report on Form 10-K, has also audited the effectiveness of our internal control over financial reporting as of June 2, 2015 as stated in their report filed within Item 8 – Financial Statements and Supplementary Data.
Changes in Internal Controls
During the fiscal quarter ended June 2, 2015, there was no change in our internal control over financial reporting that has materially affected, or is reasonably likely to materially affect, our internal control over financial reporting.
None.
-95-
PART III
We expect to file a definitive proxy statement (the “2015 Proxy Statement”) relating to our 2015 Annual Meeting of shareholders (the “Annual Meeting”) with the Securities and Exchange Commission, pursuant to Regulation 14A, not later than 120 days after the end of our most recent fiscal year. Accordingly, certain information required by Part III has been omitted under General Instruction G(3) to Form 10-K. Only those sections of the 2015 Proxy Statement that specifically address disclosure requirements of Items 10-14 below are incorporated by reference.
The information required by this Item 10 regarding the directors of the Company is incorporated herein by reference to the information set forth in the table entitled “Director and Director Nominee Information” in the 2015 Proxy Statement.
Information regarding executive officers of the Company has been included in Part I of this Annual Report on Form 10-K under the caption “Executive Officers.”
Information regarding corporate governance of the Company and other information required by this item is incorporated herein by reference to the information set forth under the captions, “Corporate Governance,” “Section 16(a) Beneficial Ownership Reporting Compliance,” and “Committees of the Board of Directors” in the 2015 Proxy Statement.
The information required by this Item 11 is incorporated herein by reference to the information set forth under the captions “Compensation Discussion and Analysis,” “Compensation Committee Report,” “2015 Summary Compensation Table,” “Grants of Plan-Based Awards in Fiscal Year 2015,” “Outstanding Equity Awards at Fiscal Year-End for 2015,” “Option Exercises and Stock Vested in Fiscal Year 2015,” “2015 Nonqualified Deferred Compensation,” “Pension Benefits for Fiscal Year 2015,” “Potential Payments Upon Termination or Change in Control,” “Directors’ Fees and Attendance,” “2015 Director Compensation,” and “Committees of the Board of Directors” in the 2015 Proxy Statement relating to the Annual Meeting.
Item 12. Security Ownership of Certain Beneficial Owners
and Management and Related Stockholder Matters
The information required by this Item 12 is incorporated herein by reference to the information set forth in the tables captioned “Beneficial Ownership of Common Stock” and “Securities Authorized for Issuance Under Equity Compensation Plans” in the 2015 Proxy Statement relating to the Annual Meeting.
The information required by this Item 13 is incorporated herein by reference to the information set forth under the captions “Related Person Transactions” and “Directors’ Independence” in the 2015 Proxy Statement relating to the Annual Meeting.
The information required by this Item 14 is incorporated herein by reference to the information set forth under the caption “Accountants’ Fees and Expenses” in the 2015 Proxy Statement relating to the Annual Meeting.
-96-
PART IV
(a) The following documents are filed as part of this report:
1. Financial Statements:
The financial statements of the Company and its subsidiaries are listed in the accompanying “Index to
Consolidated Financial Statements” on page 47.
2. Financial Statement Schedule:
Schedule II – Valuation and Qualifying Accounts for the Years Ended June 2, 2015, June 3, 2014, and June 4, 2013 (in thousands):
|
Charged/
|
Charged/
|
|||||||||
|
Balance at
|
(Credited)
|
(Credited)
|
||||||||
|
Beginning
|
to Costs
|
to other
|
Balance at
|
|||||||
|
Description
|
of Period
|
and Expenses
|
Accounts
|
Write-offs
|
End of Period
|
|||||
|
Allowance for Doubtful Notes
|
||||||||||
|
Fiscal Year Ended June 2, 2015
|
$ – | $ (2) | $ – | $ 2 | $ – | |||||
|
Fiscal Year Ended June 3, 2014
|
259 | 307 | – | (566) | – | |||||
|
Fiscal Year Ended June 4, 2013
|
41 | 259 | (20) | (21) | 259 |
All other financial statement schedules have been omitted, as the required information is inapplicable or the information is presented in the financial statements or related notes.
3. Exhibits:
|
|
|
The exhibits filed with or incorporated by reference in this report are listed on the Exhibit Index beginning on page 99.
-97-
Pursuant to the requirements of Section 13 or 15(d) of the Securities Exchange Act of 1934, the registrant has duly caused this report to be signed on its behalf by the undersigned, thereunto duly authorized.
RUBY TUESDAY, INC.
Date: August 17, 2015 By: /s/ James J. Buettgen
James J. Buettgen
Chairman of the Board, President, and
Chief Executive Officer
Pursuant to the requirements of the Securities Exchange Act of 1934, this report has been signed below by the following persons on behalf of the registrant and in the capacities and on the dates indicated:
|
Name
|
Position
|
Date
|
|
/s/ James J. Buettgen
James J. Buettgen
|
Chairman of the Board, President,
and Chief Executive Officer
(Principal Executive Officer)
|
Date: August 17, 2015
|
|
/s/ Jill M. Golder
Jill M. Golder
|
Executive Vice President,
Chief Financial Officer
(Principal Financial Officer)
|
Date: August 17, 2015
|
|
/s/ Franklin E. Southall, Jr.
Franklin E. Southall, Jr.
|
Vice President,
Corporate Controller
(Principal Accounting Officer)
|
Date: August 17, 2015
|
|
/s/ Mark W. Addicks
Mark W. Addicks
|
Director
|
Date: August 17, 2015
|
|
/s/ F. Lane Cardwell, Jr.
F. Lane Cardwell, Jr.
|
Director
|
Date: August 17, 2015
|
|
/s/ Kevin T. Clayton
Kevin T. Clayton
|
Director
|
Date: August 17, 2015
|
|
/s/ Donald E. Hess
Donald E. Hess
|
Director
|
Date: August 17, 2015
|
|
/s/ Bernard Lanigan Jr.
Bernard Lanigan Jr.
|
Director
|
Date: August 17, 2015
|
|
/s/ Jeffrey J. O’Neill
Jeffrey J. O’Neill
|
Director
|
Date: August 17, 2015
|
|
/s/ Stephen I. Sadove
Stephen I. Sadove
|
Director
|
Date: August 17, 2015
|
-98-
RUBY TUESDAY, INC. AND SUBSIDIARIES
EXHIBIT INDEX
|
Exhibit
Number
|
|
Description of Exhibit
|
|
*
|
Management contract or compensatory plan or arrangement.
|
|
|
+
|
Filed herewith.
|
|
|
3.1
|
Articles of Incorporation, as amended, of Ruby Tuesday, Inc. (incorporated by reference from Exhibit 3.1 to Form 8-B filed on March 15, 1996 (File No. 1-12454)).
|
|
|
3.2
|
Bylaws, as amended and restated, of Ruby Tuesday, Inc. (incorporated by reference from Exhibit 3.1 to Form 8-K filed on October 8, 2009 (File No. 1-12454)).
|
|
|
4.1
|
Specimen Common Stock Certificate. (incorporated by reference from Exhibit 4.1 to Form 8-B filed on March 15, 1996 (File No. 1-12454)).
|
|
|
10.1
|
Ruby Tuesday, Inc. Executive Supplemental Pension Plan, amended and restated as of January 1, 2007. (incorporated by reference from Exhibit 10.1 to the Ruby Tuesday, Inc. Annual Report on Form 10-K for the fiscal year ended June 5, 2007 (File No. 1-12454)).*
|
|
|
10.2
|
First Amendment, dated as of April 2, 2008, to the Ruby Tuesday, Inc. Executive Supplemental Pension Plan (Amended and Restated as of January 1, 2007) (incorporated by reference from Exhibit 10.6 to the Ruby Tuesday, Inc. Quarterly Report on Form 10-Q for the quarter ended March 4, 2008 (File No. 1-12454)).*
|
|
|
10.3
|
Second Amendment, dated as of December 31, 2008, to the Ruby Tuesday, Inc. Executive Supplemental Pension Plan (Amended and Restated as of January 1, 2007) (incorporated by reference from Exhibit 10.1 to the Ruby Tuesday, Inc. Quarterly Report on Form 10-Q for the quarter ended December 2, 2008 (File No. 1-12454)).*
|
|
|
10.4
|
Third Amendment, dated as of January 6, 2010, to the Ruby Tuesday, Inc. Executive Supplemental Pension Plan (Amended and Restated as of January 1, 2007) (incorporated by reference from Exhibit 10.3 to the Ruby Tuesday, Inc. Quarterly Report on Form 10-Q for the quarter ended December 1, 2009 (File No. 1-12454)).*
|
|
|
10.5
|
Fourth Amendment, dated as of November 30, 2012, to the Ruby Tuesday, Inc. Executive Supplemental Pension Plan (Amended and Restated as of January 1, 2007) (incorporated by reference from Exhibit 10.4 to the Ruby Tuesday, Inc. Quarterly Report on Form 10-Q for the quarter ended December 4, 2012 (File No. 1-12454)).*
|
|
|
10.6
|
Ruby Tuesday, Inc. Deferred Compensation Plan for Directors (Amended and Restated as of April 9, 2014) (incorporated by reference from Exhibit 10.3 to the Ruby Tuesday, Inc. Quarterly Report on Form 10-Q for the quarter ended March 4, 2014 (File No. 1-12454)).*
|
|
|
10.7
|
Ruby Tuesday, Inc. Stock Incentive Plan (Amended and Restated April 8, 2015) (incorporated by reference from Exhibit 10.1 to the Ruby Tuesday, Inc. Quarterly Report on Form 10-Q for the quarter ended March 3, 2015 (File No. 1-12454)).*
|
|
|
10.8
|
Ruby Tuesday, Inc. Stock Incentive Plan (Amended and Restated October 9, 2013) (incorporated by reference from Exhibit 10.1 to Form 8-K filed on October 10, 2013 (File No. 1-12454)).*
|
|
|
10.9
|
First Amendment to the Ruby Tuesday, Inc. Stock Incentive Plan (incorporated by reference from Exhibit 10.2 to the Ruby Tuesday, Inc. Quarterly Report on Form 10-Q for the quarter ended March 4,
|
-99-
| 2014 (File No. 1-12454)).* | ||
|
10.10
|
Form of Service-Based Restricted Stock Award (incorporated by reference from Exhibit 10.1 to the Ruby Tuesday, Inc. Quarterly Report on Form 10-Q for the quarter ended September 4, 2012 (File No. 1-12454)).*
|
|
|
10.11
|
Form of Restricted Stock Award for Directors (incorporated by reference from Exhibit 10.4 to the Ruby Tuesday, Inc. Quarterly Report on Form 10-Q for the quarter ended September 4, 2012 (File No. 1-12454)).*
|
|
|
10.12
|
Form of Service-Based Restricted Stock Award (incorporated by reference from Exhibit 10.1 to Form 8-K filed on June 25, 2013 (File No. 1-12454)).*
|
|
|
10.13
|
Form of Non-Qualified Stock Option Award (incorporated by reference from Exhibit 10.1 to Form 8-K filed on August 28, 2013 (File No. 1-12454)).*
|
|
|
10.14
|
Form of High-Performance Non-Qualified Stock Option Award (incorporated by reference from Exhibit 10.2 to Form 8-K filed on August 28, 2013 (File No. 1-12454)).*
|
|
|
10.15
|
Form of Performance-Based Cash Incentive Award (incorporated by reference from Exhibit 10.3 to Form 8-K filed on August 28, 2013 (File No. 1-12454)).*
|
|
|
10.16
|
Form of Service-Based Restricted Stock Unit Award (File No. 1-12454).*+
|
|
|
10.17
|
Form of Performance Restricted Stock Unit Award (File No. 1-12454).*+
|
|
|
10.18
|
Form of Performance Cash Incentive Award (File No. 1-12454).*+
|
|
|
10.19
|
Initial Award, dated as of December 3, 2012, by and between Ruby Tuesday, Inc. and James J. Buettgen (incorporated by reference from Exhibit 10.24 to the Ruby Tuesday, Inc. Annual Report on Form 10-K for the year ended June 4, 2013 (File No. 1-12454)).*
|
|
|
10.20
|
Inducement and High-Performance Award, dated as of December 3, 2012, by and between Ruby Tuesday, Inc. and James J. Buettgen (incorporated by reference from Exhibit 10.25 to the Ruby Tuesday, Inc. Annual Report on Form 10-K for the year ended June 4, 2013 (File No. 1-12454)).*
|
|
|
10.21
|
Make-Whole Award, dated as of December 3, 2012, by and between Ruby Tuesday, Inc. and James J. Buettgen (incorporated by reference from Exhibit 10.26 to the Ruby Tuesday, Inc. Annual Report on Form 10-K for the year ended June 4, 2013 (File No. 1-12454)).*
|
|
|
10.22
|
Performance-Based Cash Incentive Award, dated as of December 3, 2012, by and between Ruby Tuesday, Inc. and James J. Buettgen (incorporated by reference from Exhibit 10.27 to the Ruby Tuesday, Inc. Annual Report on Form 10-K for the year ended June 4, 2013 (File No. 1-12454)).*
|
|
|
10.23
|
Morrison Restaurants Inc. Deferred Compensation Plan, as restated effective January 1, 1994, together with amended and restated Trust Agreement, dated as of December 1, 1992, to Deferred Compensation Plan (incorporated by reference from Exhibit 10(i) to the Morrison Restaurants Inc. Annual Report on Form 10-K for the fiscal year ended June 5, 1993 (File No. 0-1750)).*
|
|
|
10.24
|
Morrison Restaurants Inc. Management Retirement Plan together with First Amendment, dated as of June 30, 1994 and Second Amendment, dated as of July 31, 1995 (incorporated by reference from Exhibit 10(n) to the Morrison Restaurants Inc. Annual Report on Form 10-K for the fiscal year ended June 3, 1995 (File No. 1-12454)).*
|
-100-
|
10.25
|
Form of Third Amendment to Management Retirement Plan (incorporated by reference from Exhibit 10.32 to Form 8-B filed on March 15, 1996 (File No. 1-12454)).*
|
|
|
10.26
|
Form of Fourth Amendment to Management Retirement Plan (incorporated by reference from Exhibit 10.14 to the Ruby Tuesday, Inc. Annual Report on Form 10-K for the fiscal year ended June 3, 2003 (File No. 1-12454)).*
|
|
|
10.27
|
Form of Fifth Amendment to Management Retirement Plan (incorporated by reference from Exhibit 10.15 to the Ruby Tuesday, Inc. Annual Report on Form 10-K for the fiscal year ended June 3, 2003 (File No. 1-12454)).*
|
|
|
10.28
|
Sixth Amendment, dated as of April 9, 2001, to the Ruby Tuesday, Inc. Management Retirement Plan (incorporated by reference from Exhibit 10.41 to the Ruby Tuesday, Inc. Annual Report on Form 10-K for the fiscal year ended June 5, 2001 (File No. 1-12454)).*
|
|
|
10.29
|
Seventh Amendment (dated as of October 5, 2004) to the Ruby Tuesday, Inc. Management Retirement Plan (incorporated by reference from Exhibit 99.5 to the Ruby Tuesday, Inc. Quarterly Report on Form 10-Q for the quarter ended November 30, 2004 (File No. 1-12454)).*
|
|
|
10.30
|
Morrison Retirement Plan, amended and restated as of October 7, 2009 (incorporated by reference from Exhibit 10.1 to the Ruby Tuesday, Inc. Quarterly Report on Form 10-Q for the quarter ended December 1, 2009 (File No. 1-12454)).*
|
|
|
10.31
|
Indenture, dated January 7, 2015, to the Morrison Retirement Plan (incorporated by reference from Exhibit 10.2 to the Ruby Tuesday, Inc. Quarterly Report on Form 10-Q for the quarter ended December 2, 2014 (File No. 12454)).*
|
|
|
10.32
|
Executive Group Life and Executive Accidental Death and Dismemberment Plan (incorporated by reference from Exhibit 10(q) to the Morrison Restaurants Inc. Annual Report on Form 10-K for the fiscal year ended June 3, 1989 (File No. 0-1750)).*
|
|
|
10.33
|
Morrison Restaurants Inc. Executive Life Insurance Plan (incorporated by reference from Exhibit 10(a)(a) to the Morrison Restaurants Inc. Annual Report on Form 10-K for the fiscal year ended June 4, 1994 (File No. 1-12454)).*
|
|
|
10.34
|
Form of First Amendment to the Morrison Restaurants Inc. Executive Life Insurance Plan (incorporated by reference from Exhibit 10.25 to the Ruby Tuesday, Inc. Annual Report on Form 10-K for the fiscal year ended June 3, 2003 (File No. 1-12454)).*
|
|
|
10.35
|
Second Amendment (dated as of January 1, 2004) to the Ruby Tuesday Inc. Executive Life Insurance Plan (formerly the Morrison Restaurants Inc. Executive Life Insurance Plan) (incorporated by reference from Exhibit 99.2 to the Ruby Tuesday, Inc. Quarterly Report on Form 10-Q for the quarter ended November 30, 2004 (File No. 1-12454)).*
|
|
|
10.36
|
Ruby Tuesday Inc. Executive Life Insurance Premium Plan dated as of January 1, 2004 (incorporated by reference from Exhibit 99.1 to the Ruby Tuesday, Inc. Quarterly Report on Form 10-Q for the quarter ended November 30, 2004 (File No. 1-12454)).*
|
|
|
10.37
|
First Amendment, dated November 30, 2012, to the Ruby Tuesday Inc. Executive Life Insurance Premium Plan (incorporated by reference from Exhibit 10.6 to the Ruby Tuesday, Inc. Quarterly Report on Form 10-Q for the quarter ended December 4, 2012 (File No. 1-12454)).*
|
|
|
10.38
|
Ruby Tuesday, Inc. 1996 Stock Incentive Plan, restated as of September 30, 1999 (incorporated by reference from Exhibit 99.1 to the Ruby Tuesday, Inc. Quarterly Report on Form 10-Q for the quarter ended September 3, 2000 (File No. 1-12454)).*
|
-101-
Index
|
10.39
|
First Amendment, dated as of July 10, 2000, to the restated Ruby Tuesday, Inc. 1996 Stock Incentive Plan (incorporated by reference from Exhibit 99.2 to the Ruby Tuesday, Inc. Quarterly Report on Form 10-Q for the quarter ended September 3, 2000 (File No. 1-12454)).*
|
|
|
10.40
|
Ruby Tuesday, Inc. Salary Deferral Plan, amended and restated as of October 7, 2009 (incorporated by reference from Exhibit 10.2 to the Ruby Tuesday, Inc. Quarterly Report on Form 10-Q for the quarter ended December 1, 2009 (File No. 1-12454)).*
|
|
|
10.41
|
First Amendment, dated as of April 6, 2011, to the Ruby Tuesday, Inc. Salary Deferral Plan (incorporated by reference from Exhibit 10.1 to the Ruby Tuesday, Inc. Quarterly Report on Form 10-Q for the quarter ended March 1, 2011 (File No. 1-12454)).*
|
|
|
10.42
|
Indenture, dated January 7, 2015, to the Ruby Tuesday, Inc. Salary Deferral Plan (incorporated by reference from Exhibit 10.1 to the Ruby Tuesday, Inc. Quarterly Report on Form 10-Q for the quarter ended December 2, 2014 (File No. 12454)).*
|
|
| 10.43 | First Amendment, dated as of July 29, 2015, to the Ruby Tuesday, Inc. Salary Deferral Plan (File No. 1-12454).*+ | |
|
10.44
|
Ruby Tuesday, Inc. Deferred Compensation Plan Trust Agreement restated as of June 1, 2001 (incorporated by reference from Exhibit 10.44 to the Ruby Tuesday, Inc. Annual Report on Form 10-K for the fiscal year ended June 5, 2001 (File No. 1-12454)).*
|
|
|
10.45
|
First Amendment, dated as of June 10, 2002, to the Ruby Tuesday, Inc. Deferred Compensation Plan Trust Agreement (incorporated by reference from Exhibit 10.58 to the Ruby Tuesday, Inc. Annual Report on Form 10-K for the fiscal year ended June 4, 2002 (File No. 1-12454)).*
|
|
|
10.46
|
Ruby Tuesday, Inc. Restated Deferred Compensation Plan, dated as of November 26, 2002 (incorporated by reference from Exhibit 99.2 to the Ruby Tuesday, Inc. Quarterly Report on Form 10-Q for the quarter ended December 3, 2002 (File No. 1-12454)).*
|
|
|
10.47
|
Ruby Tuesday, Inc. 2005 Deferred Compensation Plan (incorporated by reference from Exhibit 10.1 to Form 8-K filed on January 18, 2005 (File No. 1-12454)).*
|
|
|
10.48
|
First Amendment, dated as of December 14, 2006, to the Ruby Tuesday, Inc. 2005 Deferred Compensation Plan (incorporated by reference from Exhibit 10.6 to the Ruby Tuesday, Inc. Quarterly Report on Form 10-Q for the quarter ended December 5, 2006 (File No. 1-12454)).*
|
|
|
10.49
|
Second Amendment, dated as of July 11, 2007, to the Ruby Tuesday, Inc. 2005 Deferred Compensation Plan (incorporated by reference from Exhibit 10.40 to the Ruby Tuesday, Inc. Annual Report on Form 10-K for the fiscal year ended June 5, 2007 (File No. 1-12454)).*
|
|
|
10.50
|
Third Amendment, dated as of December 30, 2008, to the Ruby Tuesday, Inc. 2005 Deferred Compensation Plan (incorporated by reference from Exhibit 10.3 to the Ruby Tuesday, Inc. Quarterly Report on Form 10-Q for the quarter ended December 2, 2008 (File No. 1-12454)).*
|
|
|
10.51
|
Fourth Amendment, dated as of December 31, 2008, to the Ruby Tuesday, Inc. 2005 Deferred Compensation Plan (incorporated by reference from Exhibit 10.4 to the Ruby Tuesday, Inc. Quarterly Report on Form 10-Q for the quarter ended December 2, 2008 (File No. 1-12454)).*
|
|
|
10.52
|
Fifth Amendment, dated as April 6, 2011, to the Ruby Tuesday, Inc. 2005 Deferred Compensation Plan (incorporated by reference from Exhibit 10.2 to the Ruby Tuesday, Inc. Quarterly Report on Form 10-Q for the quarter ended March 1, 2011 (File No. 1-12454)).*
|
|
|
10.53
|
Sixth Amendment, dated as October 31, 2012, to the Ruby Tuesday, Inc. 2005 Deferred Compensation Plan (incorporated by reference from Exhibit 10.5 to the Ruby Tuesday, Inc. Quarterly Report on Form
|
-102-
| 10-Q for the quarter ended December 4, 2012 (File No. 1-12454)).* | ||
|
10.54
|
Seventh Amendment, dated as July 29, 2015, to the Ruby Tuesday, Inc. 2005 Deferred Compensation Plan (File No. 1-12454).*+ | |
| 10.55 |
Description of Cash Bonus Plan (incorporated by reference to Form 8-K filed on July 14, 2006 (File No. 1-12454)).*
|
|
|
10.56
|
Distribution Agreement, dated as of March 2, 1996, by and among Morrison Restaurants Inc., Morrison Fresh Cooking, Inc. and Morrison Health Care, Inc. (incorporated by reference from Exhibit 10.23 to Form 8-B filed on March 15, 1996 (File No. 1-12454)).
|
|
|
10.57
|
Amended and Restated Tax Allocation and Indemnification Agreement, dated as of March 2, 1996, by and among Morrison Restaurants Inc., Custom Management Corporation of Pennsylvania, Custom Management Corporation, John C. Metz & Associates, Inc., Morrison International, Inc., Morrison Custom Management Corporation of Pennsylvania, Morrison Fresh Cooking, Inc., Ruby Tuesday, Inc., a Delaware corporation, Ruby Tuesday (Georgia), Inc., a Georgia corporation, Tias, Inc. and Morrison Health Care, Inc. (incorporated by reference from Exhibit 10.24 to Form 8-B filed on March 15, 1996 (File No. 1-12454)).
|
|
|
10.58
|
Agreement Respecting Employee Benefit Matters, dated as of March 2, 1996, by and among Morrison Restaurants Inc., Morrison Fresh Cooking, Inc. and Morrison Health Care, Inc. (incorporated by reference from Exhibit 10.25 to Form 8-B filed on March 15, 1996 (File No. 1-12454)).
|
|
|
10.59
|
Trust Agreement (dated as of July 23, 2004) between Ruby Tuesday Inc. and U.S. Trust Company, N.A. (incorporated by reference from Exhibit 99.3 to the Ruby Tuesday, Inc. Quarterly Report on Form 10-Q for the quarter ended November 30, 2004 (File No. 1-12454)).*
|
|
|
10.60
|
Master Distribution Agreement, dated as of December 8, 2006 and effective as of November 15, 2006, by and between Ruby Tuesday, Inc. and PFG Customized Distribution (portions of which have been redacted pursuant to a confidential treatment request filed with the SEC) (incorporated by reference from Exhibit 10.4 to the Ruby Tuesday, Inc. Quarterly Report on Form 10-Q for the quarter ended December 5, 2006 (File No. 1-12454)).
|
|
|
10.61
|
Revolving Credit Agreement, dated as of December 3, 2013, among Ruby Tuesday, Inc., the Guarantors, the Lenders from time to time party hereto, Bank of America, N.A., as Administrative Agent and Issuing Bank, and Wells Fargo, National Association and Regions Bank, as Co-Syndication Agents (incorporated by reference from Exhibit 10.1 to Form 8-K filed on December 9, 2013 (File No. 1-12454)).
|
|
|
10.62
|
Waiver and Consent in Connection with Revolving Credit Facility (incorporated by reference from Exhibit 10.3 to the Ruby Tuesday, Inc. Quarterly Report on Form 10-Q for the quarter ended December 3, 2013 (File No. 1-12454)).
|
|
|
10.63
|
First Amendment to Revolving Credit Agreement and Waiver, dated as of January 10, 2014, by and among Ruby Tuesday, Inc., the Guarantors party hereto, the Lenders party hereto and Bank of America, N.A., as administrative agent for the Lenders (incorporated by reference from Exhibit 10.4 to the Ruby Tuesday, Inc. Quarterly Report on Form 10-Q for the quarter ended December 3, 2013 (File No. 1-12454)).
|
|
|
10.64
|
Second Amendment to Revolving Credit Agreement and Waiver, dated as of February 7, 2014, by and among Ruby Tuesday, Inc., the Guarantors, the Lenders party hereto and Bank of America, N.A., as administrative agent for the Lenders (incorporated by reference from Exhibit 10.1 to the Ruby Tuesday, Inc. Quarterly Report on Form 10-Q for the quarter ended March 4, 2014 (File No. 1-12454)).
|
-103-
|
10.65
|
Third Amendment to Revolving Credit Agreement and Waiver, dated as of August 5, 2014, by and among Ruby Tuesday, Inc., the Guarantors, the Lenders party hereto and Bank of America, N.A., as administrative agent for the Lenders (incorporated by reference from Exhibit 10.1 to the Ruby Tuesday, Inc. Annual Report on Form 10-K for the year ended June 3, 2014 (File No. 1-12454)).
|
|
|
10.66
|
Fourth Amendment to Revolving Credit Agreement and Waiver, dated as of June 29, 2015, by and among Ruby Tuesday, Inc., the Guarantors, the Lenders party hereto and Bank of America, N.A. as administrative agent for the Lenders (incorporated by reference from Exhibit 10.1 to Form 8-K filed on July 2, 2015 (File No. 1-12454)).
|
|
|
10.67
|
Loan Modification Agreement, dated as of December 2, 2013, by and among Ruby Tuesday, Inc. and the Borrowers and Lenders party hereto (incorporated by reference from Exhibit 10.2 to the Ruby Tuesday, Inc. Quarterly Report on Form 10-Q for the quarter ended December 3, 2013 (File No. 1-12454)).
|
|
|
10.68
|
Loan Modification Agreement, dated as of August 03, 2015, by and among Ruby Tuesday, Inc. and the Borrowers and Lenders party hereto (File No. 1-12454).+
|
|
|
10.69
|
Master Amendment to Loan Documents, dated as of May 2, 2014, for the Secured Promissory Notes by and among certain subsidiaries of Ruby Tuesday, Inc. and First Franchise Capital Corporation (incorporated by reference from Exhibit 10.2 to the Ruby Tuesday, Inc. Annual Report on Form 10-K for the year ended June 3, 2014 (File No. 1-12454)).
|
|
|
10.70
|
Purchase Agreement, dated as of May 7, 2012 (incorporated by reference from Exhibit 10.1 to Form 8-K filed on May 9, 2012 (File No. 1-12454)).
|
|
|
10.71
|
Indenture, dated as of May 14, 2012, by and among Ruby Tuesday, Inc., the Guarantors party hereto, and Wells Fargo, National Association, as Trustee (incorporated by reference from Exhibit 10.1 to Form 8-K filed on May 17, 2012 (File No. 1-12454)).
|
|
|
10.72
|
Registration Rights Agreement, dated as of May 14, 2012 (incorporated by reference from Exhibit 10.2 to Form 8-K filed on May 17, 2012 (File No. 1-12454)).
|
|
|
10.73
|
Pledge Agreement, dated as of May 14, 2012 (incorporated by reference from Exhibit 10.4 to Form 8-K filed on May 17, 2012 (File No. 1-12454)).
|
|
|
10.74
|
Indenture, dated January 9, 2013, to the Ruby Tuesday, Inc. Cafeteria Plan (incorporated by reference from Exhibit 10.3 to the Ruby Tuesday, Inc. Quarterly Report on Form 10-Q for the quarter ended December 4, 2012 (File No. 1-12454)).*
|
|
|
10.75
|
Form of Indemnification Agreement, dated April 7, 2010 (incorporated by reference from Exhibit 10.1 to the Ruby Tuesday, Inc. Quarterly Report on Form 10-Q for the quarter ended March 2, 2010 (File No. 1-12454)).
|
|
|
10.76
|
Employment Agreement, dated as of November 16, 2012, by and between Ruby Tuesday, Inc. and James J. Buettgen (incorporated by reference from Exhibit 10.1 to the Ruby Tuesday, Inc. Quarterly Report on Form 10-Q for the quarter ended December 4, 2012 (File No. 1-12454)).*
|
|
|
10.77
|
Amendment No. 1, dated as of September 20, 2013, to Employment Agreement by and between Ruby Tuesday, Inc. and James J. Buettgen (incorporated by reference from Exhibit 99.1 to Form 8-K filed on September 23, 2013 (File No. 1-12454)).*
|
|
|
10.78
|
Agreement and General Release, by and between Ruby Tuesday, Inc. and Jeff Wood (incorporated by reference from Exhibit 10.1 to the Ruby Tuesday, Inc. Quarterly Report on Form 10-Q for the quarter ended September 2, 2014 (File No. 1-12454)).*
|
-104-
|
10.79
|
Separation Agreement, dated as of April 30, 2012, by and between Ruby Tuesday, Inc. and Michael O. Moore (incorporated by reference from Exhibit 10.1 to Form 8-K filed on April 26, 2012 (File No. 1-12454)).*
|
|
|
10.80
|
First Amendment to Separation Agreement, dated as of June 26, 2014, by and between Ruby Tuesday, Inc. and Michael O. Moore (incorporated by reference from Exhibit 99.2 to Form 8-K filed on June 26, 2014 (File No. 1-12454)).*
|
|
|
10.81
|
Agreement for Separation of Employment, by and between Robert LeBoeuf and Ruby Tuesday, Inc. (incorporated by reference from Exhibit 10.1 to the Ruby Tuesday, Inc. Quarterly Report on Form 10-Q for the quarter ended December 3, 2013 (File No. 1-12454)).*
|
|
|
10.82
|
Ruby Tuesday, Inc. Executive Compensation Clawback Policy, dated as of July 22, 2015 (File No. 1-12454).*+
|
|
|
10.83
|
Ruby Tuesday, Inc. 2010 Executive Incentive Compensation Plan (incorporated by reference from Exhibit 10.2 to the Ruby Tuesday, Inc. Quarterly Report on Form 10-Q for the quarter ended August 31, 2011 (File No. 1-12454)).*
|
|
|
10.84
|
Ruby Tuesday, Inc. 2015 Executive Incentive Compensation Plan (incorporated by reference from Exhibit 10.2 to the Ruby Tuesday, Inc. Quarterly Report on Form 10-Q for the quarter ended March 3, 2015 (File No. 1-12454)).*
|
|
|
12.1
|
Statement regarding computation of Consolidated Ratio of Earnings to Fixed Charges.+
|
|
|
21.1
|
Subsidiaries of Ruby Tuesday, Inc.+
|
|
|
23.1
|
Consent of KPMG LLP, Independent Registered Public Accounting Firm.+
|
|
|
31.1
|
Certification of President and Chief Executive Officer pursuant to Section 302 of the Sarbanes-Oxley Act of 2002.+
|
|
|
31.2
|
Certification of Chief Financial Officer pursuant to Section 302 of the Sarbanes-Oxley Act of 2002.+
|
|
|
32.1
|
Certification of President and Chief Executive Officer pursuant to Section 906 of the Sarbanes-Oxley Act of 2002.+
|
|
|
32.2
|
Certification of Chief Financial Officer pursuant to Section 906 of the Sarbanes-Oxley Act of 2002.+
|
|
|
101.INS
|
XBRL Instance Document.+
|
|
|
101.SCH
|
XBRL Schema Document.+
|
|
|
101.CAL
|
XBRL Calculation Linkbase Document.+
|
|
|
101.DEF
|
XBRL Definition Linkbase Document.+
|
|
|
101.LAB
|
XBRL Labels Linkbase Document.+
|
|
|
101.PRE
|
XBRL Presentation Linkbase Document.+
|
-105-