Attached files
| file | filename |
|---|---|
| 8-K - 8-K - Pangaea Logistics Solutions Ltd. | a8-kfiling.htm |
| EX-99.1 - EXHIBIT 99.1 - Pangaea Logistics Solutions Ltd. | exh991pangaea2q15releasev1.htm |

Second Quarter 2015 Results August 2015

Safe Harbor This presentation includes certain forward-looking statements within the meaning of the Private Securities Litigation Reform Act of 1995, including statements regarding future financial performance, future growth and future acquisitions. These statements are based on Pangaea’s and managements’ current expectations or beliefs and are subject to uncertainty and changes in circumstances. Actual results may vary materially from those expressed or implied by the statements herein due to changes in economic, business, competitive and/or regulatory factors, and other risks and uncertainties affecting the operation of Pangaea’s business. These risks, uncertainties and contingencies include: business conditions; weather and natural disasters; changing interpretations of GAAP; outcomes of government reviews; inquiries and investigations and related litigation; continued compliance with government regulations; legislation or regulatory environments; requirements or changes adversely affecting the business in which Pangaea is engaged; fluctuations in customer demand; management of rapid growth; intensity of competition from other providers of logistics and shipping services; general economic conditions; geopolitical events and regulatory changes; and other factors set forth in Pangaea’s filings with the Securities and Exchange Commission and the filings of its predecessors. The information set forth herein should be read in light of such risks. Further, investors should keep in mind that certain of Pangaea’s financial results are unaudited and do not conform to SEC Regulation S-X and as a result such information may fluctuate materially depending on many factors. Accordingly, Pangaea’s financial results in any particular period may not be indicative of future results. Pangaea is under any obligation to, and expressly disclaims any obligation to, update or alter its forward-looking statements, whether as a result of new information, future events, changes in assumptions or otherwise.

Second Quarter 2015 Highlights • Net income attributable to Pangaea Logistics Solutions Ltd. was $5.5 million in the second quarter of 2015, compared to $1.2 million in the second quarter of 2014 • Pro forma adjusted earnings per common share1 increased to $0.15 in the second quarter of 2015, compared to $0.04 pro forma adjusted earnings per common share in the second quarter of 2014 • Adjusted EBITDA2 increased 68% to $10.3 million in the second quarter of 2015, compared with $6.1 million in the second quarter of 2014, illustrating the Company's continued execution on its strategy in a difficult environment • Cash flow from operations was $12.8 million in the first half of 2015, compared with $9.7 million in the first half of 2014 • At the end of the quarter, Pangaea had $34.2 million in cash and cash equivalents • Announced a 3-5 year Contract of Affreightment ("COA") utilizing the Company's ice- class tonnage with the potential to produce up to $135 million in revenue over 5 years • Secured extensions to two COAs with the potential to generate up to $22 million in revenue over the next three years 1 Earnings per share represents total earnings allocated to common stock divided by the weighted average number of common shares outstanding. Pro Forma adjusted earnings per share represents adjusted total earnings allocated to common stock divided by the weighted average number of shares giving effect to the merger with Quarter Merger Corp. as if it had been consummated as of January 1, 2014. See Reconciliation of Adjusted EBITDA and Pro Forma Adjusted Earnings Per Share. 2 Adjusted EBITDA is a non-GAAP measure and represents operating earnings before interest expense, income taxes, depreciation and amortization, and other non- operating income and/or expense, if any. See Reconciliation of Adjusted EBITDA and Pro Forma Adjusted Earnings Per Share.

Drivers of Second Quarter 2015 Performance • Operating margin improved nearly threefold to 10.8% from 3.7%, this reflected an increased share of revenues coming from COAs as opposed to charter business and decreased expenses, specifically: - Voyage revenue per day decreased 3.4% to $11,401/day from 2014, despite significant decline of dry bulk charter indices, demonstrating the benefit of COAs in limiting volatility - Voyage expense decreased to $28.1 million for the second quarter of 2015 from $41.9 million in the second quarter of 2014, thanks in part to decreased bunker costs - Charter hire expense decreased to $15.2 million from $34.0 million - Vessel operating expenses dropped to $5,586/day in the second quarter of 2015 from $6,440/day in the second quarter of 2014 • Total shipping days decreased by 533 days, as Pangaea limited its exposure to a weak spot market • An unrealized gain of $1.2 million on fuel swaps for first half of 2015

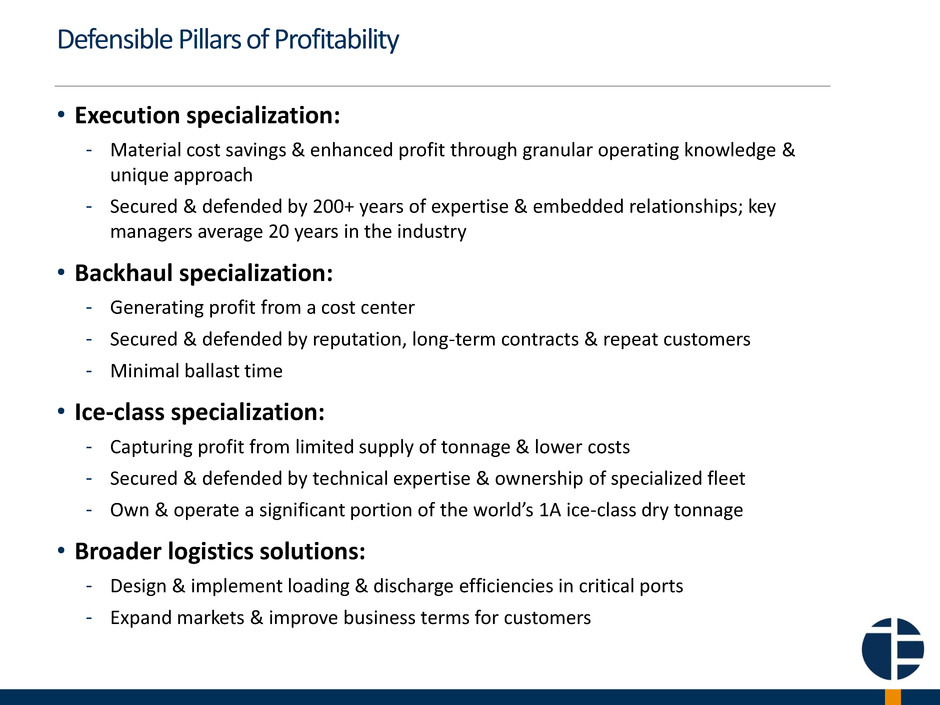
Defensible Pillars of Profitability • Execution specialization: - Material cost savings & enhanced profit through granular operating knowledge & unique approach - Secured & defended by 200+ years of expertise & embedded relationships; key managers average 20 years in the industry • Backhaul specialization: - Generating profit from a cost center - Secured & defended by reputation, long-term contracts & repeat customers - Minimal ballast time • Ice-class specialization: - Capturing profit from limited supply of tonnage & lower costs - Secured & defended by technical expertise & ownership of specialized fleet - Own & operate a significant portion of the world’s 1A ice-class dry tonnage • Broader logistics solutions: - Design & implement loading & discharge efficiencies in critical ports - Expand markets & improve business terms for customers

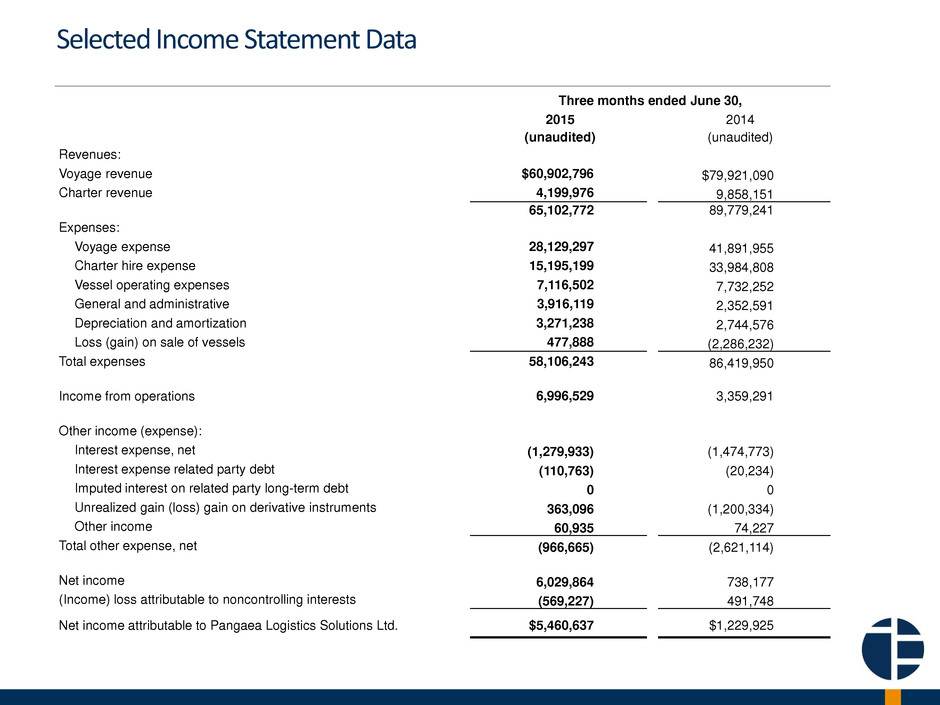
Selected Income Statement Data Three months ended June 30, 2015 2014 (unaudited) (unaudited) Revenues: Voyage revenue $60,902,796 $79,921,090 Charter revenue 4,199,976 9,858,151 65,102,772 89,779,241 Expenses: Voyage expense 28,129,297 41,891,955 Charter hire expense 15,195,199 33,984,808 Vessel operating expenses 7,116,502 7,732,252 General and administrative 3,916,119 2,352,591 Depreciation and amortization 3,271,238 2,744,576 Loss (gain) on sale of vessels 477,888 (2,286,232) Total expenses 58,106,243 86,419,950 Income from operations 6,996,529 3,359,291 Other income (expense): Interest expense, net (1,279,933) (1,474,773) Interest expense related party debt (110,763) (20,234) Imputed interest on related party long-term debt 0 0 Unrealized gain (loss) gain on derivative instruments 363,096 (1,200,334) Other income 60,935 74,227 Total other expense, net (966,665) (2,621,114) Net income 6,029,864 738,177 (Income) loss attributable to noncontrolling interests (569,227) 491,748 Net income attributable to Pangaea Logistics Solutions Ltd. $5,460,637 $1,229,925

Selected Balance Sheet and Cash Flow Data Balance Sheet Data June 30, 2015 December 31, 2014 Assets (unaudited) Current Assets Cash and cash equivalents $34,154,575 $29,817,507 Accounts receivable 21,004,625 27,362,216 Other current assets 22,479,675 27,693,697 Total current assets 77,638,875 84,873,420 Fixed assets, net 265,713,887 207,667,613 Investment in newbuildings in-process 15,381,477 38,471,430 Other noncurrent assets 876,964 1,450,802 Total Assets 359,611,203 332,463,265 Liabilities and stockholders' equity Current liabilities Accounts payable, accrued expenses and other current liabilities 24,918,504 40,201,794 Related party debt 60,618,225 59,102,077 Current portion long-term debt 22,204,172 17,807,674 Other current liabilities 18,582,465 27,753,751 Total current liabilities 126,323,366 144,685,296 Secured long-term debt, net 118,047,085 87,430,416 Total Pangaea Logistics Solutions Ltd. equity 109,781,512 97,816,194 Non-controlling interests 5,459,240 2,531,359 Total stockholders' equity 115,240,752 100,347,553 Total liabilities and stockholders' equity $359,611,203 $332,463,265 Statements of Cash Flows Data Six months ended June 30, 2015 2014 Net cash provided by operating activities 12,810,782 9,749,684 Net cash used in investing activities (40,634,872) (6,629,130) Net cash provided by (used in) financing activities 32,161,158 (546,325)
