Attached files
| file | filename |
|---|---|
| 8-K - CURRENT REPORT - National American University Holdings, Inc. | nauh_8k.htm |
Exhibit 99.1

NATIONAL AMERICAN UNIVERSITY HOLDINGS, INC. REPORTS
FISCAL 2015 FOURTH QUARTER AND YEAR-END RESULTS
Company to host conference call on August 6, 2015, at 11:00 a.m. EDT
Financial and Operational Highlights
|
*
|
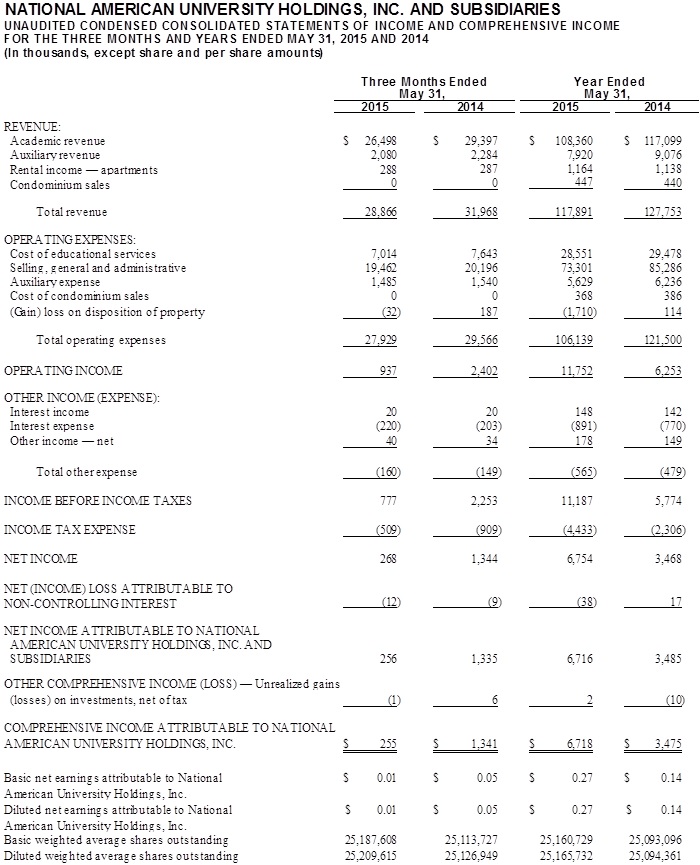
FY 2015 annual net income attributable to the Company increased 92.7% to $6.7 million, from $3.5 million in the prior year, primarily as a result of lower SG&A expenses incurred during the year.
|
|
*
|
FY 2015 annual revenues were $117.9 million, compared to $127.8 million in the prior year. The Company’s academic segment’s revenue was $116.3 million, compared to $126.2 million in the prior year.
|
|
*
|
FY 2015 fourth quarter net income attributable to the Company was $0.3 million, compared to $1.3 million in the prior-year period, primarily as a result of lower revenues and increased SG&A expenses due to an increase in allowance for bad debt expense.
|
|
*
|
FY 2015 fourth quarter total revenue was $28.9 million, compared to $32.0 million in the prior-year period. The Company’s academic segment’s revenue was $28.6 million in the FY 2015 fourth quarter, compared to $31.7 million in the prior-year period.
|
|
*
|
Enrollment by headcount for the FY 2015 fourth quarter (spring 2015 term) decreased 12.3% over the prior-year period to 9,519 students as of May 31, 2015.
|
|
*
|
The Board of Directors declared a cash dividend in the amount of $0.045 per share on all shares of the Company’s common stock outstanding and of record as of the close of business on May 31, 2015, which was paid on July 10, 2015.
|
|
*
|
Balance sheet at May 31, 2015, included cash and cash equivalents and investments of $27.4 million; working capital of $34.6 million; no outstanding lending debt; and stockholders’ equity of $52.5 million, or approximately $2.09 per diluted share.
|
Rapid City, South Dakota, August 5, 2015 — National American University Holdings, Inc. (the “Company”) (NASDAQ: NAUH), which through its wholly owned subsidiary operates National American University (“NAU” or the “University”), a regionally accredited, proprietary, multi-campus institution of higher learning, today reported unaudited financial results for its fiscal 2015 fourth quarter and year ended May 31, 2015.
Ronald L. Shape, Ed.D., Chief Executive Officer of the Company, commented, “During FY 2015, we continued to focus on positioning NAU and the Company to be successful in the constantly changing postsecondary education environment. The overall industry has been impacted by enrollment pressures and a challenging regulatory atmosphere, and while NAU has not been immune to these issues, we feel we have made progress toward our goal of best positioning NAU and the Company for the future. As one of our two non-negotiables, regulatory compliance was a key area of focus in FY 2015. In the first half of 2015, we announced the reaffirmation of NAU’s accreditation by the Higher Learning Commission, as well as the returning of funds to the U.S. Department of Education (‘DOE’) related to the ineligible disbursement of Title IV funds related to the timing of approvals for one of our newer locations. In addition, I am particularly pleased to share that we recently received a final determination regarding the Title IV program review conducted by the DOE in August 2014, which accepted the corrective actions taken by the University in response to the initial program review report and required no further action. We look forward to continuing our strong relationship with the DOE, with the shared goal of creating the best possible outcomes for our students.”
Dr. Shape continued, “During FY 2015, we implemented a number of changes to help reverse the declining enrollment trend that many of our peers have also experienced this past year. In addition to putting a greater emphasis on enrollment counselor performance and student outcomes, we launched a new branding campaign and targeted marketing programs in the second half of 2015 to better communicate to prospective students the differentiating factors between NAU and its peers. To achieve these goals, we hired a VP of Marketing and Enrollment to coordinate our efforts and ensure we were capitalizing on the outcomes. One example where NAU stands apart is its doctoral program in Community College Leadership, which continues to grow and gain interest. We welcomed our first cohort of doctoral students in January 2014, and the program has since grown to four cohorts consisting of 78 students in total, with one additional cohort expected to start in the fall term.
1
“Despite numerous industry headwinds and a higher-than-expected allowance for bad debt expense in the FY 2015 fourth quarter, we achieved a 92.7% increase in net income attributable to the Company of $6.7 million, compared to $3.5 million in FY 2014, which was a direct result of our continued focus on increasing efficiencies during FY 2015. We continue to maintain a strong balance sheet with no long-term debt, and believe we are well positioned operationally and financially to grow in the short and long term. We are committed to consistently improving and expanding our academic programming and support services for our students to enable them to successfully complete their academic goals and obtain jobs in the field for which they studied. We believe we are in a better position to do so today than a year ago and will continue to work toward increasing operational efficiencies without compromising academic quality.”
Operating Review
Enrollment Update
Total NAU student enrollment for the spring term of 2015 decreased 12.3% to 9,519 students from 10,857 during the prior spring term. Students enrolled in 80,396 credit hours compared to 93,742 credit hours during the prior spring term. The current average age of NAU’s students continues to be in the mid-30s, with those seeking undergraduate degrees remaining the highest portion of NAU’s student population.
The following is a summary of student enrollment at May 31, 2015, and May 31, 2014, by degree level and by instructional delivery method:
|
|
May 31, 2015
(Spring ’15 Qtr)
|
May 31, 2014
(Spring ’14 Qtr)
|
||||||||||||||
|
|
No. of Students
|
% of Total
|
No. of Students
|
% of Total
|
||||||||||||
|
Continuing Ed
|
519 | 5.4 | % | 12 | 0.1 | % | ||||||||||
|
Doctoral
|
78 | 0.8 | % | 37 | 0.3 | % | ||||||||||
|
Graduate
|
253 | 2.7 | % | 322 | 3.0 | % | ||||||||||
|
Undergraduate
|
8,669 | 91.1 | % | 10,486 | 96.6 | % | ||||||||||
|
|
||||||||||||||||
|
Total
|
9,519 | 100.0 | % | 10,857 | 100.0 | % | ||||||||||
|
|
May 31, 2015
|
May 31, 2014
|
||||||||||||||
|
|
No. of Students
|
% of Total
|
No. of Students
|
% of Total
|
||||||||||||
|
Online
|
5,929 | 62.3 | % | 6,481 | 59.7 | % | ||||||||||
|
On-Campus
|
2,182 | 22.9 | % | 2,686 | 24.7 | % | ||||||||||
|
Hybrid
|
1,408 | 14.8 | % | 1,690 | 15.6 | % | ||||||||||
|
|
||||||||||||||||
|
Total
|
9,519 | 100.0 | % | 10,857 | 100.0 | % | ||||||||||
Financial Review
The Company, through its wholly owned subsidiary, operates in two business segments: the academic segment, which consists of NAU’s undergraduate, graduate, and doctoral education programs and contributes the primary portion of the Company’s revenue; and ownership in multiple apartments and condominium complexes from which it derives sales and rental income. The real estate operations generated approximately 1.0% of the Company’s revenues for the quarter ended May 31, 2015.
Fiscal 2015 Fourth Quarter Financial Results
|
●
|
Total revenues for the FY 2015 fourth quarter were $28.9 million, compared to $32.0 million in the same period last year. The academic segment’s total revenue was $28.6 million, compared to $31.7 million in the prior-year period. This decrease in academic segment revenues was primarily a result of a decrease in enrollment, which was driven by weaker market demand among NAU’s targeted student demographic and an improving economic environment in which many working adults choose not to attend school. The academic segment’s revenue decrease was partially offset by a Board of Governors-approved tuition increase of approximately 2.5% that became effective in late 2014.
|
2
|
●
|
For the FY 2015 fourth quarter, educational services expense was $7.0 million, or 24.5% of the academic segment’s total revenue, compared to $7.6 million, or 23.9%, for the FY 2014 fourth quarter. The increase in cost of educational services as a percentage of total academic revenue was the result of fixed facility costs on lower revenues.
|
Educational services expense specifically relates to the academic segment, and includes salaries and benefits of faculty and academic administrators, costs of educational supplies, facility costs, faculty reference and support material and related academic costs.
|
●
|
During the FY 2015 fourth quarter, SG&A expenses decreased to $19.5 million, or 67.4% of total revenues, from $20.2 million, or 63.2%, in the prior-year period.
|
|
●
|
Income before income taxes and non-controlling interest for the FY 2015 fourth quarter was $777,000, from $2.3 million in the same period last year, primarily as a result of decreased revenues and increased SG&A expenses related to an increase in allowance for bad debt expense, which totaled $1.6 million.
|
|
●
|
Net income attributable to the Company for the FY 2015 fourth quarter was $0.3 million, or $0.01 per diluted share based on 25.2 million shares outstanding, compared to $1.3 million, or $0.05 per diluted share based on 25.2 million shares outstanding, in the prior-year period.
|
|
●
|
EBITDA for the FY 2015 fourth quarter was $2.5 million, compared to $4.1 million in the prior-year period. A table reconciling EBITDA to net income can be found at the end of this release.
|
Fiscal 2015 Financial Results
|
●
|
Total revenues for FY 2015 were $117.9 million, compared to $127.8 million for FY 2014. The academic segment’s total revenue was $116.3 million, compared to $126.2 million in the prior fiscal year, as a result of the decrease in enrollment, which was partially offset by the previously mentioned tuition increase. The Company believes it will achieve increased revenue growth as it continues to execute on its strategic plan, which includes growing enrollments at current existing locations by investing in new program development and expansion, a new branding campaign, academic advisor support, student retention initiatives, and leadership focus with a new VP of Marketing and Enrollment.
|
|
●
|
NAU’s educational services expense for FY 2015 was $28.6 million, or 24.6% of the academic segment’s total revenue, compared to $29.5 million, or 23.4%, in the prior-year period. The increase in cost of educational services as a percentage of total academic revenue was the result of fixed facility costs on lower revenues.
|
|
●
|
During FY 2015, SG&A expenses decreased 14.1% to $73.3 million, or 62.2% of total revenues, compared to $85.3 million, or 66.8%, in the prior fiscal year. The decrease was driven by cost-cutting initiatives to better align expenditures with current enrollments.
|
|
●
|
Income before income taxes and non-controlling interest for FY 2015 increased to $11.2 million, from $5.8 million in the prior fiscal year, primarily as a result of lower SG&A expenses incurred during the year.
|
|
●
|
Net income attributable to the Company during FY 2015 increased to $6.7 million, or $0.27 per diluted share based on 25.2 million shares outstanding, compared to $3.5 million, or $0.14 per diluted share based on 25.1 million shares outstanding, in FY 2014.
|
|
●
|
The Company’s EBITDA for FY 2015 increased to $18.1 million, from $12.8 million in the prior-year period. A table reconciling EBITDA to net income can be found at the end of this release.
|
Balance Sheet Highlights
|
(in millions except for percentages)
|
5/31/2015
|
5/31/2014
|
% Change
|
|||||||||
|
Cash and Cash Equivalents/Investments
|
$ | 27.4 | $ | 19.6 | 39.9 | %* | ||||||
|
Working Capital
|
34.6 | 25.7 | 34.6 | % | ||||||||
|
Total Long-term Debt
|
0 | 0 | N/A | |||||||||
|
Stockholders’ Equity
|
52.5 | 51.2 | 2.6 | % | ||||||||
* The increase in cash is primarily due to increased net income and the timing of funds received from student receivables, which the Company received in June and July this year versus April and May of last year.
3
Quarterly Dividend
The Board of Directors declared a cash dividend in the amount of $0.045 per share on all shares of the Company’s common stock outstanding and of record as of the close of business on May 31, 2015, that was paid on or about July 10, 2015.
Conference Call Information
Management will discuss these results in a conference call (with accompanying presentation) on Thursday, August 6, 2015, at 11:00 a.m. EDT.
The dial-in numbers are:
(877) 407-9078 (U.S.)
(201) 493-6745 (International)
Accompanying Slide Presentation and Webcast
The Company will also have an accompanying slide presentation available in PDF format at the “Investor Relations” section of the NAU website at http://www.national.edu/about-nau/investor-relations/. The presentation will be made available 30 minutes prior to the conference call. In addition, the call will be simultaneously webcast over the Internet via the “Investor Relations” section of the NAU website or by clicking on the conference call link: http://national.equisolvewebcast.com/q4-2015.
About National American University Holdings, Inc.
National American University Holdings, Inc., through its wholly owned subsidiary, operates National American University (“NAU”), a regionally accredited, proprietary, multi-campus institution of higher learning offering associate, bachelor’s, master’s, and doctoral degree programs in technical and professional disciplines. Accredited by The Higher Learning Commission and a member of the North Central Association of Colleges and Schools, NAU has been providing technical and professional career education since 1941. NAU opened its first campus in Rapid City, South Dakota, and has since grown to multiple locations throughout the United States. In 1998, NAU began offering online courses. Today, NAU offers degree programs in traditional, online, and hybrid formats, which provide students increased flexibility to take courses at times and places convenient to their busy lifestyles.
Forward Looking Statements
This press release may contain forward-looking statements within the meaning of the Private Securities Litigation Reform Act of 1995 regarding the Company's business. Statements made in this release, other than those concerning historical financial information, may be considered forward-looking statements, which speak only as of the date of this release and are based on current beliefs and expectations and involve a number of assumptions. These forward-looking statements include outlooks or expectations for earnings, revenues, expenses or other future financial or business performance, strategies or expectations, or the impact of legal or regulatory matters on business, results of operations or financial condition. Specifically, forward-looking statements may include statements relating to the future financial performance of the Company; the ability to continue to receive Title IV funds; the growth of the market for the Company’s services; expansion plans and opportunities; consolidation in the market for the Company’s services generally; and other statements preceded by, followed by or that include the words “estimate,” “plan,” “project,” “forecast,” “intend,” “expect,” “anticipate,” “believe,” “seek,” “target” or similar expressions. These forward-looking statements involve a number of known and unknown risks and uncertainties or other assumptions that may cause actual results or performance to be materially different from those expressed or implied by those forward-looking statements. Other factors that could cause the Company’s results to differ materially from those contained in its forward-looking statements are included under, among others, the heading “Risk Factors” in the Company’s Annual Report on Form 10-K, which the Company expects to file on August 7, 2015, and in its other filings with the Securities and Exchange Commission. The Company assumes no obligation to update the information contained in this release.
Contact Information:
National American University Holdings, Inc.
Dr. Ronald Shape
605-721-5220
rshape@national.edu
| Investor Relations Counsel | |
| The Equity Group Inc. | |
| Carolyne Y. Sohn | Adam Prior |
| 415-568-2255 | 212-836-9606 |
| csohn@equityny.com | aprior@equityny.com |
4
5
|
NATIONAL AMERICAN UNIVERSITY HOLDINGS, INC. AND SUBSIDIARIES
|
||||||||
|
CONSOLIDATED BALANCE SHEETS
|
||||||||
|
AS OF MAY 31, 2015 AND 2014
|
||||||||
|
(In thousands, except share and per share amounts)
|
||||||||
|
May 31,
|
May 31,
|
|||||||
|
2015
|
2014
|
|||||||
|
ASSETS
|
||||||||
|
CURRENT ASSETS:
|
||||||||
|
Cash and cash equivalents
|
$ | 23,300 | $ | 4,154 | ||||
|
Available for sale investments
|
4,102 | 15,435 | ||||||
|
Student receivables — net of allowance of $1,583 and $1,026 at May 31, 2015 and
|
||||||||
|
May 31, 2014, respectively
|
14,358 | 16,532 | ||||||
|
Other receivables
|
1,195 | 291 | ||||||
|
Deferred income taxes
|
2,335 | 1,688 | ||||||
|
Prepaid and other current assets
|
2,151 | 2,180 | ||||||
|
Total current assets
|
47,441 | 40,280 | ||||||
|
Total property and equipment - net
|
36,390 | 43,258 | ||||||
|
OTHER ASSETS:
|
||||||||
|
Condominium inventory
|
385 | 744 | ||||||
|
Land held for future development
|
312 | 312 | ||||||
|
Course development — net of accumulated amortization of $2,760 and $2,421 at
|
||||||||
|
May 31, 2015 and May 31, 2014, respectively
|
804 | 1,000 | ||||||
|
Note receivable - tenant improvements
|
0 | 1,308 | ||||||
|
Deposit on property and equipment
|
0 | 200 | ||||||
|
Other
|
1,212 | 1,355 | ||||||
|
Total other assets
|
2,713 | 4,919 | ||||||
|
TOTAL
|
$ | 86,544 | $ | 88,457 | ||||
|
LIABILITIES AND STOCKHOLDERS' EQUITY
|
||||||||
|
CURRENT LIABILITIES:
|
||||||||
|
Current portion of capital lease payable
|
$ | 244 | $ | 206 | ||||
|
Accounts payable
|
3,246 | 3,411 | ||||||
|
Dividends payable
|
1,139 | 1,134 | ||||||
|
Income taxes payable
|
1 | 1,158 | ||||||
|
Deferred income
|
1,459 | 1,310 | ||||||
|
Accrued and other liabilities
|
6,746 | 7,347 | ||||||
|
Total current liabilities
|
12,835 | 14,566 | ||||||
|
DEFERRED INCOME TAXES
|
3,283 | 4,168 | ||||||
|
OTHER LONG-TERM LIABILITIES
|
6,047 | 6,431 | ||||||
|
CAPITAL LEASE PAYABLE, NET OF CURRENT PORTION
|
11,853 | 12,097 | ||||||
|
COMMITMENTS AND CONTINGENCIES (Note 15)
|
||||||||
|
STOCKHOLDERS' EQUITY:
|
||||||||
|
Common stock, $0.0001 par value (50,000,000 authorized; 28,262,241 issued and
|
||||||||
|
25,191,414 outstanding as of May 31, 2015; 28,177,827 issued and 25,117,454
|
||||||||
|
outstanding as of May 31, 2014)
|
3 | 3 | ||||||
|
Additional paid-in capital
|
58,336 | 59,191 | ||||||
|
Retained earnings
|
13,751 | 11,573 | ||||||
|
Treasury stock, at cost (3,070,827 shares at May 31, 2015 and 3,060,373
|
||||||||
|
at May 31, 2014)
|
(19,455 | ) | (19,423 | ) | ||||
|
Accumulated other comprehensive loss, net of taxes - unrealized loss on available
|
||||||||
|
for sale securities
|
(1 | ) | (3 | ) | ||||
|
Total National American University Holdings, Inc. stockholders' equity
|
52,634 | 51,341 | ||||||
|
Non-controlling interest
|
(108 | ) | (146 | ) | ||||
|
Total stockholders' equity
|
52,526 | 51,195 | ||||||
|
TOTAL
|
$ | 86,544 | $ | 88,457 | ||||
6
The following table provides a reconciliation of net income attributable to the Company to EBITDA:
|
Three Months Ended
May 31,
|
Year Ended
May 31,
|
|||||||||||||||
|
2015
|
2014
|
2015
|
2014
|
|||||||||||||
|
(dollars in thousands)
|
||||||||||||||||
|
Net Income attributable to the Company
|
$ | 256 | $ | 1,335 | $ | 6,716 | $ | 3,485 | ||||||||
|
Income (Loss) attributable to non-controlling interest
|
12 | 9 | 38 | (17 | ) | |||||||||||
|
Interest Income
|
(20 | ) | (20 | ) | (148 | ) | (142 | ) | ||||||||
|
Interest Expense
|
220 | 203 | 891 | 770 | ||||||||||||
|
Income Taxes
|
509 | 909 | 4,433 | 2,306 | ||||||||||||
|
Depreciation and Amortization
|
1,491 | 1,622 | 6,127 | 6,356 | ||||||||||||
|
EBITDA
|
$ | 2,468 | $ | 4,058 | $ | 18,057 | $ | 12,758 | ||||||||
EBITDA consists of income attributable to the Company, less income from non-controlling interest, plus loss from non-controlling interest, minus interest income, plus interest expense (which is not related to any debt but to the accounting required for the capital lease), plus income taxes, plus depreciation and amortization. The Company uses EBITDA as a measure of operating performance. However, EBITDA is not a recognized measurement under U.S. generally accepted accounting principles, or GAAP, and when analyzing its operating performance, investors should use EBITDA in addition to, and not as an alternative for, income as determined in accordance with GAAP. Because not all companies use identical calculations, the Company’s presentation of EBITDA may not be comparable to similarly titled measures of other companies and is therefore limited as a comparative measure. Furthermore, as an analytical tool, EBITDA has additional limitations, including that (a) it is not intended to be a measure of free cash flow, as it does not consider certain cash requirements such as tax payments; (b) it does not reflect changes in, or cash requirements for, its working capital needs; and (c) although depreciation and amortization are non-cash charges, the assets being depreciated and amortized often will have to be replaced in the future, and EBITDA does not reflect any cash requirements for such replacements, or future requirements for capital expenditures or contractual commitments. To compensate for these limitations, the Company evaluates its profitability by considering the economic effect of the excluded expense items independently as well as in connection with its analysis of cash flows from operations and through the use of other financial measures.
The Company believes EBITDA is useful to an investor in evaluating its operating performance because it is widely used to measure a company’s operating performance without regard to certain non-cash expenses (such as depreciation and amortization) and expenses that are not reflective of its core operating results over time. The Company believes EBITDA presents a meaningful measure of corporate performance exclusive of its capital structure, the method by which assets were acquired and non-cash charges, and provides us with additional useful information to measure its performance on a consistent basis, particularly with respect to changes in performance from period to period.
7