Attached files
| file | filename |
|---|---|
| EX-31.2 - EXHIBIT 31.2 - Ideal Power Inc. | v417351_ex31-2.htm |
| EX-10.1 - EXHIBIT 10.1 - Ideal Power Inc. | v417351_ex10-1.htm |
| EX-32.1 - EXHIBIT 32.1 - Ideal Power Inc. | v417351_ex32-1.htm |
| EX-31.1 - EXHIBIT 31.1 - Ideal Power Inc. | v417351_ex31-1.htm |
UNITED STATES
SECURITIES AND EXCHANGE COMMISSION
Washington, D.C. 20549
FORM 10-Q
(Mark One)
| x | QUARTERLY REPORT PURSUANT TO SECTION 13 OR 15(d) OF THE SECURITIES EXCHANGE ACT OF 1934 |
For the quarterly period ended June 30, 2015
OR
| o | TRANSITION REPORT PURSUANT TO SECTION 13 OR 15(d) OF THE SECURITIES EXCHANGE ACT OF 1934 |
For the transition period from ______________ to _______________
Commission File Number 001-36216
IDEAL POWER INC.
(Exact name of registrant as specified in its charter)
| Delaware | 14-1999058 | |
| (State or other jurisdiction of | (I.R.S. Employer | |
| incorporation or organization) | Identification No.) |
4120 Freidrich Lane, Suite 100
Austin, Texas 78744
(Address of principal executive offices)
(Zip Code)
(512) 264-1542
(Registrant’s telephone number, including area code)
(Former name, former address and former fiscal year, if changed since last report)
Indicate by check mark whether the registrant (1) has filed all reports required to be filed by Section 13 or 15(d) of the Securities Exchange Act of 1934 during the preceding 12 months (or for such shorter period that the registrant was required to file such reports), and (2) has been subject to such filing requirements for the past 90 days. Yes x No o
Indicate by check mark whether the registrant has submitted electronically and posted on its corporate Web site, if any, every Interactive Data File required to be submitted and posted pursuant to Rule 405 of Regulation S-T (§232.405 of this chapter) during the preceding 12 months (or for such shorter period than the registrant was required to submit and post such files). Yes x No o
Indicate by check mark whether the registrant is a large accelerated filer, an accelerated filer, or a non-accelerated filer. See definition of “accelerated filer,” and “large accelerated filer” and “smaller reporting company” in Rule 12b-2 of the Exchange Act. (Check one):
| Large accelerated filer o | Accelerated filer o | |
| Non-accelerated filer o | Smaller reporting company x | |
| (Do not check if a smaller reporting company) |
Indicate by check mark whether the registrant is a shell company (as defined in Rule 12b-2 of the Exchange Act). Yes o No x
As of August 10, 2015, the issuer had 9,352,263 shares of common stock, par value $.001, issued and outstanding.
TABLE OF CONTENTS
| 2 |
| ITEM 1. | CONDENSED FINANCIAL STATEMENTS |
Balance Sheets
| June 30, | December 31, | |||||||
| 2015 | 2014 | |||||||
| (unaudited) | ||||||||
| ASSETS | ||||||||
| Current assets: | ||||||||
| Cash and cash equivalents | $ | 19,965,791 | $ | 7,912,011 | ||||
| Accounts receivable, net | 757,464 | 446,521 | ||||||
| Inventories, net | 665,481 | 251,338 | ||||||
| Prepayments and other current assets | 286,368 | 263,605 | ||||||
| Total current assets | 21,675,104 | 8,873,475 | ||||||
| Property and equipment, net | 616,993 | 374,376 | ||||||
| Patents, net | 1,095,090 | 1,012,964 | ||||||
| Other non-current assets | 17,920 | 17,920 | ||||||
| Total assets | $ | 23,405,107 | $ | 10,278,735 | ||||
| LIABILITIES AND STOCKHOLDERS’ EQUITY | ||||||||
| Current liabilities: | ||||||||
| Accounts payable | $ | 1,154,813 | $ | 441,636 | ||||
| Accrued expenses | 881,031 | 773,119 | ||||||
| Total current liabilities | 2,035,844 | 1,214,755 | ||||||
| Commitments | ||||||||
| Stockholders’ equity: | ||||||||
| Common stock, $0.001 par value; 50,000,000 shares authorized; 9,345,263 and 7,048,235 shares issued and outstanding at June 30, 2015 and December 31, 2014, respectively | 9,345 | 7,048 | ||||||
| Additional paid-in capital | 49,500,394 | 32,712,020 | ||||||
| Treasury stock | (2,657 | ) | (2,657 | ) | ||||
| Accumulated deficit | (28,137,819 | ) | (23,652,431 | ) | ||||
| Total stockholders’ equity | 21,369,263 | 9,063,980 | ||||||
| Total liabilities and stockholders’ equity | $ | 23,405,107 | $ | 10,278,735 | ||||
The accompanying notes are an integral part of these condensed financial statements.
| 3 |
Statements of Operations
(unaudited)
| Three Months Ended | Six Months Ended | |||||||||||||||
| June 30, | June 30, | |||||||||||||||
| 2015 | 2014 | 2015 | 2014 | |||||||||||||
| Revenues: | ||||||||||||||||
| Products | $ | 1,199,037 | $ | 444,100 | $ | 2,397,028 | $ | 552,600 | ||||||||
| Grants | - | 116,426 | - | 299,021 | ||||||||||||
| Total revenue | 1,199,037 | 560,526 | 2,397,028 | 851,621 | ||||||||||||
| Cost of revenues: | ||||||||||||||||
| Products | 1,056,138 | 440,972 | 2,075,639 | 635,313 | ||||||||||||
| Grant research and development costs | - | 129,362 | - | 332,245 | ||||||||||||
| Total cost of revenue | 1,056,138 | 570,334 | 2,075,639 | 967,558 | ||||||||||||
| Gross profit (loss) | 142,899 | (9,808 | ) | 321,389 | (115,937 | ) | ||||||||||
| Operating expenses: | ||||||||||||||||
| Research and development | 1,100,348 | 645,335 | 2,092,580 | 954,898 | ||||||||||||
| General and administrative | 968,364 | 718,287 | 1,879,141 | 1,463,255 | ||||||||||||
| Sales and marketing | 371,228 | 261,528 | 844,180 | 529,747 | ||||||||||||
| Total operating expenses | 2,439,940 | 1,625,150 | 4,815,901 | 2,947,900 | ||||||||||||
| Loss from operations | (2,297,041 | ) | (1,634,958 | ) | (4,494,512 | ) | (3,063,837 | ) | ||||||||
| Interest income | 4,651 | 7,394 | 9,124 | 15,531 | ||||||||||||
| Net loss | $ | (2,292,390 | ) | $ | (1,627,564 | ) | $ | (4,485,388 | ) | $ | (3,048,306 | ) | ||||
| Net loss per share – basic and fully diluted | $ | (0.28 | ) | $ | (0.23 | ) | $ | (0.59 | ) | $ | (0.44 | ) | ||||
| Weighted average number of shares outstanding – basic and fully diluted | 8,103,475 | 7,011,465 | 7,582,362 | 7,005,319 | ||||||||||||
The accompanying notes are an integral part of these condensed financial statements.
| 4 |
Statements of Cash Flows
(unaudited)
| Six Months Ended | ||||||||
| June 30, | ||||||||
| 2015 | 2014 | |||||||
| Cash flows from operating activities: | ||||||||
| Net loss | $ | (4,485,388 | ) | $ | (3,048,306 | ) | ||
| Adjustments to reconcile net loss to net cash used in operating activities: | ||||||||
| Allowance for doubtful accounts | 54,791 | - | ||||||
| Write-down of inventory | (6,430 | ) | - | |||||
| Depreciation and amortization | 80,940 | 19,711 | ||||||
| Write-off of capitalized software | 45,641 | - | ||||||
| Write-off of capitalized patents | 103,289 | - | ||||||
| Stock-based compensation | 666,434 | 379,282 | ||||||
| Fair value of warrants issued for services | 50,940 | 67,920 | ||||||
| Decrease (increase) in operating assets: | ||||||||
| Accounts receivable | (365,734 | ) | (152,602 | ) | ||||
| Inventories | (423,740 | ) | 272,724 | |||||
| Prepaid expenses | (22,763 | ) | 22,734 | |||||
| Increase (decrease) in operating liabilities: | ||||||||
| Accounts payable | 713,177 | (195,648 | ) | |||||
| Accrued expenses | 107,912 | 130,198 | ||||||
| Net cash used in operating activities | (3,480,931 | ) | (2,503,987 | ) | ||||
| Cash flows from investing activities: | ||||||||
| Purchase of property and equipment | (343,208 | ) | (233,971 | ) | ||||
| Acquisition of patents | (195,378 | ) | (254,809 | ) | ||||
| Net cash used in investing activities | (538,586 | ) | (488,780 | ) | ||||
| Cash flows from financing activities: | ||||||||
| Net proceeds from issuance of common stock | 15,924,405 | - | ||||||
| Exercise of options and warrants | 148,892 | 4,990 | ||||||
| Net cash provided by financing activities | 16,073,297 | 4,990 | ||||||
| Net increase (decrease) in cash and cash equivalents | 12,053,780 | (2,987,777 | ) | |||||
| Cash and cash equivalents at beginning of period | 7,912,011 | 14,137,097 | ||||||
| Cash and cash equivalents at end of period | $ | 19,965,791 | $ | 11,149,320 | ||||
The accompanying notes are an integral part of these condensed financial statements.
| 5 |
Notes to Financial Statements
(unaudited)
Note 1 – Organization and Description of Business
Ideal Power Inc. (the “Company”) was incorporated in Texas on May 17, 2007 under the name Ideal Power Converters, Inc. The Company changed its name to Ideal Power Inc. on July 8, 2013 and re-incorporated in Delaware on July 15, 2013. With headquarters in Austin, Texas, it develops power conversion solutions with an initial focus on stand-alone commercial and industrial grid storage, combined solar and storage, and microgrid applications. The principal products of the Company are power conversion systems, including dual-port and multi-port battery converters.
Since its inception, the Company has generated limited revenues from the sale of products and has financed its research and development efforts and operations primarily through the sale of common stock, US Department of Energy grants and, prior to its initial public offering, issuance of convertible debt.
Note 2 – Summary of Significant Accounting Policies
Basis of Presentation
The accompanying unaudited financial statements have been prepared in accordance with the rules and regulations of the Securities and Exchange Commission for Form 10-Q. Accordingly, certain information and footnote disclosures normally included in financial statements prepared in accordance with generally accepted accounting principles have been condensed or omitted pursuant to such rules and regulations. The balance sheet at December 31, 2014 has been derived from the Company’s audited financial statements. Certain prior period amounts have been reclassified to conform to the current period presentation. These changes had no impact on total revenue, loss from operations or net loss.
In the opinion of management, these financial statements reflect all normal recurring and other adjustments necessary for a fair presentation. These financial statements should be read in conjunction with the audited financial statements included in the Company’s Annual Report on Form 10-K for the year ended December 31, 2014. Operating results for interim periods are not necessarily indicative of operating results for an entire fiscal year or any other future periods.
Use of Estimates
The preparation of financial statements in conformity with US GAAP requires management to make certain estimates and assumptions that affect the reported amounts of assets and liabilities and disclosure of contingent assets and liabilities at the date of the financial statements and the reported amounts of revenues and expenses during the reporting period. Actual results could differ from those estimates.
Cash and Cash Equivalents
The Company considers all highly liquid investments purchased with an original maturity of three months or less to be cash equivalents.
Accounts Receivable
Trade accounts receivable are stated net of an allowance for doubtful accounts. The Company performs ongoing credit evaluations of its customers’ financial condition. In limited instances, the Company may require an upfront deposit and, in most cases, the Company does charge interest on past due amounts. Management estimates the allowance for doubtful accounts based on review and analysis of specific customer balances that may not be collectible and how recently payments have been received. Accounts are considered for write-off when they become past due and when it is determined that the probability of collection is remote.
| 6 |
Inventories
Inventories are stated at the lower of cost (first in, first out method) or market value. Inventory quantities on hand are reviewed regularly and a write-down for excess and obsolete inventory is recorded based primarily on an estimated forecast of product demand, market conditions and planned design changes.
Property and Equipment
Property and equipment are stated at historical cost less accumulated depreciation and amortization. Major additions and improvements are capitalized while maintenance and repairs that do not improve or extend the useful life of the respective asset are expensed. Depreciation and amortization of property and equipment is computed using the straight-line method over the estimated useful lives. Leasehold improvements are amortized over the shorter of the life of the asset or the related leases. Estimated useful lives of the principal classes of assets are as follows:
| Leasehold improvements | Up to 4 years |
| Machinery and equipment | 5 years |
| Furniture, fixtures, software and computers | 3-5 years |
Patents
Patents are recorded at cost. The Company capitalizes third party legal costs and filing fees associated with obtaining patents on its new discoveries. Once the patents have been issued, the Company amortizes these costs over the shorter of the legal life of the patent or its estimated economic life, generally 20 years, using the straight-line method.
Impairment of Long-Lived Assets
The long-lived assets held and used by the Company are reviewed for impairment no less frequently than annually or whenever events or changes in circumstances indicate that the carrying amount of an asset may not be recoverable. In the event that facts and circumstances indicate that the cost of any long-lived assets may be impaired, an evaluation of recoverability is performed.
Fair Value of Financial Instruments
Fair value is the price that would be received to sell an asset or paid to transfer a liability in an orderly transaction between market participants at the measurement date. Assets and liabilities measured at fair value are categorized based on whether or not the inputs are observable in the market and the degree that the inputs are observable. The categorization of financial assets and liabilities within the valuation hierarchy is based upon the lowest level of input that is significant to the fair value measurement.
The Company’s financial instruments primarily consist of cash and cash equivalents, accounts receivable and accounts payable. As of the balance sheet dates, the estimated fair values of the financial instruments were not materially different from their carrying values as presented on the balance sheets. This is primarily attributed to the short maturities of these instruments. The Company did not identify any other non-recurring assets and liabilities that are required to be presented in the balance sheets at fair value.
| 7 |
Revenue Recognition
Revenue from product sales is recognized when the risks of loss and title pass to the customer, as specified in (1) the respective sales agreements and (2) other revenue recognition criteria as prescribed by Staff Accounting Bulletin (“SAB”) No. 101 (SAB 101), “Revenue Recognition in Financial Statements,” as amended by SAB No. 104, “Revenue Recognition”. The Company generally sells its products FOB shipping and recognizes revenue when products are shipped.
Historically, the Company received payments from government entities in the form of government grants. Government grants are agreements that generally provide the Company with cost reimbursement for certain types of research and development activities over a contractually defined period. Revenues from government grants are recognized in the period during which the Company incurs the related costs, provided that the Company has incurred the cost in accordance with the specifications and work plans determined between the Company and the government entity. Costs incurred related to the grants are recorded as grant research and development costs. At December 31, 2014, we had recognized all grant revenues related to the ARPA-E grant and no grant revenue was recognized in the three and six months ended June 30, 2015. Grant receivables were $132,227 at December 31, 2014 and were included in accounts receivable. At June 30, 2015, all outstanding grant receivables had been collected.
Product Warranties
The Company generally provides a ten year manufacturer’s warranty covering product defects. Accruals for product warranties are estimated based upon limited historical warranty experience, engineering experience and judgment, and an assessment of the reliability of the Company’s products. Accruals for product warranties are recorded in cost of revenues at the time revenue is recognized in order to match revenues with related expenses. The Company assesses the adequacy of its estimated warranty liability quarterly and adjusts the reserve, included in accrued expenses, as necessary.
Research and Development
Grant research and development are costs incurred solely related to grant revenues, and are classified as a line item under cost of revenues. Other research and development costs are presented as a line item under operating expenses and are expensed as incurred. Total research and development costs incurred during the three and six months ended June 30, 2015 amounted to $1,100,348 and $2,092,580. Total research and development costs incurred during the three and six months ended June 30, 2014 amounted to $774,697 and $1,287,143, inclusive of $129,362 and $332,245 related to grant research which was included in cost of revenues.
Income Taxes
The Company accounts for income taxes using an asset and liability approach which allows for the recognition and measurement of deferred tax assets based upon the likelihood of realization of tax benefits in future years. Under the asset and liability approach, deferred taxes are provided for the net tax effects of temporary differences between the carrying amounts of assets and liabilities for financial reporting purposes and the amounts used for income tax purposes. A valuation allowance is provided for deferred tax assets if it is more likely than not these items will either expire before the Company is able to realize their benefits, or that future deductibility is uncertain. At June 30, 2015 and December 31, 2014, the Company has established a full reserve against all deferred tax assets.
Tax benefits from an uncertain tax position are recognized only if it is more likely than not that the tax position will be sustained on examination by the taxing authorities based on the technical merits of the position. The tax benefits recognized in the financial statements from such a position are measured based on the largest benefit that has a greater than 50 percent likelihood of being realized upon ultimate resolution.
| 8 |
Net Loss Per Share
The Company applies FASB ASC 260, “Earnings per Share.” Basic earnings (loss) per share is computed by dividing earnings (loss) available to common stockholders by the weighted-average number of common shares outstanding. Diluted earnings (loss) per share is computed similar to basic earnings (loss) per share except that the denominator is increased to include additional common shares available upon exercise of stock options and warrants using the treasury stock method. In periods with a net loss, no common share equivalents are included because their effect would be anti-dilutive. At June 30, 2015 and 2014, potentially dilutive shares outstanding amounted to 2,883,205 and 2,405,545, respectively.
Stock Based Compensation
The Company applies FASB ASC 718, “Stock Compensation,” when recording stock based compensation. The fair value of each stock option award is estimated on the date of grant using the Black-Scholes option valuation model. The assumptions used in the Black-Scholes valuation model are as follows:
Grant Price - The grant price of the issuances are determined based on the closing share price on the date of grant.
Risk-free interest rate - The risk free interest rate is based on the implied yield available on US Treasury securities at the time of grant with an equivalent term of the expected life of the award.
Expected lives - As permitted by SAB 107, due to the Company's insufficient history of option activity, the Company utilizes the simplified approach to estimate the options’ expected term, calculated as the midpoint between the vesting period and the contractual life of the award.
Expected volatility – Volatility is determined based on management's estimate or historical volatilities of comparable companies.
Expected dividend yield – Dividend yield is based on current yield at the grant date or the average dividend yield over the historical period. The Company has never declared or paid dividends and has no plans to do so in the foreseeable future.
The Company accounts for stock issued to non-employees in accordance with the provisions of FASB ASC 505-50 “Equity Based Payments to Non-Employees.” FASB ASC 505-50 states that equity instruments that are issued in exchange for the receipt of goods or services should be measured at the fair value of the consideration received or the fair value of the equity instruments issued, whichever is more reliably measurable. The measurement date occurs as of the earlier of (a) the date at which a performance commitment is reached or (b) absent a performance commitment, the date at which the performance necessary to earn the equity instruments is complete (that is, the vesting date).
Presentation of Sales Taxes
Certain states impose a sales tax on the Company’s sales to nonexempt customers. The Company collects that sales tax from customers and remits the entire amount to the states. The Company’s accounting policy is to exclude the tax collected and remitted to the states from revenues and cost of revenues.
Concentration of Credit Risk
Financial instruments that potentially subject the Company to concentrations of credit risk consist primarily of cash, accounts receivable and accounts payable. The Company maintains its cash with a major financial institution located in the United States. Balances are insured by the Federal Deposit Insurance Corporation up to $250,000. The Company maintains balances in excess of federally insured limits. The Company has not experienced losses in such accounts and believes it is not exposed to significant credit risk regarding its cash and cash equivalents.
| 9 |
The Company encounters a certain amount of risk as a result of a concentration of revenue from a few significant customers. Credit is extended to customers based on an evaluation of their financial condition. In limited instances, the Company may require an upfront deposit and, in most cases, the Company does charge interest on past due amounts. The Company performs ongoing credit evaluations of its customers and records an allowance for potential bad debts based on available information.
The Company had revenue from three customers which accounted for 28%, 21% and 20% of net revenue for the three months ended June 30, 2015 and revenue from three customers which accounted for 36%, 21% and 17% of net revenue for the six months ended June 30, 2015. The Company had receivable balances from three customers that accounted for 78% of trade receivables at June 30, 2015.
Recent Accounting Pronouncements
In May 2014, the FASB issued ASU 2014-09, Revenue from Contracts with Customers (Topic 606), requiring an entity to recognize the amount of revenue to which it expects to be entitled for the transfer of promised goods or services to customers. The updated standard will replace most existing revenue recognition guidance in US GAAP when it becomes effective and permits the use of either the retrospective or cumulative effect transition method. Early adoption is not permitted. The updated standard becomes effective for annual and interim periods beginning after December 15, 2017. The adoption of the updated standard is not expected to have a significant effect on the Company’s financial statements.
Management does not believe that any other recently issued, but not yet effective, accounting standards, if adopted, will have a material effect on the financial statements.
Note 3 – Accounts Receivable
Accounts receivable, net consisted of the following:
| June 30, | December 31, | |||||||
| 2015 | 2014 | |||||||
| (unaudited) | ||||||||
| Trade receivables | $ | 717,382 | $ | 231,412 | ||||
| Grant receivables | - | 132,227 | ||||||
| Other receivables | 40,082 | 107,657 | ||||||
| 757,464 | 471,296 | |||||||
| Allowance for doubtful accounts | - | (24,775 | ) | |||||
| $ | 757,464 | $ | 446,521 | |||||
For the six months ended June 30, 2015, $79,566 of trade receivables from customers were written-off as it was determined that the probability of collection was remote, of which $24,775 had been reserved at December 31, 2014.
| 10 |
Note 4 – Inventories
Inventories, net consisted of the following:
| June 30, | December 31, | |||||||
| 2015 | 2014 | |||||||
| (unaudited) | ||||||||
| Raw materials | $ | 123,103 | $ | 143,289 | ||||
| Finished goods | 542,378 | 148,752 | ||||||
| 665,481 | 292,041 | |||||||
| Reserve for obsolescence | - | (40,703 | ) | |||||
| $ | 665,481 | $ | 251,338 | |||||
For the six months ended June 30, 2015, the Company recorded a $34,273 write-off of inventory, of which $14,079 had been reserved at December 31, 2014, and a favorable adjustment of $26,624 to eliminate the remaining reserve as it was determined that planned design changes that originally necessitated the establishment of the reserve would be delayed. There was no reserve for obsolescence at June 30, 2015.
Note 5 – Property and Equipment
Property and equipment, net consisted of the following:
| June 30, | December 31, | |||||||
| 2015 | 2014 | |||||||
| (unaudited) | ||||||||
| Machinery and equipment | $ | 440,807 | $ | 263,142 | ||||
| Building leasehold improvements | 212,243 | 48,280 | ||||||
| Furniture, fixtures, software and computers | 147,811 | 183,237 | ||||||
| 800,861 | 494,659 | |||||||
| Accumulated depreciation and amortization | (183,868 | ) | (120,283 | ) | ||||
| $ | 616,993 | $ | 374,376 | |||||
Note 6 – Patents
Patents, net consisted of the following:
| June 30, | December 31, | |||||||
| 2015 | 2014 | |||||||
| (unaudited) | ||||||||
| Patents | $ | 1,132,307 | $ | 1,040,219 | ||||
| Accumulated amortization | (37,217 | ) | (27,255 | ) | ||||
| $ | 1,095,090 | $ | 1,012,964 | |||||
For the six months ended June 30, 2015, capitalized patent costs of $103,289 were written off as the Company chose to discontinue pursuit of the associated patents. The expense associated with the write-offs is included in general and administrative expenses.
| 11 |
Note 7 – Accrued Expenses
Accrued expenses consisted of the following:
| June 30, | December 31, | |||||||
| 2015 | 2014 | |||||||
| (unaudited) | ||||||||
| Accrued compensation | $ | 499,150 | $ | 548,953 | ||||
| Warranty reserve | 268,488 | 143,364 | ||||||
| Other | 113,393 | 80,802 | ||||||
| $ | 881,031 | $ | 773,119 | |||||
Note 8 – Commitments
The Company has entered into a lease for 14,782 square feet of office and laboratory space located in Austin, Texas. The triple net lease has a term of 48 months and commenced on June 1, 2014. The annual base rent in the first year of the lease was $154,324 and increases by $3,548 in each succeeding year of the lease. In addition, the Company is required to pay its proportionate share of operating costs for the building. The Company has a one-time option to terminate the lease on May 31, 2017 with a termination payment of approximately $99,000 if it elects to exercise this option. Upon entering the lease agreement, the Company paid the landlord a security deposit of $35,840 that is to be repaid, provided the Company is not in default on any of its obligations under the lease, one-half after eighteen months and the remainder at the end of the lease term.
At June 30, 2015, the remaining annual base rent commitments under the lease, assuming no early termination, are as follows:
| Year Ended December 31, | Amount | |||
| 2015 | $ | 78,936 | ||
| 2016 | 159,941 | |||
| 2017 | 163,489 | |||
| 2018 | 68,736 | |||
| Total | $ | 471,102 | ||
The Company incurred rent expense of $53,166 and $26,886 for the three months ended June 30, 2015 and 2014, respectively. For the six months ended June 30, 2015 and 2014, the Company incurred rent expense of $107,377 and $36,773, respectively.
Note 9 – Common Stock
On May 20, 2015, the Company completed an underwritten follow-on offering of 2,225,825 shares, inclusive of the underwriter’s overallotment of 290,325 shares, of its common stock. Gross proceeds were $17.25 million before underwriting discounts and commissions. Net cash proceeds were approximately $15.9 million after offering fees and expenses, including the underwriting discount of approximately $1.0 million. The Company expects to utilize net proceeds from the offering for working capital and general corporate purposes.
| 12 |
Note 10 — Equity Incentive Plan
On May 17, 2013, the Company adopted the 2013 Equity Incentive Plan (the “Plan”) and reserved shares of common stock for issuance under the Plan, including stock options, stock awards and stock bonuses, not to exceed a maximum of 839,983 shares. The Plan is administered by the Compensation Committee of the Company’s Board of Directors. The persons eligible to participate in the Plan are employees (including officers), members of the Board of Directors, consultants and other independent advisors and contractors who provide services to the Company. Options issued under the Plan may have a term of up to ten years and may have variable vesting. The typical vesting schedule for stock options awarded under the Plan is a four year annual vesting schedule for employees and a one year quarterly vesting schedule for Board members.
On May 26, 2015, the shareholders approved an amendment to the Plan which increased shares available for issuance under the Plan by 1,250,000 shares. At June 30, 2015, there were 1,061,665 shares of common stock available for issuance under the Plan.
During the six months ended June 30, 2015, the Company granted 38,502 stock options to Board members and 48,200 stock options to employees. The estimated fair value of stock options granted under the Plan in the six months ended June 30, 2015, calculated using the Black-Scholes option valuation model, was $392,097, of which $88,956 was recognized during the six months ended June 30, 2015.
During the six months ended June 30, 2015, 58,203 options to purchase shares of the Company’s common stock were exercised. The Company issued 49,536 shares of common stock and 8,667 options were cancelled to satisfy the exercise price of options exercised on a cashless basis. Net proceeds received from option exercises were $148,892 during the six months ended June 30, 2015.
A summary of the Company’s stock option activity and related information is as follows:
| Stock Options | Weighted Average Exercise Price | Weighted Average Remaining Life (in years) | ||||||||||
| Outstanding at December 31, 2014 | 1,368,047 | $ | 6.41 | 8.7 | ||||||||
| Granted | 86,702 | $ | 8.15 | |||||||||
| Exercised | (58,203 | ) | $ | 4.01 | ||||||||
| Forfeited/Expired/Exchanged | (45,087 | ) | $ | 5.94 | ||||||||
| Outstanding at June 30, 2015 | 1,351,459 | $ | 6.64 | 7.9 | ||||||||
| Exercisable at June 30, 2015 | 441,252 | $ | 4.89 | 5.4 | ||||||||
At June 30, 2015, there was $3,223,451 of unrecognized compensation cost related to non-vested share-based compensation arrangements granted under the Plan. That cost is expected to be recognized over a weighted average period of 2.9 years.
| 13 |
Note 11 — Warrants
During the six months ended June 30, 2015, warrant holders exercised 32,362 warrants on a cashless basis and received 21,667 shares of common stock and 10,695 shares were used to cover the exercise price.
| Warrants | Weighted Average Exercise Price | |||||||
| Outstanding at December 31, 2014 | 1,564,108 | $ | 4.48 | |||||
| Granted | - | - | ||||||
| Exercised | (32,362 | ) | $ | 3.48 | ||||
| Forfeited/Expired/Exchanged | - | - | ||||||
| Outstanding at June 30, 2015 | 1,531,746 | $ | 4.50 | |||||
The shares underlying the warrants have not been registered. Warrants to purchase 12,000 shares of the Company’s common stock were unvested at June 30, 2015.
Note 12 — Resignation Agreement
On January 9, 2015, the Company entered into a Resignation and Release Agreement (the “Resignation Agreement”) with Paul Bundschuh, the Company’s former Chief Marketing Officer. Under the terms of the Resignation Agreement, Mr. Bundschuh is to receive the full severance benefits to which he would have been entitled under his employment agreement if he had been terminated without cause. In addition, 10,000 stock options previously issued to Mr. Bundschuh and scheduled to vest on December 31, 2015 were immediately vested upon execution of the Resignation Agreement and the Company recorded an expense of $26,067 related to the vesting of the options. The Company also recorded an accrual of $140,000 related to the Resignation Agreement. At June 30, 2015, the remaining balance was $33,181 and is included in accrued expenses.
| 14 |
SPECIAL NOTE REGARDING FORWARD-LOOKING STATEMENTS AND OTHER INFORMATION
CONTAINED IN THIS REPORT
This report contains forward-looking statements within the meaning of the Private Securities Litigation Reform Act of 1995 and the provisions of Section 27A of the Securities Act of 1933, as amended, and Section 21E of the Securities Exchange Act of 1934, as amended. Forward-looking statements give our current expectations or forecasts of future events. You can identify these statements by the fact that they do not relate strictly to historical or current facts. You can find many (but not all) of these statements by looking for words such as “approximates,” “believes,” “hopes,” “expects,” “anticipates,” “estimates,” “projects,” “intends,” “plans,” “would,” “should,” “could,” “may,” or other similar expressions in this report. In particular, these include statements relating to future actions, prospective products, applications, customers, technologies, future performance or results of anticipated products, expenses, and financial results. These forward-looking statements are subject to certain risks and uncertainties that could cause actual results to differ materially from our historical experience and our present expectations or projections. Factors that could cause actual results to differ from those discussed in the forward-looking statements include, but are not limited to:
| ● | our history of losses; |
| ● | our ability to achieve profitability; |
| ● | our limited operating history; |
| ● | emerging competition and rapidly advancing technology in our industry that may outpace our technology; |
| ● | customer demand for the products and services we develop; |
| ● | the impact of competitive or alternative products, technologies and pricing; |
| ● | our ability to meet development milestones and anticipated performance metrics for our bi-directional switch technologies; |
| ● | our ability to manufacture any products we develop; |
| ● | general economic conditions and events and the impact they may have on us and our potential customers; |
| ● | the adequacy of protections afforded to us by the patents that we own and the cost to us of maintaining, enforcing and defending those patents; |
| ● | our ability to obtain, expand and maintain patent protection in the future, and to protect our non-patented intellectual property; |
| ● | our exposure to and ability to defend third-party claims and challenges to our patents and other intellectual property rights; |
| ● | our ability to obtain adequate financing in the future, as and when we need it; |
| ● | our success at managing the risks involved in the foregoing items; and |
| ● | other factors discussed in this report. |
The forward-looking statements are based upon management’s beliefs and assumptions and are made as of the date of this report. We undertake no obligation to publicly update or revise any forward-looking statements included in this report. You should not place undue reliance on these forward-looking statements.
Unless otherwise stated or the context otherwise requires, the terms “Ideal Power,” “we,” “us,” “our” and the “Company” refer to Ideal Power Inc.
| 15 |
| ITEM 2. | MANAGEMENT’S DISCUSSION AND ANALYSIS OF FINANCIAL CONDITION AND RESULTS OF OPERATIONS |
The following discussion and analysis of our financial condition and results of operations should be read in conjunction with the financial statements and related notes included elsewhere in this Quarterly Report on Form 10-Q as well as our audited 2014 financial statements and related notes included in our Annual Report on Form 10-K. In addition to historical information, the discussion and analysis here and throughout this Form 10-Q contains forward-looking statements that involve risks, uncertainties and assumptions. Our actual results may differ materially from those anticipated in these forward-looking statements as a result of certain factors, including, but not limited, to those set forth under “Risk Factors” in Part II, Item 1A of this report.
OVERVIEW
Ideal Power is located in Austin, Texas. We design, market and sell electrical power conversion products using our proprietary technology called Power Packet Switching Architecture, or PPSA. Our PPSA technology enables high efficiency power conversion by eliminating many of the heavy, passive components used in conventional power conversion products and replacing them with a unique software-enabled topology. Our products are designed to be used in both on-grid and off-grid applications. We believe our products are the only transformer-less power converters with electrical isolation approved for use in on-grid applications. Our technology is protected by a patent portfolio of 26 US and four foreign issued patents. We own all of the rights to our PPSA technology.
We sell our products primarily to systems integrators for installation as part of a larger turn-key system providing the end user with a complete solution for managing their energy consumption. These customers sell systems that enable end users to manage their electricity consumption by reducing demand charges and integrating renewable energy sources. We also sell systems to commercial end users that enable them to reduce fossil fuel consumption and/or form their own microgrid. Our products are made by contract manufacturers to our specifications, enabling us to scale production to meet demand on a cost-effective basis without requiring significant expenditures on manufacturing facilities and equipment. Our existing products that connect to the power grid are UL 1741 certified, and we are in the process of getting new products UL 1741 certified.
The Company was founded on May 17, 2007. To date, operations have been funded primarily through the sale of common stock, US Department of Energy grants and, prior to its initial public offering, issuance of convertible debt. Total revenue generated from inception to date as of June 30, 2015 amounted to $8,474,224 with approximately a third of that revenue coming from government grants. The Company has applied these revenues to research and product development, thereby reducing its capital requirements. The Company may continue to pursue research and development grants, if and when available, for the purpose of developing new products and improving current products.
Our PPSA Technology
Our PPSA-based products provide the same electrical isolation as traditional, transformer-based power conversion systems. We believe our products are the only commercial transformer-less power conversion systems that provide the electrical isolation required to connect alternative energy sources and battery storage systems to the grid. Because our products use software-enabled technologies to replace the traditional transformer and other bulky, passive components used in traditional power conversion systems, our power conversion systems (“PCS”) are lighter, smaller and more efficient.
Our PPSA technology uses indirect power flow in which power flows through input switches and is temporarily stored in our proprietary AC link inductor. Our proprietary fast switching algorithms enable the transfer of quantum packets of power between ports in our system. As the AC link becomes charged, it disconnects from its input switches, resonates without being connected to either the input or output switches, and then reconnects to its output switches when it reaches the correct voltage and frequency for the application, providing true electrical isolation without the need for a transformer.
| 16 |
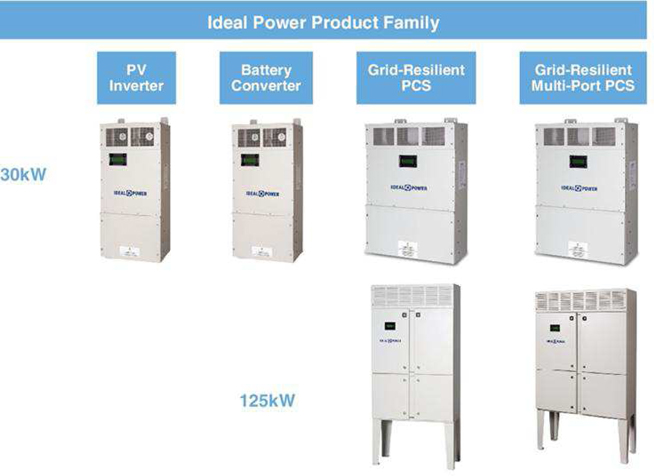
Existing Products
We have six products based on our PPSA technology. Each of these products is briefly described below:
| · | 30kW photovoltaic, or PV, Inverter, which has a UL 1741 certification and is intended to be used for commercial and industrial solar power installations. This is our first product and shares the same hardware as the Company’s 30kW battery converter described below but uses embedded software specific to a PV application. |
| · | 30kW Battery Converter, which has a UL 1741 certification and is intended to be used for the commercial and industrial grid-tied distributed energy storage market. This battery converter is bi-directional, which means power can flow to or from batteries. This product uses the same hardware design as the 30kW PV Inverter, but has embedded software that enables bi-directional power conversion and control. This product is more efficient and approximately only 1/4th to 1/8th the size and weight of similar transformer-based products. The 30kW Battery Converter also has a significantly lower acoustic noise profile and can be installed in buildings without the need for acoustic isolation or insulation. |
| · | 30kW grid-resilient AC-DC PCS, for which we received UL 1741 certification for grid-tied applications in June 2015. This product is able to convert to both 50Hz and 60Hz AC current and has the ability to form and manage a microgrid. This product is intended for customers who need a 30kW battery converter for use overseas or who need the additional capability to form a microgrid. This product is not a replacement for our 30kW battery converter but complements the existing product with additional features. |
| · | 30kW grid-resilient AC-DC-DC multi-port PCS with two DC ports enabling two DC inputs, such as a PV and a battery storage system, to be installed with one power converter. We received UL 1741 certification for grid-tied applications of this product in the June 2015. This product is capable of managing the conversion to both 50Hz and 60Hz AC current, enabling the ability to operate in grids outside of North America. This product also has the ability to form and manage a microgrid, effectively using energy storage with distributed generation resources to support critical loads or allow a building to disconnect from the utility power grid. This product received the “Electrical Energy Storage Award” for product innovation in 2014 at InterSolar, Germany, the world’s largest solar exhibition. |
| · | 125kW grid-resilient AC-DC PCS, for higher power applications. This 125kW system has over four times the power of the 30kW product and is also able to convert to both 50Hz and 60Hz AC current. This product is primarily for use in grid-tied applications, and we expect to receive its UL 1741 certification in the second half of 2015. It also has the ability to form and manage a microgrid. |
| · | 125kW grid-resilient AC-DC-DC multi-port PCS for higher power applications with multi-port capabilities. This 125kW system has over four times the power of the 30kW multi-port product and is also able to convert to both 50Hz and 60Hz AC current. This product has the ability to form and manage a microgrid. Because this product is intended primarily for off-grid and microgrid management applications, we do not intend to seek a UL 1741 certification for this product at this time. This product is currently in prototype production only with the first customer shipment in June 2015. |
| 17 |
The figure below illustrates this product family:
Strategy
Our strategy is to promote and expand the use of our PPSA technology through product development and product sales, including the licensing of our product designs to systems integrators and other original equipment manufacturers, or OEMs. We intend to target OEMs in the power conversion industry that serve markets and geographies that would be difficult or costly for us to pursue directly and which make complementary products that do not compete with us in our core markets or core product offerings.
Future Innovations
BD-IGBT
Our existing products incorporate multiple IGBTs, which are power switches used in the process to convert power from one current form to another. IGBTs switch power in only one direction (DC to AC or AC to DC) and require the use of a diode to prevent power from flowing back into the system. To enable our existing products to perform bi-directional power conversion, for each IGBT and diode used in our products, we must include a second IGBT and diode. These components result in a slight voltage drop that affects the electrical efficiency of our products and generate excess heat that must be dissipated. We are developing a bi-directional IGBT, or BD-IGBT, that we believe will allow us to substitute one BD-IGBT for two pairs of IGBTs and diodes used in our current products. Based on our software simulations, we believe that the BD-IGBTs can improve electrical efficiency from approximately 96.5% to greater than 98%, which would reduce the heat generated by the operation of our products. As a result, products incorporating BD-IGBTs will require less space for heat dissipation which would allow us to reduce our material costs. We believe that these development efforts, if successful, will enhance the competitive position of our products.
| 18 |
B-TRAN
During the course of our BD-IGBT development, we have come up with an alternative bi-directional switch concept to the BD-IGBT which we are calling the B-TRAN. This new bi-directional switch concept has the potential to meet or exceed the projected performance of the B-TRAN as validated by third party simulations. While our primary technology path for bi-directional switching remains the BD-IGBT, the B-TRAN device provides us an option with potentially higher performance. During the second quarter, the U.S. Patent Office awarded us five new patents covering the operation, control and manufacturing of the B-TRAN device. We intent to engage an additional semiconductor fabricator to produce a proof of concept of the B-TRAN device which will result in a significant increase in our research & development spending for the balance of 2015 and first quarter of 2016.
We expect that our intellectual property rights will continue to be a significant asset to us and our strategy is to actively pursue patent protection for our innovative technologies in the US and other commercially important global markets. We have 26 US and four foreign issued patents. We have filed numerous additional pending US, foreign and international patent applications.
Target Markets
We have focused our sales and marketing efforts on markets where we believe our technology has the most value. We focus on sales to commercial and industrial customers in which there is a need for power conversion systems to:
| · | manage consumption to reduce peak power demands; |
| · | integrate new sources of generation such as distributed PV; and |
| · | form microgrids. |
We believe our products provide compelling advantages to commercial or industrial customers who have these needs due to the reduced weight, compact size, quiet operation, high efficiency and reliability, and advanced programmability of our products compared to traditional power conversion systems.
According to Yole Development, or Yole, a global research firm specializing in the scientific and power electronics markets, the global power conversion market was approximately $50 billion in 2014 and is forecast to grow to over $70 billion by 2020.
Battery and Microgrid Power Conversion Market
Battery Energy Storage Systems, or BESS, are blocks of batteries coupled with a power conversion system to enable electric power to be captured and stored for future use. These grid-tied systems can be large, megawatt-scale systems operated by utilities to better manage their system resources, or small, kilowatt-scale systems in homes and businesses designed to enable consumers to manage their power use and mitigate utility imposed demand charges. In certain US markets, such as California, New York, and Massachusetts, there are economic incentives available to commercial and industrial consumers in the form of reduced demand charges for installing a BESS and reducing peak consumption. There is also emerging regulatory policy that is driving the adoption of energy storage. For example, California has issued a mandate for over 1,000 megawatts of new energy storage to be installed by 2020, and currently offers attractive rebates to end users who install a BESS through its Self-Generation Incentive Program.
Typically, PV systems are connected to the utility power grid so customers can continue to receive power from the utility to augment their PV systems and, in some cases, to sell power back to the utility. As a as result, when the utility power grid becomes unavailable or experiences a blackout, the PV system is prevented by design from generating power to avoid damaging grid equipment or creating a safety hazard. Our grid-resilient multi-port power conversion systems are designed to address this problem by enabling a solar PV system with a BESS to operate and be managed as a local microgrid even when the utility grid is down. In addition, our grid-resilient multi-port power conversion systems work with other energy sources, such as a diesel generator coupled with a BESS.
| 19 |
We sell a number of our products to BESS integrators, such as Gexpro Energy Solutions, Sharp Electronics, CODA Energy, Green Charge Networks and EOS Energy Storage.
Commercial and industrial BESS are used for more than peak demand reduction. IHS, a global research firm, forecasts that global installations of grid-tied commercial BESS coupled with PV, a subset of the battery and microgrid market, will grow 111% annually to over 600 MW of BESS by 2018.
Other Microgrid Applications
We believe, based on our analysis of market characteristics including existing grid infrastructure, high diesel fuel costs, good solar irradiance, and projected population growth, regions such as Southeast Asia, Africa, the Middle East, and Central and South America will have increasing demand for new power generation capacity. Remote communities with limited infrastructure in these regions depend more on expensive diesel fuel to generate electricity and may not have a utility power grid for access to high quality, reliable power. As a result, we believe that these less developed countries represent a significant opportunity for our grid-resilient products. IHS has predicted that the market for off-grid and microgrid BESS installations with PV will reach 400MW by 2018 with the majority of this growth coming from regions with less developed electricity infrastructure.
Other Markets
In addition to the markets discussed above, we believe there are other potential market opportunities for our power conversion systems. As an example, we have provided power conversion systems to NRG Energy, Inc. for a California Public Utility Commission-approved technology demonstration program to reduce the installation and operational costs of DC charging infrastructure for electric vehicles and, in September 2014, NRG purchased two of our 30kW battery converters for installation at a demonstration site at the University of California San Diego. Additionally, we shipped our first order for the commercial wind turbine market in September 2014. We believe our PPSA technology can also be used in other verticals within the global power conversion market.
Critical Accounting Policies
There have been no significant changes during the three and six months ended June 30, 2015 to the critical accounting policies disclosed in Management’s Discussion and Analysis of Financial Condition and Results of Operations in our Annual Report on Form 10-K for the fiscal year ended December 31, 2014.
| 20 |
Results of Operations
Comparison of the three months ended June 30, 2015 to the three months ended June 30, 2014
Revenues. Revenues for the three months ended June 30, 2015 of $1,199,037 were $638,511, or 114%, higher than the $560,526 we earned in revenues for the three months ended June 30, 2014. The increase was due to a $754,937 increase in product revenues, primarily associated with sales of our 30kW Battery Converter but also including sales of our grid-resilient 30kW PCS and 125kW products.
There were no grant revenues for the three months ended June 30, 2015, as compared to grant revenues for the three months ended June 30, 2014 of $116,426. At December 31, 2014, we had recognized all grant revenues related to the ARPA-E grant.
Cost of Revenues. Cost of revenues increased for the three months ended June 30, 2015 to $1,056,138 compared to $570,334 for the three months ended June 30, 2014 due to $615,166 increase in product cost of revenue partially offset by a $129,362 decrease in grant research and development costs. The increase was primarily due to higher unit sales volumes compared to the three months ended June 30, 2014, as well as costs associated with the production of new products in low volume and higher personnel costs. The decrease in grant research and development costs is due to the ARPA-E grant being fully funded at December 31, 2014.
Gross Profit (Loss). Gross profit for the three months ended June 30, 2015 was $142,899 compared to a gross loss for the three months ended June 30, 2014 of $9,808. Our gross profit improvement was due to the impact of $754,937 of higher product sales compared to the three months June 30, 2014 and was partly offset by costs associated with the production of new products in low volume and increased personnel costs.
Research and Development Expenses. Research and development expenses increased by $455,013, or 71%, to $1,100,348 in the three months ended June 30, 2015 from $645,335 in the three months ended June 30, 2014. The increase was due to incremental costs associated with advanced power switch development of $195,212, higher personnel costs of $176,033, higher development costs for new products, including our grid-resilient 30kW 2 port and multi-port PCS and 125kW 2 port and multi-port PCS, of $87,696, higher product certification costs of $34,833, and higher stock-based compensation of $32,239, partly offset by lower contract labor of $106,183. The costs related to advanced power switch development increased as we are self-funding these efforts going forward after fully utilizing the ARPA-E grant program funding in December 2014.
General and Administrative Expenses. General and administrative expenses increased by $250,077, or 35%, to $968,364 in the three months ended June 30, 2015 from $718,287 in the three months ended June 30, 2014. The increase was due primarily to higher stock-based compensation of $101,607, higher personnel costs of $60,171 and higher legal and patent fees of $55,214 compared to the three months ended June 30, 2014. In addition, we also wrote off $45,641 of capitalized software costs in the three months ended June 30, 2015.
Sales and Marketing Expenses. Sales and marketing expenses increased by $109,700, or 42%, to $371,228 in the three months ended June 30, 2015 from $261,528 in the three months ended June 30, 2014. The increase was due primarily to bad debt expense of $54,333 and higher contract labor costs of $30,739.
Loss from Operations. Due to the increase in our operating expense, which was partially offset by our gross profit, our loss from operations for the three months ended June 30, 2015 was $2,297,041 or 40% higher than the $1,634,958 loss from operations for the three months ended June 30, 2014.
Interest Income. Interest income decreased to $4,651 for the three months ended June 30, 2015 compared to $7,394 for the three months ended June 30, 2014.
| 21 |
Net Loss. As a result of a higher loss from operations, our net loss for the three months ended June 30, 2015, was $2,292,390 as compared to a net loss of $1,627,564 for the three months ended June 30, 2014.
Comparison of the six months ended June 30, 2015 to the six months ended June 30, 2014
Revenues. Revenues for the six months ended June 30, 2015 of $2,397,028 were $1,545,407, or 181%, higher than the $851,621 we earned in revenues for the six months ended June 30, 2014. The increase in revenue was driven by a $1,844,428 increase in product revenues, primarily associated with sales of our 30kW Battery Converter.
There were no grant revenues for the six months ended June 30, 2015, as compared to grant revenues for the six months ended June 30, 2014 of $299,021. At December 31, 2014, we had recognized all grant revenues related to the ARPA-E grant.
Cost of Revenues. Cost of revenues increased for the six months ended June 30, 2015, to $2,075,639 compared to $967,558 for the six months ended June 30, 2014 due to $1,440,326 increase in product cost of revenue partially offset by a $332,245 decrease in grant research and development costs. The increase was primarily due to higher unit sales volumes compared to the six months ended June 30, 2014, as well as higher personnel costs of $117,062. The decrease in grant research and development costs is due to the ARPA-E grant being fully funded at December 31, 2014.
Gross Profit (Loss). Gross profit for the six months ended June 30, 2015 was $321,389 compared to a gross loss for the six months ended June 30, 2014 of $115,937. Our gross profit was due to the impact of $1,844,428 of higher product sales compared to the six months June 30, 2014. Gross profit was negatively impacted by increased supply chain and engineering personnel costs, as we added resources to support our existing products, and incremental costs associated with the initial roll-out of new products at low volume.
Research and Development Expenses. Research and development expenses increased by $1,137,682, or 119%, to $2,092,580 in the six months ended June 30, 2015 from $954,898 in the six months ended June 30, 2014. The increase was due to incremental costs associated with advanced power switch development of $378,765, higher personnel costs of $375,705, higher development costs for new products, including our grid-resilient 30kW 2 port and multi-port PCS and 125kW 2 port and multi-port PCS, of $254,910, higher product certification costs of $84,327, and higher stock-based compensation of $73,934, partly offset by lower contract labor of $89,741. The costs related to advanced power switch development increased as we are self-funding these efforts going forward after fully utilizing the ARPA-E grant program funding in December 2014.
General and Administrative Expenses. General and administrative expenses increased by $415,886, or 28%, to $1,879,141 in the six months ended June 30, 2015 from $1,463,255 in the six months ended June 30, 2014. The increase was due primarily to higher stock-based compensation of $197,304, higher legal and patent fees of $113,308, and higher personnel costs of $112,955 compared to the six months ended June 30, 2014. In addition, we wrote off $45,641 of capitalized software costs in the six months ended June 30, 2015.
Sales and Marketing Expenses. Sales and marketing expenses increased by $314,433, or 59%, to $844,180 in the six months ended June 30, 2015 from $529,747 in the six months ended June 30, 2014. The increase was due primarily to severance costs of $139,955, higher contract labor costs of $67,399, bad debt expense of $54,791 and personnel costs of $27,404 compared to the six months ended June 30, 2014.
Loss from Operations. Due to the increase in our operating expense which is partially offset by our gross profit, our loss from operations for the six months ended June 30, 2015 was $4,494,512 or 47% higher than the $3,063,837 loss from operations for the six months ended June 30, 2014.
Interest Income. Interest income decreased to $9,124 for the six months ended June 30, 2015 compared to $15,531 for the six months ended June 30, 2014.
Net Loss. As a result of a higher loss from operations, our net loss for the six months ended June 30, 2015, was $4,485,388 as compared to a net loss of $3,048,306 for the six months ended June 30, 2014.
| 22 |
Liquidity and Capital Resources
Although our revenues have increased every full calendar year from the date of our inception, we do not generate enough revenue to sustain our operations. Currently, our revenues are derived from the sales of our products. We have primarily funded our operations through the sale of common stock, government grants and, prior to our initial public offering, issuance of convertible debt.
At June 30, 2015, we had cash and cash equivalents of $19,965,791. Our net working capital and long-term debt at June 30, 2015 were $19,639,260 and $0, respectively.
Operating activities in the six months ended June 30, 2015 resulted in cash outflows of $3,480,931, which were due primarily to the net loss for the period of $4,485,388, partly offset by non-cash items of $995,605, related primarily to stock-based compensation of $666,434, write-off of capitalized software and patent costs of $148,930 and depreciation and amortization of $80,940, and positive working capital changes of $8,852. Operating activities in the six months ended June 30, 2014 resulted in cash outflows of $2,503,987, which were due to the net loss for the period of $3,048,306 partially offset by non-cash items of $466,913, related primarily to stock-based compensation of $379,282, and positive working capital changes of $77,406.
Investing activities in the six months ended June 30, 2015 and 2014 resulted in cash outflows of $538,586 and $488,780, respectively, for development of patents and acquisition of fixed assets.
Financing activities in the six months ended June 30, 2015 resulted in cash inflows of $16,073,297, related primarily to the issuance of 2,225,825 shares of common stock shares at a public offering price of $7.75. Net cash proceeds after offering-related expenses were $15,924,405. In addition, we received $148,892 in net proceeds from the exercise of stock options. Financing activities in six months ended June 30, 2014 resulted in cash inflow of $4,990.
Off-Balance Sheet Transactions
We do not have any off-balance sheet transactions.
Trends, Events and Uncertainties
Research and development of new technologies is, by its nature, unpredictable. Although we will undertake development efforts with commercially reasonable diligence, there can be no assurance that the net proceeds from the recent public offerings of our common stock will be sufficient to enable us to develop our technology to the extent needed to create future sales to sustain operations as contemplated herein. If the net proceeds from the recent public offerings of our common stock are insufficient for this purpose, we will consider other options to continue our path to commercialization, including, but not limited to, additional financing through follow-on stock offerings, debt financing, co-development agreements, curtailment of operations, suspension of operations, sale or licensing of developed intellectual or other property, or other alternatives.
We cannot assure you that our technology will be adopted, that we will ever earn revenues sufficient to support our operations, or that we will ever be profitable. Furthermore, since we have no committed source of financing, we cannot assure you that we will be able to raise money as and when we need it to continue our operations. If we cannot raise funds as and when we need them, we may be required to severely curtail, or even to cease, our operations.
Other than as discussed above and elsewhere in this report, we are not aware of any trends, events or uncertainties that are likely to have a material effect on our financial condition.
| 23 |
| ITEM 3. | QUANTITATIVE AND QUALITATIVE DISCLOSURES ABOUT MARKET RISK |
As a smaller reporting company we are not required to provide this information.
| ITEM 4. | CONTROLS AND PROCEDURES |
Disclosure controls and procedures include, without limitation, controls and procedures designed to ensure that information required to be disclosed by an issuer in the reports that it files or submits under the Securities Exchange Act of 1934, as amended is accumulated and communicated to the issuer’s management, including its principal executive and principal financial officers, or persons performing similar functions, as appropriate to allow timely decisions regarding required disclosure. Our management, with the participation of our Chief Executive Officer (principal executive officer) and our Chief Financial Officer (principal financial and accounting officer), has concluded that, as of June 30, 2015, our disclosure controls and procedures are effective.
There have been no other material changes in our internal controls over financial reporting that occurred during the quarter ended June 30, 2015 that have materially affected, or are reasonably likely to materially affect, our internal controls over financial reporting.
| ITEM 1. | LEGAL PROCEEDINGS |
Not applicable.
| ITEM 1A. | RISK FACTORS |
There are no material changes from the risk factors disclosed in our 2014 Annual Report on Form 10-K.
| ITEM 2. | UNREGISTERED SALES OF EQUITY SECURITIES AND USE OF PROCEEDS |
Our initial public offering of our common stock on registration statement number 333-190414, declared effective on November 21, 2013, raised approximately $15 million in net cash proceeds after expenses.
On May 20, 2015, we closed an underwritten follow-on offering of 2,225,825 shares, inclusive of the underwriter’s overallotment of 290,325 shares, of our common stock at a price of $7.75, before underwriting discounts and commissions. The offer and sale of all shares in the follow-on offering were registered under the Securities Act of 1933, as amended pursuant to a registration statement on Form S-3 (registration number 333-200661), which was declared effective on April 27, 2015, and raised approximately $15.9 million in net cash proceeds after expenses.
Through June 30, 2015, we used approximately $11 million of the net cash proceeds from our equity offerings. These funds were used as follows: $712,000 for protection of our intellectual property, $694,000 for purchase of equipment and software and the remainder for our operations, including research and development and general and working capital purposes. None of the proceeds were used for construction of plant, building and facilities, the purchase of real estate or the acquisition of any business.
On May 5, 2015, the Company issued 9,710 shares of common stock to a warrant holder in connection with the exercise of a warrant. The per share exercise price was $3.47626 and the warrant was exercised on a cashless basis. The Company relied on the exemption provided by Section 3(a)(9) of the Securities Act of 1933 to issue the common stock.
On May 6, 2015, the Company issued 11,957 shares of common stock to a warrant holder in connection with the exercise of a warrant. The per share exercise price was $3.47626 and the warrant was exercised on a cashless basis. The Company relied on the exemption provided by Section 3(a)(9) of the Securities Act of 1933 to issue the common stock.
| 24 |
| ITEM 3. | DEFAULTS UPON SENIOR SECURITIES |
Not applicable
| ITEM 4. | MINE SAFETY DISCLOSURES |
Not applicable.
| ITEM 5. | OTHER INFORMATION |
Not applicable.
| ITEM 6. | EXHIBITS |
| Exhibit Number |
Document | |
| 10.1† | Restated 2013 Equity Incentive Plan* | |
| 31.1 | Rule 13a-14(a)/15d-14(a) Certification of Chief Executive Officer* | |
| 31.2 | Rule 13a-14(a)/15d-14(a) Certification of Chief Financial Officer* | |
| 32.1 | Section 1350 Certification of Chief Executive Officer and Chief Financial Officer* | |
| 101.INS | XBRL Instant Document * | |
| 101.SCH | XBRL Taxonomy Extension Schema Document * | |
| 101.CAL | XBRL Taxonomy Extension Calculation Linkbase Document * | |
| 101.DEF | XBRL Taxonomy Extension Definition Linkbase Document * | |
| 10.LAB | XBRL Taxonomy Extension Label Linkbase Document * | |
| 101.PRE | XBRL Taxonomy Extension Presentation Linkbase Document * |
† Restated, but not amended. Published as an Exhibit for convenience
*Filed herewith
| 25 |
Pursuant to the requirements of the Securities Exchange Act of 1934, as amended, the registrant, has duly, caused this report to be signed on its behalf by the undersigned, thereunto duly authorized.
| Dated August 13, 2015 | IDEAL POWER INC. | |
| By: | /s/ R. Daniel Brdar | |
| R. Daniel Brdar | ||
| Chief Executive Officer | ||
| By: | /s/ Timothy W. Burns | |
| Timothy W. Burns | ||
| Chief Financial Officer | ||
| 26 |