Attached files
| file | filename |
|---|---|
| EX-99.1 - EXHIBIT 99.1 - HOOPER HOLMES INC | a51162111ex99_1.htm |
| 8-K - HOOPER HOLMES, INC. 8-K - HOOPER HOLMES INC | a51162111.htm |
Exhibit 99.2
Hooper Holmes, Inc. August 13, 2015 Earnings Presentation Speakers: Henry Dubois, Chief Executive Officer Tom Collins, Chief Financial Officer 1
Safe Harbor Statement This presentation contains forward-looking statements, as such term is defined in the Private Securities Litigation Reform Act of 1995, concerning the Company’s plans, objectives, goals, strategies, future events or performances, which are not statements of historical fact and can be identified by words such as: “expect,” “continue,” “should,” “may,” “will,” “project,” “anticipate,” “believe,” “plan,” “goal,” and similar references to future periods. The forward-looking statements contained in this presentation reflect our current beliefs and expectations. Actual results or performance may differ materially from what is expressed in the forward looking statements. Among the important factors that could cause actual results to differ materially from those expressed in, or implied by, the forward-looking statements contained in this presentation are our ability to realize the expected benefits from the acquisition of Accountable Health Solutions and our strategic alliance with Clinical Reference Laboratory; our ability to successfully implement our business strategy and integrate Accountable Health Solutions’ business with ours; our ability to retain and grow our customer base; our ability to recognize operational efficiencies and reduce costs; uncertainty as to our working capital requirements over the next 12 to 24 months; our ability to maintain compliance with the financial covenants contained in our credit facilities; the rate of growth in the Health and Wellness market and such other factors as discussed in Part I, Item 1A, Risk Factors, and Part II, Item 7, Management’s Discussion and Analysis of Financial Conditions and Results of Operations of our Annual Report on Form 10-K for the year ended December 31, 2014. The Company undertakes no obligation to update or release any revisions to these forward-looking statements to reflect events or circumstances, or to reflect the occurrence of unanticipated events, after the date of this presentation, except as required by law. This presentation contains information from third-party sources, including data from studies conducted by others and market data and industry forecasts obtained from industry publications. Although the Company believes that such information is reliable, the Company has not independently verified any of this information and the Company does not guarantee the accuracy or completeness of this information. 2
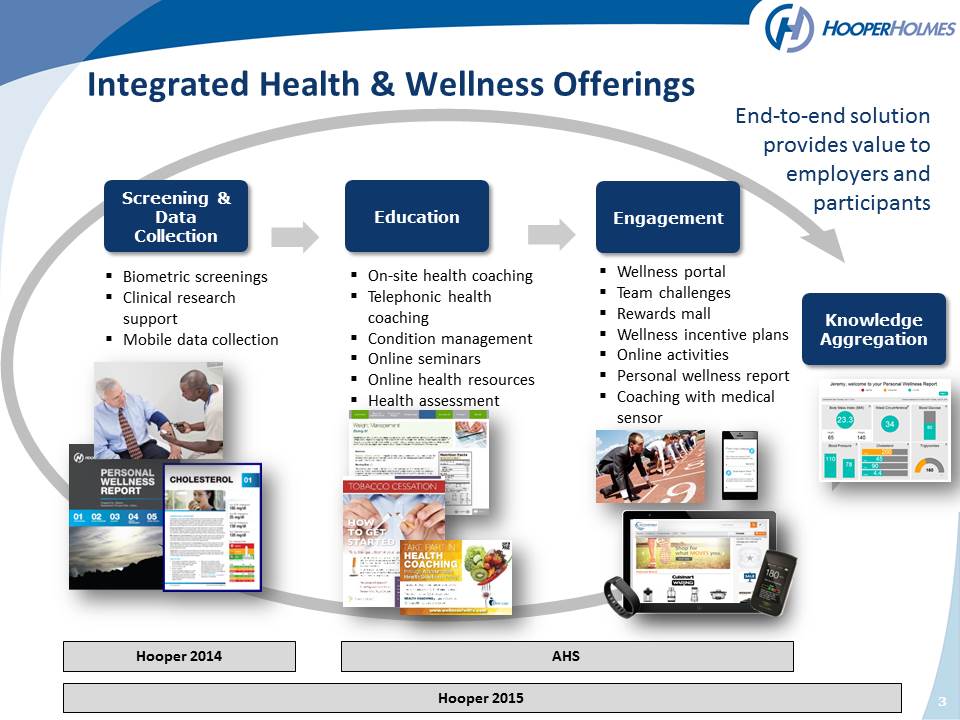
Integrated Health & Wellness Offerings On-site health coaching Telephonic health coaching Condition management Online seminars Online health resources Health assessment plans - future Biometric screenings Clinical research support Mobile data collection Wellness portal Team challenges Rewards mall Wellness incentive plans Online activities Personal wellness report Coaching with medical sensor plans - future Screening & Data Collection Education Engagement Knowledge Aggregation End-to-end solution provides value to employers and participants Hooper 2015 Hooper 2014 AHS 3
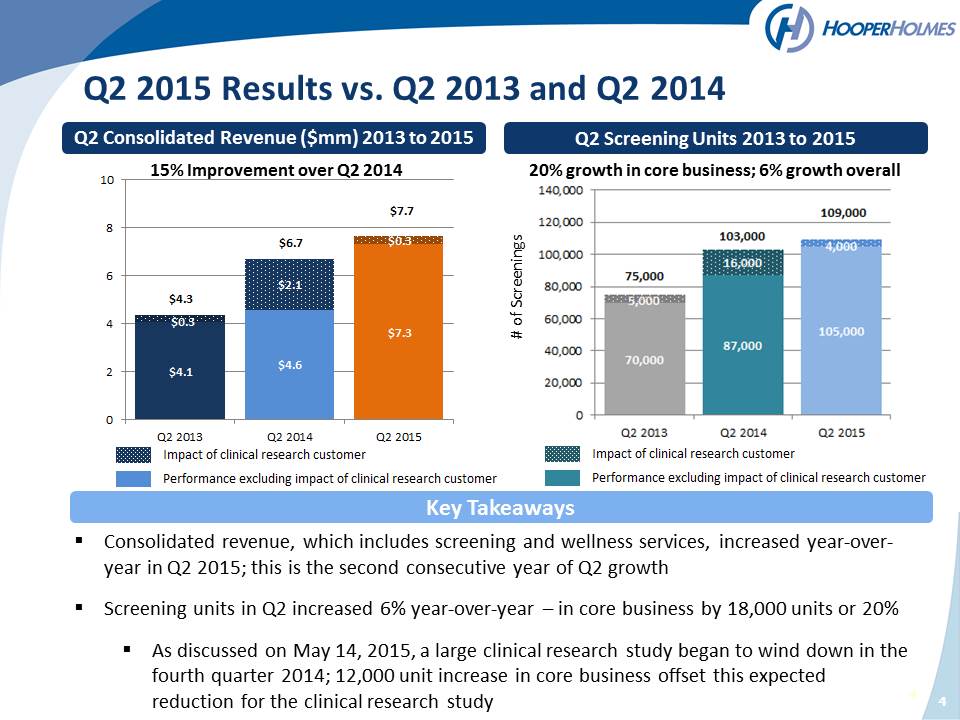
4 Q2 Consolidated Revenue ($mm) 2013 to 2015 Q2 Screening Units 2013 to 2015 Consolidated revenue, which includes screening and wellness services, increased year-over-year in Q2 2015; this is the second consecutive year of Q2 growth Screening units in Q2 increased 6% year-over-year – in core business by 18,000 units or 20% As discussed on May 14, 2015, a large clinical research study began to wind down in the fourth quarter 2014; 12,000 unit increase in core business offset this expected reduction for the clinical research study Key Takeaways # of Screenings Q2 2015 Results vs. Q2 2013 and Q2 2014 20% growth in core business; 6% growth overall 15% Improvement over Q2 2014
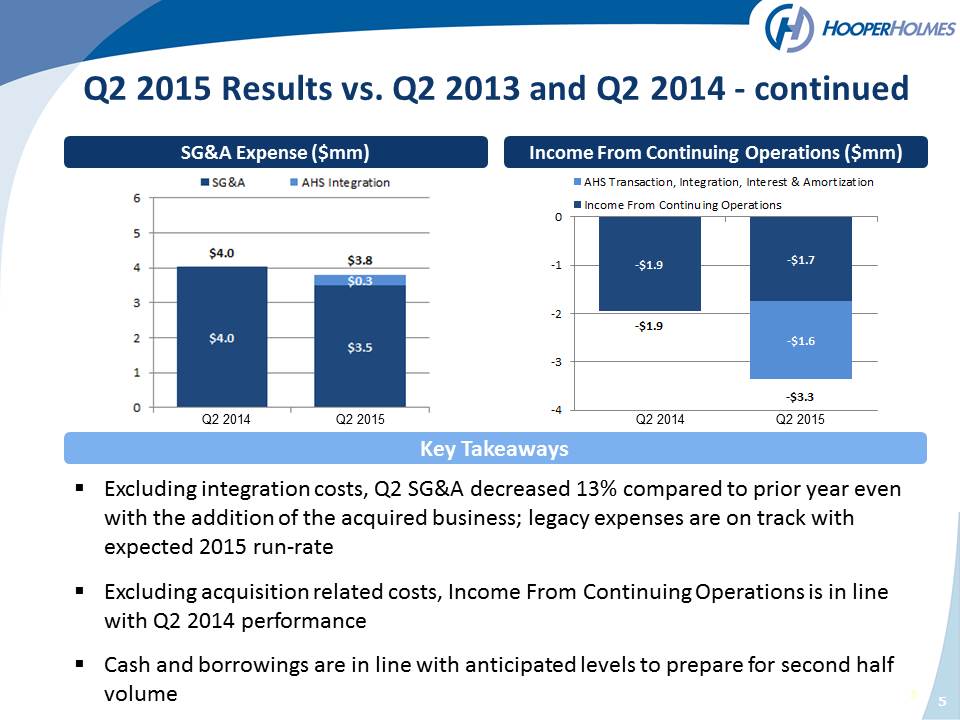
5 SG&A Expense ($mm) Income From Continuing Operations ($mm) Excluding integration costs, Q2 SG&A decreased 13% compared to prior year even with the addition of the acquired business; legacy expenses are on track with expected 2015 run-rate Excluding acquisition related costs, Income From Continuing Operations is in line with Q2 2014 performance Cash and borrowings are in line with anticipated levels to prepare for second half volume Key Takeaways Q2 2015 Results vs. Q2 2013 and Q2 2014 - continued Q2 2014 Q2 2015 Q2 2014 Q2 2015
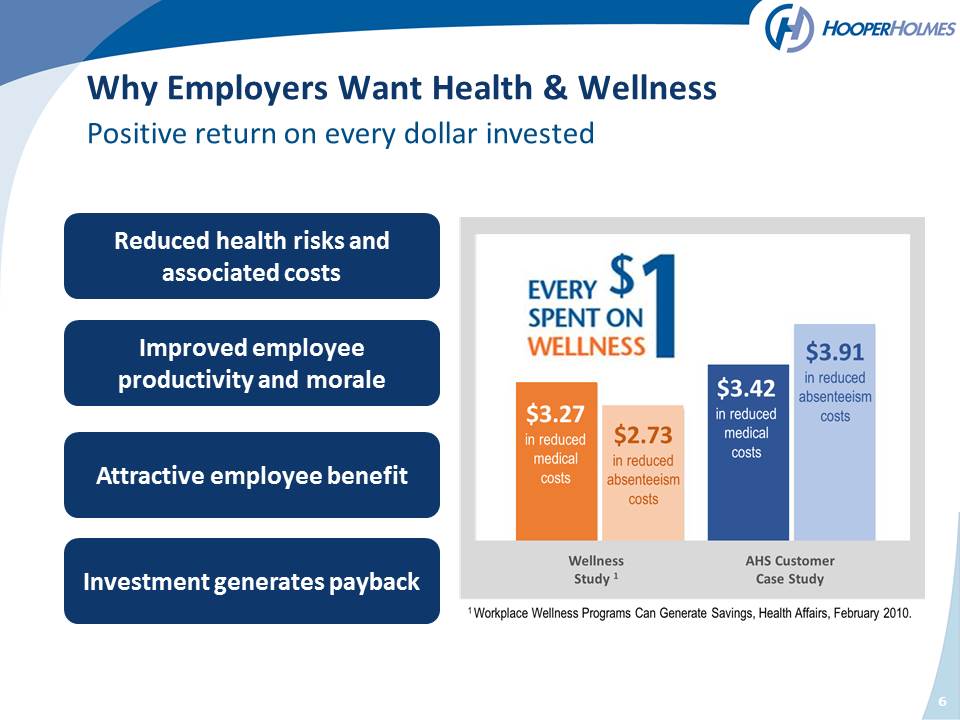
6 Why Employers Want Health & Wellness Positive return on every dollar invested Reduced health risks and associated costs Improved employee productivity and morale Attractive employee benefit Investment generates payback Competitors typically only offer own product for 1-2 of these focus areas
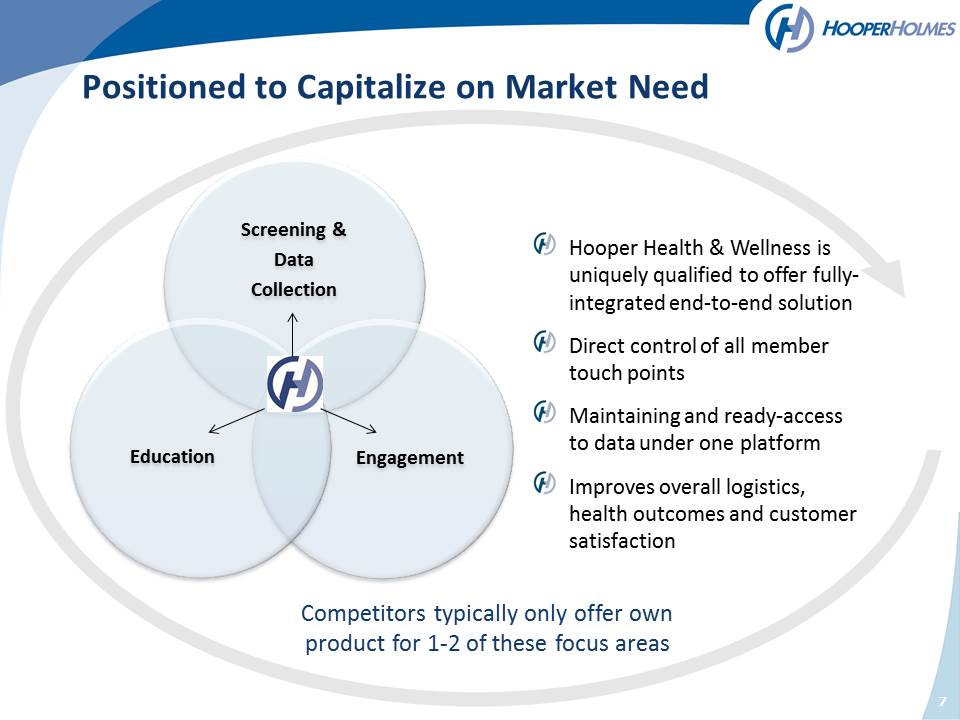
Positioned to Capitalize on Market Need 7 Screening & Data Collection Engagement Education Hooper Health & Wellness is uniquely qualified to offer fully-integrated end-to-end solution Direct control of all member touch points Maintaining and ready-access to data under one platform Improves overall logistics, health outcomes and customer satisfaction
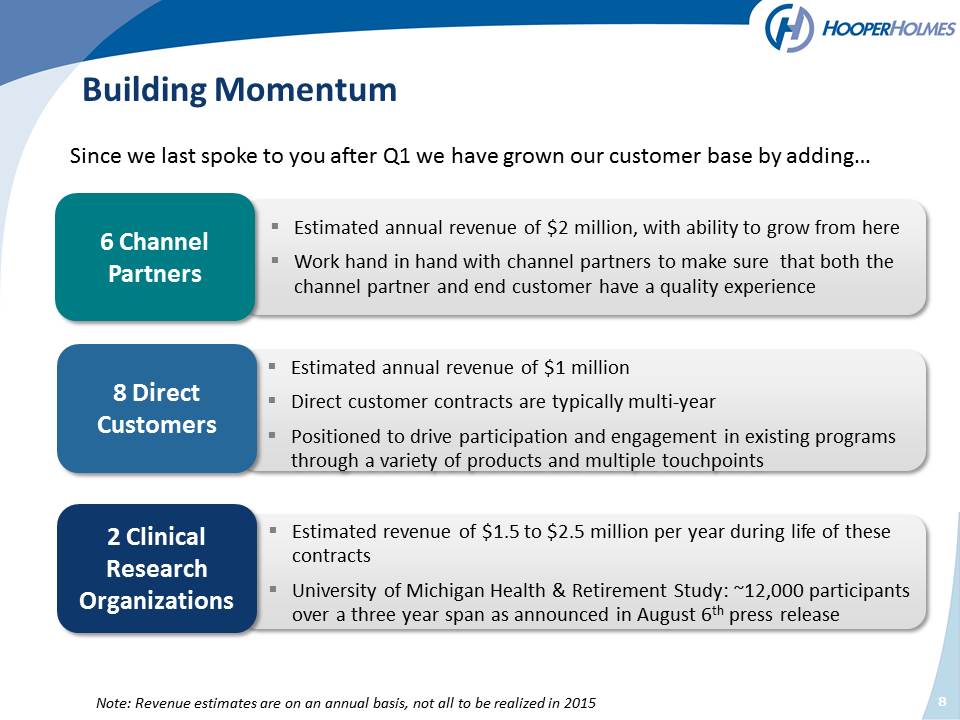
Estimated annual revenue of $2 million, with ability to grow from here Work hand in hand with channel partners to make sure that both the channel partner and end customer have a quality experience Estimated revenue of $1.5 to $2.5 million per year during life of these contracts University of Michigan Health & Retirement Study: ~12,000 participants over a three year span as announced in August 6th press release 6 Channel Partners Building Momentum 2 Clinical Research Organizations Since we last spoke to you after Q1 we have grown our customer base by adding… Note: Revenue estimates are on an annual basis, not all to be realized in 2015 Estimated annual revenue of $1 million Direct customer contracts are typically multi-year Positioned to drive participation and engagement in existing programs through a variety of products and multiple touchpoints 8 Direct Customers 8
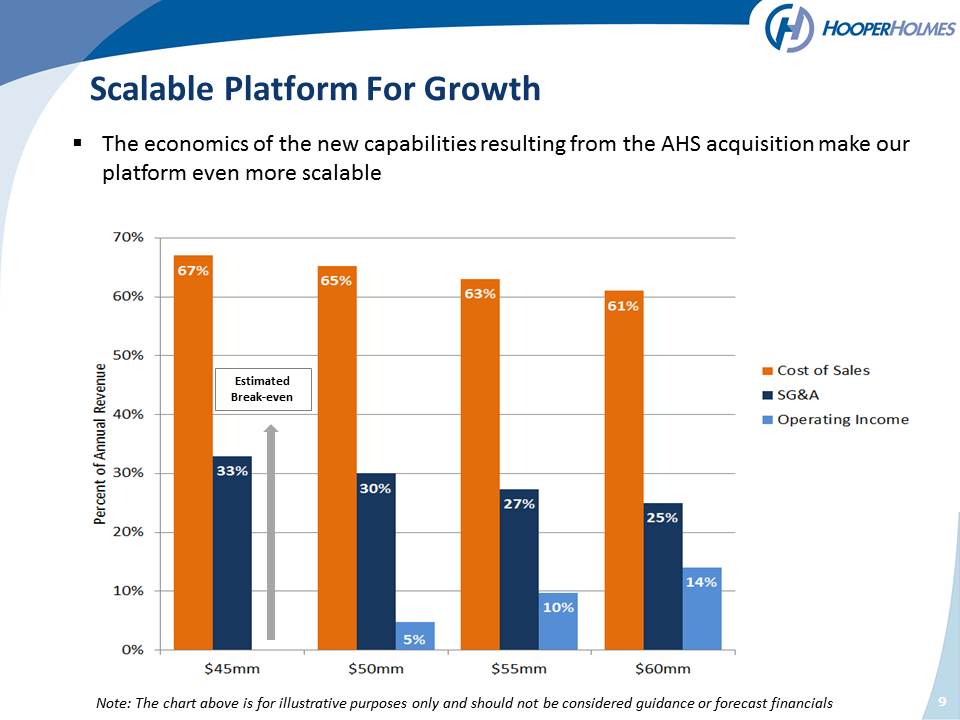
9 Scalable Platform For Growth The economics of the new capabilities resulting from the AHS acquisition make our platform even more scalable Note: The chart above is for illustrative purposes only and should not be considered guidance or forecast financials Estimated Break-even
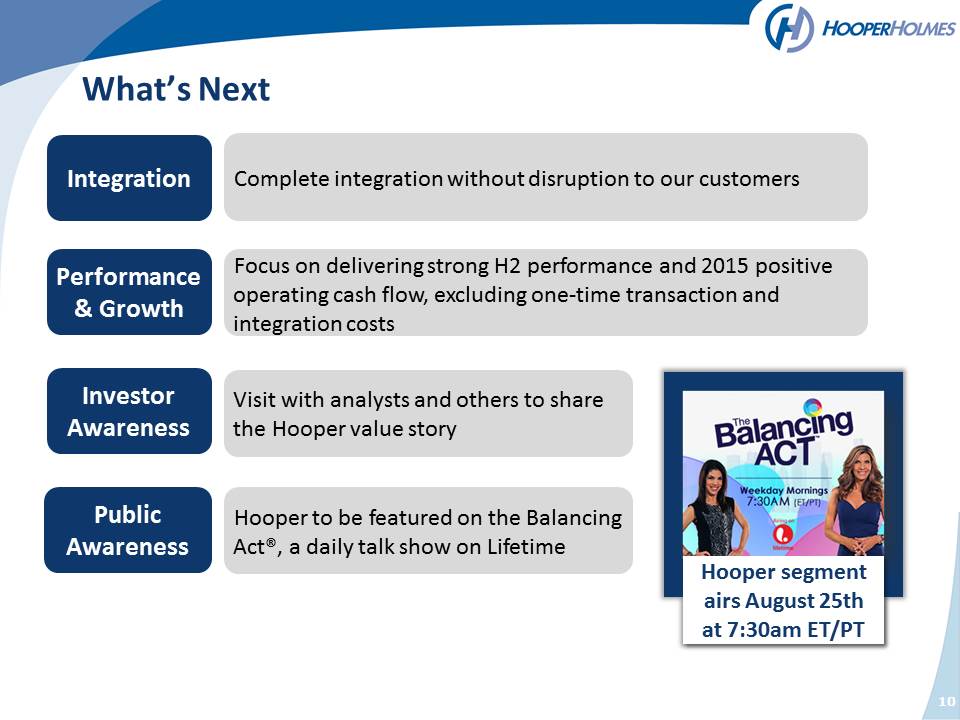
10 What’s Next Complete integration without disruption to our customers Focus on delivering strong H2 performance and 2015 positive operating cash flow, excluding one-time transaction and integration costs Visit with analysts and others to share the Hooper value story Hooper to be featured on the Balancing Act®, a daily talk show on Lifetime Hooper segment airs August 25th at 7:30am ET/PT Integration Performance & Growth Investor Awareness Public Awareness