Attached files
| file | filename |
|---|---|
| 8-K - FORM 8-K - CABOT CORP | d82382d8k.htm |
Exhibit 99.1
|
|
Cabot Corporation
Investor Presentation
August 2015
|
|
Forward Looking Statements & Use of Non—
GAAP Financial Measures
This presentation contains forward-looking statements based on management’s current expectations, estimates and
projections. All statements that address expectations or projections about the future, including statements about the
Company’s strategy for growth, product development, market position, expected financial results, and how we expect to
achieve our growth targets are forward-looking statements. Some of the forward-looking statements may be identified by
words like “expects,” “anticipates,” “plans,” “intends,” “projects,” “indicates,” and similar expressions. Forward-looking
statements are based on our current expectations, assumptions, estimates and projections about Cabot’s businesses and
strategies, market trends and conditions, economic conditions and other factors. These statements are not guarantees of
future performance and are subject to risks, uncertainties, potentially inaccurate assumptions, and other factors, some of
which are beyond our control and difficult to predict. If known or unknown risks materialize, or should underlying assumptio ns
prove inaccurate, our actual results could differ materially from past results and from those expressed in the forward -looking
statement. Important factors that could cause our results to differ materially from those expressed in the forward -looking
statements include, but are not limited to lower than expected demand for our products; the loss of one or more of our
important customers; our inability to complete capacity expansions or other development projects; the timing of
implementation of environmental regulations; our failure to develop new products or to keep pace with technological
developments; patent rights of others; the timely commercialization of products under development (which may be disrupted
or delayed by technical difficulties, market acceptance, competitors’ new products, as well as difficulties in moving from th e
experimental stage to the production stage); changes in raw material costs; demand for our customers’ products; competitors’
reactions to market conditions; delays in the successful integration of structural changes, including acquisitions or joint
ventures; the laws, regulations, policies and economic conditions, including inflation, interest and foreign currency exchange
rates, of countries where we do business; and severe weather events that cause business interruptions, including plant and
power outages or disruptions in supplier or customer operations. These factors are discussed more fully in the reports we file
with the Securities and Exchange Commission, particularly our latest annual report on Form 10-K.
This presentation includes references to the following non -GAAP financial measures: adjusted EPS (earnings per share),
adjusted EBITDA (earnings before interest, taxes, depreciation and amortization), and adjusted EBITDA margins. The definitions
of adjusted EPS, adjusted EBITDA, and EBITDA margins and a reconciliation of adjusted EPS and adjusted EBITDA to the most
comparable GAAP financial measures are provided at the end of this presentation or in our latest annual report on Form 10-K.
INVESTOR PRESENTATION 2
|
|
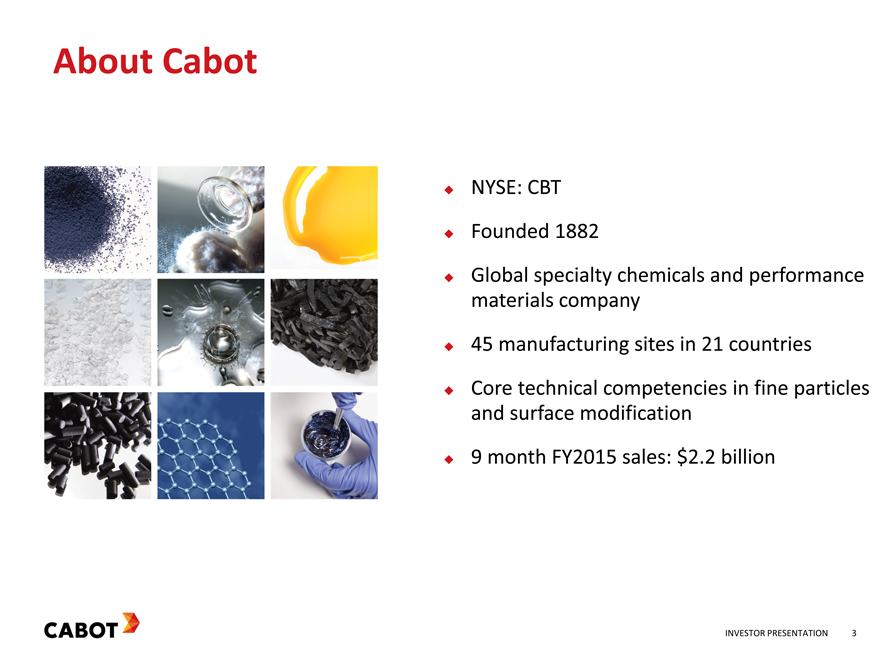
About Cabot
NYSE: CBT
Founded 1882
Global specialty chemicals and performance
materials company
45 manufacturing sites in 21 countries
Core technical competencies in fine particles
and surface modification
9 month FY2015 sales: $2.2 billion
INVESTOR PRESENTATION 3
|
|
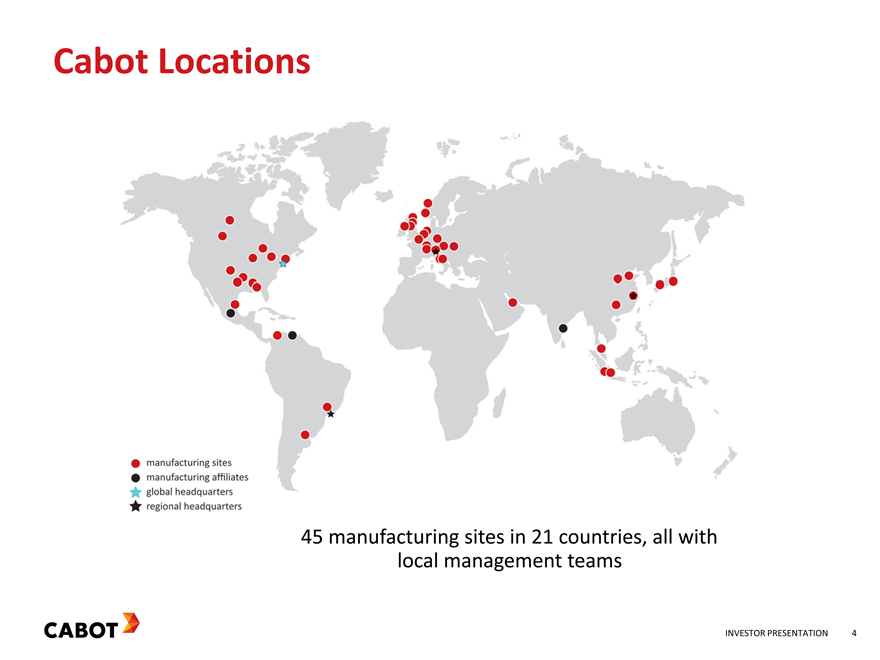
Cabot Locations
45 manufacturing sites in 21 countries, all with
local management teams
INVESTOR PRESENTATION 4
|
|
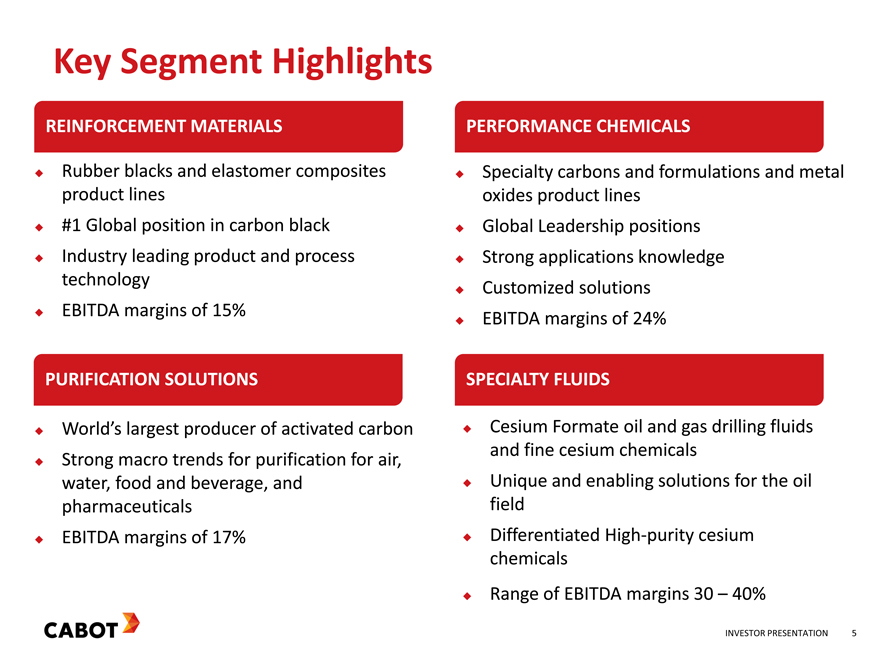
Key Segment Highlights
REINFORCEMENT MATERIALS
Rubber blacks and elastomer composites product lines
#1 Global position in carbon black Industry leading product and process technology EBITDA margins of 15%
PERFORMANCE CHEMICALS
Specialty carbons and formulations and metal oxides product lines Global Leadership positions Strong applications knowledge Customized solutions EBITDA margins of 24%
PURIFICATION SOLUTIONS
World’s largest producer of activated carbon
Strong macro trends for purification for air, water, food and beverage, and pharmaceuticals EBITDA margins of 17%
SPECIALTY FLUIDS
Cesium Formate oil and gas drilling fluids and fine cesium chemicals Unique and enabling solutions for the oil field Differentiated High-purity cesium chemicals Range of EBITDA margins 30 – 40%
INVESTOR PRESENTATION 5
|
|
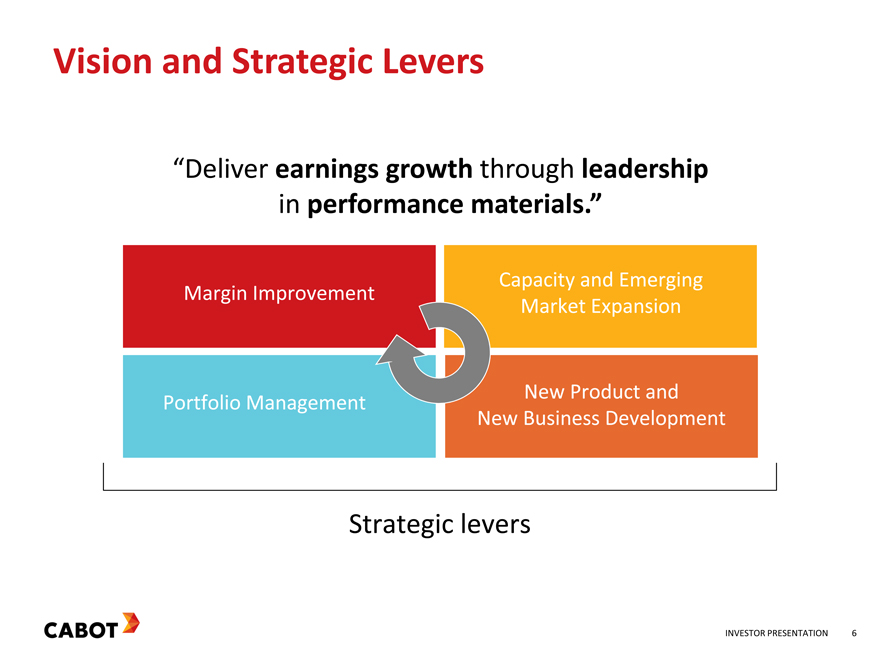
Vision and Strategic Levers
“Deliver earnings growth through leadership
in performance materials.”
Capacity and Emerging
Margin Improvement
Market Expansion
Portfolio Management New Product and
New Business Development
Strategic levers
INVESTOR PRESENTATION 6
|
|
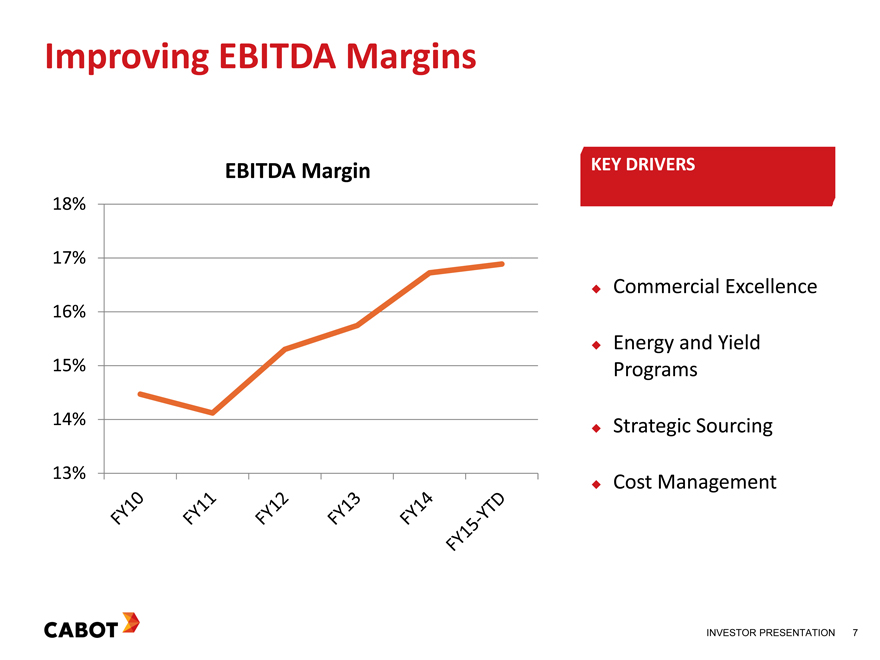
Improving EBITDA Margins
EBITDA Margin KEY DRIVERS
18%
17%
Commercial Excellence
16%
Energy and Yield
15% Programs
14% Strategic Sourcing
13%
Cost Management
INVESTOR PRESENTATION 7
|
|
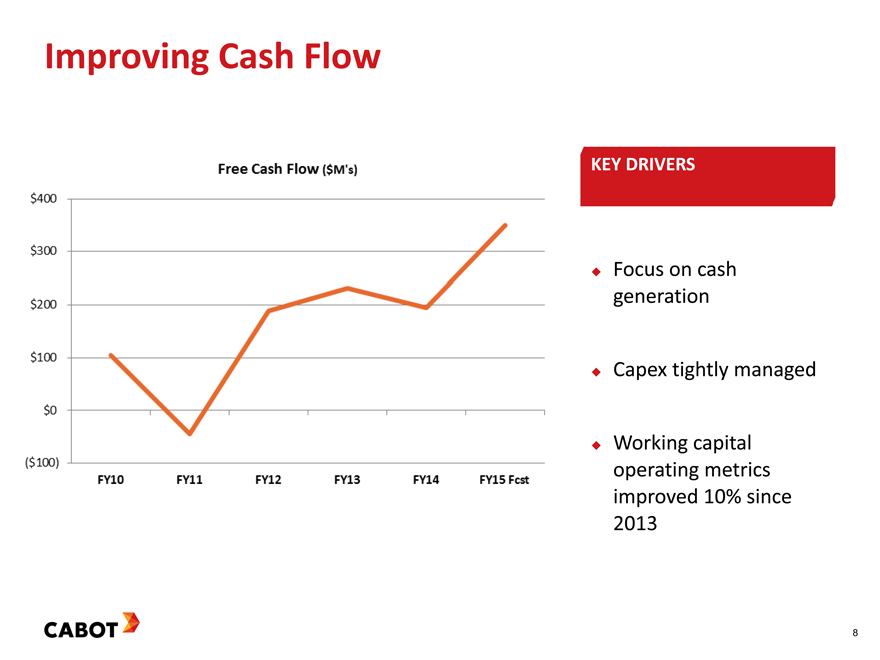
Improving Cash Flow
KEY DRIVERS
Focus on cash
generation
Capex tightly managed
Working capital
operating metrics
improved 10% since
2013
| 8 |
|
|
|
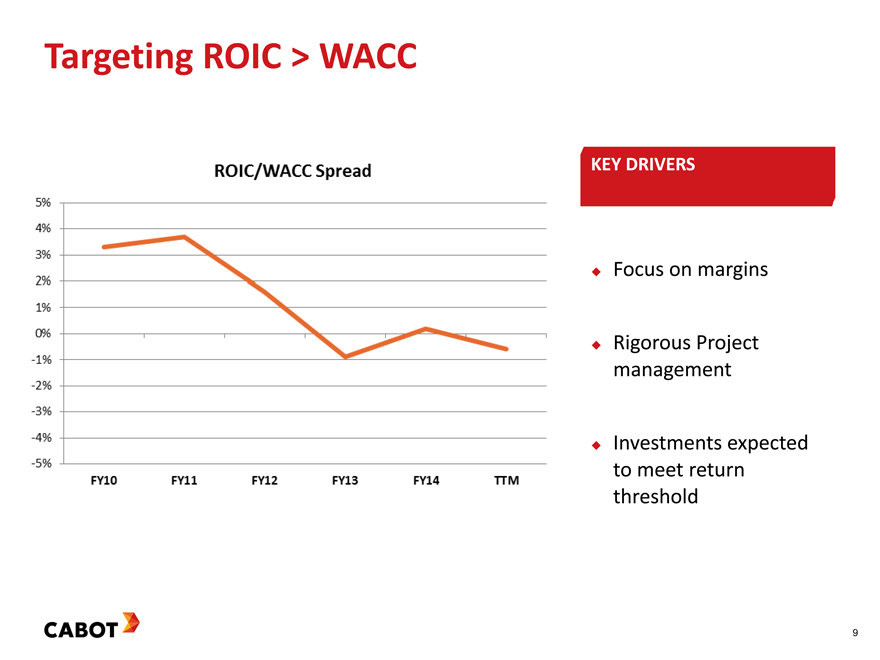
Targeting ROIC > WACC
KEY DRIVERS
Focus on margins
Rigorous Project
management
Investments expected
to meet return
threshold
9
|
|
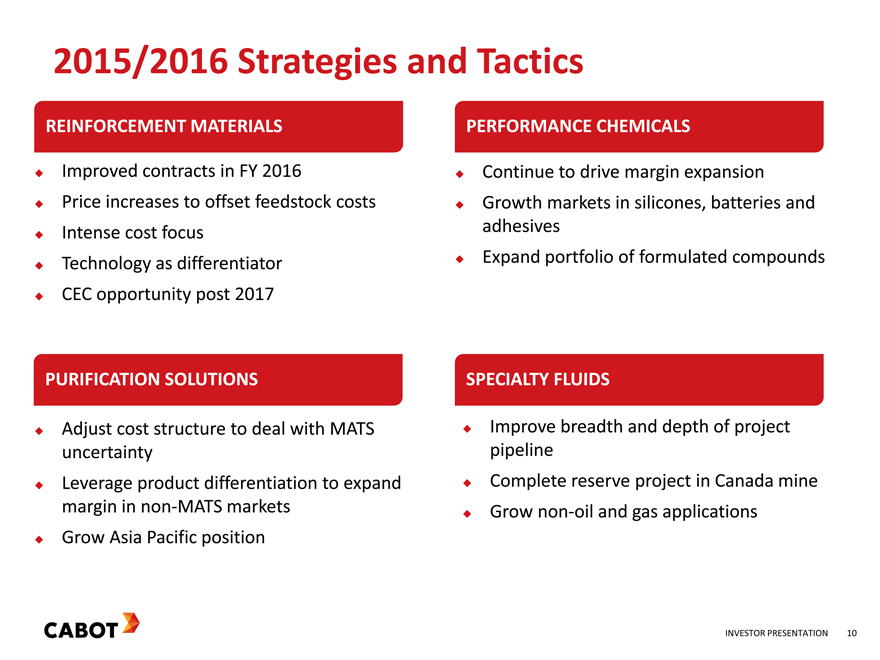
2015/2016 Strategies and Tactics
REINFORCEMENT MATERIALS PERFORMANCE CHEMICALS
Improved contracts in FY 2016 Continue to drive margin expansion
Price increases to offset feedstock costs Growth markets in silicones, batteries and
Intense cost focus adhesives
Technology as differentiator Expand portfolio of formulated compounds
CEC opportunity post 2017
PURIFICATION SOLUTIONS SPECIALTY FLUIDS
Adjust cost structure to deal with MATS Improve breadth and depth of project
uncertainty pipeline
Leverage product differentiation to expand Complete reserve project in Canada mine
margin in non-MATS markets Grow non-oil and gas applications
Grow Asia Pacific position
INVESTOR PRESENTATION 10
|
|
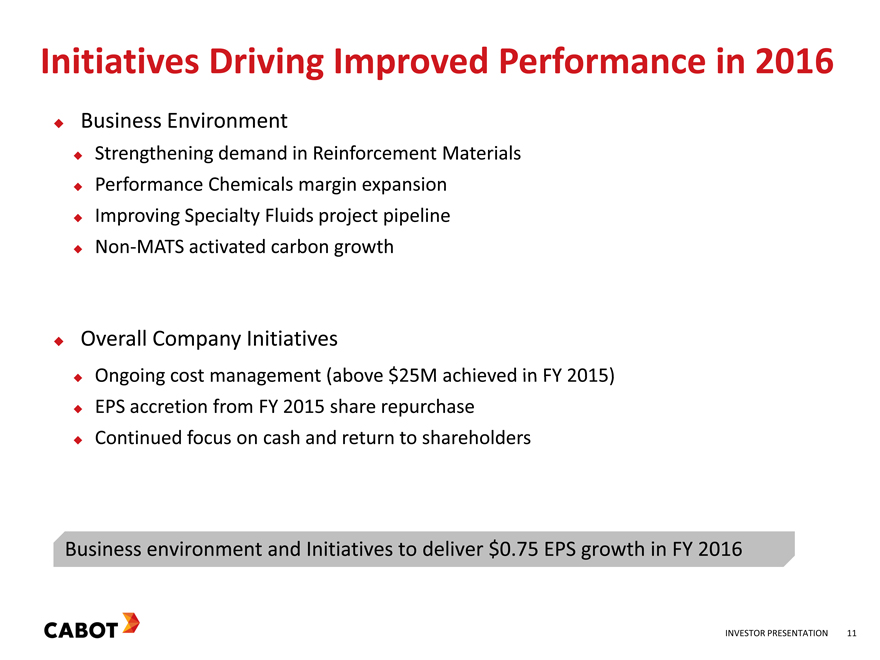
Initiatives Driving Improved Performance in 2016
Business Environment
Strengthening demand in Reinforcement Materials
Performance Chemicals margin expansion
Improving Specialty Fluids project pipeline
Non-MATS activated carbon growth
Overall Company Initiatives
Ongoing cost management (above $25M achieved in FY 2015)
EPS accretion from FY 2015 share repurchase
Continued focus on cash and return to shareholders
Business environment and Initiatives to deliver $0.75 EPS growth in FY 2016
INVESTOR PRESENTATION 11
|
|
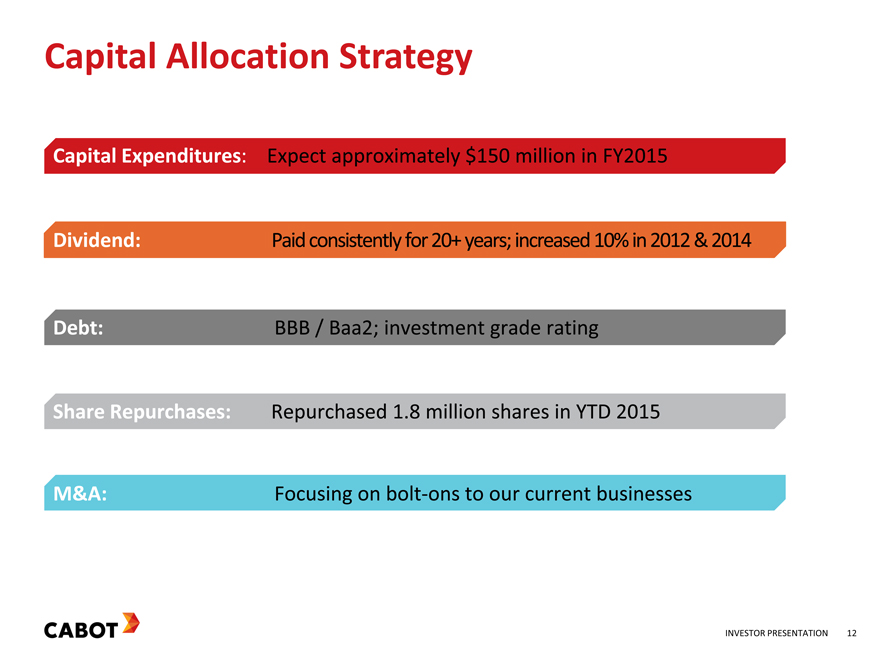
Capital Allocation Strategy
Capital Expenditures : Expect approximately $150 million in FY2015
Dividend: Paid consistently for 20+ years; increased 10% in 2012 & 2014
Debt: BBB / Baa2; investment grade rating
Share Repurchases: Repurchased 1.8 million shares in YTD 2015
M&A: Focusing on bolt-ons to our current businesses
INVESTOR PRESENTATION 12
|
|
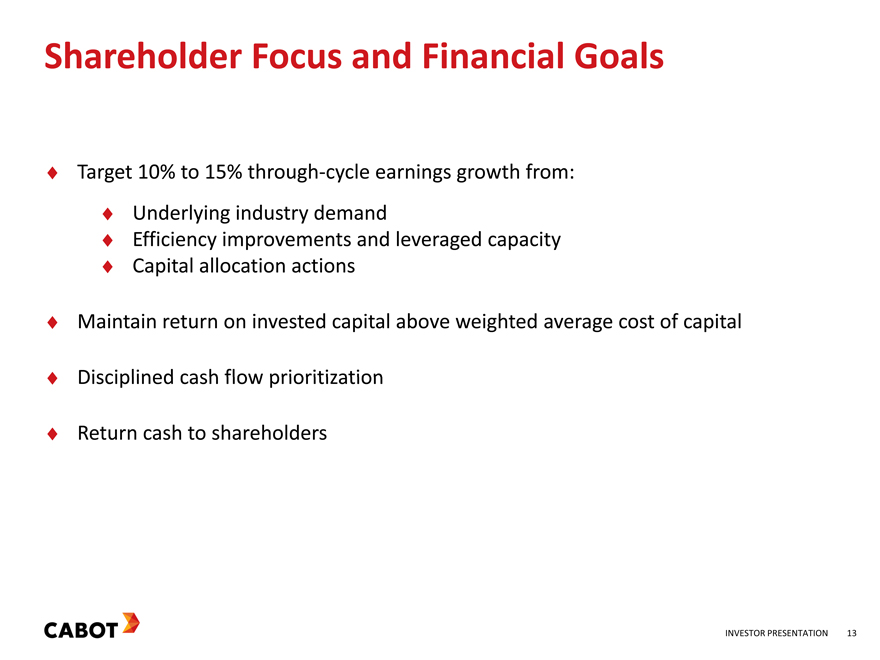
Shareholder Focus and Financial Goals
Target 10% to 15% through -cycle earnings growth from:
Underlying industry demand
Efficiency improvements and leveraged capacity
Capital allocation actions
Maintain return on invested capital above weighted average cost of capital
Disciplined cash flow prioritization
Return cash to shareholders
INVESTOR PRESENTATION 13
|
|

Thank You NYSE: CBT
Investor Relations Contact: Jim Kelly Interim Vice President, Investor Relations (617) 342-6020 jim.kelly@cabotcorp.com
INVESTOR PRESENTATION 14
|
|

Appendix
15
|
|
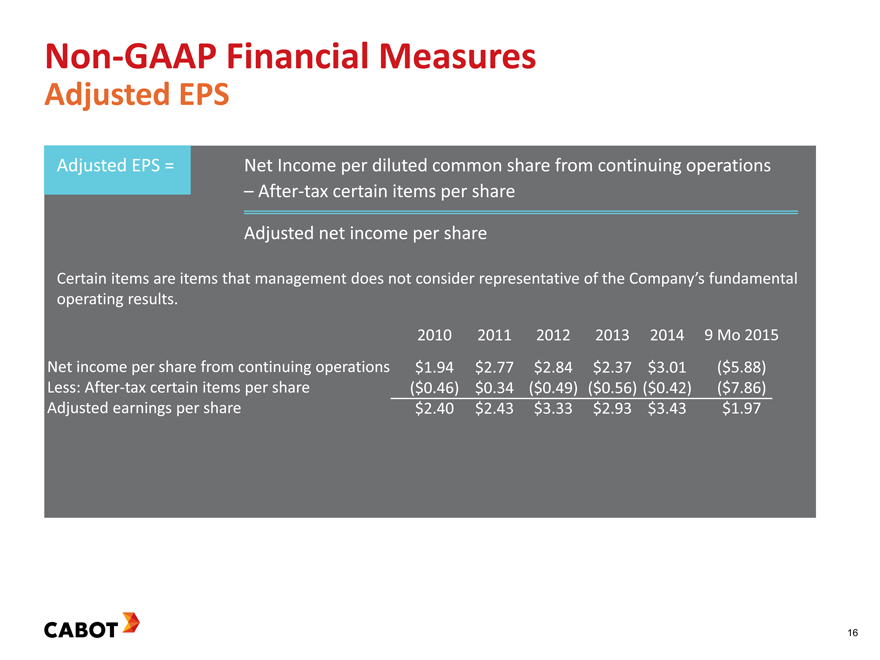
Non-GAAP Financial Measures
Adjusted EPS
Adjusted EPS = Net Income per diluted common share from continuing operations
– After-tax certain items per share
Adjusted net income per share
Certain items are items that management does not consider representative of the Company’s fundamental
operating results.
2010 2011 2012 2013 2014 9 Mo 2015
Net income per share from continuing operations $ 1.94 $ 2.77 $ 2.84 $ 2.37 $ 3.01 ($ 5.88)
Less: After-tax certain items per share ($ 0.46) $ 0.34 ($ 0.49) ($ 0.56) ($ 0.42) ($ 7.86)
Adjusted earnings per share $ 2.40 $ 2.43 $ 3.33 $ 2.93 $ 3.43 $ 1.97
16
|
|
Non-GAAP Financial Measures
Adjusted EBITDA and Adjusted EBITDA Margin
Please visit the Investor Relations section of our website for 2014 and 2015 reconciliations of Adjusted EBITDA and Adjusted EBITDA Margins.
17
|
|

Cabot