Attached files
| file | filename |
|---|---|
| 8-K - FORM 8-K - SVB FINANCIAL GROUP | q215investorrelations_8-k.htm |
S V B 2 0 1 4 4 :3 Q2 2015 Corporate Overview and Financial Results 11 August 2015 1 Q2 2015 Corporate Overview and Financial Results August 11, 2015
S V B 2 0 1 4 4 :3 Q2 2015 Corporate Overview and Financial Results 11 August 2015 2 Contents 3 7 15 17 18 40 Mission, vision and model Q2’15 performance Regulatory environment 2015 outlook Appendix Non-GAAP reconciliations Special note regarding forward-looking statements This presentation contains forward-looking statements within the meaning of the Private Securities Litigation Reform Act of 1995. Forward-looking statements are neither historical facts nor assurances of future performance. You can identify these and other forward-looking statements by the use of words such as “becoming,” “may,” “will,” “should,” "could," "would," “predict,” “potential,” “continue,” “anticipate,” “believe,” “estimate,” “seek,” “expect,” “plan,” “intend,” the negative of such words, or comparable terminology. Although we believe that the expectations reflected in these forward-looking statements are reasonable, we have based these expectations on our current beliefs as well as our assumptions, and such expectations may prove to be incorrect. We wish to caution you that such statements are just predictions and actual events or results may differ materially, due to changes in economic, business and regulatory factors and trends. We also refer you to the documents the Company files from time to time with the Securities and Exchange Commission, specifically the Company’s 2014 Annual Report on Form 10-K. These documents contain and identify important risk factors that could cause the Company’s actual results to differ materially from those contained in our projections or other forward-looking statements. All forward-looking statements included in this presentation are made only as of the date of this presentation. We assume no obligation and do not intend to revise or update any forward-looking statements contained in this presentation, except as required by law. Please also refer to the slide in this presentation entitled “Additional information regarding forward looking statements.”
S V B 2 0 1 4 4 :3 Q2 2015 Corporate Overview and Financial Results 11 August 2015 3 To increase our clients’ probability of success Our mission • Build deep relationships • Give advice • Make it easy to do business with us • Do different
S V B 2 0 1 4 4 :3 Q2 2015 Corporate Overview and Financial Results 11 August 2015 4 A financial services company like no other 30+ years of partnership with innovation companies and their investors Leading early-stage market share More than 1,000 private equity and venture capital clients Strong deposit franchise Diversified revenue streams 28 U.S. and seven international offices We deliver service with an entrepreneurial spirit. We give our clients what they need, when they need it. We stay on the pulse of our clients’ industries.
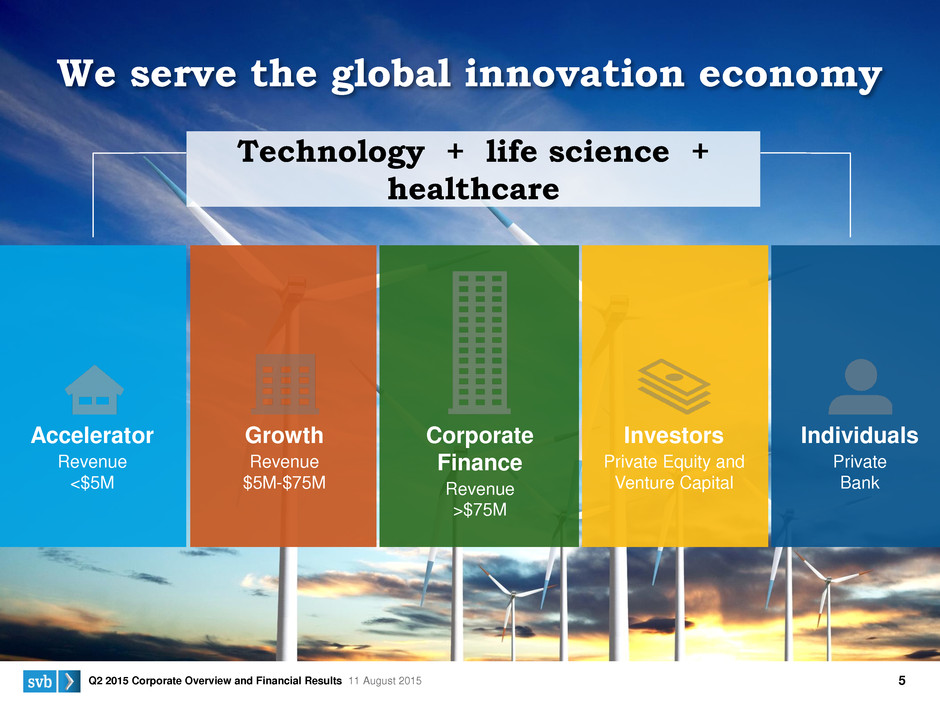
S V B 2 0 1 4 4 :3 Q2 2015 Corporate Overview and Financial Results 11 August 2015 5 Accelerator Revenue <$5M Growth Revenue $5M-$75M Individuals Private Bank Corporate Finance Revenue >$75M Investors Private Equity and Venture Capital Technology + life science + healthcare We serve the global innovation economy
S V B 2 0 1 4 4 :3 Q2 2015 Corporate Overview and Financial Results 11 August 2015 6 Current Environment Continued momentum • Positive funding and exit environments for our clients • Healthy new client acquisition • Strong market position • Global expansion • Fee income • Solid credit quality Challenges • Low interest rates • Complex regulatory environment and increasing regulatory requirements • Market valuations • Competition
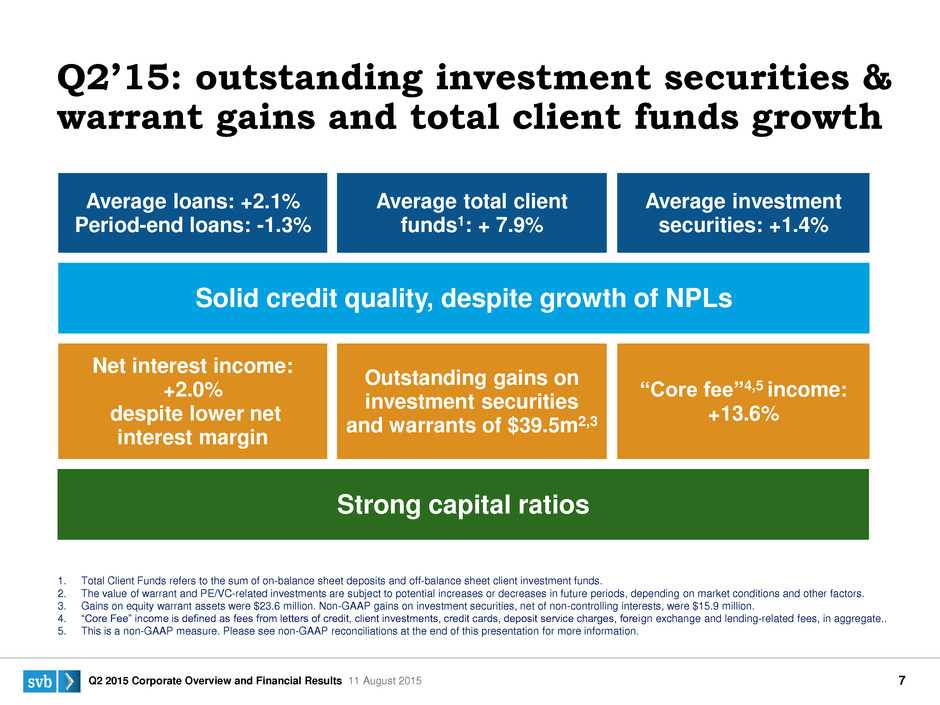
S V B 2 0 1 4 4 :3 Q2 2015 Corporate Overview and Financial Results 11 August 2015 7 Q2’15: outstanding investment securities & warrant gains and total client funds growth Average loans: +2.1% Period-end loans: -1.3% “Core fee”4,5 income: +13.6% Outstanding gains on investment securities and warrants of $39.5m2,3 Net interest income: +2.0% despite lower net interest margin Average total client funds1: + 7.9% Average investment securities: +1.4% 1. Total Client Funds refers to the sum of on-balance sheet deposits and off-balance sheet client investment funds. 2. The value of warrant and PE/VC-related investments are subject to potential increases or decreases in future periods, depending on market conditions and other factors. 3. Gains on equity warrant assets were $23.6 million. Non-GAAP gains on investment securities, net of non-controlling interests, were $15.9 million. 4. “Core Fee” income is defined as fees from letters of credit, client investments, credit cards, deposit service charges, foreign exchange and lending-related fees, in aggregate.. 5. This is a non-GAAP measure. Please see non-GAAP reconciliations at the end of this presentation for more information. Solid credit quality, despite growth of NPLs Strong capital ratios
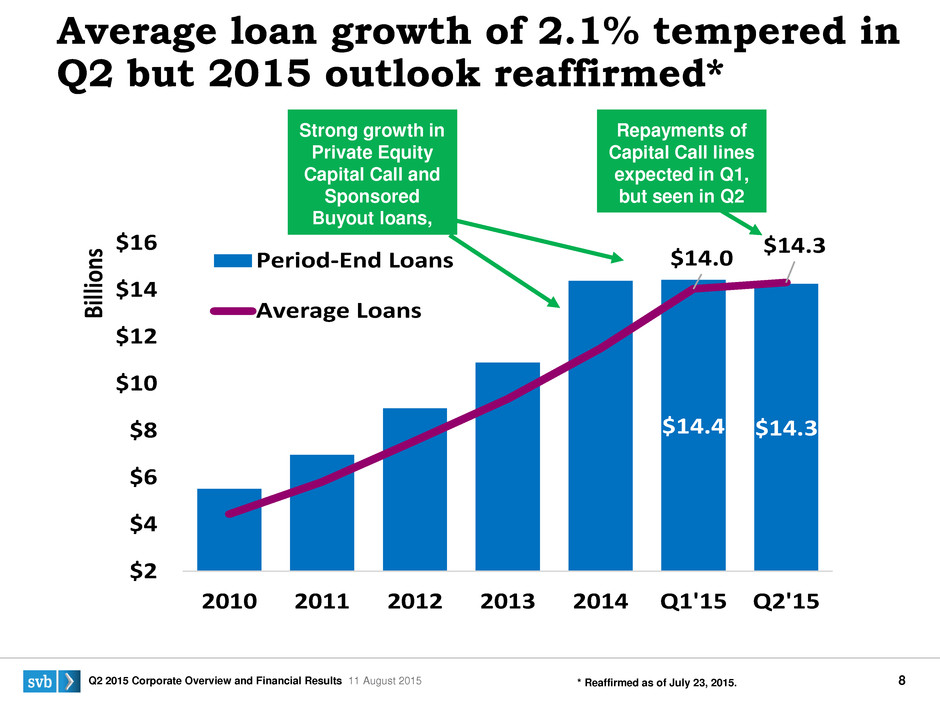
S V B 2 0 1 4 4 :3 Q2 2015 Corporate Overview and Financial Results 11 August 2015 8 Average loan growth of 2.1% tempered in Q2 but 2015 outlook reaffirmed* $14.4 $14.3 $14.0 $14.3 $2 $4 $6 $8 $10 $12 $14 $16 2010 2011 2012 2013 2014 Q1'15 Q2'15 Bil lion s Period-End Loans Average Loans Strong growth in Private Equity Capital Call and Sponsored Buyout loans, Repayments of Capital Call lines expected in Q1, but seen in Q2 * Reaffirmed as of July 23, 2015.
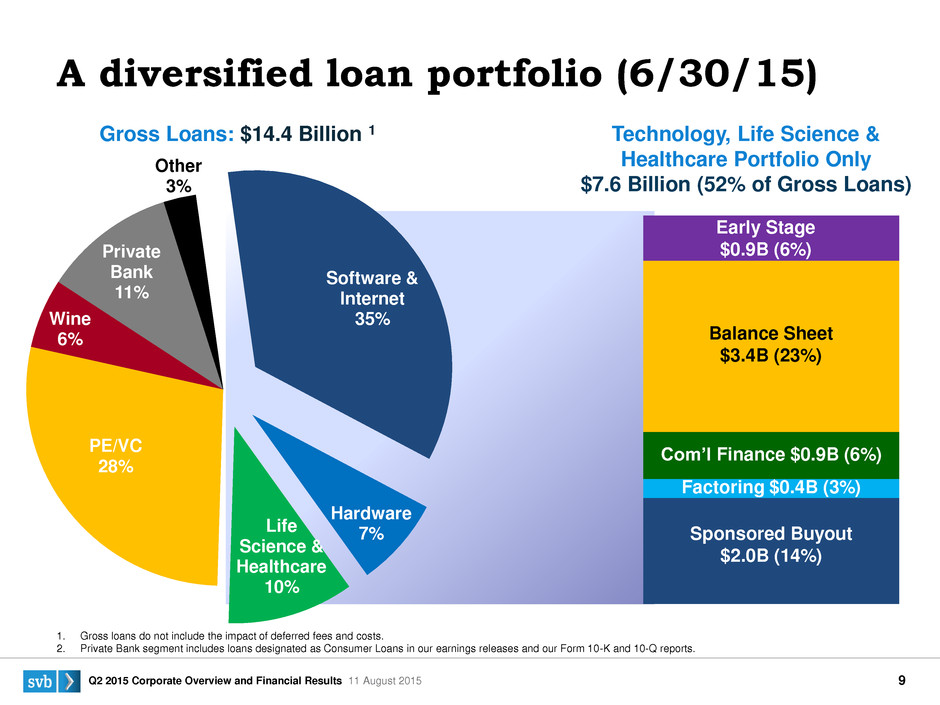
S V B 2 0 1 4 4 :3 Q2 2015 Corporate Overview and Financial Results 11 August 2015 9 A diversified loan portfolio (6/30/15) 1. Gross loans do not include the impact of deferred fees and costs. 2. Private Bank segment includes loans designated as Consumer Loans in our earnings releases and our Form 10-K and 10-Q reports. Technology, Life Science & Healthcare Portfolio Only $7.6 Billion (52% of Gross Loans) Gross Loans: $14.4 Billion 1 Sponsored Buyout $2.0B (14%) Factoring $0.4B (3%) Com’l Finance $0.9B (6%) Balance Sheet $3.4B (23%) Early Stage $0.9B (6%) Software & Internet 35% Hardware 7%Life Science & Healthcare 10% PE/VC 28% Wine 6% Private Bank 11% Other 3%
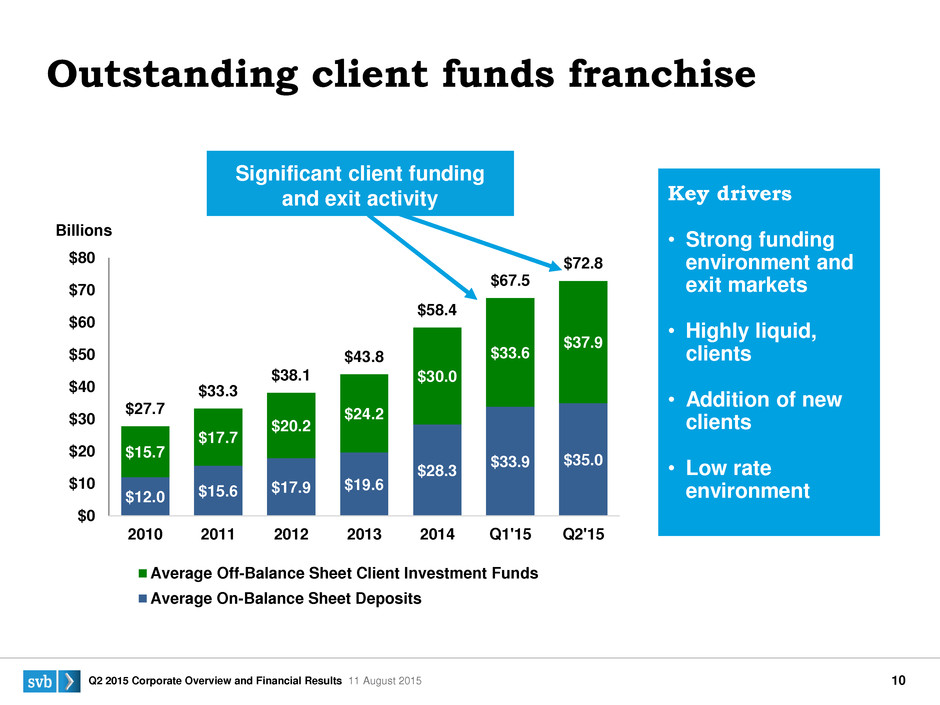
S V B 2 0 1 4 4 :3 Q2 2015 Corporate Overview and Financial Results 11 August 2015 10 Outstanding client funds franchise Significant client funding and exit activity Key drivers • Strong funding environment and exit markets • Highly liquid, clients • Addition of new clients • Low rate environment “Copy of IR Roadshow Charts x – Active File” Data: Annual Tab A 42 – C 69 Chart: Annual Charts Tab A4 $12.0 $15.6 $17.9 $19.6 $28.3 $33.9 $35.0 $15.7 $17.7 $20.2 $24.2 $30.0 $33.6 $37.9 $27.7 $33.3 $38.1 $43.8 $58.4 $67.5 $72.8 $0 $10 $20 $30 $40 $50 $60 $70 $80 2010 2011 2012 2013 2014 Q1'15 Q2'15 Billions Average Off-Balance Sheet Client Investment Funds Average On-Balance Sheet Deposits
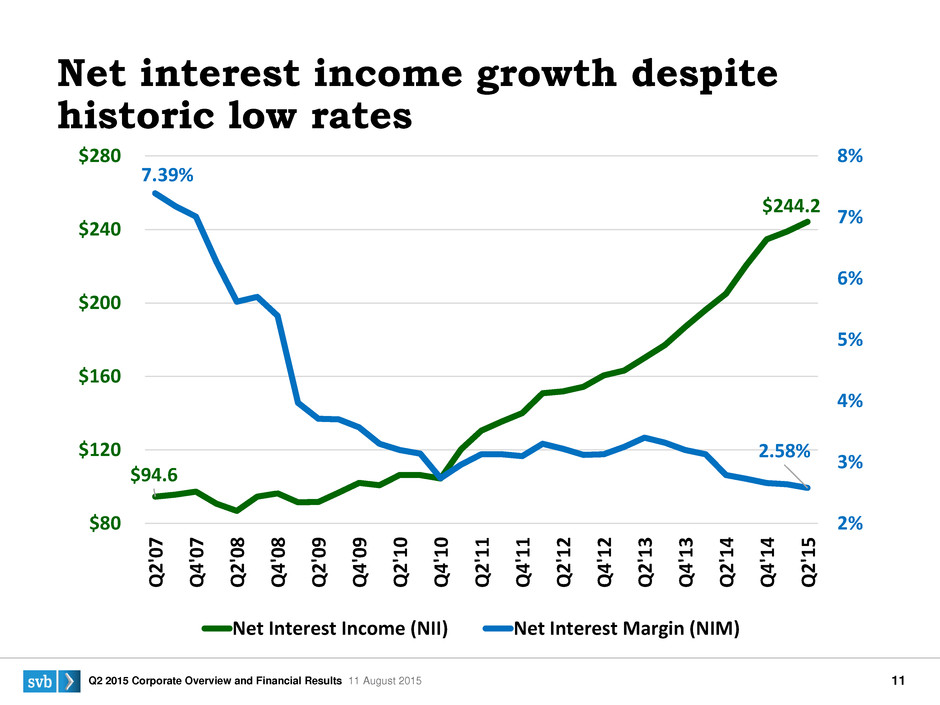
S V B 2 0 1 4 4 :3 Q2 2015 Corporate Overview and Financial Results 11 August 2015 11 Net interest income growth despite historic low rates $94.6 $244.2 7.39% 2.58% 2% 3% 4% 5% 6% 7% 8% $80 $120 $160 $200 $240 $280 Q2' 07 Q4' 07 Q2' 08 Q4' 08 Q2' 09 Q4' 09 Q2' 10 Q4' 10 Q2' 11 Q4' 11 Q2' 12 Q4' 12 Q2' 13 Q4' 13 Q2' 14 Q4' 14 Q2' 15 Net Interest Income (NII) Net Interest Margin (NIM)
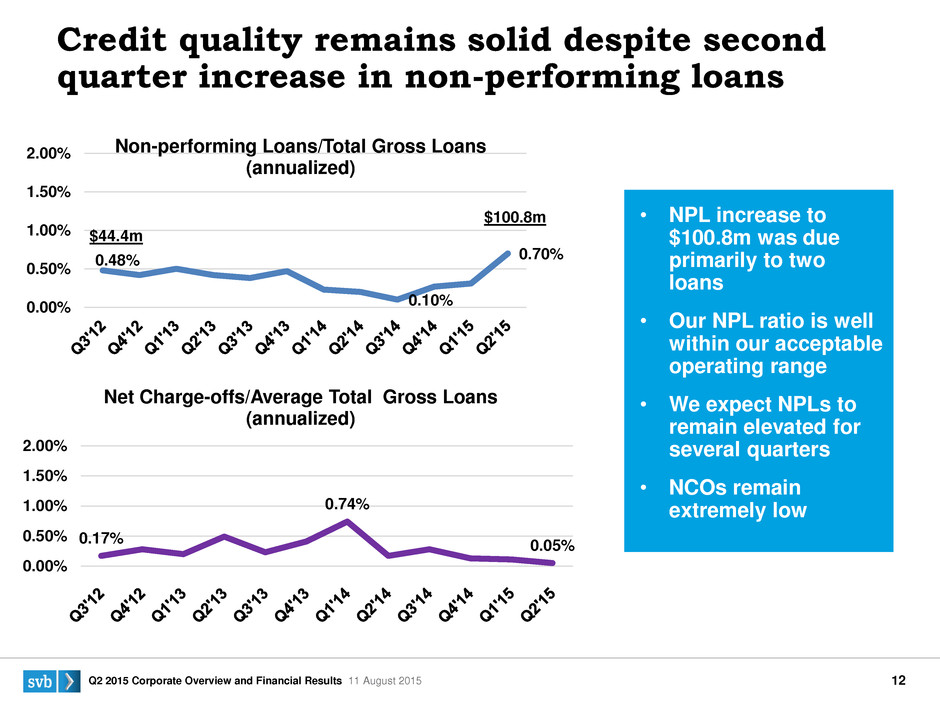
S V B 2 0 1 4 4 :3 Q2 2015 Corporate Overview and Financial Results 11 August 2015 12 • NPL increase to $100.8m was due primarily to two loans • Our NPL ratio is well within our acceptable operating range • We expect NPLs to remain elevated for several quarters • NCOs remain extremely low TAB: Quarterly Location: A63 - C74 Millions Credit quality remains solid despite second quarter increase in non-performing loans 0.48% 0.10% 0.70% 0.00% 0.50% 1.00% 1.50% 2.00% Non-performing Loans/Total Gross Loans (annualized) 0.17% 0.74% 0.05% 0.00% 0.50% 1.00% 1.50% 2.00% Net Charge-offs/Average Total Gross Loans (annualized) $44.4m $100.8m
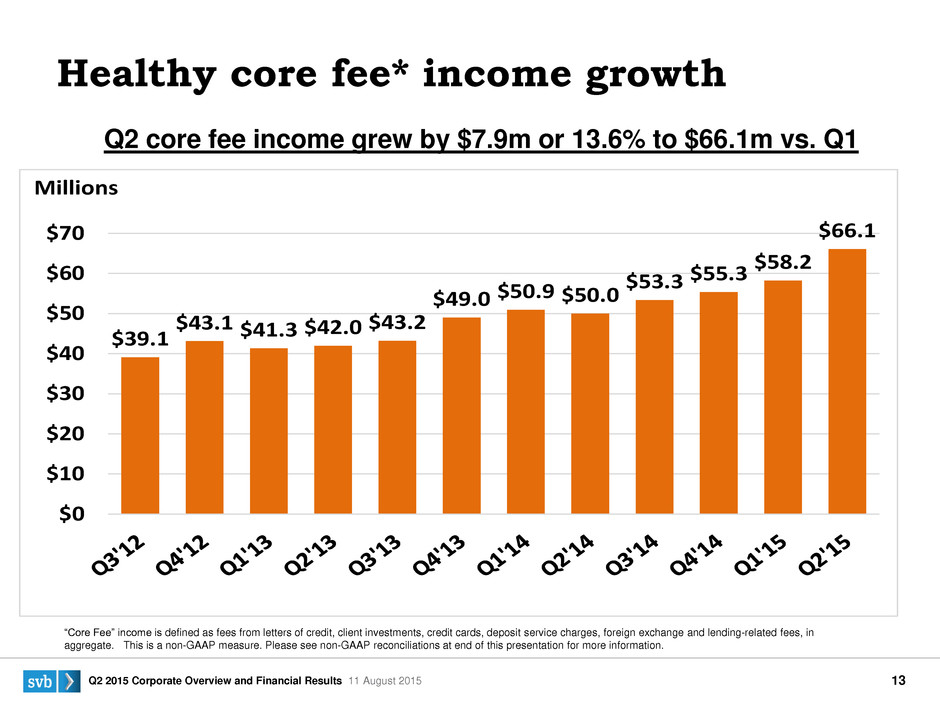
S V B 2 0 1 4 4 :3 Q2 2015 Corporate Overview and Financial Results 11 August 2015 13 “Core Fee” income is defined as fees from letters of credit, client investments, credit cards, deposit service charges, foreign exchange and lending-related fees, in aggregate. This is a non-GAAP measure. Please see non-GAAP reconciliations at end of this presentation for more information. TAB: NonII History Location: A3 – AB10 Healthy core fee* income growth Q2 core fee income grew by $7.9m or 13.6% to $66.1m vs. Q1 $39.1 $43.1 $41.3 $42.0 $43.2 $49.0 $50.9 $50.0 $53.3 $55.3 $58.2 $66.1 $0 $10 $20 $30 $40 $50 $60 $70 Millions
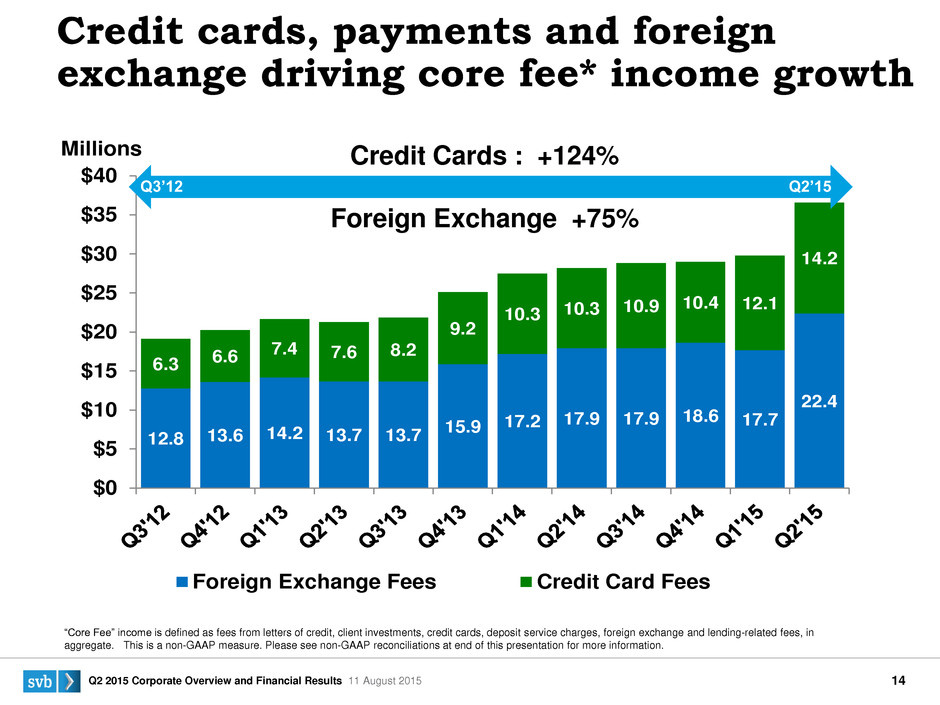
S V B 2 0 1 4 4 :3 Q2 2015 Corporate Overview and Financial Results 11 August 2015 14 12.8 13.6 14.2 13.7 13.7 15.9 17.2 17.9 17.9 18.6 17.7 22.4 6.3 6.6 7.4 7.6 8.2 9.2 10.3 10.3 10.9 10.4 12.1 14.2 $0 $5 $10 $15 $20 $25 $30 $35 $40 Millions Foreign Exchange Fees Credit Card Fees Credit Cards : +124% Foreign Exchange +75% TAB: NonII History Location: A3 – AB10 Q3’12 Q2’15 Credit cards, payments and foreign exchange driving core fee* income growth “Core Fee” income is defined as fees from letters of credit, client investments, credit cards, deposit service charges, foreign exchange and lending-related fees, in aggregate. This is a non-GAAP measure. Please see non-GAAP reconciliations at end of this presentation for more information.
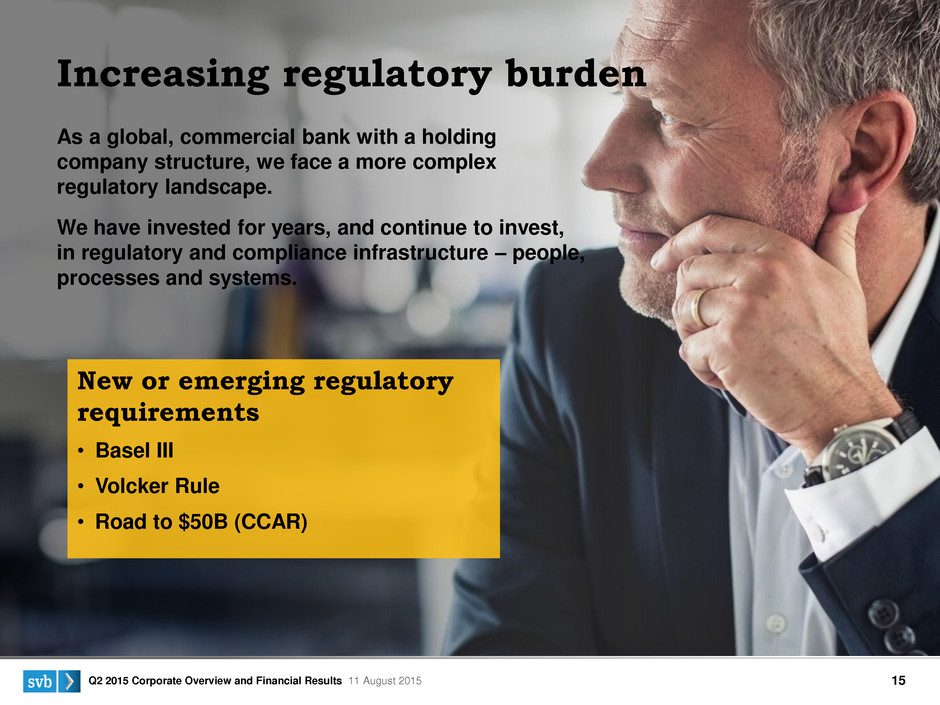
S V B 2 0 1 4 4 :3 Q2 2015 Corporate Overview and Financial Results 11 August 2015 15 Increasing regulatory burden As a global, commercial bank with a holding company structure, we face a more complex regulatory landscape. We have invested for years, and continue to invest, in regulatory and compliance infrastructure – people, processes and systems. New or emerging regulatory requirements • Basel III • Volcker Rule • Road to $50B (CCAR)
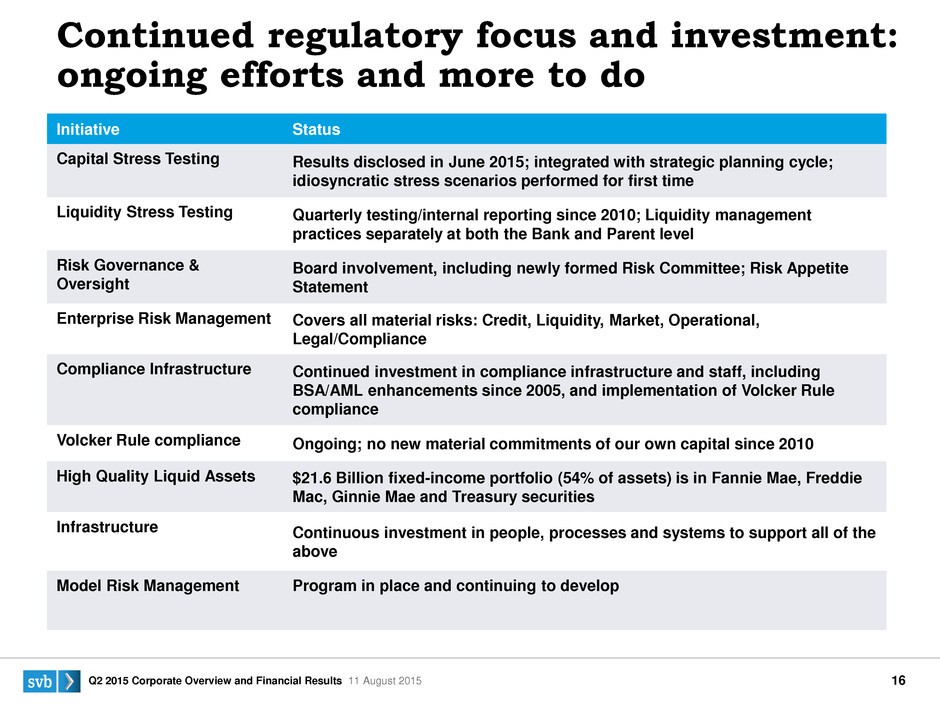
S V B 2 0 1 4 4 :3 Q2 2015 Corporate Overview and Financial Results 11 August 2015 16 Initiative Status Capital Stress Testing Results disclosed in June 2015; integrated with strategic planning cycle; idiosyncratic stress scenarios performed for first time Liquidity Stress Testing Quarterly testing/internal reporting since 2010; Liquidity management practices separately at both the Bank and Parent level Risk Governance & Oversight Board involvement, including newly formed Risk Committee; Risk Appetite Statement Enterprise Risk Management Covers all material risks: Credit, Liquidity, Market, Operational, Legal/Compliance Compliance Infrastructure Continued investment in compliance infrastructure and staff, including BSA/AML enhancements since 2005, and implementation of Volcker Rule compliance Volcker Rule compliance Ongoing; no new material commitments of our own capital since 2010 High Quality Liquid Assets $21.6 Billion fixed-income portfolio (54% of assets) is in Fannie Mae, Freddie Mac, Ginnie Mae and Treasury securities Infrastructure Continuous investment in people, processes and systems to support all of the above Model Risk Management Program in place and continuing to develop Continued regulatory focus and investment: ongoing efforts and more to do
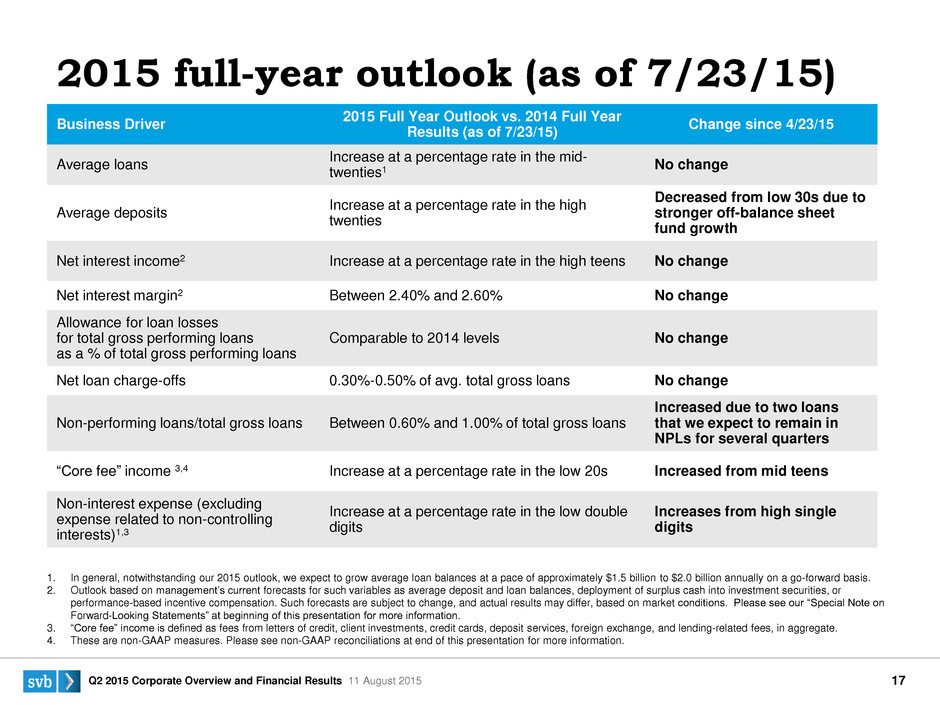
S V B 2 0 1 4 4 :3 Q2 2015 Corporate Overview and Financial Results 11 August 2015 17 Business Driver 2015 Full Year Outlook vs. 2014 Full Year Results (as of 7/23/15) Change since 4/23/15 Average loans Increase at a percentage rate in the mid- twenties1 No change Average deposits Increase at a percentage rate in the high twenties Decreased from low 30s due to stronger off-balance sheet fund growth Net interest income2 Increase at a percentage rate in the high teens No change Net interest margin2 Between 2.40% and 2.60% No change Allowance for loan losses for total gross performing loans as a % of total gross performing loans Comparable to 2014 levels No change Net loan charge-offs 0.30%-0.50% of avg. total gross loans No change Non-performing loans/total gross loans Between 0.60% and 1.00% of total gross loans Increased due to two loans that we expect to remain in NPLs for several quarters “Core fee” income 3,4 Increase at a percentage rate in the low 20s Increased from mid teens Non-interest expense (excluding expense related to non-controlling interests)1,3 Increase at a percentage rate in the low double digits Increases from high single digits 2015 full-year outlook (as of 7/23/15) 1. In general, notwithstanding our 2015 outlook, we expect to grow average loan balances at a pace of approximately $1.5 billion to $2.0 billion annually on a go-forward basis. 2. Outlook based on management’s current forecasts for such variables as average deposit and loan balances, deployment of surplus cash into investment securities, or performance-based incentive compensation. Such forecasts are subject to change, and actual results may differ, based on market conditions. Please see our “Special Note on Forward-Looking Statements” at beginning of this presentation for more information. 3. “Core fee” income is defined as fees from letters of credit, client investments, credit cards, deposit services, foreign exchange, and lending-related fees, in aggregate. 4. These are non-GAAP measures. Please see non-GAAP reconciliations at end of this presentation for more information.
S V B 2 0 1 4 4 :3 Q2 2015 Corporate Overview and Financial Results 11 August 2015 18 Appendix
S V B 2 0 1 4 4 :3 Q2 2015 Corporate Overview and Financial Results 11 August 2015 19 20 24 26 27 30 31 33 34 36 37 39 40 SVB Platform Financial Highlights ROE Balance Sheet Client Liquidity Credit Quality Investment Securities and Warrant Gains Capital Ratios Efficiency Ratio Interest Rate Sensitivity Additional Information Regarding Forward-Looking Statements Non-GAAP Reconciliations Appendix – contents
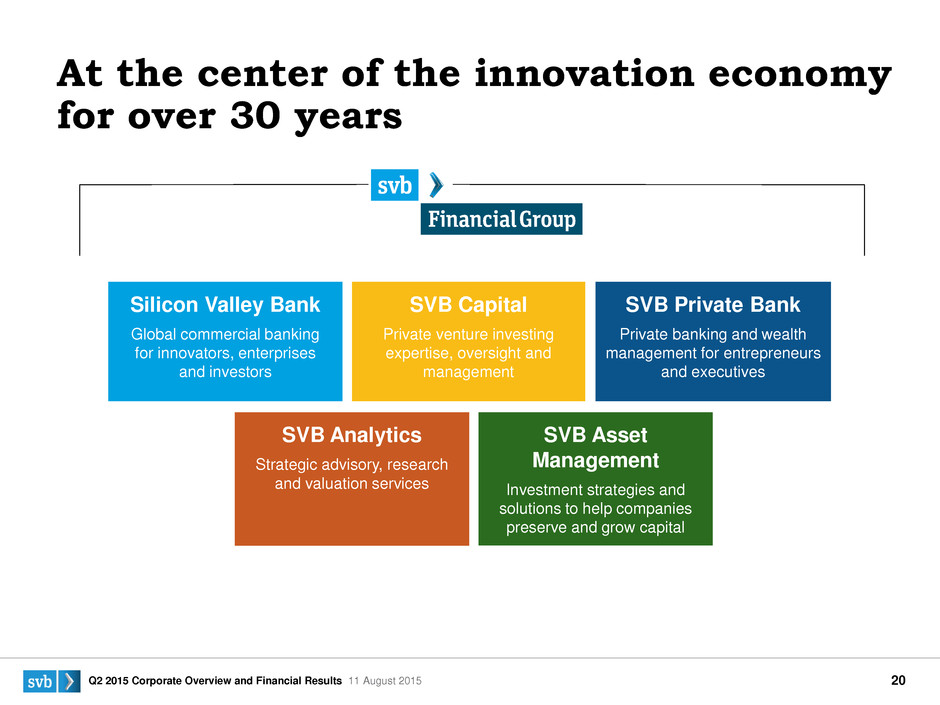
S V B 2 0 1 4 4 :3 Q2 2015 Corporate Overview and Financial Results 11 August 2015 20 At the center of the innovation economy for over 30 years Silicon Valley Bank Global commercial banking for innovators, enterprises and investors SVB Capital Private venture investing expertise, oversight and management SVB Private Bank Private banking and wealth management for entrepreneurs and executives SVB Asset Management Investment strategies and solutions to help companies preserve and grow capital SVB Analytics Strategic advisory, research and valuation services
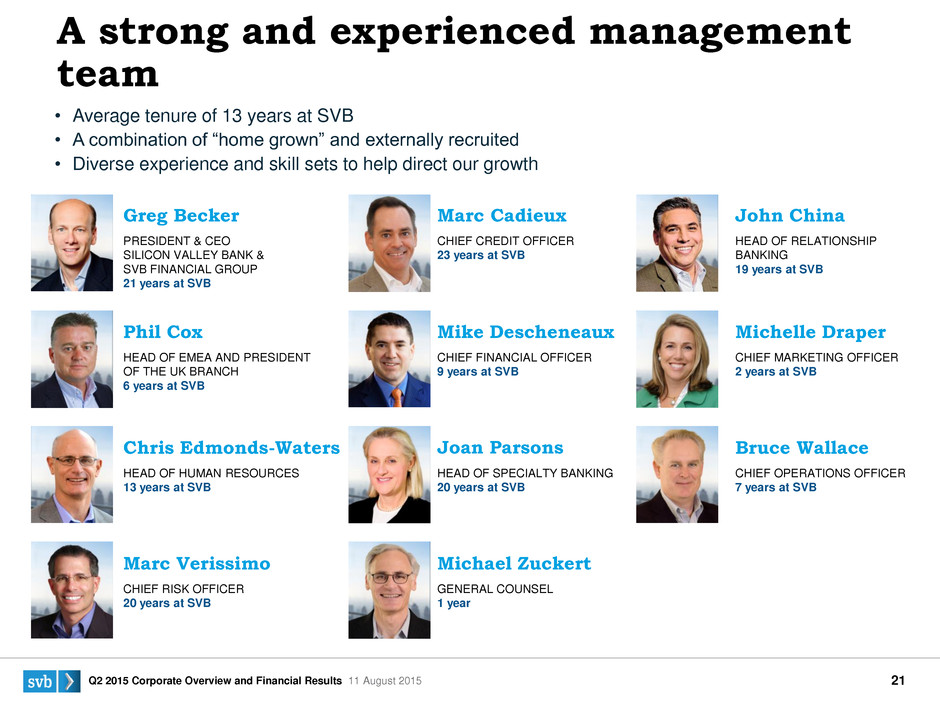
S V B 2 0 1 4 4 :3 Q2 2015 Corporate Overview and Financial Results 11 August 2015 21 Greg Becker PRESIDENT & CEO SILICON VALLEY BANK & SVB FINANCIAL GROUP 21 years at SVB Marc Cadieux CHIEF CREDIT OFFICER 23 years at SVB John China HEAD OF RELATIONSHIP BANKING 19 years at SVB Phil Cox HEAD OF EMEA AND PRESIDENT OF THE UK BRANCH 6 years at SVB Mike Descheneaux CHIEF FINANCIAL OFFICER 9 years at SVB Michelle Draper CHIEF MARKETING OFFICER 2 years at SVB Chris Edmonds-Waters HEAD OF HUMAN RESOURCES 13 years at SVB Joan Parsons HEAD OF SPECIALTY BANKING 20 years at SVB Bruce Wallace CHIEF OPERATIONS OFFICER 7 years at SVB Marc Verissimo CHIEF RISK OFFICER 20 years at SVB Michael Zuckert GENERAL COUNSEL 1 year • Average tenure of 13 years at SVB • A combination of “home grown” and externally recruited • Diverse experience and skill sets to help direct our growth CONFIDENTIAL. FOR RATING AGENCY USE ONLY. NOT FOR DISTRIBUTION. A strong and experienced management team
S V B 2 0 1 4 4 :3 Q2 2015 Corporate Overview and Financial Results 11 August 2015 22 Everything we do helps innovators, enterprises and investors move bold ideas forward, fast.
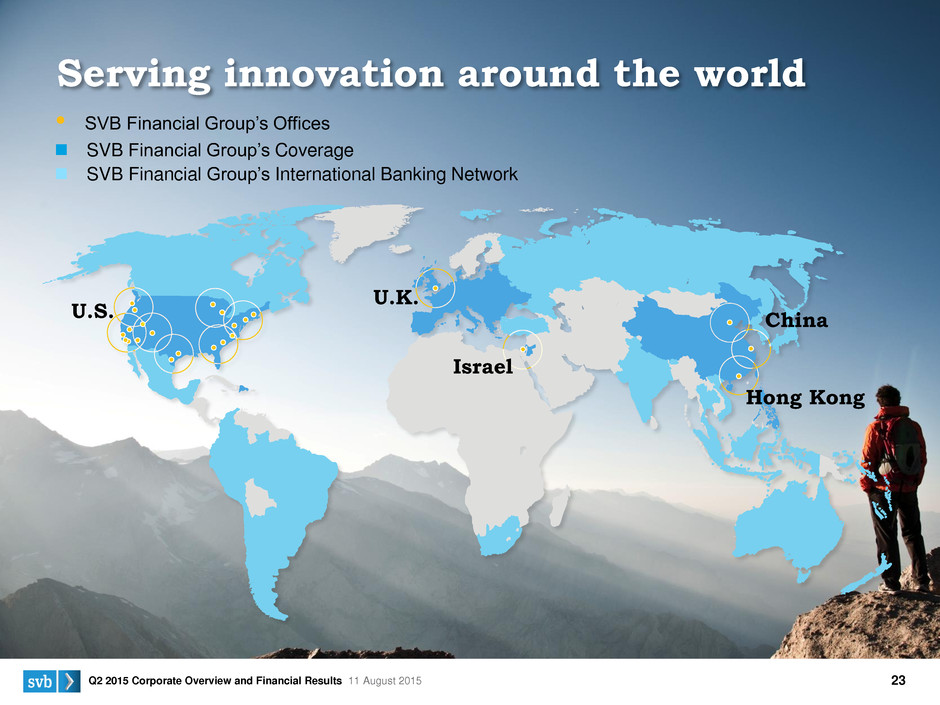
S V B 2 0 1 4 4 :3 Q2 2015 Corporate Overview and Financial Results 11 August 2015 23 Serving innovation around the world SVB Financial Group’s Offices SVB Financial Group’s Coverage SVB Financial Group’s International Banking Network China Hong Kong Israel U.K. U.S.
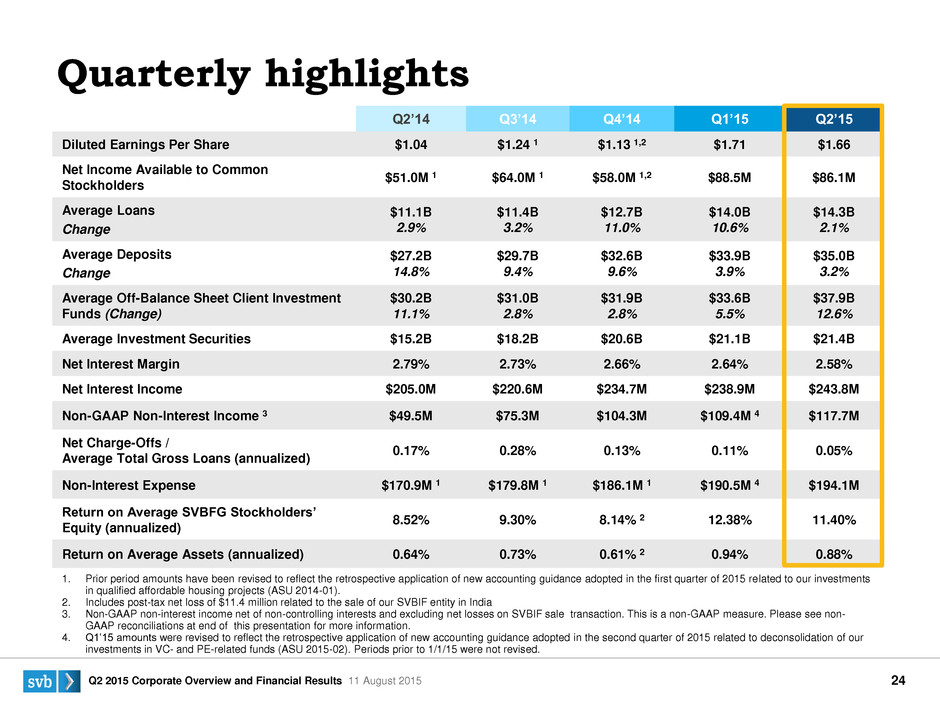
S V B 2 0 1 4 4 :3 Q2 2015 Corporate Overview and Financial Results 11 August 2015 24 Q2’14 Q3’14 Q4’14 Q1’15 Q2’15 Diluted Earnings Per Share $1.04 $1.24 1 $1.13 1,2 $1.71 $1.66 Net Income Available to Common Stockholders $51.0M 1 $64.0M 1 $58.0M 1,2 $88.5M $86.1M Average Loans Change $11.1B 2.9% $11.4B 3.2% $12.7B 11.0% $14.0B 10.6% $14.3B 2.1% Average Deposits Change $27.2B 14.8% $29.7B 9.4% $32.6B 9.6% $33.9B 3.9% $35.0B 3.2% Average Off-Balance Sheet Client Investment Funds (Change) $30.2B 11.1% $31.0B 2.8% $31.9B 2.8% $33.6B 5.5% $37.9B 12.6% Average Investment Securities $15.2B $18.2B $20.6B $21.1B $21.4B Net Interest Margin 2.79% 2.73% 2.66% 2.64% 2.58% Net Interest Income $205.0M $220.6M $234.7M $238.9M $243.8M Non-GAAP Non-Interest Income 3 $49.5M $75.3M $104.3M $109.4M 4 $117.7M Net Charge-Offs / Average Total Gross Loans (annualized) 0.17% 0.28% 0.13% 0.11% 0.05% Non-Interest Expense $170.9M 1 $179.8M 1 $186.1M 1 $190.5M 4 $194.1M Return on Average SVBFG Stockholders’ Equity (annualized) 8.52% 9.30% 8.14% 2 12.38% 11.40% Return on Average Assets (annualized) 0.64% 0.73% 0.61% 2 0.94% 0.88% 1. Prior period amounts have been revised to reflect the retrospective application of new accounting guidance adopted in the first quarter of 2015 related to our investments in qualified affordable housing projects (ASU 2014-01). 2. Includes post-tax net loss of $11.4 million related to the sale of our SVBIF entity in India 3. Non-GAAP non-interest income net of non-controlling interests and excluding net losses on SVBIF sale transaction. This is a non-GAAP measure. Please see non- GAAP reconciliations at end of this presentation for more information. 4. Q1’15 amounts were revised to reflect the retrospective application of new accounting guidance adopted in the second quarter of 2015 related to deconsolidation of our investments in VC- and PE-related funds (ASU 2015-02). Periods prior to 1/1/15 were not revised. Quarterly highlights
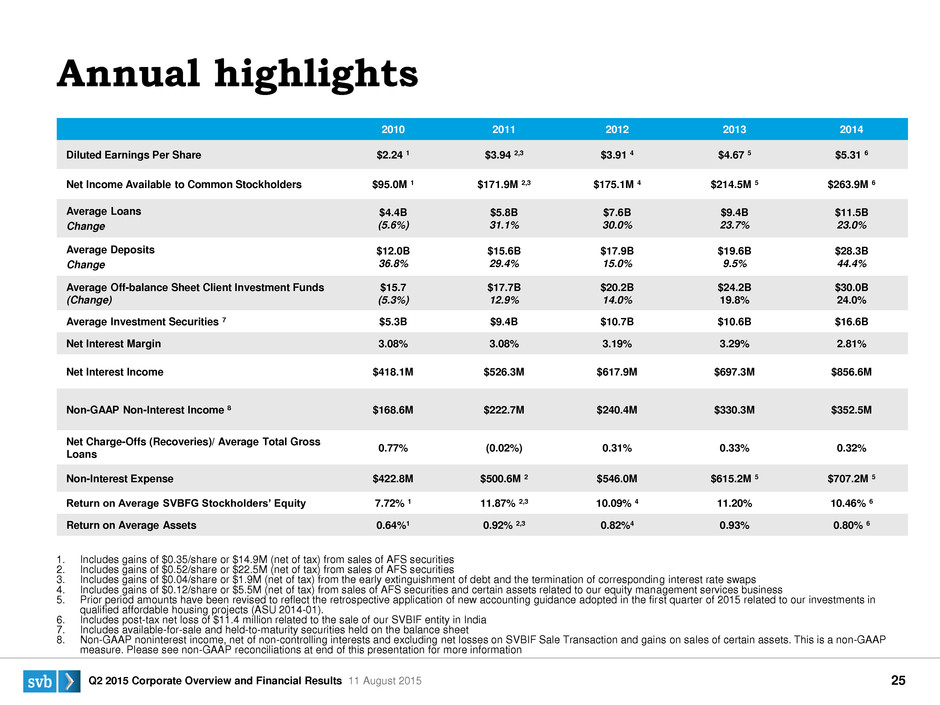
S V B 2 0 1 4 4 :3 Q2 2015 Corporate Overview and Financial Results 11 August 2015 25 2010 2011 2012 2013 2014 Diluted Earnings Per Share $2.24 1 $3.94 2,3 $3.91 4 $4.67 5 $5.31 6 Net Income Available to Common Stockholders $95.0M 1 $171.9M 2,3 $175.1M 4 $214.5M 5 $263.9M 6 Average Loans Change $4.4B (5.6%) $5.8B 31.1% $7.6B 30.0% $9.4B 23.7% $11.5B 23.0% Average Deposits Change $12.0B 36.8% $15.6B 29.4% $17.9B 15.0% $19.6B 9.5% $28.3B 44.4% Average Off-balance Sheet Client Investment Funds (Change) $15.7 (5.3%) $17.7B 12.9% $20.2B 14.0% $24.2B 19.8% $30.0B 24.0% Average Investment Securities 7 $5.3B $9.4B $10.7B $10.6B $16.6B Net Interest Margin 3.08% 3.08% 3.19% 3.29% 2.81% Net Interest Income $418.1M $526.3M $617.9M $697.3M $856.6M Non-GAAP Non-Interest Income 8 $168.6M $222.7M $240.4M $330.3M $352.5M Net Charge-Offs (Recoveries)/ Average Total Gross Loans 0.77% (0.02%) 0.31% 0.33% 0.32% Non-Interest Expense $422.8M $500.6M 2 $546.0M $615.2M 5 $707.2M 5 Return on Average SVBFG Stockholders’ Equity 7.72% 1 11.87% 2,3 10.09% 4 11.20% 10.46% 6 Return on Average Assets 0.64%1 0.92% 2,3 0.82%4 0.93% 0.80% 6 1. Includes gains of $0.35/share or $14.9M (net of tax) from sales of AFS securities 2. Includes gains of $0.52/share or $22.5M (net of tax) from sales of AFS securities 3. Includes gains of $0.04/share or $1.9M (net of tax) from the early extinguishment of debt and the termination of corresponding interest rate swaps 4. Includes gains of $0.12/share or $5.5M (net of tax) from sales of AFS securities and certain assets related to our equity management services business 5. Prior period amounts have been revised to reflect the retrospective application of new accounting guidance adopted in the first quarter of 2015 related to our investments in qualified affordable housing projects (ASU 2014-01). 6. Includes post-tax net loss of $11.4 million related to the sale of our SVBIF entity in India 7. Includes available-for-sale and held-to-maturity securities held on the balance sheet 8. Non-GAAP noninterest income, net of non-controlling interests and excluding net losses on SVBIF Sale Transaction and gains on sales of certain assets. This is a non-GAAP measure. Please see non-GAAP reconciliations at end of this presentation for more information Annual highlights
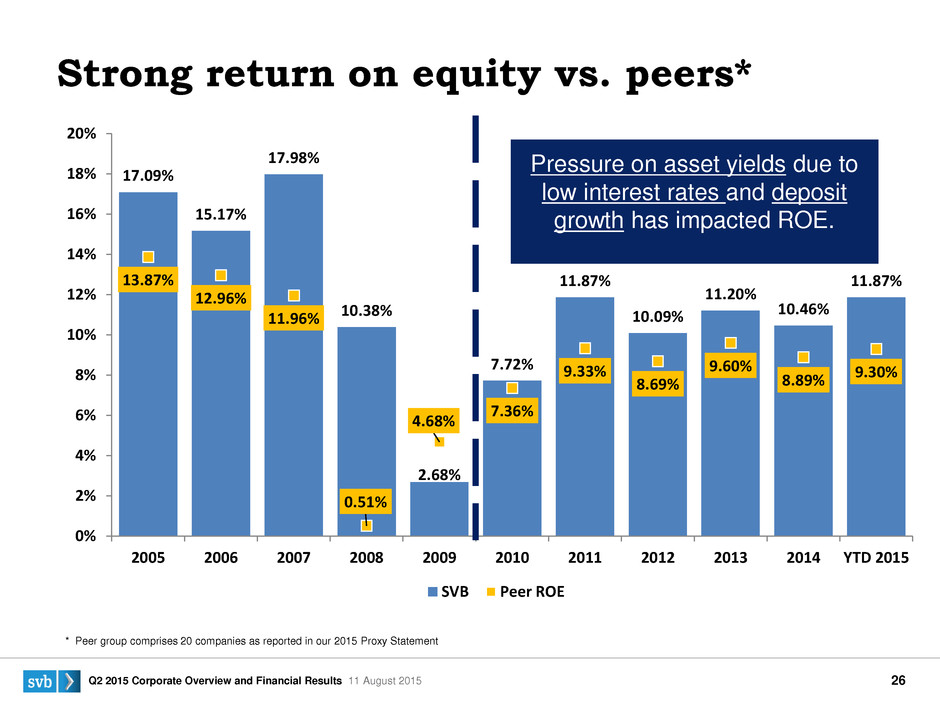
S V B 2 0 1 4 4 :3 Q2 2015 Corporate Overview and Financial Results 11 August 2015 26 17.09% 15.17% 17.98% 10.38% 2.68% 7.72% 11.87% 10.09% 11.20% 10.46% 11.87%13.87% 12.96% 11.96% 0.51% 4.68% 7.36% 9.33% 8.69% 9.60% 8.89% 9.30% 0% 2% 4% 6% 8% 10% 12% 14% 16% 18% 20% 2005 2006 2007 2008 2009 2010 2011 2012 2013 2014 YTD 2015 SVB Peer ROE TAB: Ratios Location: A13-B25 Pressure on asset yields due to low interest rates and deposit growth has impacted ROE. Strong return on equity vs. peers* * Peer group comprises 20 companies as reported in our 2015 Proxy Statement
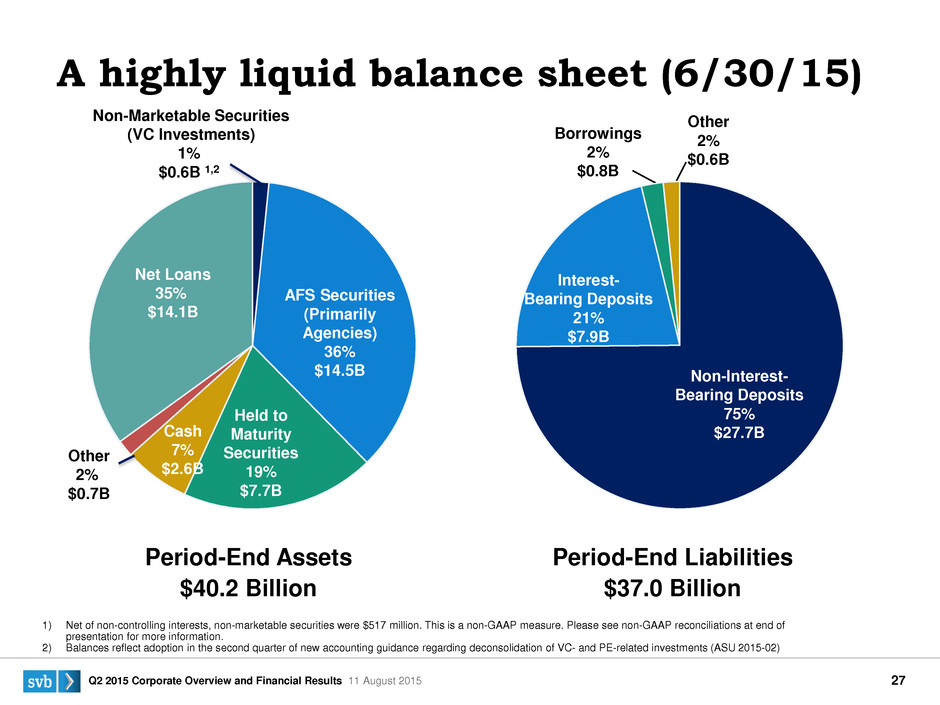
S V B 2 0 1 4 4 :3 Q2 2015 Corporate Overview and Financial Results 11 August 2015 27 TAB: Balance Sheet Location: A2 – O14 A highly liquid balance sheet (6/30/15) TAB: Balance Sheet Location: A2 – O14 Period-End Assets $40.2 Billion Period-End Liabilities $37.0 Billion 1) Net of non-controlling interests, non-marketable securities were $517 million. This is a non-GAAP measure. Please see non-GAAP reconciliations at end of presentation for more information. 2) Balances reflect adoption in the second quarter of new accounting guidance regarding deconsolidation of VC- and PE-related investments (ASU 2015-02) Non-Marketable Securities (VC Investments) 1% $0.6B 1,2 Net Loans 35% $14.1B AFS Securities (Primarily Agencies) 36% $14.5B Held to Maturity Securities 19% $7.7B Cash 7% $2.6B Other 2% $0.7B Borrowings 2% $0.8B Interest- Bearing Deposits 21% $7.9B Non-Interest- Bearing Deposits 75% $27.7B Other 2% $0.6B
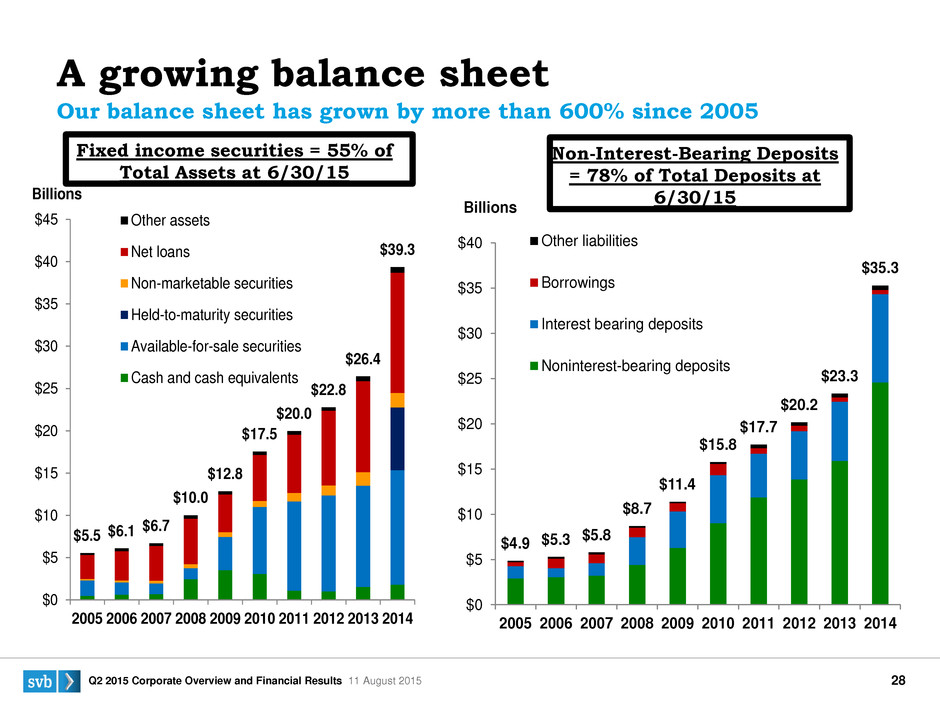
S V B 2 0 1 4 4 :3 Q2 2015 Corporate Overview and Financial Results 11 August 2015 28 Our balance sheet has grown by more than 600% since 2005 TAB: 10-Yr Balance Sheet Location: A2 – Q20 A growing balance sheet Fixed income securities = 55% of Total Assets at 6/30/15 $5.5 $6.1 $6.7 $10.0 $12.8 $17.5 $20.0 $22.8 $26.4 $39.3 $0 $5 $10 $15 $20 $25 $30 $35 $40 $45 2005 2006 2007 2008 2009 2010 2011 2012 2013 2014 Billions Other assets Net loans Non-marketable securities Held-to-maturity securities Available-for-sale securities Cash and cash equivalents Non-Interest-Bearing Deposits = 78% of Total Deposits at 6/30/15 $4.9 $5.3 $5.8 $8.7 $11.4 $15.8 $17.7 $20.2 $23.3 $35.3 $0 $5 $10 $15 $20 $25 $30 $35 $40 2005 2006 2007 2008 2009 2010 2011 2012 2013 2014 Billions Other liabilities Borrowings Interest bearing deposits Noninterest-bearing deposits
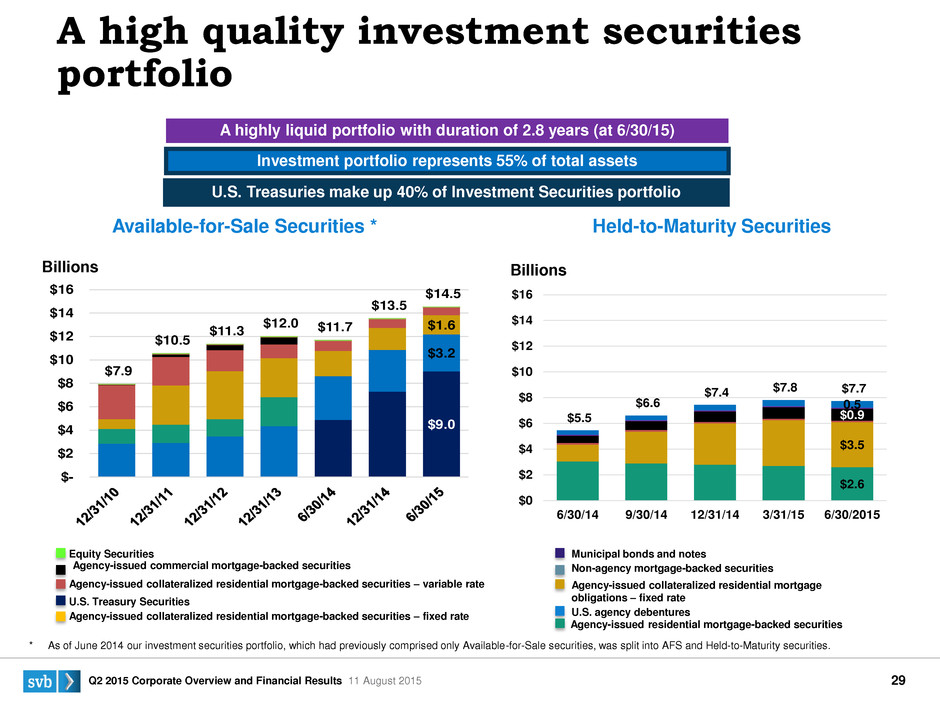
S V B 2 0 1 4 4 :3 Q2 2015 Corporate Overview and Financial Results 11 August 2015 29 A high quality investment securities portfolio TAB: InvSec (Treasury) Location: A15 – K22 Municipal bonds and notes Non-agency mortgage-backed securities Agency-issued collateralized residential mortgage obligations – fixed rate U.S. agency debentures A highly liquid portfolio with duration of 2.8 years (at 6/30/15) Equity Securities Agency-issued commercial mortgage-backed securities Agency-issued collateralized residential mortgage-backed securities – variable rate U.S. Treasury Securities Agency-issued collateralized residential mortgage-backed securities – fixed rate Agency-issued residential mortgage-backed securities Available-for-Sale Securities * Held-to-Maturity Securities Investment portfolio represents 55% of total assets TAB: InvSec (Treasury) Location: A37-B44 * As of June 2014 our investment securities portfolio, which had previously comprised only Available-for-Sale securities, was split into AFS and Held-to-Maturity securities. Billions Billions U.S. Treasuries make up 40% of Investment Securities portfolio $9.0 $3.2 $1.6 $7.9 $10.5 $11.3 $12.0 $11.7 $13.5 $14.5 $- $2 $4 $6 $8 $10 $12 $14 $16 $2.6 $3.5 $0.9 0.5 $5.5 $6.6 $7.4 $7.8 $7.7 $0 $2 $4 $ $8 $10 $12 $14 $16 6/30/14 9/30/14 12/31/14 3/31/15 6/30/2015
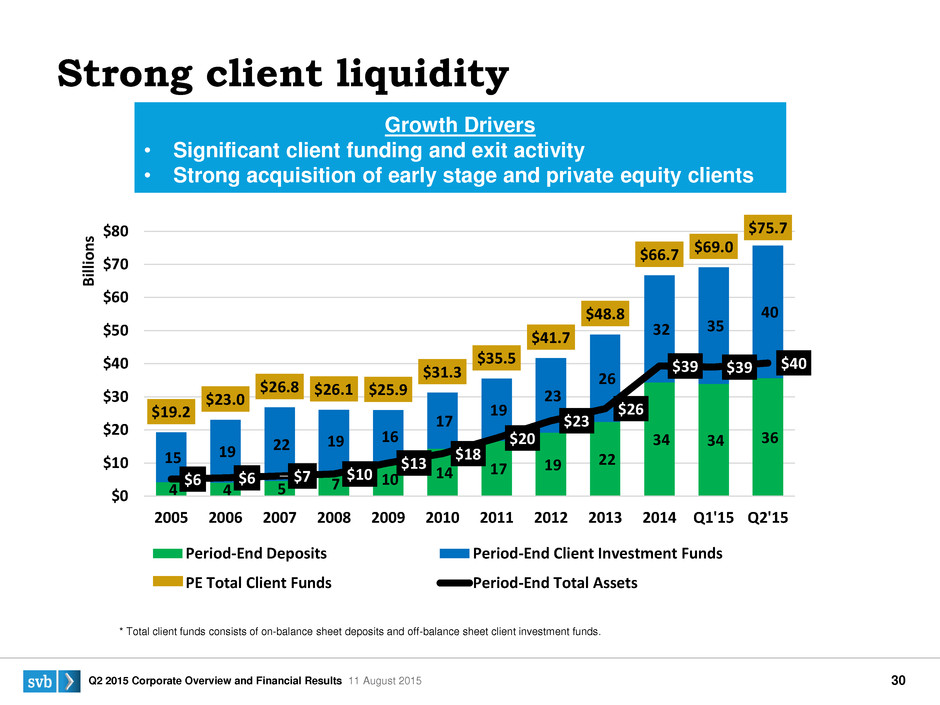
S V B 2 0 1 4 4 :3 Q2 2015 Corporate Overview and Financial Results 11 August 2015 30 * Total client funds consists of on-balance sheet deposits and off-balance sheet client investment funds. TAB: Annual Location: A59 – P61 Strong client liquidity Growth Drivers • Significant client funding and exit activity • Strong acquisition of early stage and private equity clients 4 4 5 7 10 14 17 19 22 34 34 36 15 19 22 19 16 17 19 23 26 32 35 40 $19.2 $23.0 $26.8 $26.1 $25.9 $31.3 $35.5 $41.7 $48.8 $66.7 $69.0 $75.7 $6 $6 $7 $10 $13 $18 $20 $23 $26 $39 $39 $40 $0 $10 $20 $30 $40 $50 $60 $70 $80 2005 2006 2007 2008 2009 2010 2011 2012 2013 2014 Q1'15 Q2'15 Bil lio ns Period-End Deposits Period-End Client Investment Funds PE Total Client Funds Period-End Total Assets
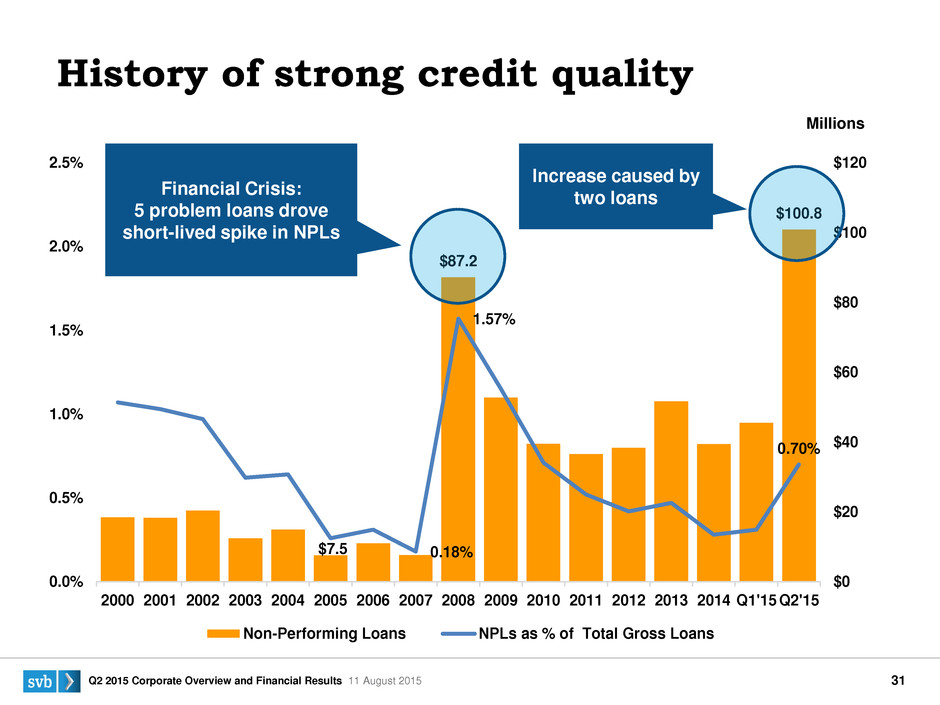
S V B 2 0 1 4 4 :3 Q2 2015 Corporate Overview and Financial Results 11 August 2015 31 $7.5 $87.2 $100.8 0.18% 1.57% 0.70% 0.0% 0.5% 1.0% 1.5% 2.0% 2.5% 2000 2001 2002 2003 2004 2005 2006 2007 2008 2009 2010 2011 2012 2013 2014 Q1'15Q2'15 $0 $20 $40 $60 $80 $100 $120 Non-Performing Loans NPLs as % of Total Gross Loans TAB: Credit Quality Location: A2 – D17 Millions Financial Crisis: 5 problem loans drove short-lived spike in NPLs History of strong credit quality Increase caused by two loans
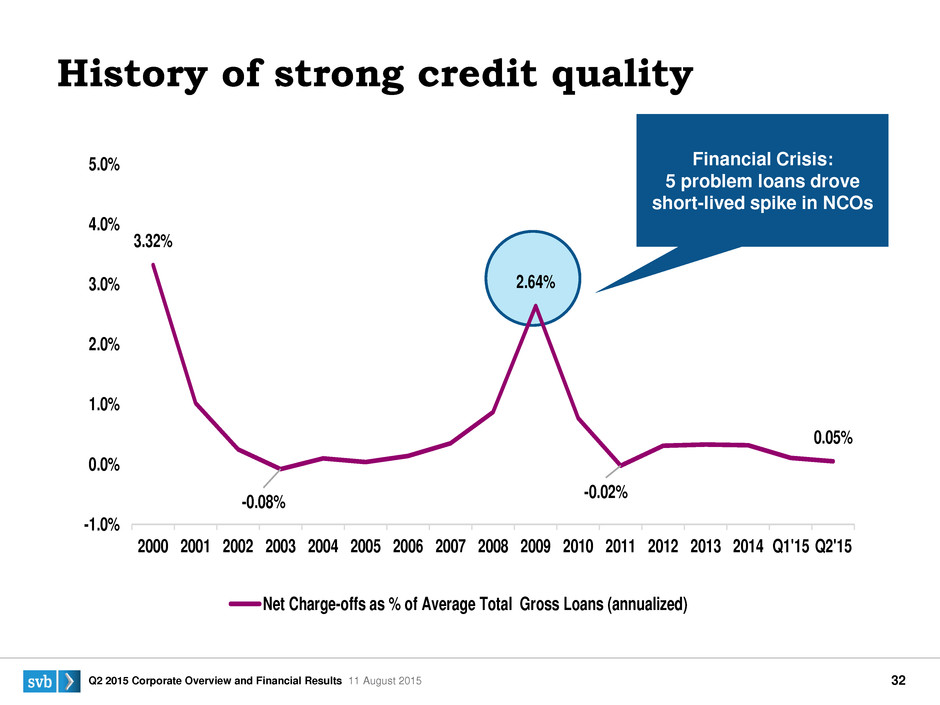
S V B 2 0 1 4 4 :3 Q2 2015 Corporate Overview and Financial Results 11 August 2015 32 TAB: Credit Quality Location: A2 – D17 Financial Crisis: 5 problem loans drove short-lived spike in NCOs History of strong credit quality 3.32% -0.08% 2.64% -0.02% 0.05% -1.0% 0.0% 1.0% 2.0% 3.0% 4.0% 5.0% 2000 2001 2002 2003 2004 2005 2006 2007 2008 2009 2010 2011 2012 2013 2014 Q1'15 Q2'15 Net Charge-offs as % of Average Total Gross Loans (annualized)
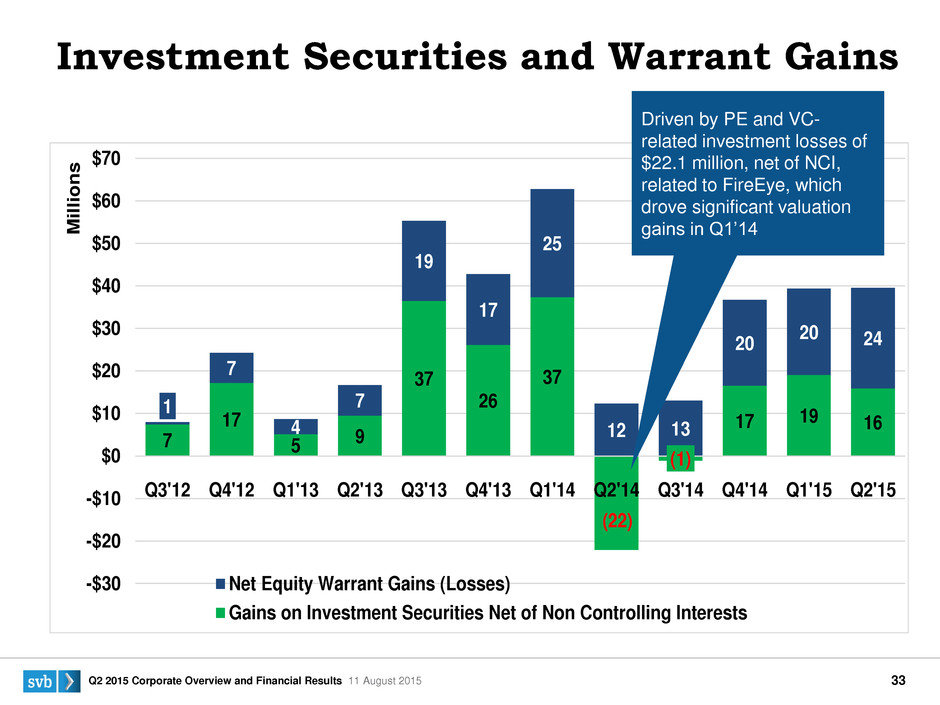
S V B 2 0 1 4 4 :3 Q2 2015 Corporate Overview and Financial Results 11 August 2015 33 7 17 5 9 37 26 37 (22) (1) 17 19 16 1 7 4 7 19 17 25 12 13 20 20 24 -$30 -$20 -$10 $0 $10 $20 $30 $40 $50 $60 $70 Q3'12 Q4'12 Q1'13 Q2'13 Q3'13 Q4'13 Q1'14 Q2'14 Q3'14 Q4'14 Q1'15 Q2'15 Million s Net Equity Warrant Gains (Losses) Gains on Investment Securities Net of Non Controlling Interests Investment Securities and Warrant Gains Driven by PE and VC- related investment losses of $22.1 million, net of NCI, related to FireEye, which drove significant valuation gains in Q1’14
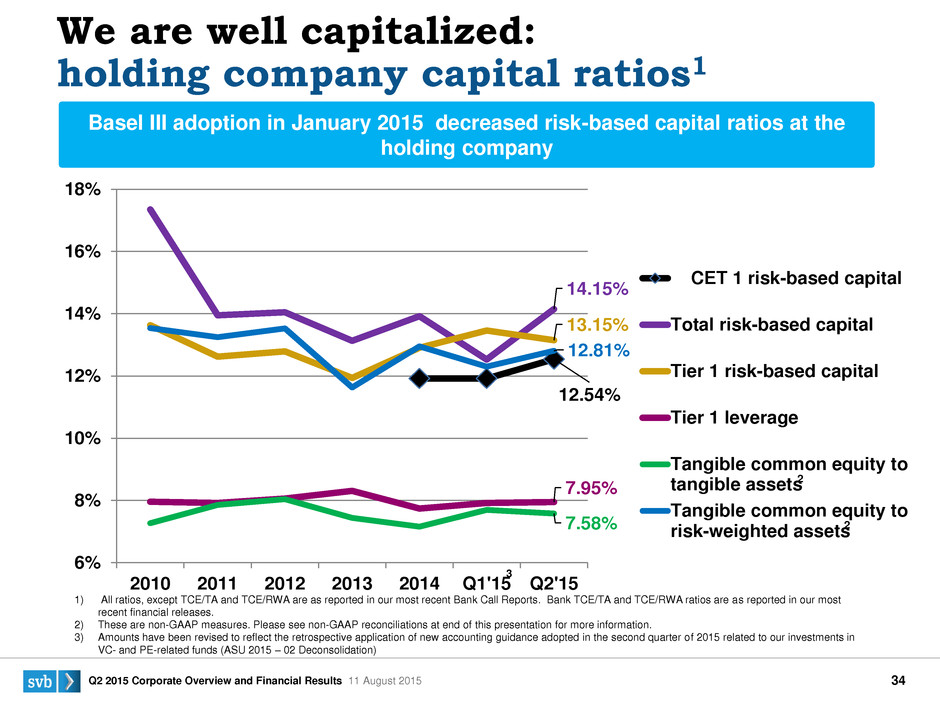
S V B 2 0 1 4 4 :3 Q2 2015 Corporate Overview and Financial Results 11 August 2015 34 12.54% 14.15% 13.15% 7.95% 7.58% 12.81% 6% 8% 10% 12% 14% 16% 18% 2010 2011 2012 2013 2014 Q1'15 Q2'15 CET 1 risk-based capital Total risk-based capital Tier 1 risk-based capital Tier 1 leverage Tangible common equity to tangible assets Tangible common equity to risk-weighted assets We are well capitalized: holding company capital ratios1 TAB: Capital Location: A3 – U7 2 2 1) All ratios, except TCE/TA and TCE/RWA are as reported in our most recent Bank Call Reports. Bank TCE/TA and TCE/RWA ratios are as reported in our most recent financial releases. 2) These are non-GAAP measures. Please see non-GAAP reconciliations at end of this presentation for more information. 3) Amounts have been revised to reflect the retrospective application of new accounting guidance adopted in the second quarter of 2015 related to our investments in VC- and PE-related funds (ASU 2015 – 02 Deconsolidation) Basel III adoption in January 2015 decreased risk-based capital ratios at the holding company 3
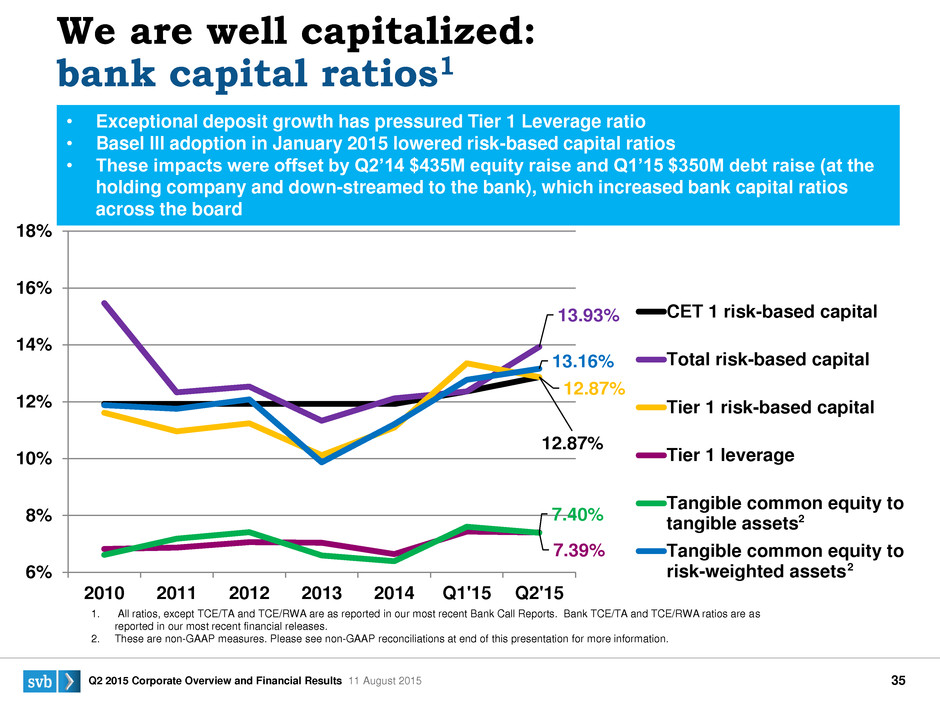
S V B 2 0 1 4 4 :3 Q2 2015 Corporate Overview and Financial Results 11 August 2015 35 12.87% 13.93% 12.87% 7.40% 7.39% 13.16% 6% 8% 10% 12% 14% 16% 18% 2010 2011 2012 2013 2014 Q1'15 Q2'15 CET 1 risk-based capital Total risk-based capital Tier 1 risk-based capital Tier 1 leverage Tangible common equity to tangible assets Tangible common equity to risk-weighted assets Bank Capital Ratios1 1 2 2 TAB: Capital Location: A9 – U13 2 We are well capitalized: bank capital ratios1 1. All ratios, except TCE/TA and TCE/RWA are as reported in our most recent Bank Call Reports. Bank TCE/TA and TCE/RWA ratios are as reported in our most recent financial releases. 2. These are non-GAAP measures. Please see non-GAAP reconciliations at end of this presentation for more information. • Exceptional deposit growth has pressured Tier 1 Leverage ratio • Basel III adoption in January 2015 lowered risk-based capital ratios • These impacts were offset by Q2’14 $435M equity raise and Q1’15 $350M debt raise (at the holding company and down-streamed to the bank), which increased bank capital ratios across the board 2
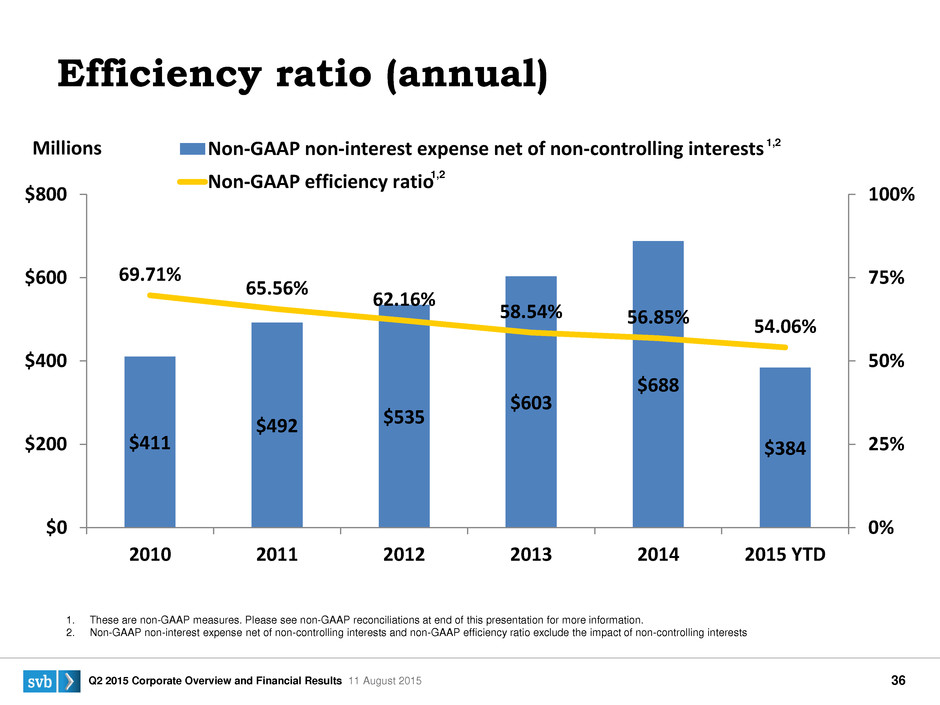
S V B 2 0 1 4 4 :3 Q2 2015 Corporate Overview and Financial Results 11 August 2015 36 $411 $492 $535 $603 $688 $384 69.71% 65.56% 62.16% 58.54% 56.85% 54.06% 0% 25% 50% 75% 100% $0 $200 $400 $600 $800 2010 2011 2012 2013 2014 2015 YTD Non-GAAP non-interest expense net of non-controlling interests Non-GAAP efficiency ratio Millions TAB: NonIE Location: B5 – D17 1. These are non-GAAP measures. Please see non-GAAP reconciliations at end of this presentation for more information. 2. Non-GAAP non-interest expense net of non-controlling interests and non-GAAP efficiency ratio exclude the impact of non-controlling interests 1,2 1,2 Efficiency ratio (annual)
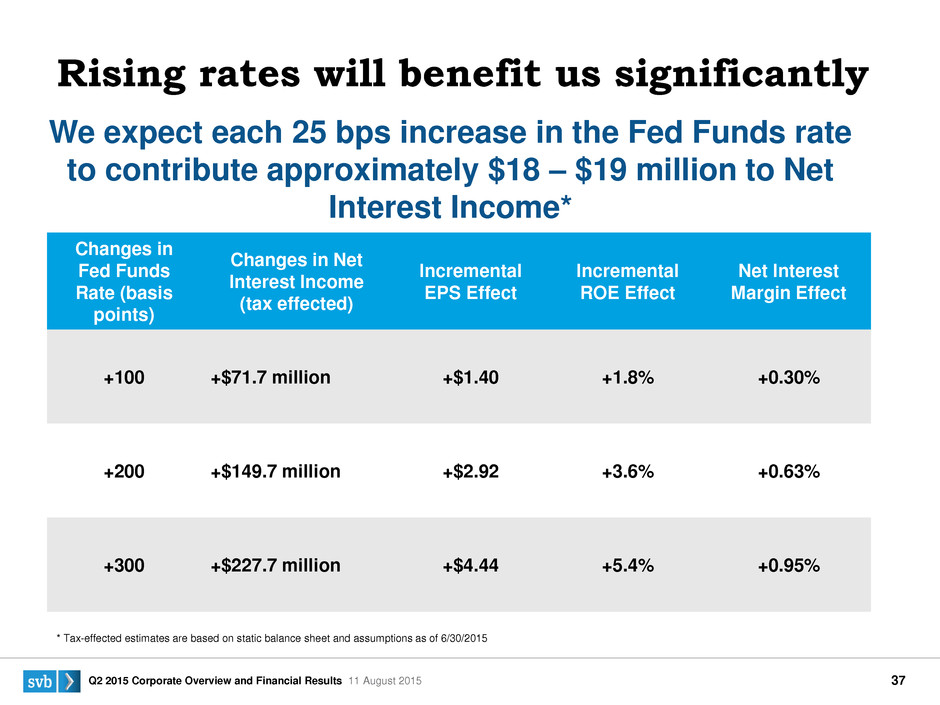
S V B 2 0 1 4 4 :3 Q2 2015 Corporate Overview and Financial Results 11 August 2015 37 Get updates from Tony Yu in ALM/Treasury Changes in Fed Funds Rate (basis points) Changes in Net Interest Income (tax effected) Incremental EPS Effect Incremental ROE Effect Net Interest Margin Effect +100 +$71.7 million +$1.40 +1.8% +0.30% +200 +$149.7 million +$2.92 +3.6% +0.63% +300 +$227.7 million +$4.44 +5.4% +0.95% We expect each 25 bps increase in the Fed Funds rate to contribute approximately $18 – $19 million to Net Interest Income* Rising rates will benefit us significantly * Tax-effected estimates are based on static balance sheet and assumptions as of 6/30/2015
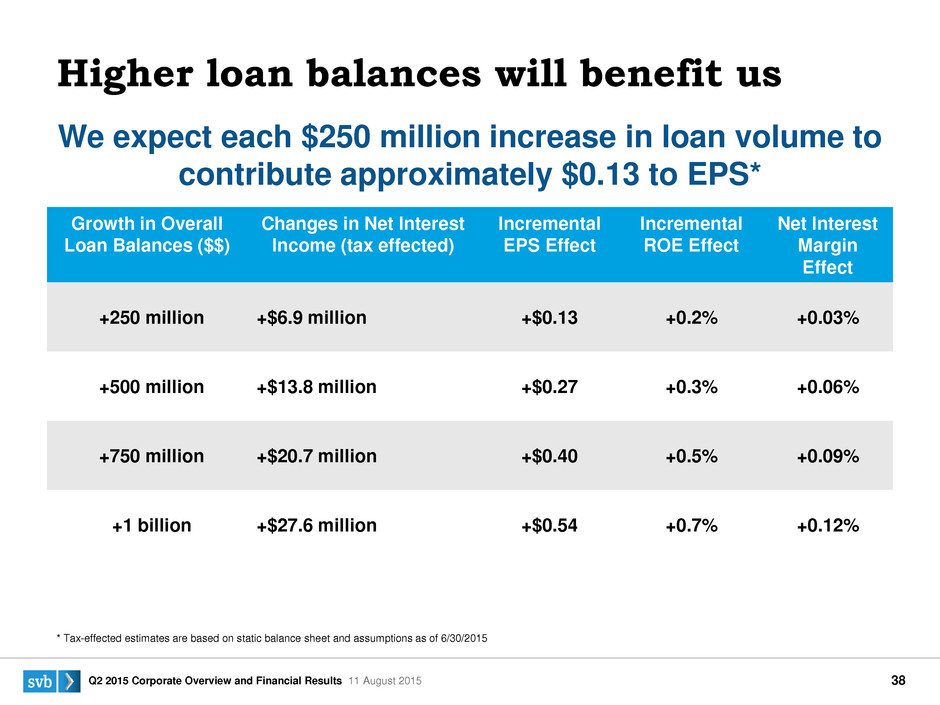
S V B 2 0 1 4 4 :3 Q2 2015 Corporate Overview and Financial Results 11 August 2015 38 Get updates from Fiorella Giantomaso in ALM/Treasury Growth in Overall Loan Balances ($$) Changes in Net Interest Income (tax effected) Incremental EPS Effect Incremental ROE Effect Net Interest Margin Effect +250 million +$6.9 million +$0.13 +0.2% +0.03% +500 million +$13.8 million +$0.27 +0.3% +0.06% +750 million +$20.7 million +$0.40 +0.5% +0.09% +1 billion +$27.6 million +$0.54 +0.7% +0.12% We expect each $250 million increase in loan volume to contribute approximately $0.13 to EPS* * Tax-effected estimates are based on static balance sheet and assumptions as of 6/30/2015 Higher loan balances will benefit us
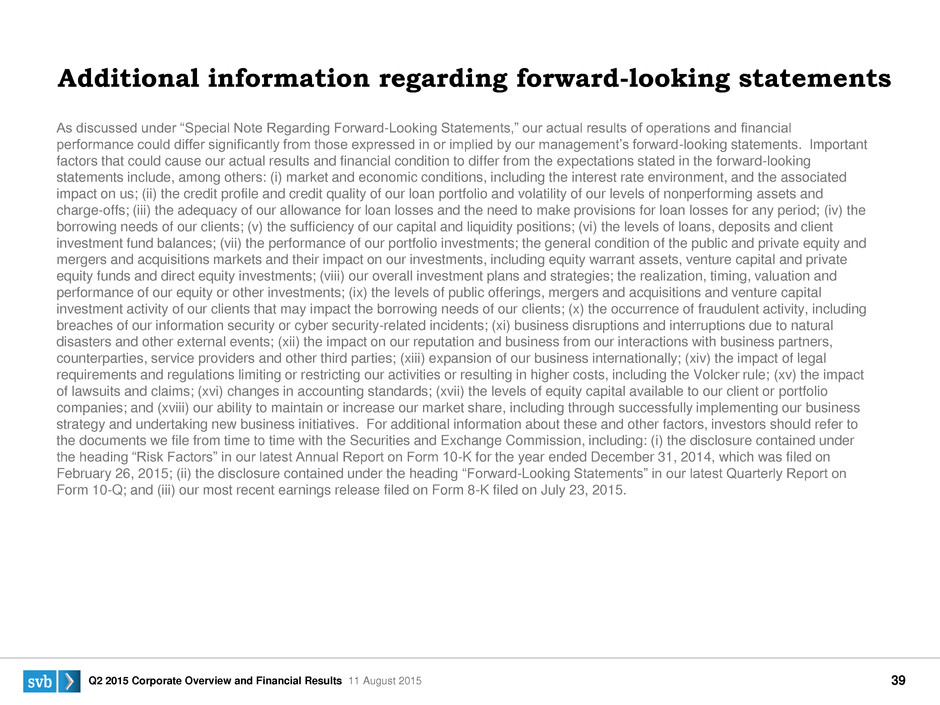
S V B 2 0 1 4 4 :3 Q2 2015 Corporate Overview and Financial Results 11 August 2015 39 As discussed under “Special Note Regarding Forward-Looking Statements,” our actual results of operations and financial performance could differ significantly from those expressed in or implied by our management’s forward-looking statements. Important factors that could cause our actual results and financial condition to differ from the expectations stated in the forward-looking statements include, among others: (i) market and economic conditions, including the interest rate environment, and the associated impact on us; (ii) the credit profile and credit quality of our loan portfolio and volatility of our levels of nonperforming assets and charge-offs; (iii) the adequacy of our allowance for loan losses and the need to make provisions for loan losses for any period; (iv) the borrowing needs of our clients; (v) the sufficiency of our capital and liquidity positions; (vi) the levels of loans, deposits and client investment fund balances; (vii) the performance of our portfolio investments; the general condition of the public and private equity and mergers and acquisitions markets and their impact on our investments, including equity warrant assets, venture capital and private equity funds and direct equity investments; (viii) our overall investment plans and strategies; the realization, timing, valuation and performance of our equity or other investments; (ix) the levels of public offerings, mergers and acquisitions and venture capital investment activity of our clients that may impact the borrowing needs of our clients; (x) the occurrence of fraudulent activity, including breaches of our information security or cyber security-related incidents; (xi) business disruptions and interruptions due to natural disasters and other external events; (xii) the impact on our reputation and business from our interactions with business partners, counterparties, service providers and other third parties; (xiii) expansion of our business internationally; (xiv) the impact of legal requirements and regulations limiting or restricting our activities or resulting in higher costs, including the Volcker rule; (xv) the impact of lawsuits and claims; (xvi) changes in accounting standards; (xvii) the levels of equity capital available to our client or portfolio companies; and (xviii) our ability to maintain or increase our market share, including through successfully implementing our business strategy and undertaking new business initiatives. For additional information about these and other factors, investors should refer to the documents we file from time to time with the Securities and Exchange Commission, including: (i) the disclosure contained under the heading “Risk Factors” in our latest Annual Report on Form 10-K for the year ended December 31, 2014, which was filed on February 26, 2015; (ii) the disclosure contained under the heading “Forward-Looking Statements” in our latest Quarterly Report on Form 10-Q; and (iii) our most recent earnings release filed on Form 8-K filed on July 23, 2015. Additional information regarding forward-looking statements
S V B 2 0 1 4 4 :3 S V B 2 0 1 4 4 :3 S V B 2 0 1 4 4 :3 Q2 2015 Corporate Overview and Financial Results 6 August 2015 40 Non-GAAP reconciliations
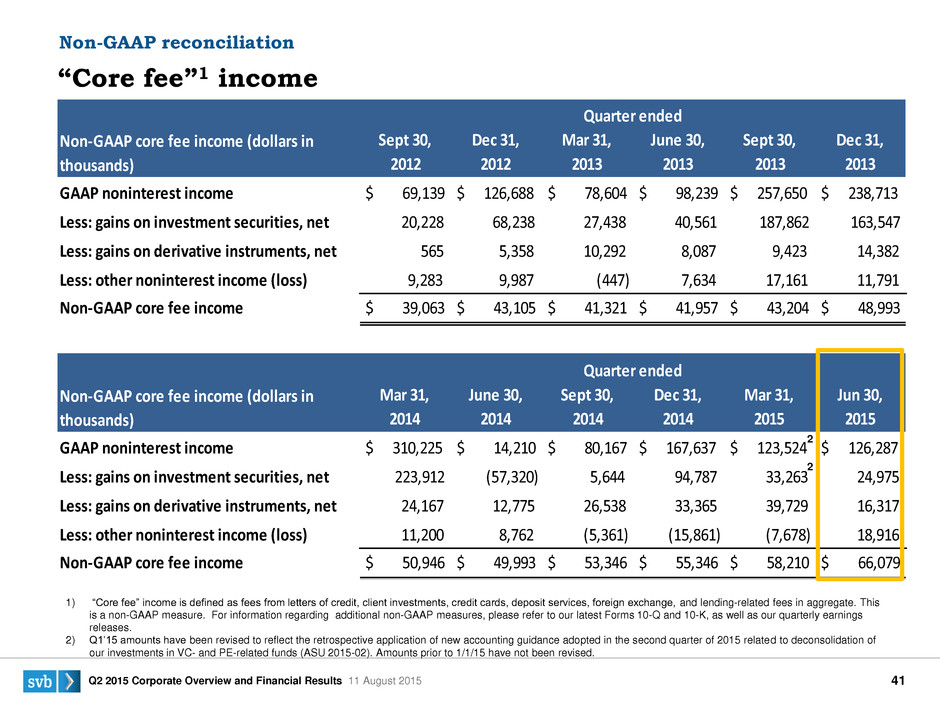
S V B 2 0 1 4 4 :3 Q2 2015 Corporate Overview and Financial Results 11 August 2015 41 Sept 30, 2012 Dec 31, 2012 Mar 31, 2013 June 30, 2013 Sept 30, 2013 Dec 31, 2013 GAAP noninterest income $ 69,139 $ 126,688 $ 78,604 $ 98,239 $ 257,650 $ 238,713 Less: gains on investment securities, net 20,228 68,238 27,438 40,561 187,862 163,547 Less: gains on derivative instruments, net 565 5,358 10,292 8,087 9,423 14,382 Less: other noninterest income (loss) 9,283 9,987 (447) 7,634 17,161 11,791 Non-GAAP core fee income $ 39,063 $ 43,105 $ 41,321 $ 41,957 $ 43,204 $ 48,993 Mar 31, 2014 June 30, 2014 Sept 30, 2014 Dec 31, 2014 Mar 31, 2015 Jun 30, 2015 GAAP noninterest income $ 310,225 $ 14,210 $ 80,167 $ 167,637 $ 123,524 $ 126,287 Less: gains on investment securities, net 223,912 (57,320) 5,644 94,787 33,263 24,975 Less: gains on derivative instruments, net 24,167 12,775 26,538 33,365 39,729 16,317 Less: other noninterest income (loss) 11,200 8,762 (5,361) (15,861) (7,678) 18,916 Non-GAAP core fee income $ 50,946 $ 49,993 $ 53,346 $ 55,346 $ 58,210 $ 66,079 Quarter ended Non-GAAP core fee income (dollars in thousands) Quarter ended Non-GAAP core fee income (dollars in thousands) “Core fee”1 income Non-GAAP reconciliation 1) “Core fee” income is defined as fees from letters of credit, client investments, credit cards, deposit services, foreign exchange, and lending-related fees in aggregate. This is a non-GAAP measure. For information regarding additional non-GAAP measures, please refer to our latest Forms 10-Q and 10-K, as well as our quarterly earnings releases. 2) Q1’15 amounts have been revised to reflect the retrospective application of new accounting guidance adopted in the second quarter of 2015 related to deconsolidation of our investments in VC- and PE-related funds (ASU 2015-02). Amounts prior to 1/1/15 have not been revised. 2 2
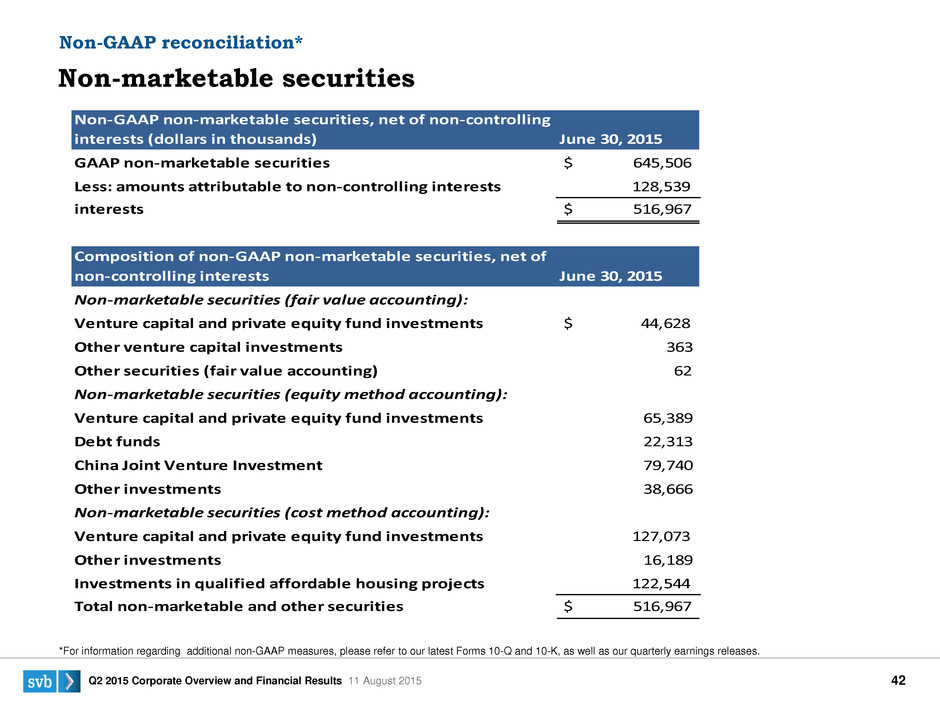
S V B 2 0 1 4 4 :3 Q2 2015 Corporate Overview and Financial Results 11 August 2015 42 *For information regarding additional non-GAAP measures, please refer to our latest Forms 10-Q and 10-K, as well as our quarterly earnings releases. Non-marketable securities Non-GAAP reconciliation* Non-GAAP non-marketable securities, net of non-controlling interests (dollars in thousands) June 30, 2015 GAAP non-marketable securities $ 645,506 Less: amounts attributable to non-controlling interests 128,539 Non-GAAP on-marketable securities, net of non-controlling interests $ 516,967 Composition of non-GAAP non-marketable securities, net of non-controlling interests June 30, 2015 Non-marketable securities (fair value accounting): Venture capital and private equity fund investments $ 44,628 Other venture capital investments 363 Other securities (fair value accounting) 62 Non-marketable securities (equity method accounting): Venture capital and private equity fund investments 65,389 Debt funds 22,313 China Joint Venture Investment 79,740 Other investments 38,666 Non-marketable securities (cost method accounting): Venture capital and private equity fund investments 127,073 Other investments 16,189 Investments in qualified affordable housing projects 122,544 Total non-marketable and other securities $ 516,967
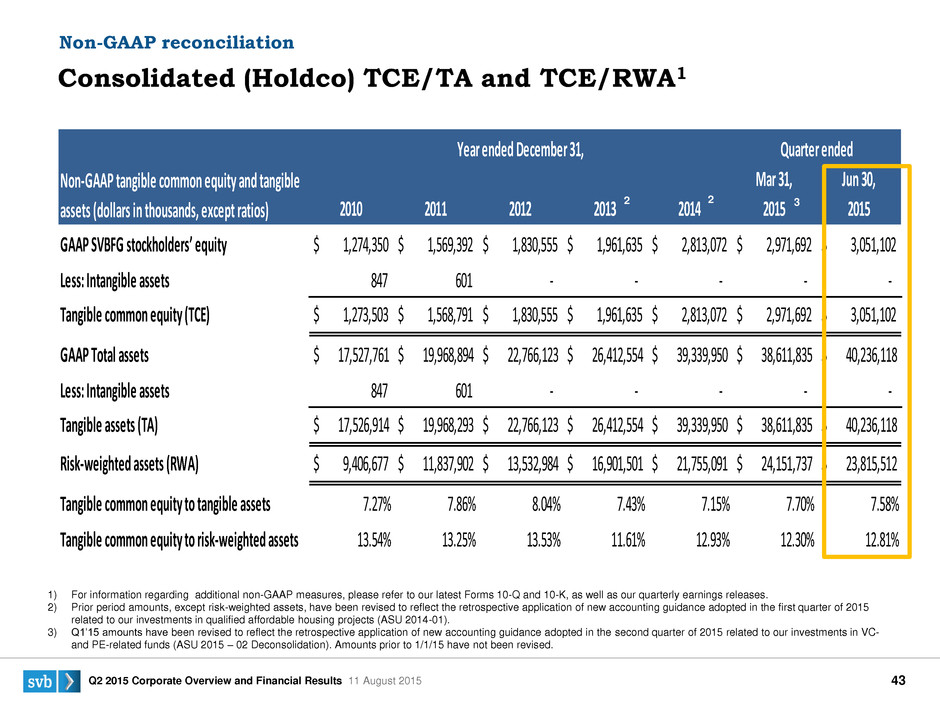
S V B 2 0 1 4 4 :3 Q2 2015 Corporate Overview and Financial Results 11 August 2015 43 2010 2011 2012 2013 2014 Mar 31, 2015 Jun 30, 2015 GAAP SVBFG stockholders’ equity $ 1,274,350 $ 1,569,392 $ 1,830,555 $ 1,961,635 $ 2,813,072 $ 2,971,692 $ 3,051,102 Less: Intangible assets 847 601 - - - - - Tangible common equity (TCE) $ 1,273,503 $ 1,568,791 $ 1,830,555 $ 1,961,635 $ 2,813,072 $ 2,971,692 $ 3,051,102 GAAP Total assets $ 17,527,761 $ 19,968,894 $ 22,766,123 $ 26,412,554 $ 39,339,950 $ 38,611,835 $ 40,236,118 Less: Intangible assets 847 601 - - - - - Tangible assets (TA) $ 17,526,914 $ 19,968,293 $ 22,766,123 $ 26,412,554 $ 39,339,950 $ 38,611,835 $ 40,236,118 Risk-weighted assets (RWA) $ 9,406,677 $ 11,837,902 $ 13,532,984 $ 16,901,501 $ 21,755,091 $ 24,151,737 $ 23,815,512 Tangible common equity to tangible assets 7.27% 7.86% 8.04% 7.43% 7.15% 7.70% 7.58% Tangible common equity to risk-weighted assets 13.54% 13.25% 13.53% 11.61% 12.93% 12.30% 12.81% Year ended December 31, Quarter ended Non-GAAP tangible common equity and tangible assets (dollars in thousands, except ratios) Consolidated (Holdco) TCE/TA and TCE/RWA1 Non-GAAP reconciliation 1) For information regarding additional non-GAAP measures, please refer to our latest Forms 10-Q and 10-K, as well as our quarterly earnings releases. 2) Prior period amounts, except risk-weighted assets, have been revised to reflect the retrospective application of new accounting guidance adopted in the first quarter of 2015 related to our investments in qualified affordable housing projects (ASU 2014-01). 3) Q1’15 amounts have been revised to reflect the retrospective application of new accounting guidance adopted in the second quarter of 2015 related to our investments in VC- and PE-related funds (ASU 2015 – 02 Deconsolidation). Amounts prior to 1/1/15 have not been revised. 2 2 3
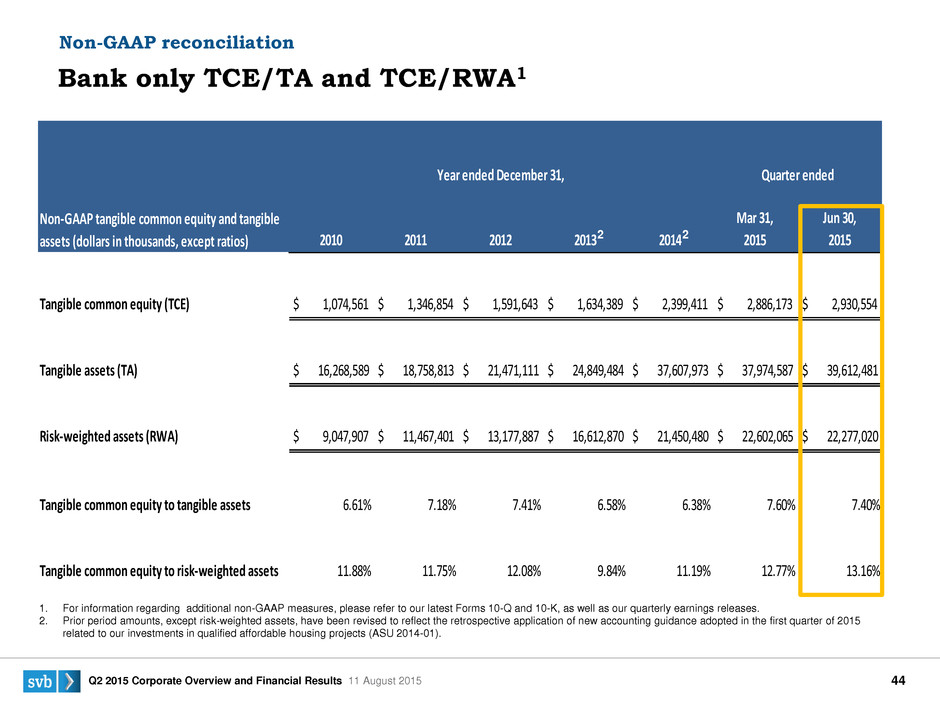
S V B 2 0 1 4 4 :3 Q2 2015 Corporate Overview and Financial Results 11 August 2015 44 2010 2011 2012 2013 2014 Mar 31, 2015 Jun 30, 2015 Tangible common equity (TCE) $ 1,074,561 $ 1,346,854 $ 1,591,643 $ 1,634,389 $ 2,399,411 $ 2,886,173 $ 2,930,554 Tangible assets (TA) $ 16,268,589 $ 18,758,813 $ 21,471,111 $ 24,849,484 $ 37,607,973 $ 37,974,587 $ 39,612,481 Risk-weighted assets (RWA) $ 9,047,907 $ 11,467,401 $ 13,177,887 $ 16,612,870 $ 21,450,480 $ 22,602,065 $ 22,277,020 Tangible common equity to tangible assets 6.61% 7.18% 7.41% 6.58% 6.38% 7.60% 7.40% Tangible common equity to risk-weighted assets 11.88% 11.75% 12.08% 9.84% 11.19% 12.77% 13.16% Non-GAAP tangible common equity and tangible assets (dollars in thousands, except ratios) Year ended December 31, Quarter ended 1. For information regarding additional non-GAAP measures, please refer to our latest Forms 10-Q and 10-K, as well as our quarterly earnings releases. 2. Prior period amounts, except risk-weighted assets, have been revised to reflect the retrospective application of new accounting guidance adopted in the first quarter of 2015 related to our investments in qualified affordable housing projects (ASU 2014-01). Bank only TCE/TA and TCE/RWA1 Non-GAAP reconciliation 2 2
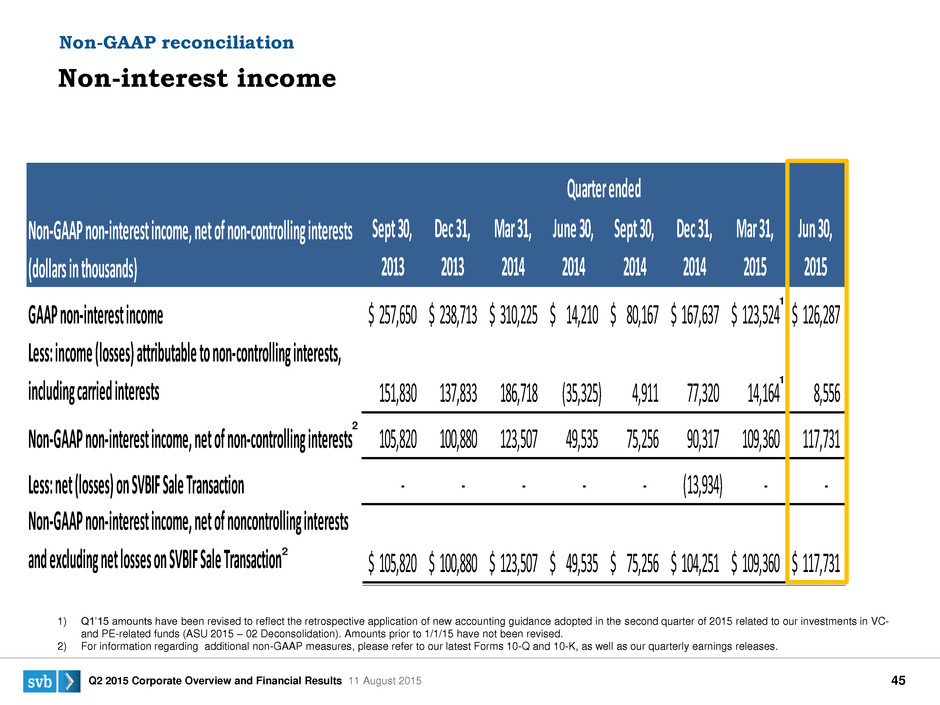
S V B 2 0 1 4 4 :3 Q2 2015 Corporate Overview and Financial Results 11 August 2015 45 Sept 30, 2013 Dec 31, 2013 Mar 31, 2014 June 30, 2014 Sept 30, 2014 Dec 31, 2014 Mar 31, 2015 Jun 30, 2015 GAAP non-interest income 257,650$ 238,713$ 310,225$ 14,210$ 80,167$ 167,637$ 123,524$ 126,287$ Less: income (losses) attributable to non-controlling interests, including carried interests 151,830 137,833 186,718 (35,325) 4,911 77,320 14,164 8,556 Non-GAAP non-interest income, net of non-controlling interests 105,820 100,880 123,507 49,535 75,256 90,317 109,360 117,731 Less: net (losses) on SVBIF Sale Transaction - - - - - (13,934) - - Non-GAAP non-interest income, net of noncontrolling interests and excluding net losses on SVBIF Sale Transaction 105,820$ 100,880$ 123,507$ 49,535$ 75,256$ 104,251$ 109,360$ 117,731$ Non-GAAP non-interest income, net of non-controlling interests (dollars in thousands) Quarter ended Non-interest income Non-GAAP reconciliation 1) Q1’15 amounts have been revised to reflect the retrospective application of new accounting guidance adopted in the second quarter of 2015 related to our investments in VC- and PE-related funds (ASU 2015 – 02 Deconsolidation). Amounts prior to 1/1/15 have not been revised. 2) For information regarding additional non-GAAP measures, please refer to our latest Forms 10-Q and 10-K, as well as our quarterly earnings releases. 1 1 2 2
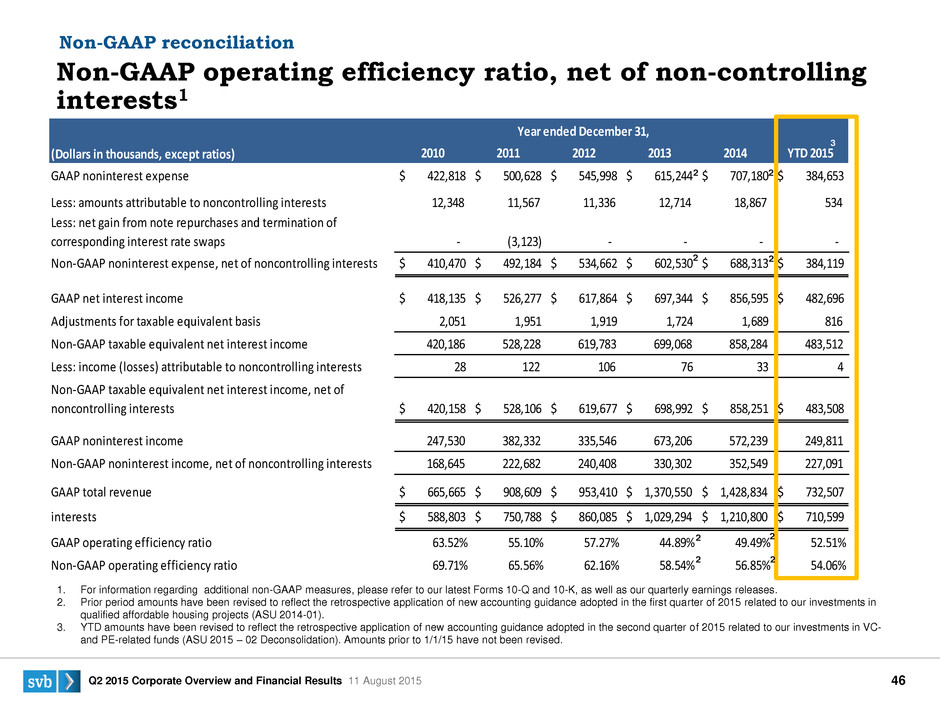
S V B 2 0 1 4 4 :3 Q2 2015 Corporate Overview and Financial Results 11 August 2015 46 2010 2011 2012 2013 2014 YTD 2015 GAAP noninterest expense $ 422,818 $ 500,628 $ 545,998 $ 615,244 $ 707,180 $ 384,653 Less: amounts attributable to noncontrolling interests 12,348 11,567 11,336 12,714 18,867 534 Less: net gain from note repurchases and termination of corresponding interest rate swaps - (3,123) - - - - Non-GAAP noninterest expense, net of noncontrolling interests $ 410,470 $ 492,184 $ 534,662 $ 602,530 $ 688,313 $ 384,119 GAAP net interest income $ 418,135 $ 526,277 $ 617,864 $ 697,344 $ 856,595 $ 482,696 Adjustments for taxable equivalent basis 2,051 1,951 1,919 1,724 1,689 816 Non-GAAP taxable equivalent net interest income 420,186 528,228 619,783 699,068 858,284 483,512 Less: income (losses) attributable to noncontrolling interests 28 122 106 76 33 4 Non-GAAP taxable equivalent net interest income, net of noncontrolling interests $ 420,158 $ 528,106 $ 619,677 $ 698,992 $ 858,251 $ 483,508 GAAP noninterest income 247,530 382,332 335,546 673,206 572,239 249,811 Non-GAAP noninterest income, net of noncontrolling interests 168,645 222,682 240,408 330,302 352,549 227,091 GAAP total revenue $ 665,665 $ 908,609 $ 953,410 $ 1,370,550 $ 1,428,834 $ 732,507 Non-GAAP taxable equivalent revenue, net of noncontrolling interests $ 588,803 $ 750,788 $ 860,085 $ 1,029,294 $ 1,210,800 $ 710,599 GAAP operating efficiency ratio 63.52% 55.10% 57.27% 44.89% 49.49% 52.51% Non-GAAP operating efficiency ratio 69.71% 65.56% 62.16% 58.54% 56.85% 54.06% (Dollars in thousands, except ratios) Year ended December 31, 1. For information regarding additional non-GAAP measures, please refer to our latest Forms 10-Q and 10-K, as well as our quarterly earnings releases. 2. Prior period amounts have been revised to reflect the retrospective application of new accounting guidance adopted in the first quarter of 2015 related to our investments in qualified affordable housing projects (ASU 2014-01). 3. YTD amounts have been revised to reflect the retrospective application of new accounting guidance adopted in the second quarter of 2015 related to our investments in VC- and PE-related funds (ASU 2015 – 02 Deconsolidation). Amounts prior to 1/1/15 have not been revised. Non-GAAP operating efficiency ratio, net of non-controlling interests1 Non-GA P reconciliation 2 2 2 2 2 2 2 2 3
S V B 2 0 1 4 4 :3 Q2 2015 Corporate Overview and Financial Results 11 August 2015 47 Find SVB on LinkedIn, Facebook and Twitter Meghan O’Leary Director of Investor Relations 3005 Tasman Drive Santa Clara, CA 95054 T 408 654 6364 M 650 255 9934 moleary@svb.com
