Attached files
| file | filename |
|---|---|
| 8-K - CURRENT REPORT ON FORM 8-K - PNMAC Holdings, Inc. | pfsi_8k.htm |
Exhibit 99.1

August 2015 Investor Presentation

Forward - Looking Statements 2 This presentation contains forward - looking statements within the meaning of Section 21 E of the Securities Exchange Act of 1934 , as amended, regarding management’s beliefs, estimates, projections and assumptions with respect to, among other things, the Company’s financial results, future operations, business plans and investment strategies, as well as industry and market conditions, all of which are subject to change . Words like “believe,” “expect,” “anticipate,” “promise,” “plan,” and other expressions or words of similar meanings, as well as future or conditional verbs such as “will,” “would,” “should,” “could,” or “may” are generally intended to identify forward - looking statements . Actual results and operations for any future period may vary materially from those projected herein, from past results discussed herein, or from illustrative examples provided herein . Factors which could cause actual results to differ materially from historical results or those anticipated include, but are not limited to : changes in federal, state and local laws and regulations applicable to the highly regulated industry in which we operate ; lawsuits or governmental actions if we do not comply with the laws and regulations applicable to our businesses ; the creation of the Consumer Financial Protection Bureau, or CFPB, and enforcement of its rules ; changes in existing U . S . government - sponsored entities, their current roles or their guarantees or guidelines ; changes to government mortgage modification programs ; the licensing and operational requirements of states and other jurisdictions applicable to our businesses, to which our bank competitors are not subject ; foreclosure delays and changes in foreclosure practices ; certain banking regulations that may limit our business activities ; changes in macroeconomic and U . S . residential real estate market conditions ; difficulties in growing loan production volume ; changes in prevailing interest rates ; increases in loan delinquencies and defaults ; our reliance on PennyMac Mortgage Investment Trust as a significant source of financing for, and revenue related to, our correspondent lending business and purchased mortgage servicing rights ; availability of required additional capital and liquidity to support business growth ; our obligation to indemnify third - party purchasers or repurchase loans that we originate, acquire or assist in with fulfillment ; our obligation to indemnify advised entities or investment funds to meet certain criteria or characteristics or under other circumstances ; decreases in the historical returns on the assets that we select and manage for our clients, and our resulting management and incentive fees ; regulation applicable to our investment management segment ; conflicts of interest in allocating our services and investment opportunities among ourselves and our advised entities ; the potential damage to our reputation and adverse impact to our business resulting from ongoing negative publicity ; and our rapid growth . You should not place undue reliance on any forward - looking statement and should consider all of the uncertainties and risks described above, as well as those more fully discussed in reports and other documents filed by the Company with the Securities and Exchange Commission from time to time . The Company undertakes no obligation to publicly update or revise any forward - looking statements or any other information contained herein, and the statements made in this presentation are current as of the date of this presentation only .

Corporate Overview

PennyMac Financial’s Business Model Is Well Positioned for Growth • Complex and highly regulated mortgage industry requires effective governance, compliance, and operating systems • PFSI’s platform has been developed organically and is highly scalable • Commitment to strong corporate governance, compliance, and risk management since inception • PFSI is well positioned for continued growth in this market and regulatory environment Loan Production Loan Servicing Investment Management • Servicing for owned MSRs and subservicing for Advised Entities • Major loan servicer for Fannie Mae, Freddie Mac and Ginnie Mae • Industry - leading capabilities in special servicing • Organic growth results from loan production, supplemented by MSR acquisitions and PMT investment activity • Serve as external manager for investment vehicles focused on investing in mortgage - related assets: – Distressed whole loans – MSRs and ESS – Investments in prime non - Agency loans – MBS and ABS – GSE risk transfers – Commercial real estate loans and securitization interests • Synergistic partnership with PMT • Correspondent aggregation of newly originated loans from third - party sellers – PFSI earns gains on government - insured loans – Fulfillment fees for PMT’s conventional and jumbo loans • Consumer - direct origination of conventional, government - insured and jumbo loans • Newly launched commercial mortgage origination business 4

PFSI Has Developed in a Sustainable Manner for Long - Term Growth 72 128 230 435 1,008 1, 373 1,816 2,354 (1) • Operations launched • De novo build of legacy - free mortgage servicer 2008 Employees at year end 5 2009 2010 2011 2012 2013 2014 2015 • Correspondent group established with a focus on operations development and process design • Added servicing leadership for prime portfolio and to drive scalable growth • Correspondent system launches • Expanded infrastructure with flagship operations facility in Moorpark, CA • Correspondent leadership team expands • Expanded infrastructure in Tampa, FL • Became largest non - bank correspondent aggregator • PFSI completed initial public offering • Expanded infrastructure in Fort Worth, TX • Continued organic growth • Servicing UPB reaches $100 bn • Launched Commercial Real Estate Finance (PCREF) • Disciplined growth to address the demands of the GSEs, Agencies, regulators and our financing partners - Since inception, PennyMac has focused on building and testing processes and systems before adding significant transaction volumes • Highly experienced management team has created a robust corporate governance system centered on compliance, risk management and quality control (1) As of June 30, 2015

$0.83 $1.01 1H14 1H15 $107 $ 128 1H14 1H15 +20% +22% PFSI Continues to Deliver Strong Earnings and Earnings Growth Pretax Income ($ in millions) 6 Earnings per Share (1) Represents partial year. PFSI completed its IPO on May 5 th , 2013 (1) $1.73 $ 2.02 $0.82 2012 2013 2014 2015 YTD Annualized $ 256 $118 $172 $196 2012 2013 2014 2015 YTD Annualized N/A

7.69% 9.22% 0% 2% 4% 6% 8% 10% 2Q13 3Q13 4Q13 1Q14 2Q14 3Q14 4Q14 1Q15 2Q15 Trends in PennyMac Financial’s Businesses Correspondent Production (1) Market Share 0.41% 0.43% 0.00% 0.10% 0.20% 0.30% 0.40% 0.50% 2Q13 3Q13 4Q13 1Q14 2Q14 3Q14 4Q14 1Q15 2Q15 Market Share Consumer Direct Production (1) $1.95 $1.84 $0.0 $0.5 $1.0 $1.5 $2.0 $2.5 2Q13 3Q13 4Q13 1Q14 2Q14 3Q14 4Q14 1Q15 2Q15 1.17% 1.38% 0.0% 0.3% 0.6% 0.9% 1.2% 1.5% 2Q13 3Q13 4Q13 1Q14 2Q14 3Q14 4Q14 1Q15 2Q15 Loan Servicing (1) Market Share Investment Management AUM (billions) 7 (1) Source: Inside Mortgage Finance and company estimates. Inside Mortgage Finance estimates total 2Q15 origination market of $4 45 billion. Correspondent production share estimate is based on PFSI and PMT acquisition volume of $11.9 billion divided by $129 billion for the correspondent market (estimated to be 29% of total origination market). Consumer direct production share is based on PFSI ori gin ations of $1.1 billion divided by $267 billion for the retail market (estimated to be 60% of total origination market). Loan servicing mar ket share is based on PFSI’s servicing UPB of $136.2 billion divided by $9.84 trillion in mortgage debt outstanding as of June 30, 2015.

Growth Strategy Enabled by PennyMac Financial’s Unique Platform 8 ▪ Best - in - class mortgage banking platform designed for today’s market and regulatory environment – Operations built and grown organically – not through acquisitions – Highly scalable to support continued growth ▪ Largest non - bank correspondent aggregator with the scale and systems to grow profitably (1) – Unique mortgage fulfillment operations can acquire, audit and securitize large volumes of loans at the highest levels of manufacturing quality ▪ Leader in mortgage servicing – 46% growth over the last year to become the 12th largest servicer in the U.S. (1) – Track record of successful MSR transfers from third parties ▪ Investing in consumer direct lending – origination volumes have more than doubled versus a year ago and are poised for significant future growth ▪ Synergistic partnership with PMT – tax - efficient investment vehicle that helps reduce balance sheet constraints for PFSI ▪ Commitment to strong corporate governance, compliance, and risk management since inception (1) Inside Mortgage Finance. Largest non - bank correspondent aggregator as of 1Q15 (most recent publication); 12 th largest servicer as of 2Q15.
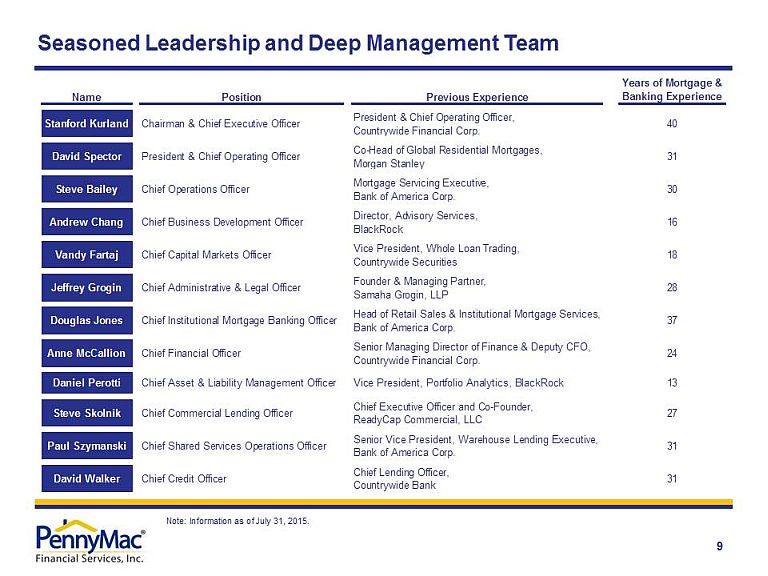
Seasoned Leadership and Deep Management Team 9 Note: Information as of July 31, 2015. Name Position Previous Experience Years of Mortgage & Banking Experience Stanford Kurland Chairman & Chief Executive Officer President & Chief Operating Officer, Countrywide Financial Corp. 40 David Spector President & Chief Operating Officer Co-Head of Global Residential Mortgages, Morgan Stanley 31 Steve Bailey Chief Operations Officer Mortgage Servicing Executive, Bank of America Corp. 30 Andrew Chang Chief Business Development Officer Director, Advisory Services, BlackRock 16 Vandy Fartaj Chief Capital Markets Officer Vice President, Whole Loan Trading, Countrywide Securities 18 Jeffrey Grogin Chief Administrative & Legal Officer Founder & Managing Partner, Samaha Grogin, LLP 28 Douglas Jones Chief Institutional Mortgage Banking Officer Head of Retail Sales & Institutional Mortgage Services, Bank of America Corp. 37 Anne McCallion Chief Financial Officer Senior Managing Director of Finance & Deputy CFO, Countrywide Financial Corp. 24 Daniel Perotti Chief Asset & Liability Management Officer Vice President, Portfolio Analytics, BlackRock 13 Steve Skolnik Chief Commercial Lending Officer Chief Executive Officer and Co-Founder, ReadyCap Commercial, LLC 27 Paul Szymanski Chief Shared Services Operations Officer Senior Vice President, Warehouse Lending Executive, Bank of America Corp. 31 David Walker Chief Credit Officer Chief Lending Officer, Countrywide Bank 31

Governance Structure & Policies 10 Note: Information as of July 31, 2015. Entity Boards Internal Audit Governance Committee Structure Revision Date: 6/2015 Executive Committee Asset Liability Committee (ALCO) Credit Committee Mortgage Regulatory Compliance Committee Operations Committee Strategic Planning Committee Disclosure Committee Subcommittees: Related Party Transactions SOX Subcommittees: -Capital -Investment -Valuation -PCM Compliance Subcommittees: -Loss Exposure Review -PCG Loan Quality Review -PCG Counter Party Review -Product Development Subcommittees: -Consumer Complaint -Fair Lending -Anti Money Laundering Subcommittees: -Business Continuity -Corporate Communications -Data Governance -Privacy -Service Provider Risk Mgmt PennyMac’s Governance Structure provides independent oversight of revenue generating and support areas through quality assurance, quality control, committee oversight, internal audit, and board reporting.

Production Overview

Approximately 70% of PennyMac’s 2014 loan production Production Market Opportunity 12 • Purchase originations have historically been more stable and have a natural “floor” due to moves/relocations, household formation, etc. • Post - financial crisis purchase originations fell to generational lows, suggesting potential pent - up demand that may be realized in a strengthening economy ( 1 ) Historical originations obtained from Mortgage Bankers Association . Forecast originations represent the average of Fannie Mae, Freddie Mac, and Mortgage Bankers Association estimates as of June 2015 . Dollar amounts represent real values in 2014 dollars calculated using the annual Consumer Price Index – All Urban Consumers provided by the Bureau of Labor Statistics . • Refinance originations have historically been highly cyclical and are projected to decline in the anticipated rising interest rate environment • Impact to PennyMac mitigated by extension in the MSR portfolio, which acts as a natural hedge Approximately 30% of PennyMac’s 2014 loan production Purchase Originations Refinance Originations $0.0 $0.5 $1.0 $1.5 $2.0 $2.5 $3.0 $3.5 $ in Trillions (1) $0.0 $0.5 $1.0 $1.5 $2.0 $2.5 $3.0 $3.5 $ in Trillions (1)
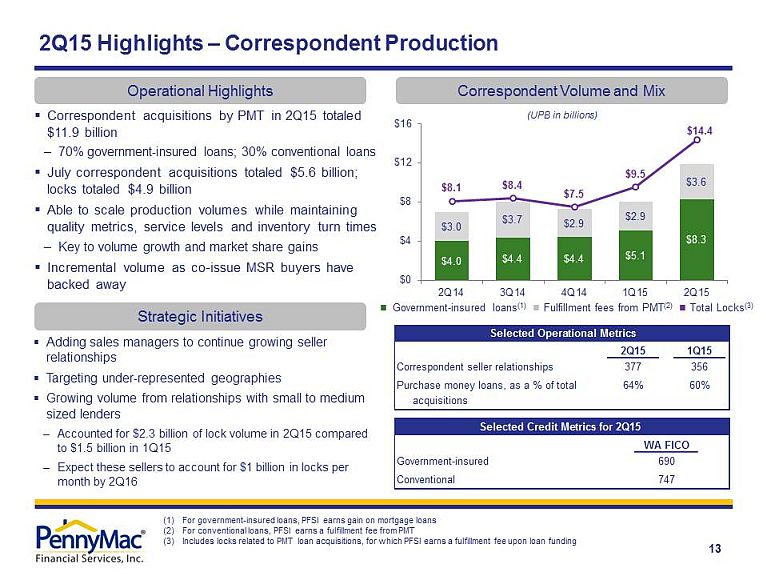
2Q15 1Q15 Correspondent seller relationships 377 356 Purchase money loans, as a % of total 64% 60% acquisitions Government-insured Conventional Selected Operational Metrics Selected Credit Metrics for 2Q15 WA FICO 690 747 13 $4.0 $4.4 $4.4 $5.1 $8.3 $3.0 $3.7 $2.9 $2.9 $3.6 $8.1 $8.4 $7.5 $9.5 $14.4 $0 $4 $8 $12 $16 2Q14 3Q14 4Q14 1Q15 2Q15 (UPB in billions) 2Q15 Highlights – Correspondent Production (1) For government - insured loans, PFSI earns gain on mortgage loans (2) For conventional loans, PFSI earns a fulfillment fee from PMT (3) Includes locks related to PMT loan acquisitions, for which PFSI earns a fulfillment fee upon loan funding Correspondent Volume and Mix Operational Highlights Ŷ Government - insured loans (1) Ŷ Fulfillment fees from PMT (2) Ŷ Total Locks (3) Strategic Initiatives ▪ Adding sales managers to continue growing seller relationships ▪ Targeting under - represented geographies ▪ Growing volume from relationships with small to medium sized lenders – Accounted for $2.3 billion of lock volume in 2Q15 compared to $1.5 billion in 1Q15 – Expect these sellers to account for $1 billion in locks per month by 2Q16 ▪ Correspondent acquisitions by PMT in 2Q15 totaled $11.9 billion – 70% government - insured loans; 30% conventional loans ▪ July correspondent acquisitions totaled $5.6 billion; locks totaled $4.9 billion ▪ Able to scale production volumes while maintaining quality metrics, service levels and inventory turn times – Key to volume growth and market share gains ▪ Incremental volume as co - issue MSR buyers have backed away

PennyMac Is the Largest Non - Bank Correspondent Aggregator 14 (1) Inside Mortgage Finance Originators: small and mid - sized mortgage lenders across the U.S. Agencies and other Investors ▪ Estimated 32 % of the mortgage market, or $ 370 billion in new originations, flowed through the correspondent channel in 2014 ▪ Correspondent share could increase as market conditions motivate small/mid - sized mortgage lenders to sell more loans “servicing released” ▪ Well - capitalized firm with many sources of financing ▪ Approvals and established performance for Agencies and other investors ▪ Sophisticated capital markets expertise to manage pipeline and interest rate risk ▪ Pooling and securitization capabilities ▪ Capabilities and scale to service loans and retain MSRs Aggregator $ $ $ (1)
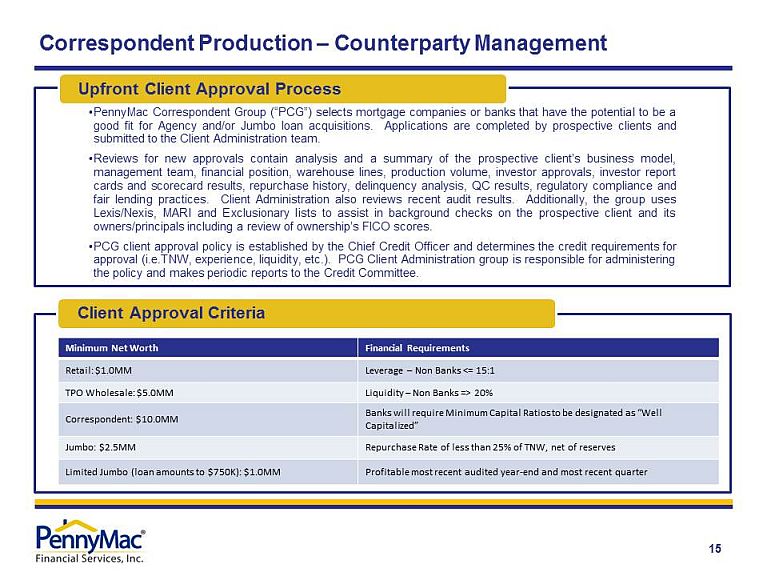
15 Correspondent Production – Counterparty Management • PennyMac Correspondent Group (“PCG”) selects mortgage companies or banks that have the potential to be a good fit for Agency and/or Jumbo loan acquisitions . Applications are completed by prospective clients and submitted to the Client Administration team . • Reviews for new approvals contain analysis and a summary of the prospective client’s business model, management team, financial position, warehouse lines, production volume, investor approvals, investor report cards and scorecard results, repurchase history, delinquency analysis, QC results, regulatory compliance and fair lending practices . Client Administration also reviews recent audit results . Additionally, the group uses Lexis/Nexis, MARI and Exclusionary lists to assist in background checks on the prospective client and its owners/principals including a review of ownership’s FICO scores . • PCG client approval policy is established by the Chief Credit Officer and determines the credit requirements for approval (i . e . TNW, experience, liquidity, etc . ) . PCG Client Administration group is responsible for administering the policy and makes periodic reports to the Credit Committee . Upfront Client Approval Process Minimum Net Worth Financial Requirements Retail: $1.0 MM Leverage – Non Banks <= 1 5:1 TPO Wholesale: $5.0MM Liquidity – Non Banks => 20% Correspondent: $10.0MM Banks will require Minimum Capital Ratios to be designated as “Well Capitalized” Jumbo: $2.5 MM Repurchase Rate of less than 25% of TNW, net of reserves Limited Jumbo (loan amounts to $750K): $1.0MM Profitable most recent audited year - end and most recent quarter Client Approval Criteria

16 Correspondent Production – Loan Acquisition Process Prior to Delivery • Correspondent lenders process, underwrite and close loans for delivery to PennyMac • Business rules and the pricing engine prevent lock and delivery if loan is outside of PennyMac’s guidelines ▪ Data Extraction & Indexing ▪ Data Integrity Rules ▪ Validate MERS ▪ Internal Collateral Review: POA, CEMA, Trust ▪ Review Stipulations ▪ Communicate with the Correspondents ▪ Confirm Escrow Account ▪ Confirm Wire Details and Funding Fees Zero Defects ▪ Validate key data & AUS ▪ Runs Early Check • Complete Checklists • Full Credit Review based on risk, attribute and/or product • Compliance Sampling Framework: First 20 loans, Random, Post Purchase • QM Points & Fees testing ▪ Selection Driven by Tiers, AVM, “Red Flags” and Fannie AQM ▪ Validate Appraised Value ▪ Ensure Compliance with USPAP ▪ Confirm Appraisers’ License Status Risk Review ▪ Define Pre - Purchase Review Policy ▪ Preform Post Purchase QC and Provide Feedback to Division ▪ Define Product Guidelines ▪ Daily Loan Review Meeting ▪ Maintain Cost effectiveness ▪ Scalability for Growth ▪ Seamless Transitions to Servicing and Secondary ▪ Risk Based Focus ▪ Feedback for Continuous Improvement Acquisition Process
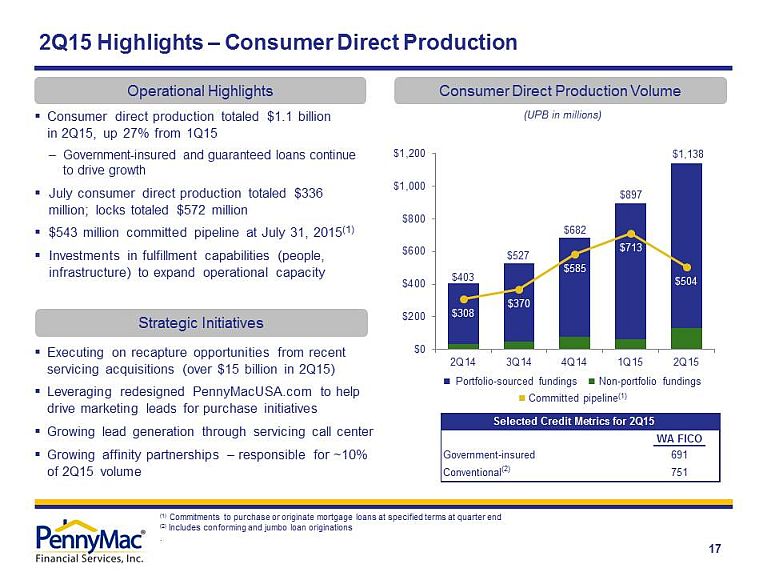
WA FICO Government-insured 691 Conventional (2) 751 Selected Credit Metrics for 2Q15 (UPB in millions) ▪ Consumer direct production totaled $1.1 billion in 2Q15, up 27% from 1Q15 – Government - insured and guaranteed loans continue to drive growth ▪ July consumer direct production totaled $336 million; locks totaled $572 million ▪ $543 million committed pipeline at July 31, 2015 (1) ▪ Investments in fulfillment capabilities (people, infrastructure) to expand operational capacity 2Q15 Highlights – Consumer Direct Production Consumer Direct Production Volume Operational Highlights Strategic Initiatives Ŷ Portfolio - sourced fundings Ŷ Non - portfolio fundings Ŷ Committed pipeline (1) (1) Commitments to purchase or originate mortgage loans at specified terms at quarter end (2) Includes conforming and jumbo loan originations . ▪ Executing on recapture opportunities from recent servicing acquisitions (over $15 billion in 2Q15) ▪ Leveraging redesigned PennyMacUSA.com to help drive marketing leads for purchase initiatives ▪ Growing lead generation through servicing call center ▪ Growing affinity partnerships – responsible for ~10% of 2Q15 volume 17 $403 $527 $682 $897 $1,138 $308 $370 $585 $713 $504 $0 $200 $400 $600 $800 $1,000 $1,200 2Q14 3Q14 4Q14 1Q15 2Q15
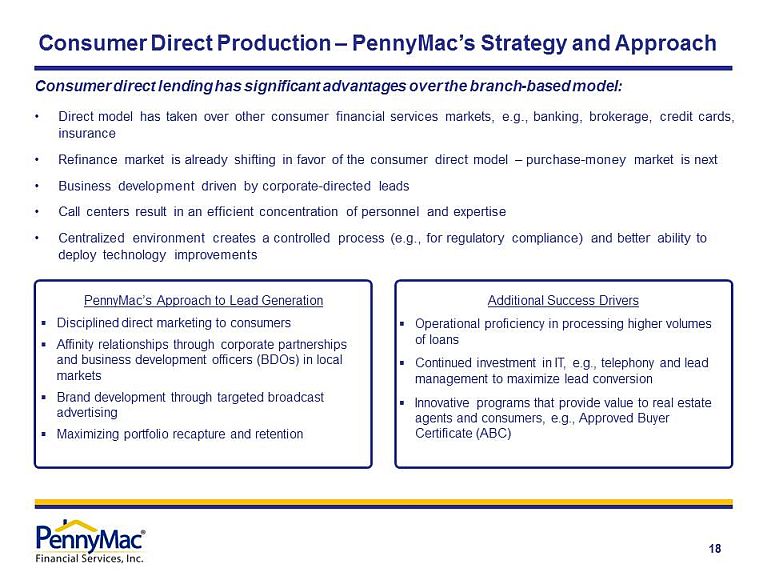
Consumer Direct Production – PennyMac’s Strategy and Approach 18 Consumer direct lending has significant advantages over the branch - based model: • Direct model has taken over other consumer financial services markets, e.g., banking, brokerage, credit cards, insurance • Refinance market is already shifting in favor of the consumer direct model – purchase - money market is next • Business development driven by corporate - directed leads • Call centers result in an efficient concentration of personnel and expertise • Centralized environment creates a controlled process (e.g., for regulatory compliance) and better ability to deploy technology improvements PennyMac’s Approach to Lead Generation ▪ Disciplined direct marketing to consumers ▪ Affinity relationships through corporate partnerships and business development officers (BDOs) in local markets ▪ Brand development through targeted broadcast advertising ▪ Maximizing portfolio recapture and retention Additional Success Drivers ▪ Operational proficiency in processing higher volumes of loans ▪ Continued investment in IT, e.g., telephony and lead management to maximize lead conversion ▪ Innovative programs that provide value to real estate agents and consumers, e.g., Approved Buyer Certificate (ABC)

Loan Production – Limited GSE Repurchases Since Inception 19 • As of June 30 , 2015 , the outstanding UPB of loans subject to R epresentations and Warranties was $ 44 . 8 billion and the Reserve against these loans was $ 16 . 3 million ( 3 . 6 bps) • Life - to - date losses for PFSI from repurchases totaled $ 472 K $0.0 $2.0 $4.0 $6.0 $8.0 $10.0 $12.0 $14.0 $16.0 $18.0 Q1 2013 Q2 2013 Q3 2013 Q4 2013 Q1 2014 Q2 2014 Q3 2014 Q4 2014 Q1 2015 Q2 2015 Reserve for Representations & Warranties vs. Losses Incurred ($ in millions) Cumulative Reserve (Left axis) Losses Incurred (Right axis) Cumulative Reserve $0.0 $0.2 $0.4 $0.6 $0.8 $1.0 $1.2 $1.4 $1.6 $1.8 $2.0 Losses Incurred
Servicing Overview

$115.2 $136.2 At 3/31/15 Runoff Additions from loan production MSR acquisitions At 6/30/15 (UPB in billions) ▪ Servicing portfolio totaled $136.2 billion in UPB at quarter end, up 18% from 1Q15 ▪ Bulk and flow MSR acquisitions totaled $15.4 billion in UPB during 2Q15 – Excess servicing spread (ESS) investments by PMT in 2Q15 totaled $140.9 million – Reviewed 43 new deals, bid on 9, won 2 in 2Q15 ▪ Transferred $8.5 billion in UPB bulk MSR acquisition after quarter end 2Q15 Highlights – Loan Servicing Loan Servicing Portfolio Composition Operational Highlights Strategic Initiatives Ŷ Prime owned Ŷ Prime subserviced Ŷ Special Net Portfolio Growth ($7.4) $13.0 $15.4 (UPB in billions) (1) $94 $100 $106 $115 $136 $0 $30 $60 $90 $120 $150 2Q14 3Q14 4Q14 1Q15 2Q15 ▪ Continuing to pursue additional bulk acquisitions ▪ Operating platform expansion with fully developed facilities in Moorpark and Ft. Worth ▪ Technology initiatives with scale benefits – Servicing platform enhancements – Customer self service capabilities via website 21 (1) Includes consumer direct production, government correspondent acquisitions, and conventional conforming and jumbo loan acquis iti ons subserviced for PMT. Additions From loan production (1) From MSR acquisitions

Loan Servicing Portfolio and Approach to Growth 22 • We have grown our servicing portfolio primarily through organic loan production from our correspondent and consumer direct channels, supplemented by MSR acquisitions and the acquisition of whole loan pools by our Advised Entities (1) As of 6/30/2015 Fannie Mae Servicing 27% Freddie Mac Servicing 11% Ginnie Mae Servicing 55% Private Label & Whole Loan Servicing 6% Servicing by Investor 100% = $136 billion (1) Correspondent & Consumer Direct Production 63% MSR Acquisitions 34% Whole Loan Acquisitions & Others 3% Servicing by Source 100% = $136 billion (1)

23 Recent Servicing Transfer Experience • Recently completed bulk and co - issue servicing acquisitions, totaling over $41.7 billion in UPB across more than 250,000 loans Seller Type UPB ($ Millions) Loan Count Settlement Date Product Mortgage Bank Bulk 337 1,752 3/2/2014 GNMA Mortgage Bank Bulk 521 2,562 4/2/2014 GNMA Mortgage Bank Bulk 1,183 6,627 4/2/2014 GNMA Mortgage Bank Bulk 3,431 18,839 6/2/2014 GNMA Mortgage Bank Bulk 253 952 6/30/2014 GNMA Mortgage Bank Bulk 1,837 10,857 6/30/2014 GNMA Mortgage Banks Co - issue 495 2,438 6/30/2014 FNMA/FHLMC Mortgage Banks Co - issue 640 3,200 9/30/2014 FNMA/FHLMC Mortgage Bank Bulk 804 4,066 11/30/2014 GNMA Mortgage Banks Co - issue 933 4,669 11/30/2014 FNMA/FHLMC Mortgage Bank Bulk 913 5,554 2/2/2015 GNMA Mortgage Bank Bulk 861 4,408 2/27/2015 GNMA Mortgage Banks Co - issue 672 3,360 2/28/2015 FNMA/FHLMC Mortgage Bank Bulk 3,910 23,239 3/2/2015 GNMA National Bank Bulk 14,921 95,356 5/1/2015 GNMA Mortgage Banks Co - issue 921 2,324 5/31/2015 FNMA/FHLMC National Bank Bulk 8,429 57,194 7/1/2015 GNMA Mortgage Bank Bulk 653 3,476 8/3/2015 GNMA Total $41,714 250,8739

24 CFPB Complaints vs. Non - Bank Servicers: CFPB Inception – 3/31/15 Complaint Source: PennyMac analysis based on data from the Consumer Finance Protection Bureau Portal as of 1Q15. UPB Source: PennyMac analysis based on data from Inside Mortgage Finance “Top 30 Mortgage Servicers” as of 1Q15. # of CFPB Complaints: 433 15,703 8,904 5,417 Loan Count (000s): 501 2,391 2,080 2,184 NPL Count (000s): 32 298 206 207 UPB ($ billions ): 115 373 390 236 CFPB Inception - March 2015 1.35% 5.27% 4.32% 2.62% PennyMac Ocwen Nationstar GreenTree (Walter) 0.00% 0.50% 1.00% 1.50% 2.00% 2.50% 3.00% 3.50% 4.00% 4.50% 5.00% 5.50% 6.00% 0.09% 0.66% 0.43% 0.25% 0.00% 0.10% 0.20% 0.30% 0.40% 0.50% 0.60% 0.70% 0.80% 0.90% 1.00% Complaints/ NPLs Serviced Complaints / Loans Serviced

Opportunity for PFSI and PMT in MSR Acquisitions 25 Why Are MSR Sales Occurring? How Do MSRs Come to Market? • Large servicers may sell MSRs due to continuing operational pressures, higher regulatory capital requirements for banks (treatment under Basel III) and a re - focus on core customers/businesses • Independent mortgage banks sell MSRs from time to time due to a need for capital • Intermittent large bulk portfolio sales ($10+ billion in UPB) – Require considerable coordination with selling institutions and Agencies • Mini - bulk sales (typically $500 million to $5 billion in UPB) – Increased activity as originators sell MSRs retained in 2012 and 2013 • Flow/co - issue MSR transactions (monthly commitments, typically $20 - 100 million in UPB) – Alternative delivery method typically from larger independent originators Which MSR Transactions Are Attractive? • GSE and Ginnie Mae servicing in which PFSI has distinctive expertise • MSRs sold and operational servicing transferred to PFSI (not subserviced by a third party) • Measurable rep and warranty liability for PFSI PFSI is uniquely positioned to be a successful acquirer of MSRs • Proven track record of complex MSR and distressed loan transfers • Operational platform that addresses the demands of the Agencies, regulators, and financing partners • Physical capacity in place to service over $200 billion in UPB • Co - investment opportunity for PMT in the excess servicing spread