Attached files
| file | filename |
|---|---|
| 8-K - 8-K - STIFEL FINANCIAL CORP | sf-8k_20150810.htm |
| EX-99.1 - EX-99.1 - STIFEL FINANCIAL CORP | sf-ex991_36.htm |
2nd Quarter 2015 Financial Results Presentation August 10, 2015 Exhibit 99.2
Disclaimer Forward-Looking Statements This presentation may contain “forward-looking statements” within the meaning of the Private Securities Litigation Reform Act of 1995 that involve significant risks, assumptions, and uncertainties, including statements relating to the market opportunity and future business prospects of Stifel Financial Corp., as well as Stifel, Nicolaus & Company, Incorporated and its subsidiaries (collectively, “SF” or the “Company”). These statements can be identified by the use of the words “may,” “will,” “should,” “could,” “would,” “plan,” “potential,” “estimate,” “project,” “believe,” “intend,” “anticipate,” “expect,” and similar expressions. In particular, these statements may refer to our goals, intentions, and expectations, our business plans and growth strategies, our ability to integrate and manage our acquired businesses, estimates of our risks and future costs and benefits, and forecasted demographic and economic trends relating to our industry. You should not place undue reliance on any forward-looking statements, which speak only as of the date they were made. We will not update these forward-looking statements, even though our situation may change in the future, unless we are obligated to do so under federal securities laws. Actual results may differ materially and reported results should not be considered as an indication of future performance. Factors that could cause actual results to differ are included in the Company’s annual and quarterly reports and from time to time in other reports filed by the Company with the Securities and Exchange Commission and include, among other things, changes in general economic and business conditions, actions of competitors, regulatory and legal actions, changes in legislation, and technology changes. Use of Non-GAAP Financial Measures The Company utilized non-GAAP calculations of presented net revenues, compensation and benefits, non-compensation operating expenses, income before income taxes, provision for income taxes, net income, compensation and non-compensation operating expense ratios, pre-tax margin and diluted earnings per share as an additional measure to aid in understanding and analyzing the Company’s financial results for the three and six months ended June 30, 2015. Specifically, the Company believes that the non-GAAP measures provide useful information by excluding certain items that may not be indicative of the Company’s operating results and business outlook. The Company believes that these non-GAAP measures will allow for a better evaluation of the operating performance of the business and facilitate a meaningful comparison of the Company’s results in the current period to those in prior periods and future periods. Reference to these non-GAAP measures should not be considered as a substitute for results that are presented in a manner consistent with GAAP. These non-GAAP measures are provided to enhance investors' overall understanding of the Company’s financial performance.

Chairman’s Comments “Our record second quarter results demonstrate the strength of our platform. On June 5, 2015, we completed the acquisition of Sterne Agee, and as a result, our second quarter includes approximately one month of Sterne Agee’s financial results. We are pleased to welcome our new associates to Stifel. We remain excited about partnering with the professionals at Barclays to continue to grow our Global Wealth Management business. We are committed to investing in and helping grow the Barclays franchise over the long-term, and creating a best-in-class platform to serve our clients. We remain on track to close the transaction in the 4th quarter of 2015.”
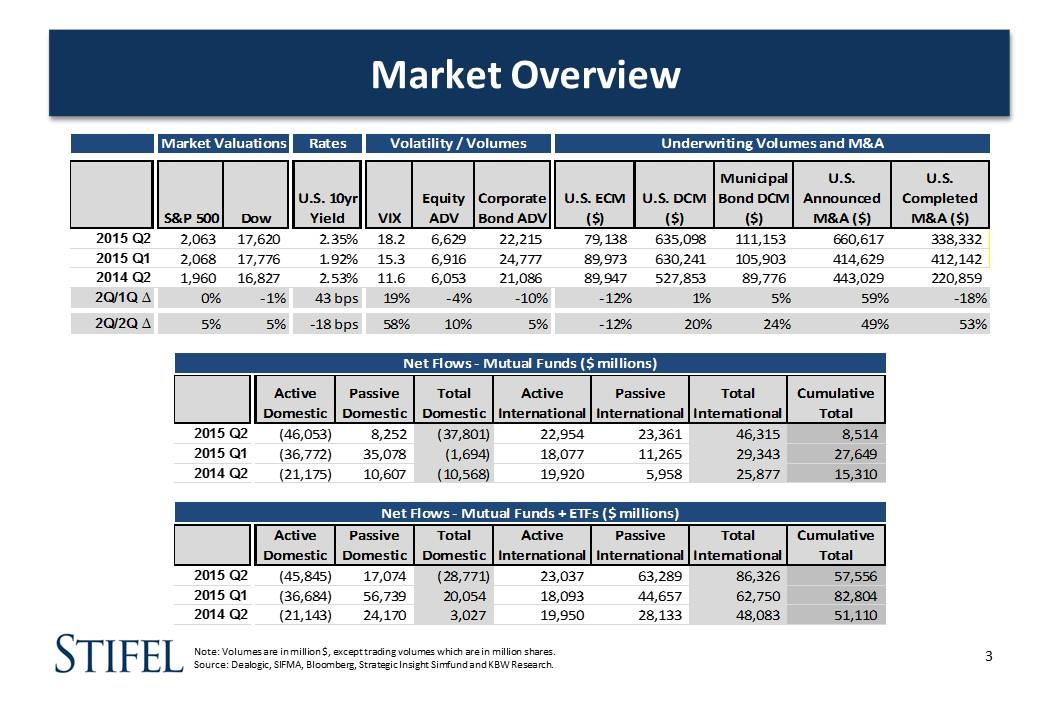
Market Overview Note: Volumes are in million $, except trading volumes which are in million shares. Source: Dealogic, SIFMA, Bloomberg, Strategic Insight Simfund and KBW Research. Market Valuations Rates Volatility / Volumes Underwriting Volumes and M&A Municipal U.S. U.S. U.S. 10yr Equity Corporate U.S. ECM U.S. DCM Bond DCM Announced Completed S&P 500 Dow Yield VIX ADV Bond ADV ($) ($) ($) M&A ($) M&A ($) 2015 Q2 2,063 17,620 2.35% 18.2 6,629 22,215 79,138 635,098 111,153 660,617 338,332 2015 Q1 2,068 17,776 1.92% 15.3 6,916 24,777 89,973 630,241 105,903 414,629 412,142 2014 Q2 1,960 16,827 2.53% 11.6 6,053 21,086 89,947 527,853 89,776 443,029 220,859 2Q/1Q 0% 1% 43 bps 19% 4% 10% 12% 1% 5% 59% 18% 2Q/2Q 5% 5% 18 bps 58% 10% 5% 12% 20% 24% 49% 53% Net Flows Mutual Funds ($ millions) Active Passive Total Active Passive Total Cumulative Domestic Domestic Domestic International International International Total 2015 Q2 (46,053) 8,252 (37,801) 22,954 23,361 46,315 8,514 2015 Q1 (36,772) 35,078 (1,694) 18,077 11,265 29,343 27,649 2014 Q2 (21,175) 10,607 (10,568) 19,920 5,958 25,877 15,310 Net Flows Mutual Funds + ETFs ($ millions) Active Passive Total Active Passive Total Cumulative Domestic Domestic Domestic International International International Total 2015 Q2 (45,845) 17,074 (28,771) 23,037 63,289 86,326 57,556 2015 Q1 (36,684) 56,739 20,054 18,093 44,657 62,750 82,804 2014 Q2 (21,143) 24,170 3,027 19,950 28,133 48,083 51,110

Financial Results
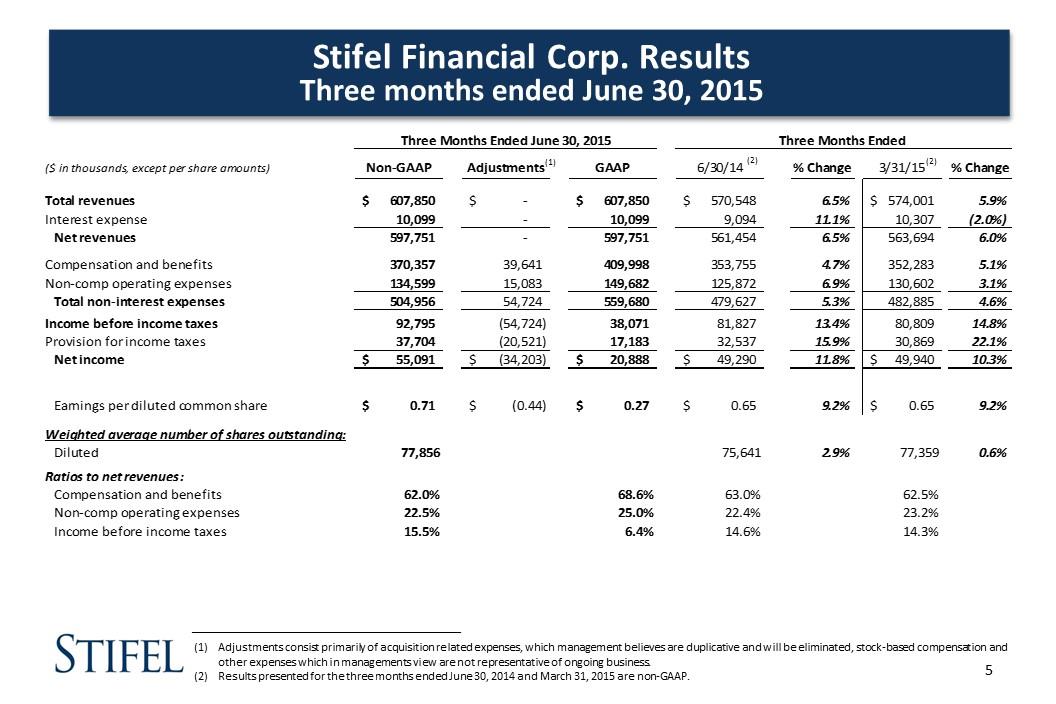
Stifel Financial Corp. Results Three months ended June 30, 2015 Adjustments consist primarily of acquisition related expenses, which management believes are duplicative and will be eliminated, stock-based compensation and other expenses which in managements view are not representative of ongoing business. Results presented for the three months ended June 30, 2014 and March 31, 2015 are non-GAAP. _________________________________________________________ (1) (2) (2) Three Months Ended June 30, 2015Three Months Ended ($ in thousands, except per share amounts)Non-GAAPAdjustmentsGAAP6/30/14% Change3/31/15% Change Total revenues $607,850 $- $607,850 $570,548 6.5% $574,001 5.9%Interest expense 10,099 - 10,099 9,094 11.1% 10,307 (2.0%)Net revenues 597,751 - 597,751 561,454 6.5% 563,694 6.0%Compensation and benefits 370,357 39,641 409,998 353,755 4.7% 352,283 5.1%Non-comp operating expenses 134,599 15,083 149,682 125,872 6.9% 130,602 3.1%Total non-interest expenses 504,956 54,724 559,680 479,627 5.3% 482,885 4.6%Income before income taxes 92,795 (54,724) 38,071 81,827 13.4% 80,809 14.8%Provision for income taxes 37,704 (20,521) 17,183 32,537 15.9% 30,869 22.1%Net income $55,091 $(34,203) $20,888 $49,290 11.8% $49,940 10.3%Earnings per diluted common share $0.71 $(0.44) $0.27 $0.65 9.2% $0.65 9.2%Weighted average number of shares outstanding:Diluted77,85675,6412.9%77,3590.6%Ratios to net revenues: Compensation and benefits62.0%68.6%63.0%62.5%Non-comp operating expenses22.5%25.0%22.4%23.2%Income before income taxes15.5%6.4%14.6%14.3%
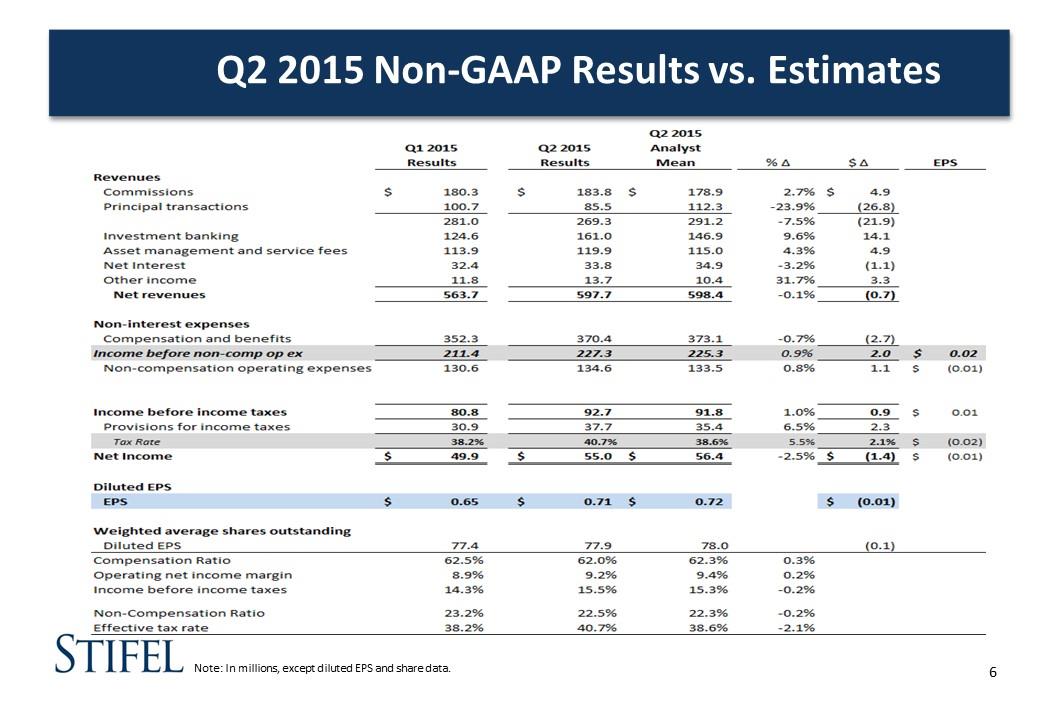
Note: In millions, except diluted EPS and share data. Q2 2015 Non-GAAP Results vs. Estimates
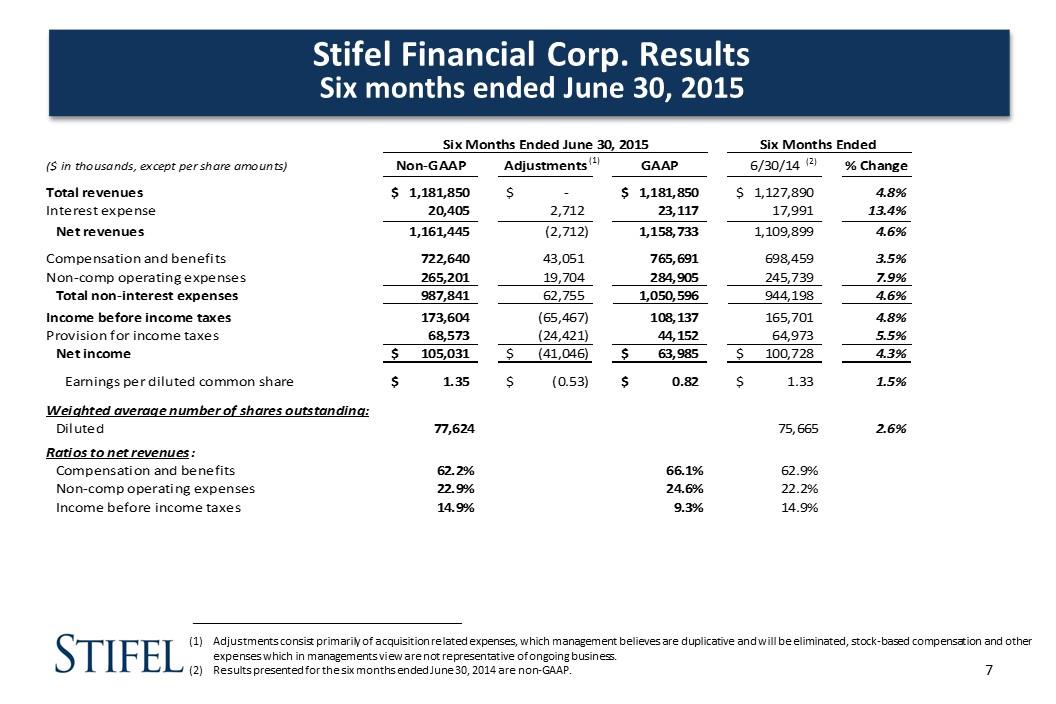
Stifel Financial Corp. Results Six months ended June 30, 2015 Adjustments consist primarily of acquisition related expenses, which management believes are duplicative and will be eliminated, stock-based compensation and other expenses which in managements view are not representative of ongoing business. Results presented for the six months ended June 30, 2014 are non-GAAP. _________________________________________________________ (1) (2) Six Months Ended June 30, 2015Six Months Ended ($ in thousands, except per share amounts)Non-GAAPAdjustmentsGAAP6/30/14% Change Total revenues $1,181,850 $- $1,181,850 $1,127,890 4.8%Interest expense 20,405 2,712 23,117 17,991 13.4%Net revenues 1,161,445 (2,712) 1,158,733 1,109,899 4.6%Compensation and benefits 722,640 43,051 765,691 698,459 3.5%Non-comp operating expenses 265,201 19,704 284,905 245,739 7.9%Total non-interest expenses 987,841 62,755 1,050,596 944,198 4.6%Income before income taxes 173,604 (65,467) 108,137 165,701 4.8%Provision for income taxes 68,573 (24,421) 44,152 64,973 5.5%Net income $105,031 $(41,046) $63,985 $100,728 4.3%Earnings per diluted common share $1.35 $(0.53) $0.82 $1.33 1.5%Weighted average number of shares outstanding:Diluted77,62475,6652.6%Ratios to net revenues: Compensation and benefits62.2%66.1%62.9%Non-comp operating expenses22.9%24.6%22.2%Income before income taxes14.9%9.3%14.9%
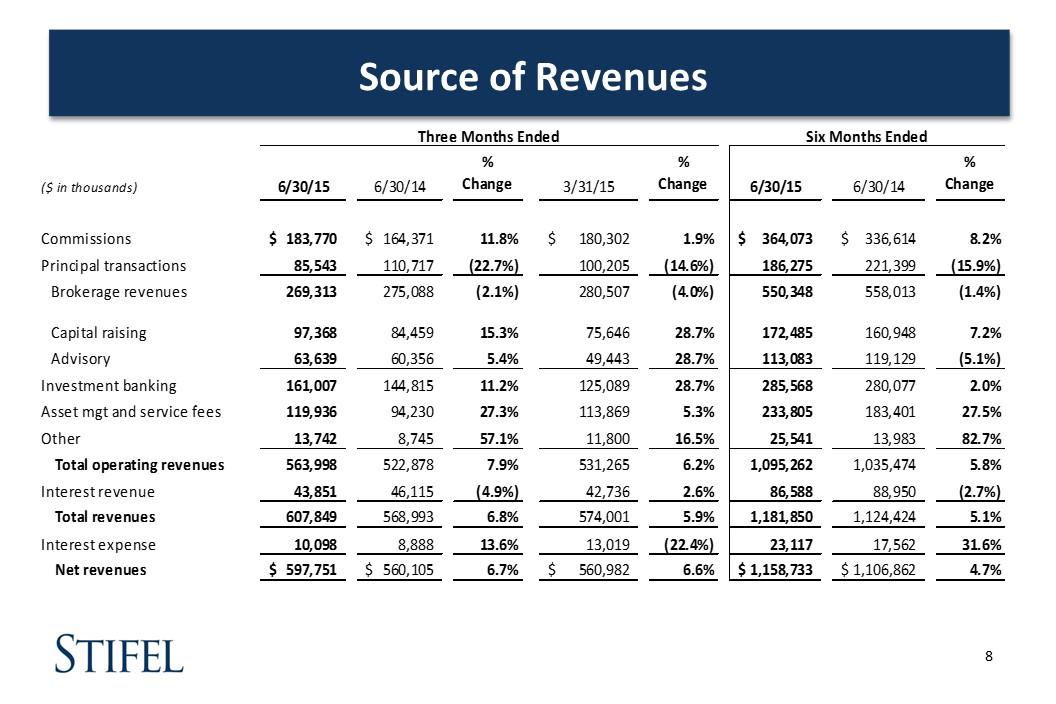
Source of Revenues Three Months Ended Six Months Ended% % % ($ in thousands) 6/30/15 6/30/14 Change 3/31/15 Change 6/30/15 6/30/14 ChangeCommissions $ 183,770 $ 164,371 11.8% $ 180,302 1.9% $ 364,073 $ 336,614 8.2% Principal transactions 85,543 110,717 (22.7%) 100,205 (14.6%) 186,275 221,399 (15.9%) Brokerage revenues 269,313 275,088 (2.1%) 280,507 (4.0%) 550,348 558,013 (1.4%)Capital raising 97,368 84,459 15.3% 75,646 28.7% 172,485 160,948 7.2%Advisory 63,639 60,356 5.4% 49,443 28.7% 113,083 119,129 (5.1%)Investment banking 161,007 144,815 11.2% 125,089 28.7% 285,568 280,077 2.0% Asset mgt and service fees 119,936 94,230 27.3% 113,869 5.3% 233,805 183,401 27.5%Other 13,742 8,745 57.1% 11,800 16.5% 25,541 13,983 82.7% Total operating revenues 563,998 522,878 7.9% 531,265 6.2% 1,095,262 1,035,474 5.8%Interest revenue 43,851 46,115 (4.9%) 42,736 2.6% 86,588 88,950 (2.7%) Total revenues 607,849 568,993 6.8% 574,001 5.9% 1,181,850 1,124,424 5.1%Interest expense 10,098 8,888 13.6% 13,019 (22.4%) 23,117 17,562 31.6% Net revenues $ 597,751 $ 560,105 6.7% $ 560,982 6.6% $ 1,158,733 $ 1,106,862 4.7%
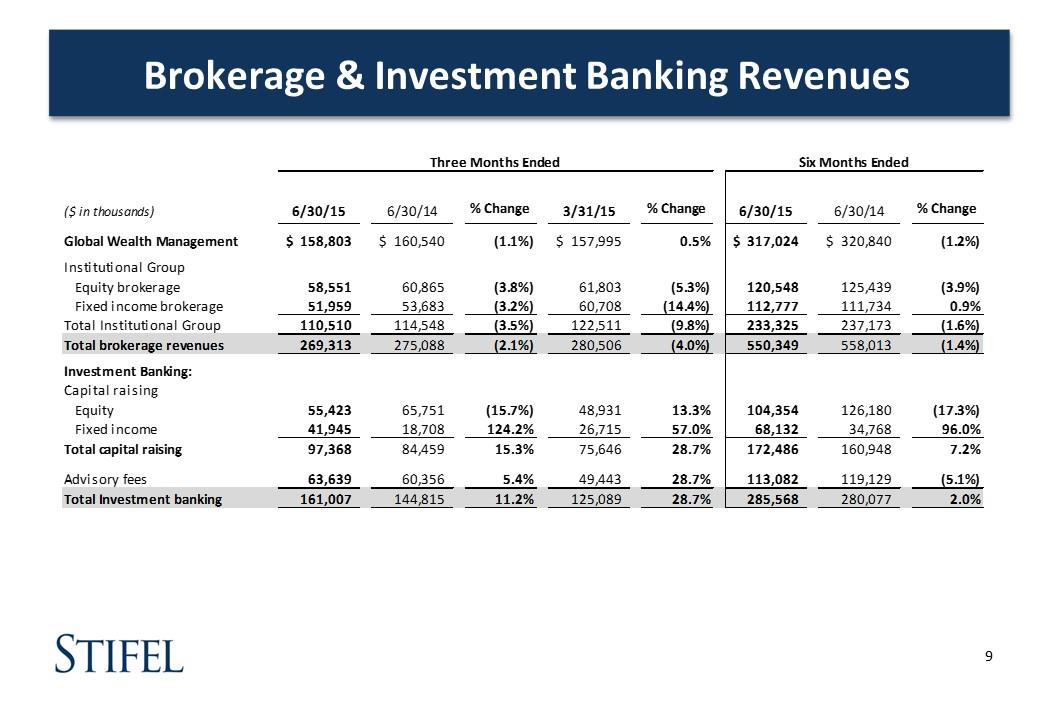
Brokerage & Investment Banking Revenues Three Months Ended Six Months Ended ($ in thousands) 6/30/15 6/30/14 % Change 3/31/15 % Change 6/30/15 6/30/14 % Change Global Wealth Management $ 158,803 $ 160,540 (1.1%) $ 157,995 0.5% $ 317,024 $ 320,840 (1.2%) Institutional Group Equity brokerage 58,551 60,865 (3.8%) 61,803 (5.3%) 120,548 125,439 (3.9%) Fixed income brokerage 51,959 53,683 (3.2%) 60,708 (14.4%) 112,777 111,734 0.9% Total Institutional Group 110,510 114,548 (3.5%) 122,511 (9.8%) 233,325 237,173 (1.6%) Total brokerage revenues 269,313 275,088 (2.1%) 280,506 (4.0%) 550,349 558,013 (1.4%) Investment Banking: Capital raising Equity 55,423 65,751 (15.7%) 48,931 13.3% 104,354 126,180 (17.3%) Fixed income 41,945 18,708 124.2% 26,715 57.0% 68,132 34,768 96.0% Total capital raising 97,368 84,459 15.3% 75,646 28.7% 172,486 160,948 7.2% Advisory fees 63,639 60,356 5.4% 49,443 28.7% 113,082 119,129 (5.1%) Total Investment banking 161,007 144,815 11.2% 125,089 28.7% 285,568 280,077 2.0% Three Months Ended Six Months Ended ($ in thousands) 6/30/15 6/30/14 % Change 3/31/15 % Change 6/30/15 6/30/14 % Change Global Wealth Management $ 158,803 $ 160,540 (1.1%) $ 157,995 0.5% $ 317,024 $ 320,840 (1.2%) Institutional Group Equity brokerage 58,551 60,865 (3.8%) 61,803 (5.3%) 120,548 125,439 (3.9%) Fixed income brokerage 51,959 53,683 (3.2%) 60,708 (14.4%) 112,777 111,734 0.9% Total Institutional Group 110,510 114,548 (3.5%) 122,511 (9.8%) 233,325 237,173 (1.6%) Total brokerage revenues 269,313 275,088 (2.1%) 280,506 (4.0%) 550,349 558,013 (1.4%) Investment Banking: Capital raising Equity 55,423 65,751 (15.7%) 48,931 13.3% 104,354 126,180 (17.3%) Fixed income 41,945 18,708 124.2% 26,715 57.0% 68,132 34,768 96.0% Total capital raising 97,368 84,459 15.3% 75,646 28.7% 172,486 160,948 7.2% Advisory fees 63,639 60,356 5.4% 49,443 28.7% 113,082 119,129 (5.1%) Total Investment banking 161,007 144,815 11.2% 125,089 28.7% 285,568 280,077 2.0%
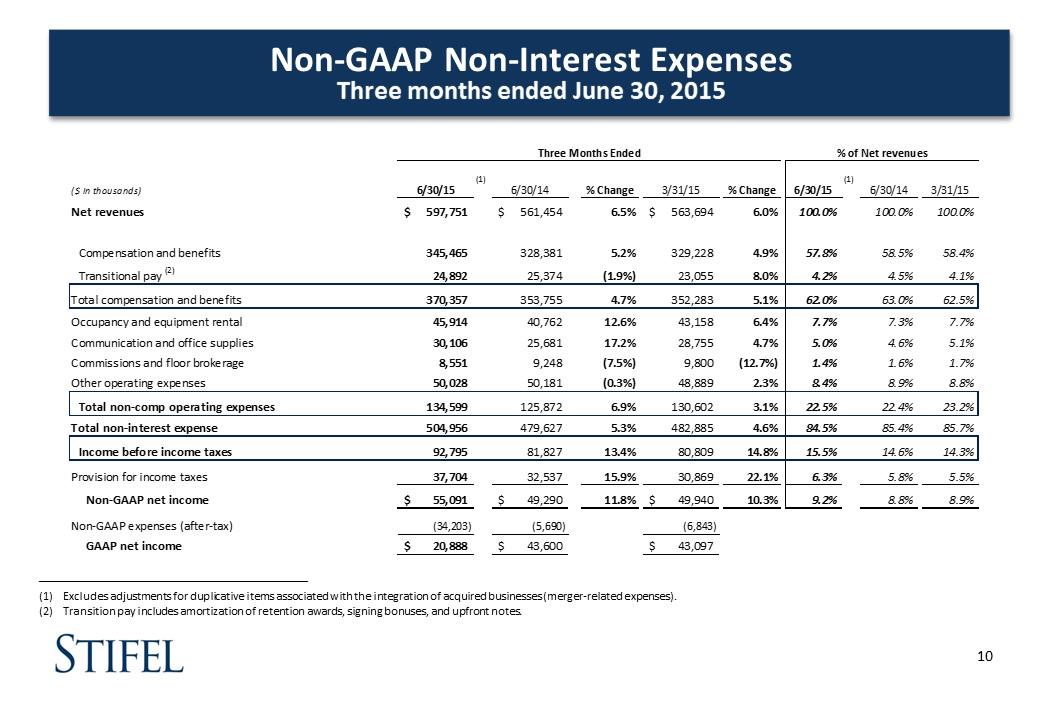
Non-GAAP Non-Interest Expenses Three months ended June 30, 2015 _________________________________________________________ Excludes adjustments for duplicative items associated with the integration of acquired businesses (merger-related expenses). Transition pay includes amortization of retention awards, signing bonuses, and upfront notes. Three Months Ended % of Net revenues (1) (1) ($ in thousands) 6/30/15 6/30/14 % Change 3/31/15 % Change 6/30/15 6/30/14 3/31/15 Net revenues $ 597,751 $ 561,454 6.5% $ 563,694 6.0% 100.0% 100.0% 100.0% Compensation and benefits 345,465 328,381 5.2% 329,228 4.9% 57.8% 58.5% 58.4% Transitional pay (2) 24,892 25,374 (1.9%) 23,055 8.0% 4.2% 4.5% 4.1% Total compensation and benefits 370,357 353,755 4.7% 352,283 5.1% 62.0% 63.0% 62.5% Occupancy and equipment rental 45,914 40,762 12.6% 43,158 6.4% 7.7% 7.3% 7.7% Communication and office supplies 30,106 25,681 17.2% 28,755 4.7% 5.0% 4.6% 5.1% Commissions and floor brokerage 8,551 9,248 (7.5%) 9,800 (12.7%) 1.4% 1.6% 1.7% Other operating expenses 50,028 50,181 (0.3%) 48,889 2.3% 8.4% 8.9% 8.8% Total non comp operating expenses 134,599 125,872 6.9% 130,602 3.1% 22.5% 22.4% 23.2% Total non interest expense 504,956 479,627 5.3% 482,885 4.6% 84.5% 85.4% 85.7% Income before income taxes 92,795 81,827 13.4% 80,809 14.8% 15.5% 14.6% 14.3% Provision for income taxes 37,704 32,537 15.9% 30,869 22.1% 6.3% 5.8% 5.5% Non GAAP net income $ 55,091 $ 49,290 11.8% $ 49,940 10.3% 9.2% 8.8% 8.9% Non GAAP expenses (after tax) (34,203) (5,690) (6,843) GAAP net income $ 20,888 $ 43,600 $ 43,097
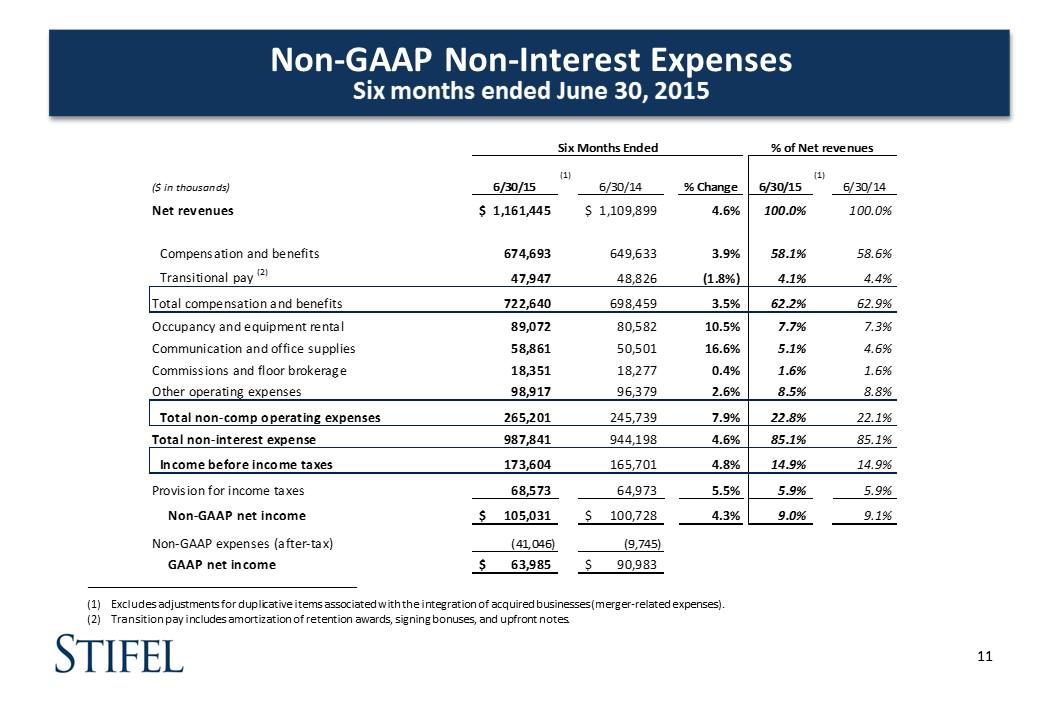
Non-GAAP Non-Interest Expenses Six months ended June 30, 2015 _________________________________________________________ Excludes adjustments for duplicative items associated with the integration of acquired businesses (merger-related expenses). Transition pay includes amortization of retention awards, signing bonuses, and upfront notes. Six Months Ended % of Net revenues (1) (1) ($ in thousands) 6/30/15 6/30/14 % Change 6/30/15 6/30/14 Net revenues $ 1,161,445 $ 1,109,899 4.6% 100.0% 100.0% Compensation and benefits 674,693 649,633 3.9% 58.1% 58.6% Transitional pay (2) 47,947 48,826 (1.8%) 4.1% 4.4% Total compensation and benefits 722,640 698,459 3.5% 62.2% 62.9% Occupancy and equipment rental 89,072 80,582 10.5% 7.7% 7.3% Communication and office supplies 58,861 50,501 16.6% 5.1% 4.6% Commissions and floor brokerage 18,351 18,277 0.4% 1.6% 1.6% Other operating expenses 98,917 96,379 2.6% 8.5% 8.8% Total non comp operating expenses 265,201 245,739 7.9% 22.8% 22.1% Total non interest expense 987,841 944,198 4.6% 85.1% 85.1% Income before income taxes 173,604 165,701 4.8% 14.9% 14.9% Provision for income taxes 68,573 64,973 5.5% 5.9% 5.9% Non GAAP net income $ 105,031 $ 100,728 4.3% 9.0% 9.1% Non GAAP expenses (after tax) (41,046) (9,745) GAAP net income $ 63,985 $ 90,983
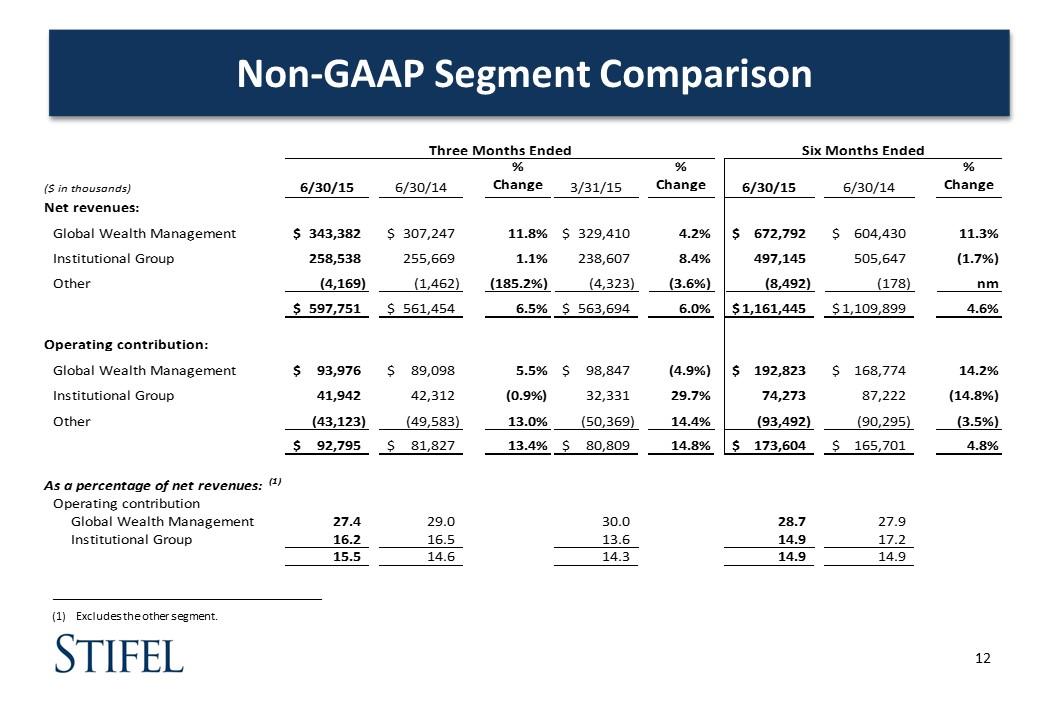
Non-GAAP Segment Comparison Excludes the other segment. _________________________________________________________ Three Months Ended Six Months Ended % % % ($ in thousands) 6/30/15 6/30/14 Change 3/31/15 Change 6/30/15 6/30/14 Change Net revenues: Global Wealth Management $ 343,382 $ 307,247 11.8% $ 329,410 4.2% $ 672,792 $ 604,430 11.3% Institutional Group 258,538 255,669 1.1% 238,607 8.4% 497,145 505,647 (1.7%) Other (4,169) (1,462) (185.2%) (4,323) (3.6%) (8,492) (178) nm $ 597,751 $ 561,454 6.5% $ 563,694 6.0% $ 1,161,445 $ 1,109,899 4.6% Operating contribution: Global Wealth Management $ 93,976 $ 89,098 5.5% $ 98,847 (4.9%) $ 192,823 $ 168,774 14.2% Institutional Group 41,942 42,312 (0.9%) 32,331 29.7% 74,273 87,222 (14.8%) Other (43,123) (49,583) 13.0% (50,369) 14.4% (93,492) (90,295) (3.5%) $ 92,795 $ 81,827 13.4% $ 80,809 14.8% $ 173,604 $ 165,701 4.8% As a percentage of net revenues: (1) Operating contribution Global Wealth Management 27.4 29.0 30.0 28.7 27.9 Institutional Group 16.2 16.5 13.6 14.9 17.2 15.5 14.6 14.3 14.9 14.9 _________________________________________________________ (1) Excludes the other segment.
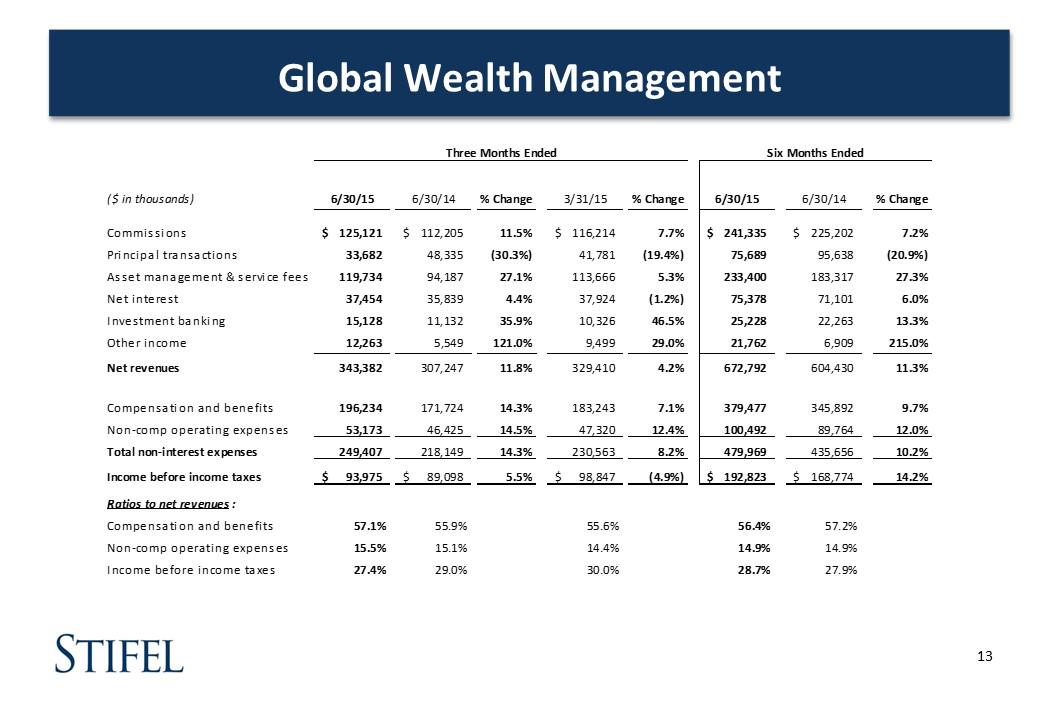
Global Wealth Management Three Months Ended Six Months Ended ($ in thousands) 6/30/15 6/30/14 % Change 3/31/15 % Change 6/30/15 6/30/14 % Change Commissions $ 125,121 $ 112,205 11.5% $ 116,214 7.7% $ 241,335 $ 225,202 7.2% Principal transactions 33,682 48,335 (30.3%) 41,781 (19.4%) 75,689 95,638 (20.9%) Asset management & service fees 119,734 94,187 27.1% 113,666 5.3% 233,400 183,317 27.3% Net interest 37,454 35,839 4.4% 37,924 (1.2%) 75,378 71,101 6.0% Investment banking 15,128 11,132 35.9% 10,326 46.5% 25,228 22,263 13.3% Other income 12,263 5,549 121.0% 9,499 29.0% 21,762 6,909 215.0% Net revenues 343,382 307,247 11.8% 329,410 4.2% 672,792 604,430 11.3% Compensation and benefits 196,234 171,724 14.3% 183,243 7.1% 379,477 345,892 9.7% Non comp operating expenses 53,173 46,425 14.5% 47,320 12.4% 100,492 89,764 12.0% Total non interest expenses 249,407 218,149 14.3% 230,563 8.2% 479,969 435,656 10.2% Income before income taxes $ 93,975 $ 89,098 5.5% $ 98,847 (4.9%) $ 192,823 $ 168,774 14.2% Ratios to net revenues : Compensation and benefits 57.1% 55.9% 55.6% 56.4% 57.2% Non comp operating expenses 15.5% 15.1% 14.4% 14.9% 14.9% Income before income taxes 27.4% 29.0% 30.0% 28.7% 27.9%
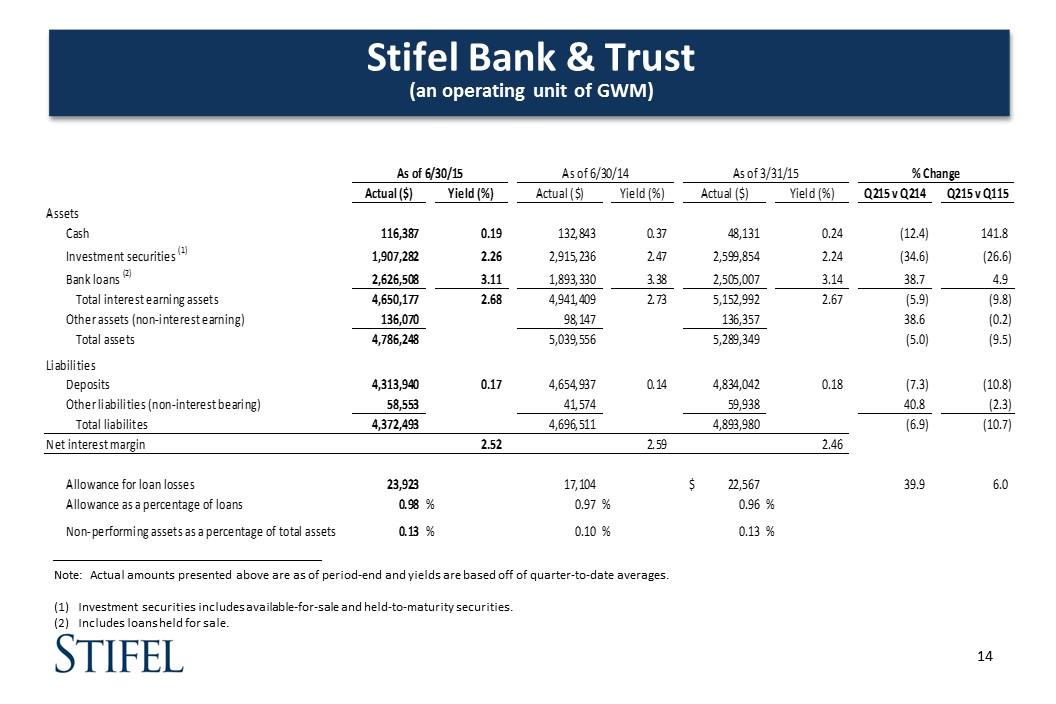
Stifel Bank & Trust (an operating unit of GWM) Note: Actual amounts presented above are as of period-end and yields are based off of quarter-to-date averages. Investment securities includes available-for-sale and held-to-maturity securities. Includes loans held for sale. As of 6/30/15 As of 6/30/14 As of 3/31/15 % Change Actual ($) Yield (%) Actual ($) Yield (%) Actual ($) Yield (%) Q215 v Q214 Q215 v Q115 Assets Cash 116,387 0.19 132,843 0.37 48,131 0.24 (12.4) 141.8 (1) Investment securities 1,907,282 2.26 2,915,236 2.47 2,599,854 2.24 (34.6) (26.6) (2) Bank loans 2,626,508 3.11 1,893,330 3.38 2,505,007 3.14 38.7 4.9 Total interest earning assets 4,650,177 2.68 4,941,409 2.73 5,152,992 2.67 (5.9) (9.8) Other assets (non interest earning) 136,070 98,147 136,357 38.6 (0.2) Total assets 4,786,248 5,039,556 5,289,349 (5.0) (9.5) Liabilities Deposits 4,313,940 0.17 4,654,937 0.14 4,834,042 0.18 (7.3) (10.8) Other liabilities (non interest bearing) 58,553 41,574 59,938 40.8 (2.3) Total liabilites 4,372,493 4,696,511 4,893,980 (6.9) (10.7) Net interest margin 2.52 2.59 2.46 Allowance for loan losses 23,923 17,104 $ 22,567 39.9 6.0 Allowance as a percentage of loans 0.98 % 0.97 % 0.96 % Non performing assets as a percentage of total assets 0.13 % 0.10 % 0.13 % _________________________________________________________ Stifel Bank & Trust (Unaudited) Key Statistical Information Three Months Ended 3/31/13 % Change % Change (in 000s, except percentages) Net revenues $ 23,879 16,018 49.076039455612438 22,551 5.8888741075783777 Income before income taxes 17,236 11,403 51.153205296851702 15,977 7.8800776115666267 As of 6/30/15 As of 6/30/14 As of 3/31/15 % Change Actual ($) Yield (%) Actual ($) Yield (%) Actual ($) Yield (%) Q215 v Q214 Q215 v Q115 Assets Cash ,116,387 0.19 ,132,843 0.37 48,131 0.24 -12.387555234374412 141.81296877272445 Investment securities (1) 1,907,282.257 2.2599999999999998 2,915,236.4879999999 2.4700000000000002 2,599,853.9559999998 2.2400000000000002 -34.575384712322524 -26.63886936424516 Bank loans (2) 2,626,508.94 3.11 1,893,329.773 3.38 2,505,006.8769999999 3.14 38.724279914442562 4.8503346683626765 Total interest earning assets 4,650,177.3509999998 2.68 4,941,409.2609999999 2.73 5,152,991.8329999996 2.67 -5.8937014648542414 -9.7577193656693275 Other assets (non-interest earning) ,136,070.3049999997 98,146.73900000006 ,136,357.38999999966 38.639659744578594 -0.21053864407346271 Total assets 4,786,247.6559999995 5,039,556 5,289,349.2229999993 -5.0264020084309111 -9.5115967161391541 Liabilities Deposits 4,313,940 0.17 4,654,937 0.14000000000000001 4,834,042 0.18 -7.3254911935435434 -10.759153519973554 Other liabilities (non-interest bearing) 58,553.484000000171 41,573.638000000268 59,937.70100000035 40.8428196733704 -2.3094262490984945 Total liabilites 4,372,493.4840000002 4,696,510.6380000003 4,893,979.7010000004 -6.8991040151882244 -10.655667756313813 Net interest margin 2.52 2.59 2.46 Allowance for loan losses 23,923 17,104 $22,567 39.867867165575305 6.0087738733548983 Allowance as a percentage of loans 0.98 % 0.97 % 0.96 % Non-performing loans $3,907 $1,042 274.95201535508636 $3,907 0 Other non-performing assets 0 173 -,100 0 0 Non-performing assets $3,907 $1,215 221.56378600823047 $3,907 0 Non-performing assets as a percentage of total assets 0.13 % 0.1 % 0.13 % Stifel Bank & Trust (Unaudited) Key Statistical Information Three Months Ended 3/31/13 % Change % Change (in 000s, except percentages) Net revenues $ 23,879 16,018 49.076039455612438 22,551 5.8888741075783777 Income before income taxes 17,236 11,403 51.153205296851702 15,977 7.8800776115666267 As of 6/30/15 As of 6/30/14 As of 3/31/15 % Change Actual ($) Yield (%) Actual ($) Yield (%) Actual ($) Yield (%) Q215 v Q214 Q215 v Q115 Assets Cash ,116,387 0.19 ,132,843 0.37 48,131 0.24 -12.387555234374412 141.81296877272445 Investment securities (1) 1,907,282.257 2.2599999999999998 2,915,236.4879999999 2.4700000000000002 2,599,853.9559999998 2.2400000000000002 -34.575384712322524 -26.63886936424516 Bank loans (2) 2,626,508.94 3.11 1,893,329.773 3.38 2,505,006.8769999999 3.14 38.724279914442562 4.8503346683626765 Total interest earning assets 4,650,177.3509999998 2.68 4,941,409.2609999999 2.73 5,152,991.8329999996 2.67 -5.8937014648542414 -9.7577193656693275 Other assets (non-interest earning) ,136,070.3049999997 98,146.73900000006 ,136,357.38999999966 38.639659744578594 -0.21053864407346271 Total assets 4,786,247.6559999995 5,039,556 5,289,349.2229999993 -5.0264020084309111 -9.5115967161391541 Liabilities Deposits 4,313,940 0.17 4,654,937 0.14000000000000001 4,834,042 0.18 -7.3254911935435434 -10.759153519973554 Other liabilities (non-interest bearing) 58,553.484000000171 41,573.638000000268 59,937.70100000035 40.8428196733704 -2.3094262490984945 Total liabilites 4,372,493.4840000002 4,696,510.6380000003 4,893,979.7010000004 -6.8991040151882244 -10.655667756313813 Net interest margin 2.52 2.59 2.46 Allowance for loan losses 23,923 17,104 $22,567 39.867867165575305 6.0087738733548983 Allowance as a percentage of loans 0.98 % 0.97 % 0.96 % Non-performing loans $3,907 $1,042 274.95201535508636 $3,907 0 Other non-performing assets 0 173 -,100 0 0 Non-performing assets $3,907 $1,215 221.56378600823047 $3,907 0 Non-performing assets as a percentage of total assets 0.13 % 0.1 % 0.13 %
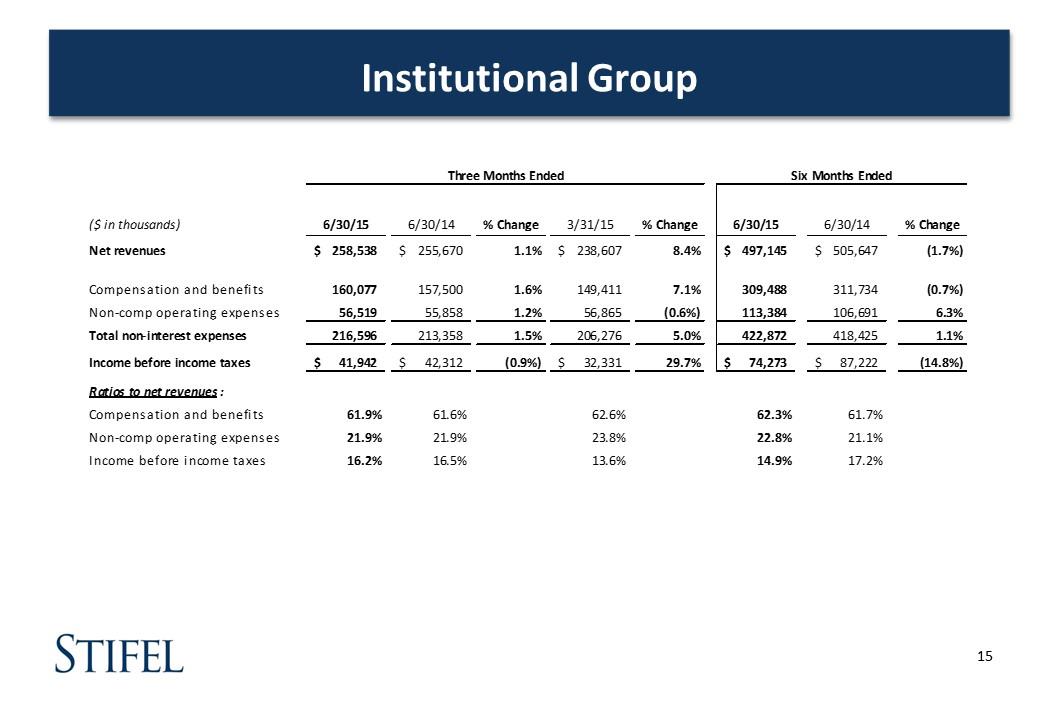
Institutional Group Three Months Ended Six Months Ended ($ in thousands) 6/30/15 6/30/14 % Change 3/31/15 % Change 6/30/15 6/30/14 % Change Net revenues $ 258,538 $ 255,670 1.1% $ 238,607 8.4% $ 497,145 $ 505,647 (1.7%) Compensation and benefits 160,077 157,500 1.6% 149,411 7.1% 309,488 311,734 (0.7%) Non comp operating expenses 56,519 55,858 1.2% 56,865 (0.6%) 113,384 106,691 6.3% Total non interest expenses 216,596 213,358 1.5% 206,276 5.0% 422,872 418,425 1.1% Income before income taxes $ 41,942 $ 42,312 (0.9%) $ 32,331 29.7% $ 74,273 $ 87,222 (14.8%) Ratios to net revenues : Compensation and benefits 61.9% 61.6% 62.6% 62.3% 61.7% Non comp operating expenses 21.9% 21.9% 23.8% 22.8% 21.1% Income before income taxes 16.2% 16.5% 13.6% 14.9% 17.2%

Financial Condition
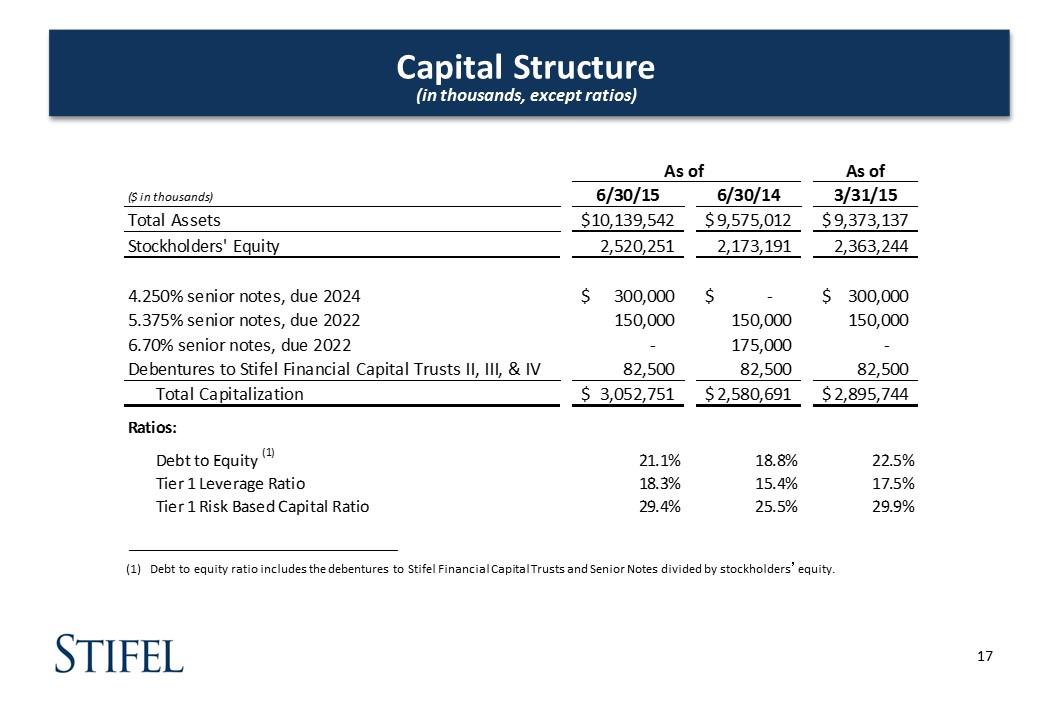
Capital Structure (in thousands, except ratios) _________________________________________________________ Debt to equity ratio includes the debentures to Stifel Financial Capital Trusts and Senior Notes divided by stockholders’equity. As of As of ($ in thousands) 6/30/15 6/30/14 3/31/15 Total Assets $ 10,139,542 $ 9,575,012 $ 9,373,137 Stockholders' Equity 2,520,251 2,173,191 2,363,244 4.250% senior notes, due 2024 $ 300,000 $ $ 300,000 5.375% senior notes, due 2022 150,000 150,000 150,000 6.70% senior notes, due 2022 175,000 Debentures to Stifel Financial Capital Trusts II, III, & IV 82,500 82,500 82,500 Total Capitalization $ 3,052,751 $ 2,580,691 $ 2,895,744 Ratios: (1) Debt to Equity 21.1% 18.8% 22.5% Tier 1 Leverage Ratio OPEN 15.4% 17.5% Tier 1 Risk Based Capital Ratio OPEN 25.5% 29.9%
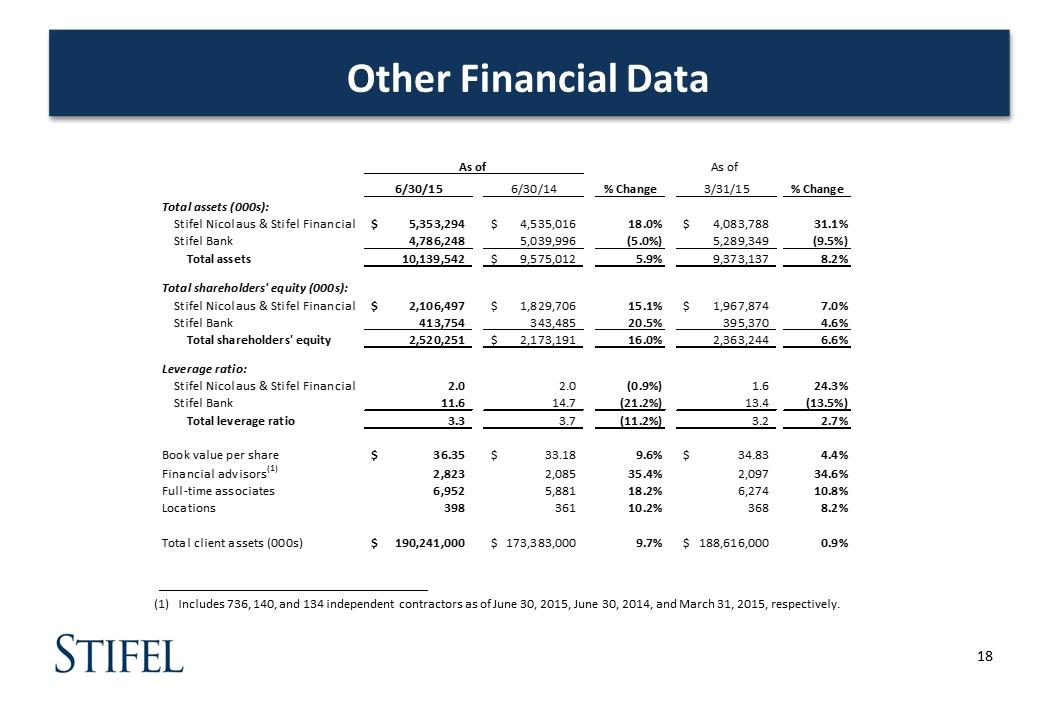
Other Financial Data _________________________________________________________ Includes 736, 140, and 134 independent contractors as of June 30, 2015, June 30, 2014, and March 31, 2015, respectively. As of As of 6/30/15 6/30/14 % Change 3/31/15 % Change Total assets (000s): Stifel Nicolaus & Stifel Financial $ 5,353,294 $ 4,535,016 18.0% $ 4,083,788 31.1% Stifel Bank 4,786,248 5,039,996 (5.0%) 5,289,349 (9.5%) Total assets 10,139,542 $ 9,575,012 5.9% 9,373,137 8.2% Total shareholders' equity (000s): Stifel Nicolaus & Stifel Financial $ 2,106,497 $ 1,829,706 15.1% $ 1,967,874 7.0% Stifel Bank 413,754 343,485 20.5% 395,370 4.6% Total shareholders' equity 2,520,251 $ 2,173,191 16.0% 2,363,244 6.6% Leverage ratio: Stifel Nicolaus & Stifel Financial 2.0 2.0 (0.9%) 1.6 24.3% Stifel Bank 11.6 14.7 (21.2%) 13.4 (13.5%) Total leverage ratio 3.3 3.7 (11.2%) 3.2 2.7% Book value per share $ 36.35 $ 33.18 9.6% $ 34.83 4.4% (1) Financial advisors 2,823 2,085 35.4% 2,097 34.6% Full time associates 6,952 5,881 18.2% 6,274 10.8% Locations 398 361 10.2% 368 8.2% Total client assets (000s) $ 190,241,000 $ 173,383,000 9.7% $ 188,616,000 0.9% (1)

Acquisition Updates
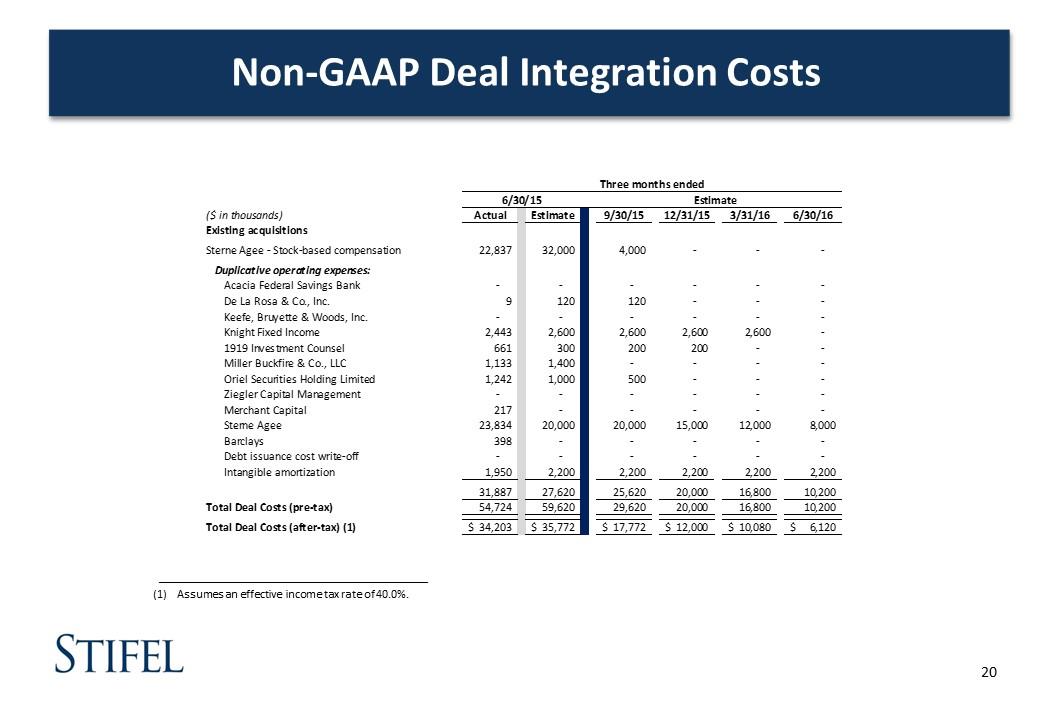
Non-GAAP Deal Integration Costs _________________________________________________________ Assumes an effective income tax rate of 40.0%. Three months ended 6/30/15 Estimate ($ in thousands) Actual Estimate 9/30/15 12/31/15 3/31/16 6/30/16 Existing acquisitions Duplicative operating expenses: Acacia Federal Savings Bank De La Rosa & Co., Inc. 9 120 120 Keefe, Bruyette & Woods, Inc. Knight Fixed Income 2,443 2,600 2,600 2,600 2,600 1919 Investment Counsel 661 300 200 200 Miller Buckfire & Co., LLC 1,133 1,400 Oriel Securities Holding Limited 1,242 1,000 500 Ziegler Capital Management Merchant Capital 217 Sterne Agee 23,834 20,000 18,700 15,200 11,700 8,200 Barclays 398 Debt issuance cost write off Intangible amortization 1,950 2,200 2,200 2,200 2,200 2,200 Sterne Agee Stock based compensation 22,837 32,000 Total Deal Costs (pre tax) 54,724 59,620 24,320 20,200 16,500 10,400 Total Deal Costs (after tax) (1) $ 34,203 $ 35,772 $ 14,592 $ 12,120 $ 9,900 $ 6,240

Q&A
