Attached files
| file | filename |
|---|---|
| 8-K - FORM 8-K - MRC GLOBAL INC. | d75526d8k.htm |
 August
2015 TM Investor Presentation Exhibit 99.1 |
 2 2 Forward Looking Statements and Non-GAAP Disclaimer This presentation contains forward-looking statements within the meaning of Section 27A of the Securities Act and Section 21E of the Exchange Act. Words such as “will,” “expect,” “expected”, “looking forward”, “guidance” and similar expressions are
intended to identify forward-looking statements. Statements about the
company’s business, including its strategy, the impact of changes in oil prices and customer spending, its industry, the company’s future profitability, the company’s guidance on its sales, adjusted EBITDA, adjusted gross profit, tax rate, capital expenditures and cash flow,
the company’s expectations regarding the pay down of its debt,
growth in the company’s various markets and the company’s expectations, beliefs, plans, strategies, objectives, prospects and assumptions are not guarantees of future performance. These statements are based on management’s expectations that
involve a number
of business risks and uncertainties, any of which could cause actual results to differ materially from those expressed in or implied by the forward- looking statements. These statements involve known and unknown risks, uncertainties and other factors, most of which are difficult to predict and many of which are beyond our control, including the factors described in the company’s SEC filings that may cause our actual results and performance to be materially different from any future results or performance expressed or implied by these forward-looking statements.
For a discussion of key risk factors, please see the risk factors disclosed in the company’s SEC filings, which are available on the SEC’s website at www.sec.gov and on the company’s website, www.mrcglobal.com. Our filings and other important information are also available on the Investor Relations
page of our website at
www.mrcglobal.com. Undue reliance should not be placed on the company’s forward-looking statements. Although forward-looking statements reflect the
company’s good faith beliefs,
reliance should not be placed on forward-looking statements because they involve known and unknown risks, uncertainties and other factors, which may cause the company’s actual results, performance or achievements or future events to differ materially from anticipated future results,
performance or achievements or future events expressed or implied by such
forward-looking statements. The company undertakes no obligation to publicly update or revise any forward-looking statement, whether as a result of new information, future events, changed circumstances or otherwise, except to the extent required by law. |
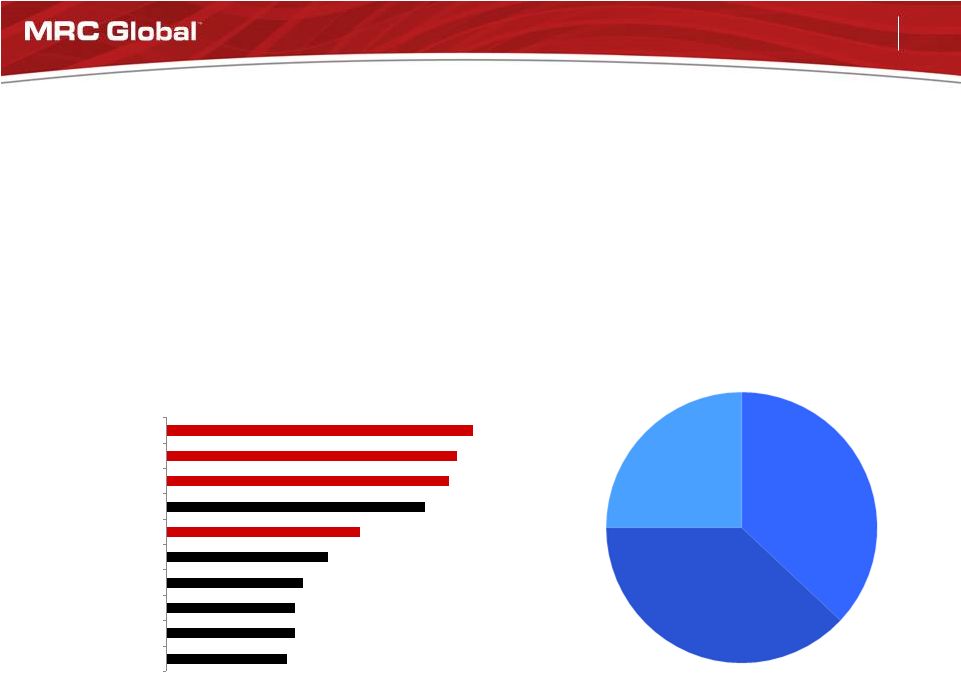
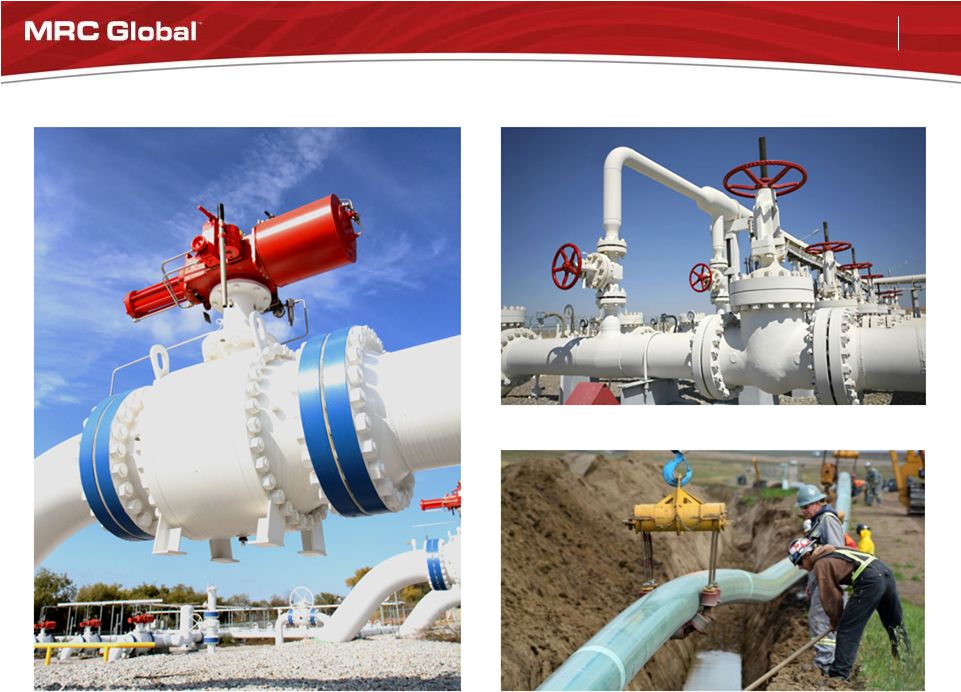
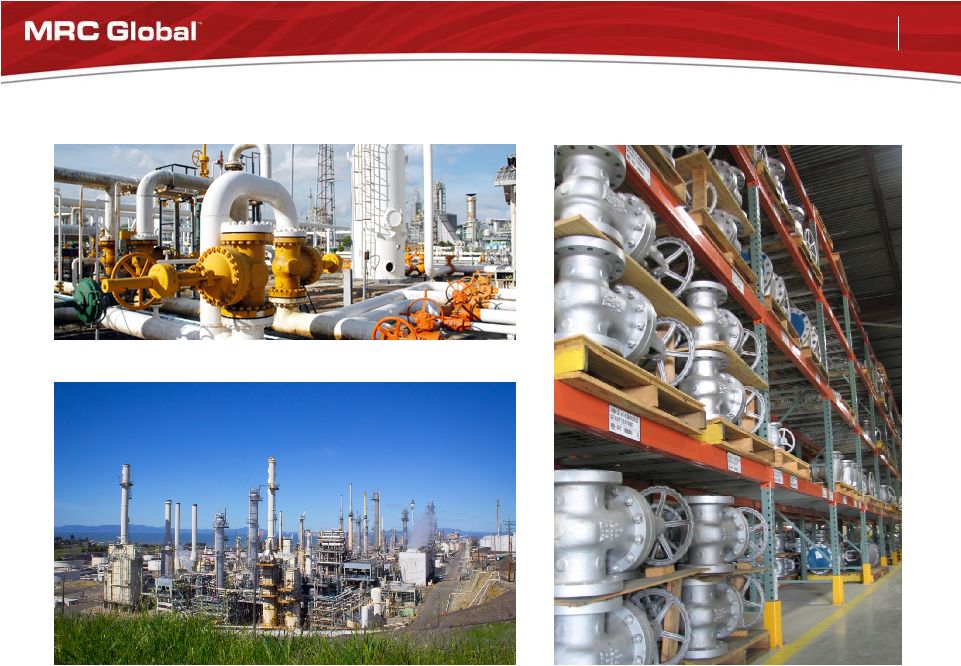
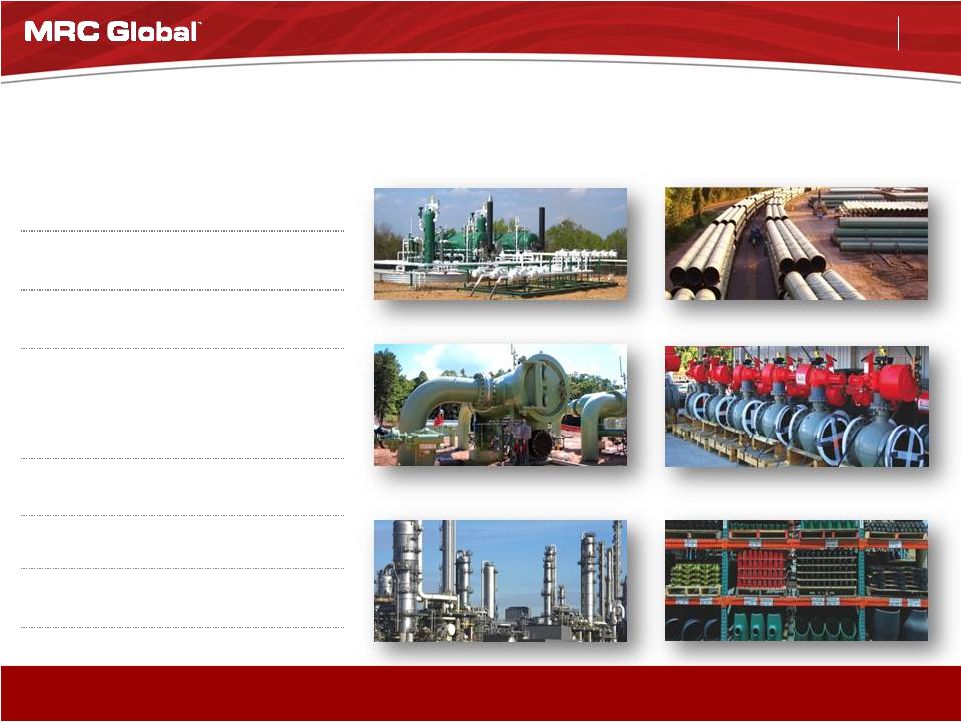 3 Company Snapshot MRC Global is the largest global distributor of pipe, valves and fittings (PVF) to the energy industry, by sales 1. As of June 30, 2015 By the Numbers TTM Sales TTM Adjusted EBITDA $5.621B $384M Employees ~4,500 Locations 400+ Countries • Operations • Direct Sales (>$100,000) • All countries 22 45+ 90+ Customers 21,000+ Suppliers 21,000+ SKU’s 230,000+ Industry Sectors Product Categories Upstream Line Pipe & OCTG Midstream Valves Downstream/ Industrial Fittings & Flanges 1 |
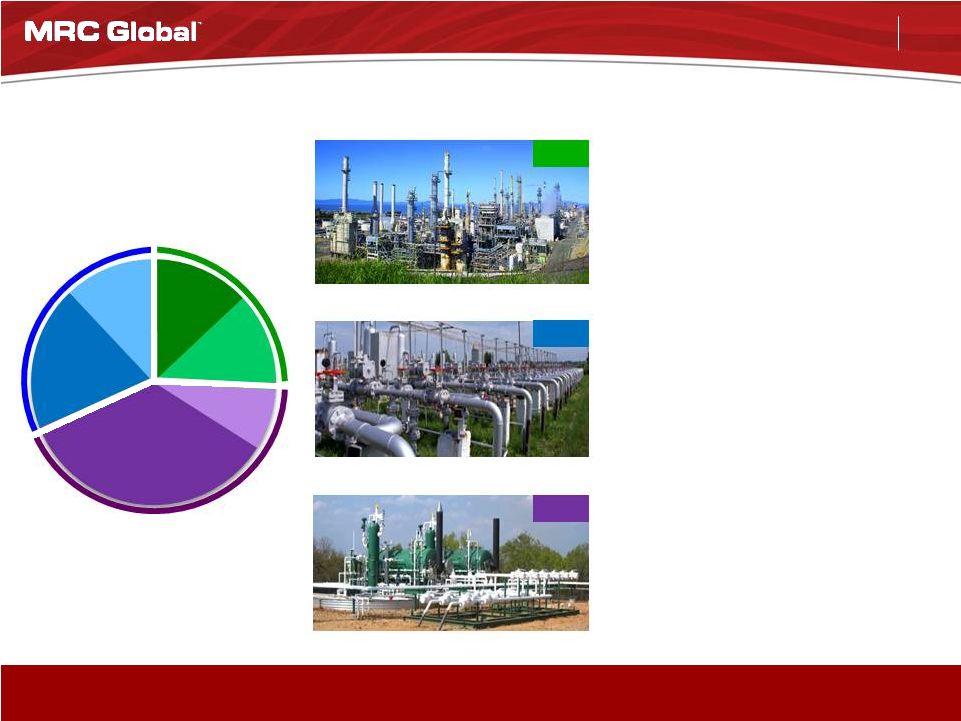 4 Revenue by Industry Sector Note: Percentage of sales for the twelve months ended June 30, 2015. Upstream Downstream Midstream Diversified Across All Three Major Energy Sectors • MRO, recurring, turnaround work • Large installed base of refineries & petrochemical facilities • Weighted to customer’s operating budgets v. new construction capital projects • Primarily new construction • Growing pipeline integrity work in gas utilities • Weighted to customer’s new construction capital projects v. operating budgets • Includes approximately half of line pipe sales • Both MRO and new construction • Weighted slightly to customer’s operating budgets v. new construction capital projects • Includes 100% of OCTG sales • Tracks customer CapEx, well completions and well count • Primarily production equipment, above ground Transmission 19% Production Infrastructure, Materials & Supplies 35% Drilling & Completion Tubulars (OCTG) 8% Gas Utility 12% Other/ Industrial 13% Chemicals & Refining 13% 26% 31% 43% |
 5 By Product Line Revenue by Geography and Product Line 9% 14% 24% 25% 28% Canada Asia / Europe Eastern Western Gulf Coast 32% 21% 20% 19% 8% Valves Fittings & Flanges Line Pipe General Oilfield Products OCTG Note: Percentage of sales for the twelve months ended June 30, 2015 By Geography 8% 21% 19% 20% 32% Houston, TX Edmonton, AB Bradford, UK Singapore Perth, AU Stavanger, NO Diversified Across Multiple Geographies - Domestically (all shale plays) and Internationally |
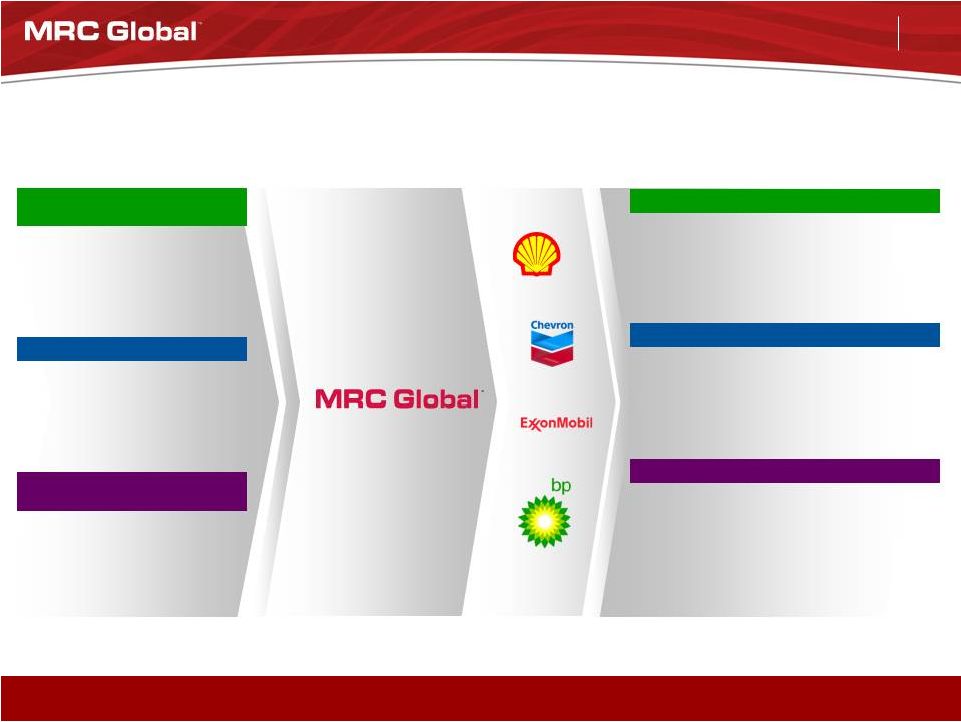 6 MRC Global plays a vital role in the complex, technical, global energy supply chain
Long-Term Supplier & Customer Relationships
CUSTOMERS
SUPPLIERS
IOCs DOW DuPont Marathon Petroleum AGL Resources Atmos NiSource PG&E MarkWest DCP Midstream Chesapeake Energy CNRL ConocoPhillips Apache Anadarko California Resources Corporation Hess Husky Energy Marathon Oil Statoil Tenaris TMK- IPSCO U.S. Steel CSI Tubular JMC Wheatland Balon Cameron Flowserve Kitz Neway Velan Boltex Bonney Forge Chevron Phillips Chemical Tube Forgings of America WL Plastics Emerson Williams Phillips 66 Chevron Phillips Chemical Valero Colombia Pipeline Group Energy Carbon Steel Tubular Products Valves Fittings, Flanges and General Use Products Downstream Midstream Upstream |
 7 Integrated Supply Statistics • Supplying Integrated Supply services since 1988 • Accounts for sales in excess of
$830 million and growing rapidly • Employ over 190 personnel
at customer sites
• Providing Integration Services on
over 100 customer sites • Managing over 1.4 million customer part numbers • Consignment inventories in excess
of $35 million at 700 locations
• Manage customer-owned point of use materials at over 800 locations MRC Global is a Leading Provider of Integrated Supply Services to the Energy Industry |
 8 Long Term Growth Strategy – Greater Scale for Better Returns Rebalance Product Mix to Higher Margin Items • Focus on valves and valve automation Growth from Mergers & Acquisitions • Continue to identify geographic and product line opportunities 1. Percentage of sales for the twelve months ended June 30, 2015 Targeted Growth Account Continue to grow share with the “next 75” customers 29% 22% 49% All Other -
21,000+ customers Targeted Growth Accounts Top 1 - 25 • Focus on multi-year “Top 25” MRO agreements & adding scope to current agreements Execute Global Preferred Supplier Contracts • Recently added or renewed: • MarkWest – U.S. midstream MRO, 5 years • Statoil – Norway, Johan Sverdrup project, instrumentation • Marathon Oil – U.S. MRO, 5 years • California Resources Corporation – U.S. integrated supply, 3 years • TECO Energy’s People’s Gas & New Mexico Gas – U.S. integrated supply, 5 years • SABIC – Saudi Arabia, downstream valve framework agreement, 5 years Strategic Objectives Customer Mix 1 |
 Product Mix Shift from 2008 to 2015 • Stable, higher margin valves are a larger percentage of revenue. • More volatile carbon pipe is a smaller percentage of revenue. • The prices of higher margin products are more stable. 55% Higher Margin Products 45% Carbon Pipe 2008 72% Higher Margin Products TTM 2015 Note: Percentage of sales for the year ended December 31, 2008 and the twelve months ended June 30, 2015.
OCTG 24% Line Pipe 21% Valves 15% Fittings & Flanges 18% Oilfield OCTG 8% 28% Carbon Pipe Line Pipe 20% Valves 32% 9 Fittings & 21% Flanges General Oilfield 19% Supplies Products 22% General |
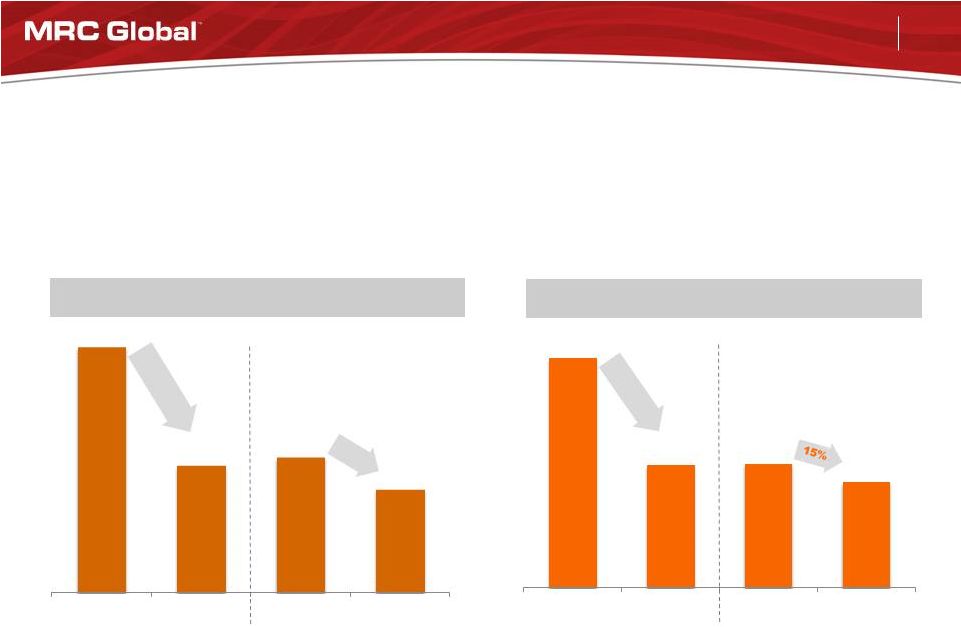 10 • Inflation impacted both OCTG and LP in 2008…resulting in a significant reduction in prices in 2009. • Today, prices are lower and have less to fall in a downturn. Line Pipe Prices OCTG Prices 48% 47% Carbon Steel Prices in 2008/2009 as Compared to Today Note: Prices are per ton, as reported in published market data. Amounts reflect peak prices in September 2008 and trough prices in November 2009. 2014 peak prices for OCTG are from November and Line Pipe from August. 23% $3,036 $1,614 $1,643 $1,404 Peak 2008 Trough 2009 Peak 2014 Jul-15 $3,242 $1,675 $1,786 $1,402 Peak 2008 Trough 2009 Peak 2014 Jul-15 |
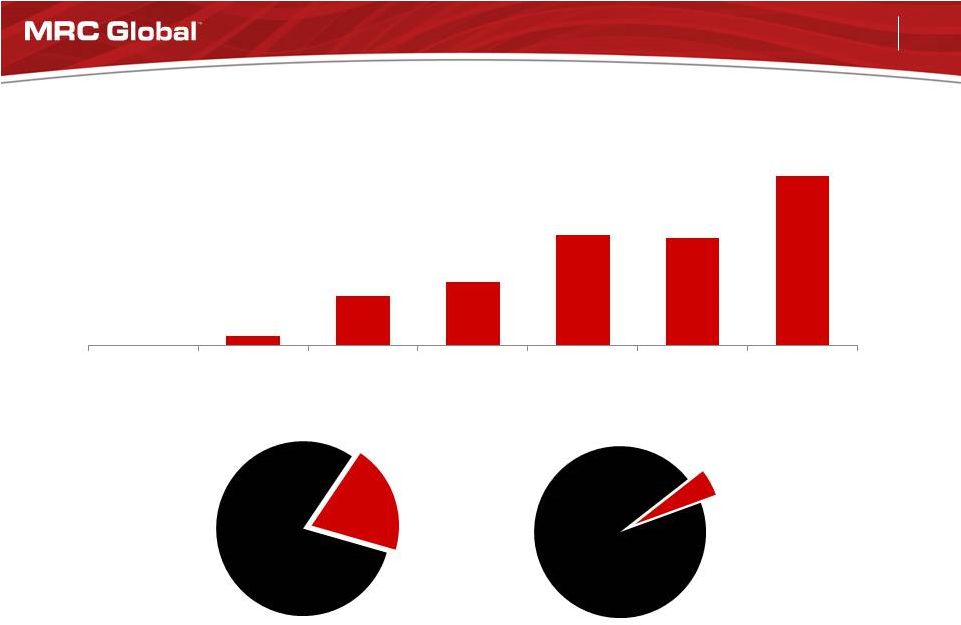 11 Building an International Platform for Growth North America Estimated PVF Spend ~$25B Estimated Percentage of PVF Spend ¹ International Estimated PVF Spend ~$20B 1. Estimated percentages are management estimates based on 2014 results. $0 $52 $256 $330 $567 $554 $873 2008 2009 2010 2011 2012 2013 2014 International Segment Revenue ($ millions) MRC Global 20% ~$5.0 B All others 80% MRC Global 5% ~$900M All others 95% |
 12 Strategic Expansion into Offshore Production Platform MRO • Top 4 largest offshore markets ~$140 billion E&P spend • Norway is the largest – we are positioned in 4 of the 5 largest offshore markets. • MRC Global revenue mix • Pre Stream acquisition (2013) – approx. 98% onshore, 2% offshore • Post Stream acquisition (2014) – approx. 93% onshore, 7% offshore $38 $36 $35 $32 $24 $20 $17 $16 $16 $15 Norway United Kingdom USA Brazil Australia Angola Nigeria Kingdom of Saudi Arabia Malaysia Mexico Top 10 Global Offshore E&P Markets ¹ 1. Source: Rystad Energy, September 2014 ($ billions) Stream 2014 Sales by Division Valve Management 37% Instrumentation 38% Pipe, Fittings & Flanges 25% |
 13 Financial Overview |
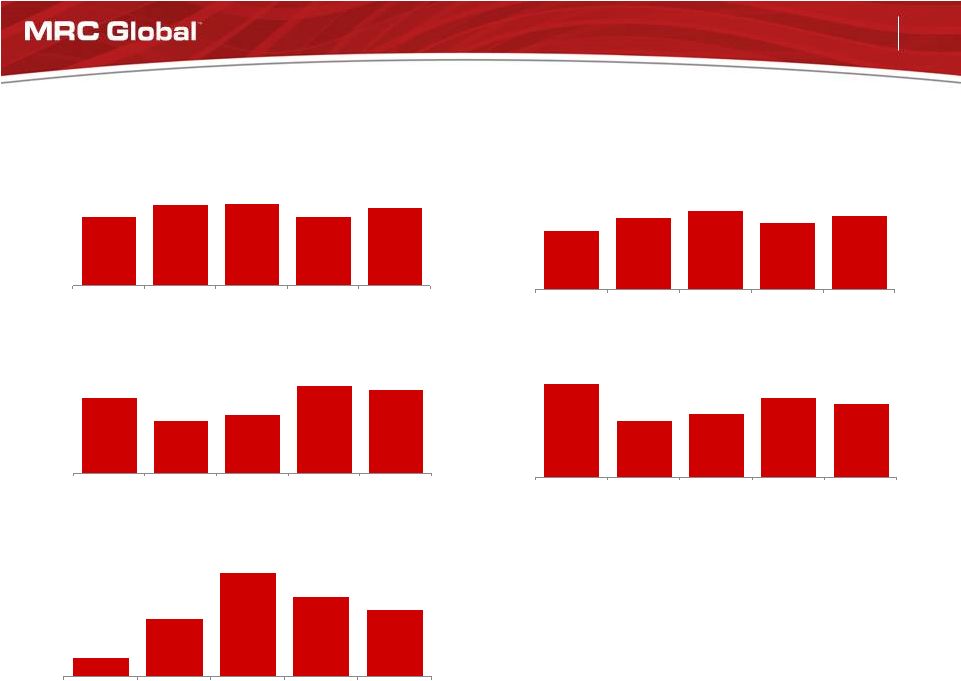
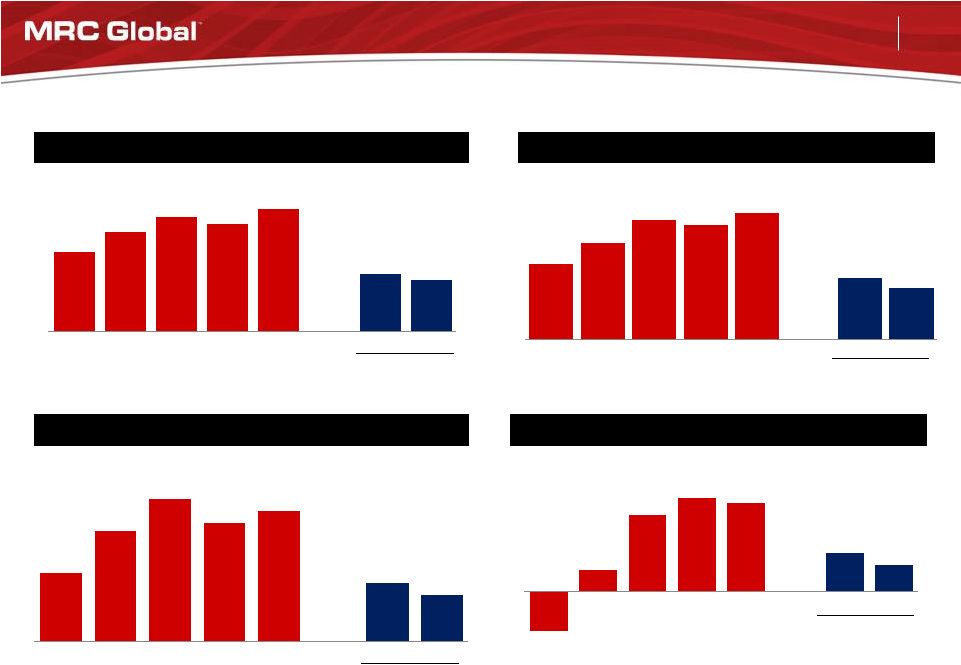 14 $663 $850 $1,058 $1,009 $1,120 $538 $452 2010 2011 2012 2013 2014 2014 2015 Financial Metrics Sales Adjusted Gross Profit and % Margin Adjusted EBITDA and % Margin 7.0% 8.5% ($ millions, except per share data) Y-o-Y Growth 28% 24% (5%) 11% Y-o-Y Growth 61% 29% (17%) 10% $3,846 $4,832 $5,571 $5,231 $5,933 $2,803 $2,490 2010 2011 2012 2013 2014 2014 2015 $224 $360 $463 $386 $424 $190 $150 2010 2011 2012 2013 2014 2014 2015 5.8% 7.5% 8.3% 7.4% 7.1% 6.8% 6.0% Y-o-Y Growth 26% 15% (6%) 13% Diluted EPS $(0.61) $0.34 $1.22 $1.48 $1.40 $0.61 $0.43 2010 2011 2012 2013 2014 2014 2015 Y-o-Y Growth 156% 259% 21% (5%) 17.2% 17.6% 19.0% 19.3% 18.9% 19.2% 18.1% Six months ended June 30 Six months ended June 30 Six months ended June 30 Six months ended June 30 |
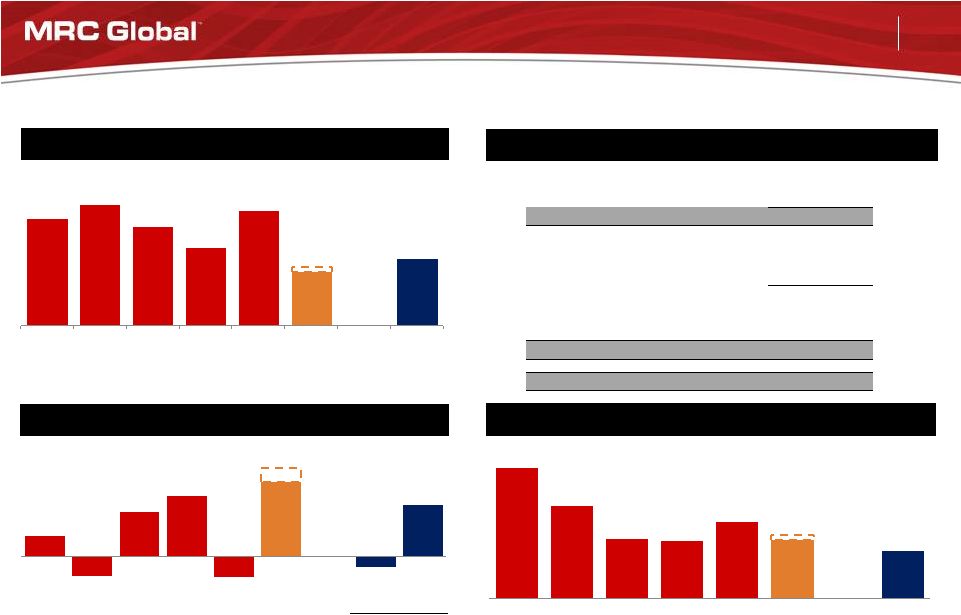 15 Balance Sheet Metrics Total Debt Capital Structure Cash Flow from Operations Net Leverage ($ millions) June 30, 2015 Cash and Cash Equivalents $ 33 Total Debt (including current portion): Term Loan B due 2019, net of discount 527 Global ABL Facility due 2019 321 Total Debt $ 848 Preferred stock 355 Common stockholders’ equity 1,404 Total Capitalization $ 2,607 Liquidity $ 576 5.8x 4.1x 2.5x 2.6x 3.4x 2.6x – 2.9x 2.1x 2010 2011 2012 2013 2014 2015E 06/30/15 $113 $(103) $240 $324 $(106) $400 - $475 $(52) $277 2010 2011 2012 2013 2014 2015E 2014 2015 $1,360 $1,527 $1,257 $987 $1,454 $680 - $750 $848 2010 2011 2012 2013 2014 2015E 06/30/15 Six months ended June 30 NOTE: The Net Leverage ratio is calculated assuming the expected year-end debt balance above, the 6/30/2015 cash balance and a denominator of $249
million, which is 2015 EBITDA consensus, as per Bloomberg on August 6,
2015. |
 16 Current 2015 Guidance • Revenue – Quarter: Q3 sequentially lower by 7-12% – Annual: 2015 expected to be 20-25% lower than 2014 • Upstream – upper 30% decline • Midstream – high single digit decline • Downstream – mid single digit decline – Revenue headwinds in 2015 in excess of $120 million related to currency • Adjusted gross margin
– Low to mid 17% range for the remainder of 2015 • LIFO – $30 million benefit for 2015 • SG&A – $149-$152 million per quarter for the remainder of 2015 • Effective tax rate
– 36% for 2015 • Balance sheet – Expect to generate $400-$475 million of cash from operations – Reduce debt by $700-$750 million in 2014 – Reduce debt to $680-$750 million at year-end |
 17 Macro drivers • Growth in global energy consumption driving investment • Increased global production • Need for additional energy infrastructure • Expansion of downstream energy conversion businesses Investment Thesis Highlights Leading global PVF distributor to the energy sector MRC Global attributes • Market leader • Exposed to all sectors of global energy • Long term global customer & supplier relationships • Generates strong cash flow from operations over the cycle |
 18 Appendix |
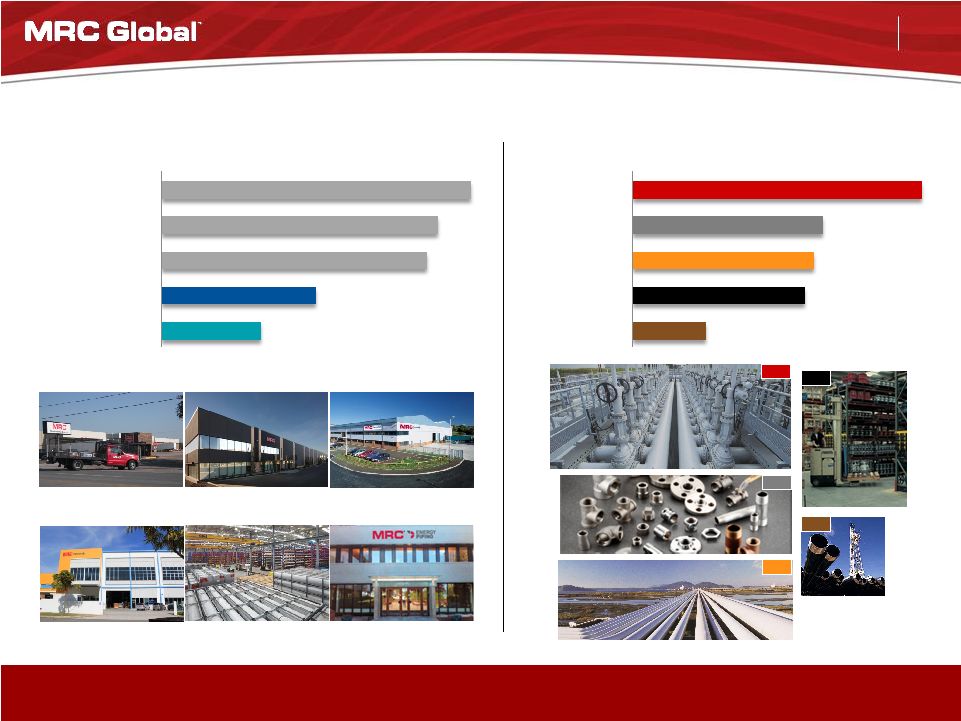
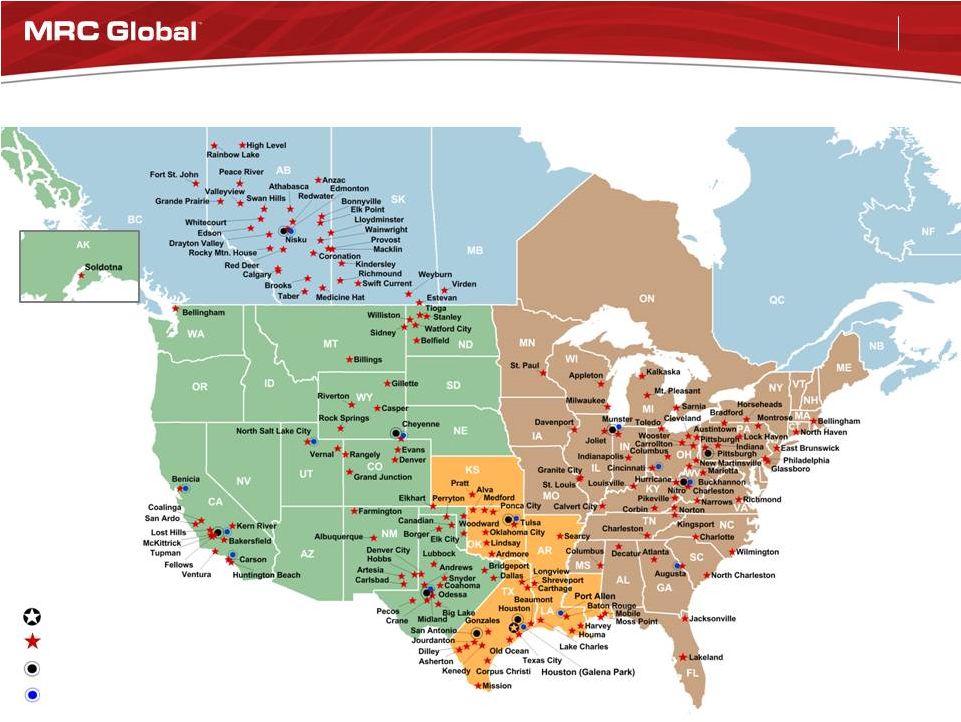 19 MRC Global // North America Corporate Headquarters Branch Locations Regional Distribution Centers Valve Automation Centers Western Gulf Coast Canada Eastern |
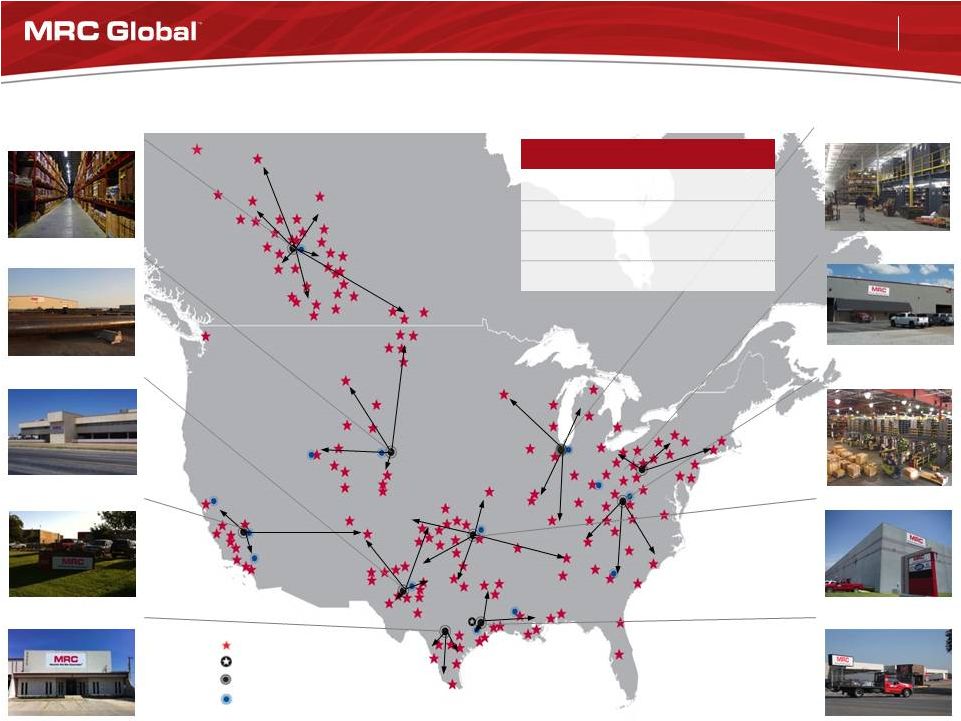 20 Global Footprint to Serve Customers - North America Munster, IN Nitro, WV Tulsa, OK Houston, TX Nisku, AB Cheyenne, WY Odessa, TX Bakersfield, CA San Antonio, TX Regional Distribution Centers Corporate Headquarters Valve Automation Centers Branch Locations By the Numbers As of 6/30/2015 Branches 160+ RDCs 10 VACs 14 Employees ~3,200 Pittsburgh, PA |
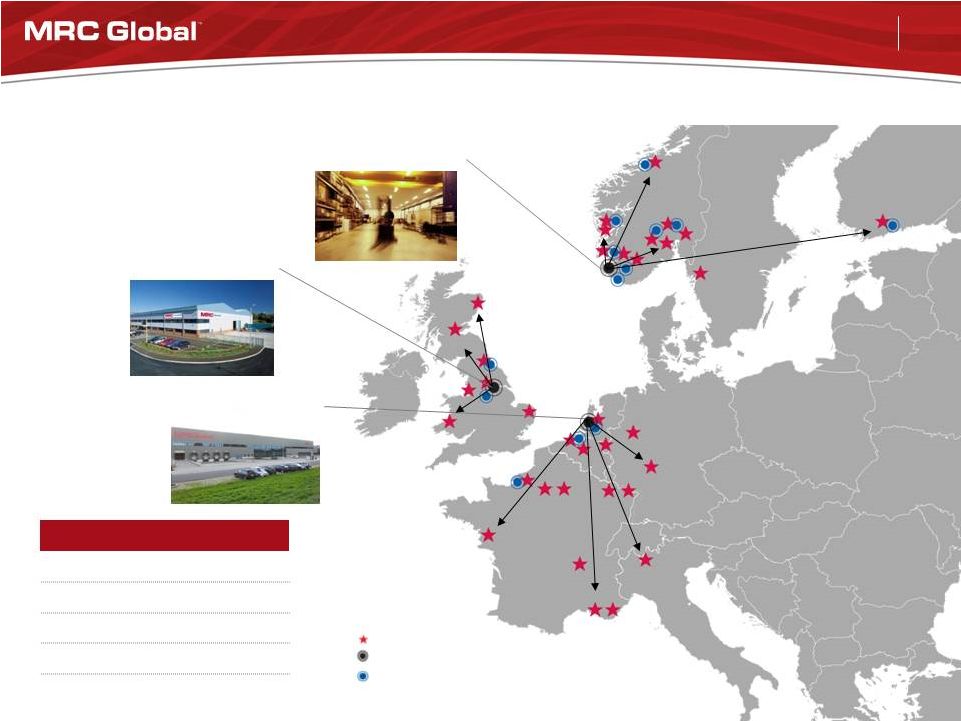 Global Footprint to Serve Customers - Europe Regional Distribution Centers Valve Automation Centers Branch Locations Stavanger, NO By the Numbers As of 6/30/2015 Branches 34 RDCs 3 VACs 13 Countries 9 Employees ~900 Rotterdam, NL Bradford, UK 21 |
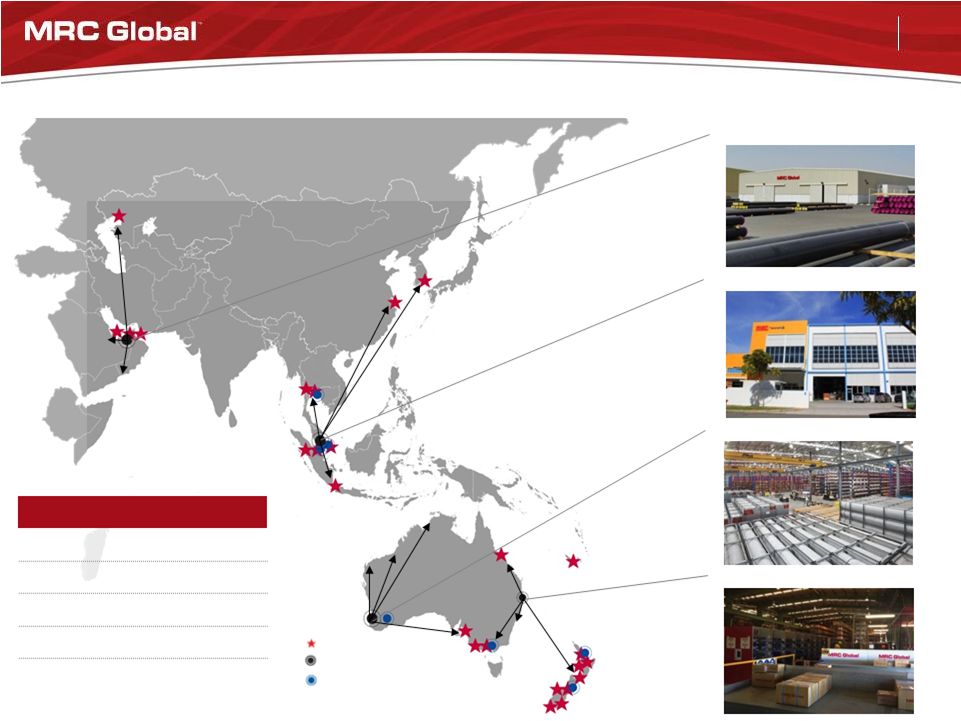 22 By the Numbers As of 6/30/2015 Branches 28 RDCs 4 VACs 7 Countries 11 Employees ~400 Global Footprint to Serve Customers - Asia Pacific & Middle East Regional Distribution Centers Valve Automation Centers Branch Locations Singapore Perth, WA Brisbane, QLD Dubai, UAE |
 Date Acquisition Rationale Region Revenue ¹ ($ millions) Oct-08 LaBarge Midstream U.S. $ 233 Oct-09 Transmark International valve platform Europe and Asia 346 May-10 South Texas Supply Domestic shale Eagle Ford Shale - South Texas 9 Aug-10 Dresser Oil Tools Supply Domestic shale Bakken Shale - North Dakota 13 Jun-11 Stainless Pipe and Fittings Projects Australia / SE Asia 91 Jul-11 Valve Systems and Controls Valve automation U.S. Gulf of Mexico 13 Mar-12 OneSteel Piping Systems International PVF expansion Australia 174 Jun-12 Chaparral Supply Domestic shale Mississippian Lime - Oklahoma / Kansas 71 Dec-12 Production Specialty Services Domestic shale Permian Basin / Eagle Ford shale 127 Jul-13 Flow Control Products Valve automation Permian Basin / Eagle Ford shale 28 Dec-13 Flangefitt Stainless Stainless/Alloys United Kingdom 24 Jan-14 Stream International Offshore PVF Norway 271 May-14 MSD Engineering Valve automation Singapore & SE Asia 26 Jun-14 HypTeck International Offshore Norway 38 1. Reflects reported revenues for the year of acquisition or 2013 for Stream, MSD and HypTeck.
M&A -
Track Record of Strategic Acquisitions
Acquisition Priorities • International branch platform for “super majors” E&P spend • Branch platforms/infrastructure for North American shale plays • Global valve and valve automation • Global stainless/alloys 23 $ 1.46 Billion + |
 24 Upstream |
 25 Midstream |
 26 Downstream |
 27 Performance Measures $1,043 $1,234 $1,255 $1,054 $1,181 2010 2011 2012 2013 2014 $180 $217 $238 $203 $223 2010 2011 2012 2013 2014 Sales per Employee ($ thousands) Adjusted Gross Profit per Employee ($ thousands) 23.0% 19.8% 20.4% 21.8% 21.3% 2010 2011 2012 2013 2014 11.7% 10.6% 10.9% 12.3% 12.1% 2010 2011 2012 2013 2014 SG&A / Sales Average Working Capital / Sales 1.9% 6.1% 10.9% 8.4% 7.0% 2010 2011 2012 2013 2014 Return on Average Net Capital Employed (RANCE) 1. Calculated based on average number of employees 2. RANCE is defined as Pretax income for the year plus Interest expense and related financing charges, multiplied by 1, minus our effective tax rate, and the denominator is average net capital employed for the year. Net capital employed is defined as Total assets minus Current liabilities plus Other long-
term liabilities. 1 1 2 |
 28 Adjusted EBITDA Reconciliation Six months ended June 30 Year Ended December 31 ($ millions) 2015 2014 2014 2013 2012 2011 2010 Net income available to shareholders $ 45.4 $ 62.8 $ 144.1 $ 152.1 $ 118.0 $ 29.0 $ (51.8) Income tax expense 26.2 34.0 81.8 84.8 63.7 26.8 (23.4) Interest expense 28.3 30.5 61.8 60.7 112.5 136.8 139.6 Depreciation and amortization 10.2 10.5 22.5 22.3 18.6 17.0 16.6 Amortization of intangibles 30.9 33.9 67.8 52.1 49.5 50.7 53.9 Increase (decrease) in LIFO reserve (15.1) 2.1 11.9 (20.2) (24.1) 73.7 74.6 Change in fair value of derivative instruments 1.1 4.3 1.1 (4.7) (2.2) (7.0) 4.9 Equity-based compensation expense 5.4 4.0 8.9 15.5 8.5 8.4 3.7 Severance & related costs 8.7 5.0 7.5 0.8 - 1.1 3.2 Write-off of debt issuance costs 3.2 - - - - - - Foreign currency losses (gains) 5.5 (3.1) 2.5 12.9 (0.8) (0.6) 0.3 Loss on sale of Canadian progressive cavity pump business - 6.2 6.2 - - - - Loss on disposition of rolled and welded business - - 4.1 - - - - Insurance charge - - - 2.0 - - - Cancellation of executive employment agreement (cash portion) - - 3.2 - - - - Inventory write-down - - - - - - 0.4 M&A transaction & integration expenses - - - - - 0.5 1.4 Expenses associated with refinancing - - - 5.1 1.7 9.5 - Loss on early extinguishment of debt - - - - 114.0 - - Pension settlement - - - - 4.4 - - Legal and consulting expenses - - - - - 9.9 4.2 Provision for uncollectible accounts - - - - - 0.4 (2.0) Joint venture termination - - - - - 1.7 - Other expense (income) - - 0.6 3.0 (0.6) 2.6 (1.4) Adjusted EBITDA $ 149.8 $ 190.2 $ 424.0 $ 386.4 $ 463.2 $ 360.5 $ 224.2 |
 29 Adjusted Gross Profit Reconciliation Six months ended June 30 Year ended December 31 ($ millions) 2015 2014 2014 2013 2012 2011 2010 Gross profit $ 425.9 $ 491.6 $ 1,018.1 $ 954.8 $ 1,013.7 $ 708.2 $ 518.1 Depreciation and amortization 10.2 10.5 22.5 22.3 18.6 17.0 16.6 Amortization of intangibles 30.9 33.9 67.8 52.1 49.5 50.7 53.9 Increase (decrease) in LIFO reserve (15.1) 2.1 11.9 (20.2) (24.1) 73.7 74.6 Adjusted Gross Profit $ 451.9 $ 538.1 $ 1,120.3 $ 1,009.0 $ 1,057.7 $ 849.6 $ 663.2 |