Attached files
| file | filename |
|---|---|
| 8-K - FORM 8-K - CENTERPOINT ENERGY INC | d13060d8k.htm |
| EX-99.1 - EX-99.1 - CENTERPOINT ENERGY INC | d13060dex991.htm |
 August 10, 2015
Second Quarter 2015 Earnings Call
• Regulatory Update • Guidance Reaffirmed • Dividend to Grow with Earnings Exhibit 99.2 |
 investors.centerpointenergy.com
2 Cautionary Statement This presentation contains statements concerning our expectations, beliefs, plans, objectives, goals, strategies, future events or performance or underlying assumptions (including future dividends) and other statements that are not historical facts. These statements are “forward-looking statements” within the meaning
of the Private Securities Litigation Reform Act of 1995. You should not place undue reliance on forward-looking statements. Actual results may differ materially from those expressed or implied by these statements. You
can generally identify our forward-looking statements by the words “anticipate,” “believe,” “continue,” “could,” “estimate,” “expect,” “forecast,”
“goal,” “intend,” “may,” “objective,” “plan,” “potential,” “predict,” “projection,” “should,” “will,” or other similar words. The
absence of these words, however, does not mean that the
statements are not forward-looking. We have based our
forward-looking statements on our management's beliefs and assumptions based on information currently available to our management at the time the statements are made. We caution you that assumptions, beliefs, expectations, intentions, and projections about future events may and often do vary materially
from actual results. Therefore, we cannot assure you that actual results will not differ materially from those expressed or implied by our forward-looking statements.
Some of the factors that could cause actual results to differ from those
expressed or implied by our forward-looking statements include but are not limited to the timing and impact of future regulatory, legislative and IRS decisions, financial market conditions, future market conditions, economic and employment conditions, customer growth
and other factors described in CenterPoint Energy, Inc.’s Form 10-K for the period ended December 31, 2014 under “Risk Factors” and “Management’s Discussion and Analysis of Financial Condition and Results of Operations - Certain Factors Affecting Future Earnings,” in CenterPoint Energy, Inc.’s Form 10-Q for the quarter ended June 30, 2015 under “Cautionary Statement Regarding
Forward-Looking Information,” “Risk Factors” and “Management’s Discussion and Analysis of Financial Condition and Results of Operations of CenterPoint Energy, Inc. and Subsidiaries” and in other filings with the SEC by CenterPoint Energy, which can be found at www.centerpointenergy.com on the Investor Relations page or on the SEC’s website at www.sec.gov . This presentation contains time sensitive information that is accurate as of the date hereof. Some of the information in this
presentation in unaudited and may be subject to change. We undertake no obligation to update the information presented herein except as required by law.
Investors and others should note that we may announce material information
using SEC filings, press releases, public conference calls, webcasts and the Investors page of our website. In the future, we will continue to use these channels to distribute material information about the Company and to communicate important information about the
Company, key personnel, corporate initiatives, regulatory
updates and other matters. Information that we post on our website could be deemed material; therefore, we encourage investors, the media, our customers, business partners and others interested in our Company to review the information we post on our website. Use of Non-GAAP Financial Measures In addition to presenting its financial results in accordance with generally accepted accounting principles (“GAAP”),
CenterPoint Energy also provides guidance based on adjusted diluted earnings per share, which is a non-GAAP financial measure. Generally, a non-GAAP financial measure is a numerical measure of a company’s historical or future financial performance that excludes or includes amounts that are not normally excluded or included in the most directly comparable GAAP financial measure. A full reconciliation of net income and diluted earnings per share to the basis used in providing guidance is provided in this presentation on slide 22. Additionally, on slides 18 and 23, management presents a further adjustment and reconciliation
of adjusted diluted earnings per share to a 2014 baseline metric, which provides management’s starting point for forecasting earnings growth, by adjusting for unusual weather impacts, true-up variations and an unusual energy efficiency bonus. These additional adjustments are provided to further explain the basis for management’s guidance estimate. These non-GAAP financial measure should be considered as a supplement and complement to, and not as a substitute for, or superior to, the most directly comparable GAAP financial measure and may be different than non-GAAP financial measures used by other
companies. Management evaluates financial performance in part
based on adjusted diluted earnings per share and believes that presenting this non-GAAP financial measure enhances an investor’s understanding of CenterPoint Energy’s overall financial performance by providing them with an additional meaningful and relevant comparison of current and anticipated future results across periods by excluding items that Management does not believe most accurately reflect its fundamental business performance, which items include the items reflected in the reconciliation table on page 22 of this presentation. This non-GAAP financial measure should be considered as a supplement and complement to, and not as a substitute for, or superior to, the most directly
comparable GAAP financial measure and may be different than non-GAAP financial measures used by other companies. |
 investors.centerpointenergy.com
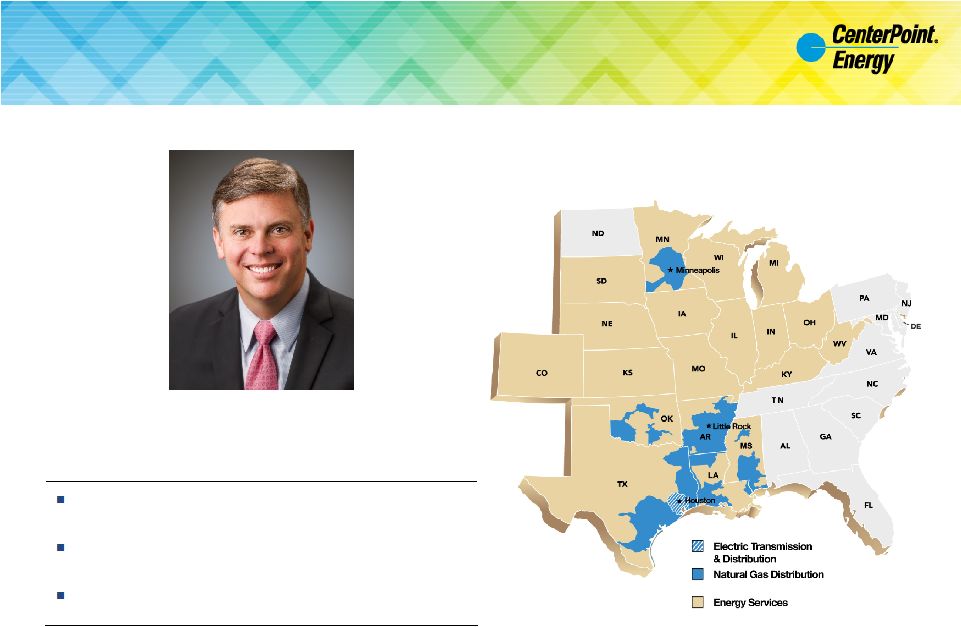
3 Scott Prochazka – President and CEO Earnings Call Discussion Highlights Solid Second Quarter Results Utility Operations Update Midstream Investment Update |
 investors.centerpointenergy.com
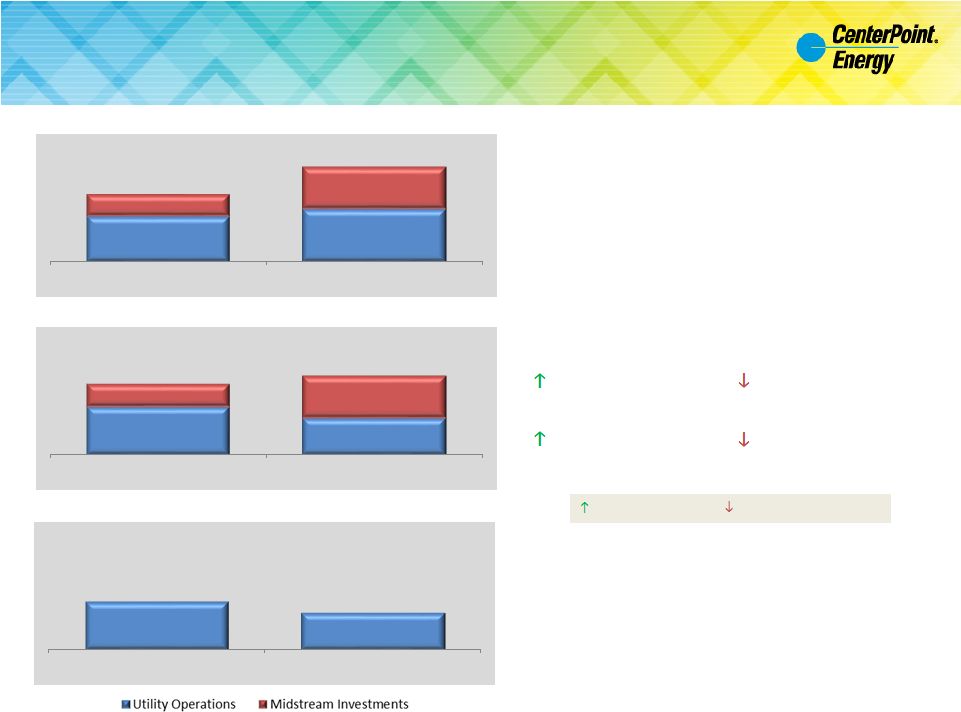
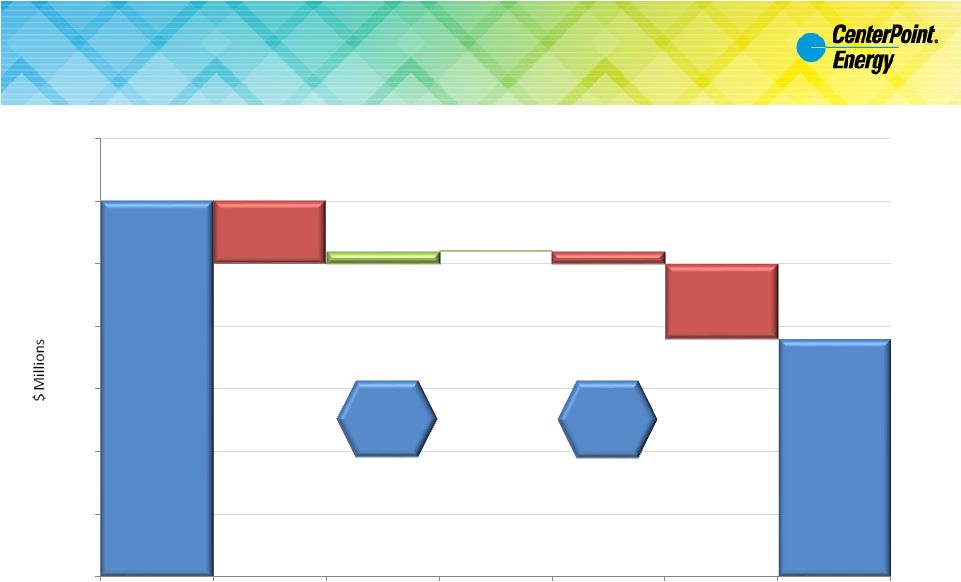
$0.13 $0.10 $0.06 $0.11 2015 2014 $0.12 $0.14 $0.06 $0.11 2015 2014 4 Second Quarter 2015 Performance Highlights Q2 GAAP EPS Q2 2015 vs Q2 2014 Drivers (EPS on a Guidance Basis) $0.21 $0.18 $0.19 Q2 EPS on a Guidance Basis 2Q15 Utility Operations EPS on a Guidance Basis vs 2Q14 Baseline $0.25 Favorable Variance Unfavorable Variance Note: Refer to slide 22 for reconciliation to GAAP measures and slide 2 for information on non-GAAP measures Rate Relief Midstream Investments Equity Return related to True-up Customer Growth $0.13 $0.10 2015 2014 Baseline |
 investors.centerpointenergy.com
5 Midstream Investments Enable Q2 Outlook 3-7% per unit distribution growth outlook for 2016 and 2017 Enable 2016 volume growth outlook High single digit growth in natural gas gathering volumes ~25% growth in natural gas processing volumes Doubling of crude oil gathering volumes Producers continue to invest significant capital in the plays around Enable’s footprint,
including the SCOOP, STACK, Cana Woodford and Cleveland Sands plays.
Enable has connected more wells year-to-date through July
2015 than the same period one year ago
To support rich gas volume growth in the Anadarko Basin, Enable continues to
add natural gas processing infrastructure
A 200 MMcf/d plant in Grady County, Oklahoma, expected in service during the
first quarter of 2016
Wildhorse plant, a newly announced 200 MMcf/d plant in Garvin County, Oklahoma, expected in service during the first quarter of 2017 Quarterly cash distribution increased to $0.316 per unit for the 2 nd quarter, representing an approximately 1% increase over the prior quarter Source: Enable Midstream Partners August 5 th , 2015, Press Release and Q2 Earnings Call |
 investors.centerpointenergy.com
6 Severe Storms Impacted Houston in April, May and June |
 investors.centerpointenergy.com
7 Tracy Bridge – EVP & President, Electric Division Earnings Call Discussion Highlights Electric Results Houston Growth Regulatory Update Raising our high voltage transmission towers to accommodate the new Highway US-99 corridor and to serve load growth |
 investors.centerpointenergy.com
$115 $131 $131 $13 $5 $8 ($5) ($2) ($3) $- $20 $40 $60 $80 $100 $120 $140 $160 Q2 2014 TDU Core Operating Income Usage, primarily weather Customer growth Rate relief Equity Return, primarily related to true- up proceeds O&M expense Depreciation and other Q2 2015 TDU Core Operating Income Electric Transmission and Distribution Operating Income Drivers: 2 nd Quarter 2014 vs 2 nd Quarter 2015 8 2% YoY Customer Growth 1 1 Houston Electric’s customer count increased from 2,272,293 as of June 30, 2014, to 2,322,164 as of June 30, 2015
2 Q2 2014 O&M versus Q2 2015 O&M, excluding costs with revenue offset
3 Net transmission related revenue 4 Right of Way revenue for 2Q 2015 was slightly above $1 million, in-line with 2Q 2014; YTD ROW revenue is approximately $9
million 4
2% YoY O&M Increase 2 3 |
 investors.centerpointenergy.com
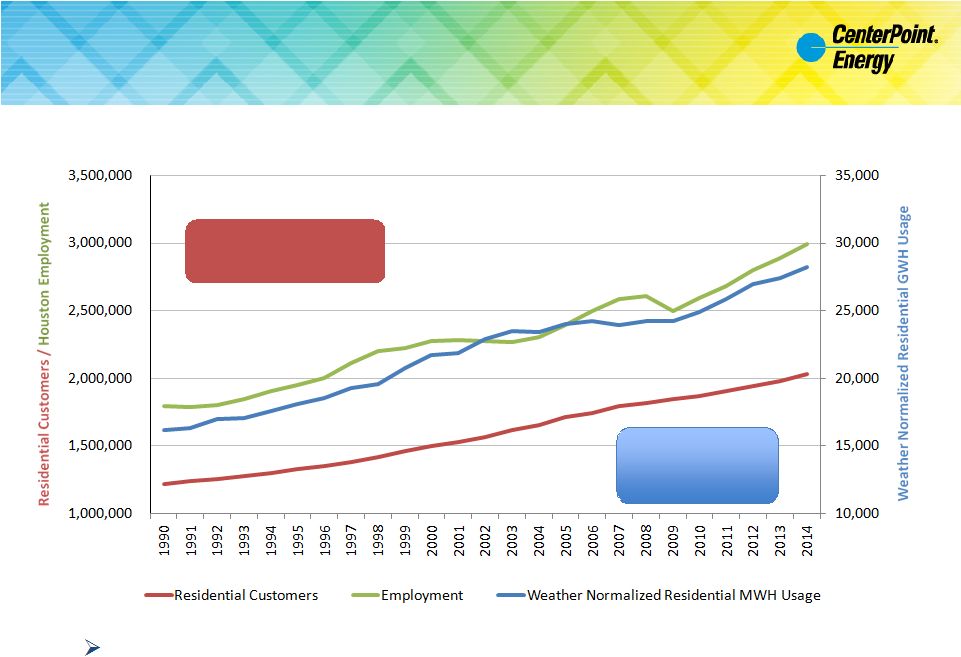
9 Houston Electric: Residential Customers and Weather Normalized Residential Load vs. Houston Employment 2015 Residential customer growth rate through June 30, 2015: 2% annualized
Sources: 1 Company Provided 2 Texas Workforce Commission (Houston, Sugarland, Woodlands Metro) 1 1 2 Residential customer count grew 46,484 Q2 2014 to Q2 2015 Over 2% residential customer compound annual growth rate since 1990 |
 investors.centerpointenergy.com
Electric Transmission and Distribution:
Regulatory Update
DCRF – Distribution Cost Recovery Factor; TCOS – Transmission Cost of Service; EECRF – Energy Efficiency Cost Recovery Factor 10 Mechanism Expected Effective Date Annual Revenue Increase - $MM Comments Docket # DCRF Sept 2015 $13.0 (Settlement) Settlement unanimously approved on July 30, 2015 44572 TCOS 3Q 2015 $13.7 (Requested) Filed on June 26, 2015; based on an incremental increase in net plant of $87.6 MM 44881 EECRF 1Q 2016 $6.6 (Requested Incentive) Filed June 1, 2015; recovers expected program costs and a $6.6 MM performance incentive related to 2014’s energy efficiency program results 44783 Project Expected In- Service Capital - $MM Comments Docket # Brazos Valley Connection Mid-2018 $276 – 383 (Estimated) Routing and need decisions expected during 4Q 2015 44547 Rate Filings: Other Filings: |
 investors.centerpointenergy.com
11 Joe McGoldrick – EVP & President, Gas Division Earnings Call Discussion Highlights Gas Operations Results Regulatory Update Minnesota Belt Line Project Energy Services Update Using horizontal directional drilling to construct and install a new pipeline under the bed of the Arkansas River |
 investors.centerpointenergy.com
$30 $26 $19 $19 ($5) $1 $0 ($1) ($6) $0 $5 $10 $15 $20 $25 $30 $35 Q2 2014 Gas Utility Operating Income Usage, primarily weather Customer growth Rate relief O&M expense Depreciation and other Q2 2015 Gas Utility Operating Income 12 Natural Gas Utilities Operating Income Drivers: 2 nd Quarter 2014 vs 2 nd Quarter 2015 1% YoY Customer Growth 1 1% YoY O&M Growth 2 1 Natural Gas Utilities’ customer count increased from 3,326,517 on June 30, 2014, to 3,362,044 on June 30, 2015
2 Q2 2014 O&M versus Q2 2015 O&M, excluding costs with revenue offset |
 investors.centerpointenergy.com
Natural Gas Utilities: Regulatory Update
13 Jurisdiction Expected Effective Date Annual Revenue Increase - $MM Comments Docket # Minnesota Interim Rates 1 : October 2015 $54.1 (Requested) Rate case filed August 3, 2015; based on a 10.3% ROE and $213MM increase in rate base 15-424 Texas Coast September 2015 $4.9 (Settlement) Pending approval by the TX RRC; settlement established parameters for future GRIP filings GUD 10432 Rate Filings (in process): Jurisdiction Effective Date Annual Revenue Increase - $MM Comments Docket # South Texas July 2015 $4.0 Fourth Annual GRIP GUD 10435 Beaumont/ East Texas July 2015 $5.9 Second Annual GRIP GUD 10433 Rate Filings (approved): TX RRC – Texas Railroad Commission; GRIP – Gas Reliability Infrastructure Program 1 Interim rate amount to be determined |
 investors.centerpointenergy.com
The Belt Line
Supplies gas to more than 600,000
customers in the Minneapolis area
Replaces over 60 miles of 20’’ and
24’’ coupled steel pipe installed
primarily in the 1950s
The project is in its 4
th year and is expected to be completed in 2023, requiring over $400 million of capital Over $70 million invested to date The new pipe includes: remotely controlled valves, upgraded cathodic protection systems, and thicker, welded pipe with improved coating 14 Minnesota Belt Line Project One of many modernization construction projects, Belt Line is scheduled to be completed in 2023. The project is intended to improve system safety and reliability and reduce O&M costs |
 investors.centerpointenergy.com
$5 $7 $1 $1 $0 $2 $4 $6 $8 $10 $12 Q2 2014 Energy Services Operating Income Margin and Other O&M Expense Q2 2015 Energy Services Operating Income 15 Energy Services Operating Income Drivers: 2 nd Quarter 2014 vs 2 nd Quarter 2015 1 2 1 Operating income as reported in Q2 2014 was $11 million. Chart excludes mark-to-market gain of $6 million
2 Operating income as reported in Q2 2015 was $9 million. Chart excludes mark-to-market gain of $2 million
3 Energy Services’ customer count increased from 17,746 on June 30, 2014 to 18,073 on June 30, 2015
1.8% YoY Customer Growth 3 Lower O&M |
 investors.centerpointenergy.com
16 Bill Rogers – EVP & CFO Earnings Call Discussion Highlights Quarterly Drivers Dividend to Grow with Earnings Financing Plan Guidance Reaffirmed |
 investors.centerpointenergy.com
17 $0.10 $0.10 $0.01 ($0.01) $0.00 $0.02 $0.04 $0.06 $0.08 $0.10 $0.12 2014 Q2 Utility Operations on a Guidance Basis Q2 2014 EPS Impact due to Weather vs. Normal 2014-2015 Equity Return Variance Primarily from True- up Proceeds 2014 Q2 Utility Operations Baseline Q2 EPS Normalization GAAP to Guidance Basis to Baseline Note: Please refer to slide 22 for the full reconciliation table and slide 2 for
information on non-GAAP measures
Quarter Ended Quarter Ended June 30, 2014 June 30, 2015 Net Income (in millions) EPS Net Income (in millions) EPS Consolidated as reported 107 $
0.25
$
77
$
0.18 $
Midstream Investments
(44) (0.11)
(27)
(0.06) Utility Operations
(1) 63 0.14
$
50
0.12 $
Per the basis used in providing earnings guidance:
Utility Operations on a guidance basis
44 $
0.10 $
57 $
0.13 $
Midstream Investments
44 0.11 27 0.06 Consolidated on guidance basis
88 $
0.21 $
84 $
0.19 $
(1) CenterPoint earnings excluding Midstream Investments |
 investors.centerpointenergy.com
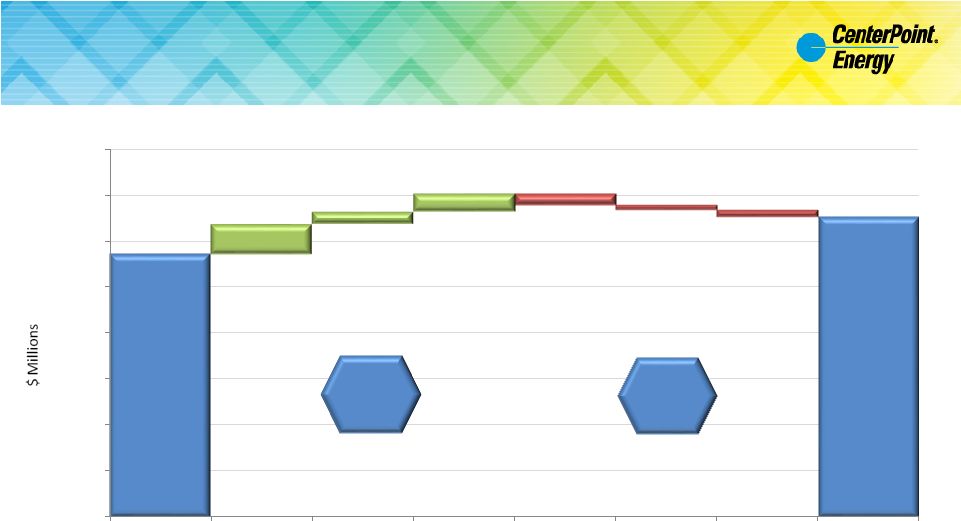
18 2014 Q2 Baseline EPS to 2015 Q2 EPS on a Guidance Basis The consolidated effective tax rate reported for the six months ended June 30, 2015 was 36% compared to 37% for the same period in 2014.
The lower effective tax rate was primarily due to the lower Texas
tax rate enacted on June 15, 2015 and favorable permanent book-tax differences. Note: Please refer to slide 22 for the full reconciliation table and slide 2 for
information on non-GAAP measures
$0.10 $0.13 $0.02 $0.00 $0.01 $0.00 $0.02 $0.04 $0.06 $0.08 $0.10 $0.12 2014 Q2 Utility Operations Baseline Business Unit Results (including growth, weather, usage, depreciation and other) Interest Expense Income Tax Rate 2015 Q2 Utility Operations on a Guidance Basis Quarter Ended Quarter Ended June 30, 2014 June 30, 2015 Net Income (in millions) EPS Net Income (in millions) EPS Consolidated as reported 107 $
0.25 $
77 $
0.18 $
Midstream Investments
(44) (0.11) (27) (0.06) Utility Operations
(1) 63 0.14 $
50 0.12 $
Per the basis used in providing earnings guidance:
Utility Operations on a guidance basis
44 $
0.10 $
57 $
0.13 $
Midstream Investments
44 0.11 27 0.06 Consolidated on guidance basis
88 $
0.21 $
84 $
0.19 $
(1) CenterPoint earnings excluding Midstream Investments |
 investors.centerpointenergy.com
Dividend Growth Outlook
CenterPoint is targeting 4-6% annual EPS growth on a
guidance basis through 2018, inclusive of Midstream
Investments Annual dividend growth in line with EPS growth CenterPoint’s consolidated payout ratio is expected to remain above 90% with a utility operations payout ratio of 60-70% 30-40% of utility operations earnings expected to be used to fund utility growth 19 |
 investors.centerpointenergy.com
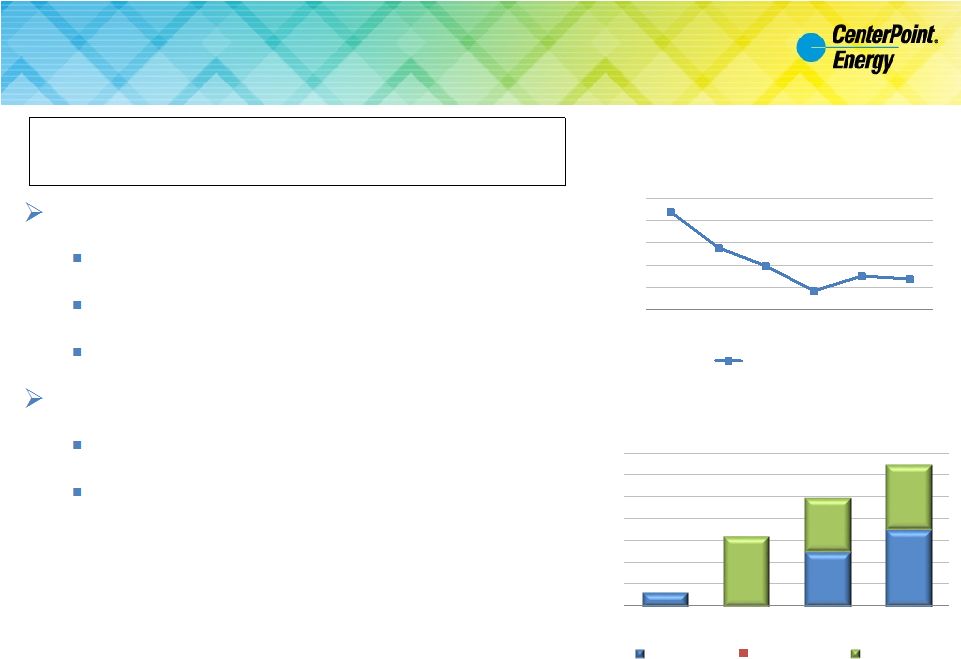
2015 $200 million matured in June 2015 $69 million maturity in October 2015 Anticipate ~ $400 million financing needs 2016 $325 million maturity in May 2016 Anticipate financing needs similar to 2015; dependent on such factors as bonus depreciation, capital investment plans and working capital 1 Excludes transition and system restoration bonds 2 If appropriate, we may consider equity financing through the limited use of our DRIP and benefits plans. In 2014, if CenterPoint had issued new shares rather than purchased shares for the Dividend Reinvestment and Savings
Benefit plans, share dilution would have averaged about 1%. The maximum
number of shares that could be issued under these plans in future
years depends upon participation in the plans Financing
Plan Utilize Debt Capacity and Limited Equity Issuance
2 20 $0 $100 $200 $300 $400 $500 $600 $700 2015 2016 2017 2018 Long-term Debt Maturities ($MM) 1 CNP CEHE CERC 50.0% 54.0% 58.0% 62.0% 66.0% 70.0% 2010 2011 2012 2013 2014 2015 Debt/Capital CNP has substantially reduced leverage over the last five years YTD 1 Expect to source majority of financing needs through commercial paper borrowings and fixed rate debt |
 2 Appendix |
 investors.centerpointenergy.com
22 Reconciliation: Net Income and diluted EPS to the Basis Used in Providing Annual Earnings Guidance Note: For information on non-GAAP measures, please refer to slide 2
Quarter Ended
Quarter Ended
June 30, 2015
June 30, 2014
Net Income (in millions) EPS Net Income (in millions) EPS Consolidated as reported 77 $
0.18 $
107 $
0.25 $
Midstream Investments
(27) (0.06) (44) (0.11) Utility Operations (1) 50 0.12 $
63 0.14 $
Timing effects impacting CES
(2) : Mark-to-market (gain) losses (2) (0.01) (4) (0.01) $
ZENS-related mark-to-market (gains) losses:
Marketable securities
(3) (51) (0.12) (47) (0.11) $
Indexed debt securities
(4) 60 0.14 32 0.08 $
Utility operations earnings on an adjusted guidance basis
57 $
0.13 $
44 $
0.10 $
Per the basis used in providing earnings guidance:
Utility Operations on a guidance basis
57 $
0.13 $
44 $
0.10 $
Midstream Investments
27 0.06 44 0.11 Consolidated on guidance basis 84 $
0.19 $
88 $
0.21 $
(1) CenterPoint earnings excluding Midstream Investments (2) Energy Services segment (3) Time Warner Inc., Time Warner Cable Inc., Time Inc. and AOL Inc. (4) 2015 Includes amount associated with Verizon tender offer for AOL, Inc common stock |
 investors.centerpointenergy.com
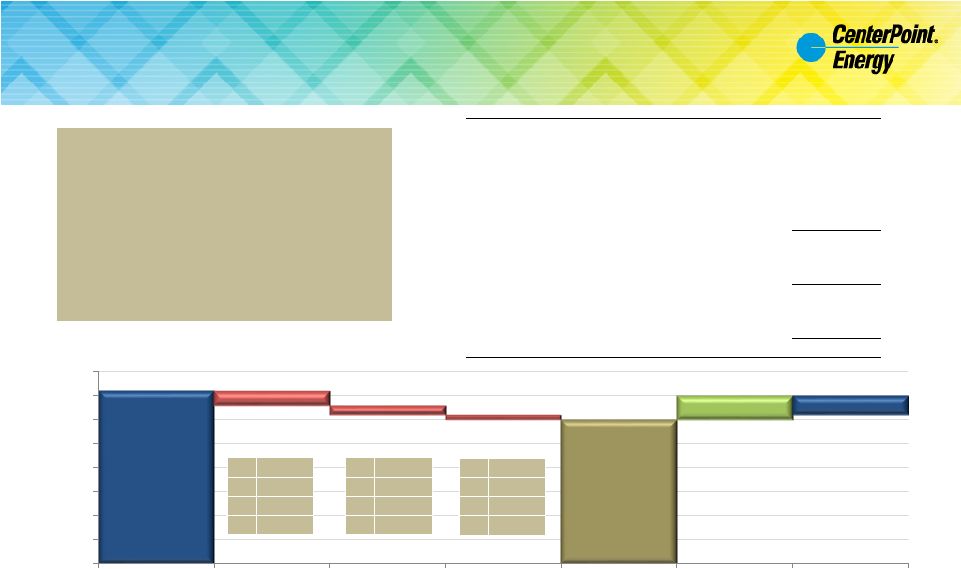
2014 EPS Reconciliation to 2015 Utility Operations
Guidance Range of $0.71 to $0.75 per diluted share
23 2014 Fully Diluted EPS $ 1.42 On an adjusted guidance basis: ZENS-related mark to market gains (0.12) CES MTM gain (0.04) Pension Curtailment loss 0.01 2014 Consolidated EPS on a guidance basis $ 1.27 Deferred Tax Benefit (0.07) 2014 Fully Adjusted EPS $ 1.20 Midstream Investments (0.44) 2014 Fully Adjusted Utility Operations EPS $ 0.76 (1) The Equity Amortization schedule on page 19 of the supplemental materials posted on February 26, 2015 details the decrease between the
2014 actual and 2015 projected equity returns
(2)
Information about the 2008 Energy Efficiency Cost Recovery Factor Appeals is
provided in the 2014 10-K Note: Please refer to slide 2
for information on non-GAAP measures 1
2 $0.76 $0.70 $0.71 - $0.75 ($0.03) ($0.02) ($0.01) $0.01 to $0.05 $0.40 $0.45 $0.50 $0.55 $0.60 $0.65 $0.70 $0.75 $0.80 2014 Fully Adjusted Utility Operations EPS Equity Return related to True-up Weather Energy Efficiency Remand Bonus 2014 Utility Operations Baseline Growth and Other Variables 2015 Utility Operations EPS Guidance Range $0.71 to $0.75 Q1 ($0.01) Q2 ($0.01) Q3 ($0.01) Q4 - Q1 ($0.05) Q2 $0.01 Q3 $0.01 Q4 $0.01 Q1 Q2 Q3 ($0.01) Q4 For 2014, normalized $0.76 of fully adjusted earnings to a baseline of $0.70. In comparing to Q2 of 2014, “baseline” was equal to guidance. Adjustments for each quarter can be seen in the tan boxes below. |