Attached files
| file | filename |
|---|---|
| 8-K - AMERICAN PUBLIC EDUCATION, INC. 8-K - AMERICAN PUBLIC EDUCATION INC | a51160099.htm |
| EX-99.3 - EXHIBIT 99.3 - AMERICAN PUBLIC EDUCATION INC | a51160099-ex993.htm |
| EX-99.1 - EXHIBIT 99.1 - AMERICAN PUBLIC EDUCATION INC | a51160099-ex991.htm |
Exhibit 99.2

August 10, 2015 Recent Results and Developments Second Quarter 2015
Statements made in this presentation regarding American Public Education, Inc. or its subsidiaries, that are not historical facts are forward-looking statements based on current expectations, assumptions, estimates and projections about American Public Education and the industry. These forward-looking statements are subject to risks and uncertainties that could cause actual future events or results to differ materially from such statements. Forward-looking statements can be identified by words such as “anticipate", “believe”, “seek”, “could”, “estimate”, “expect”, “intend”, “may”, “plan”, “should”, “will” and “would”. These forward-looking statements include, without limitation, statements regarding expected growth, expected registration and enrollments, expected revenues, expected earnings. Actual results could differ materially from those expressed or implied by these forward-looking statements as a result of various factors, including the various risks described in the “Risk Factors” section and elsewhere in the Company’s Annual Report on Form 10-K for the year ended December 31, 2014, Quarterly Report on Form 10-Q for the period ended June 30, 2015 and in the Company’s other filings with the SEC. The Company undertakes no obligation to update publicly any forward-looking statements for any reason, even if new information becomes available or other events occur in the future. 2 Advancing the Learning Experience | Exploring New Opportunities SAFE HARBOR STATEMENT
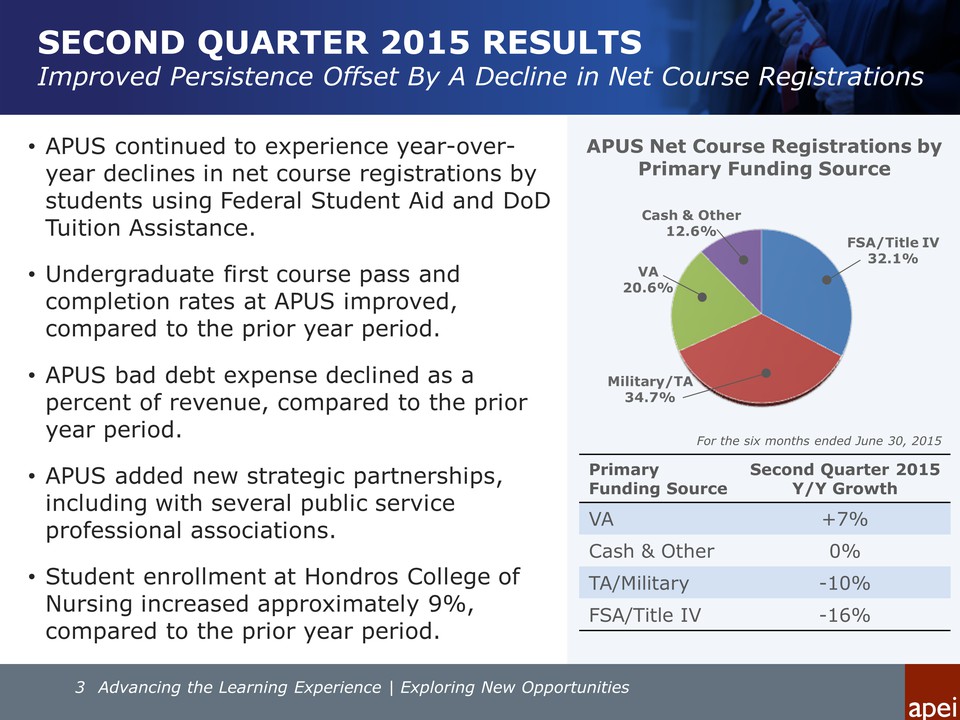
American Public Education, Inc. SECOND QUARTER 2015 RESULTS Improved Persistence Offset By A Decline in Net Course Registrations • APUS continued to experience year-overyear declines in net course registrations by students using Federal Student Aid and DoD Tuition Assistance. • Undergraduate first course pass and completion rates at APUS improved, compared to the prior year period. • APUS bad debt expense declined as a percent of revenue, compared to the prior year period. • APUS added new strategic partnerships, including with several public service professional associations. • Student enrollment at Hondros College of Nursing increased approximately 9%, compared to the prior year period. Primary Funding Source Second Quarter 2015 Y/Y Growth VA +7% Cash & Other 0% TA/Military -10% FSA/Title IV -16% For the six months ended June 30, 2015 APUS Net Course Registrations by Primary Funding Source Cash & Other 12.6% FSA/Title IV 32.1% Military/TA 34.7% VA 20.6% 3 Advancing the Learning Experience | Exploring New Opportunities
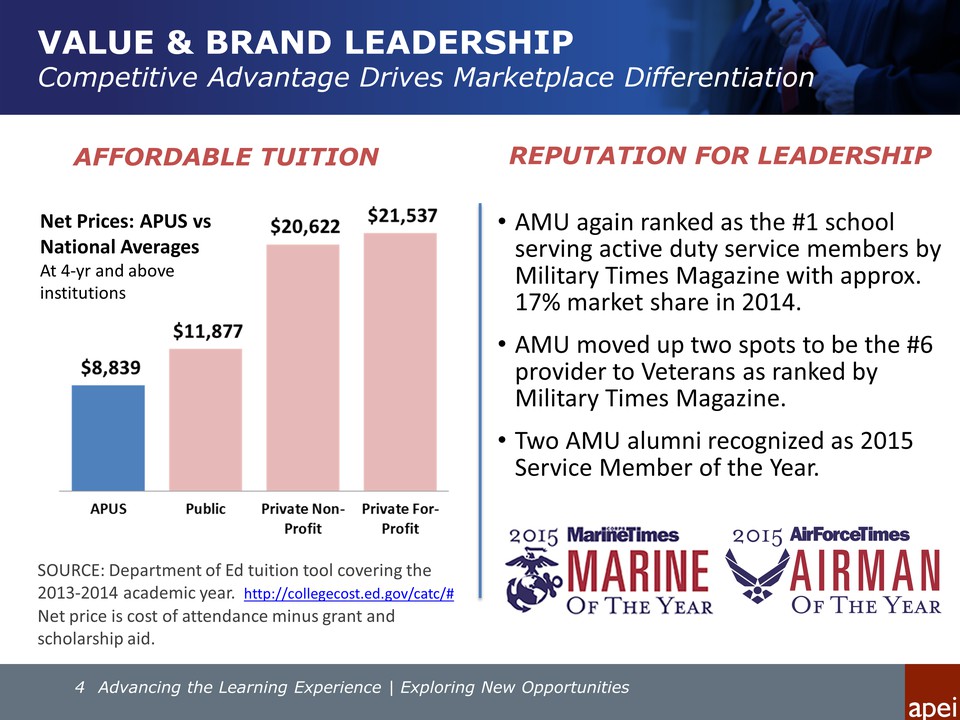
VALUE & BRAND LEADERSHIP Competitive Advantage Drives Marketplace Differentiation REPUTATION FOR LEADERSHIP 4 Advancing the Learning Experience | Exploring New Opportunities • AMU again ranked as the #1 school serving active duty service members by Military Times Magazine with approx. 17% market share in 2014. • AMU moved up two spots to be the #6 provider to Veterans as ranked by Military Times Magazine. • Two AMU alumni recognized as 2015 Service Member of the Year. AFFORDABLE TUITION SOURCE: Department of Ed tuition tool covering the 2013‐2014 academic year. http://collegecost.ed.gov/catc/# Net Prices: APUS vs National Averages At 4‐yr and above institutions Net price is cost of attendance minus grant and scholarship aid.
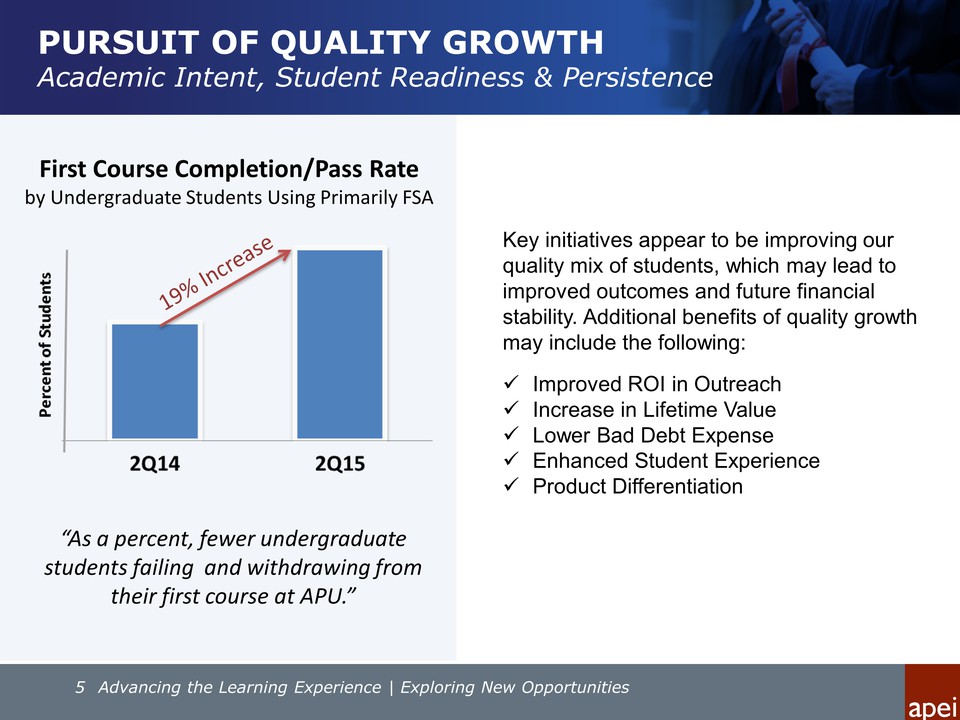
PURSUIT OF QUALITY GROWTH Academic Intent, Student Readiness & Persistence 5 Advancing the Learning Experience | Exploring New Opportunities Key initiatives appear to be improving our quality mix of students, which may lead to improved outcomes and future financial stability. Additional benefits of quality growth may include the following: Improved ROI in Outreach Increase in Lifetime Value Lower Bad Debt Expense Enhanced Student Experience Product Differentiation “As a percent, fewer undergraduate students failing and withdrawing from their first course at APU.” First Course Completion/Pass Rate by Undergraduate Students Using Primarily FSA
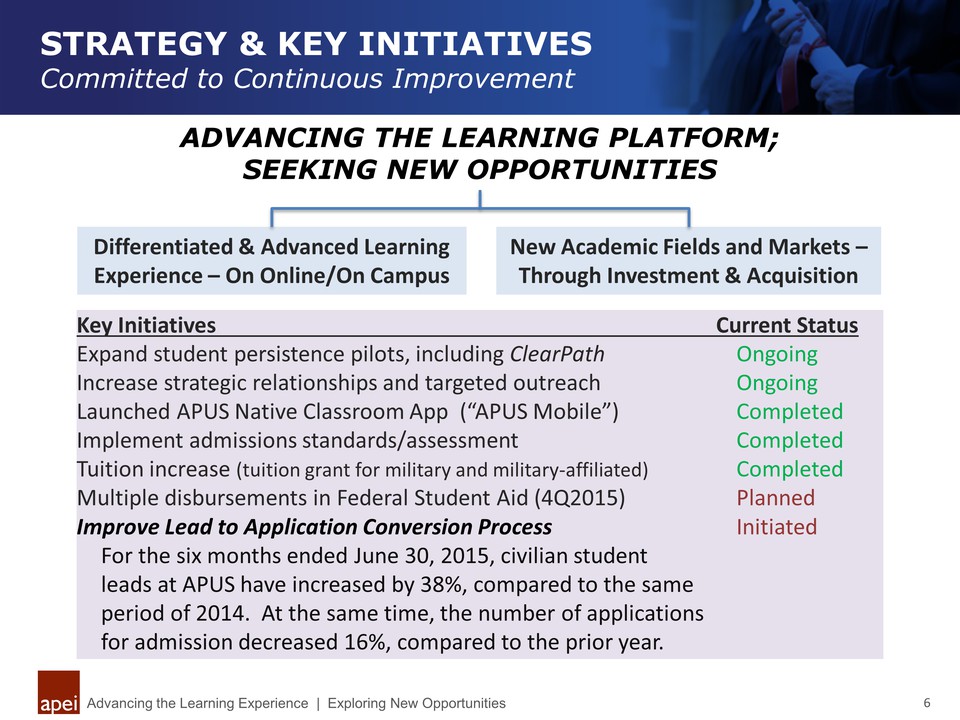
STRATEGY & KEY INITIATIVES Committed to Continuous Improvement Advancing the Learning Experience | Exploring New Opportunities 6 ADVANCING THE LEARNING PLATFORM; SEEKING NEW OPPORTUNITIES Key Initiatives Current Status Expand student persistence pilots, including ClearPath Ongoing Increase strategic relationships and targeted outreach Ongoing Launched APUS Native Classroom App (“APUS Mobile”) Completed Implement admissions standards/assessment Completed Tuition increase (tuition grant for military and military‐affiliated) Completed Multiple disbursements in Federal Student Aid (4Q2015) Planned Improve Lead to Application Conversion Process Initiated For the six months ended June 30, 2015, civilian student leads at APUS have increased by 38%, compared to the same period of 2014. At the same time, the number of applications for admission decreased 16%, compared to the prior year. Differentiated & Advanced Learning Experience – On Online/On Campus New Academic Fields and Markets – Through Investment & Acquisition
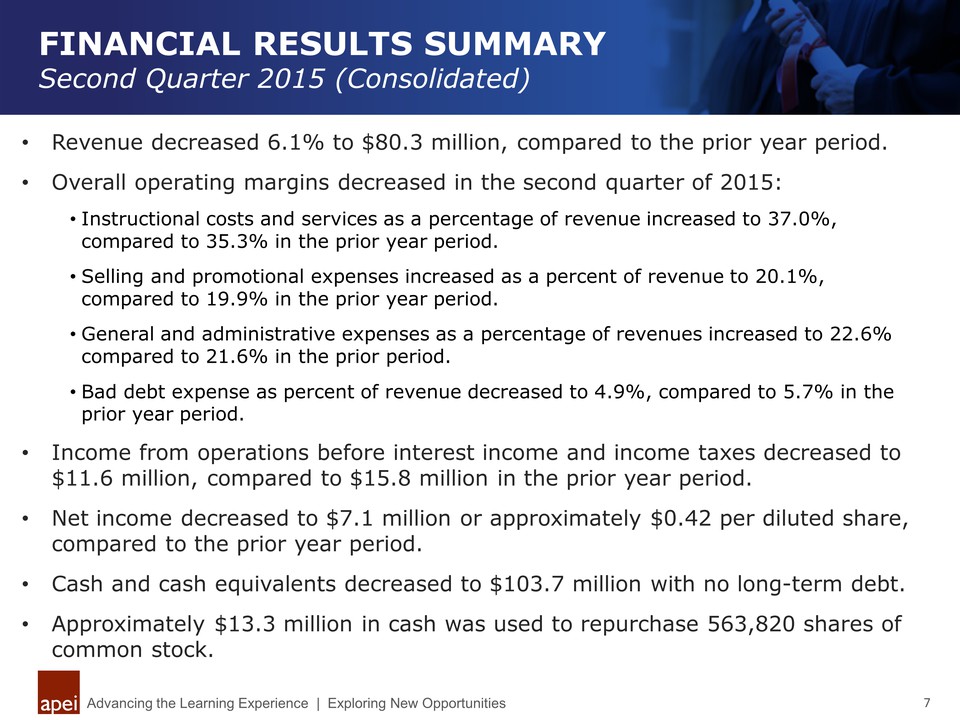
FINANCIAL RESULTS SUMMARY Second Quarter 2015 (Consolidated) Advancing the Learning Experience | Exploring New Opportunities 7 • Revenue decreased 6.1% to $80.3 million, compared to the prior year period. • Overall operating margins decreased in the second quarter of 2015: • Instructional costs and services as a percentage of revenue increased to 37.0%, compared to 35.3% in the prior year period. • Selling and promotional expenses increased as a percent of revenue to 20.1%, compared to 19.9% in the prior year period. • General and administrative expenses as a percentage of revenues increased to 22.6% compared to 21.6% in the prior period. • Bad debt expense as percent of revenue decreased to 4.9%, compared to 5.7% in the prior year period. • Income from operations before interest income and income taxes decreased to $11.6 million, compared to $15.8 million in the prior year period. • Net income decreased to $7.1 million or approximately $0.42 per diluted share, compared to the prior year period. • Cash and cash equivalents decreased to $103.7 million with no long-term debt. • Approximately $13.3 million in cash was used to repurchase 563,820 shares of common stock.
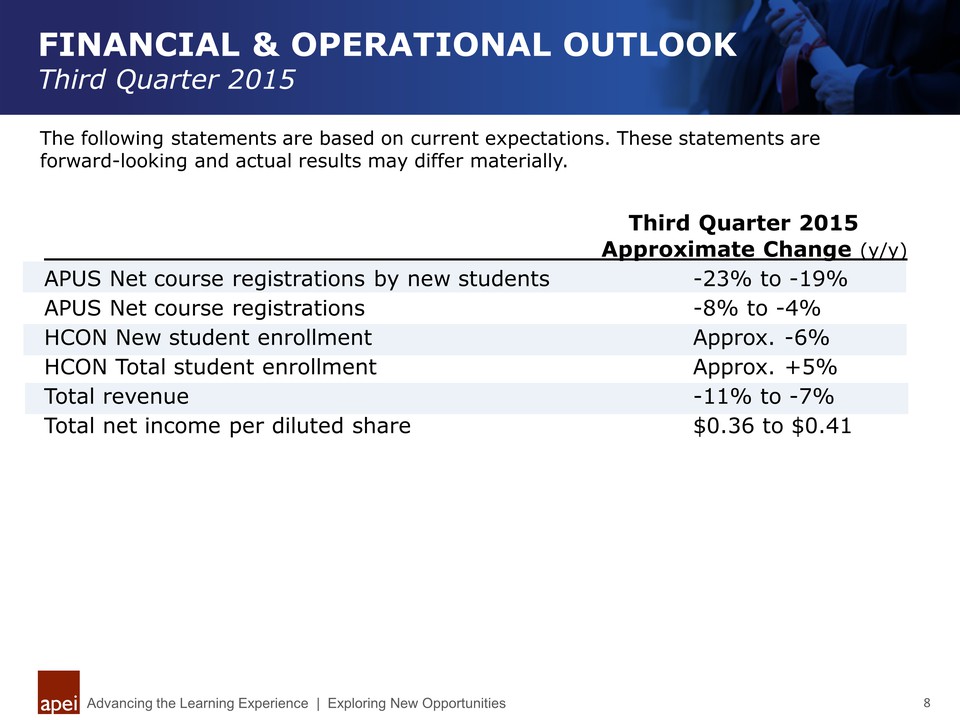
FINANCIAL & OPERATIONAL OUTLOOK Third Quarter 2015 Advancing the Learning Experience | Exploring New Opportunities 8 The following statements are based on current expectations. These statements are forward-looking and actual results may differ materially. Approximate Change (y/y) APUS Net course registrations by new students -23% to -19% APUS Net course registrations -8% to -4% HCON New student enrollment Approx. -6% HCON Total student enrollment Approx. +5% Total revenue -11% to -7% Total net income per diluted share $0.36 to $0.41 Third Quarter 2015

Second Quarter 2015 Financial Results Conference Call August 10, 2015
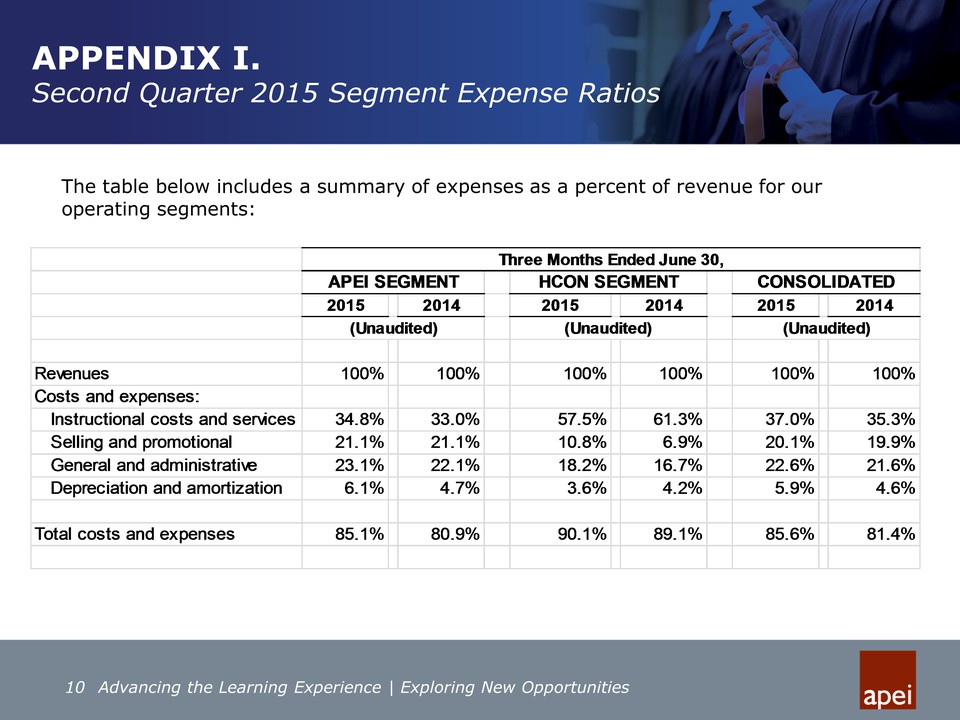
10 Advancing the Learning Experience | Exploring New Opportunities The table below includes a summary of expenses as a percent of revenue for our operating segments: 2015 2014 2015 2014 2015 2014 Revenues 100% 100% 100% 100% 100% 100% Costs and expenses: Instructional costs and services 34.8% 33.0% 57.5% 61.3% 37.0% 35.3% Selling and promotional 21.1% 21.1% 10.8% 6.9% 20.1% 19.9% General and administrative 23.1% 22.1% 18.2% 16.7% 22.6% 21.6% Depreciation and amortization 6.1% 4.7% 3.6% 4.2% 5.9% 4.6% Total costs and expenses 85.1% 80.9% 90.1% 89.1% 85.6% 81.4% HCON SEGMENT (Unaudited) CONSOLIDATED Three Months Ended June 30, APEI SEGMENT (Unaudited) (Unaudited) APPENDIX I. Second Quarter 2015 Segment Expense Ratios