Attached files
| file | filename |
|---|---|
| EX-21 - EX-21 - TEAM INC | d933365dex21.htm |
| EX-32.2 - EX-32.2 - TEAM INC | d933365dex322.htm |
| EX-31.1 - EX-31.1 - TEAM INC | d933365dex311.htm |
| EX-31.2 - EX-31.2 - TEAM INC | d933365dex312.htm |
| EX-23.1 - EX-23.1 - TEAM INC | d933365dex231.htm |
| EX-32.1 - EX-32.1 - TEAM INC | d933365dex321.htm |
Table of Contents
UNITED STATES
SECURITIES AND EXCHANGE COMMISSION
Washington, D.C. 20549
FORM 10-K
| þ | ANNUAL REPORT PURSUANT TO SECTION 13 OR 15(d) OF THE SECURITIES EXCHANGE ACT OF 1934 |
For the fiscal year ended May 31, 2015
OR
| ¨ | TRANSITION REPORT PURSUANT TO SECTION 13 OR 15(d) OF THE SECURITIES EXCHANGE ACT OF 1934 |
For the transition period from to
Commission File Number 001-08604

TEAM, INC.
(Exact Name of Registrant as Specified in Its Charter)
| Delaware | 74-1765729 | |
| (State or Other Jurisdiction of Incorporation or Organization) |
(I.R.S. Employer Identification No.) | |
| 13131 Dairy Ashford, Suite 600, Sugar Land, Texas | 77478 | |
| (Address of Principal Executive Offices) | (Zip Code) | |
(281) 331-6154
(Registrant’s Telephone Number, Including Area Code)
Securities registered pursuant to Section 12(b) of the Act:
| Title of Each Class |
Name of Each Exchange on Which Registered | |
| Common Stock, $0.30 par value | New York Stock Exchange |
Securities registered pursuant to Section 12(g) of the Act: None
Indicate by check mark if the registrant is a well-known seasoned issuer, as defined in Rule 405 of the Securities Act. Yes ¨ No þ
Indicate by check mark if the registrant is not required to file reports pursuant to Section 13 or Section 15(d) of the Act. Yes ¨ No þ
Indicate by check mark whether the registrant (1) has filed all reports required to be filed by Section 13 or 15(d) of the Securities Exchange Act of 1934 during the preceding 12 months (or for such shorter period that the registrant was required to file such reports), and (2) has been subject to such filing requirements for the past 90 days. Yes þ No ¨
Indicate by check mark whether the registrant has submitted electronically and posted on its corporate website, if any, every Interactive Data File required to be submitted and posted pursuant to Rule 405 of Regulation S-T (§232.405 of this chapter) during the preceding 12 months (or for such shorter period that the registrant was required to submit and post such files). Yes þ No ¨
Indicate by check mark if disclosure of delinquent filers pursuant to Item 405 of Regulation S-K (§229.405 of this chapter) is not contained herein, and will not be contained, to the best of registrant’s knowledge, in definitive proxy or information statements incorporated by reference in Part III of this Form 10-K or any amendment to this Form 10-K. þ
Indicate by check mark whether the registrant is a large accelerated filer, an accelerated filer, a non-accelerated filer or a smaller reporting company. See definition of “accelerated filer and large accelerated filer” in Rule 12b-2 of the Exchange Act. (Check one):
| Large accelerated filer | ¨ | Accelerated filer | þ | |||
| Non-accelerated filer | ¨ (Do not check if a smaller reporting company) | Smaller reporting company | ¨ |
Indicate by check mark whether the registrant is a shell company (as defined in Rule 12b-2 of the Act). Yes ¨ No þ
The aggregate market value of the voting stock held by non-affiliates on November 30, 2014 was approximately $522 million, determined using the closing price of shares of common stock on the New York Stock Exchange on that date of $40.61.
For purposes for the foregoing calculation only, all directors, executive officers, the Team, Inc. Salary Deferral Plan and Trust and known 5% or greater beneficial owners have been deemed affiliates.
The Registrant had 20,910,719 shares of common stock, par value $0.30, outstanding and 546,977 shares of treasury stock as of July 29, 2015.
Documents Incorporated by Reference
Portions of our Definitive Proxy Statement for the 2015 Annual Meeting of Stockholders are incorporated by reference into Part III of this report. These will be filed no later than September 28, 2015.
Table of Contents
Table of Contents
Certain items required in Part III of this Form 10-K can be found in our 2015 Proxy Statement and are incorporated herein by reference. A copy of the 2015 Proxy Statement will be provided, without charge, to any person who receives a copy of this Form 10-K and submits a written request to Team, Inc., Attn: Corporate Secretary, 13131 Dairy Ashford, Suite 600, Sugar Land, Texas, 77478.
| ITEM 1. | BUSINESS |
Introduction. Unless otherwise indicated, the terms “Team, Inc.,” “Team,” “the Company,” “we,” “our” and “us” are used in this report to refer to Team, Inc., to one or more of our consolidated subsidiaries or to all of them taken as a whole. We are incorporated in the State of Delaware and our company website can be found at www.teamindustrialservices.com. Our corporate headquarters is located at 13131 Dairy Ashford, Suite 600, Sugar Land, Texas, 77478 and our telephone number is (281) 331-6154. Our stock is traded on the New York Stock Exchange (“NYSE”) under the symbol “TISI” and our fiscal year ends on May 31 of each calendar year.
We are a leading provider of specialty industrial services, including inspection and assessment, required in maintaining high temperature and high pressure piping systems and vessels that are utilized extensively in the refining, petrochemical, power, pipeline and other heavy industries. We conduct operations in three segments: Inspection and Heat Treating Services (“IHT”) Group, Mechanical Services (“MS”) Group and Quest Integrity (“Quest Integrity”) Group. While our services are aligned in three business groups, we believe our services broadly fall into three different classifications that have unique customer demand drivers: inspection and assessment services, turnaround services, and on-stream services.
Inspection and assessment services are offered in both IHT and Quest Integrity. IHT provides basic and advanced non-destructive testing services for the process, pipeline and power sectors, pipeline integrity management services, as well as associated engineering and assessment services. These services can be offered while facilities are running (on-stream), during facility turnarounds or during new construction or expansion activities. Quest Integrity provides integrity and reliability management solutions for the process, pipeline and power sectors. These solutions encompass two broadly-defined disciplines: (1) highly specialized in-line inspection services for unpiggable process piping and pipelines using proprietary in-line inspection tools and analytical software; and (2) advanced condition assessment services through a multi-disciplined engineering team. We believe there is a general growth in market demand for inspection and assessment services as improved inspection technologies enable better information about asset reliability to be available to facility owners and operators.
Turnaround services are offered in both IHT and MS. These services are project-related and demand is a function of the number and scope of scheduled and unscheduled facility turnarounds as well as new industrial facility construction or expansion. Turnaround services include the field machining, technical bolting, field valve repair, heat exchanger repair, and isolation test plugging services that are part of MS and the field heat treating services that are part of IHT.
On-stream services are offered by MS and represent the services offered while plants are operating and under pressure. These services include leak repair, fugitive emissions control and hot tapping. We believe demand for on-stream services is a function of the population of the existing infrastructure of operating industrial facilities.
We offer these services in over 150 locations throughout the world. Our industrial services are available 24 hours a day, 7 days a week, 365 days a year. We market our services to companies in a diverse array of heavy industries which include the petrochemical, refining, power, pipeline, steel, pulp and paper industries, as well as municipalities, shipbuilding, original equipment manufacturers (“OEMs”), distributors, and some of the world’s largest engineering and construction firms. Our services are also provided across a broad geographic reach.
1
Table of Contents
Narrative Description of Business
IHT Group:
IHT offers both inspection services and heat treating services which are generally associated with turnaround or project activities. A description of these services is as follows:
Non-Destructive Evaluation and Testing Services. Machined parts and industrial structures can be complex systems that experience extreme loads and fatigue during their lifetime. Our Non-Destructive Evaluation (“NDE”), or Non-Destructive Testing (“NDT”), enables the inspection of these components without permanently altering the equipment. It is a highly valuable technique that is often used to validate the integrity of materials, detect instabilities, discover performance outside of tolerances, identify failed components, or highlight an inadequate control system. Inspection services frequently require industry recognized training and certification processes. We maintain training and certification programs, which are designed to meet or exceed industry standards. As assets continue to age and compliance regulations advance, inspection techniques are playing a critical role in fit-for-life service assessments.
Radiographic Testing. Radiographic Testing (“RT”) is used to detect discontinuities in ferrous and nonferrous castings, welds or forgings using X-ray or gamma ray radiation. RT reveals both external and internal defects, internal assembly details and changes in thickness. Our licensed technicians utilize conventional, computed and real-time radiography testing techniques depending upon the complexity and needs of our customers.
Ultrasonic Testing. Ultrasonic Testing (“UT”) uses high frequency ultrasonic waves to detect surface breaking and internal imperfections, measure material thickness and determine acceptance or rejection of a test object based on a reference code or standard. We offer ten different types of UT methods, including traditional scans as well as automated and high speed ultrasonic Electro Magnet Acoustic Transducer (“EMAT”) testing. Each method is utilized to meet a specific material or process application requirement.
Magnetic Particle Inspection. Magnetic Particle Inspection is a NDT process for detecting surface and slightly subsurface discontinuities in ferroelectric materials such as iron, nickel, cobalt, and some of their alloys. The process puts a magnetic field into the test object. When the part is magnetized, flaws perpendicular to the magnetic field direction cause flux leakage. If a lapse or a crack is present the magnetic particles will be attracted to the flawed area, providing our technician with what is called an indication. Our technician will then evaluate the indication to assess the location, size, shape and extent of these imperfections.
Liquid Penetrant Inspection. Liquid Penetrant Inspection is one of the most widely used NDE/ NDT methods. Its popularity can be attributed to two main factors: its relative ease of use and its flexibility. Liquid Penetrant Inspection can be used to inspect almost any material. At Team, we utilize Liquid Penetrant Inspection to detect surface discontinuities in both ferromagnetic and non-ferromagnetic materials. In castings and forgings, there may be cracks or leaks in new products or fatigue cracks in in-service components.
Positive Material Identification. Positive Material Identification (“PMI”) quickly and accurately identifies the composition of more than 100 different engineering alloys onsite. Team can perform PMI on virtually any size or shape of pipe, plate, weld, welding materials, machined parts or castings.
Electromagnetic Testing. Electromagnetic Testing applies to a family of test methods that use magnetism and electricity to detect or measure cracks, flaws, corrosion or heat damage in conductive materials. Magnetic properties and geometric analysis are used to determine the best technique to identify defects. Our electromagnetic services enable our technicians to evaluate small cracks, pits, dents and general thinning in tubing with small diameters, large steel surfaces such as storage tank floors, and everything in between.
Alternating Current Field Measurement. Originally developed for inspection of fatigue cracking, our Alternating Current Field Measurement (“ACFM”) is an advanced technique for detecting surface cracks and pinpointing the location, length and depth of the defect. Our ACFM works through paint and coatings and in a wide range of temperatures. Results are automatically recorded and accepted by certification authorities.
2
Table of Contents
Eddy Current Testing. Eddy Current Testing (“ET”) is ideal for nonferrous materials such as heat exchanger tubes, condensers, boilers, tubing and aircraft surfaces. Team’s ET uses electromagnetic induction to detect flaws in conductive materials, displaying the presence of very small cracks, pits, dents and general thinning.
Long-Range Guided Ultrasonics. Guided wave inspection is a method of ultrasonic testing that enables the detection and location of pipe defects above and below ground without disruption of service. This technique only requires a small area of excavation to perform the testing where applicable. Guided ultrasonics sends a bilateral signal over hundreds of feet allowing long ranges of piping to be inspected at one time.
Phased Array Ultrasonic Testing. Phased Array Ultrasonics (“PAUT”) provides sharper detection capability for off-angle cracks and is capable of displaying multiple presentations simultaneously. PAUT applies computer-controlled excitation to individual elements in a multi-element probe. By varying the timing of the excitation, the sound beam can be swept through a range of angles. The shape of the beam may also be modified to a specific focal distance or spot.
Tank Inspection and Management Programs. Our wholly-owned subsidiary, TCI Services Inc. (“TCI”), is a storage tank management company that performs inspections, engineering and repair services across the U.S. for above ground storage tanks. Backed by Team’s in-house engineering, documentation and certification services – including API 653 evaluations – TCI’s on-site tank inspections, repair and maintenance services help keep customers’ tanks fully operational and compliant with stringent industry standards.
Rope Access. In July 2013, Team acquired a leading provider of industrial rope access services. With these services, we provide a range of innovative and cost-effective solutions to suit the customer’s individual requirements for inspection and maintenance services to the energy and industrial markets. Our rope access solutions allow for work to be carried out more quickly than traditional methods using scaffolding, keeping costs and job duration to a minimum. We provide these services under full accreditation by the Industrial Rope Access Trade Association (“IRATA”), whose guidelines are recognized by the industry as the safest method of working at height.
Mechanical Integrity Services. Maintaining the integrity of equipment is more than simply performing inspections. A well-implemented Mechanical Integrity (“MI”) program involves multiple components that improve the safety and reliability of a facility’s equipment. Our MI programs ensure the continued integrity and fitness for service of piping systems, pressure vessels, tanks and related components. Our mechanical integrity engineers are well versed in pertinent codes and standards of the Occupational Safety and Health Administration’s process safety management (“PSM”) and U.S. Environmental Protection Agency’s (“EPA”) risk management program (“RMP”) regulations.
Field Heat Treating Services. Field Heat Treating Services include electric resistance and gas-fired combustion, primarily utilized by industrial customers to enhance the metallurgical properties of their process piping and equipment. Electric resistance heating is the transfer of high energy power sources through attached heaters to the plant component to preheat weld joints, to remove contaminants and moisture prior to welding, post-weld heat treatments and to relieve metal thermal stresses induced by the welding process. Specialty heat treating processes are performed using gas-fired combustion on large pressure vessels for stress relieving to bake specialty paint coatings and controlled drying of abrasion and temperature resistant refractories. Special high frequency heating, commonly called induction heating, is used for expanding metal parts for assembly or disassembly, expanding large bolting for industrial turbines and stress relieving projects which is cost prohibitive for electric resistance or gas-fired combustion.
MS Group:
MS offers both on-stream services and turnaround/project related services as follows:
Leak Repair Services. Our leak repair services consist of on-stream repairs of leaks in pipes, valves, flanges and other parts of piping systems and related equipment. Our on-stream repairs utilize composite repair, drill and
3
Table of Contents
tap repair, and both standard and custom-designed clamps and enclosures for piping systems. We use specially developed techniques, sealants and equipment for repairs. Many of our repairs are furnished as interim measures which allow plant systems to continue operating until more permanent repairs can be made during plant shut downs. Our leak repair services involve inspection of the leak by our field crew who records pertinent information about the faulty part of the system and transmits the information to our engineering department for determination of appropriate repair techniques. Repair materials such as clamps and enclosures are custom designed and manufactured at our ISO-9001 certified manufacturing centers and delivered to the job site. We maintain an inventory of raw materials and semi-finished clamps and enclosures to reduce the time required to manufacture the finished product.
Fugitive Emissions Control Services. We provide fugitive volatile organic compound (“VOC”) emission leak detection services that include identification, monitoring, data management and reporting primarily for the chemical, refining and natural gas processing industries. These services are designed to monitor and record VOC emissions from specific process equipment and piping components as required by environmental regulations and customer requests, typically assisting the customer in enhancing an ongoing maintenance program and/or complying with present and/or future environmental regulations. We provide specialty trained technicians in the use of portable organic chemical analyzers and data loggers to measure potential leaks at designated plant components maintained in customer or our proprietary databases. The measured data is used to prepare standard reports in compliance with the EPA and local regulatory requirements. We also provide enhanced custom-designed reports to customer specifications.
Hot Tapping Services. Our hot tapping services consist of providing a full range of hot tapping, Line-stop™ and Freeze-stop™ services with capabilities for up to 48” diameter pipelines. Hot tapping services involve utilizing special equipment to cut a hole in a pressurized pipeline so that a new branch pipe can be connected onto the existing pipeline without interrupting operations. Line-stop™ services permit the line to be depressurized downstream so that maintenance work can be performed on the piping system. We typically perform these services by mechanically cutting into the pipeline similar to a hot tap and installing a special plugging device to stop the process flow. The Hi-stop™ is a proprietary procedure that allows stopping of the process flow in extreme pressures and temperatures. In some cases, we may use a line freezing procedure by injecting liquid nitrogen into installed special external chambers around the pipe to stop the process flow. Inflatable bag stops are used when a pipe is out of round or inside surface conditions of the pipe prevent a standard line stop. It can also be used to back up a line stop. A small hot tap is made into a pipe and an inflatable pipe plug is inserted into the pipe to allow the plug to stop the flow in the pipe. Additionally, we provide innovative line stop applications for unique service applications to meet customers’ needs.
Field Machining Services and Technical Bolting Services. We use portable machining equipment to repair or modify machinery, equipment, vessels and piping systems not easily removed from a permanent location. As opposed to conventional machining processes where the work piece rotates and the cutting tool is fixed, in field machining, the work piece remains fixed in position and the cutting tool rotates. Other common descriptions for this service are on-site or in-place machining. Field machining services include flange facing, pipe cutting, line boring, journal turning, drilling and milling. We provide customers technical bolting as a complementary service to field machining during plant shut downs or maintenance activities. These services involve the use of hydraulic or pneumatic equipment with industry standard bolt tightening techniques to achieve reliable and leak-free connections following plant maintenance or expansion projects. Additional services include bolt disassembly and hot bolting, which is a technique to remove and replace a bolt while in service and hot.
Valve Repair Services. We perform on-site repairs to manual and control valves and pressure and safety relief valves as well as specialty valve actuator diagnostics and repair. We are certified and authorized to perform testing and repairs to pressure and safety relief valves by The National Board of Boiler and Pressure Vessel Inspectors. This certification requires specific procedures, testing and documentation to maintain the safe operation of these essential plant valves. We provide special transportable trailers to the plant site which contain specialty machines to manufacture valve components without removing the valve from the piping system. In addition, we provide preventive maintenance programs for VOC specific valves and valve data management programs.
4
Table of Contents
Heat Exchanger and Maintenance Services. We provide turnkey heat exchanger services that allow for blind to blind disassembly and re-assembly. Utilizing our expanding fleet of bundle extractors that allow us to pull and push the tube bundles, as well as field machining and bolting equipment, we can make complete repairs to minimize downtime by using one contractor. A complete service allows us to unbolt the exchanger heads and remove the tube bundle for inspection and repair. Team is certified by The National Board of Boiler and Pressure Vessel Inspectors to make welded code repairs when necessary to the many components that make up the assembly. Based on the inspection, the bundle tubes can be replaced or plugged. Assembly of the exchanger is documented by our rigid quality control process providing documented procedures and final “as assembled” bolted values.
Isolation and Test Plug Services. We install isolation plugs to provide a mechanical block of flammable atmosphere to allow for pipe cutting and welding without having to purge the piping system. The plugs are mechanically expanded to seal on the inside pipe surface and provide a venting system to prevent pressure from building up in the piping system while the system is opened. Test plugs are used to verify the integrity of welded joints by providing sealing surfaces on both sides of the weld and pressuring the void cavity in between. The test plugs allow the customer to comply with American Society of Mechanical Engineers (“ASME”) hydrostatic test requirements for welded joints without having to pressurize the whole system which may result in shutdown of other systems or environmental issues with the test medium.
Valve Insertion Services. We offer professional installation services for our patented InsertValve™. The valve installs under pressure, eliminating the need for line shut downs in the event of planned or emergency valve cut-ins. Designed for a wide range of line sizes and types, the InsertValve™ wedge gate sits on the valve body, not the pipe bottom. This unique feature prevents the seat from coming into contact with the cut pipe edges to significantly extend valve life. If a repair is ever needed, it is the only valve on the market that can be repaired under pressure.
Project Services. Our Project Services capabilities are a full project management solution provided to turnaround, new construction, routine maintenance and specialty welding projects. This integrated service offering brings all of Team’s service capabilities to bear for the seamless planning, training and execution of these projects meeting the demands of the customer in a timely and safe manner.
Quest Integrity Group:
Quest Integrity offers integrity management solutions to the energy industry in the form of advanced quantitative inspection and engineering assessment services and products. Quest Integrity’s advanced quantitative inspection services utilize proprietary non-destructive testing and examination (NDT/NDE) instrumentation to provide technology-enabled in-line inspections of fired heaters, piping systems and steam reformers, primarily to the process, pipeline and power industries. Additionally, Quest Integrity offers engineering assessment services enabled by proprietary software and a variety of analytical models. Effective July 1, 2013, Quest Integrity became a stand-alone reportable segment of Team.
Quest Integrity’s major service offerings are described as follows:
Furnace Tube Inspection System. Furnace Tube Inspection System (“FTIS™”) in-line inspection service provides an untethered 360-degree 100% coverage ultrasonic inspection of the internal and external surfaces of serpentine coils of fired heaters, which are found in refineries. FTIS™ allows us to detect and quantify internal/external pipe/tube wall loss, deformation and fouling and thereby identify weak points in such heaters in order to provide customers with timely, actionable information to better manage their infrastructure.
InVista™. Our proprietary InVista™ in-line inspection service provides an untethered 360-degree 100% coverage ultrasonic inspection of the internal and external surfaces of pipelines that are considered “unpiggable” or too challenging to inspect by traditional inspection methods, due to a number of factors. InVista™ allows us to detect and quantify pipe/tube internal/external wall loss, deformation, pitting and fouling in such pipelines. Our InVista™ service also provides an integrated fitness-for-service report which forecasts remaining life of the pipeline and displays the information in a highly intuitive format, providing an integrated solution set for pipeline customers.
5
Table of Contents
Pipeline Integrity Management. We offer turn-key Pipeline Integrity Management (“PIM”) services, including project management, integrity engineering and integrity management development services, in-line inspection support, land surveying, and materials equipment selection and procurement. We offer these resources on an integrated basis with our InVista™ and HYDRA™ in-line inspection services and engineering assessment capabilities, or individually as applicable.
Engineering Assessment Services. Using proprietary software and a variety of analytical models, we offer a variety of advanced engineering assessment services to customers in the process, power, pipeline, and petrochemical industries including fitness-for-service, computational mechanics, failure analysis, pipeline analysis, risk-based asset management, and materials consulting.
In July 2015, we acquired the Qualspec Group (“Qualspec”) for total cash consideration of $255.0 million, which could be increased by $10.0 million depending upon the operating results of Qualspec through the end of calendar year 2015. Qualspec is a leading provider of NDT services in the United States, with significant operations in the West Coast, Gulf Coast and Mid-Western areas of the country. The acquisition is expected to add about $180.0 million of annual revenue to our operations and nearly 1,000 new employees to our human capital resources. The purchase of Qualspec was financed through borrowings under our new banking credit facility.
In June 2015, we purchased an advanced valve leader located in Long Beach, California, with a portfolio of projects from various sectors including oil and gas refining, pipelines and power generation for a total cash consideration of $10.3 million. The agreement also includes earn-out consideration based upon the achievement of certain performance targets over a three year period for an additional amount of up to $4.0 million.
In August 2014, we purchased a valve repair company in the U.K. for total consideration of $3.1 million, net of cash acquired of $0.2 million, including estimated contingent consideration of $0.3 million. Our purchase price allocation resulted in $2.1 million being allocated to fixed assets and net working capital and $1.0 million being applied to goodwill and intangible assets.
In July 2013, we purchased a leading provider of industrial rope access services, for total consideration of approximately $12.9 million including net working capital of $1.3 million and $11.6 million allocated to goodwill and intangible assets. We estimate $9.2 million of the goodwill recognized to be deductible for tax purposes. The purchase price allocation included contingent consideration valued at $1.9 million. The contingent consideration is based upon the achievement of operating earnings thresholds over a six year period for an amount of up to $4.0 million.
In September 2012, we purchased TCI, a leading provider of inspection and repair services of above ground storage tanks. The TCI acquisition included total consideration of approximately $23.2 million, including net working capital of $4.1 million, $2.6 million in fixed assets and $16.4 million allocated to goodwill and intangible assets. We expect $6.7 million of the goodwill recognized to be deductible for tax purposes. The purchase price included $5.0 million of deferred consideration and $1.9 million of contingent consideration which we revalued during the second quarter of fiscal year 2014, resulting in the recognition of a non-cash gain of $2.1 million.
In August 2012, we also purchased a specialty remote digital video inspection company in New Zealand for approximately $3.0 million in cash.
Our industrial services are marketed principally by personnel based at our service locations. We believe that these service locations are situated to facilitate timely responses to customer needs with on-call expertise, which is an important feature of selling and providing our services. Our array of integrated services also allows us to
6
Table of Contents
benefit from the procurement trends of many of our customers who are seeking reductions in the number of contractors and vendors in their facilities. No single customer accounted for 10% or more of consolidated revenues during any of the last three fiscal years.
Generally, customers are billed on a time and materials basis, although some work may be performed pursuant to a fixed-price bid. Services are usually performed pursuant to purchase orders issued under written customer agreements. While most purchase orders provide for the performance of a single job, some provide for services to be performed on a run and maintain basis. Substantially all our agreements and contracts may be terminated by either party on short notice. The agreements generally specify the range of services to be performed and the hourly rates for labor. While many contracts cover specific plants or locations, we also enter into multiple-site regional or national contracts which cover multiple plants or locations.
We experience some seasonal fluctuations. Historically, the refining industry has scheduled plant shutdowns (commonly referred to as “turnarounds”) for the fall and spring seasons. The timing of large turnarounds can significantly impact our revenues.
At May 31, 2015, we had approximately 4,800 employees in our worldwide operations. Our employees in the U.S. are predominantly not unionized. Most of our Canadian employees and certain employees outside of North America, primarily Europe, are unionized. There have been no employee work stoppages to date and we believe our relations with our employees and their representative organizations are good.
A significant portion of our business activities are subject to foreign, federal, state and local laws and regulations. These regulations are administered by various foreign, federal, state and local health and safety and environmental agencies and authorities, including the Occupational Safety and Health Administration of the U.S. Department of Labor and the EPA. Failure to comply with these laws and regulations may involve civil and criminal liability. From time to time, we are also subject to a wide range of reporting requirements, certifications and compliance as prescribed by various federal and state governmental agencies that include, but are not limited to, the EPA, the Nuclear Regulatory Commission, Chemical Safety Board, Department of Transportation and Federal Aviation Administration. Expenditures relating to such regulations are made in the normal course of our business and are neither material nor place us at any competitive disadvantage. We do not currently expect that compliance with such laws and regulations will require us to make material expenditures.
From time to time, during the operation of our environmental consulting and engineering services, the assets of which were sold in 1996, we handled small quantities of certain hazardous wastes or other substances generated by our customers. Under the Comprehensive Environmental Response, Compensation and Liability Act of 1980 (the “Superfund Act”), the EPA is authorized to take administrative and judicial action to either cause parties who are responsible under the Superfund Act for cleaning up any unauthorized release of hazardous substances to do so, or to clean up such hazardous substances and to seek reimbursement of the costs thereof from the responsible parties, who are jointly and severally liable for such costs under the Superfund Act. The EPA may also bring suit for treble damages from responsible parties who unreasonably refuse to voluntarily participate in such a clean-up or funding thereof. Responsible parties include anyone who owns or operates the facility where the release occurred (either currently and/or at the time such hazardous substances were disposed of), or who by contract arranges for disposal, treatment, transportation for disposal or treatment of a hazardous substance, or who accepts hazardous substances for transport to disposal or treatment facilities selected by such person from which there is a release. We believe that our risk of liability is minimized since our handling consisted solely of maintaining and storing small samples of materials for laboratory analysis that are classified as hazardous. Due to its prohibitive costs, we accordingly do not currently carry insurance to cover liabilities which we may incur under the Superfund Act or similar environmental statutes.
7
Table of Contents
We hold various patents, trademarks, trade secrets and licenses, which have not historically been material to our consolidated business operations. However, Quest Integrity has significant trade secrets and intellectual property pertaining to its in-line inspection tool technologies. This subsidiary was acquired in fiscal year 2011 and a significant amount of the purchase price was allocated to these intangible assets.
In general, competition stems from a large number of other outside service contractors. More than 100 different competitors are currently active in our markets. We believe we have a competitive advantage over most service contractors due to the quality, training and experience of our technicians, our nationwide and increasingly international service capability, our broad range of services, and our technical support and manufacturing capabilities supporting the service network. However, there are other competitors that may offer a similar range of coverage or services and include, but are not limited to, Acuren Group, Inc., Furmanite Corporation, Guardian Compliance, Mistras Group, Inc. and T.D. Williamson, Inc.
As a public company, we are required to file periodic reports with the Securities and Exchange Commission (the “SEC”) within established deadlines. Any document we file with the SEC may be viewed or copied at the SEC’s Public Reference Room at 100 F Street, N.E., Washington, D.C. 20549. Additional information regarding the Public Reference Room can be obtained by calling the SEC at (800) SEC-0330. Our SEC filings are also available to the public through the SEC’s website located at www.sec.gov. Our internet website address is www.teamindustrialservices.com. Information contained on our website is not part of this report on Form 10-K. Our annual reports on Form 10-K, quarterly reports on Form 10-Q, Proxy Statements and current reports on Form 8-K filed with (or furnished to) the SEC are available on our website, free of charge, as soon as reasonably practicable after we file or furnish such material. We also post our code of ethical conduct, our governance principles, our social responsibility policy and the charters of our Board of Directors’ (the “Board”) committees on our website. Our governance documents are available in print to any stockholder that submits a written request to Team, Inc., Attn: Corporate Secretary, 13131 Dairy Ashford, Suite 600, Sugar Land, Texas 77478.
| ITEM 1A. | RISK FACTORS |
Past financial performance is not necessarily a reliable indicator of future performance, and investors in our common stock should not use historical performance to anticipate results or future period trends. Investing in our common stock involves a high degree of risk. The risk factors described below should be carefully considered in addition to other information contained or incorporated by reference herein. We operate in a continually changing business environment and new risk factors emerge from time to time. We cannot predict such risk factors, nor can we assess the impact, if any, of such risk factors on our business or the extent to which any factors may cause actual results to differ materially from those projected. The following risks and uncertainties should be considered in evaluating our outlook of future Company performance.
The economic environment may affect our customers’ demand for our services. Future economic uncertainty may reduce the availability of liquidity and credit and, in many cases, reduce demand for our customers’ products. Disruption of the credit markets could also adversely affect our customers’ ability to finance on-going maintenance and new projects, resulting in contract cancellations or suspensions, and project delays. An extended or deep recession may result in plant closures or other contractions in our customer base. These factors may also adversely affect our ability to collect payment for work we have previously performed. Furthermore, our ability to expand our business could be limited if, in the future, we are unable to increase our credit capacity under favorable terms or at all. Such disruptions, should they occur, could materially impact our results of operations, financial position or cash flows.
8
Table of Contents
Our revenues are heavily dependent on certain industries. Sales of our services are dependent on customers in certain industries, particularly the refining and petrochemical industries. As experienced in the past, and as expected to occur in the future, downturns characterized by diminished demand for services in these industries could have a material impact on our results of operations, financial position or cash flows. Certain of our customers have employees represented by unions and could be subject to temporary work stoppage which could impact our activity level.
We sell our services in highly competitive markets, which places pressure on our profit margins and limits our ability to maintain or increase the market share of our services. Our competition generally stems from other outside service contractors, many of whom offer a similar range of services. Future economic uncertainty could generally reduce demand for industrial services and thus create a more competitive bidding environment for new and existing work. No assurances can be made that we will continue to maintain our pricing model and our profit margins or increase our market share.
No assurances can be made that we will be successful in maintaining or renewing our contracts with our customers. A significant portion of our contracts and agreements with customers may be terminated by either party on short notice. Although we actively pursue the renewal of our contracts, we cannot assure that we will be able to renew these contracts or that the terms of the renewed contracts will be as favorable as the existing contracts. If we are unable to renew or replace these contracts, or if we renew on less favorable terms, we may suffer a material reduction in revenue and earnings.
No assurances can be made that we will be successful in hiring or retaining members of a skilled technical workforce. We have a skilled technical workforce and an industry recognized technician training program for each of our service lines that prepares new employees as well as further trains our existing employees. The competition for these individuals is intense. The loss of the services of a number of these individuals, or failure to attract new employees, could adversely affect our ability to perform our obligations on our customers’ projects or maintenance and consequently could negatively impact the demand for our products and services.
Unsatisfactory safety performance can affect customer relationships, result in higher operating costs and negatively impact our ability to hire and retain a skilled technical workforce. Our workers are subject to the normal hazards associated with providing services at industrial facilities. Even with proper safety precautions, these hazards can lead to personal injury, loss of life, destruction of property, plant and equipment, lower employee morale and environmental damage. We are intensely focused on maintaining a strong safety environment and reducing the risk of accidents to the lowest possible level. Poor safety performance may limit or eliminate potential revenue streams from many of our largest customers and may materially increase our future insurance and other operating costs. Although we maintain insurance coverage, such coverage may be inadequate to protect us from all expenses related to these risks.
The implementation of a new enterprise resource planning (“ERP”) system may disrupt the Company’s operations or its system of internal controls. In the second quarter of fiscal year 2014, we initiated the design and implementation of a new ERP system, which is expected to be fully installed by the end of fiscal year 2017. As this system continues to be deployed throughout the Company, delays or difficulties may be encountered in effectively and efficiently processing transactions and conducting business operations until such time as personnel are familiar with all appropriate aspects and capabilities of the upgraded systems.
The Company’s operations and information systems are subject to cybersecurity risks. Team continues to increase its dependence on digital technologies to conduct its operations. Many of the Company’s files are digitized and more employees are working in almost paperless and remote environments. We have also outsourced certain information technology development, maintenance and support functions. As a result, the Company may be exposed to potentially severe cyber incidents at both its internal locations and outside vendor locations that could result in a theft of intellectual property and/or disruption of its operations for an extended period of time resulting in the loss of critical data and in higher costs to correct and remedy the effects of such incidents, although no such material incidents have occurred to date to the Company’s knowledge.
9
Table of Contents
Our operations and properties are subject to extensive governmental regulation under environmental laws. Environmental laws and regulations can impose substantial sanctions for violations or operational changes that may limit our services. We must conform our operations to applicable regulatory requirements and adapt to changes in such requirements in all locations in which we operate. These actions may increase the overall costs of providing our services. Some of our services involve handling or monitoring highly regulated materials, including VOCs or hazardous wastes. Environmental laws and regulations generally impose limitations and standards for regulated materials and require us to obtain permits and comply with various other requirements. The improper characterization, handling, disposal or monitoring of regulated materials or any other failure by us to comply with increasingly complex and strictly enforced federal, state and local environmental laws and regulations or associated environmental permits could subject us to the assessment of administrative, civil and criminal penalties, the imposition of investigatory or remedial obligations, or the issuance of injunctions that could restrict or prevent our ability to operate our business and complete contracted services. A defect in our services or faulty workmanship could result in an environmental liability if, as a result of the defect or faulty workmanship, a contaminate is released into the environment.
We currently maintain liability insurance to limit any potential loss, but there can be no assurance that our insurance will fully protect us against a claim or loss. We perform services in hazardous environments on or around high-pressure, high temperature systems and our employees are exposed to a number of hazards, including exposure to hazardous materials, explosion hazards and fire hazards. Incidents that occur at these large industrial facilities or systems, regardless of fault, may be catastrophic and adversely impact our employees and third parties by causing serious personal injury, loss of life, damage to property or the environment, and interruption of operations. Our contracts typically require us to indemnify our customers for injury, damage or loss arising out of our presence at our customers’ location, regardless of fault, or the performance of our services and provide for warranties for materials and workmanship. We may also be required to name the customer as an additional insured under our insurance policies. We maintain insurance coverage against these and other risks associated with our business. Due to the high cost of general liability coverage, we maintain insurance with a self-insured retention of $3.0 million per occurrence. This insurance may not protect us against liability for certain events, including events involving pollution, product or professional liability, losses resulting from business interruption or acts of terrorism or damages from breach of contract by the Company. We cannot assure you that our insurance will be adequate in risk coverage or policy limits to cover all losses or liabilities that we may incur. Moreover, in the future, we cannot assure that we will be able to maintain insurance at levels of risk coverage or policy limits that we deem adequate. Any future damages caused by our products or services that are not covered by insurance or are in excess of policy limits could have a material adverse effect on our results of operations, financial position or cash flows.
We are involved and are likely to continue to be involved in legal proceedings, which will increase our costs and, if adversely determined, could have a material effect on our results of operations, financial position or cash flows. We are currently a defendant in legal proceedings arising from the operation of our business and it is reasonable to expect that we will be named in future actions. Most of the legal proceedings against us arise out of the normal course of performing services at customer facilities, and include claims for workers’ compensation, personal injury and property damage. Legal proceedings can be expensive to defend and can divert the attention of management and other personnel for significant periods of time, regardless of the ultimate outcome. An unsuccessful defense of a liability claim could have an adverse effect on our business, results of operations, financial position or cash flows.
Economic, political and other risks associated with international operations could adversely affect our business. A portion of our operations are conducted and located outside the United States and, accordingly, our business is subject to risks associated with doing business internationally, including changes in foreign currency exchange rates, instability in political or economic conditions, difficulty in repatriating cash proceeds, differing employee relations, differing regulatory environments, trade protection measures, and difficulty in administering and enforcing corporate policies which may be different than the normal business practices of local cultures. In many foreign countries, particularly in those with developing economies, it is common to engage in business
10
Table of Contents
practices that are prohibited by U.S. and foreign anti-corruption regulations applicable to us such as the U.S. Foreign Corrupt Practices Act and the United Kingdom Bribery Act. Our international business operations may include projects in countries where corruption is prevalent. Although we have, and continue to, implement policies and procedures designed to ensure compliance with these laws, there can be no assurance that all of our employees, contractors or agents, including those representing us in countries where practices which violate such anti-corruption laws may be customary, will not take actions in violation of our policies and procedures. Any violation of foreign or U.S. laws by our employees, contractors or agents, even if such violation is prohibited by our policies and procedures, could have a material adverse effect on our results of operations, financial position or cash flows.
Our growth strategy entails risk for investors. We intend to continue to pursue acquisitions in, or complementary to, the specialty maintenance and construction services industry to complement and diversify our existing business. We may not be able to continue to expand our market presence through attractive acquisitions, and any future acquisitions may present unforeseen integration difficulties or costs. From time to time, we make acquisitions of other businesses that enhance our services or geographic scope. No assurances can be made that we will realize the cost savings, synergies or revenue enhancements that we may anticipate from any acquisition, or that we will realize such benefits within the time frame that we expect. If we are not able to address the challenges associated with acquisitions and successfully integrate acquired businesses, or if our integrated product and service offerings fail to achieve market acceptance, our business could be adversely affected. The consideration paid in connection with an acquisition may also affect our share price or future financial results depending on the structure of such consideration. To the extent we issue stock or other rights to purchase stock, including options or other rights, existing shareholders may be diluted and earnings per share may decrease. In addition, acquisitions may result in the incurrence of additional debt.
The price of our outstanding securities may be volatile. It is possible that in some future quarter (or quarters) our revenues, operating results or other measures of financial performance will not meet the expectations of public stock market analysts or investors, which could cause the price of our outstanding securities to decline or be volatile. Historically, our quarterly and annual sales and operating results have fluctuated. We expect fluctuations to continue in the future. In addition to general economic and political conditions, the following factors may affect our sales and operating results: the timing of significant customer orders, the timing of planned maintenance projects at customer facilities, changes in competitive pricing, wide variations in profitability by product line, variations in operating expenses, rapid increases in raw material and labor costs, the timing of announcements or introductions of new products or services by us, our competitors or our respective customers, the acceptance of those services, our ability to adequately meet staffing requirements with qualified personnel, relative variations in manufacturing efficiencies and costs, and the relative strength or weakness of international markets. Since our quarterly and annual revenues and operating results vary, we believe that period-to-period comparisons are not necessarily meaningful and should not be relied upon as indicators of our future performance.
Our business may be adversely impacted by work stoppages, staffing shortages and other labor matters. At May 31, 2015, we had approximately 4,800 employees, approximately 900 of whom were located in Canada and Europe where employees predominantly are represented by unions. Although we believe that our relations with our employees are good and we have had no strikes or work stoppages, no assurances can be made that we will not experience these and other types of conflicts with labor unions, works councils, other groups representing employees, or our employees in general, or that any future negotiations with our labor unions will not result in significant increases in the cost of labor.
Climate change legislation or regulations restricting emissions of “greenhouse gases” could result in reduced demand for our services and products. Scientific studies have suggested that emissions of certain gases, commonly referred to as “greenhouse gases” may be contributing to warming of the earth’s atmosphere. As a result, there have been a variety of regulatory developments, proposals or requirements and legislative initiatives that have been introduced in the United States (and other parts of the world) that are focused on restricting the emission of carbon dioxide, methane and other greenhouse gases. The adoption and implementation of any regulations which impose limiting emissions of carbon dioxide and other greenhouse gases from customers for whom we provide repair and maintenance services could affect demand for our products and services.
11
Table of Contents
Interruptions in the proper functioning of our information systems could disrupt operations and cause increases in costs and/or decreases in revenues. The proper functioning of our information systems is critical to the successful operation of our business. Although our information systems are protected through physical and software safeguards, our information systems are still vulnerable to natural disasters, power losses, telecommunication failures and other problems. If critical information systems fail or are otherwise unavailable, our business operations could be adversely affected.
New regulations related to conflict-free minerals may cause us to incur additional expenses. The SEC has established new annual disclosure and reporting requirements for those companies who use “conflict” minerals sourced from the Democratic Republic of Congo and adjoining countries in their products. These requirements could limit the pool of suppliers who can provide conflict-free minerals and as a result, we cannot ensure that we will be able to obtain these minerals at competitive prices. Compliance with these new requirements may also increase our costs. In addition, we may face challenges with our customers if we are unable to sufficiently verify the origins of the minerals used in our products.
Other risk factors. Other risk factors may include interruption of our operations, or the operations of our customers due to fire, hurricanes, earthquakes, power loss, telecommunications failure, terrorist attacks, labor disruptions, health epidemics and other events beyond our control.
Any one of these factors, or a combination of these factors, could materially affect our future results of operations, financial position or cash flows and whether any forward-looking statements in this Form 10-K ultimately prove to be accurate.
| ITEM 1B. | UNRESOLVED STAFF COMMENTS |
NONE
| ITEM 2. | PROPERTIES |
We own several facilities used in our operations. Our 120,000 square foot facility in Alvin, Texas consists of our primary training facility, equipment center and ISO-9001 certified manufacturing facility for clamps, enclosures, and sealants. Additionally, we own a 39,000 square foot manufacturing facility in Houston, Texas. We also own offices for our branch service locations in the following areas:
| • | Beaumont, Texas (27,000 ft2) |
| • | Pasadena, Texas (27,000 ft2) |
| • | Tulsa, Oklahoma (23,000 ft2) |
| • | Stafford, Texas (20,000 ft2) |
| • | Edmonton, Alberta (17,000 ft2) |
| • | Milwaukee, Wisconsin (10,000 ft2) |
All other facilities used in our operations are provided through operating leases.
Included in assets held for sale is $5.2 million pertaining to 50 acres of undeveloped land purchased in October 2007. The property was sold on July 29, 2015, for a sales price of $5.3 million.
We believe that our property and equipment are adequate for our current needs, although additional investments are expected to be made in property and equipment for expansion, replacement of assets at the end of their useful lives and in connection with corporate development activities.
12
Table of Contents
| ITEM 3. | LEGAL PROCEEDINGS |
Con Ed Matter—We have, from time to time, provided temporary leak repair services for the steam operations of Consolidated Edison Company of New York (“Con Ed”) located in New York City. In July 2007, a Con Ed steam main located in midtown Manhattan ruptured causing one death and other injuries and property damage. As of May 31, 2015, ninety-two lawsuits are currently pending against Con Ed, the City of New York and Team in the Supreme Courts of New York located in Kings, New York and Bronx County, alleging that our temporary leak repair services may have contributed to the cause of the rupture. The lawsuits seek generally unspecified compensatory damages for personal injury, property damage and business interruption. Additionally, on March 31, 2008, we received a letter from Con Ed alleging that our contract with Con Ed requires us to indemnify and defend Con Ed for additional claims filed against Con Ed as a result of the rupture. Con Ed filed an action to join Team and the City of New York as defendants in all lawsuits filed against Con Ed that did not include Team and the City of New York as direct defendants. We are vigorously defending the lawsuits and Con Ed’s claim for indemnification. We are unable to estimate the amount of liability to us, if any, associated with these lawsuits and the claim for indemnification. We maintain insurance coverage, subject to a deductible limit of $250,000, which we believe should cover these claims. We have not accrued any liability in excess of the deductible limit for the lawsuits. We do not believe the ultimate outcome of these matters will have a material adverse effect on our financial position, results of operations or cash flows.
In December 2014, our subsidiary, Quest Integrity, filed three patent infringement lawsuits against three different defendants, two in the US District of Delaware (“Delaware Cases”) and one in US District of Western Washington (“Washington Case”). Quest Integrity alleges that the three defendants infringed Quest Integrity’s patent, entitled “2D and 3D Display System and Method for Furnace Tube Inspection”. This Quest Integrity patent generally teaches a system and method for displaying inspection data collected during the inspection of furnace tubes in petroleum and petro-chemical refineries. The subject patent litigation is specific to the visual display of the collected data and does not relate to Quest Integrity’s underlying advanced inspection technology. In these lawsuits, Quest Integrity is seeking temporary and permanent injunctive relief, as well as monetary damages. Defendants have denied they infringe any valid claim of Quest Integrity’s patent, and have asserted declaratory judgment counterclaims that the patent at issue is invalid and/or unenforceable, and not infringed. In June 2015, the US District of Delaware denied our motions for preliminary injunctive relief in the Delaware Cases (that is, our request that the defendants stop using our patented systems and methods during the pendency of the actions); the Delaware Cases are expected to proceed to trial on our claims during the second calendar quarter of 2016. The preliminary injunction hearing for the Washington Case is expected to occur in the first half of calendar 2016.
We are involved in various other lawsuits and are subject to various claims and proceedings encountered in the normal conduct of business. In our opinion, any uninsured losses that might arise from these lawsuits and proceedings will not have a materially adverse effect on our consolidated financial statements.
| ITEM 4. | MINE SAFETY DISCLOSURES |
NOT APPLICABLE
13
Table of Contents
| ITEM 5. | MARKET FOR REGISTRANT’S COMMON EQUITY, RELATED STOCKHOLDER MATTERS AND ISSUER PURCHASES OF EQUITY SECURITIES |
Market Information
Our stock is traded on the NYSE under the symbol “TISI”. The table below reflects the high and low sales prices of our common stock by quarter for the fiscal years ended May 31, 2015 and 2014, respectively.
| Sales Price | ||||||||
| High | Low | |||||||
| 2015 |
||||||||
| Quarter ended: |
||||||||
| August 31, 2014 |
$ | 43.53 | $ | 36.09 | ||||
| November 30, 2014 |
$ | 44.36 | $ | 35.18 | ||||
| February 28, 2015 |
$ | 41.42 | $ | 35.44 | ||||
| May 31, 2015 |
$ | 41.22 | $ | 35.60 | ||||
| 2014 |
||||||||
| Quarter ended: |
||||||||
| August 31, 2013 |
$ | 41.77 | $ | 35.20 | ||||
| November 30, 2013 |
$ | 41.13 | $ | 32.33 | ||||
| February 28, 2014 |
$ | 48.09 | $ | 37.70 | ||||
| May 31, 2014 |
$ | 45.05 | $ | 40.00 | ||||
Holders
There were 159 holders of record of our common stock as of July 29, 2015 excluding beneficial owners of stock held in street name.
Dividends
No cash dividends were declared or paid during the fiscal years ended May 31, 2015, 2014 and 2013. We are limited in our ability to pay cash dividends without the consent of our bank syndicate. Accordingly, we have no present intention to pay cash dividends in the foreseeable future. Additionally, any future dividend payments will continue to depend on our financial condition, market conditions and other matters deemed relevant by the Board.
Securities Authorized for Issuance Under Equity Compensation Plans
This information has been omitted from this report on Form 10-K as we intend to file such information in our definitive proxy statement no later than 120 days following the close of our fiscal year ended May 31, 2015. The information required regarding equity compensation plans is hereby incorporated by reference.
14
Table of Contents
Performance Graph
The following performance graph compares the performance of our common stock to the NYSE Composite Index and a Peer Group Index. The comparison assumes $100 was invested on May 31, 2010 in our common stock, the NYSE Composite Index and a Peer Group Index. The values of each investment are based on share price appreciation, with reinvestment of all dividends, assuming any were paid. For each graph, the investments are assumed to have occurred at the beginning of each period presented. The following companies are included in our Peer Group Index used in the graph: Furmanite Corporation, Matrix Service Company, Englobal Corporation and Mistras Group, Inc.
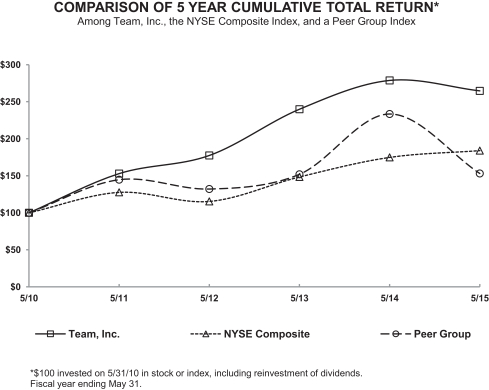
| 5/10 | 5/11 | 5/12 | 5/13 | 5/14 | 5/15 | |||||||||||||||||||
| Team, Inc. |
100.00 | 152.93 | 177.39 | 239.83 | 278.72 | 264.63 | ||||||||||||||||||
| NYSE Composite |
100.00 | 127.63 | 115.35 | 148.38 | 174.84 | 183.96 | ||||||||||||||||||
| Peer Group |
100.00 | 144.71 | 132.10 | 151.97 | 233.41 | 153.08 | ||||||||||||||||||
Notes: The above information was provided by Research Data Group, Inc.
15
Table of Contents
| ITEM 6. | SELECTED FINANCIAL DATA |
The following is a summary of selected financial information for the five years ended May 31, (in thousands, except per share data):
| 2015 | 2014 | 2013 | 2012 | 2011 | ||||||||||||||||
| Revenues |
$ | 842,047 | $ | 749,527 | $ | 714,311 | $ | 623,740 | $ | 508,020 | ||||||||||
| Operating income |
$ | 68,465 | $ | 53,421 | $ | 55,602 | $ | 56,497 | $ | 42,475 | ||||||||||
| Net income available to Team shareholders |
$ | 40,070 | $ | 29,855 | $ | 32,436 | $ | 32,911 | $ | 26,585 | ||||||||||
| Net income per share |
||||||||||||||||||||
| Basic |
$ | 1.95 | $ | 1.46 | $ | 1.61 | $ | 1.67 | $ | 1.38 | ||||||||||
| Diluted |
$ | 1.85 | $ | 1.40 | $ | 1.53 | $ | 1.59 | $ | 1.32 | ||||||||||
| Weighted-average shares outstanding |
||||||||||||||||||||
| Basic |
20,500 | 20,439 | 20,203 | 19,667 | 19,206 | |||||||||||||||
| Diluted |
21,651 | 21,285 | 21,166 | 20,660 | 20,083 | |||||||||||||||
| Depreciation and amortization |
$ | 22,787 | $ | 21,468 | $ | 19,664 | $ | 17,469 | $ | 14,584 | ||||||||||
| Share-based compensation |
$ | 4,838 | $ | 4,239 | $ | 3,931 | $ | 4,386 | $ | 4,993 | ||||||||||
| Capital expenditures |
$ | 28,769 | $ | 33,016 | $ | 26,068 | $ | 23,924 | $ | 13,158 | ||||||||||
| Balance sheet data: |
||||||||||||||||||||
| Total assets |
$ | 523,833 | $ | 484,941 | $ | 460,203 | $ | 403,788 | $ | 355,486 | ||||||||||
| Long-term debt and other long-term liabilities |
$ | 97,234 | $ | 92,753 | $ | 95,209 | $ | 97,131 | $ | 86,299 | ||||||||||
| Stockholders’ equity |
$ | 335,375 | $ | 317,045 | $ | 292,190 | $ | 245,001 | $ | 209,446 | ||||||||||
| Working capital |
$ | 197,472 | $ | 173,671 | $ | 174,114 | $ | 157,019 | $ | 130,533 | ||||||||||
| Non-controlling interest |
$ | 6,034 | $ | 5,678 | $ | 5,384 | $ | 5,097 | $ | 4,983 | ||||||||||
16
Table of Contents
| ITEM 7. | MANAGEMENT’S DISCUSSION AND ANALYSIS OF FINANCIAL CONDITION AND RESULTS OF OPERATIONS |
The following review of our results of operations and financial condition should be read in conjunction with Item 1 “Business,” Item 1A “Risk Factors,” Item 2 “Properties,” and Item 8 “Consolidated Financial Statements and Supplementary Data,” included in this Form 10-K.
CAUTIONARY STATEMENT FOR THE PURPOSE OF
SAFE HARBOR PROVISIONS OF THE
PRIVATE SECURITIES LITIGATION REFORM ACT OF 1995
This report includes forward-looking statements within the meaning of Section 27A of the Securities Act of 1933 and Section 21E of the Securities Exchange Act of 1934. In addition, other written or oral statements that constitute forward-looking statements may be made by us or on behalf of the Company in other materials we release to the public including all statements, other than statements of historical facts, included or incorporated by reference in this Form 10-K, that address activities, events or developments which we expect or anticipate will or may occur in the future. You can generally identify our forward-looking statements by the words “anticipate,” “believe,” “expect,” “plan,” “intend,” “estimate,” “project,” “projection,” “predict,” “budget,” “forecast,” “goal,” “guidance,” “target,” “will,” “could,” “should,” “may” and similar expressions.
We based our forward-looking statements on our reasonable beliefs and assumptions, and our current expectations, estimates and projections about ourselves and our industry. We caution that these statements are not guarantees of future performance and involve risks, uncertainties and assumptions that we cannot predict. In addition, we based many of these forward-looking statements on assumptions about future events that may prove to be inaccurate. We wish to ensure that such statements are accompanied by meaningful cautionary statements, so as to obtain the protections of the safe harbor established in the Private Securities Litigation Reform Act of 1995. New risk factors emerge from time to time and it is not possible for us to predict all such risk factors, nor can we assess the impact of all such risk factors on our business or the extent to which any factor, or combination of factors, may cause actual results to differ materially from those contained in any forward-looking statements. Accordingly, forward-looking statements cannot be relied upon as a guarantee of future results and involve a number of risks and uncertainties that could cause actual results to differ materially from those projected in the statements, including, but not limited to the statements under “Risk Factors.” We undertake no obligation to update publicly any forward-looking statements, whether as a result of new information, future events or otherwise.
This Management’s Discussion and Analysis of Financial Condition and Results of Operations is provided as a supplement to the accompanying consolidated financial statements and notes to help provide an understanding of our financial condition, changes in financial condition, and results of operations.
General Information
We are a leading provider of specialty industrial services, including inspection and assessment, required in maintaining high temperature and high pressure piping systems and vessels that are utilized extensively in the refining, petrochemical, power, pipeline and other heavy industries. We conduct operations in three segments: IHT, MS and Quest Integrity. While our services are aligned in three business groups, we believe our services broadly fall into three different classifications that have unique customer demand drivers: inspection and assessment services, turnaround services, and on-stream services.
Inspection and assessment services are offered in both IHT and Quest Integrity. IHT provides basic and advanced non-destructive testing services for the process, pipeline and power sectors, pipeline integrity management services, as well as associated engineering and assessment services. These services can be offered while facilities are running (on-stream), during facility turnarounds or during new construction or expansion
17
Table of Contents
activities. Quest Integrity provides integrity and reliability management solutions for the process, pipeline and power sectors. These solutions encompass two broadly-defined disciplines: (1) highly specialized in-line inspection services for unpiggable process piping and pipelines using proprietary in-line inspection tools and analytical software; and (2) advanced condition assessment services through a multi-disciplined engineering team. We believe there is a general growth in market demand for inspection and assessment services as improved inspection technologies enable better information about asset reliability to be available to facility owners and operators.
Turnaround services are offered in both IHT and MS. These services are project-related and demand is a function of the number and scope of scheduled and unscheduled facility turnarounds as well as new industrial facility construction or expansion. Turnaround services include the field machining, technical bolting, field valve repair, heat exchanger repair, and isolation test plugging services that are part of MS and the field heat treating services that are part of IHT.
On-stream services are offered by MS and represent the services offered while plants are operating and under pressure. These services include leak repair, fugitive emissions control and hot tapping. We believe demand for on-stream services is a function of the population of the existing infrastructure of operating industrial facilities.
We offer these services in over 150 locations throughout the world. Our industrial services are available 24 hours a day, 7 days a week, 365 days a year. We market our services to companies in a diverse array of heavy industries which include the petrochemical, refining, power, pipeline, steel, pulp and paper industries, as well as municipalities, shipbuilding, OEMs, distributors, and some of the world’s largest engineering and construction firms. Our services are also provided across a broad geographic reach.
Results of Operations
Year Ended May 31, 2015 Compared to Year Ended May 31, 2014
The following table sets forth the components of revenue and operating income from our operations for fiscal years 2015 and 2014 (in thousands):
| Year Ended May 31, |
Increase (Decrease) |
|||||||||||||||
| 2015 | 2014 | $ | % | |||||||||||||
| Revenues by business segment: |
||||||||||||||||
| IHT |
$ | 467,099 | $ | 408,259 | $ | 58,840 | 14 | % | ||||||||
| MS |
300,456 | 275,322 | 25,134 | 9 | % | |||||||||||
| Quest Integrity |
74,492 | 65,946 | 8,546 | 13 | % | |||||||||||
|
|
|
|
|
|
|
|||||||||||
| Total |
$ | 842,047 | $ | 749,527 | $ | 92,520 | 12 | % | ||||||||
|
|
|
|
|
|
|
|||||||||||
| Operating income: |
||||||||||||||||
| IHT |
$ | 60,198 | $ | 47,787 | $ | 12,411 | 26 | % | ||||||||
| MS |
28,713 | 26,177 | 2,536 | 10 | % | |||||||||||
| Quest Integrity |
13,196 | 9,260 | 3,936 | 43 | % | |||||||||||
| Corporate and shared support services |
(33,642 | ) | (29,803 | ) | (3,839 | ) | 13 | % | ||||||||
|
|
|
|
|
|
|
|||||||||||
| Total |
$ | 68,465 | $ | 53,421 | $ | 15,044 | 28 | % | ||||||||
|
|
|
|
|
|
|
|||||||||||
Revenues. Total revenues increased 12% or $92.5 million in 2015 versus 2014, with IHT revenues growing $58.8 million, Quest Integrity revenues growing $8.5 million and MS revenues growing $25.1 million. The IHT business is comprised of both traditional and advanced NDE services, as well as Heat Treating services. The IHT NDE services were $364.3 million in 2015, up $44.3 million or 14% from 2014. Overall favorable market conditions across most of our regions, coupled with growth in tank inspection and rope access services, all contributed to the increase in IHT revenues. Advanced inspection services, such as Phased Array Ultrasonics also
18
Table of Contents
experienced increased demand in fiscal year 2015. IHT Heat Treating services, which are fundamentally performed in turnarounds or projects, were $102.8 million, up $12.8 million or 14% from 2014 due to favorable market conditions, increased large project activity levels, and successful deployment of our mobile smart rigs and smart heat consoles. Unfavorable currency exchange fluctuations in Canada negatively impacted IHT’s revenue by approximately $8.0 million when compared to fiscal year 2014.
MS includes both on-stream and turnaround/project services. On-stream services were $158.7 million in 2015, consistent with 2014 results. Turnaround services within MS were $141.8 million, up $25.8 million or 22% from 2014. Overall market conditions were favorable as MS experienced revenue growth across most regions and service offerings. Turnaround project levels were strong during the year and favorably impacted by several large projects. Offsetting these market growth factors, MS was negatively impacted by unfavorable foreign currency fluctuations during fiscal year 2015 relating primarily to the Euro and Canadian dollar. We estimate an unfavorable currency impact of approximately $6.0 million.
Quest Integrity revenues increased $8.5 million or 13% in 2015 from 2014 as Quest Integrity’s pipeline inspection business was up significantly in fiscal year 2015. However, this was partially offset by a generally weak process inspection market, resulting from lower crude oil prices which led to some turnaround project deferrals.
Operating Income. Total operating income (earnings before interest and taxes) was $68.5 million in fiscal year 2015 compared to $53.4 million in fiscal year 2014, an increase of $15.0 million or 28%. Changes in operating income within business groups were driven primarily by increased revenues from high activity level. Gross margins improved by one point and four points, respectively, in fiscal year 2015 for IHT and Quest Integrity while gross margin for MS was unchanged in comparison to the prior year. Operating income in fiscal year 2015 was negatively impacted by $3.2 million in non-routine costs consisting of acquisition related fees, legal fees surrounding the defense of intellectual property associated with Quest Integrity, ERP system implementation costs, and a fixed asset write down. Non-routine items benefitted operating income in fiscal year 2014 by $1.4 million consisting of a revaluation of contingent consideration, partially offset by severance costs.
Earnings from Unconsolidated Affiliates. The earnings from unconsolidated affiliates in last year’s results represented our interest in a joint venture providing inspection services in Alaska. The joint venture was dissolved in December 2013 and the operations that were formerly conducted in the joint venture are now conducted directly by the IHT business unit.
Venezuelan Impairment Loss. During the year ended May 31, 2015, management began reporting the results of our Venezuelan operations using the cost method of accounting. This change resulted in a one-time pre-tax charge of $1.2 million. This decision was made given the other-than-temporary lack of exchangeability in the Venezuelan currency combined with other recent Venezuelan regulations that negatively impacted our ability to control operations and maintain normal service levels.
Foreign Currency Loss. Non-operating results include $1.5 million currency transaction losses for the year ended May 31, 2015 compared to losses of $4.2 million for the year ended May 31, 2014. Currency transaction losses in the current year were driven primarily by a weakening of the Euro, Canadian Dollar and Mexican Peso against the U.S. Dollar. Currency transaction losses in the prior year were primarily due to fluctuations between the Venezuelan Bolivar and the U.S. Dollar. We accounted for Venezuela as a highly-inflationary economy and accordingly, all currency fluctuations between the Bolivar and the U.S. Dollar were recorded in our statement of operations. Due to the devaluations of the Bolivar in fiscal year 2014, we recorded a $4.0 million foreign currency loss during the year ended May 31, 2014.
Taxes. The provision for income tax was $22.8 million on pre-tax income of $63.3 million for the year ended May 31, 2015 compared to the provision for income tax of $16.2 million on pre-tax income of $46.4 million for the year ended May 31, 2014. The effective tax rate was 36% for the year ended May 31, 2015
19
Table of Contents
and 35% for the year ended May 31, 2014. The increase in the effective tax rate was primarily due to changes in deferred tax liabilities related to the differences between the financial reporting basis and U.S. tax basis of investments in certain foreign subsidiaries.
Year Ended May 31, 2014 Compared to Year Ended May 31, 2013
The following table sets forth the components of revenue and operating income from our operations for fiscal years 2014 and 2013 (in thousands):
| Year Ended May 31, |
Increase (Decrease) |
|||||||||||||||
| 2014 | 2013 | $ | % | |||||||||||||
| Revenues by business segment: |
||||||||||||||||
| IHT |
$ | 408,259 | $ | 380,518 | $ | 27,741 | 7 | % | ||||||||
| MS |
275,322 | 276,360 | (1,038 | ) | (0 | )% | ||||||||||
| Quest Integrity |
65,946 | 57,433 | 8,513 | 15 | % | |||||||||||
|
|
|
|
|
|
|
|||||||||||
| Total |
$ | 749,527 | $ | 714,311 | $ | 35,216 | 5 | % | ||||||||
|
|
|
|
|
|
|
|||||||||||
| Operating income: |
||||||||||||||||
| IHT |
$ | 47,787 | $ | 45,307 | $ | 2,480 | 5 | % | ||||||||
| MS |
26,177 | 29,228 | (3,051 | ) | (10 | )% | ||||||||||
| Quest Integrity |
9,260 | 9,400 | (140 | ) | (1 | )% | ||||||||||
| Corporate and shared support services |
(29,803 | ) | (28,333 | ) | (1,470 | ) | 5 | % | ||||||||
|
|
|
|
|
|
|
|||||||||||
| Total |
$ | 53,421 | $ | 55,602 | $ | (2,181 | ) | (4 | )% | |||||||
|
|
|
|
|
|
|
|||||||||||
Revenues. Total revenues increased 5% or $35 million in 2014 versus 2013, with IHT revenues growing $27.7 million, Quest Integrity revenues growing $8.5 million and MS revenues being relatively flat year over year. The IHT business is comprised of both traditional and advanced NDE services, as well as Heat Treating services. The IHT NDE services were approximately $320 million in 2014, up $35 million or 12% from 2013. The growth in NDE inspection includes $4.8 million from acquired businesses. IHT Heat Treating services, which are fundamentally performed in turnarounds or projects, were approximately $90 million, down $8 million or 8% from 2013 due to fewer large project opportunities.
MS includes both on-stream and turnaround/project services. On-stream services were approximately $159 million in 2014, up $15 million or 11% over 2013. Turnaround services within MS were approximately $116 million, down $20 million or 15% from 2013. The decline in turnaround/project services was impacted by a reduction in the number of very large turnaround projects in the first half of the year compared to the first half of 2013.
Quest Integrity revenues increased $8.5 million or 15% in 2014 from 2013 and reflect a slowing of revenue growth in the fourth quarter due primarily to deferral of projects into fiscal year 2015.
Operating Income. Total operating income (earnings before interest and taxes) was $53.4 million in 2014 compared to $55.6 million in 2013, a decline of $2 million or 4%. Included in operating income in the IHT group in 2014 is a $2.1 million non-cash gain from the revaluation of contingent consideration (see Note 2). Fluctuations in operating income within business groups were driven primarily by revenue changes. However, with respect to Quest Integrity, our investment in next generation tools caused engineering and development costs, which are included in cost of sales and SG&A expenses, to increase 36% to $4.9 million from fiscal year 2013. As a result, Quest Integrity’s operating profit was flat when compared to fiscal year 2013, in spite of the 15% increase in its revenues. Corporate and shared support costs include $0.8 million of severance incurred in the first quarter associated with the business unit reorganization.
Earnings from Unconsolidated Affiliates. The earnings from unconsolidated affiliates in last year’s results represented our interest in a joint venture providing inspection services in Alaska. The joint venture was
20
Table of Contents
dissolved in December 2013 and the operations that were formerly conducted in the joint venture are now conducted directly by the IHT business unit.
Foreign Currency Loss. Non-operating results include $4.2 million currency transaction losses for the year ended May 31, 2014 compared to losses of $0.9 million for the year ended May 31, 2013. Currency transaction losses are primarily due to fluctuations between the Venezuelan Bolivar and the U.S. Dollar. We accounted for Venezuela as a highly-inflationary economy and accordingly, all currency fluctuations between the Bolivar and the U.S. Dollar were recorded in our statement of operations. Due to the devaluations of the Bolivar in fiscal year 2014, we recorded a $4.0 million foreign currency loss during the year ended May 31, 2014. At May 31, 2014 after giving effect to the revaluations in 2014, our Venezuelan subsidiary had remaining net assets of $0.7 million.
Taxes. The provision for income tax was $16.2 million on pre-tax income of $46.4 million for the year ended May 31, 2014 compared to the provision for income tax of $19.2 million on pre-tax income of $51.9 million for the year ended May 31, 2013. The effective tax rate was 35% for the year ended May 31, 2014 and 37% for the year ended May 31, 2013. The reduction in the effective tax rate was primarily the result of foreign exchange rate changes to certain deferred tax liability accounts.
Liquidity and Capital Resources
Financing for our operations consists primarily of vendor financing and leasing arrangements, our banking credit facility (“Credit Facility”) and cash flows attributable to our operations, which we believe are sufficient to fund our business needs. The Credit Facility had borrowing capacity of up to $150 million in multiple currencies, bears interest based on a variable Eurodollar rate option (LIBOR plus 1.50% margin at May 31, 2015) with the margin based on financial covenants set forth in the Credit Facility. In connection with a prior renewal of the Credit Facility, we are amortizing $0.8 million of associated debt issuance costs over the life of the Credit Facility. At May 31, 2015, we had $33.2 million of cash on hand and approximately $58 million of available borrowing capacity through our Credit Facility.
Subsequent to year end, we renewed our Credit Facility (the “New Credit Facility”). The New Credit Facility has borrowing capacity of up to $500 million and consists of a $300 million, five-year revolving loan facility and a $200 million five-year term loan facility, the proceeds of which were used to fund, in part, the Company’s acquisition of the Qualspec Group. The New Credit Facility matures in July 2020 and expands the number of banks in the syndicate from four to seven. The New Credit Facility also contains financial covenants requiring the Company to maintain as of the end of each fiscal quarter (i) a maximum ratio of consolidated funded debt to consolidated EBITDA of not more than 4.00 to 1.00 (until August 31, 2016, at which point the ratio will decrease by 0.25 to 1.00 every other quarter until it reaches 3.00 to 1.00), (ii) a maximum ratio of senior secured debt to consolidated EBITDA of not more than 3.00 to 1.00 and (iii) an interest coverage ratio of less than 3.00 to 1.00. As of May 31, 2015, we are in compliance with these covenants.
In the second quarter of fiscal year 2014, we initiated the design and implementation of a new ERP system, which is expected to be fully installed by the end of fiscal year 2017. Through the end of fiscal year 2015, we have capitalized $14.5 million associated with the project that includes $0.2 million of capitalized interest.
On October 1, 2013, our Board approved an initial $25 million stock repurchase plan, superseding and replacing our previous stock repurchase plan. During the second quarter of fiscal year 2014, we repurchased 369,900 shares for a total cost of $13.3 million. These shares, along with 89,569 shares purchased under a previous plan in a prior period at a cost of $1.3 million, were retired and are not included in common stock issued and outstanding as of May 31, 2014. The retirement of the shares purchased resulted in a reduction in common stock of $0.1 million, a reduction of $2.2 million to additional paid-in capital, and a $12.3 million reduction in retained earnings.
On June 23, 2014, our Board authorized an increase in the stock repurchase plan limit to repurchase Team common stock up to $50 million (net of the $13.3 million repurchased in the second quarter of fiscal year 2014). During the third quarter of fiscal year 2015, we repurchased 546,977 shares for a total cost of $21.1 million. At May 31, 2015, $15.5 million remained available to repurchase shares under the stock repurchase plan.
21
Table of Contents
Contractual Obligations
A summary of contractual obligations as of May 31, 2015 are as follows (in thousands):
| Less than 1 year | 1-3 years | 3-5 years | More than 5 years | Total | ||||||||||||||||
| Long-term debt obligations |
$ | — | $ | — | $ | — | $ | 78,484 | $ | 78,484 | ||||||||||
| Operating lease obligations |
19,063 | 27,612 | 11,207 | 8,604 | 66,486 | |||||||||||||||
| Other long-term liabilities |
— | 3,119 | — | — | 3,119 | |||||||||||||||
|
|
|
|
|
|
|
|
|
|
|
|||||||||||
| Total |
$ | 19,063 | $ | 30,731 | $ | 11,207 | $ | 87,088 | $ | 148,089 | ||||||||||
|
|
|
|
|
|
|
|
|
|
|
|||||||||||
Long-term debt obligations shown in the summary above reflects the revised maturity date of the New Credit Facility but does not include additional obligations in connection with the acquisition of Qualspec subsequent to year end. The table above excludes interest on our Credit Facility. We cannot predict with any certainty the amount of interest due to the expected variability of interest rates and principal amounts outstanding. If we assume interest payment amounts are calculated using the outstanding principal balances and interest rates as of May 31, 2015, the estimated interest payments on our Credit Facility would be $2.0 million annually for a total of $10 million over the contractual five year period.
A summary of long-term debt and other contractual obligations as of May 31, 2015 and May 31, 2014 is as follows (in thousands):
| May 31, | ||||||||
| 2015 | 2014 | |||||||
| Credit Facility |
$ | 78,484 | $ | 73,721 | ||||
| Current maturities |
— | — | ||||||
|
|
|
|
|
|||||
| Long-term debt, excluding current maturities |
$ | 78,484 | $ | 73,721 | ||||
|
|
|
|
|
|||||
| Outstanding letters of credit |
$ | 12,068 | $ | 13,640 | ||||
| Leasing arrangements |
$ | 66,486 | $ | 68,502 | ||||
| Other long-term liabilities |
$ | 3,119 | $ | 3,377 | ||||
Restrictions on cash. Included in our cash and cash equivalents at May 31, 2015 is $16.8 million of cash in certain foreign subsidiaries (located in primarily Europe and Canada) where earnings are considered by the Company to be permanently reinvested. In the event that some or all of this cash were to be repatriated, we would be required to accrue and pay additional taxes. While not legally restricted from repatriating this cash, we consider all undistributed earnings of these foreign subsidiaries to be indefinitely reinvested and access to cash to be limited.
Cash flows attributable to our operating activities. For the year ended May 31, 2015, net cash provided by operating activities was $43.5 million. Positive operating cash flow was primarily attributable to net income of $40.5 million, depreciation and amortization of $22.8 million, and non-cash compensation cost of $4.8 million offset by a $27.4 million increase in working capital.
For the year ended May 31, 2014, net cash provided by operating activities was $52.9 million. Positive operating cash flow was primarily attributable to net income of $30.1 million, depreciation and amortization of $21.5 million, and non-cash compensation cost of $4.2 million offset by a $3.5 million increase in working capital.
Cash flows attributable to our investing activities. For the year ended May 31, 2015, net cash used in investing activities was $31.8 million, consisting primarily of $28.8 million of capital expenditures and $3.1 million related to business acquisitions. Capital expenditures can vary depending upon specific customer needs that may arise unexpectedly.
22
Table of Contents
For the year ended May 31, 2014, net cash used in investing activities was $40.6 million, consisting primarily of $33.0 million of capital expenditures and $10.2 million related to business acquisitions.
Cash flows attributable to our financing activities. For the year ended May 31, 2015, net cash used in financing activities was $10.1 million, consisting primarily of $21.1 million of cash related to the purchase of stock pursuant to our stock repurchase plan offset by $8.0 million of borrowings.
For the year ended May 31, 2014, net cash used in financing activities was $9.6 million consisting primarily of $13.3 million of cash related to the purchase of stock pursuant to our stock repurchase plan offset by $5.3 million provided by the issuance of common stock from share-based payment arrangements.
Effect of exchange rate changes on cash. For the years ended May 31, 2015 and 2014, the effect of exchange rate changes on cash was a negative impact of $3.1 million and $2.2 million. The negative impact in the current year is primarily attributable to changes in U.S. Dollar exchange rates with Canada and Europe. The negative impact in the prior year is primarily to changes in U.S. Dollar exchange rates with Canada and Venezuela.
Critical Accounting Policies
The process of preparing financial statements in accordance with Generally Accepted Accounting Principles in the U.S. (“GAAP”) requires our management to make estimates and judgments. It is possible that materially different amounts could be recorded if these estimates and judgments change or if actual results differ from these estimates and judgments. We have identified the following six critical accounting policies that require a significant amount of estimation and judgment and are considered to be important to the portrayal of our financial position and results of operations:
| • | Revenue Recognition |
| • | Goodwill, Intangible Assets, and Non-Controlling Interest |
| • | Income Taxes |
| • | Workers’ Compensation, Auto, Medical and General Liability Accruals |
| • | Allowance for Doubtful Accounts |
| • | Estimated Useful Lives |
Revenue recognition. We determine our revenue recognition guidelines for our operations based on guidance provided in applicable accounting standards and positions adopted by the Financial Accounting Standards Board (“FASB”) and the SEC. Most of our projects are short-term in nature and we predominantly derive revenues by providing a variety of industrial services on a time and material basis. For all of these services our revenues are recognized when services are rendered or when product is shipped to the job site and risk of ownership passes to the customer. However, due to various contractual terms with our customers, at the end of any reporting period, there may be earned but unbilled revenue that is accrued to properly match revenues with related costs. At May 31, 2015 and May 31, 2014, the amount of earned but unbilled revenue included in accounts receivable was $18.4 million and $14.9 million, respectively.
Goodwill, intangible assets and non-controlling interest. Goodwill represents the excess of costs over fair value of assets of businesses acquired. Goodwill and intangible assets acquired in a purchase business combination and determined to have an indefinite useful life are not amortized, but are instead tested for impairment at least annually in accordance with the provisions of the FASB Accounting Standards Codification (“ASC”) 350, Intangibles—Goodwill and Other (“ASC 350”). Intangible assets with estimated useful lives are amortized over their respective estimated useful lives to their estimated residual values and reviewed for impairment in accordance with ASC 350. We assess goodwill for impairment at the reporting unit level, which we have determined to be the same as our operating segments. Each reporting unit has goodwill relating to past acquisitions.
23
Table of Contents
Effective July 1, 2013, we implemented a reorganization of our business divisions and now conduct operations in three segments: IHT Group, MS Group and Quest Integrity Group. Each operating segment has goodwill relating to past acquisitions and we now assess goodwill for impairment at the operating segment level. Due to the changes in the underlying assumptions surrounding our goodwill testing, during the first quarter of fiscal year 2014, we performed a quantitative analysis of goodwill to test for impairment. The test for impairment is performed at the reporting unit level which is deemed to be at the operating segment level. The test was a two-step process that involved comparing the estimated fair value of each reporting unit to the reporting unit’s carrying value, including goodwill. If the fair value of a reporting unit exceeded its carrying amount, the goodwill of the reporting unit was not considered impaired; therefore, the second step of the impairment test would not be deemed necessary. If the carrying amount of the reporting unit exceeded its fair value, we would then perform a second step to the goodwill impairment test to measure the amount of goodwill impairment loss to be recorded.
The fair value of the reporting units at July 1, 2013 were determined using a method based on discounted cash flow models with estimated cash flows based on internal forecasts of revenue and expenses over a four year period plus a terminal value period (the income approach). The income approach estimated fair value by discounting each reporting unit’s estimated future cash flows using a discount rate that approximated our weighted-average cost of capital. The fair value derived from the income approach, in the aggregate, approximated our market capitalization. At July 1, 2013, our market capitalization exceeded the carrying value of our consolidated net assets by approximately $500 million or 170%, and the fair value of each operating segment significantly exceeded their respective carrying amounts as of that date.
On May 31, 2015 and 2014, we completed our annual goodwill impairment test by performing a qualitative analysis that assessed relevant events and circumstances to evaluate whether it was more likely than not that the fair value of our individual reporting units was less than their respective carrying amount of goodwill. If, after assessing the totality of events and circumstances, an entity determines that it is more likely than not that the fair value of a reporting unit is greater than the carrying amount, then the first and second steps of the goodwill impairment test are not necessary. We evaluated considerations under ASC 350, such as macroeconomic effects on our business, industry and market considerations, cost factors that could have a negative effect on cash flows or earnings, overall financial performance, entity-specific events, events affecting reporting units, and any realization of a sustained decrease in the price of our stock. After consideration of the aforementioned events and circumstances, we concluded that it was more likely than not that the fair value of each reporting unit was greater than its respective carrying amount of goodwill. Accordingly, we did not perform the two-step process described above for our fiscal years 2015 and 2014 annual goodwill impairment testing.
There was $107.8 million and $113.8 million of goodwill at May 31, 2015 and 2014, respectively. A summary of goodwill is as follows (in thousands):
| Twelve Months Ended May 31, 2015 |
||||||||||||||||
| MS | IHT | Quest Integrity | Total | |||||||||||||
| Balance at beginning of year |
$ | 19,685 | $ | 63,249 | $ | 30,829 | $ | 113,763 | ||||||||
| Acquisitions |
103 | — | — | 103 | ||||||||||||
| Foreign currency adjustments |
(2,322 | ) | (2,512 | ) | (1,259 | ) | (6,093 | ) | ||||||||
|
|
|
|
|
|
|
|
|
|||||||||
| Balance at May 31, 2015 |
$ | 17,466 | $ | 60,737 | $ | 29,570 | $ | 107,773 | ||||||||
|
|
|
|
|
|
|
|
|
|||||||||
| Twelve Months Ended May 31, 2014 |
||||||||||||||||
| MS | IHT | Quest Integrity | Total | |||||||||||||
| Balance at beginning of year |
$ | 19,131 | $ | 53,800 | $ | 30,535 | $ | 103,466 | ||||||||
| Acquisitions |
— | 10,386 | — | 10,386 | ||||||||||||
| Foreign currency adjustments |
554 | (937 | ) | 294 | (89 | ) | ||||||||||
|
|
|
|
|
|
|
|
|
|||||||||
| Balance at May 31, 2014 |
$ | 19,685 | $ | 63,249 | $ | 30,829 | $ | 113,763 | ||||||||
|
|
|
|
|
|
|
|
|
|||||||||
24
Table of Contents
In November 2010, we purchased 95% of Quest Integrity Group, a leading provider of proprietary in-line inspection and advanced engineering and assessment services. We will purchase the remaining 5% interest (“non-controlling interest”) at a consideration to be determined pursuant to a “Put/Call Agreement” that was executed at the time of the Quest Integrity acquisition. That agreement essentially rewards the 5% stakeholders with 35% of the agreed incremental value of Quest Integrity that is created after the original acquisition. The valuation of Quest Integrity was made at the end of fiscal year 2015 and was determined as a multiple of average EBITDA (earnings before interest, taxes, depreciation and amortization) of Quest Integrity for fiscal years 2014 and 2015, subject to certain adjustments. The incremental purchase price for the non-controlling interests was based upon the average value of Team’s stock over the ninety trading days prior to May 31, 2015. At the end of fiscal year 2015, Quest Integrity’s average EBITDA for fiscal years 2014 and 2015 was $17.6 million and the average closing stock price over the ninety trading days prior to May 31, 2015 was $39.00. Based on the valuation, we estimate that approximately 732,000 Team shares and $5.8 million cash will be issued to acquire the non-controlling interest. These shares are included as dilutive securities in the earnings per share calculation as set forth herein.
Information regarding the change in carrying value of the non-controlling interest is set forth below (in thousands):
| Carrying value of non-controlling interest at May 31, 2014 |
$ | 5,678 | ||
| Income attributable to non-controlling interest |
427 | |||
| Other comprehensive income attributable to non-controlling interest |
(71 | ) | ||
|
|
|
|||
| Carrying value of non-controlling interest at May 31, 2015 |
$ | 6,034 | ||
|
|
|
Income taxes. We follow the guidance of ASC 740, Income Taxes (“ASC 740”) which requires that we use the asset and liability method of accounting for deferred income taxes and provide deferred income taxes for all significant temporary differences. As part of the process of preparing our consolidated financial statements, we are required to estimate our income taxes in each of the jurisdictions in which we operate. This process involves estimating our actual current tax payable and related tax expense together with assessing temporary differences resulting from differing treatment of certain items, such as depreciation, for tax and accounting purposes. These differences can result in deferred tax assets and liabilities, which are included within our consolidated balance sheets.
In accordance with ASC 740, we are required to assess the likelihood that our deferred tax assets will be realized and, to the extent we believe that it is more likely than not (a likelihood of more than 50%) that some portion or all of the deferred tax assets will not be realized, we must establish a valuation allowance. We consider all available evidence to determine whether, based on the weight of the evidence, a valuation allowance is needed. Evidence used includes information about our current financial position and our results of operations for the current and preceding years, as well as all currently available information about future years, including our anticipated future performance, the reversal of existing taxable temporary differences and tax planning strategies.
Management believes future sources of taxable income, reversing temporary differences and other tax planning strategies will be sufficient to realize assets for which no reserve has been established. While we have considered these factors in assessing the need for a valuation allowance, there is no assurance that a valuation allowance would not need to be established in the future if information about future years change. Any change in the valuation allowance would impact our income tax provision and net income in the period in which such a determination is made. As of May 31, 2015, we believe that it is more likely than not that we will have sufficient reversals of temporary differences and future taxable income to allow us to realize the benefits of the net deferred tax assets except for those related to net operating loss carry forwards of certain foreign subsidiaries in the amount of $0.1 million. Our belief is based upon our track record of consistent earnings over the past seven years and projections of future taxable income over the periods in which the future deductible temporary differences become deductible. As of May 31, 2015, our deferred tax assets were $17.5 million, less a valuation allowance of $0.1 million. As of May 31, 2015, our deferred tax liabilities were $23.6 million and our unrecognized tax benefits totaled $0.5 million.
25
Table of Contents
Significant judgment is required in assessing the timing and amounts of deductible and taxable items for tax purposes. In accordance with ASC 740-10, we establish reserves for uncertain tax positions when, despite our belief that our tax return positions are supportable, we believe that certain positions may be challenged and potentially disallowed. When facts and circumstances change, we adjust these reserves through our provision for income taxes. To the extent interest and penalties may be assessed by taxing authorities on any related underpayment of income tax, such amounts have been accrued and are classified as a component of income tax expense in our Consolidated Statements of Income. As of May 31, 2015, our unrecognized tax benefits related to uncertain tax positions were $0.5 million.
Workers’ compensation, auto, medical and general liability accruals. In accordance with ASC 450, Contingencies (“ASC 450”), we record a loss contingency when it is probable that a liability has been incurred and the amount of the loss can be reasonably estimated. We review our loss contingencies on an ongoing basis to ensure that we have appropriate reserves recorded on our balance sheet. These reserves are based on historical experience with claims incurred but not received, estimates and judgments made by management, applicable insurance coverage for litigation matters, and are adjusted as circumstances warrant. For workers’ compensation, our self-insured retention is $1.0 million and our automobile liability self-insured retention is currently $500,000 per occurrence. For general liability claims we have an effective self-insured retention of $3.0 million per occurrence. For medical claims, our self-insured retention is $175,000 per individual claimant determined on an annual basis. For environmental liability claims, our self-insured retention is $500,000 per occurrence. We maintain insurance for claims that exceed such self-retention limits. The insurance is subject to terms, conditions, limitations and exclusions that may not fully compensate us for all losses. Our estimates and judgments could change based on new information, changes in laws or regulations, changes in management’s plans or intentions, or the outcome of legal proceedings, settlements or other factors. If different estimates and judgments were applied with respect to these matters, it is likely that reserves would be recorded for different amounts.
Allowance for doubtful accounts. In the ordinary course of business, a portion of our accounts receivable are not collected due to billing disputes, customer bankruptcies, dissatisfaction with the services we performed and other various reasons. We establish an allowance to account for those accounts receivable that will eventually be deemed uncollectible. The allowance for doubtful accounts is based on a combination of our historical experience and management’s review of long outstanding accounts receivable.
Estimated useful lives. The estimated useful lives of our long-lived assets are used to compute depreciation expense, future asset retirement obligations and are also used in impairment testing. Estimated useful lives are based, among other things, on the assumption that we provide an appropriate level of associated capital expenditures and maintenance while the assets are still in operation. Without these continued associated capital expenditures and maintenance, the useful lives of these assets could decrease significantly. Estimated useful lives could be impacted by such factors as future energy prices, environmental regulations, various legal factors and competition. If the useful lives of these assets were found to be shorter than originally estimated, depreciation expense may increase, liabilities for future asset retirement obligations may be insufficient and impairments in carrying values of tangible and intangible assets may result.
Accounting Principles Not Yet Adopted
ASU No. 2014-09. On May 28, 2014, the FASB issued ASU No. 2014-09, Revenue from Contracts with Customers (“ASU 2014-09”), which requires an entity to recognize the amount of revenue to which it expects to be entitled for the transfer of promised goods or services to customers. The ASU 2014-09 will replace most existing revenue recognition guidance in GAAP when it becomes effective. The new standard is effective for us on June 1, 2018, with early application permitted as of June 1, 2017. ASU 2014-09 permits the use of either the retrospective or cumulative effect transition method. We are evaluating the effect that ASU 2014-09 will have on our consolidated financial statements and related disclosures. We have not yet selected a transition method or determined the effect ASU 2014-09 will have on our ongoing financial reporting.
26
Table of Contents
ASU No. 2015-03. In April 2015, the FASB issued ASU No. 2015-03, Interest—Imputation of Interest: Simplifying the Presentation of Debt Issuance Costs (“ASU 2015-03”), which requires that debt issuance costs be presented as a direct deduction from the carrying amount of the related debt liability, consistent with the presentation of debt discounts. Prior to the issuance of ASU 2015-03, debt issuance costs were required to be presented as other assets, separate from the related debt liability. ASU 2015-03 does not change the recognition and measurement requirements for debt issuance costs. The update is effective for fiscal years beginning after December 15, 2015 on a retrospective basis. The adoption of this update is not expected to have a material impact on our results of operations, financial position or cash flows.
| ITEM 7A. | QUANTITATIVE AND QUALITATIVE DISCLOSURES ABOUT MARKET RISK |
We have operations in foreign countries with a functional currency that is not the U.S. Dollar. We are exposed to market risk, primarily related to foreign currency fluctuations related to these operations. Subsidiaries with asset and liability balances denominated in currencies other than their functional currency are remeasured in the preparation of their financial statements using a combination of current and historical exchange rates, with any resulting remeasurement adjustments included in net income for the period. Net foreign currency transaction losses for the years ended May 31, 2015 and May 31, 2014 were $1.5 million and $0.2 million, respectively. The foreign currency transaction losses realized in fiscal year 2015 relate primarily to the strengthening of the U.S. Dollar in relation to the Euro, Canadian Dollar, Australian Dollar and Mexican Peso.
During the three months ended May 31, 2015, we initiated a foreign currency hedging program to mitigate the foreign currency risk in countries where we have significant assets and liabilities denominated in currencies other than the functional currency. We utilize monthly foreign currency swap contracts to reduce exposures to changes in foreign currency exchange rates related to the Euro, Australian Dollar and Mexican Peso. The impact from these swap contracts were not material as of and for the year ended May 31, 2015.
Translation adjustments for the assets and liability accounts are included as a separate component of accumulated other comprehensive income in shareholders’ equity. Foreign currency translation losses in other comprehensive income were $15.8 million for the year ended May 31, 2015.
Based on fiscal year 2015 foreign currency-based revenues and operating income of $217.0 million and $13.8 million, respectively, a hypothetical 10% adverse change in all applicable foreign currencies would result in an annual change in revenues and operating income of $21.7 million and $1.4 million, respectively.
We carry Euro based debt to serve as a hedge of our net investment in our European operations as fluctuations in the fair value of the borrowing attributable to the U.S. Dollar/Euro spot rate will offset translation gains or losses attributable to our investment in our European operations. We are exposed to market risk, primarily related to foreign currency fluctuations related to the unhedged portion of our investment in our European operations.
Prior to February 1, 2015, we accounted for Venezuelan operations pursuant to accounting guidance for hyperinflationary economies. Following the designation of the Venezuelan economy as hyperinflationary, we ceased recording the effects of currency fluctuations to accumulated other comprehensive income and began reflecting all effects as a component of other income in our statement of operations. At February 1, 2015, our Venezuelan subsidiary had $0.6 million of cash on hand based on the SICAD-2, rate in effect at that date. On February 1, 2015 Team management began reporting the results of our Venezuelan operations using the cost method of accounting due to the other-than-temporary lack of exchangeability in the Venezuelan currency combined with other recent Venezuelan regulations. This resulted in recognition of a pre-tax loss of $1.2 million in fiscal year 2015. Subsequent to year end, we disposed of our Venezuelan operations and realized no gain or loss from the transaction.
We hold certain floating-rate obligations. We are exposed to market risk primarily related to potential increases in interest rates related to our debt.
27
Table of Contents
| ITEM 8. | CONSOLIDATED FINANCIAL STATEMENTS AND SUPPLEMENTARY DATA |
Our financial statements and financial statement schedules, found at the end of this annual report on Form 10-K, are incorporated herein by reference.
| ITEM 9. | CHANGES IN AND DISAGREEMENTS WITH ACCOUNTANTS ON ACCOUNTING AND FINANCIAL DISCLOSURE |
There have been no disagreements concerning accounting and financial disclosures with our independent accountants during any of the periods presented.
| ITEM 9A. | CONTROLS AND PROCEDURES |
Limitations on effectiveness of control. Our management, including the principal executive and financial officer, does not expect that our disclosure controls and procedures or our internal control over financial reporting will prevent or detect all errors and all fraud. A control system, no matter how well designed or operated, can provide only reasonable, not absolute, assurance that the objectives of the control system are met. The design of our control system reflects the fact that there are resource constraints and the benefits of such controls must be considered relative to their costs. Further, because of the inherent limitations in all control systems, no evaluation of controls can provide absolute assurance that all control failures and instances of fraud, if any, have been detected. These inherent limitations include the realities that judgments in decision-making can be faulty and that breakdowns can occur because of simple error or mistake. Additionally, controls can be circumvented by the individual acts, by collusion of two or more people, or by management override of the controls. The design of any system of controls is also based in part on certain assumptions about the likelihood of future events and there can be no assurance that any design will succeed in achieving its stated goals under all potential future conditions. Projections of management’s assessments of the current effectiveness of our disclosure controls and procedures and its internal control over financial reporting are subject to risks. However, our disclosure controls and procedures are designed to provide reasonable assurance that the objectives of our control system are met.
Evaluation of disclosure controls and procedures. As of the end of the period covered by this report, an evaluation was carried out under the supervision and with the participation of our management, including our Chief Executive Officer (“CEO”) and our Chief Financial Officer (“CFO”), of the effectiveness of the design and operation of our disclosure controls and procedures (as defined in Rules 13a-15(e) and 15d-15(e) under the Securities Exchange Act of 1934, as amended (“Exchange Act”)). This evaluation included consideration of the various processes carried out under the direction of our disclosure committee in an effort to ensure that information required to be disclosed in our SEC reports is recorded, processed, summarized and reported within the time periods specified by the SEC. This evaluation also considered the work completed relating to our compliance with Section 404 of the Sarbanes-Oxley Act of 2002.
Based on this evaluation, our CEO and CFO concluded that, as of May 31, 2015, our disclosure controls and procedures were operating effectively to ensure that the information required to be disclosed in our SEC reports is recorded, processed, summarized and reported within the requisite time periods and that such information is accumulated and communicated to management, including our CEO and CFO, as appropriate, to allow timely decisions regarding required disclosure.
Management’s Annual Report on Internal Control Over Financial Reporting
Our management is responsible for establishing and maintaining adequate internal control over financial reporting as defined in Exchange Act Rule 13a-15(f). Our internal control over financial reporting is a process designed to provide reasonable assurance regarding the reliability of financial reporting and the preparation of our consolidated financial statements for external purposes in accordance with U.S. GAAP.
28
Table of Contents
Internal control over financial reporting cannot provide absolute assurance of achieving financial objectives because of its inherent limitations. Internal control over financial reporting is a process that involves human diligence and compliance and is subject to lapses in judgment and breakdowns resulting from human failures. Internal control over financial reporting can also be circumvented by collusion or improper management override. Because of such limitations, there is a risk that material misstatements may not be prevented or detected on a timely basis by internal control over financial reporting. However, these inherent limitations are known features of the financial reporting process. Therefore, it is possible to design into the process safeguards to reduce, though not eliminate, this risk.
We have used the framework set forth in the report entitled Internal Control—Integrated Framework issued by the Committee of Sponsoring Organizations of the Treadway Commission (1992) to evaluate the effectiveness of our internal control over financial reporting. We have concluded that our internal control over financial reporting was effective as of May 31, 2015.
Attestation report of the registered public accounting firm. The attestation report of KPMG LLP, the Company’s independent registered public accounting firm, on the Company’s internal control over financial reporting is set forth in this Annual Report on Form 10-K on page 32.
Changes in internal control over financial reporting. There were no changes in our internal control over financial reporting (as defined in Rules 13a-15(f) and 15d-15(f) of the Securities Exchange Act) that have materially affected or are reasonably likely to materially affect our internal control over financial reporting during the fourth quarter of our fiscal year ended May 31, 2015.
| ITEM 9B. | OTHER INFORMATION |
None.
29
Table of Contents
The information for the following items of Part III has been omitted from this Report on Form 10-K since we will file, not later than 120 days following the close of our fiscal year ended May 31, 2015, our Definitive Proxy Statement. The information required by Part III will be included in that proxy statement and such information is hereby incorporated by reference, with the exception of the information under the headings “Compensation Committee Report” and “Audit Committee Report.”
| ITEM 10. | DIRECTORS, EXECUTIVE OFFICERS AND CORPORATE GOVERNANCE |
| ITEM 11. | EXECUTIVE COMPENSATION |
| ITEM 12. | SECURITY OWNERSHIP OF CERTAIN BENEFICIAL OWNERS AND MANAGEMENT AND RELATED STOCKHOLDER MATTERS |
| ITEM 13. | CERTAIN RELATIONSHIPS AND RELATED TRANSACTIONS, AND DIRECTOR INDEPENDENCE |
| ITEM 14. | PRINCIPAL ACCOUNTING FEES AND SERVICES |
30
Table of Contents
| ITEM 15. | EXHIBITS, FINANCIAL STATEMENT SCHEDULES |
(a) 1. Financial Statements
The financial statements and notes thereto can be found on the following pages:
31
Table of Contents
Report of Independent Registered Public Accounting Firm
The Board of Directors and Shareholders
Team, Inc.:
We have audited Team, Inc. and subsidiaries’ internal control over financial reporting as of May 31, 2015, based on criteria established in Internal Control – Integrated Framework (1992) issued by the Committee of Sponsoring Organizations of the Treadway Commission (COSO). The Company’s management is responsible for maintaining effective internal control over financial reporting and for its assessment of the effectiveness of internal control over financial reporting, included in the accompanying Management’s Annual Report on Internal Control over Financial Reporting. Our responsibility is to express an opinion on the Company’s internal control over financial reporting based on our audit.
We conducted our audit in accordance with the standards of the Public Company Accounting Oversight Board (United States). Those standards require that we plan and perform the audit to obtain reasonable assurance about whether effective internal control over financial reporting was maintained in all material respects. Our audit included obtaining an understanding of internal control over financial reporting, assessing the risk that a material weakness exists, and testing and evaluating the design and operating effectiveness of internal control based on the assessed risk. Our audit also included performing such other procedures as we considered necessary in the circumstances. We believe that our audit provides a reasonable basis for our opinion.
A company’s internal control over financial reporting is a process designed to provide reasonable assurance regarding the reliability of financial reporting and the preparation of financial statements for external purposes in accordance with generally accepted accounting principles. A company’s internal control over financial reporting includes those policies and procedures that (1) pertain to the maintenance of records that, in reasonable detail, accurately and fairly reflect the transactions and dispositions of the assets of the company; (2) provide reasonable assurance that transactions are recorded as necessary to permit preparation of financial statements in accordance with generally accepted accounting principles, and that receipts and expenditures of the company are being made only in accordance with authorizations of management and directors of the company; and (3) provide reasonable assurance regarding prevention or timely detection of unauthorized acquisition, use, or disposition of the company’s assets that could have a material effect on the financial statements.
Because of its inherent limitations, internal control over financial reporting may not prevent or detect misstatements. Also, projections of any evaluation of effectiveness to future periods are subject to the risk that controls may become inadequate because of changes in conditions, or that the degree of compliance with the policies or procedures may deteriorate.
In our opinion, the Company maintained, in all material respects, effective internal control over financial reporting as of May 31, 2015, based on criteria established in Internal Control – Integrated Framework (1992) issued by the Committee of Sponsoring Organizations of the Treadway Commission (COSO).
We also have audited, in accordance with the standards of the Public Company Accounting Oversight Board (United States), the consolidated balance sheets of the Team, Inc. and subsidiaries as of May 31, 2015 and 2014, and the related consolidated statements of income, comprehensive income, shareholders’ equity, and cash flows for each of the years in the three-year period ended May 31, 2015, and our report dated August 7, 2015 expressed an unqualified opinion on those consolidated financial statements.
(signed) KPMG LLP
Houston, Texas
August 7, 2015
32
Table of Contents
Report of Independent Registered Public Accounting Firm
The Board of Directors and Shareholders
Team, Inc.:
We have audited the accompanying consolidated balance sheets of Team, Inc. and subsidiaries as of May 31, 2015 and 2014, and the related consolidated statements of income, comprehensive income, shareholders’ equity, and cash flows for each of the years in the three-year period ended May 31, 2015. These consolidated financial statements are the responsibility of the Company’s management. Our responsibility is to express an opinion on these consolidated financial statements based on our audits.
We conducted our audits in accordance with the standards of the Public Company Accounting Oversight Board (United States). Those standards require that we plan and perform the audit to obtain reasonable assurance about whether the financial statements are free of material misstatement. An audit includes examining, on a test basis, evidence supporting the amounts and disclosures in the financial statements. An audit also includes assessing the accounting principles used and significant estimates made by management, as well as evaluating the overall financial statement presentation. We believe that our audits provide a reasonable basis for our opinion.
In our opinion, the consolidated financial statements referred to above present fairly, in all material respects, the financial position of Team, Inc. and subsidiaries as of May 31, 2015 and 2014, and the results of their operations and their cash flows for each of the years in the three-year period ended May 31, 2015, in conformity with U.S. generally accepted accounting principles.
We also have audited, in accordance with the standards of the Public Company Accounting Oversight Board (United States), Team, Inc.’s internal control over financial reporting as of May 31, 2015, based on criteria established in Internal Control—Integrated Framework (1992) issued by the Committee of Sponsoring Organizations of the Treadway Commission (COSO), and our report dated August 7, 2015 expressed an unqualified opinion on the effectiveness of the Company’s internal control over financial reporting.
(signed) KPMG LLP
Houston, Texas
August 7, 2015
33
Table of Contents
CONSOLIDATED BALANCE SHEETS
(in thousands, except share and per share data)
| May 31, | ||||||||
| 2015 | 2014 | |||||||
| ASSETS | ||||||||
| Current assets: |
||||||||
| Cash and cash equivalents |
$ | 33,211 | $ | 34,656 | ||||
| Receivables, net of allowance of $2,775 and $4,784 |
212,934 | 175,601 | ||||||
| Inventory |
26,005 | 25,537 | ||||||
| Deferred income taxes |
5,926 | 4,717 | ||||||
| Prepaid expenses and other current assets |
10,620 | 8,303 | ||||||
|
|
|
|
|
|||||
| Total current assets |
288,696 | 248,814 | ||||||
| Property, plant and equipment, net |
97,926 | 89,961 | ||||||
| Assets held for sale |
5,207 | 5,207 | ||||||
| Intangible assets, net of accumulated amortization of $15,957 and $12,698 |
20,268 | 23,513 | ||||||
| Goodwill |
107,773 | 113,763 | ||||||
| Other assets, net |
467 | 1,248 | ||||||
| Deferred income taxes |
3,496 | 2,435 | ||||||
|
|
|
|
|
|||||
| Total assets |
$ | 523,833 | $ | 484,941 | ||||
|
|
|
|
|
|||||
| LIABILITIES AND EQUITY | ||||||||
| Current liabilities: |
||||||||
| Accounts payable |
$ | 32,854 | $ | 21,755 | ||||
| Other accrued liabilities |
54,185 | 48,391 | ||||||
| Income taxes payable |
4,185 | 4,997 | ||||||
|
|
|
|
|
|||||
| Total current liabilities |
91,224 | 75,143 | ||||||
| Deferred income taxes |
15,631 | 15,655 | ||||||
| Long-term debt |
78,484 | 73,721 | ||||||
| Other long-term liabilities |
3,119 | 3,377 | ||||||
|
|
|
|
|
|||||
| Total liabilities |
188,458 | 167,896 | ||||||
| Commitments and contingencies |
||||||||
| Equity: |
||||||||
| Preferred stock, 500,000 shares authorized, none issued |
— | — | ||||||
| Common stock, par value $0.30 per share, 60,000,000 shares authorized; 20,909,402 and 20,477,938 shares issued |
6,273 | 6,142 | ||||||
| Additional paid-in capital |
115,642 | 105,872 | ||||||
| Retained earnings |
242,102 | 202,032 | ||||||
| Accumulated other comprehensive loss |
(13,538 | ) | (2,679 | ) | ||||
| Treasury stock at cost, 546,977 and 0 shares |
(21,138 | ) | — | |||||
|
|
|
|
|
|||||
| Total Team shareholders’ equity |
329,341 | 311,367 | ||||||
| Non-controlling interest |
6,034 | 5,678 | ||||||
|
|
|
|
|
|||||
| Total equity |
335,375 | 317,045 | ||||||
|
|
|
|
|
|||||
| Total liabilities and equity |
$ | 523,833 | $ | 484,941 | ||||
|
|
|
|
|
|||||
See accompanying notes to consolidated financial statements.
34
Table of Contents
CONSOLIDATED STATEMENTS OF INCOME
(in thousands, except per share data)
| Twelve Months Ended May 31, | ||||||||||||
| 2015 | 2014 | 2013 | ||||||||||
| Revenues |
$ | 842,047 | $ | 749,527 | $ | 714,311 | ||||||
| Operating expenses |
584,054 | 527,611 | 501,346 | |||||||||
|
|
|
|
|
|
|
|||||||
| Gross margin |
257,993 | 221,916 | 212,965 | |||||||||
| Selling, general and administrative expenses |
189,528 | 171,455 | 158,355 | |||||||||
| Earnings from unconsolidated affiliates |
— | 822 | 992 | |||||||||
| Gain on revaluation of contingent consideration |
— | 2,138 | — | |||||||||
|
|
|
|
|
|
|
|||||||
| Operating income |
68,465 | 53,421 | 55,602 | |||||||||
| Interest expense, net |
2,489 | 2,851 | 2,734 | |||||||||
| Loss on investment in Venezuela |
1,177 | — | — | |||||||||
| Foreign currency loss |
1,509 | 4,185 | 943 | |||||||||
|
|
|
|
|
|
|
|||||||
| Earnings before income taxes |
63,290 | 46,385 | 51,925 | |||||||||
| Less: Provision for income taxes (see Note 9) |
22,793 | 16,236 | 19,211 | |||||||||
|
|
|
|
|
|
|
|||||||
| Net income |
40,497 | 30,149 | 32,714 | |||||||||
| Less: Income attributable to non-controlling interest |
427 | 294 | 278 | |||||||||
|
|
|
|
|
|
|
|||||||
| Net income available to Team shareholders |
$ | 40,070 | $ | 29,855 | $ | 32,436 | ||||||
|
|
|
|
|
|
|
|||||||
| Net income per share: Basic |
$ | 1.95 | $ | 1.46 | $ | 1.61 | ||||||
| Net income per share: Diluted |
$ | 1.85 | $ | 1.40 | $ | 1.53 | ||||||
See accompanying notes to consolidated financial statements.
35
Table of Contents
CONSOLIDATED STATEMENTS OF COMPREHENSIVE INCOME
(in thousands)
| Twelve Months Ended May 31, | ||||||||||||
| 2015 | 2014 | 2013 | ||||||||||
| Net income |
$ | 40,497 | $ | 30,149 | $ | 32,714 | ||||||
| Foreign currency translation adjustment |
(15,822 | ) | (1,613 | ) | 1,070 | |||||||
| Foreign currency hedge |
3,237 | (775 | ) | (674 | ) | |||||||
| Tax benefit attributable to other comprehensive income |
1,655 | 1,498 | 411 | |||||||||
|
|
|
|
|
|
|
|||||||
| Total comprehensive income |
29,567 | 29,259 | 33,521 | |||||||||
| Less: Total comprehensive income attributable to non-controlling interest |
356 | 294 | 287 | |||||||||
|
|
|
|
|
|
|
|||||||
| Total comprehensive income available to Team shareholders |
$ | 29,211 | $ | 28,965 | $ | 33,234 | ||||||
|
|
|
|
|
|
|
|||||||
See accompanying notes to consolidated financial statements.
36
Table of Contents
CONSOLIDATED STATEMENTS OF SHAREHOLDERS’ EQUITY
(in thousands)
| Common Shares |
Treasury Shares |
Common Stock |
Treasury Stock |
Additional Paid in Capital |
Non Controlling Interest |
Retained Earnings |
Accumulated Other Comprehensive Income (Loss) |
Total Shareholders’ Equity |
||||||||||||||||||||||||||||
| Balance at May 31, 2012 |
19,955 | (90 | ) | $ | 5,985 | $ | (1,344 | ) | $ | 85,801 | $ | 5,097 | $ | 152,049 | $ | (2,587 | ) | $ | 245,001 | |||||||||||||||||
| Net income |
— | — | — | — | — | — | 32,714 | — | 32,714 | |||||||||||||||||||||||||||
| Foreign currency translation adjustment, net of tax |
— | — | — | — | — | — | — | 1,200 | 1,200 | |||||||||||||||||||||||||||
| Foreign currency hedge, net of tax |
— | — | — | — | — | — | — | (393 | ) | (393 | ) | |||||||||||||||||||||||||
| Comprehensive income attributable to non-controlling interest |
— | — | — | — | — | 287 | (278 | ) | (9 | ) | — | |||||||||||||||||||||||||
| Non-cash compensation |
— | — | — | — | 3,931 | — | — | — | 3,931 | |||||||||||||||||||||||||||
| Vesting of stock awards |
124 | — | 38 | — | (1,572 | ) | — | — | — | (1,534 | ) | |||||||||||||||||||||||||
| Exercise of stock options |
509 | — | 153 | — | 8,122 | — | — | — | 8,275 | |||||||||||||||||||||||||||
| Tax benefit of exercise of stock options |
— | — | — | — | 2,996 | — | — | — | 2,996 | |||||||||||||||||||||||||||
|
|
|
|
|
|
|
|
|
|
|
|
|
|
|
|
|
|
|
|||||||||||||||||||
| Balance at May 31, 2013 |
20,588 | (90 | ) | 6,176 | (1,344 | ) | 99,278 | 5,384 | 184,485 | (1,789 | ) | 292,190 | ||||||||||||||||||||||||
| Net income |
— | — | — | — | — | — | 30,149 | — | 30,149 | |||||||||||||||||||||||||||
| Foreign currency translation adjustment, net of tax |
— | — | — | — | — | — | — | (400 | ) | (400 | ) | |||||||||||||||||||||||||
| Foreign currency hedge, net of tax |
— | — | — | — | — | — | — | (490 | ) | (490 | ) | |||||||||||||||||||||||||
| Comprehensive income attributable to non-controlling interest |
— | — | — | — | — | 294 | (294 | ) | — | — | ||||||||||||||||||||||||||
| Non-cash compensation |
— | — | — | — | 4,239 | — | — | — | 4,239 | |||||||||||||||||||||||||||
| Vesting of stock awards |
117 | — | 34 | — | (1,744 | ) | — | — | — | (1,710 | ) | |||||||||||||||||||||||||
| Tax benefit of exercise of stock options |
— | — | — | — | 1,131 | — | — | — | 1,131 | |||||||||||||||||||||||||||
| Exercise of stock options |
232 | — | 70 | — | 5,200 | — | — | — | 5,270 | |||||||||||||||||||||||||||
| Purchase of treasury stock |
— | (369 | ) | — | (13,334 | ) | — | — | — | — | (13,334 | ) | ||||||||||||||||||||||||
| Retirement of common stock |
(459 | ) | 459 | (138 | ) | 14,678 | (2,232 | ) | — | (12,308 | ) | — | — | |||||||||||||||||||||||
|
|
|
|
|
|
|
|
|
|
|
|
|
|
|
|
|
|
|
|||||||||||||||||||
| Balance at May 31, 2014 |
20,478 | — | 6,142 | — | 105,872 | 5,678 | 202,032 | (2,679 | ) | 317,045 | ||||||||||||||||||||||||||
| Net income |
— | — | — | — | — | — | 40,497 | — | 40,497 | |||||||||||||||||||||||||||
| Foreign currency translation adjustment, net of tax |
— | — | — | — | — | — | — | (13,263 | ) | (13,263 | ) | |||||||||||||||||||||||||
| Foreign currency hedge, net of tax |
— | — | — | — | — | — | — | 2,333 | 2,333 | |||||||||||||||||||||||||||
| Comprehensive income attributable to non-controlling interest |
— | — | — | — | — | 356 | (427 | ) | 71 | — | ||||||||||||||||||||||||||
| Non-cash compensation |
— | — | — | — | 4,838 | — | — | — | 4,838 | |||||||||||||||||||||||||||
| Vesting of stock awards |
106 | — | 33 | — | (1,808 | ) | — | — | — | (1,775 | ) | |||||||||||||||||||||||||
| Tax benefit of exercise of stock options |
— | — | — | — | 3,034 | — | — | — | 3,034 | |||||||||||||||||||||||||||
| Exercise of stock options |
325 | — | 98 | — | 3,706 | — | — | — | 3,804 | |||||||||||||||||||||||||||
| Purchase of treasury stock |
— | (547 | ) | — | (21,138 | ) | — | — | — | — | (21,138 | ) | ||||||||||||||||||||||||
|
|
|
|
|
|
|
|
|
|
|
|
|
|
|
|
|
|
|
|||||||||||||||||||
| Balance at May 31, 2015 |
20,909 | (547 | ) | $ | 6,273 | $ | (21,138 | ) | $ | 115,642 | $ | 6,034 | $ | 242,102 | $ | (13,538 | ) | $ | 335,375 | |||||||||||||||||
|
|
|
|
|
|
|
|
|
|
|
|
|
|
|
|
|
|
|
|||||||||||||||||||
See accompanying notes to consolidated financial statements.
37
Table of Contents
CONSOLIDATED STATEMENTS OF CASH FLOWS
(in thousands)
| Twelve Months Ended May 31, | ||||||||||||
| 2015 | 2014 | 2013 | ||||||||||
| Cash flows from operating activities: |
||||||||||||
| Net income |
$ | 40,497 | $ | 30,149 | $ | 32,714 | ||||||
| Adjustments to reconcile net income to net cash provided by operating activities: |
||||||||||||
| Earnings from unconsolidated affiliates |
— | (822 | ) | (992 | ) | |||||||
| Depreciation and amortization |
22,787 | 21,468 | 19,664 | |||||||||
| Loss on asset impairment and disposals |
617 | 78 | 193 | |||||||||
| Amortization of deferred loan costs |
223 | 223 | 222 | |||||||||
| Loss on investment in Venezuela |
1,177 | — | — | |||||||||
| Venezuela devaluation |
— | 3,962 | — | |||||||||
| Foreign currency loss |
1,509 | 223 | 943 | |||||||||
| Deferred income taxes |
(729 | ) | (1,040 | ) | 5,089 | |||||||
| Gain on contingent consideration revaluation |
— | (2,138 | ) | — | ||||||||
| Non-cash compensation cost |
4,838 | 4,239 | 3,931 | |||||||||
| (Increase) decrease: |
||||||||||||
| Receivables |
(43,192 | ) | (6,812 | ) | (10,964 | ) | ||||||
| Inventory |
(925 | ) | 822 | (1,405 | ) | |||||||
| Prepaid expenses and other current assets |
(2,525 | ) | (17 | ) | 443 | |||||||
| Increase (decrease): |
||||||||||||
| Accounts payable |
10,789 | (295 | ) | 3,210 | ||||||||
| Other accrued liabilities |
9,377 | (1,208 | ) | 7,779 | ||||||||
| Income taxes |
(972 | ) | 4,029 | (2,184 | ) | |||||||
|
|
|
|
|
|
|
|||||||
| Net cash provided by operating activities |
43,471 | 52,861 | 58,643 | |||||||||
|
|
|
|
|
|
|
|||||||
| Cash flows from investing activities: |
||||||||||||
| Capital expenditures |
(28,769 | ) | (33,016 | ) | (26,068 | ) | ||||||
| Proceeds from sale of assets |
133 | 357 | 758 | |||||||||
| Business acquisitions, net of cash acquired |
(3,075 | ) | (10,175 | ) | (18,589 | ) | ||||||
| Change related to Venezuelan operations |
(620 | ) | — | — | ||||||||
| Distributions from joint venture |
— | 2,223 | 1,000 | |||||||||
| Decrease in other assets, net |
550 | 2 | — | |||||||||
|
|
|
|
|
|
|
|||||||
| Net cash used in investing activities |
(31,781 | ) | (40,609 | ) | (42,899 | ) | ||||||
|
|
|
|
|
|
|
|||||||
| Cash flows from financing activities: |
||||||||||||
| Net (payments) borrowings under revolving credit agreement |
8,000 | — | (13,600 | ) | ||||||||
| Deferred consideration payments |
(1,000 | ) | (1,000 | ) | — | |||||||
| Contingent consideration payments |
(1,000 | ) | — | — | ||||||||
| Payments related to withholding tax for share-based payment arrangements |
(1,775 | ) | (1,710 | ) | (1,534 | ) | ||||||
| Corporate tax effect from share-based payment arrangements |
3,034 | 1,131 | 2,996 | |||||||||
| Issuance of common stock from share-based payment arrangements |
3,804 | 5,270 | 8,275 | |||||||||
| Purchase of treasury stock |
(21,138 | ) | (13,334 | ) | — | |||||||
|
|
|
|
|
|
|
|||||||
| Net cash used in financing activities |
(10,075 | ) | (9,643 | ) | (3,863 | ) | ||||||
| Effect of exchange rate changes on cash |
(3,060 | ) | (2,154 | ) | (157 | ) | ||||||
|
|
|
|
|
|
|
|||||||
| Net increase (decrease) in cash and cash equivalents |
(1,445 | ) | 455 | 11,724 | ||||||||
| Cash and cash equivalents at beginning of year |
34,656 | 34,201 | 22,477 | |||||||||
|
|
|
|
|
|
|
|||||||
| Cash and cash equivalents at end of year |
$ | 33,211 | $ | 34,656 | $ | 34,201 | ||||||
|
|
|
|
|
|
|
|||||||
| Supplemental disclosure of cash flow information: |
||||||||||||
| Cash paid during the year for: |
||||||||||||
| Interest |
$ | 2,028 | $ | 2,728 | $ | 2,615 | ||||||
| Income taxes |
$ | 21,491 | $ | 12,111 | $ | 12,926 | ||||||
See accompanying notes to consolidated financial statements.
38
Table of Contents
NOTES TO CONSOLIDATED FINANCIAL STATEMENTS
1. SUMMARY OF SIGNIFICANT ACCOUNTING POLICIES AND PRACTICES
Description of Business. We are a leading provider of specialty industrial services, including inspection and assessment, required in maintaining high temperature and high pressure piping systems and vessels that are utilized extensively in the refining, petrochemical, power, pipeline and other heavy industries. We conduct operations in three segments: IHT, MS and Quest Integrity. While our services are aligned in three business groups, we believe our services broadly fall into three different classifications that have unique customer demand drivers: inspection and assessment services, turnaround services, and on-stream services.
Inspection and assessment services are offered in both IHT and Quest Integrity. IHT provides basic and advanced non-destructive testing services for the process, pipeline and power sectors, pipeline integrity management services, as well as associated engineering and assessment services. These services can be offered while facilities are running (on-stream), during facility turnarounds or during new construction or expansion activities. Quest Integrity provides integrity and reliability management solutions for the process, pipeline and power sectors. These solutions encompass two broadly-defined disciplines: (1) highly specialized in-line inspection services for unpiggable process piping and pipelines using proprietary in-line inspection tools and analytical software; and (2) advanced condition assessment services through a multi-disciplined engineering team.
Turnaround services are offered in both IHT and MS. These services are project-related and demand is a function of the number and scope of scheduled and unscheduled facility turnarounds as well as new industrial facility construction or expansion. Turnaround services include the field machining, technical bolting, field valve repair, heat exchanger repair, and isolation test plugging services that are part of MS and the field heat treating services that are part of IHT.
On-stream services are offered by MS and represent the services offered while plants are operating and under pressure. These services include leak repair, fugitive emissions control and hot tapping.
We offer these services in over 150 locations throughout the world. We market our services to companies in a diverse array of heavy industries which include the petrochemical, refining, power, pipeline, steel, pulp and paper industries, as well as municipalities, shipbuilding, OEMs, distributors, and some of the world’s largest engineering and construction firms. Our services are also provided across a broad geographic reach.
Our stock is traded on the NYSE under the symbol “TISI”.
Consolidation. The consolidated financial statements include the accounts of Team, Inc. and our majority-owned subsidiaries where we have control over operating and financial policies. Investments in affiliates in which we have the ability to exert significant influence over operating and financial policies, but where we do not control the operating and financial policies, are accounted for using the equity method. All material intercompany accounts and transactions have been eliminated in consolidation. Effective February 1, 2015, we began reporting the results of our Venezuelan operations using the cost method of accounting (see Note 17).
Use of estimates. Our accounting policies conform to GAAP. Our most significant accounting policies are described below. The preparation of consolidated financial statements in conformity with GAAP requires management to make estimates and judgments that affect our reported financial position and results of operations. We review significant estimates and judgments affecting our consolidated financial statements on a recurring basis and record the effect of any necessary adjustments prior to their publication. Estimates and judgments are based on information available at the time such estimates and judgments are made. Adjustments made with respect to the use of these estimates and judgments often relate to information not previously available. Uncertainties with respect to
39
Table of Contents
such estimates and judgments are inherent in the preparation of financial statements. Estimates and judgments are used in, among other things, (1) aspects of revenue recognition, (2) valuation of tangible and intangible assets and subsequent assessments for possible impairment, (3) the fair value of the non-controlling interest in subsidiaries that are not wholly-owned, (4) estimating various factors used to accrue liabilities for workers’ compensation, auto, medical and general liability, (5) establishing an allowance for uncollectible accounts receivable, (6) estimating the useful lives of our assets, (7) assessing future tax exposure and the realization of tax assets and (8) estimating the value associated with contingent consideration payment arrangements.
Fair value of financial instruments. Our financial instruments consist primarily of cash, cash equivalents, accounts receivable, accounts payable and debt obligations. The carrying amount of cash, cash equivalents, trade accounts receivable and trade accounts payable are representative of their respective fair values due to the short-term maturity of these instruments. The fair value of our banking facility is representative of the carrying value based upon the variable terms and management’s opinion that the current rates available to us with the same maturity and security structure are equivalent to that of the banking facility.
Cash and cash equivalents. Cash and cash equivalents consist of all demand deposits and funds invested in highly liquid short-term investments with original maturities of three months or less when purchased.
Inventory. Inventory is stated at the lower of cost (first-in, first-out method) or market. Inventory includes material, labor and certain fixed overhead costs.
Property, plant and equipment. Property, plant and equipment are stated at cost less accumulated depreciation and amortization. Leasehold improvements are amortized over the shorter of their respective useful life or the lease term. Depreciation and amortization of assets are computed by the straight-line method over the following estimated useful lives of the assets:
| Classification |
Useful Life | |||
| Buildings |
20-40 years | |||
| Leasehold improvements |
2-15 years | |||
| Machinery and equipment |
2-12 years | |||
| Furniture and fixtures |
2-10 years | |||
| Computers and computer software |
2-5 years | |||
| Automobiles |
2-5 years | |||
Revenue recognition. We determine our revenue recognition guidelines for our operations based on guidance provided in applicable accounting standards and positions adopted by the FASB and the SEC. Most of our projects are short-term in nature and we predominantly derive revenues by providing a variety of industrial services on a time and material basis. For all of these services our revenues are recognized when services are rendered or when product is shipped to the job site and risk of ownership passes to the customer. However, due to various contractual terms with our customers, at the end of any reporting period, there may be earned but unbilled revenue that is accrued to properly match revenues with related costs. At May 31, 2015 and May 31, 2014, the amount of earned but unbilled revenue included in accounts receivable was $18.4 million and $14.9 million, respectively.
Goodwill, intangible assets and non-controlling interest. Goodwill represents the excess of costs over fair value of assets of businesses acquired. Goodwill and intangible assets acquired in a purchase business combination and determined to have an indefinite useful life are not amortized, but are instead tested for impairment at least annually in accordance with the provisions of the FASB ASC 350, Intangibles—Goodwill and Other. Intangible assets with estimated useful lives are amortized over their respective estimated useful lives to their estimated residual values and reviewed for impairment in accordance with ASC 350. We assess goodwill for impairment at the reporting unit level, which we have determined to be the same as our operating segments. Each reporting unit has goodwill relating to past acquisitions.
40
Table of Contents
Effective July 1, 2013, we implemented a reorganization of our business divisions and now conduct operations in three segments: IHT Group, MS Group and Quest Integrity Group. Each operating segment has goodwill relating to past acquisitions and we assess goodwill for impairment at the operating segment level. Due to the changes in the underlying assumptions surrounding our goodwill testing, during the first quarter of fiscal year 2014, we performed a quantitative analysis of goodwill to test for impairment. The test for impairment is performed at the reporting unit level which is deemed to be at the operating segment level. The test was a two-step process that involved comparing the estimated fair value of each reporting unit to the reporting unit’s carrying value, including goodwill. If the fair value of a reporting unit exceeded its carrying amount, the goodwill of the reporting unit was not considered impaired; therefore, the second step of the impairment test would not be deemed necessary. If the carrying amount of the reporting unit exceeded its fair value, we would then perform a second step to the goodwill impairment test to measure the amount of goodwill impairment loss to be recorded.
The fair value of the reporting units at July 1, 2013 were determined using a method based on discounted cash flow models with estimated cash flows based on internal forecasts of revenue and expenses over a four year period plus a terminal value period (the income approach). The income approach estimated fair value by discounting each reporting unit’s estimated future cash flows using a discount rate that approximated our weighted-average cost of capital. The fair value derived from the income approach, in the aggregate, approximated our market capitalization. At July 1, 2013, our market capitalization exceeded the carrying value of our consolidated net assets by approximately $500 million or 170%, and the fair value of each operating segment significantly exceeded their respective carrying amounts as of that date.
On May 31, 2015 and 2014, we completed our annual goodwill impairment test by performing a qualitative analysis that assessed relevant events and circumstances to evaluate whether it was more likely than not that the fair value of our individual reporting units was less than their respective carrying amount of goodwill. If, after assessing the totality of events and circumstances, an entity determines that it is more likely than not that the fair value of a reporting unit is greater than the carrying amount, then the first and second steps of the goodwill impairment test are not necessary. We evaluated considerations under ASC 350, such as macroeconomic effects on our business, industry and market considerations, cost factors that could have a negative effect on cash flows or earnings, overall financial performance, entity-specific events, events affecting reporting units, and any realization of a sustained decrease in the price of our stock. After consideration of the aforementioned events and circumstances, we concluded that it was more likely than not that the fair value of each reporting unit was greater than its respective carrying amount of goodwill. Accordingly, we did not perform the two-step process described above for our fiscal years 2015 and 2014 annual goodwill impairment testing.
There was $107.8 million and $113.8 million of goodwill at May 31, 2015 and 2014, respectively. A summary of goodwill is as follows (in thousands):
| Twelve Months Ended May 31, 2015 |
||||||||||||||||
| MS | IHT | Quest Integrity | Total | |||||||||||||
| Balance at beginning of year |
$ | 19,685 | $ | 63,249 | $ | 30,829 | $ | 113,763 | ||||||||
| Acquisitions |
103 | — | — | 103 | ||||||||||||
| Foreign currency adjustments |
(2,322 | ) | (2,512 | ) | (1,259 | ) | (6,093 | ) | ||||||||
|
|
|
|
|
|
|
|
|
|||||||||
| Balance at May 31, 2015 |
$ | 17,466 | $ | 60,737 | $ | 29,570 | $ | 107,773 | ||||||||
|
|
|
|
|
|
|
|
|
|||||||||
| Twelve Months Ended May 31, 2014 |
||||||||||||||||
| MS | IHT | Quest Integrity | Total | |||||||||||||
| Balance at beginning of year |
$ | 19,131 | $ | 53,800 | $ | 30,535 | $ | 103,466 | ||||||||
| Acquisitions |
— | 10,386 | — | 10,386 | ||||||||||||
| Foreign currency adjustments |
554 | (937 | ) | 294 | (89 | ) | ||||||||||
|
|
|
|
|
|
|
|
|
|||||||||
| Balance at May 31, 2014 |
$ | 19,685 | $ | 63,249 | $ | 30,829 | $ | 113,763 | ||||||||
|
|
|
|
|
|
|
|
|
|||||||||
41
Table of Contents
In November 2010, we purchased 95% of Quest Integrity Group, LLC, a leading provider of proprietary in-line inspection and advanced engineering and assessment services. We will purchase the remaining 5% interest (“non-controlling interest”) at a consideration to be determined pursuant to a “Put/Call Agreement” that was executed at the time of the Quest Integrity acquisition. That agreement essentially rewards the 5% stakeholders with 35% of the agreed incremental value of Quest Integrity that is created after the original acquisition. The valuation of Quest Integrity was made at the end of fiscal year 2015 and was determined as a multiple of average EBITDA (earnings before interest, taxes, depreciation and amortization) of Quest Integrity for fiscal years 2014 and 2015, subject to certain adjustments. The incremental purchase price for the non-controlling interests was based upon the average value of Team’s stock over the ninety trading days prior to May 31, 2015. At the end of fiscal year 2015, Quest Integrity’s average EBITDA for fiscal years 2014 and 2015 was $17.6 million and the average closing stock price over the ninety trading days prior to May 31, 2015 was $39.00. Based on the valuation, we estimate that approximately 732,000 Team shares and $5.8 million cash will be issued to acquire the non-controlling interest. These shares are included as dilutive securities in the earnings per share calculation as set forth herein.
Information regarding the change in carrying value of the non-controlling interest is set forth below (in thousands):
| Carrying value of non-controlling interest at May 31, 2014 |
$ | 5,678 | ||
| Income attributable to non-controlling interest |
427 | |||
| Other comprehensive income attributable to non-controlling interest |
(71 | ) | ||
|
|
|
|||
| Carrying value of non-controlling interest at May 31, 2015 |
$ | 6,034 | ||
|
|
|
Income taxes. We follow the guidance of ASC 740, which requires that we use the asset and liability method of accounting for deferred income taxes and provide deferred income taxes for all significant temporary differences. As part of the process of preparing our consolidated financial statements, we are required to estimate our income taxes in each of the jurisdictions in which we operate. This process involves estimating our actual current tax payable and related tax expense together with assessing temporary differences resulting from differing treatment of certain items, such as depreciation, for tax and accounting purposes. These differences can result in deferred tax assets and liabilities, which are included within our consolidated balance sheets.
In accordance with ASC 740, we are required to assess the likelihood that our deferred tax assets will be realized and, to the extent we believe that it is more likely than not (a likelihood of more than 50%) that some portion or all of the deferred tax assets will not be realized, we must establish a valuation allowance. We consider all available evidence to determine whether, based on the weight of the evidence, a valuation allowance is needed. Evidence used includes information about our current financial position and our results of operations for the current and preceding years, as well as all currently available information about future years, including our anticipated future performance, the reversal of existing taxable temporary differences and tax planning strategies.
Management believes future sources of taxable income, reversing temporary differences and other tax planning strategies will be sufficient to realize assets for which no reserve has been established. While we have considered these factors in assessing the need for a valuation allowance, there is no assurance that a valuation allowance would not need to be established in the future if information about future years change. Any change in the valuation allowance would impact our income tax provision and net income in the period in which such a determination is made. As of May 31, 2015, we believe that it is more likely than not that we will have sufficient reversals of temporary differences and future taxable income to allow us to realize the benefits of the net deferred tax assets except for those related to net operating loss carry forwards of certain foreign subsidiaries in the amount $0.1 million. Our belief is based upon our track record of consistent earnings over the past seven years and projections of future taxable income over the periods in which the future deductible temporary differences become deductible. As of May 31, 2015, our deferred tax assets were $17.5 million, less a valuation allowance of $0.1 million. As of May 31, 2015, our deferred tax liabilities were $23.6 million and our unrecognized tax benefits totaled $0.5 million.
42
Table of Contents
Significant judgment is required in assessing the timing and amounts of deductible and taxable items for tax purposes. In accordance with ASC 740-10, we establish reserves for uncertain tax positions when, despite our belief that our tax return positions are supportable, we believe that certain positions may be challenged and potentially disallowed. When facts and circumstances change, we adjust these reserves through our provision for income taxes. To the extent interest and penalties may be assessed by taxing authorities on any related underpayment of income tax, such amounts have been accrued and are classified as a component of income tax expense in our Consolidated Statements of Income. As of May 31, 2015, our unrecognized tax benefits related to uncertain tax positions were $0.5 million.
Workers’ compensation, auto, medical and general liability accruals. In accordance with ASC 450, we record a loss contingency when it is probable that a liability has been incurred and the amount of the loss can be reasonably estimated. We review our loss contingencies on an ongoing basis to ensure that we have appropriate reserves recorded on our balance sheet. These reserves are based on historical experience with claims incurred but not received, estimates and judgments made by management, applicable insurance coverage for litigation matters, and are adjusted as circumstances warrant. For workers’ compensation, our self-insured retention is $1.0 million and our automobile liability self-insured retention is currently $500,000 per occurrence. For general liability claims we have an effective self-insured retention of $3.0 million per occurrence. For medical claims, our self-insured retention is $175,000 per individual claimant determined on an annual basis. For environmental liability claims, our self-insured retention is $500,000 per occurrence. We maintain insurance for claims that exceed such self-retention limits. The insurance is subject to terms, conditions, limitations and exclusions that may not fully compensate us for all losses. Our estimates and judgments could change based on new information, changes in laws or regulations, changes in management’s plans or intentions, or the outcome of legal proceedings, settlements or other factors. If different estimates and judgments were applied with respect to these matters, it is likely that reserves would be recorded for different amounts.
Allowance for doubtful accounts. In the ordinary course of business, a portion of our accounts receivable are not collected due to billing disputes, customer bankruptcies, dissatisfaction with the services we performed and other various reasons. We establish an allowance to account for those accounts receivable that will eventually be deemed uncollectible. The allowance for doubtful accounts is based on a combination of our historical experience and management’s review of long outstanding accounts receivable.
Concentration of credit risk. No single customer accounts for more than 10% of consolidated revenues.
Earnings per share. Basic earnings per share is computed by dividing net income available to Team shareholders by the weighted-average number of shares of common stock outstanding during the year. Diluted earnings per share is computed by dividing net income available to Team shareholders, less income or loss for the period attributable to the non-controlling interest, by the sum of, (1) the weighted-average number of shares of common stock outstanding during the period, (2) the dilutive effect of the assumed exercise of share-based compensation using the treasury stock method and (3) the dilutive effect of the assumed conversion of our non-controlling interest to our common stock (see Note 1).
Amounts used in basic and diluted earnings per share, for all periods presented, are as follows (in thousands):
| Twelve Months Ended May 31, |
||||||||||||
| 2015 | 2014 | 2013 | ||||||||||
| Weighted-average number of basic shares outstanding |
20,500 | 20,439 | 20,203 | |||||||||
| Stock options, stock units and performance awards |
419 | 633 | 759 | |||||||||
| Assumed conversion of non-controlling interest |
732 | 213 | 204 | |||||||||
|
|
|
|
|
|
|
|||||||
| Total shares and dilutive securities |
21,651 | 21,285 | 21,166 | |||||||||
|
|
|
|
|
|
|
|||||||
43
Table of Contents
There were no share-based awards outstanding during the twelve month periods ended May 31, 2015, 2014 and 2013, excluded from the computation of diluted earnings per share because the options’ exercise prices were greater than the average market price of common shares during the periods.
Foreign currency. For subsidiaries whose functional currency is not the U.S. Dollar, assets and liabilities are translated at period ending rates of exchange and revenues and expenses are translated at period average exchange rates. Translation adjustments for the asset and liability accounts are included as a separate component of accumulated other comprehensive income in shareholders’ equity. Foreign currency transaction gains and losses are included in our statement of income. Effective December 1, 2009, we began to account for Venezuela as a highly-inflationary economy and the effect of all subsequent currency fluctuations between the Bolivar and the U.S. Dollar are recorded in our statement of income. Subsequently, effective February 1, 2015, we began reporting the results of our Venezuelan operations using the cost method of accounting (see Note 17).
We utilize monthly foreign currency swap contracts to reduce exposures to changes in foreign currency exchange rates related to the Euro, Australian Dollar and Mexican Peso. The impact from these swap contracts was not material as of and for the year ended May 31, 2015.
Accounting Principles Not Yet Adopted
ASU No. 2014-09. On May 28, 2014, the FASB issued ASU No. 2014-09, which requires an entity to recognize the amount of revenue to which it expects to be entitled for the transfer of promised goods or services to customers. The ASU 2014-09 will replace most existing revenue recognition guidance in GAAP when it becomes effective. The new standard is effective for us on June 1, 2018, with early application permitted as of June 1, 2017. ASU 2014-09 permits the use of either the retrospective or cumulative effect transition method. We are evaluating the effect that ASU 2014-09 will have on our consolidated financial statements and related disclosures. We have not yet selected a transition method or determined the effect ASU 2014-09 will have on our ongoing financial reporting.
ASU No. 2015-03. In April 2015, the FASB issued ASU No. 2015-03, which requires that debt issuance costs be presented as a direct deduction from the carrying amount of the related debt liability, consistent with the presentation of debt discounts. Prior to the issuance of ASU 2015-03, debt issuance costs were required to be presented as other assets, separate from the related debt liability. ASU 2015-03 does not change the recognition and measurement requirements for debt issuance costs. The update is effective for fiscal years beginning after December 15, 2015 on a retrospective basis. The adoption of this update is not expected to have a material impact on our results of operation, financial position or cash flows.
2. ACQUISITIONS
In August 2014, we purchased a valve repair company in the U.K. for total consideration of $3.1 million, net of cash acquired of $0.2 million, including estimated contingent consideration of $0.3 million. Our purchase price allocation resulted in $2.1 million being allocated to fixed assets and net working capital and $1.0 million being applied to goodwill and intangible assets.
In July 2013, we purchased a leading provider of industrial rope access services, for total consideration of approximately $12.9 million including net working capital of $1.3 million and $11.6 million allocated to goodwill and intangible assets. We expect $9.2 million of the goodwill recognized to be deductible for tax purposes. The purchase price allocation included contingent consideration valued at $1.9 million. The contingent consideration is based upon the achievement of operating earnings thresholds over a six year period for an amount of up to $4.0 million.
In September 2012, we purchased TCI, a leading provider of inspection and repair services of above ground storage tanks. The TCI acquisition included total consideration of approximately $23.2 million, including net
44
Table of Contents
working capital of $4.1 million, $2.6 million in fixed assets and $16.4 million allocated to goodwill and intangible assets. We expect $6.7 million of the goodwill recognized to be deductible for tax purposes. The purchase price included $5.0 million of deferred consideration and $1.9 million of contingent consideration which we revalued during the second quarter of fiscal year 2014, resulting in the recognition of a non-cash gain of $2.1 million.
In August 2012, we also purchased a specialty remote digital video inspection company in New Zealand for approximately $3 million in cash.
See Note 21 for acquisitions after May 31, 2015.
3. RECEIVABLES
A summary of accounts receivable as of May 31, 2015 and 2014 is as follows (in thousands):
| May 31, | ||||||||
| 2015 | 2014 | |||||||
| Trade accounts receivable |
$ | 197,322 | $ | 165,484 | ||||
| Unbilled revenues |
18,387 | 14,901 | ||||||
| Allowance for doubtful accounts |
(2,775 | ) | (4,784 | ) | ||||
|
|
|
|
|
|||||
| Total |
$ | 212,934 | $ | 175,601 | ||||
|
|
|
|
|
|||||
The allowance for doubtful accounts is our best estimate of the amount of probable credit losses in our existing accounts receivable. Account balances are charged off against the allowance after all means of collection have been exhausted and the potential for recovery is remote. The following summarizes the activity in the allowance for doubtful accounts as of May 31, 2015, 2014 and 2013 (in thousands):
| Twelve Months Ended May 31, | ||||||||||||
| 2015 | 2014 | 2013 | ||||||||||
| Balance at beginning of year |
$ | 4,784 | $ | 5,438 | $ | 4,405 | ||||||
| Provision for doubtful accounts |
233 | 2,140 | 2,922 | |||||||||
| Write-off of bad debts |
(2,242 | ) | (2,794 | ) | (1,889 | ) | ||||||
|
|
|
|
|
|
|
|||||||
| Balance at end of year |
$ | 2,775 | $ | 4,784 | $ | 5,438 | ||||||
|
|
|
|
|
|
|
|||||||
4. INVENTORY
A summary of inventory as of May 31, 2015 and 2014 is as follows (in thousands):
| May 31, | ||||||||
| 2015 | 2014 | |||||||
| Raw materials |
$ | 3,168 | $ | 2,924 | ||||
| Work in progress |
924 | 894 | ||||||
| Finished goods |
21,913 | 21,719 | ||||||
|
|
|
|
|
|||||
| Total |
$ | 26,005 | $ | 25,537 | ||||
|
|
|
|
|
|||||
45
Table of Contents
5. PROPERTY, PLANT AND EQUIPMENT
A summary of property, plant and equipment as of May 31, 2015 and 2014 is as follows (in thousands):
| May 31, | ||||||||
| 2015 | 2014 | |||||||
| Land |
$ | 3,025 | $ | 3,078 | ||||
| Buildings and leasehold improvements |
27,390 | 26,793 | ||||||
| Machinery and equipment |
154,891 | 150,050 | ||||||
| Furniture and fixtures |
5,939 | 5,530 | ||||||
| Capitalized ERP system development costs |
14,524 | 4,655 | ||||||
| Computers and computer software |
7,252 | 6,842 | ||||||
| Automobiles |
3,095 | 3,550 | ||||||
| Construction in progress |
2,934 | 3,123 | ||||||
|
|
|
|
|
|||||
| Total |
219,050 | 203,621 | ||||||
| Accumulated depreciation and amortization |
(121,124 | ) | (113,660 | ) | ||||
|
|
|
|
|
|||||
| Property, plant, and equipment, net |
$ | 97,926 | $ | 89,961 | ||||
|
|
|
|
|
|||||
In the second quarter of fiscal year 2014, we initiated the design and implementation of a new ERP system, which is expected to be fully installed by the end of fiscal year 2017. Amortization of the ERP system development costs will be computed by the straight-line method, commencing in the period when substantial testing is completed and the asset is ready for its intended use. Through the end of fiscal year 2015, we have capitalized $14.5 million associated with the project that includes $0.2 million of capitalized interest.
6. ASSETS HELD FOR SALE
Assets held for sale consists of $5.2 million related to approximately 50 acres of undeveloped land purchased in October 2007. The property was sold on July 29, 2015, for a sales price of $5.3 million.
7. INTANGIBLE ASSETS
A summary of intangible assets as of May 31, 2015 and 2014 is as follows (in thousands):
| May 31, 2015 | May 31, 2014 | |||||||||||||||||||||||
| Gross Carrying Amount |
Accumulated Amortization |
Net Carrying Amount |
Gross Carrying Amount |
Accumulated Amortization |
Net Carrying Amount |
|||||||||||||||||||
| Customer relationships |
$ | 22,612 | $ | (9,111 | ) | $ | 13,501 | $ | 22,424 | $ | (6,739 | ) | $ | 15,685 | ||||||||||
| Non-compete agreements |
3,417 | (3,363 | ) | 54 | 3,667 | (3,430 | ) | 237 | ||||||||||||||||
| Trade names |
4,401 | (1,074 | ) | 3,327 | 4,325 | (717 | ) | 3,608 | ||||||||||||||||
| Technology |
5,112 | (2,230 | ) | 2,882 | 5,112 | (1,698 | ) | 3,414 | ||||||||||||||||
| Licenses |
683 | (179 | ) | 504 | 683 | (114 | ) | 569 | ||||||||||||||||
|
|
|
|
|
|
|
|
|
|
|
|
|
|||||||||||||
| Total |
$ | 36,225 | $ | (15,957 | ) | $ | 20,268 | $ | 36,211 | $ | (12,698 | ) | $ | 23,513 | ||||||||||
|
|
|
|
|
|
|
|
|
|
|
|
|
|||||||||||||
Amortization expense for fiscal years ended May 31, 2015, 2014 and 2013 was $3.8 million, $3.7 million, and $3.4 million, respectively. Amortization expense for current intangible assets is forecasted to be approximately $3 million per year through fiscal year 2020.
46
Table of Contents
8. OTHER ACCRUED LIABILITIES
A summary of other accrued liabilities as of May 31, 2015 and 2014 is as follows (in thousands):
| May 31, | ||||||||
| 2015 | 2014 | |||||||
| Payroll and other compensation expenses |
$ | 35,858 | $ | 28,737 | ||||
| Insurance accruals |
5,712 | 5,897 | ||||||
| Property, sales and other non-income related taxes |
2,840 | 2,381 | ||||||
| Lease commitments |
1,703 | 1,881 | ||||||
| Deferred revenue |
1,116 | 1,198 | ||||||
| Other |
6,956 | 8,297 | ||||||
|
|
|
|
|
|||||
| Total |
$ | 54,185 | $ | 48,391 | ||||
|
|
|
|
|
|||||
9. INCOME TAXES
For the years ended May 31, 2015, 2014 and 2013, we were taxed on income from continuing operations at an effective tax rate of 36%, 35% and 37%, respectively. Our income tax provision for May 31, 2015, 2014 and 2013 was $22.8 million, $16.2 million and $19.2 million, respectively, and includes federal, state and foreign taxes. The components of our tax provision were as follows (in thousands):
| Current | Deferred | Total | ||||||||||
| Year ended May 31, 2015: |
||||||||||||
| U.S. Federal |
$ | 17,183 | $ | 606 | $ | 17,789 | ||||||
| State & local |
2,634 | (141 | ) | 2,493 | ||||||||
| Foreign jurisdictions |
3,598 | (1,087 | ) | 2,511 | ||||||||
|
|
|
|
|
|
|
|||||||
| $ | 23,415 | $ | (622 | ) | $ | 22,793 | ||||||
|
|
|
|
|
|
|
|||||||
| Year ended May 31, 2014: |
||||||||||||
| U.S. Federal |
$ | 11,933 | $ | 358 | $ | 12,291 | ||||||
| State & local |
1,759 | 319 | 2,078 | |||||||||
| Foreign jurisdictions |
3,573 | (1,706 | ) | 1,867 | ||||||||
|
|
|
|
|
|
|
|||||||
| $ | 17,265 | $ | (1,029 | ) | $ | 16,236 | ||||||
|
|
|
|
|
|
|
|||||||
| Year ended May 31, 2013: |
||||||||||||
| U.S. Federal |
$ | 7,947 | $ | 4,873 | $ | 12,820 | ||||||
| State & local |
1,847 | 236 | 2,083 | |||||||||
| Foreign jurisdictions |
4,328 | (20 | ) | 4,308 | ||||||||
|
|
|
|
|
|
|
|||||||
| $ | 14,122 | $ | 5,089 | $ | 19,211 | |||||||
|
|
|
|
|
|
|
|||||||
The components of pre-tax income for the years ended May 31, 2015, 2014 and 2013 were as follows (in thousands):
| Twelve Months Ended May 31, | ||||||||||||
| 2015 | 2014 | 2013 | ||||||||||
| Domestic |
$ | 51,784 | $ | 38,214 | $ | 37,445 | ||||||
| Foreign |
11,506 | 8,171 | 14,480 | |||||||||
|
|
|
|
|
|
|
|||||||
| $ | 63,290 | $ | 46,385 | $ | 51,925 | |||||||
|
|
|
|
|
|
|
|||||||
47
Table of Contents
Income tax expense attributable to income differed from the amounts computed by applying the U.S. Federal income tax rate of 35% to pre-tax income from continuing operations as a result of the following (in thousands):
| Twelve Months Ended May 31, | ||||||||||||
| 2015 | 2014 | 2013 | ||||||||||
| Pre-tax income |
$ | 63,290 | $ | 46,385 | $ | 51,925 | ||||||
|
|
|
|
|
|
|
|||||||
| Computed income taxes at statutory rate |
$ | 22,153 | $ | 16,235 | $ | 18,174 | ||||||
| State income taxes, net of federal benefit |
1,670 | 1,505 | 1,570 | |||||||||
| Foreign tax rate differential |
(1,318 | ) | (1,004 | ) | (1,261 | ) | ||||||
| Production activity deduction |
(136 | ) | (174 | ) | (113 | ) | ||||||
| Deferred taxes on investment in foreign subsidiaries |
819 | (1,133 | ) | 712 | ||||||||
| Non-deductible expenses |
513 | 510 | 473 | |||||||||
| Foreign tax credits |
(11 | ) | (1,942 | ) | (3 | ) | ||||||
| Other tax credits |
(223 | ) | (244 | ) | (337 | ) | ||||||
| Dividend from foreign subsidiaries |
— | 2,062 | — | |||||||||
| Valuation allowance |
(394 | ) | 414 | 65 | ||||||||
| Other |
(280 | ) | 7 | (69 | ) | |||||||
|
|
|
|
|
|
|
|||||||
| Total provision for income tax |
$ | 22,793 | $ | 16,236 | $ | 19,211 | ||||||
|
|
|
|
|
|
|
|||||||
The tax effects of temporary differences that give rise to significant portions of the deferred tax assets and deferred tax liabilities are presented below (in thousands):
| May 31, | ||||||||
| 2015 | 2014 | |||||||
| Deferred tax assets: |
||||||||
| Accrued compensation and benefits |
$ | 5,752 | $ | 3,625 | ||||
| Receivables |
513 | 1,180 | ||||||
| Inventory |
553 | 560 | ||||||
| Stock options |
3,110 | 3,299 | ||||||
| Foreign currency translation and other equity adjustments |
2,897 | 1,242 | ||||||
| Net operating loss carry forwards |
1,198 | 352 | ||||||
| Other |
3,474 | 2,675 | ||||||
|
|
|
|
|
|||||
| Deferred tax assets |
17,497 | 12,933 | ||||||
| Less: Valuation allowance |
(85 | ) | (479 | ) | ||||
|
|
|
|
|
|||||
| Deferred tax assets, net |
17,412 | 12,454 | ||||||
|
|
|
|
|
|||||
| Deferred tax liabilities: |
||||||||
| Property, plant and equipment |
(11,679 | ) | (11,248 | ) | ||||
| Goodwill and intangible costs |
(7,775 | ) | (6,619 | ) | ||||
| Unremitted earnings of foreign subsidiaries |
(2,004 | ) | (1,185 | ) | ||||
| Prepaids |
(1,610 | ) | (1,318 | ) | ||||
| Other |
(552 | ) | (588 | ) | ||||
|
|
|
|
|
|||||
| Deferred tax liabilities |
(23,620 | ) | (20,958 | ) | ||||
|
|
|
|
|
|||||
| Net deferred tax liability |
$ | (6,208 | ) | $ | (8,504 | ) | ||
|
|
|
|
|
|||||
As of May 31, 2015, we had a valuation allowance of $0.1 million to reduce our deferred tax assets to an amount more likely than not to be recovered. This valuation allowance relates to net operating loss carry forwards related to closure of foreign subsidiaries in the amount of $0.1 million. In assessing the realizability of deferred tax assets, we consider whether it is more likely than not that some portion or all of the deferred tax assets will not be realized. The ultimate realization of deferred tax assets is dependent upon the generation of future taxable income
48
Table of Contents
during the periods in which those temporary differences become deductible. We consider the reversal of deferred tax liabilities, projected future taxable income, and tax planning strategies in making this assessment.
As of May 31, 2015, we had net operating loss carry forwards totaling $4.0 million that were expected to be realized in fiscal year 2016. A total of $3.3 million has an unlimited carry forward period and will therefore not expire.
At May 31, 2015, undistributed earnings of foreign operations totaling $17.1 million were considered to be permanently reinvested. We have recognized no deferred tax liability for the remittance of such earnings to the U.S. since it is our intention to utilize those earnings in the foreign operations. Generally, such earnings become subject to U.S. tax upon the remittance of dividends and under certain other circumstances. Determination of the unrecognized deferred U.S. income tax liability is not practicable due to uncertainties related to the timing and source of any potential distribution of such funds, along with other important factors such as the amount of associated foreign tax credits.
At May 31, 2015, we have established liabilities for uncertain tax positions of $0.5 million, inclusive of interest and penalties. To the extent these uncertainties are ultimately resolved favorably, the resulting reduction of recorded liabilities would have an effect on our effective tax rate. In accordance with ASC 740-10, our policy is to recognize interest and penalties related to unrecognized tax benefits through the tax provision.
We file income tax returns in the U.S. with federal and state jurisdictions as well as various foreign jurisdictions. With few exceptions, we are no longer subject to U.S. Federal, state and local or non-U.S. income tax examinations by tax authorities for fiscal years prior to fiscal year 2011. We are currently in the examination phase of IRS audits for the tax years ended May 31, 2011 and May 31, 2012 and expect these audits to be completed within the next six to twelve months. The income tax laws and regulations are voluminous and are often ambiguous. As such, we are required to make certain subjective assumptions and judgments regarding our tax positions that may have a material effect on our results of operations, financial position or cash flows. We believe, however, that there is appropriate support for the income tax positions taken, and to be taken, on our returns, and that our accruals for tax liabilities are adequate for all open tax years based on an assessment of many factors including past experience and interpretations of tax law applied to the facts of each matter.
Set forth below is a reconciliation of the changes in our unrecognized tax benefits associated with uncertain tax positions (in thousands):
| Year Ended May 31, | ||||||||||||
| 2015 | 2014 | 2013 | ||||||||||
| Balance at beginning of year |
$ | 715 | $ | 697 | $ | 624 | ||||||
| Additions based on tax positions related to prior years |
68 | 110 | 191 | |||||||||
| Reductions based on tax positions related to prior years |
(306 | ) | — | — | ||||||||
| Reductions resulting from a lapse of the applicable statute of limitations |
— | (92 | ) | (118 | ) | |||||||
|
|
|
|
|
|
|
|||||||
| Balance at end of year |
$ | 477 | $ | 715 | $ | 697 | ||||||
|
|
|
|
|
|
|
|||||||
We believe that in the next eighteen months it is reasonably possible $0.1 million of liabilities recorded for tax uncertainties will be effectively settled.
Recent Legislation
The Tax Increase Prevention Act of 2014 was signed into law on December 19, 2014 and included an extension for one year of the 50% bonus depreciation allowance. The provision specifically applies to qualifying property placed in service before January 1, 2015. The acceleration of deductions for the year ended May 31, 2015 on qualifying capital expenditures resulting from the bonus depreciation provision had no impact on our current period effective tax rate because the acceleration of deductions does not result in permanent differences
49
Table of Contents
between asset bases for financial reporting purposes and income tax purposes. However, the ability to accelerate depreciation deductions decreased our cash taxes relating to fiscal year 2015 by approximately $1.4 million. Taking the accelerated tax depreciation will result in increased cash taxes in subsequent periods when the deductions for these capital expenditures would have otherwise been taken. The act also reinstated the research and development credit retroactively from January 1, 2014 through December 31, 2014. This change in legislation resulted in a permanent decrease in income tax expense for the year ended May 31, 2015 of $0.2 million.
10. LONG-TERM DEBT, DERIVATIVES AND LETTERS OF CREDIT
Our banking Credit Facility with our banking syndicate had borrowing capacity of up to $150 million in multiple currencies, is secured by virtually all of our domestic assets and a majority of the stock of our foreign subsidiaries and matures in July 2016. In connection with a prior renewal of the Credit Facility, we are amortizing $0.8 million of associated debt issuance costs over the life of the Credit Facility. The Credit Facility bears interest based on a variable Eurodollar rate option (LIBOR plus 1.50% margin at May 31, 2015) and has commitment fees of 0.30% on unused borrowing capacity. At May 31, 2015, we had approximately $58 million of borrowing capacity on our Credit Facility.
Subsequent to year end, we renewed our Credit Facility. The New Credit Facility has borrowing capacity of up to $500 million and consists of a $300 million, five-year revolving loan facility and a $200 million five-year term loan facility, the proceeds of which were used to fund, in part, the Company’s acquisition of the Qualspec Group. The New Credit Facility matures in July 2020 and expands the number of banks in the syndicate from four to seven. The New Credit Facility also contains financial covenants requiring the Company to maintain as of the end of each fiscal quarter (i) a maximum ratio of consolidated funded debt to consolidated EBITDA of not more than 4.00 to 1.00 (until August 31, 2016, at which point the ratio will decrease by 0.25 to 1.00 every other quarter until it reaches 3.00 to 1.00), (ii) a maximum ratio of senior secured debt to consolidated EBITDA of not more than 3.00 to 1.00 and (iii) an interest coverage ratio of less than 3.00 to 1.00. As of May 31, 2015, we are in compliance with these covenants.
In order to secure our casualty insurance programs we are required to post letters of credit generally issued by a bank as collateral. A letter of credit commits the issuer to remit specified amounts to the holder, if the holder demonstrates that we failed to meet our obligations under the letter of credit. If this were to occur, we would be obligated to reimburse the issuer for any payments the issuer was required to remit to the holder of the letter of credit. We were contingently liable for outstanding stand-by letters of credit totaling $12.1 million at May 31, 2015 and $13.6 million at May 31, 2014. Outstanding letters of credit reduce amounts available under our Credit Facility and are considered as having been funded for purposes of calculating our financial covenants under the Credit Facility.
ASC 815, Derivatives and Hedging, established accounting and reporting standards requiring that derivative instruments be recorded at fair value and included in the balance sheet as assets or liabilities. The accounting for changes in the fair value of a derivative instrument depends on the intended use of the derivative and the resulting designation, which is established at the inception date of a derivative. Special accounting for derivatives qualifying as fair value hedges allows derivatives’ gains and losses to offset related results on the hedged item in the statement of income. For derivative instruments designated as cash flow hedges, changes in fair value, to the extent the hedge is effective, are recognized in other comprehensive income until the hedged item is recognized in earnings. Hedge effectiveness is measured at least quarterly based on the relative cumulative changes in fair value between the derivative contract and the hedged item over time. Credit risks related to derivatives include the possibility that the counter-party will not fulfill the terms of the contract. We considered counter-party credit risk to our derivative contracts when valuing our derivative instruments.
Our borrowing of €12.3 million under the Credit Facility serves as an economic hedge of our net investment in our European operations as fluctuations in the fair value of the borrowing attributable to the U.S. Dollar/Euro spot rate will offset translation gains or losses attributable to our investment in our European operations. At May 31, 2015 the €12.3 million borrowing had a U.S. Dollar value of $13.5 million.
50
Table of Contents
The amounts recognized in other comprehensive income, and reclassified into income, for the twelve months ended May 31, 2015 and 2014, are as follows (in thousands):
| Gain (Loss) Recognized in Other Comprehensive Income |
Gain (Loss) Reclassified from Other Comprehensive Income to Earnings |
|||||||||||||||
| Twelve Months Ended May 31, |
Twelve Months Ended May 31, |
|||||||||||||||
| 2015 | 2014 | 2015 | 2014 | |||||||||||||
| Net investment hedge |
$ | (3,237 | ) | $ | (775 | ) | $ | — | $ | — | ||||||
|
|
|
|
|
|
|
|
|
|||||||||
The following table presents the fair value totals and balance sheet classification for derivatives designated as hedges under ASC 815 (in thousands):
| May 31, 2015 | May 31, 2014 | |||||||||||||||
| Classification | Balance Sheet Location |
Fair Value |
Classification | Balance Sheet Location |
Fair Value |
|||||||||||
| Net investment hedge |
Liability | Long-term debt | $ | (4,466 | ) | Liability | Long-term debt | $ | (1,229 | ) | ||||||
|
|
|
|
|
|||||||||||||
11. FAIR VALUE MEASUREMENTS
We apply the provisions of ASC 820, Fair Value Measurements and Disclosures (“ASC 820”), which among other things, requires enhanced disclosures about assets and liabilities carried at fair value.
As defined in ASC 820, fair value is the price that would be received to sell an asset or paid to transfer a liability in an orderly transaction between market participants at the measurement date. We utilize market data or assumptions that market participants would use in pricing the asset or liability, including assumptions about risk and the risks inherent in the inputs to the valuation technique. These inputs can be readily observable, market corroborated, or generally unobservable. We primarily apply the market approach for recurring fair value measurements and endeavor to utilize the best information available. Accordingly, we utilize valuation techniques that maximize the use of observable inputs and minimize the use of unobservable inputs. The use of unobservable inputs is intended to allow for fair value determinations in situations in which there is little, if any, market activity for the asset or liability at the measurement date. We are able to classify fair value balances based on the observability of those inputs. ASC 820 establishes a fair value hierarchy such that “Level 1” measurements include unadjusted quoted market prices for identical assets or liabilities in an active market, “Level 2” measurements include quoted market prices for identical assets or liabilities in an active market which have been adjusted for items such as effects of restrictions for transferability and those that are not quoted but are observable through corroboration with observable market data, including quoted market prices for similar assets, and “Level 3” measurements include those that are unobservable and of a highly subjective measure.
51
Table of Contents
The following table sets forth, by level within the fair value hierarchy, our financial assets and liabilities that are accounted for at fair value on a recurring basis as of May 31, 2015 and 2014. As required by ASC 820, financial assets and liabilities are classified in their entirety based on the lowest level of input that is significant to the fair value measurement (in thousands):
| May 31, 2015 | ||||||||||||||||
| Quoted Prices in Active Markets for Identical Items (Level 1) |
Significant Other Observable Inputs (Level 2) |
Significant Unobservable Inputs (Level 3) |
Total | |||||||||||||
| Liabilities: |
||||||||||||||||
| Contingent consideration |
$ | — | $ | — | $ | 1,407 | $ | 1,407 | ||||||||
| Net investment hedge |
$ | — | $ | (4,466 | ) | $ | — | $ | (4,466 | ) | ||||||
| May 31, 2014 | ||||||||||||||||
| Quoted Prices in Active Markets for Identical Items (Level 1) |
Significant Other Observable Inputs (Level 2) |
Significant Unobservable Inputs (Level 3) |
Total | |||||||||||||
| Liabilities: |
||||||||||||||||
| Contingent consideration |
$ | — | $ | — | $ | 2,015 | $ | 2,015 | ||||||||
| Net investment hedge |
$ | — | $ | (1,229 | ) | $ | — | $ | (1,229 | ) | ||||||
There were no transfers in and out of Level 1, Level 2 or Level 3 during the fiscal years ended 2015 and 2014.
The fair value of contingent consideration liabilities classified in the table above were estimated using a discounted cash flow technique with significant inputs that are not observable in the market and thus represents a Level 3 fair value measurement as defined in ASC 820. The significant inputs in the Level 3 measurement not supported by market activity include a combination of actual cash flows and probability-weighted assessments of expected future cash flows related to the acquired businesses, appropriately discounted considering the uncertainties associated with the obligation, and as calculated in accordance with the terms of the acquisition agreement.
The following table represents the changes in the fair value of Level 3 contingent consideration (in thousands):
| Twelve Months Ended May 31, 2015 |
Twelve Months Ended May 31, 2014 |
|||||||
| Beginning balance |
$ | 2,015 | $ | 2,047 | ||||
| Accretion of liability |
163 | 206 | ||||||
| Foreign currency effects |
(21 | ) | — | |||||
| Payment |
(1,000 | ) | — | |||||
| Revaluation |
— | (2,138 | ) | |||||
| Acquisitions |
250 | 1,900 | ||||||
|
|
|
|
|
|||||
| Ending balance |
$ | 1,407 | $ | 2,015 | ||||
|
|
|
|
|
|||||
12. SHARE-BASED COMPENSATION
We have adopted stock incentive plans and other arrangements pursuant to which our Board of Directors may grant stock options, restricted stock, stock units, stock appreciation rights, common stock or performance awards to officers, directors and key employees. At May 31, 2015, there were approximately 0.8 million stock options, restricted stock units and performance awards outstanding to officers, directors and key employees. The exercise price, terms and other conditions applicable to each form of share-based compensation under our plans are generally determined by the Compensation Committee of our Board at the time of grant and may vary.
52
Table of Contents
Our share-based payments consist primarily of stock options, stock units, common stock and performance awards. The governance of our share-based compensation does not directly limit the number of future awards. However, the total number of shares ultimately issued may not exceed the total number of shares cumulatively authorized, which is 7,120,000 at May 31, 2015. Shares issued in connection with our share-based compensation are issued out of authorized but unissued common stock. Compensation expense related to share-based compensation totaled $4.8 million, $4.2 million, and $3.9 million for the years ended May 31, 2015, 2014, and 2013, respectively. At May 31, 2015, $9.9 million of unrecognized compensation expense related to share-based compensation is expected to be recognized over a remaining weighted-average period of 2.6 years. The tax benefit derived when share-based awards result in a tax deduction for the company was $3.0 million, $1.1 million, and $3.0 million for the years ended May 31, 2015, 2014, and 2013, respectively.
We determine the fair value of each stock option at the grant date using a Black-Scholes model and recognize the resulting expense of our stock option awards over the period during which an employee is required to provide services in exchange for the awards, usually the vesting period. There was no compensation expense related to stock options for the years ended May 31, 2015, 2014 and 2013, as all stock option awards were fully vested. Our options typically vest in equal annual installments over a four year service period. Expense related to an option grant is recognized on a straight line basis over the specified vesting period for those options. Stock options generally have a ten year term. Transactions involving our stock options during the years ended May 31, 2015, 2014, and 2013 are summarized below:
| Year Ended May 31, 2015 |
Year Ended May 31, 2014 |
Year Ended May 31, 2013 |
||||||||||||||||||||||
| No. of Options |
Weighted Average Exercise Price |
No. of Options |
Weighted Average Exercise Price |
No. of Options |
Weighted Average Exercise Price |
|||||||||||||||||||
| (in thousands) | (in thousands) | (in thousands) | ||||||||||||||||||||||
| Shares under option, beginning of year |
816 | $ | 19.61 | 1,052 | $ | 20.24 | 1,562 | $ | 18.95 | |||||||||||||||
| Changes during the year: |
||||||||||||||||||||||||
| Granted |
— | $ | — | — | $ | — | — | $ | — | |||||||||||||||
| Exercised |
(326 | ) | $ | 11.79 | (232 | ) | $ | 22.69 | (509 | ) | $ | 16.25 | ||||||||||||
| Cancelled |
— | $ | — | — | $ | — | (1 | ) | $ | 30.33 | ||||||||||||||
| Expired |
— | $ | — | (4 | ) | $ | 6.96 | — | $ | — | ||||||||||||||
|
|
|
|
|
|
|
|
|
|
|
|
|
|||||||||||||
| Shares under option, end of year |
490 | $ | 24.80 | 816 | $ | 19.61 | 1,052 | $ | 20.24 | |||||||||||||||
| Exercisable at end of year |
490 | $ | 24.80 | 816 | $ | 19.61 | 1,052 | $ | 20.24 | |||||||||||||||
Options exercisable at May 31, 2015 had a weighted-average remaining contractual life of 1.9 years. For total options outstanding at May 31, 2015, the range of exercise prices and remaining contractual lives are as follows:
| Range of Prices |
No. of Options |
Weighted Average Exercise Price |
Weighted Average Remaining Life |
|||||||||
| (in thousands) | (in years) | |||||||||||
| $9.63 to $12.82 |
30 | $ | 12.63 | 1.3 | ||||||||
| $12.83 to $16.03 |
136 | $ | 15.24 | 1.4 | ||||||||
| $16.04 to $32.05 |
324 | $ | 29.92 | 2.2 | ||||||||
|
|
|
|
|
|
|
|||||||
| 490 | $ | 24.80 | 1.9 | |||||||||
|
|
|
|||||||||||
Performance awards are settled with common stock upon vesting unless it is not legally feasible to issue shares, in which case the value of the award is settled in cash. We determine the fair value of each performance award based on the market price on the date of grant. Performance awards granted to our Chairman of our Board vest over the longer of four years or the achievement of performance goals based upon our future results of operations. Compensation expense related to performance awards totaled $0.5 million for the year ended May 31,
53
Table of Contents
2015 and $0.6 million, for the years ended May 31, 2014 and 2013. Transactions involving our performance awards during the years ended May 31, 2015, 2014 and 2013 are summarized below:
| Year Ended May 31, 2015 |
Year Ended May 31, 2014 |
Year Ended May 31, 2013 |
||||||||||||||||||||||
| No. of Performance Awards |
Weighted Average Fair Value |
No. of Performance Awards |
Weighted Average Fair Value |
No. of Performance Awards |
Weighted Average Fair Value |
|||||||||||||||||||
| (in thousands) | (in thousands) | (in thousands) | ||||||||||||||||||||||
| Performance awards, beginning of year |
50 | $ | 30.63 | 57 | $ | 25.47 | 64 | $ | 21.86 | |||||||||||||||
| Changes during the year: |
||||||||||||||||||||||||
| Granted |
— | $ | — | 17 | $ | 36.40 | 19 | $ | 32.89 | |||||||||||||||
| Vested and settled |
(22 | ) | $ | 27.66 | (24 | ) | $ | 22.65 | (26 | ) | $ | 22.04 | ||||||||||||
| Cancelled |
— | $ | — | — | $ | — | — | $ | — | |||||||||||||||
|
|
|
|
|
|
|
|
|
|
|
|
|
|||||||||||||
| Performance awards, end of year |
28 | $ | 32.86 | 50 | $ | 30.63 | 57 | $ | 25.47 | |||||||||||||||
|
|
|
|
|
|
|
|||||||||||||||||||
Under a new performance stock unit award program adopted on November 4, 2014, Long-Term Performance Stock Unit (“LTPSU”) awards granted to our Executive Officers are subject to a three year performance period and a concurrent three year service period. Under this program, the Company communicates “target awards” to the Executive Officers at the beginning of a performance period. The performance target is based on results of operations over the three year performance period with possible payouts ranging from 0% to 300% of the “target awards”. LTPSU awards cliff vest with achievement of the performance goals and completion of the three year service period. Settlement occurs with common stock within 20 business days of vesting. We determine the fair value of each LTPSU award based on the market price on the date of grant. Compensation expense is recognized on a straight-line basis over the vesting term of three years based upon the probable performance target that will be met. Compensation expense of $0.2 million related to performance awards was recognized for the year ended May 31, 2015. Transactions involving our performance awards during the years ended May 31, 2015, 2014 and 2013 are summarized below:
| Year Ended May 31, 2015 |
Year Ended May 31, 2014 |
Year Ended May 31, 2013 |
||||||||||||||||||||||
| No. of Long- Term Performance Stock Units |
Weighted Average Fair Value |
No. of Long- Term Performance Stock Units |
Weighted Average Fair Value |
No. of Long- Term Performance Stock Units |
Weighted Average Fair Value |
|||||||||||||||||||
| (in thousands) | (in thousands) | (in thousands) | ||||||||||||||||||||||
| Long-term performance stock units, beginning of year |
— | $ | — | — | $ | — | — | $ | — | |||||||||||||||
| Changes during the year: |
||||||||||||||||||||||||
| Granted |
23 | $ | 42.25 | — | $ | — | — | $ | — | |||||||||||||||
| Vested and settled |
— | $ | — | — | $ | — | — | $ | — | |||||||||||||||
| Cancelled |
— | $ | — | — | $ | — | — | $ | — | |||||||||||||||
|
|
|
|
|
|
|
|
|
|
|
|
|
|||||||||||||
| Long-term performance stock units, end of year |
23 | $ | 42.25 | — | $ | — | — | $ | — | |||||||||||||||
|
|
|
|
|
|
|
|||||||||||||||||||
54
Table of Contents
Stock units are settled with common stock upon vesting unless it is not legally feasible to issue shares, in which case the value of the award is settled in cash. We determine the fair value of each stock unit based on the market price on the date of grant. Stock units generally vest in annual installments over four years and the expense associated with the units is recognized over the same vesting period. We also grant common stock to our directors which typically vest immediately. Compensation expense related to stock units and director stock grants totaled $4.1 million, $3.7 million and $3.3 million for the years ended May 31, 2015, 2014 and 2013, respectively. Transactions involving our stock units and director stock grants during the years ended May 31, 2015, 2014 and 2013 are summarized below:
| Year Ended May 31, 2015 |
Year Ended May 31, 2014 |
Year Ended May 31, 2013 |
||||||||||||||||||||||
| No. of Stock Units |
Weighted Average Fair Value |
No. of Stock Units |
Weighted Average Fair Value |
No. of Stock Units |
Weighted Average Fair Value |
|||||||||||||||||||
| (in thousands) | (in thousands) | (in thousands) | ||||||||||||||||||||||
| Stock and stock units, beginning of year |
310 | $ | 31.42 | 329 | $ | 26.07 | 342 | $ | 21.73 | |||||||||||||||
| Changes during the year: |
||||||||||||||||||||||||
| Granted |
156 | $ | 39.51 | 136 | $ | 36.70 | 141 | $ | 32.81 | |||||||||||||||
| Vested and settled |
(133 | ) | $ | 29.23 | (139 | ) | $ | 24.32 | (143 | ) | $ | 22.53 | ||||||||||||
| Cancelled |
(29 | ) | $ | 34.12 | (16 | ) | $ | 28.01 | (11 | ) | $ | 23.58 | ||||||||||||
|
|
|
|
|
|
|
|
|
|
|
|
|
|||||||||||||
| Stock and stock units, end of year |
304 | $ | 36.23 | 310 | $ | 31.42 | 329 | $ | 26.07 | |||||||||||||||
|
|
|
|
|
|
|
|||||||||||||||||||
13. EMPLOYEE BENEFIT PLANS
Under the Team, Inc. Salary Deferral Plan (the “Plan”), contributions are made to the Plan by qualified employees at their election and our matching contributions to the Plan are made at specified rates. Our contributions to the Plan in fiscal years 2015, 2014 and 2013, were approximately $4.8 million, $4.4 million and $3.7 million, respectively, and are included in selling, general and administrative expenses.
14. COMMITMENTS AND CONTINGENCIES
Con Ed Matter—We have, from time to time, provided temporary leak repair services for the steam operations of Con Ed located in New York City. In July 2007, a Con Ed steam main located in midtown Manhattan ruptured causing one death and other injuries and property damage. As of May 31, 2015, ninety-two lawsuits are currently pending against Con Ed, the City of New York and Team in the Supreme Courts of New York located in Kings, New York and Bronx County, alleging that our temporary leak repair services may have contributed to the cause of the rupture. The lawsuits seek generally unspecified compensatory damages for personal injury, property damage and business interruption. Additionally, on March 31, 2008, we received a letter from Con Ed alleging that our contract with Con Ed requires us to indemnify and defend Con Ed for additional claims filed against Con Ed as a result of the rupture. Con Ed filed an action to join Team and the City of New York as defendants in all lawsuits filed against Con Ed that did not include Team and the City of New York as direct defendants. We are vigorously defending the lawsuits and Con Ed’s claim for indemnification. We are unable to estimate the amount of liability to us, if any, associated with these lawsuits and the claim for indemnification. We maintain insurance coverage, subject to a deductible limit of $250,000, which we believe should cover these claims. We have not accrued any liability in excess of the deductible limit for the lawsuits. We do not believe the ultimate outcome of these matters will have a material adverse effect on our financial position, results of operations, or cash flows.
In December 2014, our subsidiary, Quest Integrity, filed three patent infringement lawsuits against three different defendants, two in the US District of Delaware (“Delaware Cases”) and one in US District of Western Washington (“Washington Case”). Quest Integrity alleges that the three defendants infringed Quest Integrity’s patent, entitled “2D and 3D Display System and Method for Furnace Tube Inspection”. This Quest Integrity patent generally teaches a system and method for displaying inspection data collected during the inspection of
55
Table of Contents
furnace tubes in petroleum and petro-chemical refineries. The subject patent litigation is specific to the visual display of the collected data and does not relate to Quest Integrity’s underlying advanced inspection technology. In these lawsuits Quest Integrity is seeking temporary and permanent injunctive relief, as well as money damages. Defendants have denied they infringe any valid claim of Quest Integrity’s patent, and have asserted declaratory judgment counterclaims that the patent at issue is invalid and/or unenforceable, and not infringed. In June 2015, the US District of Delaware denied our motions for preliminary injunctive relief in the Delaware Cases (that is, our request that the defendants stop using our patented systems and methods during the pendency of the actions); the Delaware Cases are expected to proceed to trial on our claims during the second calendar quarter of 2016. The preliminary injunction hearing for the Washington Case is expected to occur in the first half of calendar 2016.
We are involved in various other lawsuits and are subject to various claims and proceedings encountered in the normal conduct of business. In our opinion, any uninsured losses that might arise from these lawsuits and proceedings will not have a materially adverse effect on our consolidated financial statements.
15. ENTITY WIDE DISCLOSURES
ASC 280, Segment Reporting, requires we disclose certain information about our operating segments where operating segments are defined as “components of an enterprise about which separate financial information is available that is evaluated regularly by the chief operating decision maker in deciding how to allocate resources and in assessing performance.” Effective July 1, 2013, we implemented a reorganization of our business divisions to conduct operations in three segments: IHT Group, MS Group and Quest Integrity Group. All three operating segments operate under a business segment manager who reports directly to Team’s Chief Executive Officer who operates as the chief operating decision maker. Segment data for our three operating segments are as follows (in thousands):
| Twelve Months Ended May 31, | ||||||||||||
| 2015 | 2014 | 2013 | ||||||||||
| Revenues: |
||||||||||||
| IHT |
$ | 467,099 | $ | 408,259 | $ | 380,518 | ||||||
| MS |
300,456 | 275,322 | 276,360 | |||||||||
| Quest Integrity |
74,492 | 65,946 | 57,433 | |||||||||
|
|
|
|
|
|
|
|||||||
| Total |
$ | 842,047 | $ | 749,527 | $ | 714,311 | ||||||
|
|
|
|
|
|
|
|||||||
| Twelve Months Ended May 31, | ||||||||||||
| 2015 | 2014 | 2013 | ||||||||||
| Operating income: |
||||||||||||
| IHT |
$ | 60,198 | $ | 47,787 | $ | 45,307 | ||||||
| MS |
28,713 | 26,177 | 29,228 | |||||||||
| Quest Integrity |
13,196 | 9,260 | 9,400 | |||||||||
| Corporate and shared support services |
(33,642 | ) | (29,803 | ) | (28,333 | ) | ||||||
|
|
|
|
|
|
|
|||||||
| Total |
$ | 68,465 | $ | 53,421 | $ | 55,602 | ||||||
|
|
|
|
|
|
|
|||||||
| Twelve Months Ended May 31, | ||||||||||||
| 2015 | 2014 | 2013 | ||||||||||
| Capital expenditures: |
||||||||||||
| IHT |
$ | 10,276 | $ | 8,104 | $ | 8,042 | ||||||
| MS |
4,916 | 6,114 | 8,401 | |||||||||
| Quest Integrity |
2,961 | 4,366 | 5,384 | |||||||||
| Corporate and shared support services |
10,616 | 14,432 | 4,241 | |||||||||
|
|
|
|
|
|
|
|||||||
| Total |
$ | 28,769 | $ | 33,016 | $ | 26,068 | ||||||
|
|
|
|
|
|
|
|||||||
56
Table of Contents
| Twelve Months Ended May 31, | ||||||||||||
| 2015 | 2014 | 2013 | ||||||||||
| Depreciation and amortization: |
||||||||||||
| IHT |
$ | 8,413 | $ | 7,953 | $ | 7,673 | ||||||
| MS |
7,583 | 7,208 | 7,007 | |||||||||
| Quest Integrity |
5,704 | 5,475 | 4,417 | |||||||||
| Corporate and shared support services |
1,087 | 832 | 567 | |||||||||
|
|
|
|
|
|
|
|||||||
| Total |
$ | 22,787 | $ | 21,468 | $ | 19,664 | ||||||
|
|
|
|
|
|
|
|||||||
Separate measures of Team’s assets by operating segment are not produced or utilized by management to evaluate segment performance.
A geographic breakdown of our revenues and total assets are as follows for the fiscal years ended May 31, 2015, 2014 and 2013 (in thousands):
| Total Revenues |
Total Assets |
|||||||
| FY 2015 |
||||||||
| United States |
$ | 625,044 | $ | 399,173 | ||||
| Canada |
132,573 | 68,043 | ||||||
| Europe |
47,524 | 34,612 | ||||||
| Other foreign countries |
36,906 | 22,005 | ||||||
|
|
|
|
|
|||||
| Total |
$ | 842,047 | $ | 523,833 | ||||
|
|
|
|
|
|||||
| FY 2014 |
||||||||
| United States |
$ | 540,967 | $ | 353,624 | ||||
| Canada |
126,874 | 68,515 | ||||||
| Europe |
42,248 | 38,870 | ||||||
| Other foreign countries |
39,438 | 23,932 | ||||||
|
|
|
|
|
|||||
| Total |
$ | 749,527 | $ | 484,941 | ||||
|
|
|
|
|
|||||
| FY 2013 |
||||||||
| United States |
$ | 508,928 | $ | 334,579 | ||||
| Canada |
135,527 | 68,164 | ||||||
| Europe |
37,787 | 35,734 | ||||||
| Other foreign countries |
32,069 | 21,726 | ||||||
|
|
|
|
|
|||||
| Total |
$ | 714,311 | $ | 460,203 | ||||
|
|
|
|
|
|||||
16. UNCONSOLIDATED SUBSIDIARIES
Our earnings from unconsolidated affiliates consisted entirely of our joint venture (50% ownership) to perform non-destructive testing and inspection services in Alaska. At December 31, 2013 the joint venture was dissolved and the net assets were liquidated resulting in no material gain or loss. However, the operations of the joint venture have been continued by our IHT division. Revenues from the joint venture not reflected in our consolidated revenues were zero and $8.5 million for the fiscal years ended May 31, 2015 and 2014, respectively.
17. VENEZUELAN OPERATIONS
Subsequent to year end, we disposed of our Venezuelan operations and realized no gain or loss from the transaction. Our annual revenues have historically been less than one percent of our consolidated revenues for all periods presented. Because of the uncertain political environment in Venezuela, starting in the third quarter of fiscal
57
Table of Contents
year 2010, we began to account for Venezuelan operations pursuant to accounting guidance for hyperinflationary economies. Following the designation of the Venezuelan economy as hyperinflationary, we ceased taking the effects of currency fluctuations to accumulated other comprehensive income and began reflecting all effects as a component of other income in our statement of operations.
In the third quarter of fiscal year 2014, we began using an alternative Venezuelan, state-run exchange rate, commonly referred to as SICAD-1, to translate local currency financial statements. As a result of the revaluation, we recognized a $1.9 million foreign currency loss in the third quarter of fiscal year 2014. In March 2014, a market-based, state-run exchange, commonly referred to as SICAD-2, was initiated by the Central Bank of Venezuela. As of the beginning of the fourth quarter of fiscal year 2014, Team began using the nascent market-based, state-run exchange rate, commonly referred to as SICAD-2 (approximately 50 Bolivars to the U.S. Dollar) to translate local currency financial statements, changing from the SICAD-1 rate (which fluctuated between 10 and 11.8 Bolivars per U.S. Dollar). As a result, Team incurred an additional $2.1 million currency exchange loss associated with a further revaluation of our Venezuelan business in the fourth quarter of fiscal year 2014.
Prior to February 1, 2015, we included the results of our Venezuelan operations in our consolidated financial statements using the consolidation method of accounting. Venezuelan exchange control regulations have resulted in an other-than-temporary lack of exchangeability between the Venezuelan Bolivar and U.S. Dollar, and have restricted our Venezuelan operations’ ability to pay dividends and obligations denominated in U.S. Dollars. These exchange regulations, combined with other recent Venezuelan regulations, have constrained equipment availability and are now significantly limiting our Venezuelan operations’ ability to maintain normal operations. As a result of these conditions, and in accordance with ASC 810, Consolidation, we began reporting the results of our Venezuelan operations using the cost method of accounting. The change, which we made effective February 1, 2015, resulted in a pre-tax charge of $1.2 million in fiscal year 2015.
18. ACCUMULATED OTHER COMPREHENSIVE INCOME
A summary of changes in accumulated other comprehensive income included within shareholders’ equity is as follows (in thousands):
| Twelve Months Ended May 31, 2015 |
Twelve Months Ended May 31, 2014 |
|||||||||||||||||||||||||||||||
| Foreign Currency Translation Adjustments |
Foreign Currency Hedge |
Tax Provision |
Total | Foreign Currency Translation Adjustments |
Foreign Currency Hedge |
Tax Provision |
Total | |||||||||||||||||||||||||
| Balance at beginning of year |
$ | (5,145 | ) | $ | 1,229 | $ | 1,237 | $ | (2,679 | ) | $ | (3,532 | ) | $ | 2,004 | $ | (261 | ) | $ | (1,789 | ) | |||||||||||
| Other comprehensive income before tax |
(15,822 | ) | 3,237 | 1,655 | (10,930 | ) | (1,613 | ) | (775 | ) | 1,498 | (890 | ) | |||||||||||||||||||
| Non-controlling interest |
71 | — | — | 71 | — | — | — | — | ||||||||||||||||||||||||
|
|
|
|
|
|
|
|
|
|
|
|
|
|
|
|
|
|||||||||||||||||
| Balance at end of year |
$ | (20,896 | ) | $ | 4,466 | $ | 2,892 | $ | (13,538 | ) | $ | (5,145 | ) | $ | 1,229 | $ | 1,237 | $ | (2,679 | ) | ||||||||||||
|
|
|
|
|
|
|
|
|
|
|
|
|
|
|
|
|
|||||||||||||||||
The following table represents the related tax effects allocated to each component of accumulated other comprehensive income (in thousands):
| Twelve Months Ended May 31, 2015 |
Twelve Months Ended May 31, 2014 |
Twelve Months Ended May 31, 2013 |
||||||||||||||||||||||||||||||||||
| Gross Amount |
Tax Effect |
Net Amount |
Gross Amount |
Tax Effect |
Net Amount |
Gross Amount |
Tax Effect |
Net Amount |
||||||||||||||||||||||||||||
| Foreign currency translation adjustments |
$ | (15,822 | ) | $ | 2,559 | $ | (13,263 | ) | $ | (1,613 | ) | $ | 1,213 | $ | (400 | ) | $ | 1,070 | $ | 130 | $ | 1,200 | ||||||||||||||
| Foreign currency hedge |
3,237 | (904 | ) | 2,333 | (775 | ) | 285 | (490 | ) | (674 | ) | 281 | (393 | ) | ||||||||||||||||||||||
|
|
|
|
|
|
|
|
|
|
|
|
|
|
|
|
|
|
|
|||||||||||||||||||
| Total |
$ | (12,585 | ) | $ | 1,655 | $ | (10,930 | ) | $ | (2,388 | ) | $ | 1,498 | $ | (890 | ) | $ | 396 | $ | 411 | $ | 807 | ||||||||||||||
|
|
|
|
|
|
|
|
|
|
|
|
|
|
|
|
|
|
|
|||||||||||||||||||
58
Table of Contents
19. REPURCHASE OF COMMON STOCK
On October 1, 2013, our Board approved an initial $25 million stock repurchase plan, superseding and replacing our previous stock repurchase plan. During the second quarter of fiscal year 2014, we repurchased 369,900 shares for a total cost of $13.3 million. These shares, along with 89,569 shares purchased under a previous plan in a prior period at a cost of $1.3 million, were retired and are not included in common stock issued and outstanding as of May 31, 2014. The retirement of the shares purchased resulted in a reduction in common stock of $0.1 million, a reduction of $2.2 million to additional paid-in capital, and a $12.3 million reduction in retained earnings.
On June 23, 2014, our Board authorized an increase in the stock repurchase plan limit to $50 million (net of the $13.3 million repurchased in the second quarter of fiscal year 2014). During fiscal year 2015, we repurchased 546,977 shares for a total cost of $21.1 million. At May 31, 2015, $15.5 million remained available to repurchase shares under the stock repurchase plan.
20. SELECTED QUARTERLY FINANCIAL DATA
The following is a summary of selected unaudited quarterly financial data for the years ended May 31, 2015 and 2014 (in thousands, except per share data):
| Year Ended May 31, 2015 | ||||||||||||||||||||
| First Quarter |
Second Quarter |
Third Quarter |
Fourth Quarter |
Total Year |
||||||||||||||||
| Revenues |
$ | 188,121 | $ | 240,619 | $ | 174,589 | $ | 238,718 | $ | 842,047 | ||||||||||
| Operating income |
$ | 11,825 | $ | 28,674 | $ | 2,926 | $ | 25,040 | $ | 68,465 | ||||||||||
| Net income available to Team shareholders |
$ | 7,031 | $ | 17,366 | $ | 304 | $ | 15,369 | $ | 40,070 | ||||||||||
| Net income per share: Basic |
$ | 0.34 | $ | 0.84 | $ | 0.01 | $ | 0.76 | $ | 1.95 | ||||||||||
| Net income per share: Diluted |
$ | 0.33 | $ | 0.80 | $ | 0.01 | $ | 0.72 | $ | 1.85 | ||||||||||
| Year Ended May 31, 2014 | ||||||||||||||||||||
| First Quarter |
Second Quarter |
Third Quarter |
Fourth Quarter |
Total Year |
||||||||||||||||
| Revenues |
$ | 174,311 | $ | 200,493 | $ | 163,236 | $ | 211,487 | $ | 749,527 | ||||||||||
| Operating income |
$ | 8,105 | $ | 23,881 | $ | 1,000 | $ | 20,435 | $ | 53,421 | ||||||||||
| Net income (loss) available to Team shareholders |
$ | 4,510 | $ | 14,425 | $ | (1,010 | ) | $ | 11,930 | $ | 29,855 | |||||||||
| Net income (loss) per share: Basic |
$ | 0.22 | $ | 0.71 | $ | (0.05 | ) | $ | 0.58 | $ | 1.46 | |||||||||
| Net income (loss) per share: Diluted |
$ | 0.21 | $ | 0.68 | $ | (0.05 | ) | $ | 0.56 | $ | 1.40 | |||||||||
21. SUBSEQUENT EVENTS
On June 1, 2015, we purchased an advanced valve leader located in Long Beach, California, with a portfolio of projects from various sectors including oil and gas refining, pipelines and power generation for a total cash consideration of $10.3 million. The agreement also includes an earn-out consideration based upon the achievement of certain performance targets over a three year period for an amount of up to $4.0 million.
On July 6, 2015, we executed a stock purchase agreement to acquire Qualspec for total cash consideration of $255.0 million, which could be increased by $10.0 million depending upon the operating results of Qualspec through the end of calendar year 2015. Qualspec is a leading provider of NDT Inspection services in the United States, with significant operations in the West Coast, Gulf Coast and Mid-Western areas of the country. The acquisition adds about $180.0 million of annual revenue to our operations and nearly 1,000 new employees to our human capital resources. The purchase of Qualspec was financed through proceeds received under our New Credit Facility.
59
Table of Contents
3. Exhibits
| Exhibit Number |
||
| 3.1 | Amended and Restated Articles of Incorporation of the Company (filed as Exhibit 3.1 to the Company’s Current Report on Form 8-K filed on December 2, 2011). | |
| 3.2 | Amended and Restated Bylaws of the Company (filed as Exhibit 3.1 to the Company’s Quarterly Report on Form 10-Q filed on April 4, 2014). | |
| 4.1 | Certificate representing shares of common stock of Company (filed as Exhibit 4(1) to the Company’s Registration Statement on Form S-1, File No. 2-68928). | |
| 10.1† | Team, Inc. 2004 Restricted Stock Option and Award Plan dated June 24, 2004 (filed as Exhibit 10.21 to the Company’s Annual Report on Form 10-K for the year ended May 31, 2004). | |
| 10.2† | Team, Inc. 2006 Stock Incentive Plan (as Amended and Restated August 1, 2009) (filed as Exhibit 10.1 to the Company’s Current Report on Form 8-K filed on September 30, 2009). | |
| 10.3† | Form of Stock Unit Agreement (filed as Exhibit 10.2 to the Company’s Current Report on Form 8-K filed on October 17, 2008). | |
| 10.4† | Form of Performance-Based Stock Unit Agreement (filed as Exhibit 10.3 to the Company’s Current Report on Form 8-K filed on October 17, 2008). | |
| 10.5† | Form of Performance Share Award Agreement (filed as Exhibit 10.1 to the Company’s Current Report on Form 8-K filed November 4, 2014). | |
| 10.6 | Form of Membership Interest Purchase Agreement dated November 2, 2010, by and among Team, Inc., TQ Acquisition, Inc. and each of the other members of Quest Integrity Group, LLC listed on Exhibit A to the Membership Interest Purchase Agreement dated November 2, 2010, by and among Team, Inc., TQ Acquisition, Inc., Quest Integrity Group, LLC, and John Zink Holdings, Inc., Ring Mountain Capital, LLC, Quest Integrated, Inc., Alexius Group II, LLC, Milton J. Altenberg and Todd Katz (filed as Exhibit 2.2 to the Company’s Current Report on Form 8-K filed on November 3, 2010). | |
| 10.7 | Form of Amended and Restated Put-Call Option Agreement dated April 7, 2014 (filed as Exhibit 10.1 to the Company’s Quarterly Report on Form 10-Q filed on April 4, 2014). | |
| 10.8 | Guaranty, dated as of November 2, 2010, made by KG Holding, LLC for the benefit of Team, Inc. (filed as Exhibit 10.2 to the Company’s Current Report on Form 8-K filed on November 3, 2010). | |
| 10.9 | First Amendment to the Amended and Restated Put/Call Option Agreement dated May 26, 2015 by and between Team, Inc. and the Class B Stockholders (filed as Exhibit 10.1 to the Company’s Current Report on Form 8-K filed May 27, 2015). | |
| 10.10 | Guaranty, dated as of November 2, 2010, made by Jeffrey L. Ott for the benefit of Team, Inc. (filed as Exhibit 10.4 to the Company’s Current Report on Form 8-K filed on November 3, 2010). | |
| 10.11 | Second Amended and Restated Credit Agreement dated July 22, 2011 among Team, Inc. as the borrower, Bank of America, NA as Administrative Agent, Swing Line Lender and L/C Issuer, and Other Lenders party thereto (filed as Exhibit 10.34 to the Company’s Annual Report on Form 10-K for the year ended May 31, 2011). | |
| 10.12 | Second Amendment dated June 20 2014, to the Amended and Restated Credit Agreement dated July 22, 2011 among Team, Inc. as the borrower, Bank of America, NA as Administrative Agent, Swing Line Lender and L/C Issuer, and Other Lenders party thereto (filed as Exhibit 10.1 to the Company’s Current Report on Form 8-K filed on June 24, 2014). | |
60
Table of Contents
| Exhibit Number |
||
| 10.15 | Third Amended and Restated Credit Agreement dated as of July 7, 2015 among Team, Inc., Bank of America, N.A. as Administrative Agent, Swingline Lender and L/C Issuer, JPMorgan Chase Bank, N.A., as Syndication Agent, Compass Bank, as Documentation Agent and the other Lenders party thereto (filed as Exhibit 10.1 to the Company’s Current Report on Form 8-K filed on July 9, 2015). | |
| 10.16 | Purchase and Sale Agreement dated June 30, 2015 by and among Rocket Acquisition, Inc., the Unit holders of Qualspec Group LLC, the Option holders of Qualspec Group LLC, Clearview Capital Fund II (Parallel) L.P., Northstar Mezzanine Partners V L.P., and Verify Representative LLC (filed as Exhibit 2.1 to the Company’s Current Report on Form 8-K filed July 7, 2015). | |
| 21 | Subsidiaries of the Company. | |
| 23.1 | Consent of Independent Registered Public Accounting Firm—KPMG LLP. | |
| 31.1 | Certifications pursuant to Section 302 of the Sarbanes-Oxley Act of 2002. | |
| 31.2 | Certifications pursuant to Section 302 of the Sarbanes-Oxley Act of 2002. | |
| 32.1 | Certifications pursuant to Section 906 of the Sarbanes-Oxley Act of 2002. | |
| 32.2 | Certifications pursuant to Section 906 of the Sarbanes-Oxley Act of 2002. | |
| 101.INS | XBRL Instance Document. | |
| 101.SCH | XBRL Taxonomy Schema Document. | |
| 101.CAL | XBRL Calculation Linkbase Document. | |
| 101.DEF | XBRL Definition Linkbase Document. | |
| 101.LAB | XBRL Label Linkbase Document. | |
| 101.PRE | XBRL Presentation Linkbase Document. | |
| † | Management contract or compensation plan or arrangement. |
61
Table of Contents
Pursuant to the requirements of Section 13 or 15(d) of the Securities Exchange Act of 1934, the Registrant has duly caused this report to be signed on its behalf by the undersigned, thereunto duly authorized August 7, 2015.
| TEAM, INC. | ||
| By: | /S/ TED W. OWEN | |
| Ted W. Owen | ||
| President and Chief Executive Officer | ||
| (Principal Executive Officer) | ||
Pursuant to the requirements of the Securities Exchange Act of 1934, this report has been signed below by the following persons on behalf of the Registrant and in the capacity and on the dates indicated.
| /S/ TED W. OWEN (Ted W. Owen) |
President and Chief Executive Officer and Director (Principal Executive Officer) | August 7, 2015 | ||
| /S/ VINCENT D. FOSTER (Vincent D. Foster) |
Director | August 7, 2015 | ||
| /S/ JACK M. JOHNSON, JR. (Jack M. Johnson, Jr.) |
Director | August 7, 2015 | ||
| /S/ PHILIP J. HAWK (Philip J. Hawk) |
Executive Chairman of the Board | August 7, 2015 | ||
| /S/ EMMETT J. LESCROART (Emmett J. Lescroart) |
Director | August 7, 2015 | ||
| /S/ LOUIS A. WATERS (Louis A. Waters) |
Director | August 7, 2015 | ||
| /S/ SIDNEY B. WILLIAMS (Sidney B. Williams) |
Director | August 7, 2015 | ||
| /S/ GREG L. BOANE (Greg L. Boane) |
Senior Vice President, Chief Financial Officer and Treasurer (Principal Financial Officer and Principal Accounting Officer) | August 7, 2015 | ||
62