Attached files
| file | filename |
|---|---|
| EX-32.2 - EXHIBIT 32.2 - CST BRANDS, INC. | cstq2-15exhibit322.htm |
| EX-31.1 - EXHIBIT 31.1 - CST BRANDS, INC. | cstq2-15exhibit311.htm |
| EX-31.2 - EXHIBIT 31.2 - CST BRANDS, INC. | cstq2-15exhibit312.htm |
| EX-32.1 - EXHIBIT 32.1 - CST BRANDS, INC. | cstq2-15exhibit321.htm |
UNITED STATES
SECURITIES AND EXCHANGE COMMISSION
WASHINGTON, D.C. 20549
FORM 10–Q
(Mark One) | |
þ | QUARTERLY REPORT PURSUANT TO SECTION 13 OR 15(d) OF THE SECURITIES EXCHANGE ACT OF 1934 |
For the quarterly period ended June 30, 2015
OR
o | TRANSITION REPORT PURSUANT TO SECTION 13 OR 15(d) OF THE SECURITIES EXCHANGE ACT OF 1934 |
For the transition period from _______________ to _______________ | |
Commission File No. 001-35743

CST BRANDS, INC.
(Exact name of registrant as specified in its charter)
Delaware (State or Other Jurisdiction of Incorporation or Organization) | 46-1365950 (I.R.S. Employer Identification No.) | |
One Valero Way
Building D, Suite 200
San Antonio, Texas
(Address of Principal Executive Offices)
78249
(Zip Code)
(210) 692-5000
(Registrant’s telephone number, including area code)
Indicate by check mark whether the registrant (1) has filed all reports required to be filed by Section 13 or 15(d) of the Securities Exchange Act of 1934 during the preceding 12 months (or for such shorter period that the registrant was required to file such reports), and (2) has been subject to such filing requirements for the past 90 days. Yes þ No ¨
Indicate by check mark whether the registrant has submitted electronically and posted on its corporate Web site, if any, every Interactive Data File required to be submitted and posted pursuant to Rule 405 of Regulation S-T (§232.405 of this chapter) during the preceding 12 months (or for such shorter period that the registrant was required to submit and post such files). Yes þ No ¨
Indicate by check mark whether the Registrant is a large accelerated filer, an accelerated filer, a non-accelerated filer, or a smaller reporting company. See the definitions of “large accelerated filer,” “accelerated filer” and “small reporting company” in Rule 12b-2 of the Exchange Act. (Check one):
Large accelerated filer þ | Accelerated filer o | Non-accelerated filer o (do not check if a smaller reporting company) | Smaller reporting company o |
Indicate by check mark whether the registrant is a shell company (as defined in Rule 12b-2 of the Exchange Act). Yes ¨ No þ
As of August 5, 2015, there were 75,612,557 common shares outstanding.
TABLE OF CONTENTS
PAGE | |
PART I - FINANCIAL INFORMATION
ITEM 1. FINANCIAL STATEMENTS
CST BRANDS, INC.
CONSOLIDATED BALANCE SHEETS
(Millions of Dollars)
June 30, | December 31, | |||||||
2015 | 2014 | |||||||
ASSETS | (Unaudited) | |||||||
Current assets: | ||||||||
Cash (CrossAmerica: $5 and $15, respectively) | $ | 348 | $ | 368 | ||||
Accounts receivable, net of allowances of $1 and $1, at June 30, 2015 and December 31, 2014, respectively (CrossAmerica: $39 and $35, respectively) | 174 | 173 | ||||||
Inventories (CrossAmerica: $18 and $12, respectively) | 216 | 221 | ||||||
Deferred income taxes (CrossAmerica: $0 and $1, respectively) | 14 | 12 | ||||||
Prepaid expenses and other (CrossAmerica: $11 and $10, respectively) | 25 | 24 | ||||||
Total current assets | 777 | 798 | ||||||
Property and equipment, net (CrossAmerica: $580 and $482, respectively) | 2,081 | 1,957 | ||||||
Intangible assets, net (CrossAmerica: $360 and $370, respectively) | 472 | 486 | ||||||
Goodwill (CrossAmerica: $259 and $223, respectively) | 294 | 242 | ||||||
Deferred income taxes | 72 | 79 | ||||||
Other assets, net (CrossAmerica: $16 and $19, respectively) | 74 | 79 | ||||||
Total assets | $ | 3,770 | $ | 3,641 | ||||
LIABILITIES AND STOCKHOLDERS’ EQUITY | ||||||||
Current liabilities: | ||||||||
Current portion of debt and capital lease obligations (CrossAmerica: $8 and $29, respectively) | $ | 85 | $ | 77 | ||||
Accounts payable (CrossAmerica: $46 and $31, respectively) | 170 | 157 | ||||||
Accounts payable to Valero | 229 | 179 | ||||||
Accrued expenses (CrossAmerica: $14 and $21, respectively) | 74 | 79 | ||||||
Taxes other than income taxes (CrossAmerica: $12 and $10, respectively) | 37 | 37 | ||||||
Income taxes payable (CrossAmerica: $3 and $0, respectively) | 11 | 16 | ||||||
Deferred income taxes (CrossAmerica: $1 and $0, respectively) | 1 | — | ||||||
Dividends payable | 5 | 5 | ||||||
Total current liabilities | 612 | 550 | ||||||
Debt and capital lease obligations, less current portion (CrossAmerica: $266 and $261, respectively) | 1,202 | 1,227 | ||||||
Deferred income taxes (CrossAmerica: $58 and $38, respectively) | 184 | 150 | ||||||
Asset retirement obligations (CrossAmerica: $22 and $19, respectively) | 111 | 102 | ||||||
Other long-term liabilities (CrossAmerica: $16 and $16, respectively) | 60 | 57 | ||||||
Total liabilities | 2,169 | 2,086 | ||||||
Commitments and contingencies (Note 8) | ||||||||
Stockholders’ equity: | ||||||||
CST Brands, Inc. stockholders’ equity: | ||||||||
Common stock, 250,000,000 shares authorized at $0.01 par value; 77,744,769 and 77,674,450 shares issued as of June 30, 2015 and December 31, 2014, respectively | 1 | 1 | ||||||
Additional paid-in capital (APIC) | 478 | 488 | ||||||
Treasury stock, at cost: 1,244,575 and 512,714 common shares as of June 30, 2015 and December 31, 2014, respectively | (52 | ) | (22 | ) | ||||
Retained earnings | 298 | 269 | ||||||
Accumulated other comprehensive income (AOCI) | 34 | 77 | ||||||
Total CST Brands, Inc. stockholders’ equity | 759 | 813 | ||||||
Noncontrolling interest | 842 | 742 | ||||||
Total stockholders’ equity | 1,601 | 1,555 | ||||||
Total liabilities and stockholders’ equity | $ | 3,770 | $ | 3,641 | ||||
See Condensed Notes to Consolidated Financial Statements.
1
CST BRANDS, INC.
CONSOLIDATED STATEMENTS OF INCOME
(Millions of Dollars, Except per Share Amounts)
(Unaudited)
Three Months Ended | Six Months Ended | |||||||||||||||
June 30, | June 30, | |||||||||||||||
2015 | 2014 | 2015 | 2014 | |||||||||||||
Operating revenues(a) | $ | 3,153 | $ | 3,261 | $ | 5,816 | $ | 6,262 | ||||||||
Cost of sales(b) | 2,837 | 2,981 | 5,196 | 5,737 | ||||||||||||
Gross profit | 316 | 280 | 620 | 525 | ||||||||||||
Operating expenses: | ||||||||||||||||
Operating expenses | 185 | 168 | 369 | 332 | ||||||||||||
General and administrative expenses | 39 | 25 | 89 | 50 | ||||||||||||
Depreciation, amortization and accretion expense | 51 | 30 | 105 | 61 | ||||||||||||
Total operating expenses | 275 | 223 | 563 | 443 | ||||||||||||
Gain on sale of assets, net | 2 | — | 7 | — | ||||||||||||
Operating income | 43 | 57 | 64 | 82 | ||||||||||||
Other income, net | 2 | 1 | 4 | 2 | ||||||||||||
Interest expense | (14 | ) | (10 | ) | (29 | ) | (20 | ) | ||||||||
Income before income tax expense | 31 | 48 | 39 | 64 | ||||||||||||
Income tax expense | 12 | 16 | 14 | 21 | ||||||||||||
Consolidated net income | 19 | 32 | 25 | 43 | ||||||||||||
Net loss attributable to noncontrolling interest | (6 | ) | — | (14 | ) | — | ||||||||||
Net income attributable to CST stockholders | $ | 25 | $ | 32 | $ | 39 | $ | 43 | ||||||||
Earnings per common share | ||||||||||||||||
Basic earnings per common share | $ | 0.32 | $ | 0.43 | $ | 0.50 | $ | 0.57 | ||||||||
Weighted-average common shares outstanding (in thousands) | 76,705 | 75,423 | 76,800 | 75,410 | ||||||||||||
Earnings per common share – assuming dilution | ||||||||||||||||
Diluted earnings per common share | $ | 0.32 | $ | 0.43 | $ | 0.50 | $ | 0.57 | ||||||||
Weighted-average common shares outstanding - assuming dilution (in thousands) | 77,071 | 75,580 | 77,157 | 75,540 | ||||||||||||
Dividends per common share | $ | 0.0625 | $ | 0.0625 | $ | 0.1250 | $ | 0.1250 | ||||||||
Supplemental information: | ||||||||||||||||
(a) Includes excise taxes of: | $ | 503 | $ | 505 | $ | 973 | $ | 975 | ||||||||
(a) Includes income from rentals of: | $ | 12 | $ | — | $ | 24 | $ | — | ||||||||
(b) Includes expenses from rentals of: | $ | 4 | $ | — | $ | 8 | $ | — | ||||||||
See Condensed Notes to Consolidated Financial Statements.
2
CST BRANDS, INC.
CONSOLIDATED STATEMENTS OF COMPREHENSIVE INCOME (LOSS)
(Millions of Dollars)
(Unaudited)
Three Months Ended | Six Months Ended | |||||||||||||||
June 30, | June 30, | |||||||||||||||
2015 | 2014 | 2015 | 2014 | |||||||||||||
Consolidated net income | $ | 19 | $ | 32 | $ | 25 | $ | 43 | ||||||||
Other comprehensive income (loss): | ||||||||||||||||
Foreign currency translation adjustment | 9 | 22 | (43 | ) | (2 | ) | ||||||||||
Other comprehensive income (loss) before income taxes | 9 | 22 | (43 | ) | (2 | ) | ||||||||||
Income taxes related to items of other comprehensive income | — | — | — | — | ||||||||||||
Other comprehensive income (loss) | 9 | 22 | (43 | ) | (2 | ) | ||||||||||
Comprehensive income (loss) | 28 | 54 | (18 | ) | 41 | |||||||||||
Loss attributable to noncontrolling interests | (6 | ) | — | (14 | ) | — | ||||||||||
Comprehensive income (loss) attributable to CST stockholders | $ | 34 | $ | 54 | $ | (4 | ) | $ | 41 | |||||||
See Condensed Notes to Consolidated Financial Statements.
3
CST BRANDS, INC.
CONSOLIDATED STATEMENTS OF CASH FLOWS
(Millions of Dollars)
(Unaudited)
Six Months Ended June 30, | ||||||||
2015 | 2014 | |||||||
Cash flows from operating activities: | ||||||||
Consolidated net income | $ | 25 | $ | 43 | ||||
Adjustments to reconcile net income to net cash provided by operating activities: | ||||||||
Stock-based compensation expense | 11 | 6 | ||||||
Depreciation, amortization and accretion expense | 105 | 61 | ||||||
Gain on the sale of assets, net | (7 | ) | — | |||||
Deferred income tax benefit | (17 | ) | (4 | ) | ||||
Changes in working capital, net of acquisitions | 58 | 61 | ||||||
Other operating activities, net | 3 | 1 | ||||||
Net cash provided by operating activities | 178 | 168 | ||||||
Cash flows from investing activities: | ||||||||
Capital expenditures | (117 | ) | (88 | ) | ||||
Proceeds from the sale of assets | 18 | — | ||||||
CST acquisitions, net of cash acquired | (22 | ) | (4 | ) | ||||
CrossAmerica acquisitions, net of cash acquired | (128 | ) | — | |||||
Other investing activities, net | 6 | — | ||||||
Net cash used in investing activities | (243 | ) | (92 | ) | ||||
Cash flows from financing activities: | ||||||||
Proceeds under the CST revolving credit facility | 20 | — | ||||||
Proceeds under the CrossAmerica revolving credit facility | 133 | — | ||||||
Payments on the CrossAmerica revolving credit facility | (146 | ) | — | |||||
Proceeds from issuance of CrossAmerica common units, net | 139 | — | ||||||
Payments on the CST term loan facility | (22 | ) | (16 | ) | ||||
Purchases of treasury shares | (29 | ) | — | |||||
Payments of capital lease obligations | (2 | ) | (1 | ) | ||||
CST dividends paid | (10 | ) | (9 | ) | ||||
CrossAmerica distributions paid | (25 | ) | — | |||||
Receivables repaid by CrossAmerica related parties | 2 | — | ||||||
Net cash provided by (used in) financing activities | 60 | (26 | ) | |||||
Effect of foreign exchange rate changes on cash | (15 | ) | — | |||||
Net decrease in cash | (20 | ) | 50 | |||||
Cash at beginning of period | 368 | 378 | ||||||
Cash at end of period | $ | 348 | $ | 428 | ||||
See Condensed Notes to Consolidated Financial Statements.
4
CST BRANDS, INC.
CONDENSED NOTES TO CONSOLIDATED FINANCIAL STATEMENTS
Note 1. | DEFINITION OF TERMS, DESCRIPTION OF BUSINESS AND OTHER DISCLOSURES |
Definition of Terms
The following terms are used throughout this document to refer to the items indicated:
• | “CST” refers to CST Brands, Inc., a Delaware corporation, and, where appropriate in context, to one or more of CST’s subsidiaries without the inclusion or consolidation of the operations or subsidiaries of CrossAmerica Partners LP. CST includes CST’s ownership of 100% of the outstanding incentive distribution rights (“IDRs”) of CrossAmerica Partners LP and any common units of CrossAmerica Partners LP owned by subsidiaries of CST, including those received as consideration for “asset drops” as defined in our Annual Report on Form 10-K for the year ended December 31, 2014 (“Form 10-K”). |
• | We refer to CrossAmerica Partners LP, a Delaware limited partnership, and, where appropriate in context, to one or more of its subsidiaries, or all of them taken as a whole as “CrossAmerica.” |
• | “We,” “us,” “our” and “company” refer to the consolidated results and accounts of CST and CrossAmerica, or individually as the context implies. |
Description of Business
CST is a holding company and conducts substantially all of its operations through its subsidiaries. CST was incorporated in Delaware in 2012, formed solely in contemplation of the separation and distribution (“spin-off”) of the retail business of Valero Energy Corporation (“Valero”) and, prior to May 1, 2013, had not commenced operations and had no material assets, liabilities or commitments.
On October 1, 2014, CST completed the purchase of 100% of the non-economic membership interests in Lehigh Gas GP LLC (the “General Partner”) and 100% of the IDRs of Lehigh Gas Partners LP for $17 million in cash and approximately 2.0 million shares of CST common stock (the “GP Purchase” and the “IDR Purchase”, respectively) for an aggregate consideration of approximately $90 million. After the purchase of the membership interest in its General Partner, the name of Lehigh Gas Partners LP was changed to CrossAmerica Partners LP. See Note 2 for additional information.
CrossAmerica is a separate publicly traded Delaware master limited partnership primarily engaged in the wholesale distribution of motor fuel and the ownership and leasing of real estate used in the retail distribution of motor fuel. CST controls CrossAmerica’s General Partner and has the right to appoint all members of the Board of Directors of the General Partner. The General Partner is managed and operated by the executive officers of the General Partner, under the oversight of the board of directors of the General Partner. Therefore, we control the operations and activities of CrossAmerica even though we do not have a majority ownership of CrossAmerica’s outstanding limited partner units. As a result, under the guidance in ASC 810–Consolidation, CrossAmerica is a consolidated variable interest entity.
On a consolidated basis, we have three operating segments, U.S. Retail, Canadian Retail and CrossAmerica. The U.S. Retail, Canadian Retail and CrossAmerica segments are managed as individual strategic business units. Each segment experiences different operating income margins due to geographic supply and demand attributes, specific country and local regulatory environments, and are exposed to variability in gross profit from the volatility of crude oil prices. Our Canadian Retail segment also experiences variability from the volatility of foreign exchange rates.
Our U.S. Retail segment operations are substantially a company owned and operated convenience store business. We generate profit on motor fuel sales, convenience merchandise sales and other services (car wash, lottery, money orders, air/water/vacuum services, video and game rentals, and access to automated teller machines (“ATMs”)). Our retail sites are operated by company employees.
Our Canadian Retail segment includes company owned and operated convenience stores, commission agents, cardlocks and heating oil operations. We generate profit on motor fuel sales, and, at our company owned and operated convenience stores, profit is also generated on convenience merchandise sales and other services (similar to our U.S. Retail segment). We use the term “retail site” as a general term to refer to convenience stores, commission agent sites or cardlocks.
CrossAmerica is engaged in the wholesale distribution of motor fuels and the ownership and leasing of real estate used in the retail distribution of motor fuels. CrossAmerica is also engaged in retail operations consisting of recently acquired convenience stores. CrossAmerica’s operations are conducted entirely within the U.S.
5
CST BRANDS, INC.
CONDENSED NOTES TO CONSOLIDATED FINANCIAL STATEMENTS
Interim Financial Information
These unaudited financial statements have been prepared in accordance with U.S. generally accepted accounting principles (“U.S. GAAP”) for interim financial information and with the instructions to Form 10-Q and Article 10 of Regulation S-X of the Securities Exchange Act of 1934, as amended. Accordingly, they do not include all of the information and notes required by U.S. GAAP for complete financial statements. In the opinion of management, all adjustments considered necessary for a fair presentation have been included. All such adjustments are of a normal recurring nature unless disclosed otherwise. Management believes that the disclosures made are adequate to keep the information presented from being misleading. The financial statements contained herein should be read in conjunction with the consolidated and combined financial statements and notes thereto included in our Form 10-K. Financial information as of June 30, 2015 and for the three and six months ended June 30, 2015 and 2014 included in the condensed notes to the consolidated financial statements has been derived from our unaudited financial statements. Financial information as of December 31, 2014, has been derived from our audited financial statements and notes thereto as of that date.
Operating results for the three and six months ended June 30, 2015 are not necessarily indicative of the results that may be expected for the year ending December 31, 2015. Our business exhibits substantial seasonality due to our wholesale and retail sites being located in certain geographic areas that are affected by seasonal weather and temperature trends and associated changes in retail customer activity during different seasons. Historically, sales volumes and operating income have been highest in the second and third quarters (during the summer activity months) and lowest during the winter months in the first and fourth quarters.
Our effective income tax rates for the three and six months ended June 30, 2015 were 39% and 36%, respectively, compared with 33% and 33% for the corresponding periods of 2014. The effective tax rate differs from the federal statutory rate of 35% for 2015 primarily as a result of CrossAmerica reporting a loss with minimal tax benefit recorded. As a limited partnership, CrossAmerica has not been subject to Federal and State income tax with the exception of its operations through certain tax paying corporate subsidiaries. CST’s effective tax rate, excluding CrossAmerica, was 35% for the three and six months ended June 30, 2015, respectively.
Use of Estimates
The preparation of financial statements in conformity with U.S. GAAP requires management to make estimates and assumptions that affect the reported amounts of assets and liabilities at the date of the financial statements and the reported amounts of revenues and expenses during the reporting periods. Actual results and outcomes could differ from those estimates and assumptions. On an ongoing basis, management reviews its estimates based on currently available information. Changes in facts and circumstances could result in revised estimates and assumptions.
Significant Accounting Policies
There have been no material changes to the significant accounting policies described in our Form 10-K filed on February 27, 2015 or our Form 10-K/A filed on June 8, 2015. Our Form 10-K/A was filed for the purpose of providing a revised Report of Independent Registered Public Accounting Firm dated February 27, 2015. KPMG LLP incorrectly referred to the report of another auditor in their Report of Independent Registered Public Accounting Firm.
New Accounting Pronouncements
In February 2015, the Financial Accounting Standards Board (“FASB”) issued Accounting Standards Update (“ASU”) 2015-02—Consolidation (Topic 810): Amendments to the Consolidation Analysis. This standard modifies existing consolidation guidance for reporting organizations that are required to evaluate whether they should consolidate certain legal entities, including limited partnerships and other similar entities. ASU 2015-02 is effective for fiscal years and interim periods within those years beginning after December 15, 2015, and requires either a full retrospective or a modified retrospective approach to adoption. Early adoption is also permitted. Management is currently evaluating this new guidance, including how it will apply the guidance at the date of adoption.
In April 2015, the FASB issued ASU 2015-03—Interest-Imputation of Interest (Subtopic 835-30), which requires that debt issuance costs related to a recognized debt liability be presented in the balance sheet as a direct deduction from the carrying amount of that debt liability, consistent with debt discounts. This guidance is effective January 1, 2016. Early adoption is permitted. The guidance is to be applied on a retrospective basis, wherein the balance sheet of each individual period presented should be adjusted to reflect the period-specific effects of applying the new guidance. If the guidance were applicable at June 30, 2015, other noncurrent assets and long-term debt would be lower by $21 million.
In May 2014, the FASB issued ASU 2014-09—Revenue from Contracts with Customers (Topic 606), which results in comprehensive new revenue accounting guidance, requires enhanced disclosures to help users of financial statements better understand the nature, amount, timing, and uncertainty of revenue that is recognized, and develops a common revenue standard under U.S. GAAP and International Financial Reporting Standards. Specifically, the core principle of the guidance is that an entity should recognize
6
CST BRANDS, INC.
CONDENSED NOTES TO CONSOLIDATED FINANCIAL STATEMENTS
revenue to depict the transfer of promised goods or services to customers in an amount that reflects the consideration to which the entity expects to be entitled in exchange for those goods and services. This guidance is effective January 1, 2018, pending issuance of the final Accounting Standards Update. Early adoption is not permitted. The guidance can be applied either retrospectively to each prior reporting period presented, or as a cumulative-effect adjustment as of the date of adoption. Management is currently evaluating this new guidance, including how it will apply the guidance at the date of adoption.
Certain other new financial accounting pronouncements have become effective for our financial statements but the adoption of these pronouncements will not affect our financial position or results of operations, nor will they require any additional disclosures.
Concentration Risk
Valero supplied substantially all of the motor fuel purchased by our U.S. Retail and Canadian Retail segments for resale during all periods presented. During the three months ended June 30, 2015 and 2014 our U.S. Retail and Canadian Retail segments purchased $1.8 billion, and $2.6 billion, respectively, of motor fuel from Valero. During the six months ended June 30, 2015 and 2014 our U.S. Retail and Canadian Retail segments purchased $3.4 billion, and $5.0 billion, respectively, of motor fuel from Valero.
CrossAmerica purchases a substantial amount of motor fuel from three suppliers. For the six months ended June 30, 2015, CrossAmerica’s wholesale business purchased approximately 27%, 25% and 23% of its motor fuel from ExxonMobil, BP and Motiva, respectively. No other fuel suppliers accounted for 10% or more of CrossAmerica’s fuel purchases in the first half of 2015.
No customers are individually material to our U.S. Retail and Canadian Retail segment operations. For the three and six months ended June 30, 2015, CrossAmerica distributed approximately 17% of its total wholesale distribution volumes to Dunne Manning Stores LLC (formerly known as Lehigh Gas-Ohio, LLC) (“DMS” or “affiliated dealer”). DMS is an operator of retail sites that purchases a significant portion of its motor fuel from CrossAmerica on a wholesale basis and then re-sells motor fuel on a retail basis. For more information regarding transactions with DMS, see Note 7.
Note 2. ACQUISITIONS AND DIVESTITURES
GP Purchase and IDR Purchase
During the first half of 2015, we updated the valuation of CrossAmerica, which resulted in adjustments to certain property and equipment, definite-lived intangibles, goodwill and related deferred tax effects as follows (in millions):
Preliminary Purchase Price Allocation | Fair Value Adjustments | Adjusted Purchase Price Allocation | ||||||||||
Current assets (excluding inventories) | $ | 74 | $ | — | $ | 74 | ||||||
Inventories | 14 | — | 14 | |||||||||
Property and equipment | 436 | 17 | 453 | |||||||||
Intangibles | 367 | (7 | ) | 360 | ||||||||
Goodwill | 213 | (7 | ) | 206 | ||||||||
Other assets | 18 | — | 18 | |||||||||
Current liabilities | (65 | ) | — | (65 | ) | |||||||
Long-term debt and capital leases | (236 | ) | — | (236 | ) | |||||||
Deferred tax liabilities | (33 | ) | — | (33 | ) | |||||||
Other liabilities | (17 | ) | — | (17 | ) | |||||||
Non-controlling interest | (771 | ) | (3 | ) | (774 | ) | ||||||
Total consideration | $ | — | $ | — | $ | — | ||||||
7
CST BRANDS, INC.
CONDENSED NOTES TO CONSOLIDATED FINANCIAL STATEMENTS
The adjustment to property and equipment resulted from obtaining additional information for the fair value determination for certain retail sites. The adjustment to intangibles resulted from revising our pro forma cash flow projections based on actual motor fuel gallons distributed for 2014 in the determination of fair value of motor fuel supply and distribution agreements. The adjustments to property and equipment and intangible assets resulted in an immaterial adjustment to previously recognized depreciation and amortization and was recorded in the first half of 2015.
We engaged an independent third party valuation services firm to assist in the calculation of the fair value of CrossAmerica’s assets and liabilities. The fair value of CrossAmerica was based on its enterprise value on the date of acquisition as principally determined by the closing price of its common units trading on the New York Stock Exchange ($33.97 per share), which resulted in a portion of the purchase price being allocated to goodwill. Therefore, a future decline in the enterprise value of CrossAmerica could result in an impairment to part or all of the associated goodwill. A sustained decline of 10% in CrossAmerica’s enterprise value could result in an impairment to the associated goodwill in excess of $100 million.
Our pro forma results, assuming we acquired CrossAmerica on January 1, 2014, would have been (in millions):
Three Months Ended | Six Months Ended | |||||||
June 30, 2014 | ||||||||
Total revenues | $ | 4,025 | $ | 7,508 | ||||
Net income attributable to CST stockholders | 32 | 43 | ||||||
Acquisition of Landmark Industries Stores (“Landmark”)
In January 2015, CST and CrossAmerica jointly purchased 22 convenience stores from Landmark. CrossAmerica purchased the real property of the 22 fee sites as well as certain wholesale fuel distribution assets for $41 million. CST purchased the personal property, working capital and the convenience store operations for $22 million.
CrossAmerica leases the acquired real property to CST under triple net leases at a lease rate per annum of 7.5% of the fair value of the leased property on the acquisition date and CrossAmerica distributes wholesale motor fuel to CST under long term agreements with a fuel gross profit margin of approximately $0.05 per gallon.
The fair values of Landmark’s assets on the date of acquisition were as follows (in millions):
Current assets | $ | 2 | |
Property and equipment | 28 | ||
Other assets | 4 | ||
Goodwill | 29 | ||
Total consideration | $ | 63 | |
The fair value of property and equipment, which consisted of land, buildings, building improvements, USTs and other equipment, was based on a cost approach. The buildings, equipment and underground storage tanks are being depreciated on a straight-line basis, with estimated useful lives of 20 years.
A substantial portion of the goodwill represents the value that would have been allocated to wholesale fuel distribution rights. However, because the acquired wholesale fuel distribution rights relate to entities under common control under U.S. GAAP, this identifiable intangible is not permitted to be recognized and therefore the value has been allocated to goodwill.
Aggregate incremental revenues since the closing of the Landmark acquisition included in our statement of operations were $29 million and $49 million for the three and six months ended June 30, 2015, respectively.
8
CST BRANDS, INC.
CONDENSED NOTES TO CONSOLIDATED FINANCIAL STATEMENTS
Acquisition of Erickson Oil Products, Inc. (“Erickson”)
In February 2015, CrossAmerica closed on the purchases of all of the outstanding capital stock of Erickson and separate purchases of certain related assets with an aggregate purchase price of $82 million, net of $3 million cash acquired, subject to certain post-closing adjustments. These transactions resulted in the acquisition of a total of 64 retail sites located in Minnesota, Michigan, Wisconsin and South Dakota. The convenience store operations of Erickson are classified as non-core in the CrossAmerica segment.
The following table summarizes the preliminary estimated fair values of the assets acquired and liabilities assumed at the acquisition date (in millions):
Current assets (excluding inventories) | $ | 4 | ||
Inventories | 8 | |||
Property and equipment | 75 | |||
Intangibles | 14 | |||
Goodwill | 31 | |||
Current liabilities | (20 | ) | ||
Deferred tax liabilities | (28 | ) | ||
Asset retirement obligations | (2 | ) | ||
Total consideration, net of cash acquired | $ | 82 | ||
The fair value of inventory was estimated at retail selling price less estimated costs to sell and a reasonable profit allowance for the selling effort.
The fair value of property and equipment, which consisted of land, buildings and equipment, was based on a cost approach. The buildings and equipment are being depreciated on a straight-line basis, with estimated remaining useful lives of 15 years for the buildings and 5 to 10 years for equipment.
The $12 million fair value of the wholesale fuel distribution rights included in intangibles was based on an income approach and management believes the level and timing of cash flows represent relevant market participant assumptions. The wholesale fuel distribution rights are being amortized on a straight-line basis over an estimated useful life of approximately 10 years.
Goodwill recorded is primarily attributable to the deferred tax liabilities arising from the application of purchase accounting. Management is reviewing the valuation and confirming the result to determine the final purchase price allocation.
Sale (“Drop Down”) of CST Wholesale Fuel Supply Equity Interests
In January 2015, we closed on the contribution and sale of a 5% limited partner equity interest in our U.S. Retail segment’s wholesale motor fuel supply business (“CST Fuel Supply”) to CrossAmerica in exchange for 1.5 million common units with an aggregate consideration of $60 million on the date of closing. In July 2015, we closed on the sale of an additional 12.5% limited partner equity interest in CST Fuel Supply to CrossAmerica in exchange for 3.3 million common units and cash in the amount of $18 million with an aggregate consideration of approximately $111 million on the date of closing. These transactions were approved by the conflicts committee of the General Partner and the executive committee of and full board of directors.
As of August 5, 2015, CrossAmerica’s total equity interest in CST Fuel Supply is 17.5%, and CST’s total equity interest in CrossAmerica is 15.9%.
Because these transactions were between entities under common control, a gain on the sale of CST Fuel Supply and the NTIs discussed below is not reflected in our consolidated income statement and we eliminated our limited partner interest from our consolidated balance sheet. The excess of the purchase price paid by CrossAmerica over the carrying value recorded on CST’s balance sheet was recorded as a contribution from CrossAmerica in our consolidated stockholders’ equity.
See Note 7 for additional information.
Divestitures
During the three months ended June 30, 2015, CST closed on the sale of 15 convenience stores and recognized a gain of $2 million in “Gain on sale of assets, net” on the consolidated statements of income. During the six months ended June 30, 2015, CST closed on the sale of 24 convenience stores and recognized a gain of $7 million in “Gain on sale of assets, net” on the consolidated statements of income.
9
CST BRANDS, INC.
CONDENSED NOTES TO CONSOLIDATED FINANCIAL STATEMENTS
Subsequent Event—Sale of New to Industry (“NTI”) Convenience Stores
In July 2015, we completed the contribution and sale of 29 NTIs to CrossAmerica in exchange for 0.3 million common units and cash in the amount of $124 million, with an aggregate consideration of $134 million on the date of closing. Based on our credit facility agreement, CST is required to use the cash proceeds from this transaction to repay debt, reinvest in asset or business acquisitions, or capital expenditures in the ordinary course of business. This transaction was approved by the conflicts committee of the General Partner and the executive committee of and full board of directors.
Subsequent Event—Acquisition of One Stop
In July 2015, CrossAmerica completed the purchase of the 41 company-operated One Stop convenience store network based in Charleston, West Virginia, along with four commission agent sites, nine dealer fuel supply agreements and one freestanding franchised quick service restaurant for approximately $42 million in cash.
Note 3. INVENTORIES
Inventories consisted of the following (in millions):
June 30, | December 31, | |||||||
2015 | 2014 | |||||||
Convenience store merchandise (CrossAmerica: $11 and $7, respectively) | $ | 129 | $ | 128 | ||||
Motor fuel (CrossAmerica: $7 and $5, respectively) | 85 | 92 | ||||||
Supplies | 2 | 1 | ||||||
Inventories | $ | 216 | $ | 221 | ||||
The cost of convenience store merchandise and supplies is determined principally under the weighted-average cost method. We account for our motor fuel inventory in our U.S. Retail segment on the LIFO basis. As of June 30, 2015 and December 31, 2014, the replacement cost (market value) of our U.S. motor fuel inventories exceeded their LIFO carrying amounts by approximately $9 million and $2 million, respectively. We account for our motor fuel inventory in our Canadian Retail and CrossAmerica segments under the weighted-average cost method.
Note 4. PROPERTY AND EQUIPMENT
Property and equipment, net consisted of the following (in millions):
June 30, | December 31, | |||||||
2015 | 2014 | |||||||
Land (CrossAmerica: $199 and $154, respectively) | $ | 650 | $ | 580 | ||||
Buildings (CrossAmerica: $227 and $179, respectively) | 725 | 678 | ||||||
Equipment (CrossAmerica: $155 and $131, respectively) | 818 | 795 | ||||||
Leasehold improvements (CrossAmerica: $5 and $4, respectively) | 330 | 311 | ||||||
Other (CrossAmerica: $20 and $17, respectively) | 267 | 260 | ||||||
Construction in progress (CrossAmerica: $3 and $5, respectively) | 37 | 38 | ||||||
Property and equipment, at cost | 2,827 | 2,662 | ||||||
Accumulated depreciation (CrossAmerica: $29 and $8, respectively) | (746 | ) | (705 | ) | ||||
Property and equipment, net | $ | 2,081 | $ | 1,957 | ||||
Other property and equipment noted in the table above consists primarily of the assets related to our asset retirement obligations and computer hardware and software.
10
CST BRANDS, INC.
CONDENSED NOTES TO CONSOLIDATED FINANCIAL STATEMENTS
Note 5. GOODWILL AND INTANGIBLE ASSETS
Changes in goodwill during the six months ended June 30, 2015 consisted of the following (in millions):
U.S. Segment | CrossAmerica | Consolidated | |||||||||
Beginning balance | $ | 19 | $ | 223 | $ | 242 | |||||
Acquisitions | 16 | 43 | 59 | ||||||||
Purchase price adjustment | — | (7 | ) | (7 | ) | ||||||
Ending balance | $ | 35 | $ | 259 | $ | 294 | |||||
See Note 2 under the heading “GP Purchase and IDR Purchase.”
Intangible assets consisted of the following (in millions):
June 30, 2015 | December 31, 2014 | ||||||||||||||||||||||
Gross Amount | Accumulated Amortization | Net Carrying Amount | Gross Amount | Accumulated Amortization | Net Carrying Amount | ||||||||||||||||||
US: | |||||||||||||||||||||||
Indefinite-lived intangible assets | $ | 91 | $ | — | $ | 91 | $ | 91 | $ | — | $ | 91 | |||||||||||
Other | 8 | (1 | ) | 7 | 7 | (1 | ) | 6 | |||||||||||||||
US total | 99 | (1 | ) | 98 | 98 | (1 | ) | 97 | |||||||||||||||
Canada: | |||||||||||||||||||||||
Customer lists | 99 | (85 | ) | 14 | 106 | (87 | ) | 19 | |||||||||||||||
Total US and Canada | 198 | (86 | ) | 112 | 204 | (88 | ) | 116 | |||||||||||||||
CrossAmerica: | |||||||||||||||||||||||
Wholesale fuel distribution rights | 215 | (15 | ) | 200 | 229 | (8 | ) | 221 | |||||||||||||||
Wholesale fuel supply agreements | 175 | (26 | ) | 149 | 155 | (17 | ) | 138 | |||||||||||||||
Below market leases | 11 | (4 | ) | 7 | 10 | (3 | ) | 7 | |||||||||||||||
Other | 6 | (2 | ) | 4 | 5 | (1 | ) | 4 | |||||||||||||||
Total CrossAmerica | 407 | (47 | ) | 360 | 399 | (29 | ) | 370 | |||||||||||||||
Consolidated total | $ | 605 | $ | (133 | ) | $ | 472 | $ | 603 | $ | (117 | ) | $ | 486 | |||||||||
Indefinite lived intangible assets, which consist primarily of the IDRs, are not amortized, but instead are tested for impairment at least annually, and tested for impairment more frequently if events and circumstances indicate that the IDRs might be impaired.
Our customer lists are located in our Canadian Retail segment and are amortized on a straight-line basis over their remaining life. As these assets are recorded in the local currency, Canadian dollars, historical gross carrying amounts are translated at each balance sheet date, resulting in changes to historical amounts presented.
11
CST BRANDS, INC.
CONDENSED NOTES TO CONSOLIDATED FINANCIAL STATEMENTS
Note 6. DEBT
Our balances for long-term debt and capital leases are as follows (in millions):
June 30, | December 31, | |||||||
2015 | 2014 | |||||||
CST debt and capital leases:(a) | ||||||||
Revolving credit facility(b) | $ | 20 | $ | — | ||||
Term loan due 2019 | 431 | 453 | ||||||
5.00% senior notes due 2023 | 550 | 550 | ||||||
Capital leases | 12 | 11 | ||||||
Total CST debt and capital leases | 1,013 | 1,014 | ||||||
CrossAmerica debt and capital leases:(c) | ||||||||
Revolving credit facility | 187 | 200 | ||||||
Other debt | 27 | 27 | ||||||
Capital leases | 60 | 63 | ||||||
Total CrossAmerica debt and capital leases | 274 | 290 | ||||||
Total consolidated debt and capital lease obligations outstanding | 1,287 | 1,304 | ||||||
Less current portion of CST | 77 | 48 | ||||||
Less current portion of CrossAmerica | 8 | 29 | ||||||
Consolidated debt and capital lease obligations, less current portion | $ | 1,202 | $ | 1,227 | ||||
(a) The assets of CST can only be used to settle the obligations of CST and creditors of CST have no recourse to the assets or general credit of CrossAmerica. CST has pledged its equity ownership in CrossAmerica to secure the CST Credit Facility.
(b) This amount was repaid in full on July 1, 2015.
(c) The assets of CrossAmerica can only be used to settle the obligations of CrossAmerica and creditors of CrossAmerica have no recourse to the assets or general credit of CST.
Financial Covenants and Interest Rate
The CST Credit Facility contains financial covenants consisting of (a) a maximum total lease adjusted leverage ratio set at not greater than 3.75 to 1.00, and (b) a minimum fixed charge coverage ratio set at not less than 1.30 to 1.00. As of June 30, 2015, CST was in compliance with both of these covenants.
The CrossAmerica revolving credit facility requires CrossAmerica to maintain a total leverage ratio (as defined) for the most recently completed four fiscal quarters of less than or equal to 5.00 to 1.00 and a consolidated interest coverage ratio (as defined in the Credit Agreement) of greater than or equal to 2.75 to 1.00. As of June 30, 2015, CrossAmerica was in compliance with these covenants.
Outstanding borrowings under the CST term loan facility bear interest at the 30–day London Interbank Offered Rate (“LIBOR”) plus a margin of 1.50%. As of June 30, 2015, the interest rate was 1.69%. As of June 30, 2015, the interest rate on the CST revolving credit facility was 3.75%. Outstanding borrowings under the CST revolving credit facility were repaid in full on July 1, 2015. Outstanding borrowings under CrossAmerica’s revolving credit facility bear interest at LIBOR plus a margin of 3.25%. CrossAmerica’s borrowings had an interest rate of 3.44% as of June 30, 2015.
12
CST BRANDS, INC.
CONDENSED NOTES TO CONSOLIDATED FINANCIAL STATEMENTS
Note 7. RELATED-PARTY TRANSACTIONS
We consider transactions with CrossAmerica to be with a related-party and account for the transactions as entities under common control.
Rent and Purchased Motor Fuel
CrossAmerica leases certain retail sites and sells motor fuel to the U.S. Retail segment under a master fuel distribution agreement and a master lease agreement having initial 10-year terms. The fuel distribution agreement provides CrossAmerica with a fixed wholesale mark-up per gallon and the lease agreement is a triple net lease with a lease rate of 7.5%. The U.S. Retail segment purchased approximately 21 million gallons of motor fuel from CrossAmerica and incurred rent expense on these retail sites of $1 million during the three months ended June 30, 2015. The U.S. Retail segment purchased approximately 37 million gallons of motor fuel from CrossAmerica and incurred rent expense on retail sites leased from CrossAmerica of $2 million during the six months ended June 30, 2015. Amounts payable to CrossAmerica totaled $4 million and $3 million at June 30, 2015 and December 31, 2014, respectively, related to these transactions.
Sale of CST Fuel Supply Equity Interests to CrossAmerica
We accounted for the January 2015 sale of equity interests in CST Fuel Supply to CrossAmerica based on the carrying value recorded on our balance sheet, which amounted to $0.4 million at the date of acquisition. The excess of the purchase price paid by CrossAmerica over the carrying value on our balance sheet was recorded as a credit to stockholders’ equity in the amount of $60 million.
CST records the monthly distributions to CrossAmerica in cost of sales, which is eliminated upon consolidation of CrossAmerica.
CST distributed $1 million and $2 million to CrossAmerica during the three and six months ended June 30, 2015, respectively, related to its equity ownership interests in CST Fuel Supply.
See Note 2 for information on the July 2015 sale of additional equity interests in CST Fuel Supply.
Amended and Restated Omnibus Agreement
We entered into an Amended and Restated Omnibus Agreement, dated October 1, 2014, by and among CrossAmerica, the General Partner, Dunne Manning Inc. (“DMI”), DMS, CST and Joseph V. Topper, Jr. (the “Amended Omnibus Agreement”), which amends and restates the Original Omnibus Agreement, which was executed in connection with CrossAmerica’s initial public offering on October 30, 2012. CST received from CrossAmerica $3 million in fixed and variable fees for the first quarter of 2015. In addition, CST allocated $2 million in non-cash stock-based compensation and incentive compensation costs to CrossAmerica for the six months ended June 30, 2015. Receivables from CrossAmerica related to these transactions were $6 million and $0.1 million at June 30, 2015 and December 31, 2014, respectively. As approved by the independent conflicts committee of the General Partner and the executive committee of our board of directors, CrossAmerica and CST mutually agreed to settle the second quarter 2015 amounts due under the terms of the Amended Omnibus Agreement in limited partnership units. As a result, in July 2015, CST received from CrossAmerica 145,056 limited partner units valued at $4 million for the three months ended June 30, 2015. CST and CrossAmerica have the right to negotiate the amount of the management fee on an annual basis, or more often as circumstances require.
IDR and Common Unit Distributions
CST received distributions of $2 million related to its investment in CrossAmerica’s IDRs and common units during the six months ended June 30, 2015.
CrossAmerica Transactions with DMS
DMS is an entity affiliated with Joseph V. Topper, Jr., a member of our Board of Directors, the Board of Directors of the General Partner and Chief Executive Officer of the General Partner. DMS is an operator of convenience stores that purchases all of its motor fuel requirements from CrossAmerica on a wholesale basis. DMS also leases certain retail site real estate from CrossAmerica in accordance with a master lease agreement between DMS and CrossAmerica.
13
CST BRANDS, INC.
CONDENSED NOTES TO CONSOLIDATED FINANCIAL STATEMENTS
Revenues from fuel sales and rental income from DMS were as follows (in millions):
Three Months Ended | Six Months Ended | |||||||
June 30, 2015 | ||||||||
Revenues from fuel sales to DMS | $ | 98 | $ | 168 | ||||
Rental income from DMS | 5 | 10 | ||||||
Motor fuel is sold to DMS at CrossAmerica’s cost plus a fixed mark-up per gallon. Receivables from DMS totaled $13 million and $10 million at June 30, 2015 and December 31, 2014, respectively.
Note 8. COMMITMENTS AND CONTINGENCIES
We are from time to time party to various lawsuits, claims and other legal proceedings that arise in the ordinary course of business. These actions typically seek, among other things, compensation for alleged personal injury, breach of contract and/or property damages, environmental damages, employment-related claims and damages, punitive damages, civil penalties or other losses, or injunctive or declaratory relief. With respect to all such lawsuits, claims and proceedings, we record a reserve when it is probable that a liability has been incurred and the amount of loss can be reasonably estimated. In addition, we disclose matters for which management believes a material loss is at least reasonably possible. None of these proceedings, separately or in the aggregate, are expected to have a material adverse effect on our consolidated financial position, results of operations or cash flows. In all instances, management has assessed the matter based on current information and made a judgment concerning its potential outcome, giving due consideration to the nature of the claim, the amount and nature of damages sought and the probability of success. Management’s judgment may prove materially inaccurate, and such judgment is made subject to the known uncertainties of litigation.
Note 9. FAIR VALUE MEASUREMENTS
Fair value is the price that would be received to sell an asset or paid to transfer a liability in an orderly transaction between market participants at the measurement date (exit price). U.S. GAAP specifies a three-level hierarchy that is used when measuring and disclosing fair value. The fair value hierarchy gives the highest priority to quoted prices available in active markets (i.e., observable inputs) and the lowest priority to data lacking transparency (i.e., unobservable inputs). An instrument’s categorization within the fair value hierarchy is based on the lowest level of significant input to its valuation. The following is a description of the three hierarchy levels.
Level 1—Unadjusted quoted prices in active markets that are accessible at the measurement date for identical, unrestricted assets or liabilities. Active markets are considered to be those in which transactions for the assets or liabilities occur in sufficient frequency and volume to provide pricing information on an ongoing basis.
Level 2—Quoted prices in markets that are not active, or inputs which are observable, either directly or indirectly, for substantially the full term of the asset or liability. This category includes quoted prices for similar assets or liabilities in active markets and quoted prices for identical or similar assets or liabilities in inactive markets.
Level 3—Unobservable inputs are not corroborated by market data. This category is comprised of financial and non-financial assets and liabilities whose fair value is estimated based on internally developed models or methodologies using significant inputs that are generally less readily observable from objective sources.
Transfers into or out of any hierarchy level are recognized at the end of the reporting period in which the transfers occurred. There were no transfers between any levels in 2015 or 2014.
Financial Instruments
The aggregate fair value and carrying amount of the CST senior notes and term loan at June 30, 2015 and December 31, 2014 were $1.0 billion and $1.0 billion, respectively. The fair value of the CST term loan approximates its carrying value due to the frequency with which interest rates are reset. The fair value of the CST senior notes is determined primarily using quoted prices of over the counter traded securities. These quoted prices are considered Level 1 inputs.
The fair value of CrossAmerica’s revolving credit facility approximated its carrying values of $187 million as of June 30, 2015 and $200 million as of December 31, 2014 due to the frequency with which interest rates are reset based on changes in prevailing interest rates.
14
CST BRANDS, INC.
CONDENSED NOTES TO CONSOLIDATED FINANCIAL STATEMENTS
Note 10. EQUITY
CST Treasury Stock
For the six months ended June 30, 2015 we purchased 703,932 of our common shares for a total purchase price of $29 million as part of our publicly announced share repurchase program. Subsequent to June 30, 2015 and through August 5, 2015, we purchased an additional 888,545 of our common shares for a total purchase price of $35 million. We have also withheld 27,929 shares of our common stock with a total fair value of $1 million in connection with withholding taxes related to the exercise of stock options, the vesting of restricted stock and the vesting of restricted stock units.
CST Dividends
We have paid regular quarterly cash dividends of $0.0625 per CST common share each quarter, commencing with the quarter ended September 30, 2013. The timing, declaration, amount and payment of future dividends to stockholders will fall within the discretion of our Board of Directors. Our indebtedness also restricts our ability to pay dividends. As such, there can be no assurance we will continue to pay dividends in the future.
Quarterly dividend activity was as follows:
Quarter Ended | Record Date | Payment Date | Cash Distribution (per share) | Cash Distribution (in millions) | ||||||||
March 31, 2015 | March 31, 2015 | April 15, 2015 | $ | 0.0625 | $ | 5 | ||||||
June 30, 2015 | June 30, 2015 | July 15, 2015 | $ | 0.0625 | $ | 5 | ||||||
CrossAmerica Distributions
Quarterly distribution activity was as follows:
Quarter Ended | Record Date | Payment Date | Cash Distribution (per unit) | Cash Distribution (in millions) | ||||||||
December 31, 2014 | March 9, 2015 | March 17, 2015 | $ | 0.5425 | $ | 13 | ||||||
March 31, 2015 | June 15, 2015 | June 19, 2015 | $ | 0.5475 | $ | 14 | ||||||
For the six months ended June 30, 2015, CrossAmerica made distributions to CST of $2 million with respect to our investment in the IDRs and common units.
CrossAmerica Unit Offering
On June 19, 2015, CrossAmerica closed on the sale of 4.6 million common units for net proceeds of approximately $139 million. CrossAmerica used the net proceeds from this offering to reduce indebtedness outstanding under its revolving credit facility. On July 1, 2015, CrossAmerica reborrowed $184 million under its revolving credit facility to fund the purchase of the 12.5% equity interest in CST Fuel Supply, the acquisition of the 29 NTIs, and the One Stop acquisition.
On July 16, 2015, CrossAmerica closed on the sale of an additional 0.2 million common units for net proceeds of $6 million in accordance with the underwriters’ option to purchase additional common units associated with the June offering discussed above.
15
CST BRANDS, INC.
CONDENSED NOTES TO CONSOLIDATED FINANCIAL STATEMENTS
Comprehensive Income
Comprehensive income for a period encompasses net income and all other changes in equity other than from transactions with our stockholders. Foreign currency translation adjustments are the only component of our accumulated other comprehensive income. Our other comprehensive income or loss before reclassifications results from changes in the value of foreign currencies (the Canadian dollar) in relation to the U.S. dollar. Changes in foreign currency translation adjustments were as follows for the three and six months ended June 30, 2015 and 2014 (in millions):
Three Months Ended | Six Months Ended | |||||||||||||||
June 30, | June 30, | |||||||||||||||
2015 | 2014 | 2015 | 2014 | |||||||||||||
Balance at the beginning of the period | $ | 25 | $ | 109 | $ | 77 | $ | 133 | ||||||||
Other comprehensive income (loss) before reclassifications | 9 | 22 | (43 | ) | (2 | ) | ||||||||||
Amounts reclassified from other comprehensive income | — | — | — | — | ||||||||||||
Net other comprehensive income (loss) | 9 | 22 | (43 | ) | (2 | ) | ||||||||||
Balance at the end of the period | $ | 34 | $ | 131 | $ | 34 | $ | 131 | ||||||||
Note 11. STOCK-BASED COMPENSATION
Overview
We record stock-based compensation as a component of operating expenses and general and administrative expenses in the consolidated statements of income.
We recognized stock-based compensation expense as follows (in millions):
Three Months Ended | Six Months Ended | |||||||||||||||
June 30, | June 30, | |||||||||||||||
2015 | 2014 | 2015 | 2014 | |||||||||||||
Stock-based compensation related to CST | $ | 3 | $ | 2 | $ | 8 | $ | 6 | ||||||||
Stock-based compensation related to CrossAmerica | — | — | 3 | — | ||||||||||||
Total stock-based compensation expense | $ | 3 | $ | 2 | $ | 11 | $ | 6 | ||||||||
During the six months ended June 30, 2015, we recognized $4 million of stock-based compensation expense, and during the six months ended June 30, 2014, we recognized $2 million of stock-based compensation expense, related to stock-based awards granted to employees who were retirement eligible at the date of grant.
16
CST BRANDS, INC.
CONDENSED NOTES TO CONSOLIDATED FINANCIAL STATEMENTS
Note 12. EARNINGS PER COMMON SHARE
Earnings per common share are computed after adjustment for net income or loss attributable to noncontrolling interest; therefore, all earnings per common share information relates solely to CST common stockholders.
Earnings per common share were computed as follows (in millions, except shares outstanding, common equivalent shares and per share amounts):
Three Months Ended June 30, | ||||||||||||||||
2015 | 2014 | |||||||||||||||
Restricted Shares and Units | Common Stock | Restricted Shares and Units | Common Stock | |||||||||||||
Earnings per common share: | ||||||||||||||||
Net income attributable to CST stockholders | $ | 25 | $ | 32 | ||||||||||||
Less dividends declared: | ||||||||||||||||
Common stock | 5 | 5 | ||||||||||||||
Undistributed earnings | $ | 20 | $ | 27 | ||||||||||||
Weighted-average common shares outstanding (in thousands) | 379 | 76,705 | 334 | 75,423 | ||||||||||||
Earnings per common share | ||||||||||||||||
Distributed earnings | $ | 0.06 | $ | 0.06 | $ | 0.06 | $ | 0.06 | ||||||||
Undistributed earnings | 0.26 | 0.26 | 0.37 | 0.37 | ||||||||||||
Total earnings per common share | $ | 0.32 | $ | 0.32 | $ | 0.43 | $ | 0.43 | ||||||||
Earnings per common share - assuming dilution: | ||||||||||||
Net income attributable to CST stockholders | $ | 25 | $ | 32 | ||||||||
Weighted-average common shares outstanding (in thousands) | 76,705 | 75,423 | ||||||||||
Common equivalent shares: | ||||||||||||
Stock options (in thousands) | 155 | 27 | ||||||||||
Restricted stock (in thousands) | 91 | 84 | ||||||||||
Restricted stock units (in thousands) | 120 | 46 | ||||||||||
Weighted-average common shares outstanding - assuming dilution (in thousands) | 77,071 | 75,580 | ||||||||||
Earnings per common share - assuming dilution | $ | 0.32 | $ | 0.43 | ||||||||
17
CST BRANDS, INC.
CONDENSED NOTES TO CONSOLIDATED FINANCIAL STATEMENTS
Six Months Ended June 30, | ||||||||||||||||
2015 | 2014 | |||||||||||||||
Restricted Shares and Units | Common Stock | Restricted Shares and Units | Common Stock | |||||||||||||
Earnings per common share: | ||||||||||||||||
Net income attributable to CST stockholders | $ | 39 | $ | 43 | ||||||||||||
Less dividends declared: | ||||||||||||||||
Common stock | 10 | 9 | ||||||||||||||
Undistributed earnings | $ | 29 | $ | 34 | ||||||||||||
Weighted-average common shares outstanding (in thousands) | 355 | 76,800 | 288 | 75,410 | ||||||||||||
Earnings per common share | ||||||||||||||||
Distributed earnings | $ | 0.12 | $ | 0.12 | $ | 0.13 | $ | 0.13 | ||||||||
Undistributed earnings | 0.38 | 0.38 | 0.44 | 0.44 | ||||||||||||
Total earnings per common share | $ | 0.50 | $ | 0.50 | $ | 0.57 | $ | 0.57 | ||||||||
Earnings per common share - assuming dilution: | ||||||||||||
Net income attributable to CST stockholders | $ | 39 | $ | 43 | ||||||||
Weighted-average common shares outstanding (in thousands) | 76,800 | 75,410 | ||||||||||
Common equivalent shares: | ||||||||||||
Stock options (in thousands) | 146 | 18 | ||||||||||
Restricted stock (in thousands) | 102 | 85 | ||||||||||
Restricted stock units (in thousands) | 109 | 27 | ||||||||||
Weighted-average common shares outstanding - assuming dilution (in thousands) | 77,157 | 75,540 | ||||||||||
Earnings per common share - assuming dilution | $ | 0.50 | $ | 0.57 | ||||||||
The table below presents securities that have been excluded from the computation of diluted earnings per share because they would have been anti-dilutive for the periods presented:
Three Months Ended | Six Months Ended | |||||||||||
June 30, | June 30, | |||||||||||
2015 | 2014 | 2015 | 2014 | |||||||||
Weighted-average anti-dilutive options (in thousands) | 458 | 364 | 283 | 327 | ||||||||
Note 13. SEGMENT INFORMATION
We have three reportable segments: U.S. Retail, Canadian Retail and CrossAmerica. The U.S. Retail, Canadian Retail and CrossAmerica segments are managed as individual strategic business units. Each segment experiences different operating income margins due to certain unique operating characteristics, geographic supply and demand attributes, specific country and local regulatory environments, and is exposed to variability in gross profit from the volatility of crude oil prices. Operating revenues from our heating oil business were less than 5% of our operating revenues for each period presented and have been included within the Canadian Retail segment information.
Results that are not included in our reportable segments are included in the corporate category, which consist primarily of general and administrative costs. Management evaluates the performance of our CrossAmerica segment without considering the effects
18
CST BRANDS, INC.
CONDENSED NOTES TO CONSOLIDATED FINANCIAL STATEMENTS
of the fair value adjustments to CrossAmerica’s historical account balances required under ASC 805—Business Combinations. As a result, we have included a fair value column to reconcile to our consolidated results. The elimination column represents wholesale fuel supplied to our U.S. Retail segment from CrossAmerica and rental income for retail sites owned by CrossAmerica and leased by our U.S. Retail segment.
The following table reflects activity related to our reportable segments (in millions):
U.S. Retail | Canada Retail | CrossAmerica | Corporate | Eliminations | Fair value adjustments | Consolidated | ||||||||||||||||||||||
Three months ended June 30, 2015: | ||||||||||||||||||||||||||||
Operating revenues | $ | 1,638 | $ | 909 | $ | 606 | $ | — | $ | — | $ | — | $ | 3,153 | ||||||||||||||
Intersegment revenues | — | — | 42 | — | (42 | ) | — | — | ||||||||||||||||||||
Gross profit | 186 | 91 | 39 | — | — | — | 316 | |||||||||||||||||||||
Depreciation, amortization and accretion expense | 23 | 10 | 11 | — | — | 7 | 51 | |||||||||||||||||||||
Operating income (loss) | 48 | 28 | 13 | (39 | ) | — | (7 | ) | 43 | |||||||||||||||||||
Three months ended June 30, 2014: | ||||||||||||||||||||||||||||
Operating revenues from external customers | $ | 2,029 | $ | 1,232 | $ | — | $ | — | $ | — | $ | — | $ | 3,261 | ||||||||||||||
Gross profit | 182 | 98 | — | — | — | — | 280 | |||||||||||||||||||||
Depreciation, amortization and accretion expense | 21 | 9 | — | — | — | — | 30 | |||||||||||||||||||||
Operating income (loss) | 53 | 29 | — | (25 | ) | — | — | 57 | ||||||||||||||||||||
U.S. Retail | Canada Retail | CrossAmerica | Corporate | Eliminations | Fair value adjustments | Consolidated | ||||||||||||||||||||||
Six months ended June 30, 2015: | ||||||||||||||||||||||||||||
Operating revenues | $ | 3,000 | $ | 1,762 | 1,054 | $ | — | $ | — | $ | — | $ | 5,816 | |||||||||||||||
Intersegment revenues | — | — | 72 | — | (72 | ) | — | — | ||||||||||||||||||||
Gross profit | 362 | 184 | 74 | — | — | — | 620 | |||||||||||||||||||||
Depreciation, amortization and accretion expense | 47 | 19 | 23 | — | — | 16 | 105 | |||||||||||||||||||||
Operating income (loss) | 90 | 56 | 23 | (89 | ) | — | (16 | ) | 64 | |||||||||||||||||||
Total expenditures for long-lived assets (including acquisitions) | 124 | 14 | 129 | — | — | — | 267 | |||||||||||||||||||||
Six months ended June 30, 2014: | ||||||||||||||||||||||||||||
Operating revenues from external customers | $ | 3,828 | $ | 2,434 | $ | — | $ | — | $ | — | $ | — | $ | 6,262 | ||||||||||||||
Gross profit | 333 | 192 | — | — | — | — | 525 | |||||||||||||||||||||
Depreciation, amortization and accretion expense | 43 | 18 | — | — | — | — | 61 | |||||||||||||||||||||
Operating income (loss) | 77 | 55 | — | (50 | ) | — | — | 82 | ||||||||||||||||||||
Total expenditures for long-lived assets (including acquisitions) | 76 | 16 | — | — | — | — | 92 | |||||||||||||||||||||
19
CST BRANDS, INC.
CONDENSED NOTES TO CONSOLIDATED FINANCIAL STATEMENTS
Note 14. SUPPLEMENTAL CASH FLOW INFORMATION
In order to determine net cash provided by operating activities, net income is adjusted by, among other things, changes in current assets and current liabilities as follows (in millions):
Six Months Ended June 30, | ||||||||
2015 | 2014 | |||||||
Decrease (increase): | ||||||||
Receivables, net | $ | (11 | ) | $ | (42 | ) | ||
Inventories | 11 | 13 | ||||||
Deferred income taxes | (3 | ) | — | |||||
Prepaid expenses and other | — | (3 | ) | |||||
Increase (decrease): | ||||||||
Accounts payable | 7 | 8 | ||||||
Accounts payable to Valero | 55 | 68 | ||||||
Accrued expenses | 2 | 10 | ||||||
Dividends payable | 5 | — | ||||||
Taxes other than income taxes | (2 | ) | 5 | |||||
Income taxes payable | (6 | ) | 2 | |||||
Changes in working capital | $ | 58 | $ | 61 | ||||
The above changes in current assets and current liabilities may differ from changes between amounts reflected in the applicable balance sheets for the respective periods for the following reasons:
• | acquisitions, including the consolidation of CrossAmerica; |
• | amounts accrued for capital expenditures are reflected in investing activities when such amounts are paid; and |
• | certain differences between balance sheet changes and the changes reflected above result from translating foreign currency denominated amounts at the applicable exchange rates as of each balance sheet date. |
Cash flows related to interest were as follows (in millions):
Six Months Ended June 30, | ||||||||
2015 | 2014 | |||||||
Interest paid in excess of amount capitalized | $ | 26 | $ | 19 | ||||
Income taxes paid | 33 | 19 | ||||||
There were no significant non-cash investing or financing activities for the six months ended June 30, 2015 and 2014.
Note 15. TERMINATION BENEFITS
CST accrued $4 million of severance and benefit costs in 2015 related to certain CST employees who were officers of CrossAmerica who have terminated their employment. Such costs are included in general and administrative expenses.
As a result of the continued integration of certain processes and systems of our recently acquired businesses, CrossAmerica committed to a workforce reduction affecting certain employees of CrossAmerica or its affiliates and is recognizing $2 million of estimated cost of severance and other benefits ratably over the required service period.
In addition, at December 31, 2014, CrossAmerica had a $2 million accrual for severance and benefit costs related to certain officers who terminated their employment, of which $1 million was paid on April 14, 2015.
20
CST BRANDS, INC.
CONDENSED NOTES TO CONSOLIDATED FINANCIAL STATEMENTS
A rollforward of our liability for severance and other termination benefits is as follows (in millions):
Balance at December 31, 2014 | $ | 2 | ||
Provision for termination benefits (included in general and administrative expenses) | 5 | |||
Termination benefits paid | (1 | ) | ||
Balance at June 30, 2015 | $ | 6 | ||
Note 16. GUARANTOR SUBSIDIARIES
CST’s 100% owned, domestic subsidiaries (the “Guarantor Subsidiaries”) fully and unconditionally guarantee, on a joint and several basis, CST’s 5% senior notes. CrossAmerica is not a guarantor under CST’s 5% senior notes. The following consolidating schedules present financial information on a consolidated basis in conformity with the SEC’s Regulation S-X Rule 3-10(f):
21
CST BRANDS, INC.
CONDENSED NOTES TO CONSOLIDATED FINANCIAL STATEMENTS
CONSOLIDATING BALANCE SHEETS
(Millions of Dollars)
June 30, 2015 | |||||||||||||||||||||||||||||||
Parent Company | Guarantor Subsidiaries | Non-Guarantor Subsidiaries | CST Eliminations | Total CST | CrossAmerica | Eliminations | Total Consolidated | ||||||||||||||||||||||||
US | Canada | ||||||||||||||||||||||||||||||
ASSETS | |||||||||||||||||||||||||||||||
Current assets: | |||||||||||||||||||||||||||||||
Cash | $ | — | $ | 104 | $ | 239 | $ | — | $ | 343 | $ | 5 | $ | — | $ | 348 | |||||||||||||||
Receivables, net | 2 | 67 | 66 | — | 135 | 41 | (2 | ) | 174 | ||||||||||||||||||||||
Inventories | — | 134 | 64 | — | 198 | 18 | — | 216 | |||||||||||||||||||||||
Deferred income taxes | — | 14 | — | — | 14 | — | — | 14 | |||||||||||||||||||||||
Prepaid expenses and other | — | 8 | 6 | — | 14 | 11 | — | 25 | |||||||||||||||||||||||
Total current assets | 2 | 327 | 375 | — | 704 | 75 | (2 | ) | 777 | ||||||||||||||||||||||
Property and equipment, at cost | — | 1,718 | 500 | — | 2,218 | 609 | — | 2,827 | |||||||||||||||||||||||
Accumulated depreciation | — | (545 | ) | (172 | ) | — | (717 | ) | (29 | ) | — | (746 | ) | ||||||||||||||||||
Property and equipment, net | — | 1,173 | 328 | — | 1,501 | 580 | — | 2,081 | |||||||||||||||||||||||
Intangible assets, net | — | 97 | 15 | — | 112 | 360 | — | 472 | |||||||||||||||||||||||
Goodwill | — | 35 | — | — | 35 | 259 | — | 294 | |||||||||||||||||||||||
Investment in subsidiaries | 2,108 | — | — | (2,108 | ) | — | — | — | — | ||||||||||||||||||||||
Investment in CrossAmerica | (1 | ) | 58 | — | — | 57 | — | (57 | ) | — | |||||||||||||||||||||
Deferred income taxes | — | — | 72 | — | 72 | — | — | 72 | |||||||||||||||||||||||
Other assets, net | 29 | 25 | 4 | — | 58 | 16 | — | 74 | |||||||||||||||||||||||
Total assets | $ | 2,138 | $ | 1,715 | $ | 794 | $ | (2,108 | ) | $ | 2,539 | $ | 1,290 | $ | (59 | ) | $ | 3,770 | |||||||||||||
Historical amounts for CrossAmerica were adjusted to their fair values as a result of the GP Purchase discussed in Note 2. These adjustments were as follows as of June 30, 2015: | |||||||||||||||||||||||||||||||
Property and equipment, net | $ | 101 | |||||||||||||||||||||||||||||
Intangibles, net | 276 | ||||||||||||||||||||||||||||||
Goodwill | 176 | ||||||||||||||||||||||||||||||
22
CST BRANDS, INC.
CONDENSED NOTES TO CONSOLIDATED FINANCIAL STATEMENTS
June 30, 2015 | |||||||||||||||||||||||||||||||
Parent Company | Guarantor Subsidiaries | Non-Guarantor Subsidiaries | CST Eliminations | Total CST | CrossAmerica | Eliminations | Total Consolidated | ||||||||||||||||||||||||
US | Canada | ||||||||||||||||||||||||||||||
LIABILITIES AND STOCKHOLDERS’ EQUITY | |||||||||||||||||||||||||||||||
Current liabilities: | |||||||||||||||||||||||||||||||
Current portion of debt and capital lease obligations | $ | 76 | $ | 1 | $ | — | $ | — | $ | 77 | $ | 8 | $ | — | $ | 85 | |||||||||||||||
Accounts payable | 9 | 75 | 40 | — | 124 | 48 | (2 | ) | 170 | ||||||||||||||||||||||
Accounts payable to Valero | (1 | ) | 138 | 92 | — | 229 | — | — | 229 | ||||||||||||||||||||||
Accrued expenses | 5 | 40 | 15 | — | 60 | 14 | — | 74 | |||||||||||||||||||||||
Taxes other than income taxes | — | 24 | 1 | — | 25 | 12 | — | 37 | |||||||||||||||||||||||
Income taxes payable | 1 | 4 | 3 | — | 8 | 3 | — | 11 | |||||||||||||||||||||||
Deferred income taxes | — | — | — | — | — | 1 | — | 1 | |||||||||||||||||||||||
Dividends payable | 5 | — | — | — | 5 | — | — | 5 | |||||||||||||||||||||||
Total current liabilities | 95 | 282 | 151 | — | 528 | 86 | (2 | ) | 612 | ||||||||||||||||||||||
Debt and capital lease obligations, less current portion | 925 | 7 | 4 | — | 936 | 266 | — | 1,202 | |||||||||||||||||||||||
Deferred income taxes | (1 | ) | 127 | — | — | 126 | 58 | — | 184 | ||||||||||||||||||||||
Intercompany payables (receivables) | 287 | (288 | ) | 1 | — | — | — | — | — | ||||||||||||||||||||||
Asset retirement obligations | — | 73 | 16 | — | 89 | 22 | — | 111 | |||||||||||||||||||||||
Other long-term liabilities | 15 | 13 | 16 | — | 44 | 16 | — | 60 | |||||||||||||||||||||||
Total liabilities | 1,321 | 214 | 188 | — | 1,723 | 448 | (2 | ) | 2,169 | ||||||||||||||||||||||
Commitments and contingencies | |||||||||||||||||||||||||||||||
Stockholders’ equity: | |||||||||||||||||||||||||||||||
Common stock | 1 | — | — | — | 1 | — | — | 1 | |||||||||||||||||||||||
APIC | 536 | 1,213 | 466 | (1,680 | ) | 535 | — | (57 | ) | 478 | |||||||||||||||||||||
Treasury stock | (52 | ) | — | — | — | (52 | ) | — | — | (52 | ) | ||||||||||||||||||||
Retained earnings | 298 | 288 | 140 | (428 | ) | 298 | — | — | 298 | ||||||||||||||||||||||
AOCI | 34 | — | — | — | 34 | — | — | 34 | |||||||||||||||||||||||
Noncontrolling interest | — | — | — | — | — | 842 | — | 842 | |||||||||||||||||||||||
Total stockholders’ equity | 817 | 1,501 | 606 | (2,108 | ) | 816 | 842 | (57 | ) | 1,601 | |||||||||||||||||||||
Total liabilities and stockholders’ equity | $ | 2,138 | $ | 1,715 | $ | 794 | $ | (2,108 | ) | $ | 2,539 | $ | 1,290 | $ | (59 | ) | $ | 3,770 | |||||||||||||
Deferred taxes and noncontrolling interest for CrossAmerica include $13 million and $540 million, respectively, related to the fair value adjustments to CrossAmerica’s net assets as a result of the GP Purchase discussed in Note 2.
23
CST BRANDS, INC.
CONDENSED NOTES TO CONSOLIDATED FINANCIAL STATEMENTS
CONSOLIDATING BALANCE SHEETS
(Millions of Dollars)
December 31, 2014 | |||||||||||||||||||||||||||||||
Parent Company | Guarantor Subsidiaries | Non-Guarantor Subsidiaries | CST Eliminations | Total CST | CrossAmerica | Eliminations | Total Consolidated | ||||||||||||||||||||||||
US | Canada | ||||||||||||||||||||||||||||||
ASSETS | |||||||||||||||||||||||||||||||
Current assets: | |||||||||||||||||||||||||||||||
Cash | $ | — | $ | 148 | $ | 205 | $ | — | $ | 353 | $ | 15 | $ | — | $ | 368 | |||||||||||||||
Receivables, net | 3 | 62 | 73 | — | 138 | 38 | (3 | ) | 173 | ||||||||||||||||||||||
Inventories | — | 144 | 65 | — | 209 | 12 | — | 221 | |||||||||||||||||||||||
Deferred income taxes | — | 11 | — | — | 11 | 1 | — | 12 | |||||||||||||||||||||||
Prepaid expenses and other | — | 9 | 5 | — | 14 | 10 | — | 24 | |||||||||||||||||||||||
Total current assets | 3 | 374 | 348 | — | 725 | 76 | (3 | ) | 798 | ||||||||||||||||||||||
Property and equipment, at cost | 1 | 1,647 | 524 | — | 2,172 | 490 | — | 2,662 | |||||||||||||||||||||||
Accumulated depreciation | — | (527 | ) | (170 | ) | — | (697 | ) | (8 | ) | — | (705 | ) | ||||||||||||||||||
Property and equipment, net | 1 | 1,120 | 354 | — | 1,475 | 482 | — | 1,957 | |||||||||||||||||||||||
Intangible assets, net | — | 97 | 19 | — | 116 | 370 | — | 486 | |||||||||||||||||||||||
Goodwill | — | 19 | — | — | 19 | 223 | — | 242 | |||||||||||||||||||||||
Investment in subsidiaries | 2,029 | — | — | (2,029 | ) | — | — | — | — | ||||||||||||||||||||||
Deferred income taxes | — | — | 79 | — | 79 | — | — | 79 | |||||||||||||||||||||||
Other assets, net | 30 | 25 | 5 | — | 60 | 19 | — | 79 | |||||||||||||||||||||||
Total assets | $ | 2,063 | $ | 1,635 | $ | 805 | $ | (2,029 | ) | $ | 2,474 | $ | 1,170 | $ | (3 | ) | $ | 3,641 | |||||||||||||
Historical amounts for CrossAmerica were adjusted to their fair values as a result of the GP Purchase discussed in the Form 10-K for the year ended December 31, 2014. These adjustments were as follows: | |||||||||||||||||||||||||||||||
Property and equipment, net | $ | 90 | |||||||||||||||||||||||||||||
Intangibles, net | 292 | ||||||||||||||||||||||||||||||
Goodwill | 183 | ||||||||||||||||||||||||||||||
24
CST BRANDS, INC.
CONDENSED NOTES TO CONSOLIDATED FINANCIAL STATEMENTS
December 31, 2014 | |||||||||||||||||||||||||||||||
Parent Company | Guarantor Subsidiaries | Non-Guarantor Subsidiaries | CST Eliminations | Total CST | CrossAmerica | Eliminations | Total Consolidated | ||||||||||||||||||||||||
US | Canada | ||||||||||||||||||||||||||||||
LIABILITIES AND STOCKHOLDERS’ EQUITY | |||||||||||||||||||||||||||||||
Current liabilities: | |||||||||||||||||||||||||||||||
Current portion of debt and capital lease obligations | $ | 47 | $ | 1 | $ | — | $ | — | $ | 48 | $ | 29 | $ | — | $ | 77 | |||||||||||||||
Accounts payable | 3 | 76 | 47 | — | 126 | 34 | (3 | ) | 157 | ||||||||||||||||||||||
Accounts payable to Valero | — | 104 | 75 | — | 179 | — | — | 179 | |||||||||||||||||||||||
Accrued expenses | 4 | 40 | 14 | — | 58 | 21 | — | 79 | |||||||||||||||||||||||
Taxes other than income taxes | — | 27 | — | — | 27 | 10 | — | 37 | |||||||||||||||||||||||
Income taxes payable | — | 1 | 15 | — | 16 | — | — | 16 | |||||||||||||||||||||||
Dividends payable | 5 | — | — | — | 5 | — | — | 5 | |||||||||||||||||||||||
Total current liabilities | 59 | 249 | 151 | — | 459 | 94 | (3 | ) | 550 | ||||||||||||||||||||||
Debt and capital lease obligations, less current portion | 956 | 6 | 4 | — | 966 | 261 | — | 1,227 | |||||||||||||||||||||||
Deferred income taxes | — | 112 | — | — | 112 | 38 | — | 150 | |||||||||||||||||||||||
Intercompany payables (receivables) | 220 | (221 | ) | 1 | — | — | — | — | — | ||||||||||||||||||||||
Asset retirement obligations | — | 66 | 17 | — | 83 | 19 | — | 102 | |||||||||||||||||||||||
Other long-term liabilities | 15 | 10 | 16 | — | 41 | 16 | — | 57 | |||||||||||||||||||||||
Total liabilities | 1,250 | 222 | 189 | — | 1,661 | 428 | (3 | ) | 2,086 | ||||||||||||||||||||||
Commitments and contingencies | |||||||||||||||||||||||||||||||
Stockholders’ equity: | |||||||||||||||||||||||||||||||
Common stock | 1 | — | — | — | 1 | — | — | 1 | |||||||||||||||||||||||
APIC | 488 | 1,154 | 502 | (1,656 | ) | 488 | — | — | 488 | ||||||||||||||||||||||
Treasury stock | (22 | ) | — | — | — | (22 | ) | — | — | (22 | ) | ||||||||||||||||||||
Retained earnings | 269 | 259 | 114 | (373 | ) | 269 | — | — | 269 | ||||||||||||||||||||||
AOCI | 77 | — | — | — | 77 | — | — | 77 | |||||||||||||||||||||||
Noncontrolling interest | — | — | — | — | — | 742 | — | 742 | |||||||||||||||||||||||
Total stockholders’ equity | 813 | 1,413 | 616 | (2,029 | ) | 813 | 742 | — | 1,555 | ||||||||||||||||||||||
Total liabilities and stockholders’ equity | $ | 2,063 | $ | 1,635 | $ | 805 | $ | (2,029 | ) | $ | 2,474 | $ | 1,170 | $ | (3 | ) | $ | 3,641 | |||||||||||||
Deferred taxes and noncontrolling interest for CrossAmerica include $14 million and $551 million, respectively, related to the fair value adjustments to CrossAmerica’s net assets as a result of the GP Purchase discussed in Form 10-K for the year ended December 31, 2014.
25
CST BRANDS, INC.
CONDENSED NOTES TO CONSOLIDATED FINANCIAL STATEMENTS
CONSOLIDATING STATEMENTS OF INCOME AND COMPREHENSIVE INCOME
(Millions of Dollars)
Three Months Ended June 30, 2015 | |||||||||||||||||||||||||||||||
Parent Company | Guarantor Subsidiaries | Non-Guarantor Subsidiaries | CST Eliminations | Total CST | CrossAmerica | Eliminations | Total Consolidated | ||||||||||||||||||||||||
US | Canada | ||||||||||||||||||||||||||||||
Operating revenues | $ | — | $ | 1,638 | $ | 909 | $ | — | $ | 2,547 | $ | 648 | $ | (42 | ) | $ | 3,153 | ||||||||||||||
Cost of sales | — | 1,452 | 818 | — | 2,270 | 609 | (42 | ) | 2,837 | ||||||||||||||||||||||
Gross profit | — | 186 | 91 | — | 277 | 39 | — | 316 | |||||||||||||||||||||||
Income from CST Fuel Supply Equity | — | — | — | — | — | 1 | (1 | ) | — | ||||||||||||||||||||||
Operating expenses: | |||||||||||||||||||||||||||||||
Operating expenses | — | 117 | 53 | — | 170 | 16 | (1 | ) | 185 | ||||||||||||||||||||||
General and administrative expenses | 1 | 24 | 5 | — | 30 | 9 | — | 39 | |||||||||||||||||||||||
Depreciation, amortization and accretion expense | — | 23 | 10 | — | 33 | 18 | (a) | — | 51 | ||||||||||||||||||||||
Total operating expenses | 1 | 164 | 68 | — | 233 | 43 | (1 | ) | 275 | ||||||||||||||||||||||
Gain on the sale of assets, net | — | 2 | — | — | 2 | — | — | 2 | |||||||||||||||||||||||
Operating (loss) income | (1 | ) | 24 | 23 | — | 46 | (3 | ) | — | 43 | |||||||||||||||||||||
Other income, net | 1 | 1 | — | — | 2 | — | — | 2 | |||||||||||||||||||||||
Interest expense | (9 | ) | — | — | — | (9 | ) | (5 | ) | — | (14 | ) | |||||||||||||||||||
Equity in earnings of CrossAmerica | (1 | ) | — | — | — | (1 | ) | — | 1 | — | |||||||||||||||||||||
Equity in earnings of subsidiaries | 36 | — | — | (36 | ) | — | — | — | — | ||||||||||||||||||||||
Income (loss) before income tax expense | 26 | 25 | 23 | (36 | ) | 38 | (8 | ) | 1 | 31 | |||||||||||||||||||||
Income tax expense (benefit) | — | 7 | 6 | — | 13 | (1 | ) | — | 12 | ||||||||||||||||||||||
Net income (loss) | 26 | 18 | 17 | (36 | ) | 25 | (7 | ) | 1 | 19 | |||||||||||||||||||||
Net loss attributable to noncontrolling interest | — | — | — | — | — | — | 6 | 6 | |||||||||||||||||||||||
Net income attributable to CST stockholders | $ | 26 | $ | 18 | $ | 17 | $ | (36 | ) | $ | 25 | $ | (7 | ) | $ | 7 | $ | 25 | |||||||||||||
Other comprehensive loss, net of tax: | |||||||||||||||||||||||||||||||
Net income (loss) | $ | 26 | $ | 18 | $ | 17 | $ | (36 | ) | $ | 25 | $ | (7 | ) | $ | 1 | $ | 19 | |||||||||||||
Foreign currency translation adjustment | 9 | — | — | — | 9 | — | — | 9 | |||||||||||||||||||||||
Comprehensive income (loss) | 35 | 18 | 17 | (36 | ) | 34 | (7 | ) | 1 | 28 | |||||||||||||||||||||
Comprehensive income (loss) attributable to noncontrolling interests | — | — | — | — | — | (6 | ) | — | (6 | ) | |||||||||||||||||||||
Comprehensive income attributable to CST stockholders | $ | 35 | $ | 18 | $ | 17 | $ | (36 | ) | $ | 34 | $ | (1 | ) | $ | 1 | $ | 34 | |||||||||||||
26
CST BRANDS, INC.
CONDENSED NOTES TO CONSOLIDATED FINANCIAL STATEMENTS
CONSOLIDATING STATEMENTS OF INCOME AND COMPREHENSIVE INCOME
(CONTINUED)
(Millions of Dollars)
Three Months Ended June 30, 2014 | |||||||||||||||||||
Parent Company | Guarantor Subsidiaries | Non-Guarantor Subsidiaries | Eliminations | Total Consolidated | |||||||||||||||
Operating revenues | $ | — | $ | 2,029 | $ | 1,232 | $ | — | $ | 3,261 | |||||||||
Cost of sales | — | 1,847 | 1,134 | — | 2,981 | ||||||||||||||
Gross profit | — | 182 | 98 | — | 280 | ||||||||||||||
Operating expenses: | |||||||||||||||||||
Operating expenses | — | 108 | 60 | — | 168 | ||||||||||||||
General and administrative expenses | 2 | 18 | 5 | — | 25 | ||||||||||||||
Depreciation, amortization and accretion expense | — | 21 | 9 | — | 30 | ||||||||||||||
Total operating expenses | 2 | 147 | 74 | — | 223 | ||||||||||||||
Operating (loss) income | (2 | ) | 35 | 24 | — | 57 | |||||||||||||
Other income, net | — | — | 1 | — | 1 | ||||||||||||||
Interest expense | (10 | ) | — | — | — | (10 | ) | ||||||||||||
Equity in earnings of subsidiaries | 44 | — | — | (44 | ) | — | |||||||||||||
Income (loss) before income tax expense | 32 | 35 | 25 | (44 | ) | 48 | |||||||||||||
Income tax expense (benefit) | — | 9 | 7 | — | 16 | ||||||||||||||
Net income (loss) | 32 | 26 | 18 | (44 | ) | 32 | |||||||||||||
Other comprehensive income (loss), net of tax: | |||||||||||||||||||
Foreign currency translation adjustment | 22 | — | — | — | 22 | ||||||||||||||
Comprehensive income | $ | 54 | $ | 26 | $ | 18 | $ | (44 | ) | $ | 54 | ||||||||
27
CST BRANDS, INC.
CONDENSED NOTES TO CONSOLIDATED FINANCIAL STATEMENTS
CONSOLIDATING STATEMENTS OF INCOME AND COMPREHENSIVE INCOME
(Millions of Dollars)
Six Months Ended June 30, 2015 | |||||||||||||||||||||||||||||||
Parent Company | Guarantor Subsidiaries | Non-Guarantor Subsidiaries | CST Eliminations | Total CST | CrossAmerica | Eliminations | Total Consolidated | ||||||||||||||||||||||||
US | Canada | ||||||||||||||||||||||||||||||
Operating revenues | $ | — | $ | 3,000 | $ | 1,762 | $ | — | $ | 4,762 | $ | 1,126 | $ | (72 | ) | $ | 5,816 | ||||||||||||||
Cost of sales | — | 2,638 | 1,578 | — | 4,216 | 1,052 | (72 | ) | 5,196 | ||||||||||||||||||||||
Gross profit | — | 362 | 184 | — | 546 | 74 | — | 620 | |||||||||||||||||||||||
Income from CST Fuel Supply Equity | — | — | — | — | — | 2 | (2 | ) | — | ||||||||||||||||||||||
Operating expenses: | |||||||||||||||||||||||||||||||
Operating expenses | — | 232 | 109 | — | 341 | 30 | (2 | ) | 369 | ||||||||||||||||||||||
General and administrative expenses | 4 | 55 | 10 | — | 69 | 20 | — | 89 | |||||||||||||||||||||||
Depreciation, amortization and accretion expense | — | 47 | 19 | — | 66 | 39 | (a) | — | 105 | ||||||||||||||||||||||
Total operating expenses | 4 | 334 | 138 | — | 476 | 89 | (2 | ) | 563 | ||||||||||||||||||||||
Gain on the sale of assets, net | — | 7 | — | — | 7 | — | — | 7 | |||||||||||||||||||||||
Operating (loss) income | (4 | ) | 35 | 46 | — | 77 | (13 | ) | — | 64 | |||||||||||||||||||||
Other income, net | 1 | 2 | 1 | — | 4 | — | — | 4 | |||||||||||||||||||||||
Interest expense | (20 | ) | — | — | — | (20 | ) | (9 | ) | — | (29 | ) | |||||||||||||||||||
Equity in earnings of CrossAmerica | (1 | ) | — | — | — | (1 | ) | — | 1 | — | |||||||||||||||||||||
Equity in earnings of subsidiaries | 63 | — | — | (63 | ) | — | — | — | — | ||||||||||||||||||||||
Income (loss) before income tax expense | 39 | 37 | 47 | (63 | ) | 60 | (22 | ) | 1 | 39 | |||||||||||||||||||||
Income tax expense (benefit) | — | 8 | 13 | — | 21 | (7 | ) | — | 14 | ||||||||||||||||||||||
Net income (loss) | 39 | 29 | 34 | (63 | ) | 39 | (15 | ) | 1 | 25 | |||||||||||||||||||||
Net loss attributable to noncontrolling interest | — | — | — | — | — | — | 14 | 14 | |||||||||||||||||||||||
Net income attributable to CST stockholders | $ | 39 | $ | 29 | $ | 34 | $ | (63 | ) | $ | 39 | $ | (15 | ) | $ | 15 | $ | 39 | |||||||||||||
Other comprehensive loss, net of tax: | |||||||||||||||||||||||||||||||
Net income (loss) | $ | 39 | $ | 29 | $ | 34 | $ | (63 | ) | $ | 39 | $ | (15 | ) | $ | 1 | $ | 25 | |||||||||||||
Foreign currency translation adjustment | (43 | ) | — | — | — | (43 | ) | — | — | (43 | ) | ||||||||||||||||||||
Comprehensive income (loss) | (4 | ) | 29 | 34 | (63 | ) | (4 | ) | (15 | ) | 1 | (18 | ) | ||||||||||||||||||
Comprehensive income (loss) attributable to noncontrolling interests | — | — | — | — | — | (14 | ) | — | (14 | ) | |||||||||||||||||||||
Comprehensive income attributable to CST stockholders | $ | (4 | ) | $ | 29 | $ | 34 | $ | (63 | ) | $ | (4 | ) | $ | (1 | ) | $ | 1 | $ | (4 | ) | ||||||||||
28
CST BRANDS, INC.
CONDENSED NOTES TO CONSOLIDATED FINANCIAL STATEMENTS
CONSOLIDATING STATEMENTS OF INCOME AND COMPREHENSIVE INCOME
(CONTINUED)
(Millions of Dollars)
Six Months Ended June 30, 2014 | |||||||||||||||||||
Parent Company | Guarantor Subsidiaries | Non-Guarantor Subsidiaries | Eliminations | Total Consolidated | |||||||||||||||
Operating revenues | $ | — | $ | 3,828 | $ | 2,434 | $ | — | $ | 6,262 | |||||||||
Cost of sales | — | 3,495 | 2,242 | — | 5,737 | ||||||||||||||
Gross profit | — | 333 | 192 | — | 525 | ||||||||||||||
Operating expenses: | |||||||||||||||||||
Operating expenses | — | 213 | 119 | — | 332 | ||||||||||||||
General and administrative expenses | 3 | 37 | 10 | — | 50 | ||||||||||||||
Depreciation, amortization and accretion expense | — | 43 | 18 | — | 61 | ||||||||||||||
Total operating expenses | 3 | 293 | 147 | — | 443 | ||||||||||||||
Operating (loss) income | (3 | ) | 40 | 45 | — | 82 | |||||||||||||
Other income, net | — | — | 2 | — | 2 | ||||||||||||||
Interest expense | (20 | ) | — | — | — | (20 | ) | ||||||||||||
Equity in earnings of subsidiaries | 66 | — | — | (66 | ) | — | |||||||||||||
Income (loss) before income tax expense | 43 | 40 | 47 | (66 | ) | 64 | |||||||||||||
Income tax expense (benefit) | — | 8 | 13 | — | 21 | ||||||||||||||
Net income (loss) | 43 | 32 | 34 | (66 | ) | 43 | |||||||||||||
Other comprehensive income (loss), net of tax: | |||||||||||||||||||
Foreign currency translation adjustment | (2 | ) | — | — | — | (2 | ) | ||||||||||||
Comprehensive income | $ | 41 | $ | 32 | $ | 34 | $ | (66 | ) | $ | 41 | ||||||||
29
CST BRANDS, INC.
CONDENSED NOTES TO CONSOLIDATED FINANCIAL STATEMENTS
CONSOLIDATING STATEMENTS OF CASH FLOWS
(Millions of Dollars)
Six Months Ended June 30, 2015 | |||||||||||||||||||||||||||||||
Parent Company | Guarantor Subsidiaries | Non-Guarantor Subsidiaries | CST Eliminations | Total CST | CrossAmerica | Eliminations | Total Consolidated | ||||||||||||||||||||||||
US | Canada | ||||||||||||||||||||||||||||||
Cash flows from operating activities: | |||||||||||||||||||||||||||||||
Net cash (used in) provided by operating activities | $ | (11 | ) | $ | 111 | $ | 62 | $ | — | $ | 162 | $ | 16 | $ | — | $ | 178 | ||||||||||||||
Cash flows from investing activities: | |||||||||||||||||||||||||||||||
Capital expenditures | — | (102 | ) | (14 | ) | — | (116 | ) | (1 | ) | — | (117 | ) | ||||||||||||||||||
Proceeds from the sale of assets | — | 15 | 1 | — | 16 | 2 | — | 18 | |||||||||||||||||||||||
CST acquisitions | — | (22 | ) | — | — | (22 | ) | — | — | (22 | ) | ||||||||||||||||||||
CrossAmerica acquisitions | — | — | — | — | — | (128 | ) | — | (128 | ) | |||||||||||||||||||||
Distributions from CrossAmerica | — | 2 | — | — | 2 | — | (2 | ) | — | ||||||||||||||||||||||
Other investing activities, net | 1 | 1 | 3 | — | 5 | 1 | — | 6 | |||||||||||||||||||||||
Net cash used in investing activities | 1 | (106 | ) | (10 | ) | — | (115 | ) | (126 | ) | (2 | ) | (243 | ) | |||||||||||||||||
Cash flows from financing activities: | |||||||||||||||||||||||||||||||
Proceeds under the CST revolving credit facility | 20 | — | — | — | 20 | — | — | 20 | |||||||||||||||||||||||
Proceeds under the CrossAmerica revolving credit facility | — | — | — | — | — | 133 | — | 133 | |||||||||||||||||||||||
Payments on the CrossAmerica revolving credit facility | — | — | — | — | — | (146 | ) | — | (146 | ) | |||||||||||||||||||||
Proceeds from issuance of CrossAmerica common units, net | — | — | — | — | — | 139 | — | 139 | |||||||||||||||||||||||
Payments on the CST term loan facility | (22 | ) | — | — | — | (22 | ) | — | — | (22 | ) | ||||||||||||||||||||
Purchases of treasury shares | (29 | ) | — | — | — | (29 | ) | — | — | (29 | ) | ||||||||||||||||||||
Payments of capital lease obligations | — | (1 | ) | — | — | (1 | ) | (1 | ) | — | (2 | ) | |||||||||||||||||||
Dividends paid | (10 | ) | — | — | — | (10 | ) | — | — | (10 | ) | ||||||||||||||||||||
Distributions paid | — | — | — | — | — | (27 | ) | 2 | (25 | ) | |||||||||||||||||||||
Intercompany funding | 51 | (48 | ) | (3 | ) | — | — | — | — | — | |||||||||||||||||||||
Receivables repaid by CrossAmerica related parties | — | — | — | — | — | 2 | — | 2 | |||||||||||||||||||||||
Net cash provided by (used in) financing activities | 10 | (49 | ) | (3 | ) | — | (42 | ) | 100 | 2 | 60 | ||||||||||||||||||||
Effect of foreign exchange rate changes on cash | — | — | (15 | ) | — | (15 | ) | — | — | (15 | ) | ||||||||||||||||||||
Net (decrease) increase in cash | — | (44 | ) | 34 | — | (10 | ) | (10 | ) | — | (20 | ) | |||||||||||||||||||
Cash at beginning of year | — | 148 | 205 | — | 353 | 15 | — | 368 | |||||||||||||||||||||||
Cash at end of period | $ | — | $ | 104 | $ | 239 | $ | — | $ | 343 | $ | 5 | $ | — | $ | 348 | |||||||||||||||
30
CST BRANDS, INC.
CONDENSED NOTES TO CONSOLIDATED FINANCIAL STATEMENTS
CONSOLIDATING STATEMENTS OF CASH FLOWS
(CONTINUED)
(Millions of Dollars)
Six Months Ended June 30, 2014 | |||||||||||||||||||
Parent Company | Guarantor Subsidiaries | Non-Guarantor Subsidiaries | Eliminations | Total Consolidated | |||||||||||||||
Cash flows from operating activities: | |||||||||||||||||||
Net cash (used in) provided by operating activities | $ | (22 | ) | $ | 114 | $ | 76 | $ | — | $ | 168 | ||||||||
Cash flows from investing activities: | |||||||||||||||||||
Capital expenditures | — | (76 | ) | (12 | ) | — | (88 | ) | |||||||||||
Acquisition | — | — | (4 | ) | — | (4 | ) | ||||||||||||
Other investing activities, net | — | (1 | ) | 1 | — | — | |||||||||||||
Net cash used in investing activities | — | (77 | ) | (15 | ) | — | (92 | ) | |||||||||||
Cash flows from financing activities: | |||||||||||||||||||
Payments on long-term debt | (16 | ) | — | — | — | (16 | ) | ||||||||||||
Payments of capital lease obligations | — | (1 | ) | — | — | (1 | ) | ||||||||||||
Dividends paid | (9 | ) | — | — | — | (9 | ) | ||||||||||||
Intercompany funding | 47 | (47 | ) | — | — | — | |||||||||||||
Net cash used in financing activities | 22 | (48 | ) | — | — | (26 | ) | ||||||||||||
Effect of foreign exchange rate changes on cash | — | — | — | — | — | ||||||||||||||
Net increase (decrease) in cash | — | (11 | ) | 61 | — | 50 | |||||||||||||
Cash at beginning of year | — | 231 | 147 | — | 378 | ||||||||||||||
Cash at end of period | $ | — | $ | 220 | $ | 208 | $ | — | $ | 428 | |||||||||
31
ITEM 2. MANAGEMENT’S DISCUSSION AND ANALYSIS OF FINANCIAL CONDITION AND RESULTS OF OPERATIONS
CAUTIONARY STATEMENT FOR THE PURPOSE OF THE SAFE HARBOR PROVISIONS OF THE PRIVATE SECURITIES LITIGATION REFORM ACT OF 1995
Forward-looking statements, within the meaning of Section 27A of the Securities Act of 1933 and Section 21E of the Securities Exchange Act of 1934, are made throughout this quarterly report on Form 10-Q. This quarterly report includes forward-looking statements. Forward-looking statements include the information concerning our possible or assumed future results of operations, business strategies, financing plans, competitive position, credit ratings, dividend and distribution growth, potential growth opportunities, potential operating performance improvements, potential improvements in return on capital employed, benefits resulting from our separation from Valero, the effects of competition and the effects of future legislation or regulations. You can identify our forward-looking statements by the words “anticipate,” “estimate,” “believe,” “continue,” “could,” “intend,” “may,” “plan,” “potential,” “predict,” “seek,” “should,” “will,” “would,” “expect,” “objective,” “projection,” “forecast,” “guidance,” “outlook,” “effort,” “target” and similar expressions. Such statements are based on management’s current views and assumptions, and involve risks and uncertainties that could affect expected results. These forward-looking statements include, among other things, statements regarding:
• | future retail gross profits, including gasoline, diesel, heating oil and convenience store merchandise gross profits; |
• | our anticipated level of capital investments and the effect of these capital investments on our results of operations; |
• | anticipated trends in the demand for, and volumes sold of, gasoline, diesel and heating oil globally and in the regions where we operate; |
• | expectations regarding environmental, tax and other regulatory initiatives; and |
• | the effect of general economic and other conditions on retail fundamentals. |
In general, we based the forward-looking statements on our current expectations, estimates and projections about our company and the industry in which we operate. We caution you that these statements are not guarantees of future performance as they involve assumptions that, while made in good faith, may prove to be incorrect, and involve risks and uncertainties we cannot predict. In addition, we based many of these forward-looking statements on assumptions about future events that may prove to be inaccurate. Accordingly, our actual outcomes and results may differ materially from what we have expressed or forecasted in the forward-looking statements. Any differences could result from a variety of factors, including the following:
• | volatility and seasonality in crude oil, wholesale motor fuel costs and motor fuel sales; |
• | political conditions in oil producing regions and global demand for oil; |
• | competitive pressures from convenience stores and other retailers located in our markets; |
• | changes in our customers’ behavior and travel as a result of changing economic conditions, labor strikes or otherwise; |
• | increasing consumer preference for alternative motor fuel and improvements in fuel efficiency; |
• | future legislation or campaigns to discourage smoking; |
• | our ability to comply with federal, provincial and state regulations, including those related to environmental matters, the sale of alcohol, cigarettes and fresh foods, and employment laws and health benefits; |
• | significant increases in statutory minimum wage; |
• | future regulations and actions that could expand the non-exempt status of employees under the Fair Labor Standards Act; |
• | severe or unfavorable weather conditions; |
• | dependence on senior management and the ability to attract qualified employees; |
• | inability to build or acquire and successfully integrate new retail sites; |
• | fluctuations in the exchange rate between the United States and Canadian currencies; |
32
• | dependence on Valero and other suppliers for motor fuel; |
• | dependence on suppliers, including Valero, for credit terms; |
• | litigation or adverse publicity concerning food quality, food safety or other health concerns related to our food product merchandise or restaurant facilities; |
• | dangers inherent in storing and transporting motor fuel; |
• | pending or future consumer, environmental or other litigation; |
• | dependence on our information technology systems and maintaining data security; |
• | acts of terrorism or war; |
• | our and CrossAmerica’s access to capital, credit ratings, debt and ability to raise additional debt or equity financing; |
• | impairment of long-lived assets, intangible assets or goodwill; |
• | our ability to comply with covenants in any credit agreements or other debt instruments and availability, terms and deployment of capital; |
• | our business strategy and operations and potential conflicts of interest with CrossAmerica; |
• | the ability to successfully integrate CrossAmerica’s operations and employees; |
• | future income tax legislation; |
• | a determination by the IRS that the spin-off or certain related transactions should be treated as a taxable transaction; and |
• | other unforeseen factors. |
You should consider the areas of risk described above, as well as those set forth in Item 1A below and the section entitled “Risk Factors” included in our Form 10-K, in connection with considering any forward-looking statements that may be made by us and our businesses generally. We cannot assure you that projected results or events reflected in the forward-looking statements will be achieved or will occur. The forward-looking statements included in this report are made as of the date of this report. We undertake no obligation to publicly release any revisions to any forward-looking statements, to report events or to report the occurrence of unanticipated events.
33
MANAGEMENT’S DISCUSSION AND ANALYSIS OF FINANCIAL CONDITION AND RESULTS OF OPERATIONS
The following Management’s Discussion and Analysis of Financial Condition and Results of Operations (“MD&A”) is provided as a supplement to, and should be read in conjunction with, our consolidated financial statements and the accompanying notes to these financial statements contained elsewhere in this report, this MD&A section and the consolidated and combined financial statements and accompanying notes to those financial statements in our Form 10-K. Our Form 10-K contains a discussion of other matters not included herein, such as disclosures regarding critical accounting policies and estimates, and contractual obligations.
MD&A is organized as follows:
• | Significant Factors Affecting Our Profitability—This section describes the significant impact on our results of operations caused by crude oil commodity price volatility and seasonality. |
• | Recently Acquired Retail Sites—This section describes our operating model related to recently acquired convenience store operations. |
• | Results of Operations—This section provides an analysis of our results of operations, including the results of operations of our business segments, for the three and six months ended June 30, 2015 and 2014, and an outlook for our business. |
• | Liquidity and Capital Resources—This section provides a discussion of our financial condition and cash flows. It also includes a discussion of our debt, capital requirements and other matters impacting our liquidity and capital resources. |
• | New Accounting Policies—This section describes new accounting pronouncements that we have already adopted, those that we are required to adopt in the future, and those that became applicable in the current year as a result of new circumstances. |
• | Critical Accounting Policies—This section describes the accounting policies and estimates that we consider most important for our business and that require significant judgment. |
34
Significant Factors Affecting Our Profitability
The Significance of Crude Oil and Wholesale Motor Fuel Prices on Our Revenues, Cost of Sales and Gross Profit
CST
The prices paid to our fuel suppliers for wholesale motor fuel are closely correlated to the price of crude oil. The crude oil commodity markets are highly volatile, and the market prices of crude oil, and wholesale motor fuel experience significant and rapid fluctuations. We attempt to pass along wholesale motor fuel price changes to our retail customers through “at the pump” retail price changes; however, market conditions do not always allow us to do so immediately. The timing of any related increase or decrease in “at the pump” retail prices is affected by competitive conditions in each geographic market in which we operate. As such, the prices we charge our customers for motor fuel and the gross profit we receive on our motor fuel sales can increase or decrease significantly and rapidly over short periods of time. It has been our experience, however, that over time, motor fuel gross profits are less affected by the volatility of crude oil and wholesale motor fuel prices as we and our competitors successfully pass along wholesale motor fuel price changes to consumers.
Changes in our average motor fuel selling price per gallon and gross margin over the three and six months ended June 30, 2015 and 2014 are directly related to the changes in crude oil and wholesale motor fuel prices over the same period. Variations in our reported revenues and cost of sales are, therefore, primarily related to the price of crude oil and wholesale motor fuel prices and generally not as a result of changes in motor fuel sales volumes, unless otherwise indicated and discussed below.
Approximately half of CST’s gross profit is derived from the sale of motor fuel. CST typically experiences lower motor fuel gross profits in periods when the wholesale cost of motor fuel increases, and higher motor fuel gross profits in periods when the wholesale cost of motor fuel declines rapidly or is more volatile.
35
The volatility of crude oil and wholesale motor fuel prices has significantly impacted CST’s motor fuel gross profits, and is further discussed in “Results of Operations” below. The following graph provides benchmark information for both crude oil and wholesale motor fuel prices for the eighteen months ended June 30, 2015:
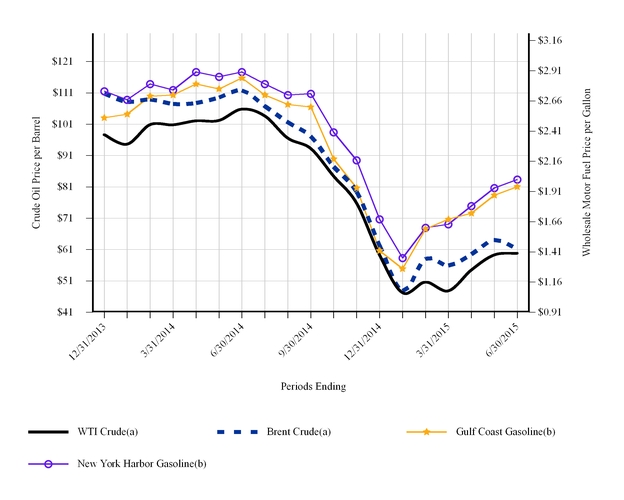
(a) Represents the average monthly spot price per barrel during the periods presented for West Texas Intermediate (“WTI”) and Brent crude oil. One barrel represents 42 gallons.
(b) | Represents the average monthly spot price per gallon during the periods presented for U.S. Gulf Coast conventional (“GCC”) gasoline and New York Harbor conventional gasoline (“NYHC”). |
36
The following graph shows the volatility of wholesale motor fuel prices and the impact on our U.S. Retail and Canadian Retail segments’ gross profits (U.S. Retail and Canadian Retail cent per gallon (“CPG”) gross profits):
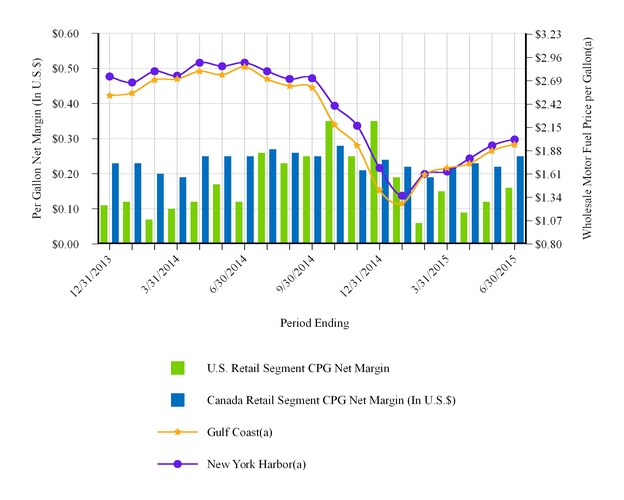
(a) | Represents the average monthly spot price per gallon during the periods presented for GCC gasoline and NYHC gasoline. |
CrossAmerica
As discussed above, our U.S. Retail and Canadian Retail segments typically experience lower motor fuel gross profits in periods when the wholesale cost of motor fuel is increasing, and higher motor fuel gross profits in periods when the wholesale cost of motor fuel is decreasing. As it relates to its retail operations, CrossAmerica generally experiences effects on its revenues and gross profits from wholesale motor fuel price changes. As it relates to its wholesale fuel operations, while a significant portion of wholesale gross profits are derived from sales at fixed amounts over cost, wholesale fuel gross profits still experience variability. A portion of CrossAmerica’s gross profit margin is generated from payment discounts and incentives that are based on the overall price of wholesale motor fuel (which generally increases or decreases with the price of crude oil). As a result, in periods of declining wholesale motor fuel prices, CrossAmerica’s gross profit margin is negatively affected and, in periods of rising wholesale motor fuel prices, its gross profit margin is positively affected.
Seasonality Effects on Volumes
Our business exhibits substantial seasonality due to our wholesale and retail sites being located in certain geographic areas that are affected by seasonal weather and temperature trends and associated changes in retail customer activity during different seasons. Historically, sales volumes and operating income have been highest in the second and third quarters (during the summer activity months) and lowest during the winter months in the first and fourth quarters.
37
Recently Acquired Retail Sites
When we acquire wholesale and convenience store operations, we do not have a predetermined operating model for the convenience store operations. Subsequent to an acquisition, we have a dedicated integration team that evaluates the eventual long-term operation of each convenience store acquired: (a) to be fully integrated into the existing core retail operations of CST, (b) to be converted into a dealer, or (c) other strategic alternatives, including divestiture. All retail convenience stores we acquire through acquisitions are first categorized as non-core and an evaluation process (which could take up to twelve months) is performed to determine if any of the acquired convenience stores are suitable to be converted and integrated into CST's core store operating model. If these stores are not determined to be core stores, these non-core stores will be evaluated for conversion to third party dealers, divestment or maintaining the existing operations under CrossAmerica using an operating model different from the core retail operations of CST. We believe it is necessary to differentiate the operating performance between core and non-core stores when presenting our operating statistics because non-core stores are not necessarily reflective of our core business. Key differentiating factors initially include the following:
• | Non-core merchandising strategies are legacy strategies of the former owner, which are different from our core store merchandising strategies, including the offering of our proprietary products and utilizing our purchasing power to maximize gross profit margin. |
• | Non-core sites are not managed in the same way as our core sites, where our Chief Operating Officer oversees all core store operations. |
• | Non-core fuel pricing, merchandise supply and labor strategies are typically not substantially similar with our core business. |
Effective April 1, 2015, management classified the convenience store operations of the 22 acquired Landmark stores as core stores. Effective July 1, 2015, management classified the convenience store operations of the 32 acquired Nice N Easy Grocery Shoppes (“Nice N Easy”) stores as core stores.
38
Results of Operations
Consolidated Income Statement Analysis
Below is an analysis of our consolidated income statements, which provides the primary reasons for significant increases and decreases in the various income statement line items from period to period. Our consolidated income statements are as follows (in millions):
Three Months Ended | Six Months Ended | |||||||||||||||
June 30, | June 30, | |||||||||||||||
2015 | 2014 | 2015 | 2014 | |||||||||||||
Operating revenues | $ | 3,153 | $ | 3,261 | $ | 5,816 | $ | 6,262 | ||||||||
Cost of sales | 2,837 | 2,981 | 5,196 | 5,737 | ||||||||||||
Gross profit | 316 | 280 | 620 | 525 | ||||||||||||
Operating expenses: | ||||||||||||||||
Operating expenses | 185 | 168 | 369 | 332 | ||||||||||||
General and administrative expenses | 39 | 25 | 89 | 50 | ||||||||||||
Depreciation, amortization and accretion expense | 51 | 30 | 105 | 61 | ||||||||||||
Total operating expenses | 275 | 223 | 563 | 443 | ||||||||||||
Gain on sale of assets, net | 2 | — | 7 | — | ||||||||||||
Operating income | 43 | 57 | 64 | 82 | ||||||||||||
Other income, net | 2 | 1 | 4 | 2 | ||||||||||||
Interest expense | (14 | ) | (10 | ) | (29 | ) | (20 | ) | ||||||||
Income before income tax expense | 31 | 48 | 39 | 64 | ||||||||||||
Income tax expense | 12 | 16 | 14 | 21 | ||||||||||||
Consolidated net income | 19 | 32 | 25 | 43 | ||||||||||||
Net loss attributable to noncontrolling interest | (6 | ) | — | (14 | ) | — | ||||||||||
Net income attributable to CST stockholders | $ | 25 | $ | 32 | $ | 39 | $ | 43 | ||||||||
We have quantified the effects of CrossAmerica to specific income statement line items in our consolidated discussion of our results of operations, and any significant increase or decrease in the underlying income statement line items attributable to CST are then discussed. CrossAmerica is a publicly traded Delaware limited partnership and its stock is listed for trading on the New York Stock Exchange under the symbol “CAPL.” As a result, CrossAmerica is required to file reports with the U.S. Securities and Exchange Commission, where additional information about its results of operations can be found.
39
Three Months Ended June 30, 2015 Compared to Three Months Ended June 30, 2014
Consolidated Results
Operating revenues increased $606 million and gross profit increased $39 million from the acquisition of CrossAmerica.
Excluding the effects of CrossAmerica, operating revenues declined $714 million, or 22%, while gross profit declined $3 million, or 1%.
Operating revenues
Significant items impacting these results (excluding CrossAmerica) were:
• | A $391 million, or 19%, decline in our U.S. Retail segment operating revenues primarily attributable to: |
◦ | A decrease in the retail price per gallon of motor fuel that we sold, which contributed $488 million of the decrease to our motor fuel operating revenues, and was attributable to the volatility in wholesale gasoline prices, as discussed above under the heading “The Significance of Crude Oil and Wholesale Motor Fuel Prices on Our Revenues, Cost of Sales and Gross Profit.” The average daily spot price of GCC gasoline decreased to $1.86 per gallon during the second quarter of 2015, compared to $2.80 per gallon during the second quarter of 2014. |
◦ | Partially offsetting the decline was an increase in motor fuel gallons sold of 4%, which increased motor fuel operating revenues by $66 million. The increase in motor fuel gallons sold resulted primarily from our acquisition of Nice N Easy and the Landmark convenience stores, as well as an overall increase in motor fuel demand. |
◦ | Our merchandise revenues increased $31 million primarily as a result of our acquisition of Nice N Easy and the Landmark convenience stores as well as an overall increase in our merchandise sales. |
•A $323 million, or 26%, decline in our Canadian Retail segment operating revenues primarily attributable to:
◦ | A decline of $109 million in operating revenues due to the foreign exchange effects of a weakening Canadian dollar relative to the U.S. dollar. On average, Canadian $1 was equal to U.S. $0.81 during the second quarter of 2015, and equal to U.S. $0.92 during the second quarter of 2014, representing a decrease in value of 12%. |
• | Excluding the effects of foreign exchange rate changes, our operating revenues decreased $214 million. This decrease was primarily attributable to: |
◦ | A $203 million decrease in operating revenues primarily attributable to a decrease in the retail price of our motor fuel. In terms of Canadian dollars, the average daily spot price of NYHC gasoline decreased to $1.55 per gallon during the second quarter of 2015, compared to $2.66 per gallon during the second quarter of 2014. |
◦ | A decrease of $9 million attributable to a 1% decrease in the volume of motor fuel we sold. |
◦ | An increase in our merchandise revenues of $5 million, primarily from an increase of 13 company operated convenience stores over the same period of 2014 as well as an increase in same store sales. |
Cost of sales
Cost of sales increased $567 million from the acquisition of CrossAmerica.
Excluding the effects of CrossAmerica, cost of sales declined $711 million, or 24%.
Significant items impacting these results excluding CrossAmerica were:
• | A $96 million decline from the foreign exchange effects of the weakening of the Canadian dollar relative to the U.S. dollar. |
• | The decline in crude oil and wholesale gasoline prices, as discussed above under the heading “The Significance of Crude Oil and Wholesale Motor Fuel Prices on Our Revenues, Cost of Sales and Gross Profit” drove the remainder of the decline. |
40
Operating expenses
Operating expenses increased $15 million from the acquisition of CrossAmerica.
Excluding the effects of CrossAmerica, operating expenses increased by $2 million primarily due to an increase of $9 million in our U.S. Retail segment related to our acquisitions of Nice N Easy and the Landmark convenience stores. This increase was partially offset by a $7 million decline in operating expenses in our Canadian Retail segment primarily from the foreign exchange effects of a weakening of the Canadian dollar relative to the U.S. dollar.
General and administrative expenses
General and administrative expenses increased $9 million from the acquisition of CrossAmerica.
In addition to the effects from CrossAmerica, general and administrative expense increased $5 million primarily as a result of severance costs, acquisition costs, legal related expenditures and incentive compensation and benefits due to an increase in employees.
Depreciation, amortization and accretion expense
Depreciation, amortization and accretion expense increased $18 million from the acquisition of CrossAmerica.
Excluding the effects of CrossAmerica, depreciation, amortization and accretion expense increased $3 million mainly due to our NTIs built from July 2014 through June 2015.
Gain on sale of assets, net
During the three months ended June 30, 2015, CST closed on the sale of 15 convenience stores and recognized a gain of $2 million in “Gain on sale of assets, net” on the consolidated statements of income. During the three months ended June 30, 2015, CrossAmerica recorded an immaterial gain on sale of assets.
Interest expense
Interest expense increased $4 million, primarily from the acquisition of CrossAmerica.
Income tax expense
Income tax expense, including CrossAmerica, declined $4 million as a result of lower earnings before tax. Our effective income tax rate was 39% for the three months ended June 30, 2015 compared to an effective rate of 33% for the three months ended June 30, 2014. The effective tax rate increased due to CrossAmerica reporting a loss with minimal tax benefit. CST’s effective tax rate, excluding CrossAmerica, was 35% for the three months ended June 30, 2015.
41
Six Months Ended June 30, 2015 Compared to Six Months Ended June 30, 2014
Consolidated Results
Operating revenues increased $1.1 billion and gross profit increased $74 million from the acquisition of CrossAmerica.
Excluding the effects of CrossAmerica, operating revenues declined $1.5 billion, or 24%, while gross profit increased $21 million, or 4%.
Operating revenues
Significant items impacting these results (excluding CrossAmerica) were:
• | A $828 million, or 22%, decline in our U.S. Retail segment operating revenues primarily attributable to: |
◦ | A decrease in the retail price per gallon of motor fuel that we sold, which contributed $988 million of the decrease to our motor fuel operating revenues, and was attributable to the volatility in wholesale gasoline prices, as discussed above under the heading “The Significance of Crude Oil and Wholesale Motor Fuel Prices on Our Revenues, Cost of Sales and Gross Profit.” The average daily spot price of GCC gasoline decreased to $1.69 per gallon during the first half of 2015, compared to $2.73 per gallon during the first half of 2014. |
◦ | An increase in motor fuel gallons sold of 3%, which increased motor fuel operating revenues by $95 million. The increase in motor fuel gallons sold resulted primarily from our acquisition of Nice N Easy and the Landmark convenience stores. |
◦ | Our merchandise revenues increased $59 million primarily as a result of our acquisition of Nice N Easy and the Landmark convenience stores as well as an overall increase in our merchandise sales. |
•A $672 million, or 28%, decline in our Canadian Retail segment operating revenues primarily attributable to:
◦ | A decline of $195 million in operating revenues due to the foreign exchange effects of a weakening Canadian dollar relative to the U.S. dollar. On average, Canadian $1 was equal to U.S. $0.81 during the first half of 2015, and equal to U.S. $0.92 during the first half of 2014, representing a decrease in value of 12%. |
• | Excluding the effects of foreign exchange rate changes, our operating revenues decreased $477 million. This decrease was primarily attributable to: |
◦ | A $432 million decrease in operating revenues primarily attributable to a decrease in the retail price of our motor fuel. In terms of Canadian dollars, the average daily spot price of NYHC gasoline decreased to $1.40 per gallon during the first half of 2015, compared to $2.58 per gallon during the first half of 2014. |
◦ | Partially offsetting this decrease was an increase of $7 million attributable to an increase in the volume of motor fuel we sold as a result of the addition of 11 retail sites on average over the applicable period. |
◦ | Our heating oil revenues decreased $63 million primarily due to a decline in the price of crude oil as discussed under the heading “The Significance of Crude Oil and Wholesale Motor Fuel Prices on Our Revenues, Cost of Sales and Gross Profit.” |
◦ | An increase in our merchandise revenues of $13 million, primarily from an increase of 17 company operated convenience stores over the same period of 2014 as well as an overall increase in our merchandise sales. |
Cost of sales
Cost of sales increased $980 million from the acquisition of CrossAmerica.
Excluding the effects of CrossAmerica, cost of sales declined $1.5 billion, or 27%.
Significant items impacting these results excluding CrossAmerica were:
• | A $169 million decline from the foreign exchange effects of a weakening Canadian dollar relative to the U.S. dollar. |
42
• | The decline in crude oil and wholesale gasoline prices, as discussed above under the heading “The Significance of Crude Oil and Wholesale Motor Fuel Prices on Our Revenues, Cost of Sales and Gross Profit” drove the remainder of the decline. |
Operating expenses
Operating expenses increased $28 million from the acquisition of CrossAmerica.
Excluding the effects of CrossAmerica, operating expenses increased by $9 million primarily due to an increase of $19 million in our U.S. Retail segment related to our acquisitions of Nice N Easy and the Landmark convenience stores. This increase was partially offset by a $10 million decline in operating expenses in our Canadian Retail segment primarily from the weakening of the Canadian dollar relative to the U.S. dollar.
General and administrative expenses
General and administrative expenses increased $20 million from the acquisition of CrossAmerica.
Excluding the effects of CrossAmerica, general and administrative expense increased $19 million primarily as a result of severance costs, acquisition costs, legal related expenditures and incentive compensation and benefits due to an increase in employees.
Depreciation, amortization and accretion expense
Depreciation, amortization and accretion expense increased $39 million from the acquisition of CrossAmerica.
Excluding the effects of CrossAmerica, depreciation, amortization and accretion expense increased $5 million from our NTIs.
Gain on sale of assets, net
During the six months ended June 30, 2015, CST closed on the sale of 24 convenience stores and recognized a gain of $7 million in “Gain on sale of assets, net” on the consolidated statements of income. During the six months ended June 30, 2015, CrossAmerica recorded an immaterial gain on sale of assets.
Interest expense
Interest expense increased $9 million, primarily from the acquisition of CrossAmerica.
Income tax expense
Income tax expense, including CrossAmerica, declined $7 million as a result of lower earnings before tax. Our effective income tax rate was 36% for the six months ended June 30, 2015 compared to an effective rate of 33% for the six months ended June 30, 2014. The effective tax rate increased due to CrossAmerica reporting a loss with minimal tax benefit recorded. CST’s effective tax rate, excluding CrossAmerica, was 35% for the six months ended June 30, 2015.
43
Segment Results
We present the results of operations of our segments consistent with how our management views the business. Therefore, the segments are presented before intercompany eliminations (which consist of motor fuel sold from our CrossAmerica segment to our U.S. Retail segment and rent expense paid to our CrossAmerica segment) and before purchase accounting adjustments related to the acquisition of CrossAmerica (primarily depreciation and amortization).
U.S. Retail
The following tables highlight the results of operations and certain operating metrics of our U.S. Retail segment. The narrative following these tables provides an analysis of the results of operations of that segment (millions of dollars, except for the number of convenience stores, per site per day and per gallon amounts):
Three Months Ended | Six Months Ended | |||||||||||||||
June 30, | June 30, | |||||||||||||||
2015 | 2014 | 2015 | 2014 | |||||||||||||
Operating revenues: | ||||||||||||||||
Motor fuel | $ | 1,246 | $ | 1,669 | $ | 2,263 | $ | 3,152 | ||||||||
Merchandise | 376 | 345 | 705 | 646 | ||||||||||||
Other | 16 | 15 | 32 | 30 | ||||||||||||
Total operating revenues | $ | 1,638 | $ | 2,029 | $ | 3,000 | $ | 3,828 | ||||||||
Gross profit: | ||||||||||||||||
Motor fuel–before amounts attributable to CrossAmerica | $ | 61 | $ | 65 | $ | 126 | $ | 109 | ||||||||
Motor fuel–amounts attributable to CrossAmerica | (2 | ) | — | (4 | ) | — | ||||||||||
Motor fuel–after amounts attributable to CrossAmerica | 59 | 65 | 122 | 109 | ||||||||||||
Merchandise | 112 | 103 | 209 | 195 | ||||||||||||
Other | 15 | 14 | 31 | 29 | ||||||||||||
Total gross profit | 186 | 182 | 362 | 333 | ||||||||||||
Operating expenses: | ||||||||||||||||
Operating expenses | 117 | 108 | 232 | 213 | ||||||||||||
Depreciation, amortization and accretion expense | 23 | 21 | 47 | 43 | ||||||||||||
Total operating expenses | 140 | 129 | 279 | 256 | ||||||||||||
Gain on sale of assets, net | 2 | — | 7 | — | ||||||||||||
Operating income | $ | 48 | $ | 53 | $ | 90 | $ | 77 | ||||||||
Total company operated retail sites at end of period | 1,025 | 1,044 | 1,025 | 1,044 | ||||||||||||
Average company operated retail sites during the period | 995 | 1,043 | 999 | 1,041 | ||||||||||||
Core store operating statistics:(a) | ||||||||||||||||
End of period core stores | 993 | 1,044 | 993 | 1,044 | ||||||||||||
Motor fuel sales (gallons per site per day) | 5,246 | 4,987 | 5,105 | 4,891 | ||||||||||||
Motor fuel sales (per site per day) | $ | 13,325 | $ | 17,583 | $ | 12,153 | $ | 16,723 | ||||||||
Motor fuel gross profit per gallon, net of credit card fees | $ | 0.1256 | $ | 0.1383 | $ | 0.1315 | $ | 0.1186 | ||||||||
CST Fuel Supply distribution to CrossAmerica (c) | (0.0025 | ) | — | (0.0025 | ) | — | ||||||||||
Motor fuel gross profit per gallon, net of credit card fees(b), (c) | $ | 0.1231 | $ | 0.1383 | $ | 0.1290 | $ | 0.1186 | ||||||||
Merchandise sales (per site per day) | $ | 3,917 | $ | 3,632 | $ | 3,703 | $ | 3,427 | ||||||||
Merchandise gross profit percentage, net of credit card fees | 30.2 | % | 29.8 | % | 29.8 | % | 30.2 | % | ||||||||
44
U.S. Retail (continued)
Three Months Ended | Six Months Ended | |||||||||||||||
June 30, | June 30, | |||||||||||||||
2015 | 2014 | 2015 | 2014 | |||||||||||||
Company operated retail sites: | ||||||||||||||||
Beginning of period | 1,035 | 1,041 | 1,021 | 1,036 | ||||||||||||
NTIs | 5 | 4 | 6 | 10 | ||||||||||||
Acquisitions | — | — | 22 | — | ||||||||||||
Closed or divested | (15 | ) | (1 | ) | (24 | ) | (2 | ) | ||||||||
End of period | 1,025 | 1,044 | 1,025 | 1,044 | ||||||||||||
Core store same store information(a),(d): | ||||||||||||||||
Company operated retail sites | 939 | 939 | 935 | 935 | ||||||||||||
NTIs included in core same store information | 54 | 54 | 50 | 50 | ||||||||||||
Motor fuel sales (gallons per site per day) | 5,197 | 5,207 | 5,051 | 5,104 | ||||||||||||
Merchandise sales (per site per day) | $ | 3,905 | $ | 3,789 | $ | 3,681 | $ | 3,571 | ||||||||
Merchandise gross profit percent, net of credit card fees | 30.2 | % | 29.9 | % | 29.8 | % | 30.3 | % | ||||||||
Merchandise sales, ex. cigarettes (per site per day) | $ | 2,788 | $ | 2,708 | $ | 2,605 | $ | 2,526 | ||||||||
Merchandise gross profit percent, net of credit card fees and ex. cigarettes | 35.8 | % | 35.4 | % | 35.4 | % | 35.8 | % | ||||||||
Merchandise gross profit dollars | $ | 101 | $ | 97 | $ | 185 | $ | 183 | ||||||||
Other services operating revenues(e) | $ | 12 | $ | 13 | $ | 26 | $ | 27 | ||||||||
NTI information(f): | ||||||||||||||||
Company operated retail sites at end of period | 82 | 82 | ||||||||||||||
Company operated retail sites (average) | 79 | 78 | ||||||||||||||
Motor fuel sales (gallons per site per day) | 8,894 | 8,761 | ||||||||||||||
Merchandise sales (per site per day) | $ | 6,816 | $ | 6,402 | ||||||||||||
Merchandise gross profit percent, net of credit card fees | 32.0 | % | 31.5 | % | ||||||||||||
Merchandise sales, ex. cigarettes (per site per day) | $ | 5,447 | $ | 5,097 | ||||||||||||
Merchandise gross profit percent, net of credit card fees and ex. cigarettes | 36.3 | % | 35.9 | % | ||||||||||||
(a) | Represents the portfolio of core retail sites and excludes recently acquired retail sites that are being integrated or are under performance evaluation to determine if: (i) the continued ownership of the retail site is consistent with our U.S. Retail core operating strategy; or (ii) the retail site is to be converted into a wholesale dealer operation managed by CrossAmerica or divested. All NTIs are core-stores and accordingly are included in the core system operating statistics. On April 1, 2015, management classified the Landmark convenience store operations as core-store and accordingly are included in the core system operating statistics for the second quarter of 2015. |
(b) | Includes $0.05 per gallon of wholesale fuel distribution profit. |
(c) | Effective January 1, 2015, CrossAmerica owns 5% of our U.S. Retail segment’s wholesale fuel distribution profit. See Note 7 of the condensed notes to consolidated financial statements for additional information. |
(d) | The same store information consists of aggregated individual store results for all sites in operation substantially throughout both periods presented. Stores that were temporarily closed for a brief period of time during the periods being compared remain in the same store sales comparison. If a store is replaced, either at the same location or relocated to a new location, it is removed from the comparison until the new store has been in operation for substantially all of the periods being compared. NTIs are included in the core same store metrics when they meet this criteria. |
(e) | Other services include revenues from car wash sales and commissions from lottery, money orders, air/water/vacuum services, video and game rentals and access to ATMs. |
(f) | NTIs consist of all new stores opened after January 1, 2008, which is generally when we began operating our larger formatted stores that accommodate broader merchandise categories and food offerings and have more fuel dispensers than our legacy stores. This information is being presented to enable a comparison of the business metrics of our NTIs to our total core store operating statistics. As of June 30, 2015, approximately 54% of the total NTIs were opened in the last two years, which we generally consider to be a |
45
development period before the NTIs achieve their full potential. Prior year information is not comparable given the increase in the number of NTIs and when they were opened, and is therefore not presented.
46
Three Months Ended June 30, 2015 Compared to Three Months Ended June 30, 2014
Operating revenues declined $391 million, or 19%, gross profit increased $4 million, or 2%, operating expenses increased $9 million, or 8% and operating income declined $5 million, or 9%.
The results were driven by:
Operating revenues
• | A decrease in the retail price per gallon of motor fuel that we sold, which contributed $488 million of the decrease to our motor fuel operating revenues, and was attributable to the volatility in wholesale gasoline prices, as discussed above under the heading “The Significance of Crude Oil and Wholesale Motor Fuel Prices on Our Revenues, Cost of Sales and Gross Profit.” The average daily spot price of GCC gasoline decreased to $1.86 per gallon during the second quarter of 2015, compared to $2.80 per gallon during the second quarter of 2014. |
• | Partially offsetting the decline was an increase in motor fuel gallons sold of 4%, which increased motor fuel operating revenues by $66 million. The increase in motor fuel gallons sold resulted primarily from our acquisitions of Nice N Easy and the Landmark convenience stores and an overall increase in motor fuel demand. |
• | Our merchandise revenues increased $31 million primarily as a result of our acquisitions of Nice N Easy and the Landmark convenience stores as well as an overall increase in our merchandise sales. |
Gross profit
• | A decrease in motor fuel gross profit of $6 million primarily due to a $0.01 decline in our motor fuel CPG gross profit. The decline in CPG gross profit was driven by volatility in crude oil and wholesale motor fuel prices, as discussed under the heading “The Significance of Crude Oil and Wholesale Motor Fuel Prices on Our Revenues, Cost of Sales and Gross Profit.” |
• | Also contributing to the decrease to motor fuel gross profit was the effect of payments to CrossAmerica. As discussed in Note 7, CST paid CrossAmerica $1 million related to fuel distribution agreements for Nice N Easy and Landmark convenience stores and $1 million to CrossAmerica related to its investment in CST Fuel Supply. |
• | An increase of $9 million in our merchandise gross profit primarily from our acquisitions. |
Operating expenses
• | Operating expenses increased $9 million, primarily as a result of our acquisitions. |
Gain on sale of assets, net resulting from our network optimization program
• | We completed the sale of 15 convenience stores in the second quarter of 2015 related to our previously announced network optimization program and recognized a gain of $2 million. |
47
Six Months Ended June 30, 2015 Compared to Six Months Ended June 30, 2014
Operating revenues declined $828 million, or 22%, gross profit increased $29 million, or 9%, operating expenses increased $19 million, or 9% and operating income increased $13 million, or 17%.
The results were driven by:
Operating revenues
• | A decrease in the retail price per gallon of motor fuel that we sold, which contributed $988 million of the decrease to our motor fuel operating revenues, and was attributable to the volatility in wholesale gasoline prices, as discussed above under the heading “The Significance of Crude Oil and Wholesale Motor Fuel Prices on Our Revenues, Cost of Sales and Gross Profit.” The average daily spot price of GCC gasoline decreased to $1.69 per gallon during the first half of 2015, compared to $2.73 per gallon during the first half of 2014. |
• | Partially offsetting the decline was an increase in motor fuel gallons sold of 3%, which increased motor fuel operating revenues by $95 million. The increase in motor fuel gallons sold resulted primarily from our acquisitions of Nice N Easy and the Landmark convenience stores and an overall increase in motor fuel demand. |
• | Our merchandise revenues increased $59 million primarily as a result of our acquisitions of Nice N Easy and the Landmark convenience stores as well as an overall increase in our merchandise sales. |
Gross profit
• | An increase in motor fuel gross profit of $13 million primarily due to a $0.01 increase in our motor fuel CPG gross profit. The increase in CPG gross profit was driven by volatility in crude oil and wholesale motor fuel prices, as discussed under the heading “The Significance of Crude Oil and Wholesale Motor Fuel Prices on Our Revenues, Cost of Sales and Gross Profit.” |
• | Partially offsetting the increase to motor fuel gross profit was the effect of payments to CrossAmerica. As discussed in Note 7, CST paid CrossAmerica $2 million related to fuel distribution agreements with Nice N Easy and Landmark convenience stores and $2 million related to its investment in CST Fuel Supply. |
• | An increase of $14 million in our merchandise gross profit primarily from our acquisitions. |
Operating expenses
• | Operating expenses increased $19 million, primarily as a result of our acquisitions. |
Gain on sale of assets, net resulting from our network optimization program
• | We completed the sale of 24 convenience stores in the first half of 2015 related to our previously announced network optimization program and recognized a gain of $7 million. |
48
Canadian Retail
The following tables highlight the results of operations and certain operating metrics of our Canadian Retail segment. The narrative following these tables provides an analysis of the results of operations of that segment (which are expressed in millions of U.S. dollars, except where indicated and except for the number of retail sites, per site per day and per gallon amounts):
Three Months Ended | Six Months Ended | |||||||||||||||
June 30, | June 30, | |||||||||||||||
2015 | 2014 | 2015 | 2014 | |||||||||||||
Operating revenues: | ||||||||||||||||
Motor fuel | $ | 768 | $ | 1,060 | $ | 1,444 | $ | 2,026 | ||||||||
Merchandise | 62 | 66 | 115 | 119 | ||||||||||||
Other | 79 | 106 | 203 | 289 | ||||||||||||
Total operating revenues | $ | 909 | $ | 1,232 | $ | 1,762 | $ | 2,434 | ||||||||
Gross profit: | ||||||||||||||||
Motor fuel | $ | 59 | $ | 62 | $ | 109 | $ | 111 | ||||||||
Merchandise | 17 | 18 | 31 | 33 | ||||||||||||
Other | 15 | 18 | 44 | 48 | ||||||||||||
Total gross profit | 91 | 98 | 184 | 192 | ||||||||||||
Operating expenses: | ||||||||||||||||
Operating expenses | 53 | 60 | 109 | 119 | ||||||||||||
Depreciation, amortization and accretion expense | 10 | 9 | 19 | 18 | ||||||||||||
Operating income | $ | 28 | $ | 29 | $ | 56 | $ | 55 | ||||||||
Total retail sites (end of period): | ||||||||||||||||
Company operated (fuel and merchandise) | 292 | 279 | 292 | 279 | ||||||||||||
Commission agents (fuel only) | 495 | 498 | 495 | 498 | ||||||||||||
Cardlock (fuel only) | 72 | 73 | 72 | 73 | ||||||||||||
Total retail sites (end of period) | 859 | 850 | 859 | 850 | ||||||||||||
Average retail sites during the period: | ||||||||||||||||
Company operated (fuel and merchandise) | 292 | 279 | 293 | 275 | ||||||||||||
Commission agents (fuel only) | 495 | 497 | 495 | 498 | ||||||||||||
Cardlock (fuel only) | 72 | 74 | 72 | 75 | ||||||||||||
Average retail sites during the period | 859 | 850 | 860 | 848 | ||||||||||||
Total system operating statistics: | ||||||||||||||||
Motor fuel sales (gallons per site per day) | 3,201 | 3,256 | 3,147 | 3,178 | ||||||||||||
Motor fuel sales (per site per day) | $ | 9,832 | $ | 13,706 | $ | 9,282 | $ | 13,198 | ||||||||
Motor fuel gross profit per gallon, net of credit card fees | $ | 0.234 | $ | 0.246 | $ | 0.222 | $ | 0.228 | ||||||||
Company operated retail site statistics: | ||||||||||||||||
Merchandise sales (per site per day) | $ | 2,355 | $ | 2,589 | $ | 2,170 | $ | 2,386 | ||||||||
Merchandise gross profit percentage, net of credit card fees | 26.8 | % | 28.1 | % | 27.0 | % | 28.1 | % | ||||||||
49
Canadian Retail (continued)
Three Months Ended | Six Months Ended | |||||||||||||||
June 30, | June 30, | |||||||||||||||
Company operated statistics(a) | 2015 | 2014 | 2015 | 2014 | ||||||||||||
Retail sites: | ||||||||||||||||
Beginning of period | 294 | 276 | 293 | 272 | ||||||||||||
NTIs | 1 | — | 2 | 1 | ||||||||||||
Acquisitions | — | 2 | — | 4 | ||||||||||||
Conversions, net(b) | — | 1 | — | 2 | ||||||||||||
Closed or divested | (3 | ) | — | (3 | ) | — | ||||||||||
End of period | 292 | 279 | 292 | 279 | ||||||||||||
Average foreign exchange rate for $1 CAD to USD | 0.81023 | 0.92207 | 0.80933 | 0.91717 | ||||||||||||
Same store information ($ amounts in CAD) (c),(d): | ||||||||||||||||
Company operated retail sites | 273 | 273 | 268 | 268 | ||||||||||||
NTIs included in same store information | 24 | 24 | 23 | 23 | ||||||||||||
Motor fuel sales (gallons per site per day) | 3,400 | 3,518 | 3,376 | 3,457 | ||||||||||||
Merchandise sales (per site per day) | $ | 2,937 | $ | 2,834 | $ | 2,734 | $ | 2,629 | ||||||||
Merchandise gross profit percent, net of credit card fees | 27.0 | % | 28.2 | % | 27.1 | % | 28.2 | % | ||||||||
Merchandise sales, ex. cigarettes (per site per day) | $ | 1,507 | $ | 1,432 | $ | 1,393 | $ | 1,329 | ||||||||
Merchandise gross profit percent, net of credit card fees and ex. cigarettes | 36.0 | % | 36.8 | % | 36.2 | % | 36.9 | % | ||||||||
Merchandise gross profit dollars | $ | 20 | $ | 20 | $ | 36 | $ | 36 | ||||||||
Other services operating revenues(e) | $ | 5 | $ | 4 | $ | 10 | $ | 9 | ||||||||
NTI information ($ amounts in CAD)(c),(f): | ||||||||||||||||
Company operated retail sites at end of period | 35 | 35 | ||||||||||||||
Company operated retail sites (average) | 34 | 34 | ||||||||||||||
Motor fuel sales (gallons per site per day) | 4,977 | 4,893 | ||||||||||||||
Merchandise sales (per site per day) | $ | 3,194 | $ | 2,896 | ||||||||||||
Merchandise gross profit percent, net of credit card fees | 26.6 | % | 27.0 | % | ||||||||||||
Merchandise sales, ex. cigarettes (per site per day) | $ | 1,759 | $ | 1,585 | ||||||||||||
Merchandise gross profit percent, net of credit card fees and ex. cigarettes | 34.4 | % | 34.9 | % | ||||||||||||
50
Canadian Retail (continued)
Commission agent statistics(a) | Three Months Ended | Six Months Ended | ||||||||||
June 30, | June 30, | |||||||||||
2015 | 2014 | 2015 | 2014 | |||||||||
Retail Sites: | ||||||||||||
Beginning of period | 495 | 498 | 495 | 499 | ||||||||
New dealers | 1 | 2 | 3 | 4 | ||||||||
Conversions, net(b) | — | (1 | ) | — | (2 | ) | ||||||
Closed or de-branded | (1 | ) | (1 | ) | (3 | ) | (3 | ) | ||||
End of period | 495 | 498 | 495 | 498 | ||||||||
Same Store Information(d): | ||||||||||||
Retail sites | 475 | 475 | 472 | 472 | ||||||||
Motor fuel sales (gallons per site per day) | 2,705 | 2,750 | 2,616 | 2,643 | ||||||||
(a) | Company operated retail sites sell motor fuel and merchandise. The Company sells only motor fuel at commission agent sites. We do not currently distinguish between core and non-core stores in our Canadian Retail segment. All sites in our Canadian Retail segment are core stores. |
(b) | Conversions represent stores that have changed their classification from commission agents to company owned and operated or vice versa. Changes in classification result when we either take over the operations of commission agents or convert an existing company owned and operated store to commission agents. |
(c) | All amounts presented are stated in Canadian dollars to remove the impact of foreign exchange and all fuel information excludes amounts related to cardlock operations. |
(d) | The same store information consists of aggregated individual store results for all sites in operation substantially throughout both periods presented. Stores that were temporarily closed for a brief period of time during the periods being compared remain in the same store sales comparison. If a store is replaced, either at the same location or relocated to a new location, it is removed from the comparison until the new store has been in operation for substantially all of the periods being compared. NTIs are included in the same store metrics when they meet this criteria. |
(e) | Other services include revenues from car wash sales and commissions from lottery, money orders, air/water/vacuum services, video and game rentals and access to ATMs. |
(f) | NTIs consist of all new stores opened after January 1, 2008, which is generally when we began operating our larger formatted stores that accommodate broader merchandise categories and food offerings and have more fuel dispensers than our legacy stores. NTIs exclude commission agents. This information is being presented to enable a comparison of the business metrics of our NTIs to our total core store operating statistics. As of June 30, 2015, approximately 54% of the total NTIs were opened in the last two years, which we generally consider to be a development period before the NTIs achieve their full potential. Prior year information is not comparable given the increase in the number of NTIs and when they were opened, and is therefore not presented. |
51
Three Months Ended June 30, 2015 Compared to Three Months Ended June 30, 2014
Operating revenues declined $323 million, or 26%, gross profit declined $7 million, or 7%, operating expenses declined $7 million, or 12%, and operating income declined $1 million, or 3%.
Significant items impacting these results included:
Operating revenues
• | A decline of $109 million in operating revenues due to the foreign exchange effects of a weakening Canadian dollar relative to the U.S. dollar. On average, Canadian $1 was equal to U.S. $0.81 during the second quarter of 2015, and equal to U.S. $0.92 during the second quarter of 2014, representing a decrease in value of 12%. |
• | Excluding the effects of foreign exchange rate changes, our operating revenues decreased $214 million. This decrease was primarily attributable to: |
◦ | A $203 million decrease in operating revenues primarily attributable to a decrease in the retail price of our motor fuel. In terms of Canadian dollars, the average daily spot price of NYHC gasoline decreased to $1.55 per gallon during the second quarter of 2015, compared to $2.66 per gallon during the second quarter of 2014. |
◦ | A $9 million decline attributable to a 1% decrease in the volume of motor fuel we sold. |
◦ | An increase in merchandise revenues of $5 million, primarily from an increase of 13 company operated convenience stores during the second quarter of 2015 compared to the same period of the prior year as well as an increase in same store sales. |
Gross profit
• | The decrease in the value of the Canadian dollar relative to the U.S. dollar resulted in a $13 million gross profit decline. |
• | Excluding the effects of foreign exchange, our motor fuel gross profit increased $5 million driven primarily by volatility in crude oil and wholesale motor fuel prices, as discussed under the heading “The Significance of Crude Oil and Wholesale Motor Fuel Prices on Our Revenues, Cost of Sales and Gross Profit.” |
Operating expenses
• | Operating expenses declined 12% primarily from the foreign exchange effects of a weakening Canadian dollar relative to the U.S. dollar. Excluding the effects of foreign exchange, operating expenses increased $1 million, primarily as a result of an increase in the average number of company operated convenience stores during the second quarter compared to the same period of the prior year. |
52
Six Months Ended June 30, 2015 Compared to Six Months Ended June 30, 2014
Operating revenues declined $672 million, or 28%, gross profit declined $8 million, or 4%, operating expenses declined $10 million, or 8%, and operating income increased $1 million, or 2%.
Significant items impacting these results included:
Operating revenues
• | A decline of $195 million in operating revenues due to the foreign exchange effects of a weakening Canadian dollar relative to the U.S. dollar. On average, Canadian $1 was equal to U.S. $0.81 during the first half of 2015, and equal to U.S. $0.92 during the first half of 2014, representing a decrease in value of 12%. |
• | Excluding the effects of foreign exchange rate changes, our operating revenues decreased $477 million. This decrease was primarily attributable to: |
◦ | A $432 million decrease in operating revenues primarily attributable to a decrease in the retail price of our motor fuel. In terms of Canadian dollars, the average daily spot price of NYHC gasoline decreased to $1.40 per gallon during the first half of 2015, compared to $2.58 per gallon during the first half of 2014. |
◦ | Partially offsetting this decrease was an increase of $7 million attributable to an increase in the volume of motor fuel that we sold as a result of the addition of 11 retail sites on average over the applicable period. |
◦ | Our heating oil revenues decreased $63 million primarily due to a decline in price. |
◦ | An increase in merchandise revenues of $13 million, primarily from an increase of 17 company operated convenience stores during the first half of 2015 compared to the same period of the prior year as well as an overall increase in our merchandise sales. |
Gross profit
• | The decrease in the value of the Canadian dollar relative to the U.S. dollar resulted in a $26 million gross profit decline. |
• | Excluding the effects of foreign exchange, our motor fuel gross profit increased $13 million driven by volatility in crude oil and wholesale motor fuel prices, as discussed under the heading “The Significance of Crude Oil and Wholesale Motor Fuel Prices on Our Revenues, Cost of Sales and Gross Profit.” The increase in merchandise gross profit was driven by the increase in our average company operated store count. |
Operating expenses
• | Operating expenses declined $10 million primarily from the foreign exchange effects of a weakening Canadian dollar relative to the U.S. dollar. Excluding the effects of foreign exchange, operating expenses increased $4 million, primarily as a result of an increase in the average number of company operated convenience stores during the first half of 2015 compared to the same period of the prior year. |
53
CrossAmerica
The following table highlights the results of operations and certain operating metrics of CrossAmerica. We completed the GP Purchase on October 1, 2014. CrossAmerica is presented excluding the accounting purchase price adjustments to be consistent with how our management reviews its results. The impact of these purchase accounting adjustments is to increase depreciation, amortization and accretion expense by $7 million and $16 million for the three and six months ended June 30, 2015, respectively. Approximately 94% of CrossAmerica’s operating results are attributable to noncontrolling interest for the three and six months ended June 30, 2015. All transactions between our U.S. Retail segment and CrossAmerica are eliminated in our consolidated financial statements. CrossAmerica is a publicly traded Delaware limited partnership and its units are listed for trading on the New York Stock Exchange under the symbol “CAPL.” As a result, CrossAmerica is required to file reports with the U.S. Securities and Exchange Commission, where additional information about its results of operations can be found and should be read in conjunction with the table below (millions of dollars).
Three Months Ended | Six Months Ended | |||||||||||||||
June 30, | June 30, | |||||||||||||||
2015 | 2014 | 2015 | 2014 | |||||||||||||
Operating revenues | $ | 648 | $ | 764 | $ | 1,126 | $ | 1,246 | ||||||||
Cost of sales | 609 | 737 | 1,052 | 1,202 | ||||||||||||
Gross profit | 39 | 27 | 74 | 44 | ||||||||||||
Income from CST Fuel Supply | 1 | — | 2 | — | ||||||||||||
Operating expenses: | ||||||||||||||||
Operating expenses | 16 | 7 | 30 | 10 | ||||||||||||
General and administrative expenses | 9 | 10 | 20 | 15 | ||||||||||||
Depreciation, amortization and accretion expense | 11 | 7 | 23 | 13 | ||||||||||||
Total operating expenses | 36 | 24 | 73 | 38 | ||||||||||||
Gain on sales of assets, net | — | — | — | 2 | ||||||||||||
Operating income (loss) | 4 | 3 | 3 | 8 | ||||||||||||
Interest expense | (5 | ) | (4 | ) | (9 | ) | (8 | ) | ||||||||
Income (loss) before income taxes | (1 | ) | (1 | ) | (6 | ) | — | |||||||||
Income tax expense (benefit) | (1 | ) | (4 | ) | (3 | ) | (4 | ) | ||||||||
Consolidated net income (loss) | — | 3 | (3 | ) | 4 | |||||||||||
Net income (loss) available to CrossAmerica limited partners | $ | — | $ | 3 | $ | (3 | ) | $ | 4 | |||||||
We have quantified the effects of CrossAmerica to specific income statement line items in our consolidated discussion of our results of operations, and any significant increase or decrease in the underlying income statement line items attributable to CST are then discussed.
As discussed above, we evaluate the performance of our CrossAmerica segment before the effects of purchase accounting. However, approximately $206 million of the purchase price was allocated to goodwill. The fair value of CrossAmerica was based on its enterprise value on the date of acquisition as principally determined by the closing price of its common units trading on the New York Stock Exchange ($33.97 per share). Therefore, a future decline in the enterprise value of CrossAmerica could result in an impairment to part or all of the associated goodwill. A sustained decline of 10% in CrossAmerica’s enterprise value could result in an impairment to the associated goodwill in excess of $100 million.
Outlook
U.S. Retail
Global energy markets, including wholesale and retail motor fuel prices, have been volatile year-to-date and we expect this trend to continue which may impact our operating results in the third quarter of 2015.
We continue to operate in a very competitive retail environment with intense competition for market share from our industry peers, high volume retailers and retailers that are attracting consumers with cross promotional programs (e.g. grocers and convenience channels). We believe that our experience allows us to effectively compete in the markets in which we operate. Our scale,
54
distribution capabilities, private label penetration and experienced team members in our stores enable us to offer a delightful, convenient shopping experience favored by today’s consumer. Our systems and processes enable us to vary the merchandise offering and retail prices by location in order to better serve our local customers and maximize gross profit dollars. We plan to continue our aggressive NTI growth strategy by adding 35 to 40 new stores in 2015, expanding our network market share and growing our Corner Store brand value. Our NTI stores have almost double the square footage compared to our average legacy store, which allows us the space and flexibility to expand our merchandise mix and fresh food offerings. Additionally, we believe the industry will continue to consolidate, and we believe we are competitively positioned through our relationship with CrossAmerica to capitalize on opportunistic acquisitions. Our recent acquisitions allow us to take advantage of best practices and processes discovered in the acquired companies, presenting opportunities for further strengthening our legacy store network. We also believe that there is an opportunity to enhance our offering to our customers through more grocery items and expanded food service offerings. While currently representing a limited amount of our retail motor fuel supply, we have expanded our fuel offering into a wider portfolio of brands, including both Shell and Phillips 66, which allows us to gain insight into expanded marketing tools that impact consumer behavior, such as loyalty programs.
Canadian Retail
Like our U.S. Retail segment, our Canadian Retail segment continues to operate in a very competitive environment. Certain non-traditional competitors, such as discount warehouse memberships and grocery chains, have continued to add motor fuel offerings and have expanded into new territories, however, at a slower pace than previous years. As in the U.S. retail segment, we have expanded our fuel offering into a wider portfolio of brands, including both Shell and Esso, which again bring us further insights into strong, fuel marketing programs.
In Canada, we also see an opportunity to better serve consumers by adding more grocery items and/or an expanded food service specific to each of our markets. We also intend to continue our NTI program by opening 10 to 12 NTIs during 2015.
Our reported results were negatively impacted by the unfavorable reduction in the value of the Canadian dollar relative to the U.S. dollar versus the corresponding periods. Due to the differential between exchange rates currently in effect and those in effect at the same time last year, we believe the reported results will likely continue to compare unfavorably to the prior corresponding periods due to lower exchange rates in the near term.
CrossAmerica
We expect our total fuel volume to increase in 2015, primarily driven by our acquisition activities. Per the U.S. Energy Information Administration website, U.S. weekly regular gasoline retail prices reached a 2015 year-to-date high in mid-June, an increase from early in the second quarter but below the same time last year. Strong demand for gasoline in both the United States and abroad has driven gasoline prices higher throughout the 2nd quarter of 2015, despite relatively stable crude oil prices. Data from the U.S. Federal Highway Administration show Americans drove a record 988 billion miles during the first four months of 2015, compared with the previous record of 966 billion miles driven in the first four months of 2007. U.S. average wholesale gasoline margins averaged higher during June 2015 than June of last year, higher than the five-year average (2010-14) for June.
We expect rent income to increase in 2015 as a result of our acquisition activities. We will continue to evaluate acquisitions on an opportunistic basis. Additionally, we will pursue targets that fit into our strategy and complement CrossAmerica as well as CST’s portfolio. Whether we will be able to execute acquisitions will depend on market conditions, availability of suitable acquisition targets at attractive terms, which are expected to be accretive to CrossAmerica’s unitholders, and our ability to finance such acquisitions on favorable terms.
55
Liquidity and Capital Resources
Capital Structure
CST and CrossAmerica maintain separate debt and equity capital structures. As such, CST and CrossAmerica each maintain credit facilities with separate covenants and restrictions. In addition, CST has outstanding publicly registered 5% senior notes due 2023, the terms of which are covered by a bond indenture. Our subsidiary that owns 100% of the membership interests in the General Partner of CrossAmerica has been designated an “unrestricted” subsidiary under this bond indenture; there are no guarantees of outstanding debt between CST and CrossAmerica. However, the IDRs and any current and future limited partnership equity interests acquired by CST are considered collateral under CST’s revolving credit agreement.
Cash Flows
Net cash provided by operating activities for the six months ended June 30, 2015 was $178 million compared to $168 million for the six months ended June 30, 2014. Changes in cash provided by or used for working capital are shown in Note 14 of the notes to the consolidated financial statements included elsewhere in this quarterly report.
Net cash used in investing activities for the six months ended June 30, 2015 was $243 million compared to $92 million for the six months ended June 30, 2014. The increase in net cash used in investing activities for the six months ended June 30, 2015 was related to the acquisitions of Landmark and Erickson.
Net cash provided by financing activities for the six months ended June 30, 2015 was $60 million compared to net cash used in financing activities of $26 million for the six months ended June 30, 2014. During the six months ended June 30, 2015, we spent $29 million on our share repurchase program, $10 million for the payment of dividends on CST common stock, $27 million for the payment of CrossAmerica distributions and payments of $22 million on our term loan. Additionally, during the second quarter of 2015, CrossAmerica closed on the sale of 4.6 million common units for net proceeds of $139 million and used the net proceeds from this offering to reduce indebtedness outstanding under its revolving credit facility.
Non–GAAP Measures
EBITDA is a non-U.S. GAAP financial measure that represents net income before income taxes, interest expense and depreciation, amortization and accretion expense. EBITDAR is a non-U.S. GAAP financial measure that further adjusts EBITDA by excluding minimum rent expense. We believe that EBITDA and EBITDAR are useful to investors and creditors in evaluating our operating performance because (a) they facilitate management’s ability to measure the operating performance of our business on a consistent basis by excluding the impact of items not directly resulting from our retail operations; and (b) securities analysts and other interested parties use such calculations as a measure of financial performance. EBITDA and EBITDAR do not purport to be alternatives to net income as a measure of operating performance or to cash flows from operating activities as a measure of liquidity. EBITDA and EBITDAR have limitations as analytical tools and should not be considered in isolation or as a substitute for analysis of our results of operations as reported under U.S. GAAP.
The following table presents a reconciliation of net income to EBITDA and EBITDAR (in millions):
Three Months Ended June 30, | ||||||||||||||||
2015 | ||||||||||||||||
CST | CrossAmerica | Total Consolidated | 2014 | |||||||||||||
Net income (loss) | $ | 25 | $ | (6 | ) | $ | 19 | $ | 32 | |||||||
Interest expense | 9 | 5 | 14 | 10 | ||||||||||||
Income tax expense | 13 | (1 | ) | 12 | 16 | |||||||||||
Depreciation, amortization and accretion | 33 | 18 | 51 | 30 | ||||||||||||
EBITDA | 80 | 16 | 96 | 88 | ||||||||||||
Minimum rent expense | 9 | 6 | 15 | 7 | ||||||||||||
EBITDAR | $ | 89 | $ | 22 | $ | 111 | $ | 95 | ||||||||
56
Six Months Ended June 30, | ||||||||||||||||
2015 | ||||||||||||||||
CST | CrossAmerica | Total Consolidated | 2014 | |||||||||||||
Net income (loss) | $ | 39 | $ | (14 | ) | $ | 25 | $ | 43 | |||||||
Interest expense | 20 | 9 | 29 | 20 | ||||||||||||
Income tax expense | 21 | (7 | ) | 14 | 21 | |||||||||||
Depreciation, amortization and accretion | 66 | 39 | 105 | 61 | ||||||||||||
EBITDA | 146 | 27 | 173 | 145 | ||||||||||||
Minimum rent expense | 17 | 11 | 28 | 14 | ||||||||||||
EBITDAR | $ | 163 | $ | 38 | $ | 201 | $ | 159 | ||||||||
Debt
As of June 30, 2015, our consolidated debt consisted of the following (in millions):
CST debt:(a) | ||||
Revolving credit facility(b) | $ | 20 | ||
Term loan due 2019 | 431 | |||
5.00% senior notes due 2023 | 550 | |||
Total CST debt | 1,001 | |||
CrossAmerica debt:(c) | ||||
Revolving credit facility | 187 | |||
Other | 27 | |||
Total CrossAmerica debt | 214 | |||
Total consolidated debt outstanding | 1,215 | |||
Less current portion | 81 | |||
Consolidated debt, less current portion | $ | 1,134 | ||
(a) The assets of CST can only be used to settle the obligations of CST and creditors of CST have no recourse to the assets or general credit of CrossAmerica. CST has pledged its equity ownership in CrossAmerica to secure the CST credit facility.
(b) This amount was repaid in full on July 1, 2015.
(c) The assets of CrossAmerica can only be used to settle the obligations of CrossAmerica and creditors of CrossAmerica have no recourse to the assets or general credit of CST.
CST maintains a revolving credit facility that provides for aggregate outstanding borrowings of up to $300 million. As of June 30, 2015, the interest rate was 3.75%. As of June 30, 2015, after taking into account letters of credit and the maximum lease adjusted leverage ratio constraints on borrowing availability, approximately $276 million was available for future borrowings. The credit facilities contain certain customary representations and warranties, covenants and events of default. Our credit facilities contain financial covenants (as defined in the credit agreement) consisting of (a) a maximum total lease adjusted leverage ratio initially set at 3.75 to 1.00, (b) a minimum fixed charge coverage ratio set at 1.30 to 1.00, and (c) limitations on expansion capital expenditures. As of June 30, 2015, we were in compliance with these financial covenant ratios.
CrossAmerica maintains a revolving credit facility that provides for aggregate outstanding borrowings of up to $550 million. CrossAmerica’s borrowings had an interest rate of 3.44% as of June 30, 2015. The credit facility is secured by substantially all of the assets of CrossAmerica and its subsidiaries. The amount of availability under this revolving credit facility, after letters of credit of $16 million and covenant constraints, was $140 million at June 30, 2015. Subsequent to the July 2015 CrossAmerica acquisitions discussed in Note 2, the availability for future borrowings was approximately $99 million. In connection with future acquisitions, the revolving credit facility requires, among other things, that CrossAmerica has, after giving effect to such acquisition, at least $20 million of borrowing availability under its revolving credit facility and unrestricted cash on the balance sheet on the date of such acquisition. CrossAmerica is required to maintain a total leverage ratio (as defined) for the most recently completed four
57
fiscal quarters of less than or equal to 5.00 to 1.00. As of June 30, 2015, CrossAmerica was in compliance with these financial covenant ratios.
Capital Requirements
Our capital expenditures and investments relate primarily to the acquisition of land and the construction of NTIs. We also spend capital to improve and renovate our existing retail sites, which we refer to as sustaining capital and, from time to time, we enter into strategic acquisitions. In the first half of 2015, our sustaining capital expenditures also include $13 million related to the improvement of our distribution warehouse and adjoining offices. We believe we have adequate liquidity from cash on hand and borrowing capacity under our revolving credit facilities to continue to operate and grow our business for the next twelve months.
Subsequent to the GP Purchase, we intend to utilize CrossAmerica’s capital structure (through debt and equity issuances) to fund our NTI and acquisition growth activities. Real property associated with NTI construction will periodically be sold (dropped down) by CST to CrossAmerica and subsequently leased back to CST. In addition, real property obtained through acquisitions is expected to be owned by CrossAmerica and leased to CST or other third parties. CST also intends, from time to time, to sell a portion of its existing wholesale fuel supply business to CrossAmerica, by selling equity interests in the subsidiary that conducts this business. We expect that CrossAmerica will pay for these equity interests in cash and limited partnership units.
In January 2015, we closed on the sale of a 5% limited partner equity interest in CST Fuel Supply to CrossAmerica in exchange for common units representing an approximate 6.1% limited partner interest in CrossAmerica. See Note 2 for additional information.
During the first half of 2015, we completed six NTIs in the U.S., which are located in Texas and Arizona. In Canada, we completed two NTIs, which are located in the Greater Toronto area and Quebec.
The following table outlines our consolidated capital expenditures and expenditures for acquisitions by segment for the six months ended June 30, 2015 and 2014 (in millions):
Six Months Ended June 30, | ||||||||
2015 | 2014 | |||||||
U.S. Retail Segment | ||||||||
NTI | $ | 66 | $ | 54 | ||||
Acquisitions | 22 | — | ||||||
Sustaining capital | 36 | 22 | ||||||
124 | 76 | |||||||
Canadian Retail Segment | ||||||||
NTI | 4 | 4 | ||||||
Acquisitions | — | 4 | ||||||
Sustaining capital | 10 | 8 | ||||||
14 | 16 | |||||||
CrossAmerica | ||||||||
Sustaining capital | 1 | — | ||||||
Acquisitions | 128 | — | ||||||
129 | — | |||||||
Total consolidated capital expenditures and acquisitions | $ | 267 | $ | 92 | ||||
CST expects total capital expenditures for 2015 to be in the range of $350 million to $400 million.
58
Other Matters Impacting Liquidity and Capital Resources
Cash Held by Our Canadian Subsidiary
As of June 30, 2015, $239 million of cash was held in Canada. We intend to reinvest earnings indefinitely in our Canadian operations even though we are not restricted from repatriating such earnings to the U.S. in the form of cash dividends. Should we decide to repatriate such earnings, we would incur and pay taxes on the amounts repatriated. In addition, such repatriation could cause us to record deferred tax expense that could significantly impact our results of operations.
Cash Held by CrossAmerica
As of June 30, 2015, $5 million of cash was held by CrossAmerica.
CrossAmerica Common Unit Offering
On June 19, 2015, CrossAmerica closed on the sale of 4.6 million common units for net proceeds of approximately $139 million. On July 16, 2015, CrossAmerica closed on the sale of an additional 0.2 million common units for net proceeds of approximately $6 million in accordance with the underwriters’ option to purchase additional common units associated with the June offering. See Note 10 for additional information.
CST Dividends
We have paid regular quarterly cash dividends of $0.0625 per common share, or $5 million, each quarter, commencing with the quarter ended September 30, 2013. We expect to continue the practice of paying quarterly cash dividends, though the timing, declaration, amount and payment of future dividends to stockholders will fall within the discretion of our Board of Directors. Our indebtedness also restricts our ability to pay dividends. As such, there can be no assurance we will continue to pay dividends in the future.
CrossAmerica Distributions
CrossAmerica paid a quarterly distribution of $0.5425 per unit, or approximately $13 million during the three months ended March 31, 2015 related to the fourth quarter 2014. CrossAmerica paid a quarterly distribution of $0.5475 per unit, or approximately $14 million during the three months ended June 30, 2015 related to the first quarter of 2015. The amount of any distribution is subject to the discretion of the Board of Directors of CrossAmerica’s General Partner, which may modify or revoke CrossAmerica’s cash distribution policy at any time. CrossAmerica’s partnership agreement does not require CrossAmerica to pay any distributions. As such, there can be no assurance CrossAmerica will continue to pay distributions in the future.
For the six months ended June 30, 2015, CrossAmerica distributed to us $2 million with respect to our ownership of common units.
CrossAmerica’s IDRs
IDRs represent our right to receive an increasing percentage of CrossAmerica’s quarterly distributions from operating surplus (as defined by the partnership agreement) after the minimum quarterly distribution and the target distribution levels have been achieved. If cash distributions to CrossAmerica’s limited partner unitholders exceed $0.5031 per unit in any quarter, CrossAmerica’s unitholders and we, as the holder of CrossAmerica’s IDRs, will receive distributions according to the following percentage allocations:
Total Quarterly Distribution Per Common and Subordinated Unit | Marginal Percentage Interest in Distribution | |||||||
Target Amount | Unitholders | Holders of IDRs | ||||||
above $0.5031 up to $0.5469 | 85 | % | 15 | % | ||||
above $0.5469 up to $0.6563 | 75 | % | 25 | % | ||||
above $0.6563 | 50 | % | 50 | % | ||||
For the six months ended June 30, 2015, CrossAmerica distributed $0.4 million to us with respect to our investment in the IDRs.
59
CST Stock Repurchase Plan
For the six months ended June 30, 2015, we purchased 703,932 common shares for approximately $29 million under our share repurchase program. The following table shows our share repurchase activity since inception of the plan through June 30, 2015:
Quarter Ended | Total Number of Shares Purchased | Average Price Paid per Share | Total Cost of Shares Repurchased | Amount Remaining under the Plan | |||||||||||
December 31, 2014 | 501,750 | $ | 42.98 | $ | 21,564,669 | $ | 178,435,331 | ||||||||
March 31, 2015 | 334,584 | $ | 41.98 | $ | 14,044,494 | $ | 164,390,837 | ||||||||
June 30, 2015 | 369,348 | $ | 40.20 | $ | 14,848,306 | $ | 149,542,531 | ||||||||
1,205,682 | $ | 50,457,469 | |||||||||||||
Subsequent to June 30, 2015 through August 5, 2015, we purchased an additional 888,545 of our common shares for a total purchase price of $35 million.
Drop Down of CST Wholesale Fuel Supply Equity Interests and NTI Convenience Stores
In January 2015 and again in July 2015, we closed on the sales of a 5% and 12.5%, respectively, limited partner equity interests in CST Fuel Supply to CrossAmerica for an aggregate consideration of $18 million in cash and 4.8 million common units of CrossAmerica.
Also in July 2015, we completed the sale of 29 NTIs to CrossAmerica in exchange for an aggregate consideration of approximately 0.3 million common units and cash in the amount of $124 million. Based on our credit facility agreement, CST is required to use the cash proceeds from this transaction to repay debt, reinvest in asset or business acquisitions, or capital expenditures in the ordinary course of business.
As of August 5, 2015, CrossAmerica’s total equity interest in CST Fuel Supply is 17.5% and CST’s total equity interest in CrossAmerica is 15.9%.
See Note 2 for additional information.
Acquisition of Landmark
In January 2015, CST jointly purchased with CrossAmerica 22 convenience stores from Landmark. See Note 2 for additional information.
Acquisition of Erickson
In February 2015, CrossAmerica closed on the purchase of all of the outstanding capital stock of Erickson and certain related assets. See Note 2 for additional information.
Acquisition of One Stop
In July 2015, CrossAmerica closed on the purchase of 41 convenience stores from One Stop and certain related assets. See Note 2 for additional information.
60
New Accounting Policies
In February 2015, the Financial Accounting Standards Board (“FASB”) issued Accounting Standards Update (“ASU”) 2015-02—Consolidation (Topic 810): Amendments to the Consolidation Analysis. This standard modifies existing consolidation guidance for reporting organizations that are required to evaluate whether they should consolidate certain legal entities, including limited partnerships and other similar entities. ASU 2015-02 is effective for fiscal years and interim periods within those years beginning after December 15, 2015, and requires either a full retrospective or a modified retrospective approach to adoption. Early adoption is also permitted. Management is currently evaluating this new guidance, including how it will apply the guidance at the date of adoption.
In April 2015, the FASB issued ASU 2015-03—Interest-Imputation of Interest (Subtopic 835-30), which requires that debt issuance costs related to a recognized debt liability be presented in the balance sheet as a direct deduction from the carrying amount of that debt liability, consistent with debt discounts. This guidance is effective January 1, 2016. Early adoption is permitted. The guidance is to be applied on a retrospective basis, wherein the balance sheet of each individual period presented should be adjusted to reflect the period-specific effects of applying the new guidance. If the guidance were applicable at June 30, 2015, other noncurrent assets and long-term debt would be lower by $21 million.
In May 2014, the FASB issued ASU 2014-09—Revenue from Contracts with Customers (Topic 606), which results in comprehensive new revenue accounting guidance, requires enhanced disclosures to help users of financial statements better understand the nature, amount, timing, and uncertainty of revenue that is recognized, and develops a common revenue standard under U.S. GAAP and International Financial Reporting Standards. Specifically, the core principle of the guidance is that an entity should recognize revenue to depict the transfer of promised goods or services to customers in an amount that reflects the consideration to which the entity expects to be entitled in exchange for those goods and services. This guidance is effective January 1, 2018, pending issuance of the final Accounting Standards Update. Early adoption is not permitted. The guidance can be applied either retrospectively to each prior reporting period presented, or as a cumulative-effect adjustment as of the date of adoption. Management is currently evaluating this new guidance, including how it will apply the guidance at the date of adoption.
As discussed in Note 1, certain other new financial accounting pronouncements have become effective for our financial statements and the adoption of these pronouncements will not affect our financial position or results of operations, nor will they require any additional disclosures.
61
Critical Accounting Policies Involving Critical Accounting Estimates
The preparation of financial statements in accordance with GAAP requires us to make estimates and assumptions that affect the amounts reported in our financial statements and accompanying notes. Actual results could differ from those estimates.
There have been no material changes to the critical accounting policies described in our Form 10-K filed on February 27, 2015 or our Form 10-K/A filed on June 8, 2015.
ITEM 3. QUANTITATIVE AND QUALITATIVE DISCLOSURES ABOUT MARKET RISK
Interest Rate Risk
CST’s debt includes a $431 million, five-year, amortizing term loan bearing interest at a variable rate. In addition, the CST revolving credit facility has a borrowing capacity of up to $300 million, and any borrowings would bear interest at variable rates. As of June 30, 2015, we have $20 million outstanding under the CST revolving credit facility, which was repaid in full on July 1, 2015. As of June 30, 2015, the interest rate was 3.75%. As of June 30, 2015, the borrowing rate on the term loan was 1.69% (LIBOR plus a margin of 1.50%). A one percentage point change in the average interest rate would impact annual interest expense by approximately $4 million.
As of June 30, 2015, CrossAmerica had $187 million outstanding under its revolving credit facility. Outstanding borrowings bear interest at LIBOR plus a margin of 3.25%. These borrowings had an interest rate of 3.44%. A one percentage point change in CrossAmerica’s average rate would impact annual interest expense by approximately $2 million.
Commodity Price Risk
We have not historically hedged or managed our price risk with respect to our commodity inventories (gasoline and diesel fuel), as the time period between the purchases of our motor fuel inventory and the sales to our customers is very short.
Foreign Currency Risk
Our financial statements are reported in U.S. dollars. However, a substantial portion of our operations are located in Canada. As such, our reported results of operations, cash flows and financial position as they relate to our Canadian operations are impacted by fluctuations in the Canadian dollar exchange rate into U.S. dollars. We have not historically hedged or managed our risk associated with our exposure to the Canadian dollar/U.S. dollar exchange rate. A one percentage decline in the 2015 weighted average exchange rate would have no material impact to our June 30, 2015 net income. As of June 30, 2015, $239 million of cash was held in Canada.
The operations of CrossAmerica are located in the U.S., and therefore are not subject to foreign currency risk.
62
ITEM 4. CONTROLS AND PROCEDURES
(a) Evaluation of disclosure controls and procedures.
Our management has evaluated, with the participation of our principal executive officer and principal financial officer, the effectiveness of our disclosure controls and procedures (as defined in Rule 13a-15 under the Securities Exchange Act of 1934) as of the end of the period covered by this report, and has concluded that our disclosure controls and procedures were effective as of June 30, 2015.
(b) Changes in internal control over financial reporting.
There were no changes in our internal control over financial reporting (as that term is defined in Rules 13a-15(f) and 15d-15(f) under the Exchange Act) that occurred during the quarter ended June 30, 2015, that have materially affected, or are reasonably likely to materially affect, our internal control over financial reporting, except as noted below.
Management’s evaluation of and conclusion regarding the effectiveness of our internal control over financial reporting for the year ended December 31, 2014 excluded the internal control over financial reporting of CrossAmerica GP LLC (formerly Lehigh Gas GP LLC) and its subsidiaries, which we acquired on October 1, 2014, and of Nice N Easy (NNE), the operations of which we acquired on November 3, 2014. CrossAmerica GP LLC is the general partner of CrossAmerica Partners LP (formerly Lehigh Gas Partners LP), which is a consolidated variable interest entity of CST Brands, Inc. Our evaluation of and conclusion regarding the effectiveness of our internal control over financial reporting also excludes the internal control over financial reporting of CrossAmerica Partners LP. The CrossAmerica GP LLC, NNE and CrossAmerica Partners LP consolidated acquisitions contributed approximately 5 percent of our total operating revenues for the year ended December 31, 2014 and accounted for approximately 33 percent of our total assets as of December 31, 2014. We plan to fully integrate CrossAmerica GP LLC, NNE and CrossAmerica Partners LP into our internal control over financial reporting in 2015.
As a public company, CrossAmerica’s management is required to report on its evaluation and conclusions regarding the effectiveness of its internal control. As noted in CrossAmerica’s Form 10-Q for the quarter ended June 30, 2015, there were no changes in its internal control over financial reporting that occurred during the six months ended June 30, 2015, that have materially affected, or are reasonably likely to materially affect, its internal control over financial reporting, except for its acquisition of Erickson on February 12, 2015. The internal controls over financial reporting of Erickson are anticipated to be excluded from a formal evaluation of effectiveness of CrossAmerica’s disclosure controls and procedures as of December 31, 2015.
PART II - OTHER INFORMATION
Item 1. LEGAL PROCEEDINGS
We hereby incorporate by reference into this Item our disclosures made in Part I, Item 1 of this quarterly report included in Note 8 of the notes to the consolidated financial statements.
Item 1A. RISK FACTORS
There were no material changes to the risk factors disclosed in the section entitled “Risk Factors” in our Form 10-K filed on February 27, 2015 or our Form 10-K/A filed on June 8, 2015.
63
Item 2. UNREGISTERED SALES OF EQUITY SECURITIES AND USE OF PROCEEDS
Repurchases of common stock
On August 5, 2014, our Board of Directors approved a stock repurchase plan under which we are authorized to purchase shares of our common stock up to a maximum dollar amount of $200 million, until such authorization is exhausted or withdrawn by our Board of Directors. Under the stock repurchase program, we are authorized to repurchase, from time-to-time, shares of our outstanding common stock in the open market, at management’s discretion, based on market and business conditions, applicable legal requirements and other factors, or pursuant to an issuer repurchase plan or agreement that may be in effect. The repurchase program does not obligate us to acquire any specific amount of common stock and will continue until otherwise modified or terminated by our Board of Directors at any time at its sole discretion and without notice.
During the second quarter of 2015, we purchased shares of our common stock totaling $15 million. The following table contains information about those purchases:
Period | Total Number of Shares Purchased (a) | Average Price Paid per Share | Total Number of Shares Purchased as Part of a Publicly Announced Plan | Maximum Dollar Amount that May Yet Be Spent Under the Plan | ||||||||||
April 1-30, 2015 | — | $ | — | — | $ | 164,390,837 | ||||||||
May 1-31, 2015 | 12,038 | $ | 40.89 | — | $ | 164,390,837 | ||||||||
June 1-30, 2015 | 369,348 | $ | 40.20 | 369,348 | $ | 149,542,531 | ||||||||
Total | 381,386 | 369,348 | ||||||||||||
(a) | Amount potentially includes shares withheld in connection with exercise proceeds and withholding taxes related to the exercise of stock options, the vesting of restricted stock and the vesting of restricted stock units. |
Item 4. MINE SAFETY DISCLOSURES
None.
64
Item 6. Exhibits
Exhibit No. | Description |
31.1* | Certification of Chief Executive Officer Pursuant to Section 302 of the Sarbanes-Oxley Act of 2002 |
31.2* | Certification of Chief Financial Officer Pursuant to Section 302 of the Sarbanes-Oxley Act of 2002 |
32.1** | Certification of Chief Executive Officer Pursuant to Section 906 of the Sarbanes-Oxley Act of 2002 |
32.2** | Certification of Chief Financial Officer Pursuant to Section 906 of the Sarbanes-Oxley Act of 2002 |
101* | Interactive Data Files |
* | Filed herewith. |
** | Furnished herewith. |
65
SIGNATURE
Pursuant to the requirements of the Securities Exchange Act of 1934, the registrant has duly caused this report to be signed on its behalf by the undersigned, thereunto duly authorized.
CST BRANDS, INC.
/s/ Clayton E. Killinger
By: Clayton E. Killinger
Title: Executive Vice President and Chief Financial Officer
(Duly Authorized Officer and Principal Financial and Accounting Officer)
Date: August 7, 2015
66