Attached files
| file | filename |
|---|---|
| 8-K - 8-K - CIFC Corp. | cifc20158-kcoverx063015.htm |

Exhibit 99.1
CIFC CORP. | Investor Relations |
250 Park Avenue | Investor@CIFC.COM |
New York, NY 10177 | (646) 367-6633 |
NASDAQ: CIFC
CIFC Corp. Announces Second Quarter of 2015 Results and a Quarterly Dividend
NEW YORK, August 7, 2015 - CIFC Corp. (NASDAQ: CIFC) (“CIFC” or the “Company”) today announced its results for the second quarter ended June 30, 2015.
Highlights
• | Fee Earning Assets Under Management ("Fee Earning AUM" or "AUM") from loan-based products was $14.0 billion as of June 30, 2015, as compared to $13.7 billion as of December 31, 2014 and $12.6 billion as of June 30, 2014. |
◦ | During the second quarter of 2015, the Company sponsored the issuance of one new CLO and increased subscriptions to Non-CLO products that, together, represented $631.5 million of new AUM. |
◦ | Subsequent to quarter end, the Company sponsored the issuance of a new CLO that represented approximately $500 million of new loan-based AUM. |
• | Economic Net Income ("ENI", a non-GAAP measure) for the six months was $22.6 million as compared to $28.4 million for the same period in the prior year. ENI for the quarter was $11.5 million as compared to $15.2 million for the same period in the prior year. |
• | GAAP net income (loss) for the six months was $6.5 million as compared to $6.7 million for the same period in the prior year. GAAP net income (loss) for the quarter was $1.1 million as compared to $6.4 million for the same period in the prior year. |
• | CIFC declares a cash dividend of $0.10 per share. The dividend will be paid on September 8, 2015 to shareholders of record as of the close of business on August 28, 2015. |
Executive Overview
The CLO market continues to be strong. We successfully closed three new CLOs raising $1.6 billion of new AUM year-to-date. Our strong brand recognition and well-capitalized platform allowed us to continue to compete successfully with larger multi-strategy credit platforms. During the past quarter, we executed what we believe to be the largest refinancing of a 2.0 CLO in the U.S. market. Looking ahead, we have built a healthy pipeline of new CLO transactions. We expect to issue our first risk retention compliant CLO before the end of the year.
Our total return businesses focused on broadly syndicated loans and CLO investment opportunities are performing well. We will have a 3-year track record for our flagship total return fund this fall and expect significant growth in this strategy. Risk retention requirements for the CLO market are creating attractive investment opportunities which we have begun to exploit in our structured product business.
We continue to invest in the CIFC platform and are confident that our commitment to attracting top industry talent will drive value in the future. During the past quarter, we allocated our capital to good relative value opportunities across CLO debt and equity while reducing our risk exposure in warehouse investments.
1
Selected Financial Metrics
(In thousands, except per share data) (unaudited)
NON-GAAP FINANCIAL MEASURES (1) | 2Q'15 | 2Q'14 | % Change vs. 2Q'14 | YTD'15 | YTD'14 | % Change vs. YTD'14 | ||||||||
Senior Fees from CLOs | $ | 5,983 | $ | 5,634 | 6% | $ | 11,774 | $ | 10,326 | 14% | ||||
Subordinated Fees from CLOs | 7,996 | 8,343 | (4)% | 17,165 | 16,812 | 2% | ||||||||
Management Fees from Non-CLO products | 977 | 657 | 49% | 1,838 | 1,265 | 45% | ||||||||
Total Management Fees | 14,956 | 14,634 | 2% | 30,777 | 28,403 | 8% | ||||||||
Incentive Fees | 4,066 | 4,682 | (13)% | 8,066 | 9,882 | (18)% | ||||||||
Net Investment Income | 5,742 | 8,240 | (30)% | 11,850 | 14,236 | (17)% | ||||||||
Total ENI Revenues | 24,764 | 27,556 | (10)% | 50,693 | 52,521 | (3)% | ||||||||
Employee compensation and benefits | 7,187 | 7,017 | 2% | 15,471 | 13,744 | 13% | ||||||||
Stock-based compensation (2) | 952 | 638 | 49% | 2,628 | 739 | 256% | ||||||||
Other operating expenses | 4,332 | 3,189 | 36% | 8,699 | 6,684 | 30% | ||||||||
Corporate interest expense | 800 | 1,486 | (46)% | 1,294 | 2,953 | (56)% | ||||||||
Total ENI Expenses | 13,271 | 12,330 | 8% | 28,092 | 24,120 | 16% | ||||||||
ENI (1) | $ | 11,493 | $ | 15,226 | (25)% | $ | 22,601 | $ | 28,401 | (20)% | ||||
ENI per share - basic | $ | 0.45 | $ | 0.73 | (38)% | $ | 0.89 | $ | 1.36 | (35)% | ||||
ENI per share - diluted (3) (4) | $ | 0.43 | $ | 0.61 | (30)% | $ | 0.85 | $ | 1.15 | (26)% | ||||
NON-GAAP FINANCIAL MEASURES (1) | 2Q'15 | 2Q'14 | % Change vs. 2Q'14 | YTD'15 | YTD'14 | % Change vs. YTD'14 | ||||||||
ENI EBITDA (5) | $ | 12,642 | $ | 16,974 | (26)% | $ | 24,577 | $ | 31,852 | (23)% | ||||
ENI EBITDA Margin (6) | 51 | % | 62 | % | (11)% | 48 | % | 61 | % | (13)% | ||||
ENI Margin (6) | 46 | % | 55 | % | (9)% | 45 | % | 54 | % | (9)% | ||||
NON-GAAP FINANCIAL MEASURES - AUM | 6/30/2015 | 12/31/2014 | % Change vs. 12/31/14 | 6/30/2014 | % Change vs. 6/30/14 | ||||
Fee Earning AUM from loan-based products (7) | $14,007,339 | $13,676,489 | 2% | $12,571,662 | 11% | ||||
SELECTED GAAP RESULTS | 2Q'15 | 2Q'14 | % Change vs. 2Q'14 | YTD'15 | YTD'14 | % Change vs. YTD'14 | ||||||||
Total net revenues | $ | 2,009 | $ | 1,475 | 36% | $ | 5,663 | $ | 3,184 | 78% | ||||
Total expenses | $ | 15,312 | $ | 13,882 | 10% | $ | 32,469 | $ | 27,626 | 18% | ||||
Net income (loss) attributable to CIFC Corp. | $ | 1,103 | $ | 6,444 | (83)% | $ | 6,531 | $ | 6,679 | (2)% | ||||
Earnings (loss) per share - basic | $ | 0.04 | $ | 0.31 | (87)% | $ | 0.26 | $ | 0.32 | (19)% | ||||
Earnings (loss) per share - diluted (3) | $ | 0.04 | $ | 0.26 | (85)% | $ | 0.25 | $ | 0.29 | (14)% | ||||
Weighted average shares outstanding - basic | 25,302 | 20,972 | 21% | 25,291 | 20,906 | 21% | ||||||||
Weighted average shares outstanding - diluted | 26,432 | 26,213 | 1% | 26,504 | 26,141 | 1% | ||||||||
Explanatory Notes:
(1) | See Appendix for a detailed description of these non-GAAP measures and reconciliations from net income (loss) attributable to CIFC Corp. to non-GAAP measures. |
(2) | Stock-based compensation includes stock award amortization expense for both employees and directors of the Company. |
(3) | Convertible Notes outstanding were converted into the Company's common shares on July 12, 2014. For the three and six months ended June 30, 2014, the numerator in the dilution calculation has been adjusted to add-back the effect of convertible note interest charges (before taxes for ENI and after taxes for GAAP). |
(4) | GAAP weighted average shares outstanding was used as ENI weighted average shares outstanding. |
(5) | ENI EBITDA is ENI before corporate interest expense and depreciation of fixed assets. See Appendix. |
(6) | ENI EBITDA Margin is ENI EBITDA divided by Total ENI Revenue. ENI Margin is ENI divided by Total ENI Revenue. |
(7) | Amount excludes Fee Earning AUM attributable to non-core products of $643.3 million, $687.6 million and $737.8 million as of June 30, 2015, December 31, 2014 and June 30, 2014, respectively. Fee Earning AUM attributable to non-core products are expected to continue to decline as these funds run-off per their contractual terms. |
2
Second Quarter Overview
CIFC reported ENI of $11.5 million for the second quarter of 2015, as compared to $15.2 million for the same quarter in the prior year. ENI decreased quarter over quarter by $3.7 million or 25% predominately driven by increases in other operating expenses as well as decreases in net investment income. Increases in operating expenses primarily relate to $0.5 million of advisory fees paid to DFR Holdings LLC under a consulting agreement executed during the third quarter of 2014. In addition, operating expenses increased quarter over quarter to support the continued growth and diversification of the business. Net investment income was lower as we reduced our exposure to warehouse investments. Most investments in warehouses are now made through the Warehouse Fund, a closed-end structured credit fund launched in the fourth quarter of 2014. Partially offsetting decreases was the reduction of corporate interest expense related to the convertible notes, which were converted in July 2014.
CIFC reported GAAP net income attributable to CIFC Corp. of $1.1 million for the second quarter of 2015, as compared to $6.4 million in the same period of the prior year. GAAP operating results decreased by $5.3 million or 83% from the same period of the prior year due to (i) the $3.7 million decrease in ENI noted above (see Non-GAAP Financial Measures section for a reconciliation between GAAP and Non-GAAP ENI), (ii) increases in income tax expense of $3.0 million period to period primarily related to a $6.3 million write-down of deferred tax assets related to changes in New York City tax laws and (iii) a $0.8 million reduction in revenues earned on certain legacy CLOs with fee sharing (GAAP presents fees gross of fee sharing). These decreases were partially offset by increases of (i) $1.0 million for the reversal of organizational fund set up costs expensed during the first quarter of 2015; subsequent to the successful launch of the fund in the current period, these costs have been absorbed by the fund and are no longer a cost to the Company, (ii) $1.0 million related to the reduction in losses recognized on contingent liabilities due to changes in the expected performance of legacy CIFC CLOs with fee sharing arrangements period over period.
Fee Earning AUM
Fee Earning AUM or AUM refers to the assets managed by the Company on which it is paid management fees and/or incentive fees. Generally, with respect to CLOs, management fees are paid to the Company based on the aggregate collateral balance at par plus principal cash, and with respect to Non-CLO funds, the value of the assets in such funds (excluding non-fee earning AUM such as the Company’s investments).
The Company's total loan-based AUM increased by $330.9 million from December 31, 2014, primarily as a result of the issuance of two new CLOs for $1.1 billion and the receipt of $327.7 million in additional subscriptions to its existing credit funds. These increases were offset by declines in AUM for certain CLOs which have reached the end of their reinvestment periods.
The following table summarizes Fee Earning AUM for the Company's significant loan-based products (1)(2):
June 30, 2015 | December 31, 2014 | June 30, 2014 | |||||||||||||||||||
(in thousands, except # of Products) | # of Products | Fee Earning AUM | # of Products | Fee Earning AUM | # of Products | Fee Earning AUM | |||||||||||||||
Post 2011 CLOs | 15 | $ | 8,457,581 | 13 | $ | 7,402,986 | 10 | $ | 5,539,964 | ||||||||||||
Legacy CLOs (3) | 15 | 4,016,596 | 19 | 4,960,877 | 19 | 5,819,791 | |||||||||||||||
Total CLOs | 30 | 12,474,177 | 32 | 12,363,863 | 29 | 11,359,755 | |||||||||||||||
Credit Funds & SMAs (4) | 9 | 884,713 | 8 | 593,456 | 5 | 495,465 | |||||||||||||||
Other Loan-Based Products (4) | 2 | 648,449 | 2 | 719,170 | 1 | 716,442 | |||||||||||||||
Total Non-CLOs (4) | 11 | $ | 1,533,162 | 10 | $ | 1,312,626 | 6 | $ | 1,211,907 | ||||||||||||
AUM from loan-based products | 41 | $ | 14,007,339 | 42 | $ | 13,676,489 | 35 | $ | 12,571,662 | ||||||||||||
Explanatory Notes:
(1) | Table excludes Fee Earning AUM attributable to non-core products of $643.3 million, $687.6 million and $737.8 million as of June 30, 2015, December 31, 2014 and June 30, 2014, respectively. Fee Earning AUM attributable to non-core products is expected to continue to decline as these funds run-off per their contractual terms. |
(2) | Fee Earning AUM is based on the latest available monthly report issued by the trustee or fund administrator prior to the end of the period, and may not tie back to Consolidated GAAP financial statements. |
(3) | Legacy CLOs represent all managed CLOs issued prior to 2011, including CLOs acquired since 2011 but issued prior to 2011. |
(4) | Management fees for Non-CLO products vary by fund and may not be similar to a CLO. |
3
The following graph illustrates that since 2012, CIFC has raised $10.0 billion new AUM, which has more than offset the run-off from Legacy CLOs (including acquired CLOs) through organic growth. Our Legacy CLO AUM of $4.0 billion is less than a third of our total CLO AUM of $12.5 billion.
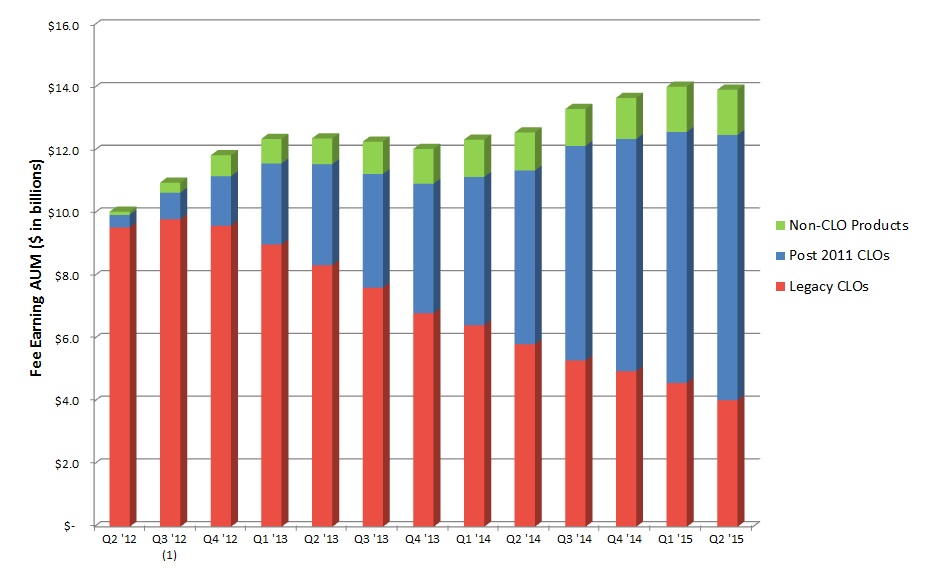
Explanatory Note:
(1) | Increase in AUM on the Legacy CLOs was the result of the acquisition of the rights to manage four "Navigator" CLOs during September 2012. |
Total loan-based Fee Earning AUM activity for the three months, six months and the last twelve months ("LTM") ended June 30, 2015 are as follows ($ in thousands):
2Q'15 | YTD'15 | LTM 2Q'15 | |||||||
Opening AUM Balance | $ | 14,033,660 | $ | 13,676,489 | $ | 12,571,662 | |||
CLO New Issuances | 500,000 | 1,100,000 | 2,949,528 | ||||||
CLO Paydowns | (593,636 | ) | (965,877 | ) | (1,818,392 | ) | |||
Fund Subscriptions | 131,518 | 327,748 | 462,377 | ||||||
Fund Redemptions | (31,497 | ) | (70,824 | ) | (97,449 | ) | |||
Other (1) | (32,706 | ) | (60,197 | ) | (60,387 | ) | |||
Ending AUM Balance | $ | 14,007,339 | $ | 14,007,339 | $ | 14,007,339 | |||
Explanatory Note:
(1) | Other includes changes in collateral balances of CLOs between periods and market value or portfolio value changes in certain Non-CLO products. |
Liquidity and Capital Resources
As of June 30, 2015 our total cash and cash equivalents and investments was $179.9 million and, excluding non-recourse variable interest entity ("VIE") debt, the Company had $120.0 million of Junior Subordinated Notes maturing in 2035 with a weighted average interest rate of three month LIBOR + 2.77% over the term of the loans.
4
Investments
Our investments increased by $49.9 million during the first half of the year. Our investments as of June 30, 2015 and December 31, 2014 are as follows ($ in thousands):
Deconsolidated Non-GAAP (1) | June 30, 2015 | December 31, 2014 | Change | |||||||||
CIFC Managed CLO Equity (Residual Interests) | $ | 25,708 | $ | 20,829 | $ | 4,879 | ||||||
Warehouses (2) | 36,742 | 21,134 | 15,608 | |||||||||
Fund Coinvestments | 65,212 | 43,346 | 21,866 | |||||||||
Other Investments | 23,532 | 15,940 | 7,592 | |||||||||
Total | $ | 151,194 | $ | 101,249 | $ | 49,945 | ||||||
Explanatory Notes:
(1) | Pursuant to GAAP, investments in consolidated CLOs, warehouses and certain Non-CLO products are eliminated from "Investments" on the Company's Consolidated Balance Sheets. See Appendix for a Reconciliation from GAAP to Non-GAAP - Consolidated Balance Sheets for further details. |
(2) | From time to time, the Company establishes “warehouses”, entities designed to accumulate assets in advance of sponsoring new CLOs or other funds managed by the Company. To establish a warehouse, the Company contributes equity capital to a newly formed entity which is typically levered (three to five times) and begins accumulating assets. When the related CLO or fund is sponsored, typically three to nine months later, the warehouse is “terminated”, with it concurrently repaying the related financing and returning to the Company its equity contribution. Gains or losses may be netted against the Company's equity contribution depending on whether warehouse assets are transferred at market value or cost. |
Non-GAAP Financial Measures
The Company discloses financial measures that are calculated and presented on a basis of methodology other than in accordance with generally accepted accounting principles of the United States of America (“Non-GAAP”) as follows:
ENI is a non-GAAP financial measure of profitability which management uses in addition to GAAP Net income attributable to CIFC Corp. to measure the performance of our core business (excluding non-core products). We believe ENI reflects the nature and substance of the business, the economic results driven by management fee revenues from the management of client funds and earnings on our investments. ENI represents net income (loss) attributable to CIFC Corp. excluding (i) income taxes, (ii) merger and acquisition related items including fee-sharing arrangements, amortization and impairments of intangible assets and gain (loss) on contingent consideration for earn-outs, (iii) non-cash compensation related to profits interests granted by CIFC Parent in June 2011, (iv) revenues attributable to non-core investment products, (v) advances for fund organizational expenses, and (vi) certain other items as detailed.
The Deconsolidated Non-GAAP Statements represent the Consolidated GAAP statements adjusted to eliminate the impact of the Consolidated Entities. On the Statement of Operations, the Company has reclassified the sum of Net results of Consolidated Entities, Net (income) loss attributable to noncontrolling interest in Consolidated Entities and Net gain (loss) on investments to the Deconsolidated Non-GAAP line items that represent its characteristics: management fees and interest income. On the Balance Sheets, the Company has excluded amounts related to all consolidated entities. Management uses these Non-GAAP statements in addition to Consolidated GAAP Statements to measure the performance of its core asset management business.
ENI EBITDA is also a non-GAAP financial measure that management considers, in addition to net income (loss) attributable to CIFC Corp., to evaluate the Company's core performance. ENI EBITDA represents ENI before corporate interest expense and depreciation of fixed assets, a non-cash item.
ENI and ENI EBITDA may not be comparable to similar measures presented by other companies, as they are non-GAAP financial measures that are not based on a comprehensive set of accounting rules or principles and therefore may be defined differently by other companies. In addition, ENI and ENI EBITDA should be considered as an addition to, not as a substitute for, or superior to, financial measures determined in accordance with GAAP.
A detailed calculation of ENI and ENI EBITDA and a reconciliation to the most comparable GAAP financial measure is included in the Appendix.
[Financial Tables to Follow in Appendix]
5
About CIFC
CIFC is a fundamentals-based, relative value credit manager. Headquartered in New York, CIFC is a SEC registered investment adviser and a publicly traded company (NASDAQ: CIFC). CIFC currently serves over 200 institutional investors globally. For more information, please visit CIFC’s website at www.cifc.com.
Forward-Looking Statements
This release may contain forward-looking statements within the meaning of Section 27A of the Securities Act of 1933 and Section 21E of the Securities Exchange Act of 1934 which reflect CIFC's current views with respect to, among other things, CIFC's operations and financial performance. You can identify these forward-looking statements by the use of words such as “outlook,” “believes,” “expects,” “potential,” “continues,” “may,” “will,” “should,” “seeks,” “approximately,” “predicts,” “intends,” “plans,” “estimates,” “anticipates” or the negative version of these words or other comparable words. Such forward-looking statements are subject to various risks and uncertainties. Accordingly, there are or will be important factors that could cause actual outcomes or results to differ materially from those indicated in these statements. CIFC believes these factors include but are not limited to those described under the section entitled “Risk Factors” in its Annual Report on Form 10-K for the fiscal year ended December 31, 2014, as such factors may be updated from time to time in its periodic filings with the Securities and Exchange Commission, which are accessible on the SEC's website at www.sec.gov. These factors should not be construed as exhaustive and should be read in conjunction with the other cautionary statements that are included in this release and in the filings. CIFC undertakes no obligation to publicly update or review any forward-looking statement, whether as a result of new information, future developments or otherwise.
6
Appendix - Table of Contents
Ÿ | Summary reconciliation of GAAP net income (loss) attributable to CIFC Corp. to Non-GAAP measures (ENI and ENI EBITDA) for the Three and Six Months Ended June 30, 2015 and 2014 (unaudited) |
Ÿ | Reconciliation of GAAP to Non-GAAP measures (GAAP basis Statements of Operations are adjusted to exclude the consolidation of entities) for the Three Months Ended June 30, 2015 and 2014 (unaudited) |
Ÿ | Reconciliation of GAAP to Non-GAAP measures (GAAP basis Statements of Operations are adjusted to exclude the consolidation of entities) for the Six Months Ended June 30, 2015 and 2014 (unaudited) |
Ÿ | Reconciliation of GAAP to Non-GAAP measures (GAAP basis Balance Sheets are adjusted to exclude the consolidation of entities) as of June 30, 2015 and December 31, 2014 (unaudited) |
7
Appendix
Summary Reconciliation of GAAP Net income (loss) attributable to CIFC Corp. to Non-GAAP Measures (unaudited)
(In thousands) (unaudited) | 2Q'15 | 2Q'14 | YTD'15 | YTD'14 | ||||||||
GAAP Net income (loss) attributable to CIFC Corp. | $ | 1,103 | $ | 6,444 | $ | 6,531 | $ | 6,679 | ||||
Income tax expense (benefit) | 9,828 | 6,837 | 12,915 | 19,241 | ||||||||
Amortization and impairment of intangibles | 2,193 | 2,608 | 4,550 | 5,517 | ||||||||
Management fee sharing arrangements (1) | (1,627 | ) | (2,421 | ) | (3,466 | ) | (5,066 | ) | ||||
Net (gain)/loss on contingent liabilities and other | 577 | 1,529 | 1,290 | 1,758 | ||||||||
Employee compensation costs (2) | 319 | 430 | 603 | 942 | ||||||||
Management fees attributable to non-core funds | (167 | ) | (201 | ) | (340 | ) | (442 | ) | ||||
Advance for fund organization expenses (3) | (1,062 | ) | — | — | — | |||||||
Other (4) | 329 | — | 518 | (228 | ) | |||||||
Total reconciling and non-recurring items | 10,390 | 8,782 | 16,070 | 21,722 | ||||||||
ENI | $ | 11,493 | $ | 15,226 | $ | 22,601 | $ | 28,401 | ||||
Add: Corporate interest expense | 800 | 1,486 | 1,294 | 2,953 | ||||||||
Add: Depreciation of fixed assets | 349 | 262 | 682 | 498 | ||||||||
ENI EBITDA | $ | 12,642 | $ | 16,974 | $ | 24,577 | $ | 31,852 | ||||
Explanatory Notes:
(1) | The Company shares management fees on certain of the acquired CLOs it manages (shared with the party that sold the funds to CIFC, or an affiliate thereof). Management fees are presented on a gross basis for GAAP and on a net basis for Non-GAAP ENI. |
(2) | Employee compensation and benefits has been adjusted for non-cash compensation related to profits interests granted to CIFC employees by CIFC Parent and sharing of incentive fees with certain former employees established in connection with the Company's acquisition of certain CLOs from Columbus Nova Credit Investments Management, LLC ("CNCIM"). |
(3) | From time to time, the Company may temporarily incur expenses related to organizational costs on a potential fund. These costs are expensed immediately under GAAP. Generally, once a fund has been successfully launched, the Company will reverse the costs as they are absorbed by the fund. |
(4) | For the three months ended June 30, 2015, Other includes certain professional fees. For the six months ended June 30, 2015, Other includes litigation expenses and certain professional fees. For the six months ended June 30, 2014, Other represents additional gains from contingent payments collected on the 2012 sale of the Company's rights to manage Gillespie CLO PLC. |
8
Reconciliation from GAAP to Non-GAAP Measures - Consolidated Statements of Operations (unaudited)
2Q'15 | 2Q'14 | |||||||||||||||||||||||
(In thousands) (unaudited) | Consolidated GAAP | Consolidation Adjustments | Deconsolidated Non-GAAP | Consolidated GAAP | Consolidation Adjustments | Deconsolidated Non-GAAP | ||||||||||||||||||
Revenues | ||||||||||||||||||||||||
Management and incentive fees | $ | 1,765 | $ | 19,051 | $ | 20,816 | $ | 1,378 | $ | 20,560 | $ | 21,938 | ||||||||||||
Net investment income | 244 | 6,560 | 6,804 | 97 | 8,143 | 8,240 | ||||||||||||||||||
Total net revenues | 2,009 | 25,611 | 27,620 | 1,475 | 28,703 | 30,178 | ||||||||||||||||||
Expenses | ||||||||||||||||||||||||
Employee compensation and benefits | 7,470 | — | 7,470 | 7,386 | — | 7,386 | ||||||||||||||||||
Stock-based compensation | 988 | — | 988 | 699 | — | 699 | ||||||||||||||||||
Professional services | 1,795 | — | 1,795 | 706 | — | 706 | ||||||||||||||||||
General and administrative expenses | 2,517 | — | 2,517 | 2,221 | — | 2,221 | ||||||||||||||||||
Depreciation and amortization | 2,080 | — | 2,080 | 2,870 | — | 2,870 | ||||||||||||||||||
Impairment of intangible assets | 462 | — | 462 | — | — | — | ||||||||||||||||||
Total expenses | 15,312 | — | 15,312 | 13,882 | — | 13,882 | ||||||||||||||||||
Other Income (Expense) and Gain (Loss) | ||||||||||||||||||||||||
Net gain (loss) on investments | 1,991 | (1,991 | ) | — | 1,121 | (1,121 | ) | — | ||||||||||||||||
Net gain (loss) on contingent liabilities | (577 | ) | — | (577 | ) | (1,529 | ) | — | (1,529 | ) | ||||||||||||||
Corporate interest expense | (800 | ) | — | (800 | ) | (1,486 | ) | — | (1,486 | ) | ||||||||||||||
Net other income (expense) and gain (loss) | 614 | (1,991 | ) | (1,377 | ) | (1,894 | ) | (1,121 | ) | (3,015 | ) | |||||||||||||
Operating income (loss) | (12,689 | ) | 23,620 | 10,931 | (14,301 | ) | 27,582 | 13,281 | ||||||||||||||||
Net results of Consolidated Entities | 39,123 | (39,123 | ) | — | 37,046 | (37,046 | ) | — | ||||||||||||||||
Income (loss) before income taxes | 26,434 | (15,503 | ) | 10,931 | 22,745 | (9,464 | ) | 13,281 | ||||||||||||||||
Income tax (expense) benefit | (9,828 | ) | — | (9,828 | ) | (6,837 | ) | — | (6,837 | ) | ||||||||||||||
Net income (loss) | 16,606 | (15,503 | ) | 1,103 | 15,908 | (9,464 | ) | 6,444 | ||||||||||||||||
Net (income) loss attributable to noncontrolling interest in Consolidated Entities | (15,503 | ) | 15,503 | — | (9,464 | ) | 9,464 | — | ||||||||||||||||
Net income (loss) attributable to CIFC Corp. | $ | 1,103 | $ | — | $ | 1,103 | $ | 6,444 | $ | — | $ | 6,444 | ||||||||||||
9
Reconciliation from GAAP to Non-GAAP Measures - Consolidated Statements of Operations (continued)(unaudited)
YTD'15 | YTD'14 | |||||||||||||||||||||||
(In thousands) (unaudited) | Consolidated GAAP | Consolidation Adjustments | Deconsolidated Non-GAAP | Consolidated GAAP | Consolidation Adjustments | Deconsolidated Non-GAAP | ||||||||||||||||||
Revenues | ||||||||||||||||||||||||
Management and incentive fees | $ | 3,299 | $ | 39,350 | $ | 42,649 | $ | 2,990 | $ | 40,803 | $ | 43,793 | ||||||||||||
Net investment income | 2,364 | 9,486 | 11,850 | 194 | 14,042 | 14,236 | ||||||||||||||||||
Total net revenues | 5,663 | 48,836 | 54,499 | 3,184 | 54,845 | 58,029 | ||||||||||||||||||
Expenses | ||||||||||||||||||||||||
Employee compensation and benefits | 16,034 | — | 16,034 | 14,544 | — | 14,544 | ||||||||||||||||||
Stock-based compensation | 2,668 | — | 2,668 | 881 | — | 881 | ||||||||||||||||||
Professional services | 3,722 | — | 3,722 | 1,752 | — | 1,752 | ||||||||||||||||||
General and administrative expenses | 4,813 | — | 4,813 | 4,434 | — | 4,434 | ||||||||||||||||||
Depreciation and amortization | 4,490 | — | 4,490 | 6,015 | — | 6,015 | ||||||||||||||||||
Impairment of intangible assets | 742 | — | 742 | — | — | — | ||||||||||||||||||
Total expenses | 32,469 | — | 32,469 | 27,626 | — | 27,626 | ||||||||||||||||||
Other Income (Expense) and Gain (Loss) | ||||||||||||||||||||||||
Net gain (loss) on investments | 2,225 | (2,225 | ) | — | 2,527 | (2,527 | ) | — | ||||||||||||||||
Net gain (loss) on contingent liabilities | (1,290 | ) | — | (1,290 | ) | (1,758 | ) | — | (1,758 | ) | ||||||||||||||
Corporate interest expense | (1,294 | ) | — | (1,294 | ) | (2,953 | ) | — | (2,953 | ) | ||||||||||||||
Net gain on the sale of management contracts | — | — | — | 228 | — | 228 | ||||||||||||||||||
Net other income (expense) and gain (loss) | (359 | ) | (2,225 | ) | (2,584 | ) | (1,956 | ) | (2,527 | ) | (4,483 | ) | ||||||||||||
Operating income (loss) | (27,165 | ) | 46,611 | 19,446 | (26,398 | ) | 52,318 | 25,920 | ||||||||||||||||
Net results of Consolidated Entities | 49,426 | (49,426 | ) | — | 86,128 | (86,128 | ) | — | ||||||||||||||||
Income (loss) before income taxes | 22,261 | (2,815 | ) | 19,446 | 59,730 | (33,810 | ) | 25,920 | ||||||||||||||||
Income tax (expense) benefit | (12,915 | ) | — | (12,915 | ) | (19,241 | ) | — | (19,241 | ) | ||||||||||||||
Net income (loss) | 9,346 | (2,815 | ) | 6,531 | 40,489 | (33,810 | ) | 6,679 | ||||||||||||||||
Net (income) loss attributable to noncontrolling interest in Consolidated Entities | (2,815 | ) | 2,815 | — | (33,810 | ) | 33,810 | — | ||||||||||||||||
Net income (loss) attributable to CIFC Corp. | $ | 6,531 | $ | — | $ | 6,531 | $ | 6,679 | $ | — | $ | 6,679 | ||||||||||||
10
Reconciliation from GAAP to Non-GAAP Measures - Consolidated Balance Sheets (unaudited)
June 30, 2015 | December 31, 2014 | |||||||||||||||||||||||
(In thousands) (unaudited) | GAAP | Consolidation Adjustments | Deconsolidated Non-GAAP | GAAP | Consolidation Adjustments | Deconsolidated Non-GAAP | ||||||||||||||||||
Assets | ||||||||||||||||||||||||
Cash and cash equivalents | $ | 28,369 | $ | — | $ | 28,369 | $ | 59,290 | $ | — | $ | 59,290 | ||||||||||||
Restricted cash and cash equivalents | 1,694 | — | 1,694 | 1,694 | — | 1,694 | ||||||||||||||||||
Due from brokers | 63 | — | 63 | 1 | — | 1 | ||||||||||||||||||
Investments | 47,968 | 103,226 | 151,194 | 38,699 | 62,550 | 101,249 | ||||||||||||||||||
Receivables | 5,015 | 5,087 | 10,102 | 2,134 | 4,346 | 6,480 | ||||||||||||||||||
Prepaid and other assets | 4,076 | — | 4,076 | 4,115 | — | 4,115 | ||||||||||||||||||
Deferred tax asset, net | 48,050 | — | 48,050 | 55,475 | — | 55,475 | ||||||||||||||||||
Equipment and improvements, net | 5,131 | — | 5,131 | 5,194 | — | 5,194 | ||||||||||||||||||
Intangible assets, net | 10,524 | — | 10,524 | 15,074 | — | 15,074 | ||||||||||||||||||
Goodwill | 76,000 | — | 76,000 | 76,000 | — | 76,000 | ||||||||||||||||||
Subtotal | 226,890 | 108,313 | 335,203 | 257,676 | 66,896 | 324,572 | ||||||||||||||||||
Total assets of Consolidated Entities | 13,478,988 | (13,478,988 | ) | — | 12,890,459 | (12,890,459 | ) | — | ||||||||||||||||
Total Assets | $ | 13,705,878 | $ | (13,370,675 | ) | $ | 335,203 | $ | 13,148,135 | $ | (12,823,563 | ) | $ | 324,572 | ||||||||||
Liabilities | ||||||||||||||||||||||||
Due to brokers | $ | 13,308 | $ | — | $ | 13,308 | $ | — | $ | — | $ | — | ||||||||||||
Accrued and other liabilities | 10,539 | — | 10,539 | 15,584 | — | 15,584 | ||||||||||||||||||
Contingent liabilities | 11,054 | — | 11,054 | 12,668 | — | 12,668 | ||||||||||||||||||
Long-term debt | 120,000 | — | 120,000 | 120,000 | — | 120,000 | ||||||||||||||||||
Subtotal | 154,901 | — | 154,901 | 148,252 | — | 148,252 | ||||||||||||||||||
Total non-recourse liabilities of Consolidated Entities | 12,957,510 | (12,957,510 | ) | — | 12,477,981 | (12,477,981 | ) | — | ||||||||||||||||
Total Liabilities | 13,112,411 | (12,957,510 | ) | 154,901 | 12,626,233 | (12,477,981 | ) | 148,252 | ||||||||||||||||
Equity | ||||||||||||||||||||||||
Common stock | 25 | — | 25 | 25 | — | 25 | ||||||||||||||||||
Treasury stock | (935 | ) | — | (935 | ) | (914 | ) | — | (914 | ) | ||||||||||||||
Additional paid-in capital | 991,436 | — | 991,436 | 988,904 | — | 988,904 | ||||||||||||||||||
Retained earnings (deficit) | (810,224 | ) | — | (810,224 | ) | (811,695 | ) | — | (811,695 | ) | ||||||||||||||
Total CIFC Corp. Stockholders' Equity | 180,302 | — | 180,302 | 176,320 | — | 176,320 | ||||||||||||||||||
Noncontrolling interest in Consolidated Funds | 287,494 | (287,494 | ) | — | 210,818 | (210,818 | ) | — | ||||||||||||||||
Appropriated retained earnings (deficit) of Consolidated Entities | 125,671 | (125,671 | ) | — | 134,764 | (134,764 | ) | — | ||||||||||||||||
Total Equity | 593,467 | (413,165 | ) | 180,302 | 521,902 | (345,582 | ) | 176,320 | ||||||||||||||||
Total Liabilities and Stockholders' Equity | $ | 13,705,878 | $ | (13,370,675 | ) | $ | 335,203 | $ | 13,148,135 | $ | (12,823,563 | ) | $ | 324,572 | ||||||||||
11