Attached files
| file | filename |
|---|---|
| 8-K - 8-K - Bristow Group Inc | d87567d8k.htm |
 August
7, 2015 First quarter FY16 earnings presentation
Bristow Group Inc. Exhibit 99.1 |
 2 First quarter FY16 earnings call agenda Introduction CEO remarks and safety review Operational highlights Current and future financial performance Closing remarks Questions and answers Linda McNeill, Director Investor Relations Jonathan Baliff, President and CEO Jeremy Akel, SVP and COO John Briscoe, SVP and CFO Jonathan Baliff, President and CEO |
 3 Forward-looking statements Statements contained in this news release that state the Company’s or management’s intentions, hopes, beliefs,
expectations or predictions of the future are forward-looking statements.
These forward-looking statements include statements regarding
earnings guidance and earnings growth, expected contract revenue, capital
deployment strategy, operational and capital performance, impact of new contracts and
cost reduction initiative, shareholder return, liquidity, market and
industry conditions. It is important to note that the Company’s actual
results could differ materially from those projected in such forward-looking
statements. Risks and uncertainties include, without
limitation: fluctuations in the demand for our services; fluctuations in worldwide prices of and supply and demand for oil and natural gas; fluctuations in levels of oil and natural gas production, exploration and
development activities; the impact of competition; actions by clients; the risk of
reductions in spending on helicopter services by governmental agencies;
changes in tax and other laws and regulations; changes in foreign
exchange rates and controls; risks associated with international operations; operating
risks inherent in our business, including the possibility of declining
safety performance; general economic conditions including the capital and
credit markets; our ability to obtain financing; the risk of grounding of segments of our fleet for extended periods of time or indefinitely; our ability to re-deploy our aircraft to regions with greater demand; our
ability to acquire additional aircraft and dispose of older aircraft through sales into
the aftermarket; the possibility that we do not achieve the anticipated
benefit of our fleet investment and Operational Excellence programs;
availability of employees with the necessary skills; and political instability, war or
acts of terrorism in any of the countries in which we operate. Additional
information concerning factors that could cause actual results to differ
materially from those in the forward-looking statements is contained from time to
time in the Company’s SEC filings,
including but not limited to the Company’s quarterly report on Form 10-Q for the quarter ended June 30, 2015 and annual report on Form 10-K for the fiscal year ended March 31, 2015. Bristow Group Inc. disclaims any
intention or obligation to revise any forward-looking statements, including
financial estimates, whether as a result of new information, future
events or otherwise. |
 CEO
remarks and safety review Jonathan Baliff, President and CEO
|
 5 0.53 0.53 0.96 FY11 FY12 FY13 FY14 FY15 Q1 FY16 Q1 FY16 operational safety review Total Recordable Injury Rate 2 (TRIR) per 200,000 man hours (cumulative) Air Accident Rate 1 (AAR) per 100,000 flight hours (fiscal year) 0 0 • Continued Target Zero air safety for over two years through Q1 FY16 • Q1 FY16 Total Recordable Injury Rate of 0.26 • Increased investment in tools and talent to proactively manage risk 0 0.42 0.27 0.31 0.26 0.23 0.26 FY11 FY12 FY13 FY14 FY15 Q1 FY16 1) AAR includes commercial operations for Bristow Group and consolidated affiliates, Eastern Airways and Airnorth
2) TRIR beginning in FY15 includes consolidated commercial operations, corporate, Bristow Academy, Eastern Airways, and Airnorth employees |
 6 Bristow is proactively repositioning for a longer downturn • Industry-wide overcapacity continues with fundamental changes occurring in the North Sea as clients aggressively rebase cost structures • Our initial cost management ($75 to $95 million reduction announced previously) has been largely successful but assumed a 12-24 month downturn with recovery in calendar 2016 • An economic restructuring is being implemented for a minimum of $60 million in additional annualized cost savings (~$25 million in FY16), assuming a 36 month downturn with recovery in late calendar 2017 • We expect improving cash generation in FY17 and FY18, due to U.K. SAR being fully operational with significant capex declines |
 Bristow
has substantial advantages to enhance our competitiveness in an extended
downturn •
Modern fleet (average age of ~9 years), allows for deferral of new
aircraft deliveries reducing capex needs without compromising safety or client service • Strong balance sheet gives us full access to capital markets to capitalize on organic and M&A opportunities • Our mostly owned fleet gives us critical optionality to sell aircraft or decline lease renewal options and return leased aircraft 7 |
 Operational highlights Jeremy Akel, SVP and COO |
 9 Challenging market will continue; recent new tender win and contract extension while awaiting results of other tenders in our most uncertain market Benefits from startup of U.K. SAR in April 2015 FY16 expected adjusted EBITDAR margin for Europe Caspian lowered to ~ mid to high thirties
Europe Caspian United Kingdom United Kingdom Norway Norway Turkmenistan Turkmenistan Operating revenue and adjusted EBITDAR margin Falkland Islands Falkland Islands |
 10 U.K. SAR update • U.K. SAR start up continues as Caernarfon began operations July 1, 2015 with additional bases starting up during the remainder of the fiscal year • Operations are meeting contractual availability thresholds and financial performance is
in line with expectations
• More than half of the U.K. SAR capital commitments are spent and trending favorably
against our original estimates
*Total capital is the spend estimate as originally disclosed in April
2013 $ in millions
Total capital* % spent through Q1 FY16 Aircraft $645 73% Ground infrastructure and equipment 125 42% Capitalized pre-op cost 195 26% Total $965 59% $ in millions GAP SAR UK SAR Total Operating revenue $11.4 $17.2 $28.6 Adjusted EBITDAR 5.9 8.6 14.4 LACE (on contract) 4 4 8 LACE rate $11.4 $17.2 $14.3 Total UK SAR - Q1 FY16 |
 11 Africa Market uncertainty continues and smaller clients are under pressure as activity declines Cost cutting measures were implemented ahead of the activity reduction with additional efficiencies expected FY16 expected adjusted EBITDAR margin for Africa lowered to ~ low thirties Nigeria Nigeria Egypt Egypt Tanzania Tanzania Operating revenue and adjusted EBITDAR margin |
 12 GoM small and medium aircraft activity decline partially offset by large aircraft demand Americas FY16 adjusted EBITDAR margin expected to remain ~ mid thirties Americas United States United States Canada Canada Brazil Brazil Trinidad Trinidad Operating revenue and adjusted EBITDAR margin |
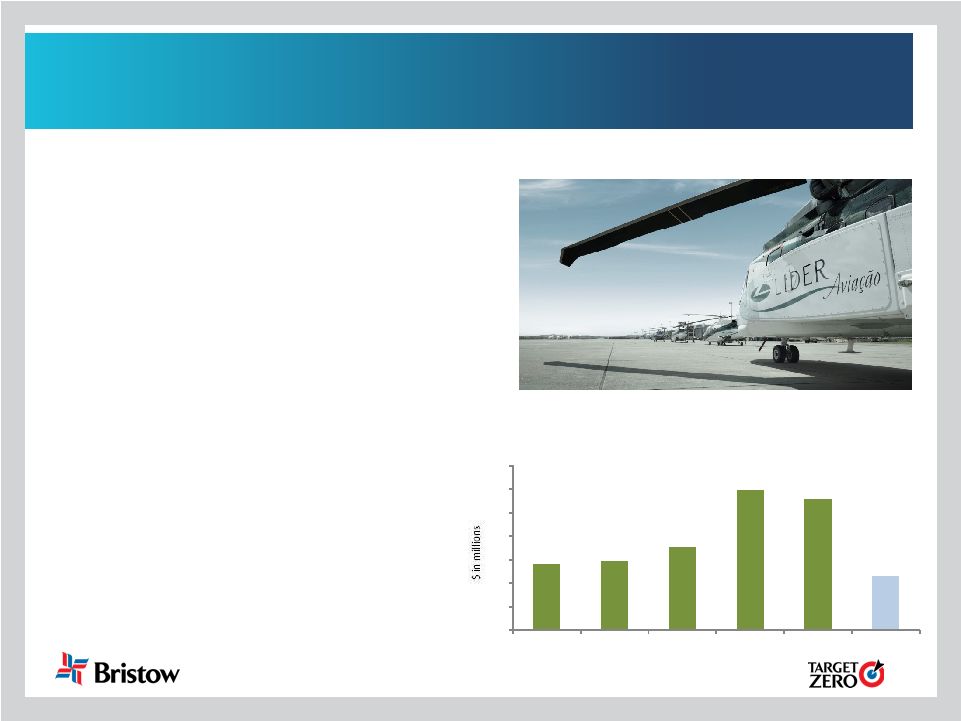 13 56.0 59.1 70.5 119.3 111.3 46.3 0 20 40 60 80 100 120 140 CY10 CY11 CY12 CY13 CY14 YTD Q2 CY15 Líder * Reconciliation of adjusted EBITDAR, leverage and BVA provided in the appendix • Absolute BVA contribution to Bristow from Líder was $3.9M* in Q1 FY16 • Adjusted debt to TTM adjusted EBITDAR increased to 3.9x as of June 30, 2015 from 3.3x as of March 31, 2015 • Current market activity is down but tempered in part by management’s aggressive cost cutting • Awaiting remainder of awards from Petrobras Líder adjusted EBITDAR* |
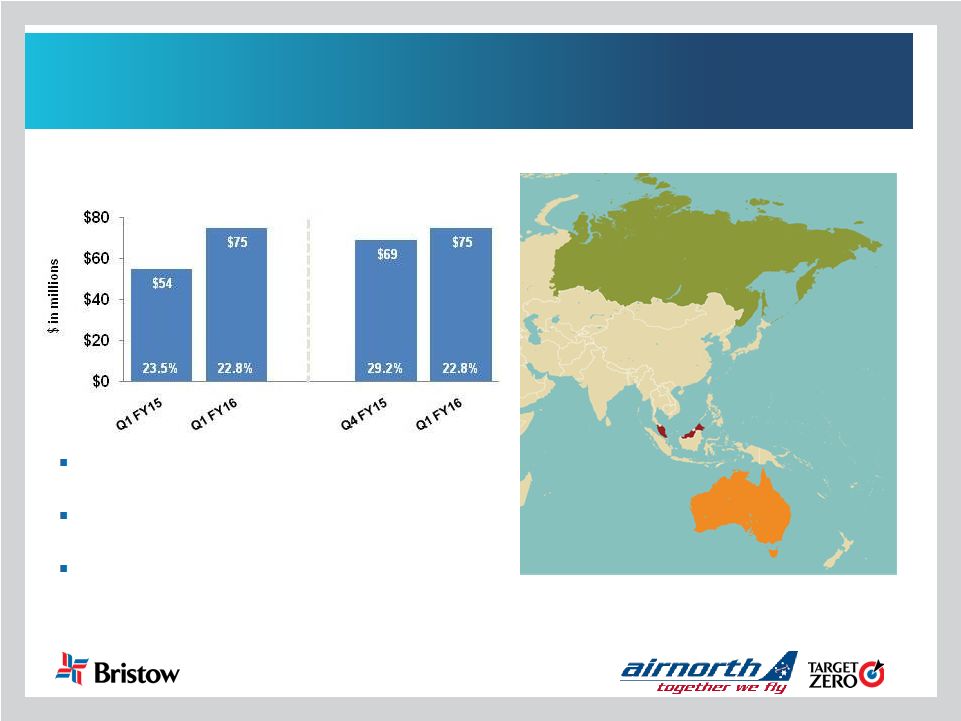 14 Asia Pacific Incremental short term wins; expansion into new countries Clients are proceeding with existing project developments FY16 expected adjusted EBITDAR margin for Asia Pacific expected to remain ~ mid twenties
Russia Russia Australia Australia Malaysia Malaysia Operating revenue and adjusted EBITDAR margin |
 Current
financial performance and guidance for the future
John Briscoe, SVP and CFO |
 16 Q1 FY16 highlights • U.K. SAR execution led to increased revenue and partially offset margin declines in oil and gas both sequentially and over prior year • Adjusted EBITDAR margins down due to lower activity levels and decreased utilization in oil and gas • Adjusted EPS of $0.56, compared to $1.32 in the comparable quarter • Continued commitment to return capital to shareholders with dividend declaration of $0.34 per share * Adjusted EBITDAR amounts exclude gains and losses on dispositions of assets and any special items during the period. See reconciliation of
these items to GAAP measures in the appendix hereto and in our earnings
release for the quarter and fiscal year ended June 30, 2015. ** Bristow
Value Added (BVA) is calculated by taking gross cash flow less the product of gross operating assets times a capital charge of 10.5%. Example calculation can be found in the appendix hereto. Operating revenue and adjusted EBITDAR margin |
 17 $1.32 $0.56 $0.56 $0.19 $0.01 Q1 FY15 Operations Corporate and Other FX Changes Q1 FY16 Financial highlights: Adjusted EBITDAR and adjusted EPS summary year-over-year Q1 FY15 to Q1 FY16 adjusted EPS bridge $127.6 $121.0 $3.6 $2.5 $0.5 Q1 FY15 Operations Corporate and Other FX Changes Q1 FY16 Q1 FY15 to Q1 FY16 adjusted EBITDAR bridge (in millions) Note: Adjusted EPS and adjusted EBITDAR amounts exclude gains and losses on dispositions of assets and any special items during the period. See
reconciliation of these items to GAAP in our earnings release for the
quarter ended June 30, 2015. |
 18 LACE and LACE rate FY16 average LACE guidance range lowered to 165-175 and average LACE rate guidance range reaffirmed at $8.00 - $9.00 million *See appendix hereto for more information on LACE and LACE rate. Consolidated commercial aircraft, LACE and LACE rate exclude Bristow Academy,
affiliate aircraft, fixed wing aircraft, aircraft held for sale, aircraft
construction in progress and reimbursable revenue. 264
261
241 242 234 149 158 158 166 164 - 50 100 150 200 250 300 FY12 FY13 FY14 FY15 Q1 FY16 Consolidated commercial aircraft Large Aircraft equivalent (LACE)* 149 158 158 166 164 $7.89 $8.35 $9.34 $9.33 $9.25 $- $2 $4 $6 $8 $10 $12 140 150 160 170 180 FY12 FY13 FY14 FY15 Q1 FY16 LACE* LACE Rate* ($ in millions) |
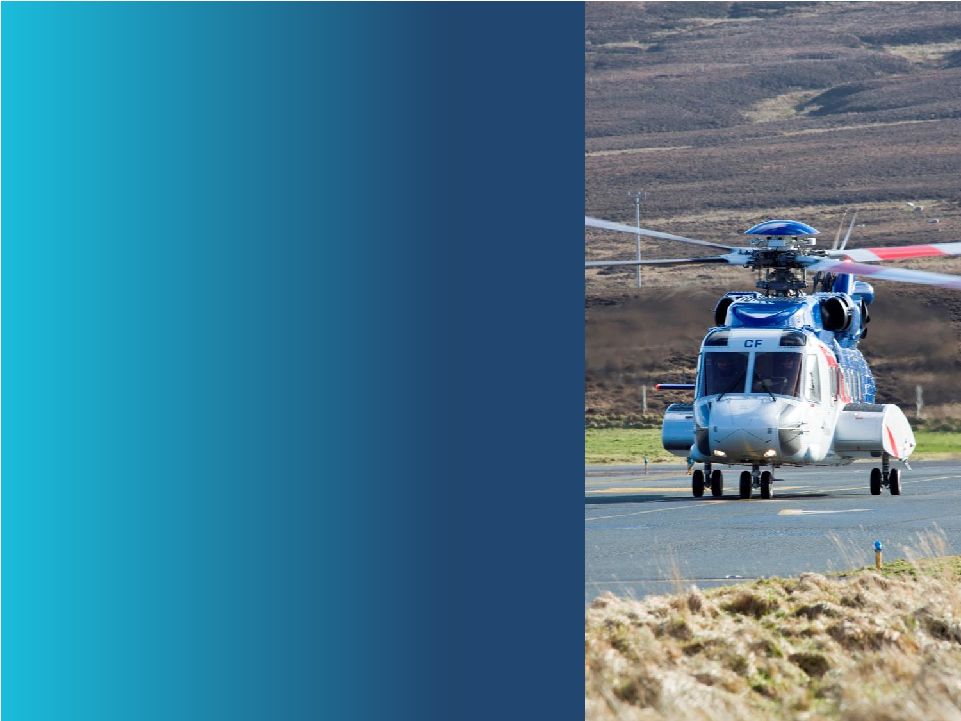
 19 24.5 26.1 19.7 29.3 9.7 13.0% 13.1% 13.2% 13.2% 12.8% 0.0% 2.0% 4.0% 6.0% 8.0% 10.0% 12.0% 14.0% - 10.0 20.0 30.0 40.0 50.0 60.0 70.0 Q1 FY15 Q2 FY15 Q3 FY15 Q4 FY15 Q1 FY16 Bristow Value Added (BVA) drives Gross Cash Flow (GCF) performance • Q1 FY16 absolute BVA is positive $9.7 million; 16 consecutive quarters of positive
BVA generation • Year-over-year decline in BVA is driven by: Decrease in activity levels Oil and gas margin declines, especially in the North Sea Notes: BVA is computed by subtracting a capital charge (10.5%) for the use of gross invested capital from after tax operating cash flow.
GCF Return % is based on trailing twelve months after tax operating cash
flows (Gross Cash Flow) over average quarterly gross invested capital (Gross Operating Assets). Refer to the appendix for additional details. |
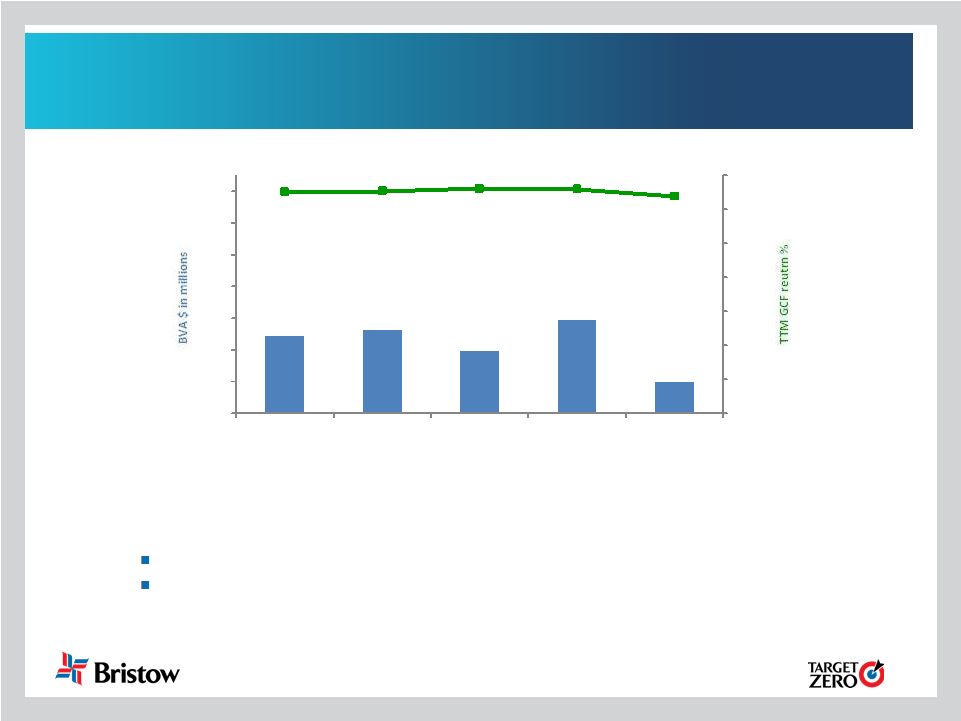
 20 26 53 55 36 37 16 126 178 211 196 216 0 50 100 150 200 250 300 FY11 FY12 FY13 FY14 FY15 Q1 FY16 Comparable Q1 Remainder 140 199 326 266 245 262 216 204 104 120 - 100 200 300 400 500 600 FY12 FY13 FY14 FY15 Q1 FY16 Undrawn borrowing capacity Cash Cash flow and liquidity Net cash provided by operating activities 1 Total liquidity 2 1) See 10-Q for more information on cash flow provided by operating activities.
2) At period end 402 415 530 370 365 152 231 266 232 253 |
 21 FY16 guidance revised FY16 adjusted EPS guidance range is lowered to $3.10 - $3.75, excluding special items and aircraft sales. FY16 guidance includes: * Assuming FY16 revenue earned in same regions and same mix as in FY15. FY16 guidance as of June 30, 2015 Average LACE count ~ 165-175 Interest expense ~ $25 - $35M Average LACE rate ~ $8.00 – $9.00M Rent expense (aircraft only) ~ $185 - $195 M G&A expense (all inclusive) ~ $220 - $240M Tax rate* ~ 21 – 24% Depreciation expense ~ $110 - $130M Adj. EPS $3.10 - $3.75 |
 22 Bristow is committed to maintaining our financial strength and strategic flexibility in this downturn • Safety is and will remain our number one priority, as we build on two consecutive years of Target Zero air safety and continue to proactively engage with the industry through HeliOffshore • The oil and gas offshore aviation market will remain challenging as project sanctioning is delayed with helicopter overcapacity in FY16 / FY17 • Bristow will achieve additional cost base reductions to enhance competitiveness and remain financially strong in this downturn • We anticipate an improved outlook for FY17, as we realize the full benefit from: U.K. SAR, reduced capex and improved cash flow from our modern fleet |
 Appendix |
 24 New organizational chart - as of June 30, 2015 Business Unit (% of Q1 FY16 operating revenue) Corporate Region ( # of aircraft ) Joint Venture (# of aircraft) Key Operated Aircraft Bristow owned and/or operated 365 aircraft as of June 30, 2015 Affiliated Aircraft Bristow affiliates and joint ventures operated 128 aircraft as of June 30, 2015 * Includes corporate and other Bristow Europe Caspian 46% Africa 18% Americas 18% Asia Pacific 17% BRS Academy 1%* U.K. – 84 Norway – 22 Nigeria – 53 U.S. GoM – 51 Canada – 8 Australia – 39 Brazil – 8 Egypt – 0 Russia – 7 Tanzania – 3 Trinidad – 10 Turkmenistan – 1 Florida – 54 Louisiana – 13 U.K. – 3 Lider – 85 PAS – 43 Suriname – 2 Falklands – 3 Other – 2 Other – 2 |
 25 Aircraft fleet – medium and large as of June 30, 2015 Next Generation Aircraft Mature Aircraft Fair market value of our owned fleet is ~$2.0 billion and leased fleet is ~$1.7 billion
Medium capacity 12-15 passengers
Large capacity 16-25 passengers
Type Capacity Engine Cons Unconsl Total Large Helicopters AS332 L Super Puma 18 Twin Turbine 4 - 4 AW189 16 Twin Turbine 5 - 5 H175 16 Twin Turbine - - - H225 19 Twin Turbine 26 - 26 Mil Mi 8 20 Twin Turbine 7 - 7 Sikorsky S-61 25 Twin Turbine 2 - 2 Sikorsky S-92 19 Twin Turbine 71 9 80 115 9 124 LACE 111 Medium Helicopters AW139 12 Twin Turbine 27 2 29 Bell 212 12 Twin Turbine - 14 14 Bell 412 13 Twin Turbine 20 18 38 H155 13 Twin Turbine 1 - 1 Sikorsky S-76A/A++ 12 Twin Turbine - 5 5 Sikorsky S-76C/C++ 12 Twin Turbine 51 34 85 Sikorsky S-76D 12 Twin Turbine - - - 99 73 172 LACE 44 |
 26 Aircraft fleet – small, training and fixed as of June 30, 2015 (continued) Mature Aircraft * LACE does not include held for sale, training helicopters and fixed wing Next Generation Aircraft Small capacity 4-7 passengers Training capacity 2-6 passengers Type Capacity Engine Cons Unconsl Total Small Helicopters AS 350BB 4 Turbine - 2 2 Bell 206B 4 Turbine 1 2 3 Bell 206 L Series 6 Turbine 5 6 11 Bell 407 6 Turbine 27 - 27 BK-117 7 Twin Turbine 2 - 2 H135 6 Twin Turbine - 3 3 35 13 48 LACE 9 Training Helicopters AW109 6 Twin Turbine 2 - 2 AS 355 5 Twin turbine 1 - 1 Bell 206B 4 Turbine 12 - 12 Robinson R22 2 Piston 6 - 6 Robinson R44 4 Piston 7 - 7 Sikorsky 300CB/CBi 2 Piston 41 - 41 Fixed Wing 1 - 1 70 - 70 Fixed Wing 46 33 79 Total 365 128 493 TOTAL LACE (Large Aircraft Equivalent)* 164 |
 27 Small Medium Large Total Leased LACE Total LACE % Leased Europe Caspian - 5 38 43 41 74 55% Africa - 1 1 2 2 22 7% Americas 1 13 5 19 12 42 28% Asia Pacific 2 2 8 12 10 27 35% Total 3 21 52 76 63 164 39% Operating lease strategy: lowering the cost and
amount of capital needed to grow
• Of the 120 aircraft currently leased in our fleet, 76 are commercial (63 LACE), 27 are training and 17 fixed wing • 63 LACE aircraft represent approximately 39% of our commercial fleet • Our goal is for commercial fleet operating leases to account for approximately 35% of our LACE Leased aircraft as of June 30, 2015 * The percentage of LACE leased is calculated by taking the total LACE for leased aircraft divided by the total LACE for all aircraft we operate,
including both owned and leased aircraft. See 10-Q Note
5 “Commitments and Contingencies” for more information provided
on operating leases. *
|
 28 Q1 FY16 Fleet Count Beginning 371 Delivered Large 1 Medium 1 Total Delivered 2 Removed Sales (6) Other* (2) Total Removed (8) 365 * Includes writeoffs, lease returns and commencements Fleet changes Consolidated fleet changes and aircraft sales for Q1 FY16 See 10-Q Note 5 “Commitments and Contingencies” for more information provided on operating leases.
# of aircraft sold Cash received* Q1 FY16 9 9.3 $ Total 9 9.3 $ * Amounts stated in millions |
 29 Held for sale and leased fleet by region as of Q1 2016 Small Medium Large Training Fixed wing Total Europe Caspian - 5 38 - 11 54 Africa - 1 1 - 2 4 Americas 1 13 5 - - 19 Asia Pacific 2 2 8 - 4 16 Academy - - - 27 - 27 Total 3 21 52 27 17 120 Leased aircraft in consolidated fleet Small Medium Large Training Total Europe Caspian - - 2 - 2 Africa - 5 - - 5 Americas - 6 - - 6 Asia Pacific - - 2 - 2 Academy - - - - - Total - 11 4 - 15 Held for sale aircraft in consolidated fleet See 10-Q Note 5 “Commitments and Contingencies” for more information provided on operating leases. |
 30 FY16 op revenue 1 LACE LACE Rate 2,3,4 Europe Caspian $169 74 $9.16 Africa 77 22 14.42 Americas 76 41 7.41 Asia Pacific 53 27 7.91 Total $379 4 164 $9.25 as of June 30, 2015 Operating revenue, LACE, and LACE rate by region Operating revenue, LACE and LACE rate by region 1) $ in millions 2) LACE rate is annualized 3) $ in millions per LACE 4) Excludes Bristow Academy, Airnorth and Eastern Airways |
 31 Historical LACE by region Q1 Q2 Q3 Q4 Q1 Q2 Q3 Q4 Q1 Q2 Q3 Q4 Europe Caspian 48 46 52 56 58 60 60 57 62 68 70 72 Africa 23 23 21 21 21 22 23 24 24 24 22 21 Americas 48 46 53 52 51 48 48 47 47 45 46 45 Asia Pacific 29 28 28 30 30 30 34 30 31 29 31 29 Consolidated 147 142 154 158 161 160 165 158 163 166 168 166 FY16 Q1 Europe Caspian 74 Africa 22 Americas 41 Asia Pacific 27 Consolidated 164 LACE FY13 FY14 FY15 LACE |
 32 Historical LACE rate by region 1) $ in millions 2) LACE rate is annualized Q1 Q2 Q3 Q4 Q1 Q2 Q3 Q4 Q1 Q2 Q3 Q4 Europe Caspian $10.49 $10.94 $9.69 $9.10 $9.59 $9.92 $10.27 $10.82 $10.55 $9.74 $9.37 $8.95 Africa 11.54 11.70 13.06 13.28 14.26 13.95 13.25 13.34 14.10 14.11 15.86 15.81 Americas 6.10 6.38 5.82 6.06 6.37 7.31 7.14 7.26 7.38 7.58 7.54 7.72 Asia Pacific 6.91 7.49 7.64 7.23 7.37 6.48 5.50 6.42 7.14 7.55 7.36 7.93 Consolidated $8.55 $8.95 $8.49 $8.35 $8.78 $9.07 $8.97 $9.34 $9.55 $9.43 $9.33 $9.33 FY16 Q1 Europe Caspian $9.16 Africa 14.42 Americas 7.41 Asia Pacific 7.91 Consolidated $9.25 LACE Rate 1,2 FY13 FY14 FY15 LACE Rate 1,2 |
 33 Order and options book as of June 30, 2015 1) 17 large aircraft on order are subject to the successful development and certification of the aircraft
2) SAR configured # Helicopter Delivery Date 1 Large September-16 2 Large December-16 1 Medium December-16 2 Large March-17 1 Medium March-17 2 Large June-17 1 Medium June-17 2 Large September-17 1 Medium September-17 3 Large December-17 3 Medium December-17 2 Medium March-18 21 OPTIONS BOOK # Class Delivery Date Location Contracted 4 Large December-15 Europe Caspian 4 of 4 4 Large December-16 Europe Caspian 4 of 4 8 8 of 8 U.K. SAR CONFIGURED ORDER BOOK # Helicopter Class Delivery Date Location Contracted 1 Large September-15 Americas 1 of 1 1 Large September-15 Europe Caspian 2 4 Medium September-15 Africa 2 Large December-15 Europe Caspian 2 1 Large December-15 Europe Caspian 1 Large December-15 Asia Pacific 1 of 1 1 Large December-15 Asia Pacific 1 of 1 4 Medium December-15 Africa 2 Medium March-16 Africa 1 Large June-16 Europe Caspian 1 Large September-16 Europe Caspian 3 Large December-16 TBD 1 Large March-17 TBD 2 Large June-17 TBD 1 Large June-17 Europe Caspian 1 Large September-17 TBD 1 Large September-17 Europe Caspian 2 Large December-17 TBD 1 Large March-18 TBD 1 Large June-18 TBD 1 Large September-18 TBD 1 Large December-18 TBD 1 Large March-19 TBD 1 Large June-19 TBD 1 Large September-19 TBD 1 Large December-19 TBD 38 3 of 38 ORDER BOOK 1 2 |
 34 Total net asset FMV with and without leased aircraft FMV NOTE: The gray shaded area represents the range of FMV with and without the impact of leased aircraft (upper range includes leased aircraft and
related NPV of lease payments; lower range excludes FMV of leased
aircraft as well as the NPV of lease payments). |
 35 Net asset FMV reconciliation as of June 30, 2015 (in millions) Including leases Excluding leases (+) FMV of aircraft $1,967 $1,967 (+) FMV of leased aircraft $1,712 - (+) NBV of PPE without aircraft
$413 413 (+) Working capital
$257 257 (-) LT debt ($918) (918) (-) Leased imputed debt
($644) - (-) Pension liability
($102) (102) Net asset FMV $2,684 $1,616 # of common shares 35.2 35.2 Net asset FMV per share
$76.24 $45.92 June 30, 2015 |
 36 Adjusted EBITDAR margin* trend by region * Adjusted EBITDAR excludes special items and asset dispositions and margin is calculated by taking adjusted EBITDAR divided by operating
revenue Q1
Q2 Q3 Q4 Q1 Q2 Q3 Q4 Europe Caspian 32.0% 34.4% 39.2% 35.8% 35.4% 30.4% 35.3% 35.6% 37.8% 35.0% Africa 31.5% 26.5% 35.0% 32.0% 31.4% 34.1% 30.1% 31.7% 36.6% 33.3% Americas 28.5% 28.3% 38.0% 40.0% 33.9% 42.5% 35.7% 37.4% 38.4% 38.1% Asia Pacific 34.1% 36.6% 34.2% 28.7% 33.3% 25.0% 23.3% 17.4% 28.3% 23.8% Consolidated 26.3% 26.1% 31.5% 29.4% 28.3% 28.5% 28.7% 27.0% 30.4% 28.6% FY16 Q1 Q2 Q3 Q4 Q1 Europe Caspian 34.1% 33.5% 32.8% 30.9% 32.9% 32.0% Africa 25.9% 30.7% 34.5% 48.6% 34.7% 29.4% Americas 44.7% 31.5% 37.6% 40.8% 38.7% 41.8% Asia Pacific 23.5% 22.7% 24.5% 29.2% 25.2% 22.8% Consolidated 29.2% 25.4% 25.3% 30.2% 27.4% 27.5% FY13 FY15 FY14 |
 37 Adjusted EBITDAR* reconciliation * Adjusted EBITDAR excludes special items and asset dispositions ($ in millions) Q1 Q2 Q3 Q4 FY13 Q1 Q2 Q3 Q4 FY14 Net income $24 $30 $37 $40 $132 $27 $110 $19 $32 $188 Income tax expense $6 $8 $8 $13 $35 $8 $41 $3 $6 $57 Interest expense $9 $9 $15 $10 $42 $20 $9 $7 $8 $45 Gain on disposal of assets $5 $1 -$7 -$7 -$8 $2 $3 -$4 $0 $1 Depreciation and amortization $21 $23 $25 $27 $96 $23 $24 $24 $26 $96 Special items $2 -$2 $15 $2 $16 $0 -$102 $24 $20 -$59 Adjusted EBITDA Subtotal $68 $70 $92 $85 $314 $79 $85 $72 $92 $328 Rental expense $16 $15 $18 $18 $67 $23 $23 $28 $31 $106 Adjusted EBITDAR $84 $85 $109 $103 $381 $102 $109 $101 $123 $434 3/31/2016 ($ in millions) Q1 Q2 Q3 Q4 FY15 Q1 Net income $45 $28 $0 $16 $89 -$2 Income tax expense $12 $6 $1 $4 $23 $3 Interest expense $7 $8 $7 $8 $30 $8 Gain on disposal of assets -$1 $0 $26 $10 $36 $8 Depreciation and amortization $25 $28 $24 $37 $114 $37 Special items $6 $7 $5 $1 $17 $13 Adjusted EBITDA Subtotal $95 $77 $63 $75 $309 $67 Rental expense $33 $35 $46 $50 $165 $54 Adjusted EBITDAR $128 $112 $109 $125 $474 $121 Fiscal year ended, 3/31/2013 3/31/2014 3/31/2015 Fiscal year ended, |
 38 Bristow Value Added (BVA) Sample calculation for Q1 FY16 and Q1 FY15 Bristow Value Added = Gross Cash Flow – (Gross Operating Assets X Capital Charge) BVA = GCF – (GOA x 10.5%**) Bristow Value Added calculation for Q1 FY16 $9.7 = $110.6* – ($3,841* x 2.625%**) Bristow Value Added calculation for Q1 FY15 $24.5 = $121.1* – ($3,683* x 2.625%**) *Reconciliation for these items follows right after this slide **Quarterly capital charge of 2.625% is based on annual capital charge of 10.5% |
 39 Bristow gross cash flow reconciliation (in millions) Gross cash flow reconciliation Q1 FY15 Q1 FY16 Net income 44 $ (3) $ Depreciation and amortization 25 37 Interest expense 7 8 Loss on extinguishment of debt 0 Interest income (0) (0) Rent 33 54 Other income/expense-net 1 (4) Gain/loss on asset sale (1) 8 Special items
5 13 Tax effect from special items (1) (7) Earnings (losses) from unconsolidated affiliates, net (4) (6) Non-controlling interests 1 2 Gross cash flow before Líder
$111 $101 Gross cash flow - Líder proportional 11 9 Gross cash flow after Líder $121 $111 |
 40 Bristow adjusted gross operating assets reconciliation (in millions) Adjusted gross operating assets reconciliation Q1 FY15 Q1 FY16 Total assets 3,541 $ 3,243 $ Accumulated depreciation 536 507 Capitalized operating leases
423 674 Cash and cash equivalents
(134) (120) Investment in unconsolidated entities (266) (223) Goodwill (58) (78) Intangibles (18) (18) Assets held for sale: net
(30) (39) Assets held for sale: gross
74 98 Adj. for gains & losses on assets sales
(12) 98 Accounts payable
(102) (98) Accrued maintenance and repairs
(18) (31) Other accrued taxes
(8) (12) Accrued wages, benefits and related taxes
(68) (76) Other accrued liabilities
(222) (79) Income taxes payable
(0) (6) Deferred revenue
(30) (33) ST deferred taxes
(14) (4) LT deferred taxes
(179) (169) Adjusted gross operating assets before Líder $3,414 3,630 $ Adjusted gross operating assets - Líder proportional 269 211 Adjusted gross operating assets after Líder
$3,683 3,841 $ |
 41 Líder Bristow Value Added (BVA) Sample calculation for Q1 FY16 and Q1 FY15 Bristow Value Added = Gross Cash Flow – (Gross Operating Assets X Capital Charge) BVA = GCF – (GOA x 10.5%** ) Bristow Value Added calculation for Q1 FY16 $3.9 = $9.5* – ($211* x 2.625%**) Bristow Value Added calculation for Q1 FY15 $3.6 = $10.7* – ($269* x 2.625%**) *Reconciliation for these items follows right after this slide **Quarterly capital charge of 2.625% is based on annual capital charge of 10.5% |
 42 Líder gross cash flow reconciliation ($ in millions) Gross cash flow reconciliation Q1 FY15 Q1 FY16 Net income (loss) $13 ($7) Depreciation and amortization 3 3 Rent 7 6 Interest expense
4 3 Interest income
(1) (1) FX (gains) losses
1 27 Other income/expense-net
(0) (16) Special Adjustment- remove Lider tax per income stmt.
2 7 Earnings (losses) from unconsolidated affiliates, net
- - Non-controlling Interests
(1) 1 Gross cash flow
28 23 Special item outside of Líder - add Bristow tax calc.
(3) 0 Gross cash flow
25 23 Líder proportional consolidation - GCF
$11 $9 |
 43 Líder adjusted gross operating assets reconciliation ($ in millions) Adjusted gross operating assets reconciliation Q1 FY15 Q1 FY16 Total assets $623 $553 Cash and cash equivalents (76) (74) Accumulated depreciation
80 64 Capitalized operating leases
149 116 Investments & escrow deposits
(44) (44) Intangibles (6) (4) Intangibles, amortization
4 3 Other, non operating assets
(17) (38) Adj. for gains & losses on assets sales
Accounts payable
(35) (30) Other payables
(3) (3) Other accrued taxes
(6) (10) Accrued wages, benefits and related taxes
(21) (14) Income taxes payable
(4) (10) Deferred revenue
(10) (7) LT deferred taxes
- Adjusted gross operating assets
633 503 Líder proportional consolidation GOA
$265 $211 |
 44 Líder's adjusted EBITDAR* reconciliation * Adjusted EBITDAR excludes special items and asset dispositions ($ in millions) Q2 CY14 Q3 CY14 Q4 CY14 Q1 CY15 Q2 CY15 Gross revenue 113.7 116.4 100.9 80.2 82.7 (-) Revenue deductions (7.3) (7.7) (6.1) (4.5) (4.9) Net operating revenue 106.4 108.7 94.8 75.7 77.8 (-) Cost of products and services (79.5) (82.0) (72.1) (56.3) (58.6) Gross profit 26.9 26.6 22.7 19.4 19.3 (-) Selling and administrative expenses (7.5) (8.8) (9.0) (5.6) (5.7) (+) Equity income of associates 0.8 (0.6) (0.2) (0.7) 0.9 (+) Other operating income/expenses 0.2 0.2 (1.0) - 0.4 Operating result 20.4 17.5 12.5 13.1 14.9 (+) Depreciation and amortization 3.5 3.5 3.3 2.9 2.6 EBITDA 23.9 21.0 15.8 16.0 17.4 Leasing costs 7.3 7.4 6.8 5.8 7.0 Adjusted EBITDAR 31.2 28.4 22.6 21.9 24.4 |
 45 GAAP reconciliation 1) See information about special items in 10-Q or earnings release for Q1 FY16 2) These amounts are presented after applying the appropriate tax effect to each item and dividing by the weighted average shares outstanding during
the related period to calculate the earnings per share
impact 2015
2014 Adjusted operating income $36,467 $69,304 Gain (loss) on disposal of assets (7,695) 610 Special items 1 (23,938) (4,722) Operating income $4,834 $65,192 Adjusted EBITDAR $121,047 $127,623 Gain (loss) on disposal of assets (7,695) 610 Special items 1 (13,430) (5,594) Depreciation and amortization (37,146) (25,334) Rent expense (53,882) (33,116) Interest expense (7,890) (7,363) Provision for income taxes (2,633) (11,823) Net income ($1,629) $45,003 Adjusted net income $19,752 $47,369 Gain (loss) on disposal of assets 2 (5,925) 483 Special items 1,2 (17,084) (3,743) Net income (loss) attributable to Bristow Group ($3,257) $44,109 Adjusted diluted earnings per share $0.56 $1.32 Gain (loss) on disposal of assets 2 (0.17) 0.01 Special items 1,2 (0.67) (0.10) Diluted earnings (loss) per share ($0.27) $1.23 Three months ended June 30, (In thousands, except per share amounts) |
 46 Bristow leverage reconciliation *Adjusted EBITDAR excludes gains and losses on dispositions of assets Debt Investment Capital Leverage (a) (b) (c) = (a) + (b) (a) / (c) (in millions) As of June 30, 2015 945.2 $
1,613.8
$
2,559.0 $ 36.9% Adjust for: Unfunded pension liability 101.9 101.9 NPV of lease obligations @ 6% 644.5 644.5 Letters of credit 10.7 10.7 Adjusted 1,702.3 $
(d)
1,613.8 $ 3,316 $ 51.3% Calculation of debt to adjusted EBITDAR multiple TTM Adjusted EBITDAR*: Q1 FY16 467.2 $
(e)
= (d) / (e) 3.64:1 |
 47 Líder leverage reconciliation (in millions) Jun-14 Jun-15 Total book debt 290 $ 338 $ NPV of leases 59 39 Total adjusted debt
349 378 TTM adjusted EBITDAR 114 $ 97 $ Adjusted debt / TTM adj. EBITDAR 3.1x 3.9x |
 48 We are Bristow |
 49 Bristow Group Inc. (NYSE: BRS) 2103 City West Blvd., 4 th Floor Houston, Texas 77042 t 713.267.7600 f 713.267.7620 bristowgroup.com Contact us |