Attached files
| file | filename |
|---|---|
| 8-K - 8-K - OneMain Holdings, Inc. | q22015earningsrelease.htm |
Exhibit 99.1
SPRINGLEAF HOLDINGS, INC. REPORTS SECOND QUARTER 2015 RESULTS
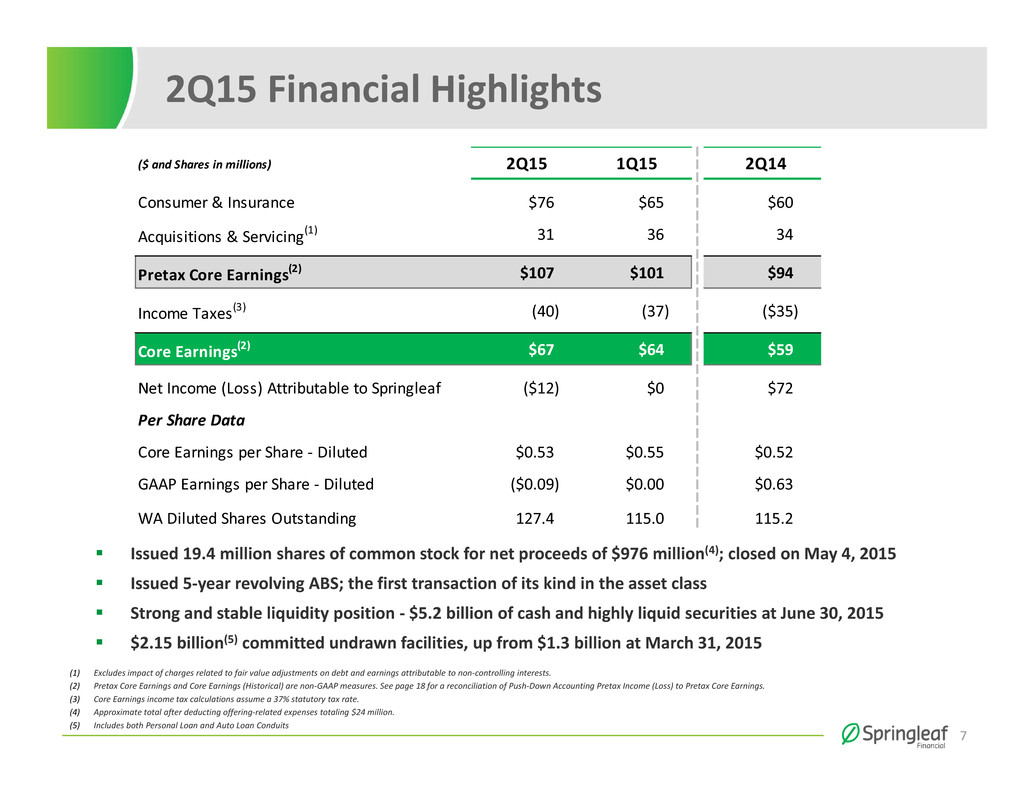
Evansville, IN, August 6, 2015 - Springleaf Holdings, Inc. (NYSE: LEAF), today reported a GAAP basis net loss of $12 million, or $0.09 per diluted share for the second quarter of 2015, compared with net income of $72 million or $0.63 per diluted share in the second quarter of 2014, which included a pretax gain of $35 million on the sale of real estate assets.
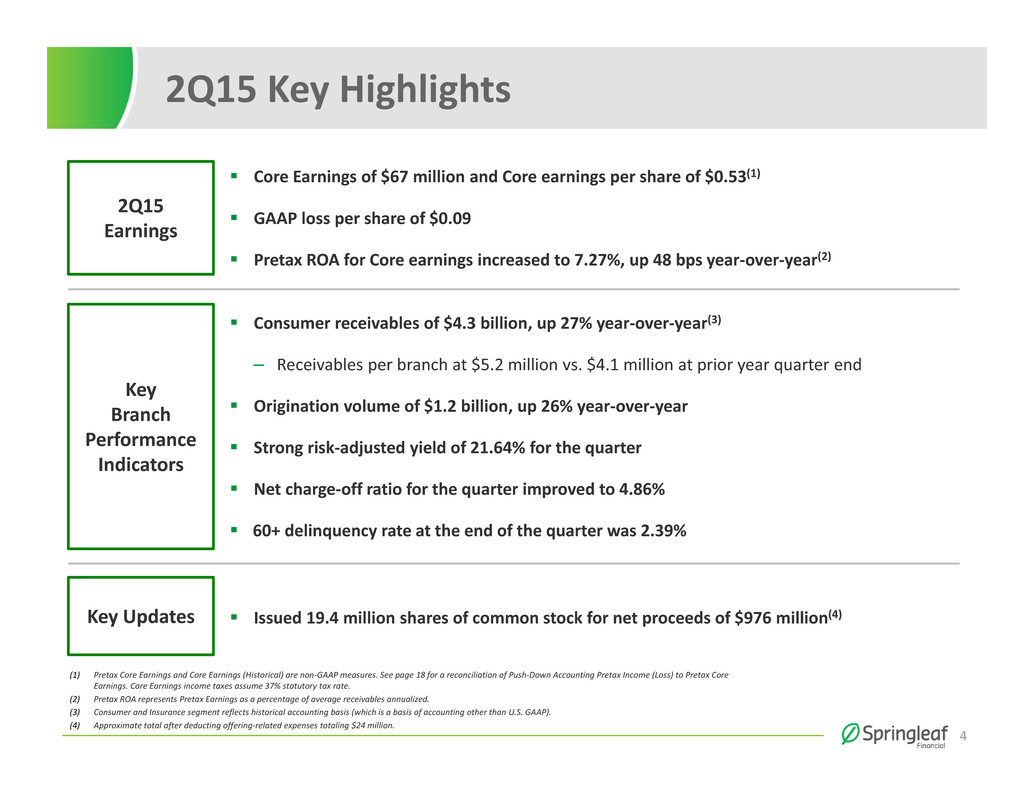
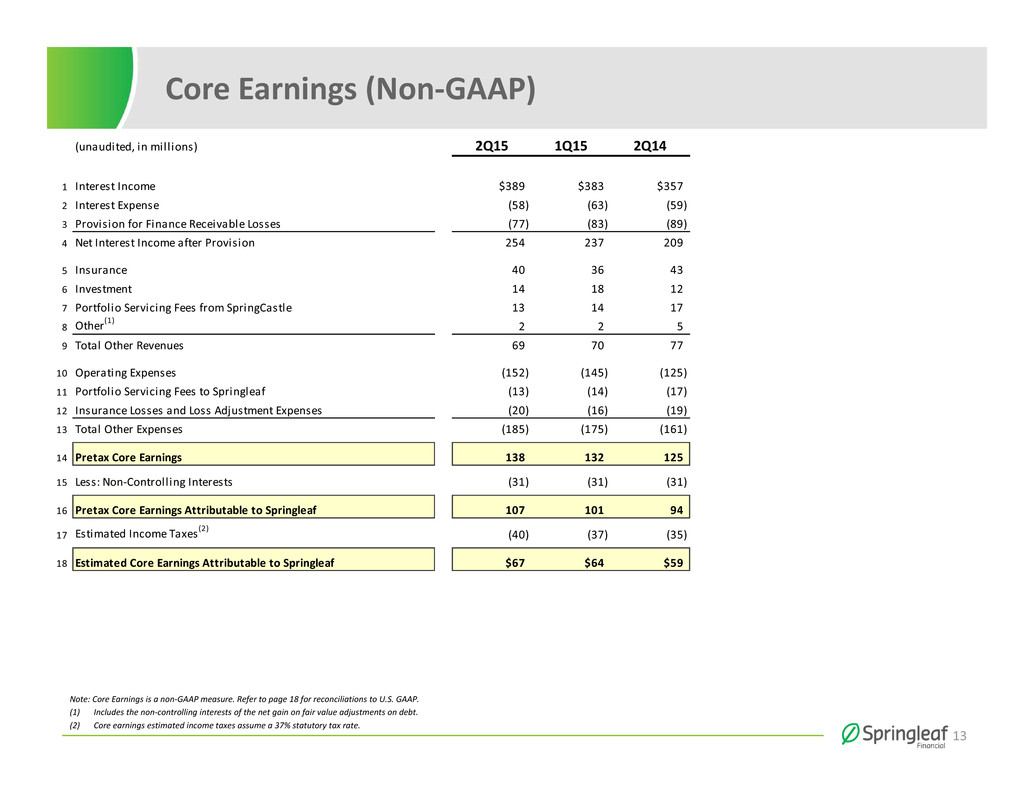
For Core Consumer Operations, core earnings (a non-GAAP measure) for the quarter were $67 million, a 14% increase from $59 million in the prior year quarter, and core earnings per diluted share (a non-GAAP measure) were $0.53 for the second quarter versus $0.52 in the prior year quarter1,2. Weighted average shares outstanding increased to 127.4 million for the second quarter 2015 from 115.2 million for the second quarter 2014 as a result of the company’s issuance of 19.4 million common shares on May 4, 2015.
Second Quarter Highlights
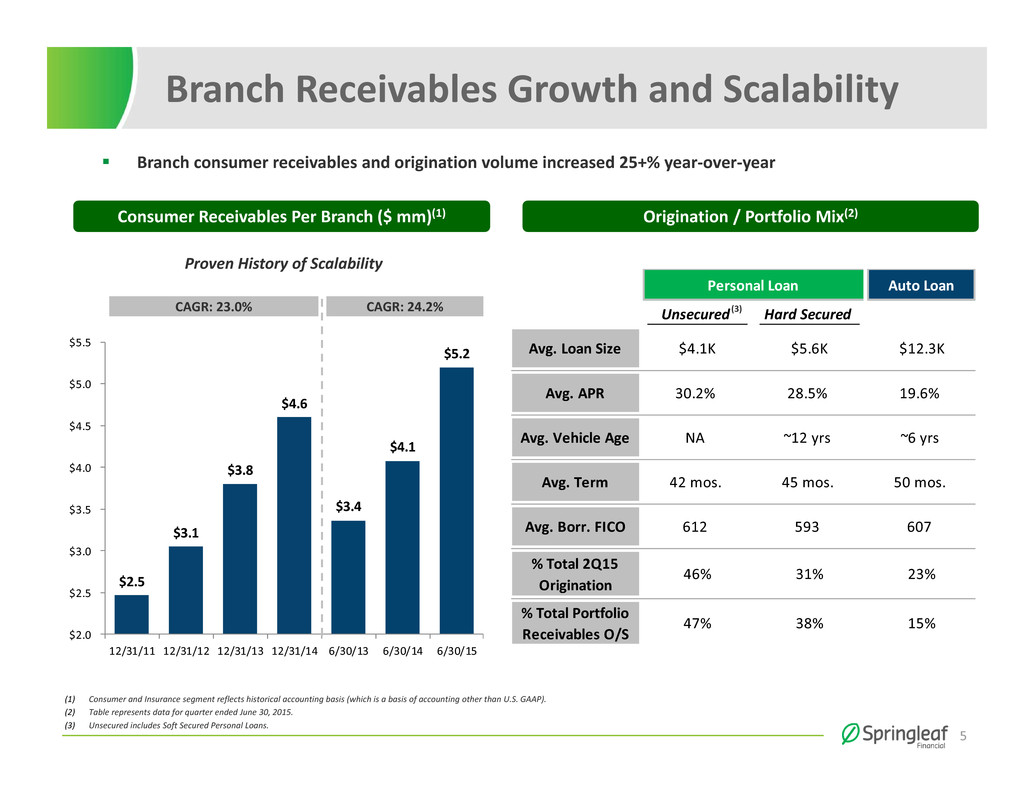
• | Consumer net finance receivables reached $4.3 billion at June 30, 2015, an increase of $909 million, or 27% from June 30, 2014, and up 10% from March 31, 2015. The $4.3 billion at June 30, 2015 included $632 million of direct auto loan receivables. |
• | Consumer net finance receivables per branch were $5.2 million at June 30, 2015, up 27% from $4.1 million at June 30, 2014, and up 10% from $4.7 million at March 31, 2015. |
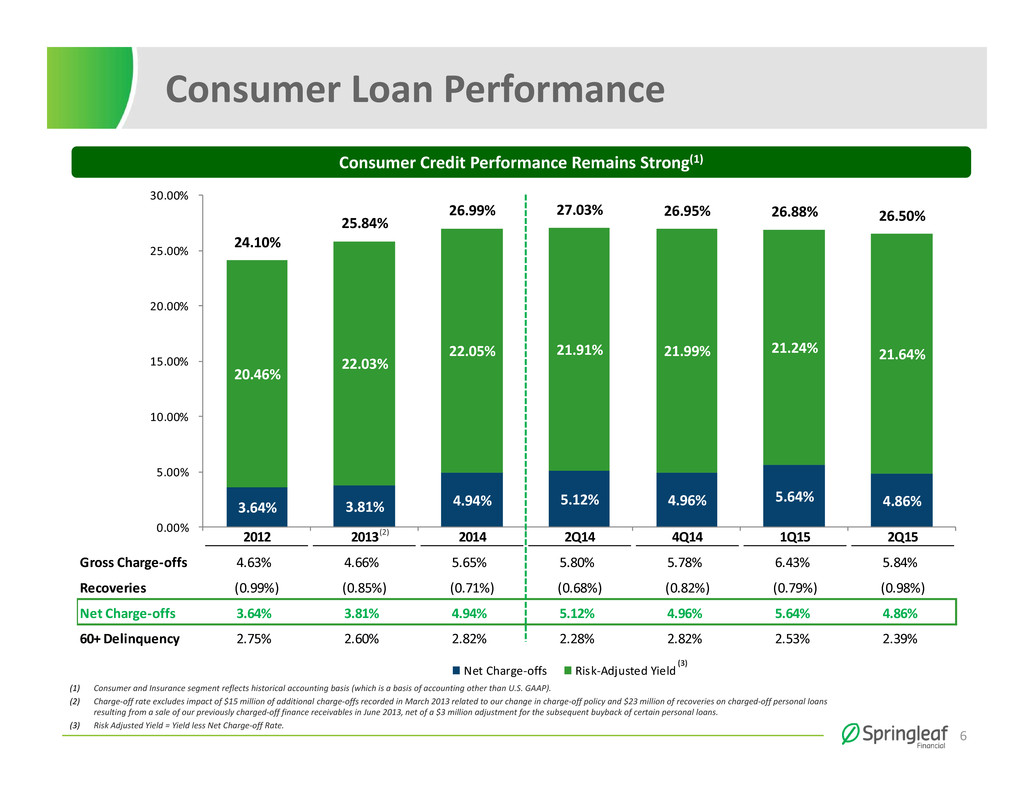
• | Yield for our Consumer segment in the quarter was 26.50%, down 53 basis points from the second quarter of 2014, and risk-adjusted yield for our Consumer segment in the quarter was 21.64%, down 27 basis points from the second quarter of 2014. |
• | The company originated $1.2 billion of total consumer loans in the second quarter, including $274 million of direct auto loan originations. |
Jay Levine, President and CEO of Springleaf said, “We are very pleased to report another quarter of strong growth in core earnings, up 14% from the prior year quarter, as we continue to generate positive operating leverage from our key strategy of serving our customer base and growing receivables per branch. Once again this quarter, both branch receivables and branch originations grew well above 20% year-over-year and consumer receivables per branch reached $5.2 million. Also contributing to our strong performance this quarter was the meaningful improvement in our credit metrics, with the net charge-off and delinquency ratios showing meaningful declines from the first quarter of this year.”
1 Excludes the impact of charges related to fair value adjustments on debt and earnings attributable to non-controlling interests.
2 Core Earnings income taxes assume 37% statutory tax rate.
1
Core Consumer Operations: (Reported on a historical accounting basis, which is a non-GAAP measure. Refer to the reconciliation of non-GAAP to comparable GAAP measures on page 10.)
Consumer and Insurance
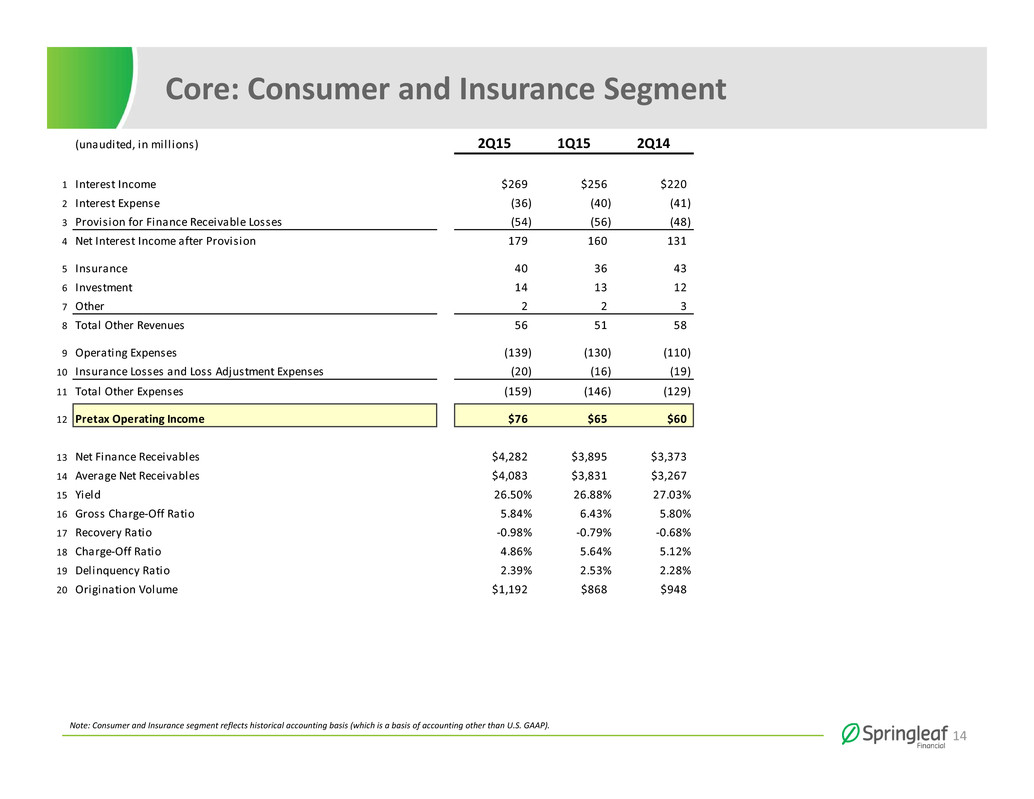
Consumer and Insurance pretax income was $76 million in the quarter versus $60 million in the second quarter of 2014, and $65 million in the first quarter of 20153.
Consumer net finance receivables reached $4.3 billion at June 30, 2015, an increase of 27% from June 30, 2014 and up 10% from March 31, 2015, driven by the ongoing use of advanced analytics to enhance the quality of new customer leads, as well as the continued strong growth in the direct auto loan product. Driven by these same factors, Consumer net finance receivables per branch continued to grow, reaching $5.2 million at June 30, 2015, up from $4.1 million at June 30, 2014 and $4.7 million at March 31, 2015.
Net interest income was $233 million in the quarter, up 30% from the prior year quarter and 8% from the prior quarter. Yield in the current quarter was 26.50%, down 53 basis points from the prior year quarter, and 38 basis points from the first quarter of 2015, reflecting the impact of the successful roll-out of the company’s direct-to-consumer auto loan product. Risk adjusted yield, representing yield less net charge-off rate, was 21.64% in the quarter, down 27 basis points from the second quarter of 2014 as the decline in yield more than offset the year-over-year improvement in net charge-offs. Risk adjusted yield grew 40 basis points from the first quarter of 2015 due to the significant reduction in charge-offs.
The annualized net charge-off ratio was 4.86% in the second quarter of 2015, versus 5.12% in the prior year quarter and 5.64% in the prior quarter.
The annualized gross charge-off ratio was 5.84% in the quarter, up 4 basis points from the prior year quarter, but 59 basis points lower than the first quarter 2015. Recovery ratio improved in the quarter to 98 basis points versus 68 basis points in the second quarter of 2014 and 79 basis points in the first quarter of 2015.
The 60+ delinquency ratio was 2.39% at quarter end, versus 2.28% at prior year quarter end and 2.53% at prior quarter end.
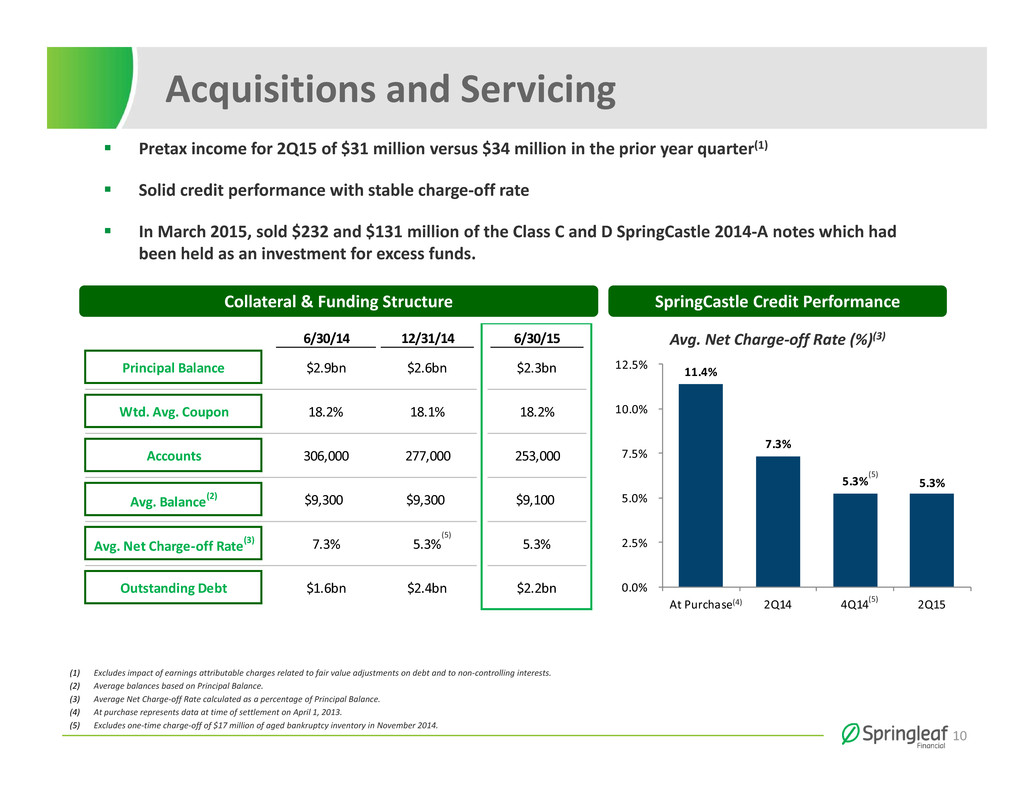
Acquisitions and Servicing
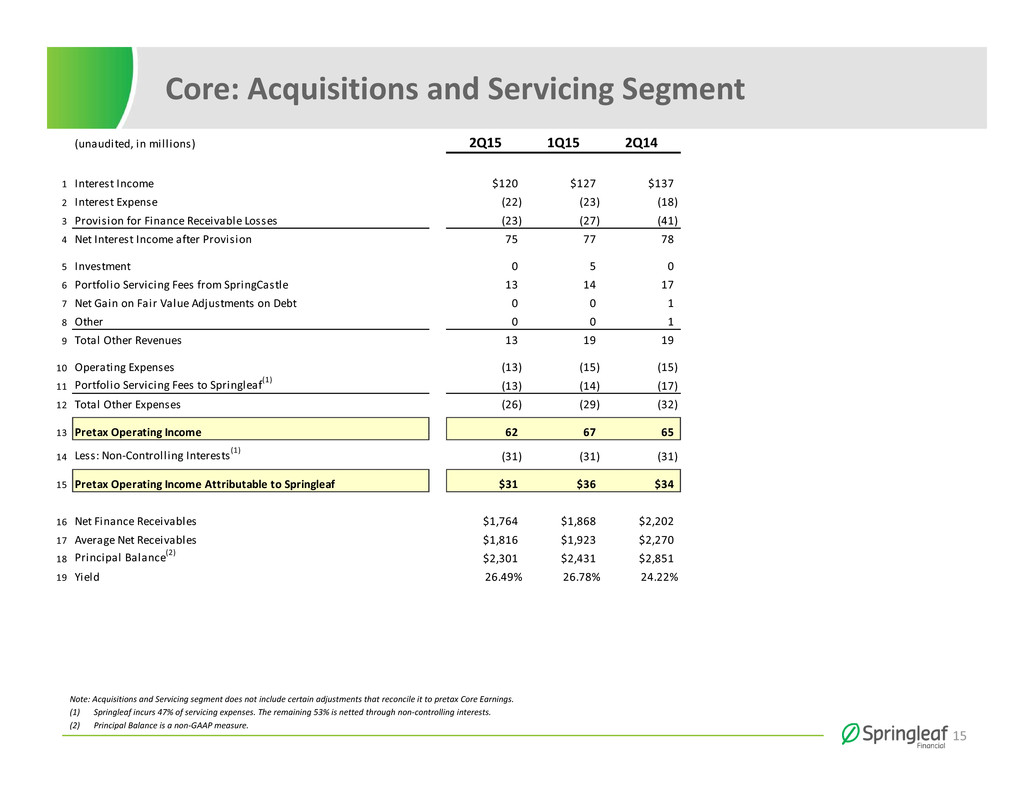
The Acquisitions and Servicing segment contributed $31 million to the company’s consolidated pretax income in the quarter. The entire Acquisitions and Servicing segment, which includes non-controlling interests, generated pretax income of $62 million in the quarter4, with net interest income of $98 million and a yield of 26.49%. Actual net finance receivables at quarter-end were $1.8 billion, down from $2.2 billion at June 30, 2014, and down from $1.9 billion at March 31, 2015. The principal balance of the portfolio was $2.3 billion at quarter-end versus $2.9 billion at June 30, 2014 and $2.4 billion at March 31, 2015.
The annualized net charge-off ratio improved to 5.07% in the quarter, versus 7.07% in the prior year quarter and 5.43% in the prior quarter.
3 Consumer and Insurance segment reflects historical accounting basis (which is a basis of accounting other than U.S. GAAP).
4 Includes the impact of earnings attributable to non-controlling interests.
2
The annualized gross charge-off ratio was 5.75% in the quarter, down 203 basis points from the prior year quarter and down 31 basis points from the first quarter 2015. Recoveries continued to improve in the quarter at 68 basis points versus 63 basis points in the first quarter of 2015.
The 60+ delinquency ratio for the Acquisitions and Servicing segment was 3.75% at the end of the quarter, a decrease of 129 basis points from the prior year quarter end, and down 47 basis points from the prior quarter end.
Non-Core Portfolio: (Reported on a historical accounting basis, which is a non-GAAP measure.)
Legacy Real Estate and Other Non-Core
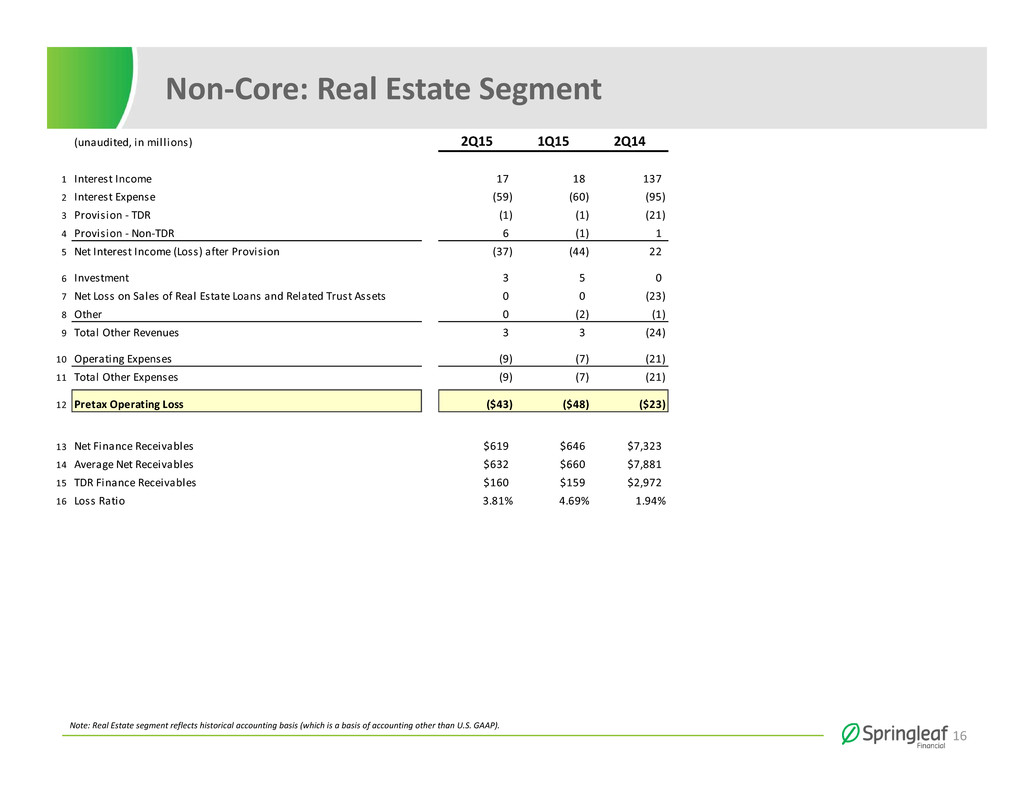
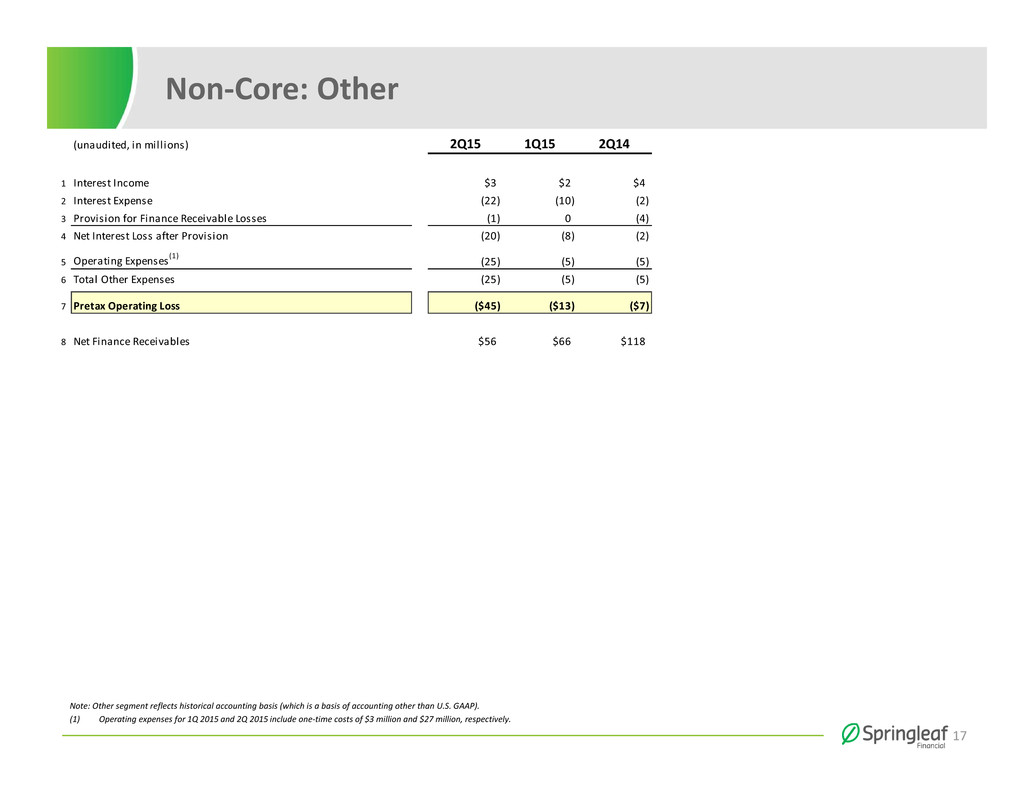
The Non-Core Portfolio (consisting of legacy real estate loans) generated a pretax loss of $43 million in the quarter. The loss resulted primarily from the reduction in interest earning assets attributable to real estate sales completed in 2014. The sale proceeds, which have been allocated to the Non-Core portfolio, are expected to be used to fund the purchase of OneMain and/or for general corporate purposes. At closing, the majority of the debt allocated to the Non-Core Portfolio will be re-allocated to the Core Consumer segment. The real estate portfolio was $0.8 billion at quarter end5., down from $7.3 billion from the prior year quarter end.
The Other Non-Core activities generated a pretax loss of $18 million6.
Liquidity and Capital Resources
As of June 30, 2015, the company had $5.2 billion of cash and highly liquid investment securities. The company had total outstanding debt of $9.7 billion at quarter-end, in a variety of debt instruments.
On May 4, 2015, the company issued approximately 19.4 million shares of common stock for net proceeds of approximately $976 million7. The proceeds may be used to fund the acquisition of OneMain and/or for general corporate purposes, which may include debt repurchases and repayments, capital expenditures and other possible acquisitions.
Proposed Acquisition of OneMain
As we reported previously, on March 22, 2015, we were notified by the Department of Justice (“DOJ”), Antitrust Division, that they would be reviewing the Proposed Acquisition from an antitrust perspective and we and OneMain subsequently met with, and provided information to, the DOJ staff on a voluntary basis. Thereafter, both parties received a voluntary request for information from the DOJ. On April 28, 2015, the DOJ also issued a Civil Investigative Demand (“CID”) to both parties. The voluntary request for information and the CID seek documentary materials and information regarding the Proposed Acquisition and the marketplace in which both parties operate. We have responded to the DOJ's request. As part of this process, on June 5, 2015, we, OneMain and the Department of Justice entered into a timing agreement whereby we and OneMain agreed not to consummate the Proposed Acquisition prior
5 Includes both Held for Investment and Held for Sale finance receivables.
6 Excludes one-time costs of $27 million.
7 Approximate total after deducting offering-related expenses totaling $24 million.
3
to September 10, 2015, in order to provide the DOJ with a sufficient opportunity to complete its review of the Proposed Acquisition from an antitrust perspective. In addition, we have been contacted by state Attorney General's offices, which may seek to coordinate their antitrust review of the Proposed Acquisition with the DOJ.
The review of the proposed acquisition of OneMain from an antitrust perspective has not yet been completed. The DOJ and certain state Attorneys General have expressed to Springleaf potential concerns with respect to the proposed acquisition. Springleaf expects to constructively engage with the DOJ and the states in an attempt to resolve any potential concerns. These discussions could result in a delay in the consummation of the proposed acquisition beyond the third quarter.
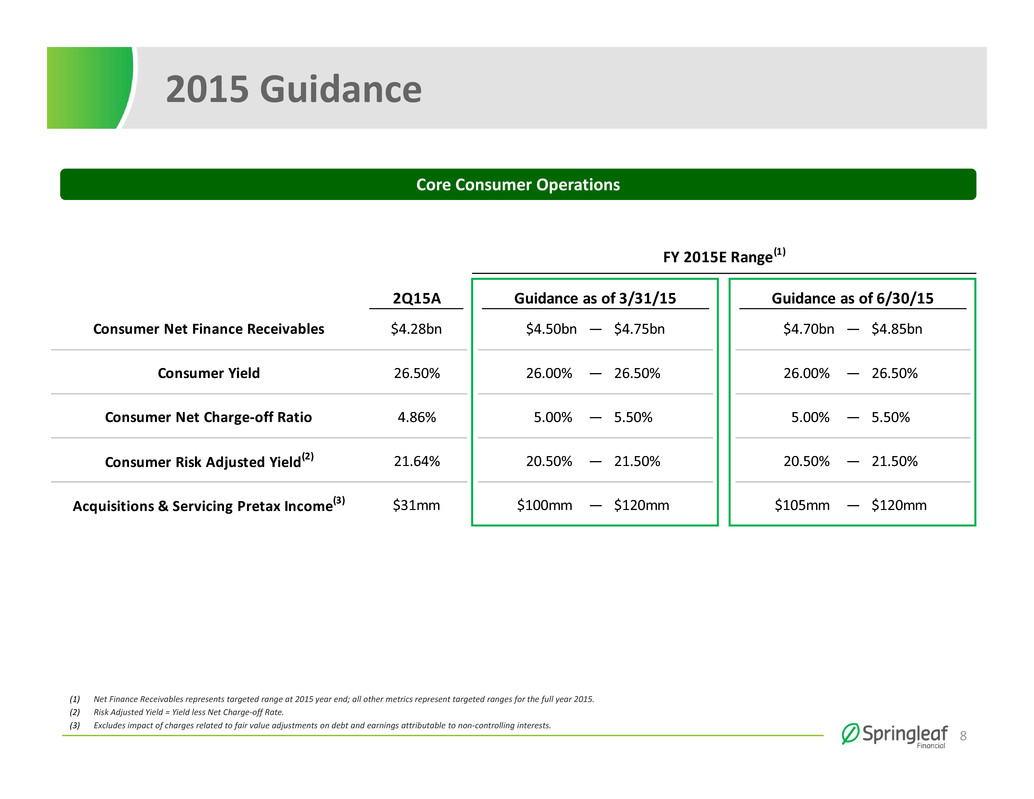
2015 Guidance
The company has established 2015 guidance ranges for certain metrics related to its Core Consumer Operations as follows:
2Q15A1 | 2015E Guidance | |
Consumer Net Finance Receivables at Period End | $4.28bn | $4.70bn - $4.85bn |
Consumer Yield | 26.50% | 26.00% - 26.50% |
Consumer Net Charge-off Ratio | 4.86% | 5.00% - 5.50% |
Consumer Risk-Adjusted Yield2 | 21.64% | 20.50% - 21.50% |
Acquisitions & Servicing Pretax Income3 | $31mm | $105mm - $120mm |
1. | Net Finance Receivables represents data as of June 30, 2015. All other metrics represent data for the quarter ended June 30, 2015. |
2. | Risk Adjusted Yield = Yield less Net Charge-off rates. |
3. | Excludes impact of earnings attributable to non-controlling interests. |
Use of Non-GAAP Measures
We report the operating results of our Core Consumer Operations, Non-Core Portfolio and Other Non-Core using the same accounting basis that we employed prior to 2010 when we were acquired by Fortress (the “Fortress Acquisition”), which we refer to as “historical accounting basis,” to provide a consistent basis for both management and other interested third parties to better understand our operating results. The historical accounting basis, which is a basis of accounting other than accounting principles generally accepted in the United State of America (“U.S. GAAP”), also provides better comparability of the operating results of these segments to our competitors and other companies in the financial services industry. The historical accounting basis is not applicable to Acquisitions and Servicing since this segment resulted from the purchase of the SpringCastle Portfolio on April 1, 2013 and therefore, was not affected by the Fortress Acquisition.
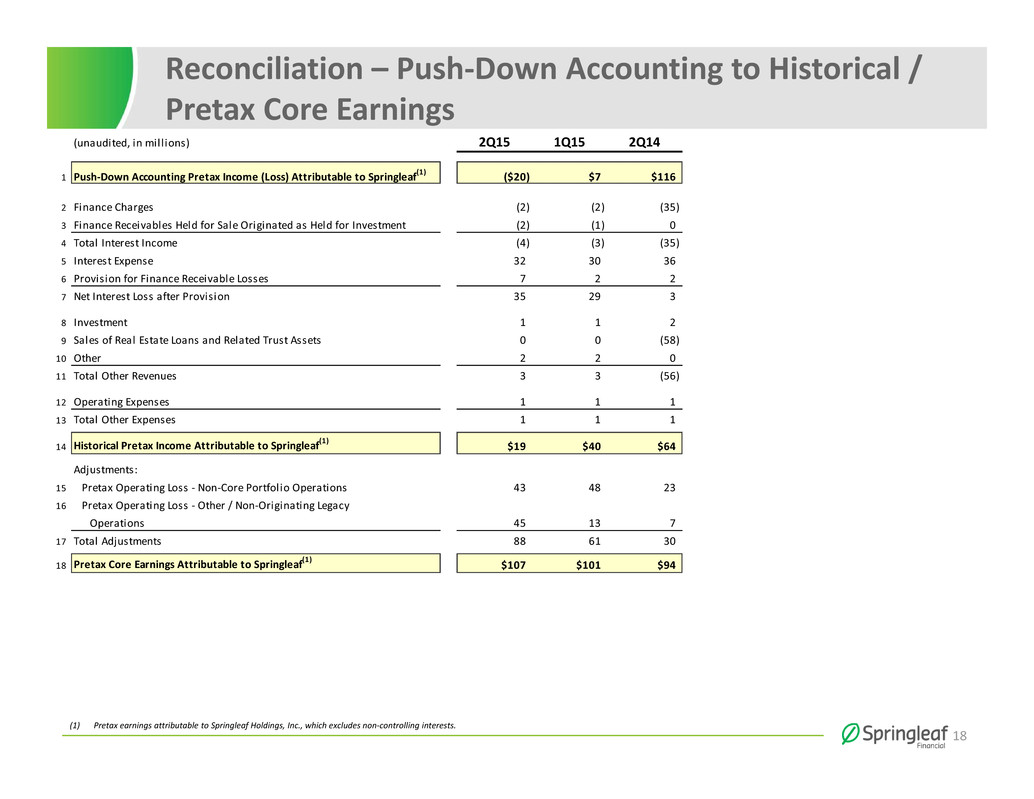
Pretax Core Earnings is a key performance measure used by management in evaluating the performance of our Core Consumer Operations. Pretax Core Earnings represents our income (loss) before provision for
4
(benefit from) income taxes on a historical accounting basis and excludes results of operations from our Non-Core Portfolio (legacy real estate loans) and other non-originating legacy operations, gains (losses) resulting from accelerated long-term debt repayment and repurchases of long-term debt related to Core Consumer Operations (attributable to Springleaf), gains (losses) on fair value adjustments on debt related to Core Consumer Operations (attributable to Springleaf), and results of operations attributable to non-controlling interests. Pretax Core Earnings provides us with a key measure of our Core Consumer Operations’ performance as it assists us in comparing its performance on a consistent basis. Management believes Pretax Core Earnings is useful in assessing the profitability of our core business and uses Pretax Core Earnings in evaluating our operating performance. Pretax Core Earnings is a non-GAAP measure and should be considered in addition to, but not as a substitute for or superior to, operating income, net income, operating cash flow, and other measures of financial performance prepared in accordance with U.S. GAAP.
Conference Call & Webcast Information
Springleaf management will host a conference call and webcast to discuss our second quarter 2015 results and other general matters at 10:00 am Eastern on Thursday, August 6, 2015. Both the call and webcast are open to the general public. The general public is invited to listen to the call by dialing 877-330-3668 (U.S. domestic), or 678-304-6859 (international), conference ID 81060727, or via a live audio webcast through the Investor Relations section of the website. For those unable to listen to the live broadcast, a replay will be available on our website or by dialing 800-585-8367 (U.S. domestic), or 404-537-3406, conference ID 81060727, beginning approximately two hours after the event. The replay of the conference call will be available through August 20, 2015. An investor presentation will be available by visiting the Investor Relations page of Springleaf’s website at www.springleaf.com on Thursday, August 6, 2015, prior to the start of the conference call.
Forward Looking Statements
This presentation contains “forward‐looking statements” within the meaning of the U.S. federal securities laws. Forward‐looking statements include, without limitation, statements concerning plans, objectives, goals, projections, strategies, future events or performance, our 2015 guidance ranges and underlying assumptions and other statements, which are not statements of historical facts. Statements preceded by, followed by or that otherwise include the words “anticipate,” “appears,” “believe,” “foresee,” “intend,” “should,” “expect,” “estimate,” “project,” “plan,” “may,” “could,” “will,” “are likely” and similar expressions are intended to identify forward‐looking statements. These statements involve predictions of our future financial condition, performance, plans and strategies, and are thus dependent on a number of factors including, without limitation, assumptions and data that may be imprecise or incorrect. Specific factors that may impact performance or other predictions of future actions include, but are not limited to: various risks relating to the OneMain acquisition, including in respect of the satisfaction of closing conditions to the OneMain acquisition that are materially adverse to the business, financial condition or results of operations of the combined company; resolution of any potential concerns expressed to us by the DOJ and certain State Attorneys General with respect to the OneMain
5
acquisition; unanticipated difficulties financing the purchase price of the OneMain acquisition; unanticipated expenditures relating to the OneMain acquisition; uncertainties as to the timing of the closing of the OneMain acquisition; litigation relating to the OneMain acquisition; the impact of the OneMain acquisition on each company’s relationships with employees and third parties; the inability to obtain, or delays in obtaining, cost savings and synergies from the OneMain acquisition and risks associated with the integration of the companies; changes in general economic conditions, including the interest rate environment and the financial markets; levels of unemployment and personal bankruptcies; shifts in residential real estate values; natural or accidental events such as earthquakes, hurricanes, tornadoes, fires, or floods; war, acts of terrorism, riots, civil disruption, pandemics, or other events disrupting business or commerce; changes in the rate at which we can collect or potentially sell our finance receivables portfolio; our ability to successfully realize the benefits of the SpringCastle Portfolio and the OneMain acquisition if completed; the effectiveness of our credit risk scoring models; changes in our ability to attract and retain employees or key executives; changes in the competitive environment in which we operate; shifts in collateral values, delinquencies, or credit losses; changes in federal, state and local laws, regulations, or regulatory policies and practices; potential liability relating to real estate and personal loans which we have sold or may sell in the future, or relating to securitized loans; the effect of future sales of our remaining portfolio of real estate loans and the transfer of servicing of these loans; the costs and effects of any litigation or governmental inquiries or investigations; our continued ability to access the capital markets or the sufficiency of our current sources of funds to satisfy our cash flow requirements; our ability to comply with our debt covenants; our ability to generate sufficient cash to service all of our indebtedness; the potential for downgrade of our debt by rating agencies; our substantial indebtedness, which could prevent us from meeting our obligations under our debt instruments and limit our ability to react to changes in the economy, or our ability to incur additional borrowings; the impacts of our securitizations and borrowings; our ability to maintain sufficient capital levels in our regulated and unregulated subsidiaries; changes in accounting standards or tax policies and practices and the application of such new policies and practices to the manner in which we conduct business; the material weakness that we have identified in our internal control over financial reporting; and other risks described in the “Risk Factors” section of the Company’s Form 10‐K filed with the SEC on March 16, 2015 and in other filings with the SEC. Forward-looking statements involve known and unknown risks, uncertainties and other factors which may cause the actual results, performance or achievements of the Company to be materially different from any future results, performance or achievements expressed or implied by such forward‐looking statements. We caution you not to place undue reliance on these forward‐looking statements that speak only as of the date they were made. We do not undertake any obligation to publicly release any revisions to these forward‐looking statements to reflect events or circumstances after the date of this presentation or to reflect the occurrence of unanticipated events. You should not rely on forward looking statements as the sole basis upon which to make any investment decision.
6
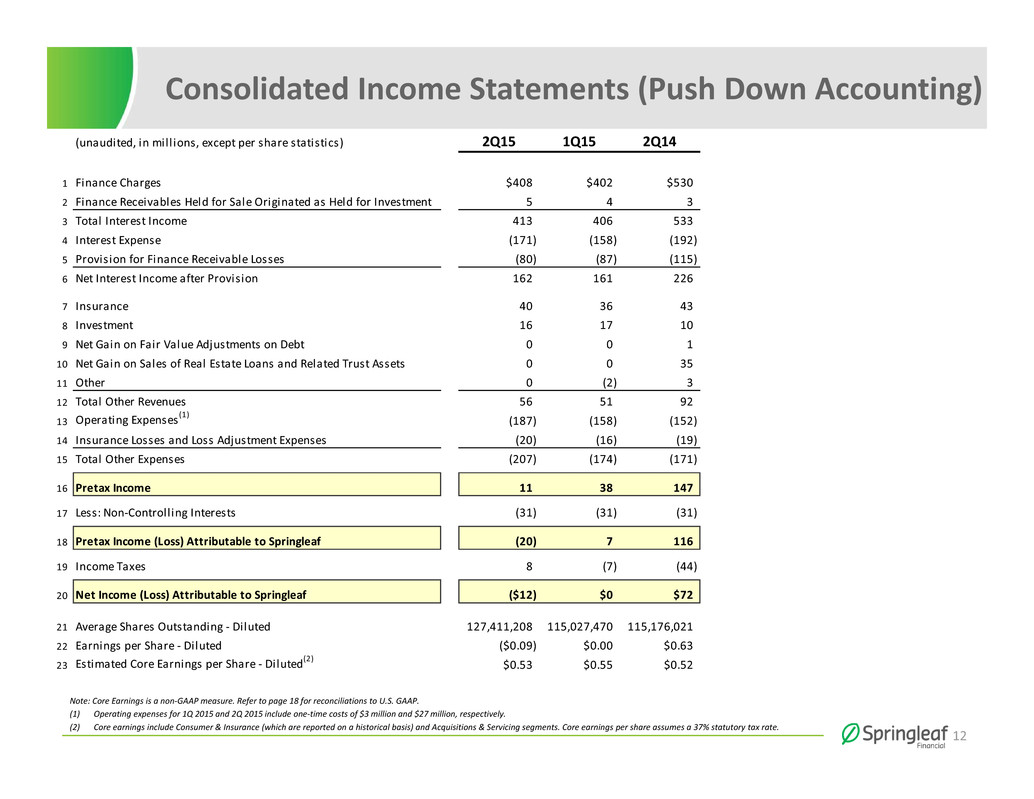
CONDENSED CONSOLIDATED STATEMENTS OF OPERATIONS (UNAUDITED)
(dollars in millions except earnings (loss) per share) | Three Months Ended June 30, | Six Months Ended June 30, | ||||||||||||||
2015 | 2014 | 2015 | 2014 | |||||||||||||
Interest income: | ||||||||||||||||
Finance charges | $ | 408 | $ | 530 | $ | 810 | $ | 1,078 | ||||||||
Finance receivables held for sale originated as held for investment | 5 | 3 | 9 | 7 | ||||||||||||
Total interest income | 413 | 533 | 819 | 1,085 | ||||||||||||
Interest expense | 171 | 192 | 329 | 397 | ||||||||||||
Net interest income | 242 | 341 | 490 | 688 | ||||||||||||
Provision for finance receivable losses | 80 | 115 | 167 | 276 | ||||||||||||
Net interest income after provision for finance receivable losses | 162 | 226 | 323 | 412 | ||||||||||||
Other revenues: | ||||||||||||||||
Insurance | 40 | 43 | 76 | 81 | ||||||||||||
Investment | 16 | 10 | 33 | 20 | ||||||||||||
Net loss on repurchases and repayments of debt | — | — | — | (7 | ) | |||||||||||
Net gain (loss) on fair value adjustments on debt | — | 1 | — | (16 | ) | |||||||||||
Net gain on sales of real estate loans and related trust assets | — | 35 | — | 90 | ||||||||||||
Other | — | 3 | (2 | ) | 5 | |||||||||||
Total other revenues | 56 | 92 | 107 | 173 | ||||||||||||
Other expenses: | ||||||||||||||||
Operating expenses: | ||||||||||||||||
Salaries and benefits | 112 | 92 | 205 | 184 | ||||||||||||
Other operating expenses | 75 | 60 | 140 | 118 | ||||||||||||
Insurance losses and loss adjustment expenses | 20 | 19 | 36 | 37 | ||||||||||||
Total other expenses | 207 | 171 | 381 | 339 | ||||||||||||
Income before provision for (benefit from) income taxes | 11 | 147 | 49 | 246 | ||||||||||||
Provision for (benefit from) income taxes | (8 | ) | 44 | (1 | ) | 75 | ||||||||||
Net income | 19 | 103 | 50 | 171 | ||||||||||||
Net income attributable to non-controlling interests | 31 | 31 | 62 | 47 | ||||||||||||
Net income (loss) attributable to Springleaf Holdings, Inc. | $ | (12 | ) | $ | 72 | $ | (12 | ) | $ | 124 | ||||||
Share Data: | ||||||||||||||||
Weighted average number of shares outstanding: | ||||||||||||||||
Basic | 127,411,208 | 114,788,439 | 121,253,548 | 114,788,439 | ||||||||||||
Diluted | 127,411,208 | 115,176,021 | 121,253,548 | 115,160,440 | ||||||||||||
Earnings (loss) per share: | ||||||||||||||||
Basic | $ | (0.09 | ) | $ | 0.63 | $ | (0.10 | ) | $ | 1.09 | ||||||
Diluted | $ | (0.09 | ) | $ | 0.63 | $ | (0.10 | ) | $ | 1.08 | ||||||
7
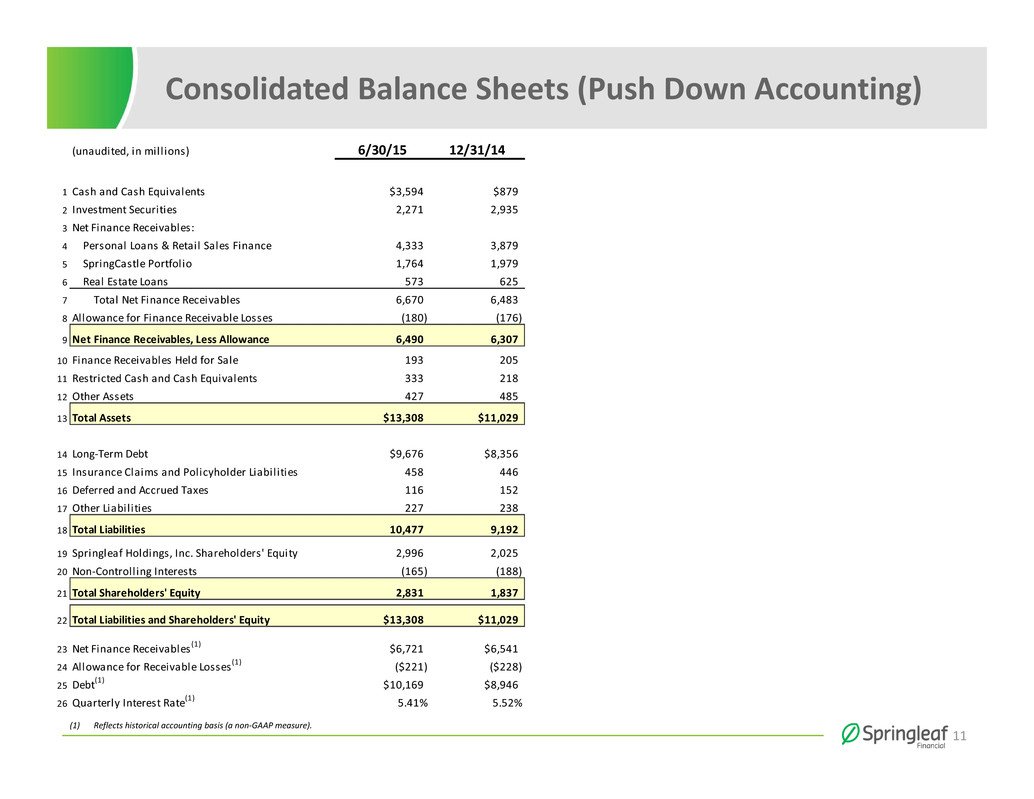
CONDENSED CONSOLIDATED BALANCE SHEETS (UNAUDITED)
(dollars in millions) | June 30, 2015 | December 31, 2014 | ||||||
Assets | ||||||||
Cash and cash equivalents | $ | 3,594 | $ | 879 | ||||
Investment securities | 2,271 | 2,935 | ||||||
Net finance receivables: | ||||||||
Personal loans | 4,300 | 3,831 | ||||||
SpringCastle Portfolio | 1,764 | 1,979 | ||||||
Real estate loans | 573 | 625 | ||||||
Retail sales finance | 33 | 48 | ||||||
Net finance receivables | 6,670 | 6,483 | ||||||
Allowance for finance receivable losses | (180 | ) | (176 | ) | ||||
Net finance receivables, less allowance for finance receivable losses | 6,490 | 6,307 | ||||||
Finance receivables held for sale | 193 | 205 | ||||||
Restricted cash and cash equivalents | 333 | 218 | ||||||
Other assets | 427 | 485 | ||||||
Total assets | $ | 13,308 | $ | 11,029 | ||||
Liabilities and Shareholders’ Equity | ||||||||
Long-term debt | $ | 9,676 | $ | 8,356 | ||||
Insurance claims and policyholder liabilities | 458 | 446 | ||||||
Deferred and accrued taxes | 116 | 152 | ||||||
Other liabilities | 227 | 238 | ||||||
Total liabilities | 10,477 | 9,192 | ||||||
Shareholders’ equity: | ||||||||
Common stock | 1 | 1 | ||||||
Additional paid-in capital | 1,522 | 529 | ||||||
Accumulated other comprehensive income (loss) | (7 | ) | 3 | |||||
Retained earnings | 1,480 | 1,492 | ||||||
Springleaf Holdings, Inc. shareholders’ equity | 2,996 | 2,025 | ||||||
Non-controlling interests | (165 | ) | (188 | ) | ||||
Total shareholders’ equity | 2,831 | 1,837 | ||||||
Total liabilities and shareholders’ equity | $ | 13,308 | $ | 11,029 | ||||
8
CORE KEY METRICS
(dollars in millions) | Three Months Ended June 30, | At or for the Six months ended June 30, | ||||||||||||||
2015 | 2014 | 2015 | 2014 | |||||||||||||
Consumer and Insurance | ||||||||||||||||
Net finance receivables | $ | 4,282 | $ | 3,373 | ||||||||||||
Number of accounts | 958,130 | 864,614 | ||||||||||||||
TDR finance receivables | $ | 28 | $ | 16 | ||||||||||||
Allowance for finance receivable losses - TDR | $ | 7 | $ | 1 | ||||||||||||
Provision for finance receivable losses - TDR | $ | 6 | $ | — | $ | 10 | $ | — | ||||||||
Average net receivables | $ | 4,083 | $ | 3,267 | $ | 3,957 | $ | 3,202 | ||||||||
Yield | 26.50 | % | 27.03 | % | 26.68 | % | 26.98 | % | ||||||||
Gross charge-off ratio | 5.84 | % | 5.80 | % | 6.13 | % | 5.68 | % | ||||||||
Recovery ratio | (0.98 | )% | (0.68 | )% | (0.89 | )% | (0.62 | )% | ||||||||
Charge-off ratio | 4.86 | % | 5.12 | % | 5.24 | % | 5.06 | % | ||||||||
Delinquency ratio | 2.39 | % | 2.28 | % | ||||||||||||
Origination volume | $ | 1,192 | $ | 948 | $ | 2,060 | $ | 1,670 | ||||||||
Number of accounts | 223,307 | 211,503 | 380,710 | 372,744 | ||||||||||||
Acquisitions and Servicing | ||||||||||||||||
Net finance receivables | $ | 1,764 | $ | 2,202 | ||||||||||||
Number of accounts | 253,351 | 306,330 | ||||||||||||||
TDR finance receivables | $ | 12 | $ | 5 | ||||||||||||
Allowance for finance receivable losses - TDR | $ | 3 | $ | — | ||||||||||||
Provision for finance receivable losses - TDR | $ | — | $ | — | $ | 1 | $ | — | ||||||||
Average net receivables | $ | 1,816 | $ | 2,270 | $ | 1,870 | $ | 2,348 | ||||||||
Yield | 26.49 | % | 24.22 | % | 26.64 | % | 24.30 | % | ||||||||
Net charge-off ratio | 5.07 | % | 7.07 | % | 5.25 | % | 7.90 | % | ||||||||
Delinquency ratio | 3.75 | % | 5.04 | % | ||||||||||||
9
RECONCILIATION OF PGAAP AND HISTORICAL INCOME (NON-GAAP)
(dollars in millions) | Three Months Ended June 30, | Six Months Ended June 30, | ||||||||||||||
2015 | 2014 | 2015 | 2014 | |||||||||||||
Income before provision for income taxes - push-down accounting basis | $ | 11 | $ | 147 | $ | 49 | $ | 246 | ||||||||
Interest income adjustments | (4 | ) | (35 | ) | (7 | ) | (71 | ) | ||||||||
Interest expense adjustments | 32 | 36 | 62 | 64 | ||||||||||||
Provision for finance receivable losses adjustments | 7 | 2 | 9 | 2 | ||||||||||||
Repurchases and repayments of long-term debt adjustments | — | — | — | (4 | ) | |||||||||||
Fair value adjustments on debt | — | — | — | 8 | ||||||||||||
Sales of finance receivables held for sale originated as held for investment adjustments | — | (58 | ) | — | (175 | ) | ||||||||||
Amortization of other intangible assets | 1 | 1 | 2 | 2 | ||||||||||||
Other | 3 | 2 | 6 | 2 | ||||||||||||
Income before provision for income taxes - historical accounting basis | $ | 50 | $ | 95 | $ | 121 | $ | 74 | ||||||||
PRETAX CORE EARNINGS (NON-GAAP) RECONCILIATION
(dollars in millions) | Three Months Ended June 30, | Six Months Ended June 30, | ||||||||||||||
2015 | 2014 | 2015 | 2014 | |||||||||||||
Income before provision for income taxes - historical accounting basis | $ | 50 | $ | 95 | $ | 121 | $ | 74 | ||||||||
Adjustments: | ||||||||||||||||
Pretax operating loss - Non-Core Portfolio Operations | 43 | 23 | 91 | 128 | ||||||||||||
Pretax operating loss - Other/non-originating legacy operations | 45 | 7 | 58 | 10 | ||||||||||||
Net loss from accelerated repayment/repurchase of debt - Core Consumer Operations (attributable to SHI) | — | — | — | 1 | ||||||||||||
Net loss on fair value adjustments on debt - Core Consumer Operations (attributable to SHI) | — | — | — | 8 | ||||||||||||
Pretax operating income attributable to non-controlling interests | (31 | ) | (31 | ) | (62 | ) | (47 | ) | ||||||||
Pretax core earnings | $ | 107 | $ | 94 | $ | 208 | $ | 174 | ||||||||
Springleaf Holdings, Inc.
Contact:
Craig Streem, 812-468-5752
craig.streem@springleaf.com
Source: Springleaf Holdings, Inc.
10