Attached files
| file | filename |
|---|---|
| 8-K - CURRENT REPORT - PNMAC Holdings, Inc. | pfsi_8k.htm |
| EX-99.1 - PRESS RELEASE - PNMAC Holdings, Inc. | pfsi_8k-ex9901.htm |
Exhibit 99.2

Second Quarter 2015 Earnings Report
Forward - Looking Statements 2 This presentation contains forward - looking statements within the meaning of Section 21 E of the Securities Exchange Act of 1934 , as amended, regarding management’s beliefs, estimates, projections and assumptions with respect to, among other things, the Company’s financial results, future operations, business plans and investment strategies, as well as industry and market conditions, all of which are subject to change . Words like “believe,” “expect,” “anticipate,” “promise,” “plan,” and other expressions or words of similar meanings, as well as future or conditional verbs such as “will,” “would,” “should,” “could,” or “may” are generally intended to identify forward - looking statements . Actual results and operations for any future period may vary materially from those projected herein, from past results discussed herein, or from illustrative examples provided herein . Factors which could cause actual results to differ materially from historical results or those anticipated include, but are not limited to : changes in federal, state and local laws and regulations applicable to the highly regulated industry in which we operate ; lawsuits or governmental actions if we do not comply with the laws and regulations applicable to our businesses ; the creation of the Consumer Financial Protection Bureau, or CFPB, and enforcement of its rules ; changes in existing U . S . government - sponsored entities, their current roles or their guarantees or guidelines ; changes to government mortgage modification programs ; the licensing and operational requirements of states and other jurisdictions applicable to our businesses, to which our bank competitors are not subject ; foreclosure delays and changes in foreclosure practices ; certain banking regulations that may limit our business activities ; changes in macroeconomic and U . S . residential real estate market conditions ; difficulties in growing loan production volume ; changes in prevailing interest rates ; increases in loan delinquencies and defaults ; our reliance on PennyMac Mortgage Investment Trust as a significant source of financing for, and revenue related to, our correspondent lending business and purchased mortgage servicing rights ; availability of required additional capital and liquidity to support business growth ; our obligation to indemnify third - party purchasers or repurchase loans that we originate, acquire or assist in with fulfillment ; our obligation to indemnify advised entities or investment funds to meet certain criteria or characteristics or under other circumstances ; decreases in the historical returns on the assets that we select and manage for our clients, and our resulting management and incentive fees ; regulation applicable to our investment management segment ; conflicts of interest in allocating our services and investment opportunities among ourselves and our advised entities ; the potential damage to our reputation and adverse impact to our business resulting from ongoing negative publicity ; and our rapid growth . You should not place undue reliance on any forward - looking statement and should consider all of the uncertainties and risks described above, as well as those more fully discussed in reports and other documents filed by the Company with the Securities and Exchange Commission from time to time . The Company undertakes no obligation to publicly update or revise any forward - looking statements or any other information contained herein, and the statements made in this presentation are current as of the date of this presentation only .
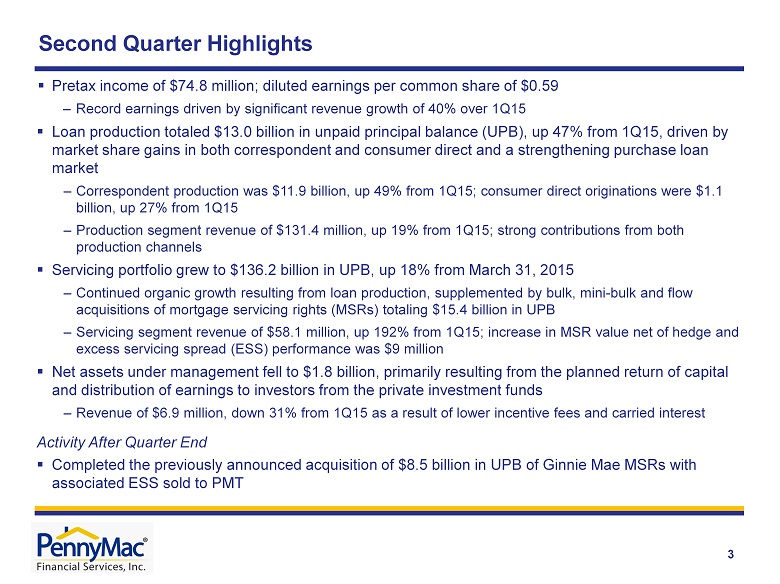
Second Quarter Highlights 3 ▪ Pretax income of $74.8 million; diluted earnings per common share of $0.59 – Record earnings driven by significant revenue growth of 40% over 1Q15 ▪ Loan production totaled $13.0 billion in unpaid principal balance (UPB), up 47% from 1Q15, driven by market share gains in both correspondent and consumer direct and a strengthening purchase loan market – Correspondent production was $11.9 billion, up 49% from 1Q15; consumer direct originations were $1.1 billion, up 27% from 1Q15 – Production segment revenue of $131.4 million, up 19% from 1Q15; strong contributions from both production channels ▪ Servicing portfolio grew to $136.2 billion in UPB, up 18% from March 31, 2015 – Continued organic growth resulting from loan production, supplemented by bulk, mini - bulk and flow acquisitions of mortgage servicing rights (MSRs) totaling $15.4 billion in UPB – Servicing segment revenue of $58.1 million, up 192% from 1Q15; increase in MSR value net of hedge and excess servicing spread (ESS) performance was $9 million ▪ Net assets under management fell to $1.8 billion, primarily resulting from the planned return of capital and distribution of earnings to investors from the private investment funds – Revenue of $6.9 million, down 31% from 1Q15 as a result of lower incentive fees and carried interest Activity After Quarter End ▪ Completed the previously announced acquisition of $8.5 billion in UPB of Ginnie Mae MSRs with associated ESS sold to PMT
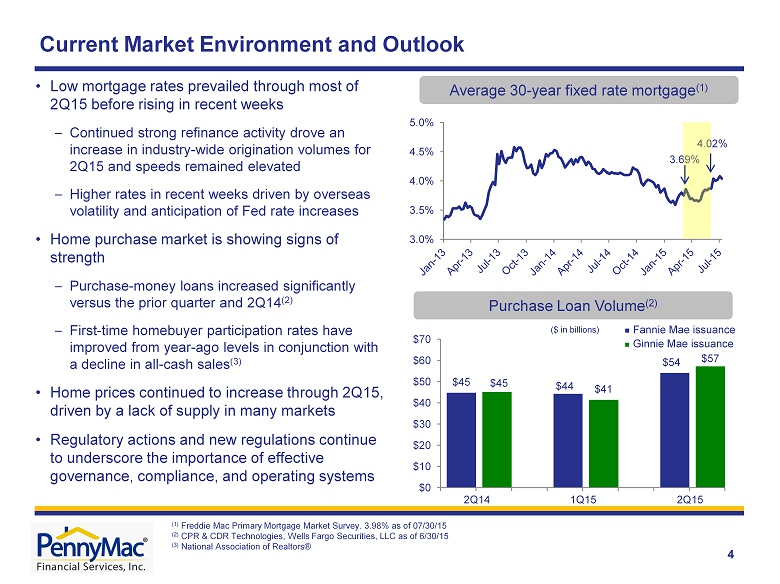
3.0% 3.5% 4.0% 4.5% 5.0% 3.69% 4.02% Current Market Environment and Outlook 4 • Low mortgage rates prevailed through most of 2Q15 before rising in recent weeks – Continued strong refinance activity drove an increase in industry - wide origination volumes for 2Q15 and speeds remained elevated – Higher rates in recent weeks driven by overseas volatility and anticipation of Fed rate increases • Home purchase market is showing signs of strength – Purchase - money loans increased significantly versus the prior quarter and 2Q14 (2) – First - time homebuyer participation rates have improved from year - ago levels in conjunction with a decline in all - cash sales (3) • Home prices continued to increase through 2Q15, driven by a lack of supply in many markets • Regulatory actions and new regulations continue to underscore the importance of effective governance, compliance, and operating systems (1) Freddie Mac Primary Mortgage Market Survey. 3.98% as of 07/30/15 (2) CPR & CDR Technologies, Wells Fargo Securities, LLC as of 6/30/15 (3) National Association of Realtors® $45 $45 $44 $41 $54 $57 $0 $10 $20 $30 $40 $50 $60 $70 2Q14 2Q15 1Q15 ($ in billions) Ŷ Fannie Mae issuance Ŷ Ginnie Mae issuance Purchase Loan Volume (2 ) Average 30 - year fixed rate mortgage (1)
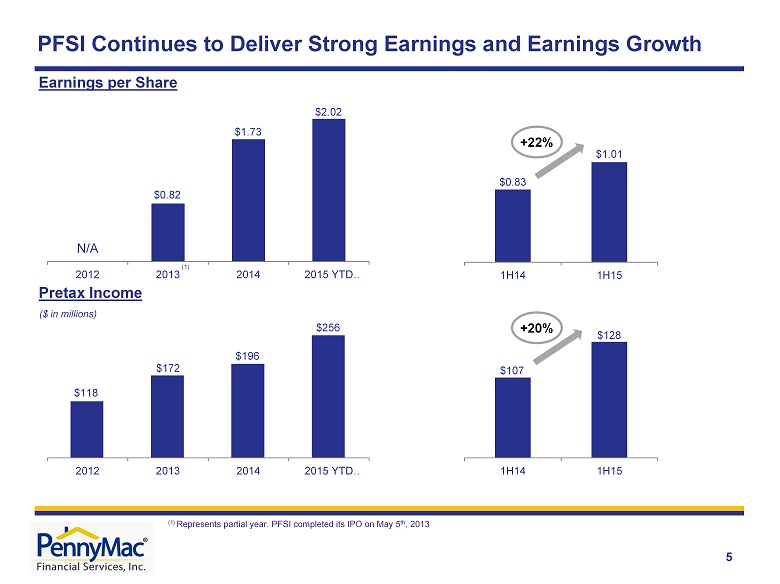
$0.83 $1.01 1H14 1H15 $107 $ 128 1H14 1H15 +20% +22% PFSI Continues to Deliver Strong Earnings and Earnings Growth Pretax Income ($ in millions) 5 Earnings per Share (1) Represents partial year. PFSI completed its IPO on May 5 th , 2013 (1) $1.73 $ 2.02 $0.82 2012 2013 2014 2015 YTD … $ 256 $118 $172 $196 2012 2013 2014 2015 YTD … N/A
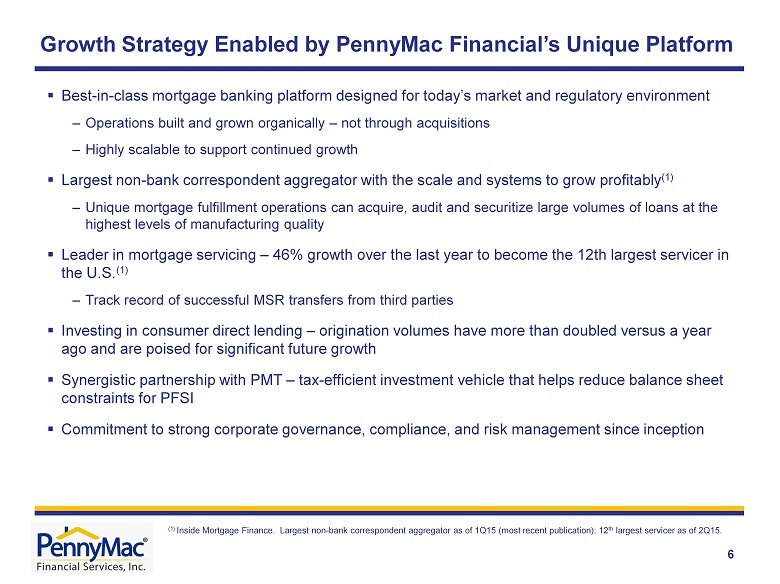
Growth Strategy Enabled by PennyMac Financial’s Unique Platform 6 ▪ Best - in - class mortgage banking platform designed for today’s market and regulatory environment – Operations built and grown organically – not through acquisitions – Highly scalable to support continued growth ▪ Largest non - bank correspondent aggregator with the scale and systems to grow profitably (1) – Unique mortgage fulfillment operations can acquire, audit and securitize large volumes of loans at the highest levels of manufacturing quality ▪ Leader in mortgage servicing – 46% growth over the last year to become the 12th largest servicer in the U.S. (1) – Track record of successful MSR transfers from third parties ▪ Investing in consumer direct lending – origination volumes have more than doubled versus a year ago and are poised for significant future growth ▪ Synergistic partnership with PMT – tax - efficient investment vehicle that helps reduce balance sheet constraints for PFSI ▪ Commitment to strong corporate governance, compliance, and risk management since inception (1) Inside Mortgage Finance. Largest non - bank correspondent aggregator as of 1Q15 (most recent publication); 12 th largest servicer as of 2Q15.
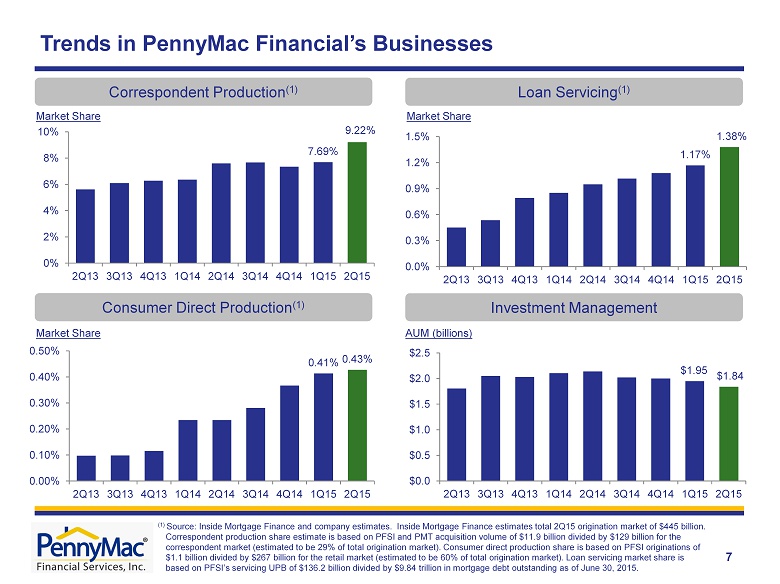
7.69% 9.22% 0% 2% 4% 6% 8% 10% 2Q13 3Q13 4Q13 1Q14 2Q14 3Q14 4Q14 1Q15 2Q15 Trends in PennyMac Financial’s Businesses Correspondent Production (1) Market Share 0.41% 0.43% 0.00% 0.10% 0.20% 0.30% 0.40% 0.50% 2Q13 3Q13 4Q13 1Q14 2Q14 3Q14 4Q14 1Q15 2Q15 Market Share Consumer Direct Production (1 ) $1.95 $1.84 $0.0 $0.5 $1.0 $1.5 $2.0 $2.5 2Q13 3Q13 4Q13 1Q14 2Q14 3Q14 4Q14 1Q15 2Q15 1.17% 1.38% 0.0% 0.3% 0.6% 0.9% 1.2% 1.5% 2Q13 3Q13 4Q13 1Q14 2Q14 3Q14 4Q14 1Q15 2Q15 Loan Servicing (1) Market Share Investment Management AUM (billions) 7 (1) Source : Inside Mortgage Finance and company estimates. Inside Mortgage Finance estimates total 2Q15 origination market of $445 billion. Correspondent production share estimate is based on PFSI and PMT acquisition volume of $11.9 billion divided by $129 billion for the correspondent market (estimated to be 29% of total origination market). Consumer direct production share is based on PFSI originations of $1.1 billion divided by $267 billion for the retail market (estimated to be 60% of total origination market). Loan servicing mar ket share is based on PFSI’s servicing UPB of $136.2 billion divided by $9.84 trillion in mortgage debt outstanding as of June 30, 2015.
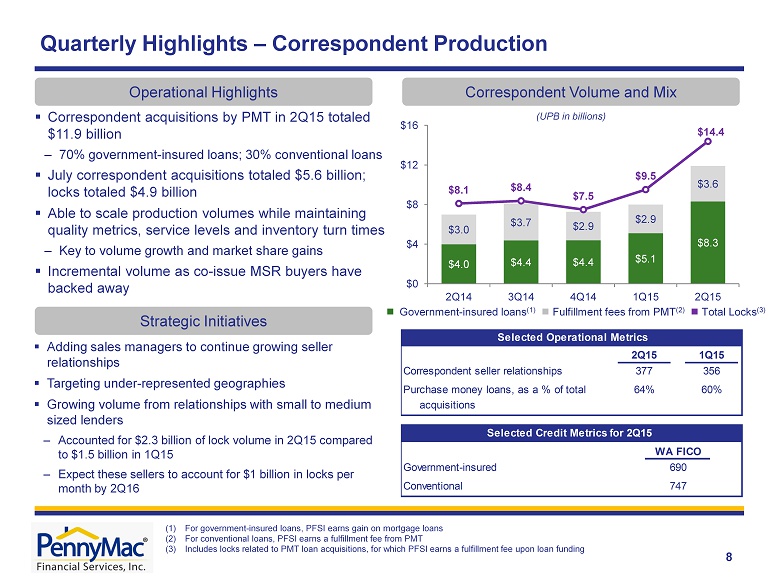
2Q15 1Q15 Correspondent seller relationships 377 356 Purchase money loans, as a % of total 64% 60% acquisitions Government-insured Conventional Selected Operational Metrics Selected Credit Metrics for 2Q15 WA FICO 690 747 8 $4.0 $4.4 $4.4 $5.1 $8.3 $3.0 $3.7 $2.9 $2.9 $3.6 $8.1 $8.4 $7.5 $9.5 $14.4 $0 $4 $8 $12 $16 2Q14 3Q14 4Q14 1Q15 2Q15 (UPB in billions) Quarterly Highlights – Correspondent Production (1) For government - insured loans, PFSI earns gain on mortgage loans (2) For conventional loans, PFSI earns a fulfillment fee from PMT (3) Includes locks related to PMT loan acquisitions, for which PFSI earns a fulfillment fee upon loan funding Correspondent Volume and Mix Operational Highlights Ŷ Government - insured loans (1) Ŷ Fulfillment fees from PMT (2) Ŷ Total Locks (3) Strategic Initiatives ▪ Adding sales managers to continue growing seller relationships ▪ Targeting under - represented geographies ▪ Growing volume from relationships with small to medium sized lenders – Accounted for $2.3 billion of lock volume in 2Q15 compared to $1.5 billion in 1Q15 – Expect these sellers to account for $1 billion in locks per month by 2Q16 ▪ Correspondent acquisitions by PMT in 2Q15 totaled $11.9 billion – 70% government - insured loans ; 30% conventional loans ▪ July correspondent acquisitions totaled $5.6 billion; locks totaled $4.9 billion ▪ Able to scale production volumes while maintaining quality metrics, service levels and inventory turn times – Key to volume growth and market share gains ▪ Incremental volume as co - issue MSR buyers have backed away
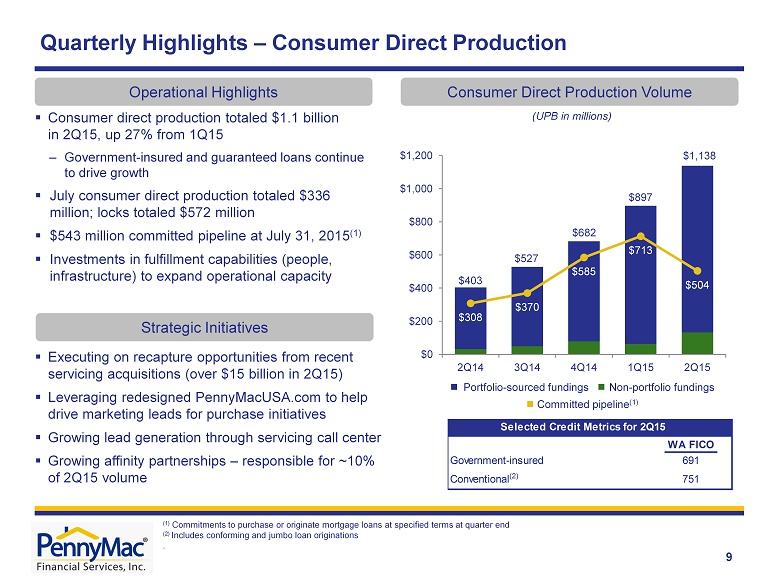
WA FICO Government-insured 691 Conventional (2) 751 Selected Credit Metrics for 2Q15 (UPB in millions ) ▪ Consumer direct production totaled $1.1 billion in 2Q15, up 27% from 1Q15 – Government - insured and guaranteed loans continue to drive growth ▪ July consumer direct production totaled $336 million ; locks totaled $572 million ▪ $543 million committed pipeline at July 31, 2015 (1) ▪ Investments in fulfillment capabilities (people, infrastructure) to expand operational capacity Quarterly Highlights – Consumer Direct Production Consumer Direct Production Volume Operational Highlights Strategic Initiatives Ŷ Portfolio - sourced fundings Ŷ Non - portfolio fundings Ŷ Committed pipeline (1) (1) C ommitments to purchase or originate mortgage loans at specified terms at quarter end (2 ) Includes conforming and jumbo loan originations . ▪ Executing on recapture opportunities from recent servicing acquisitions (over $15 billion in 2Q15) ▪ Leveraging redesigned PennyMacUSA.com to help drive marketing leads for purchase initiatives ▪ Growing lead generation through servicing call center ▪ Growing affinity partnerships – responsible for ~10% of 2Q15 volume 9 $403 $527 $682 $897 $1,138 $308 $370 $585 $713 $504 $0 $200 $400 $600 $800 $1,000 $1,200 2Q14 3Q14 4Q14 1Q15 2Q15
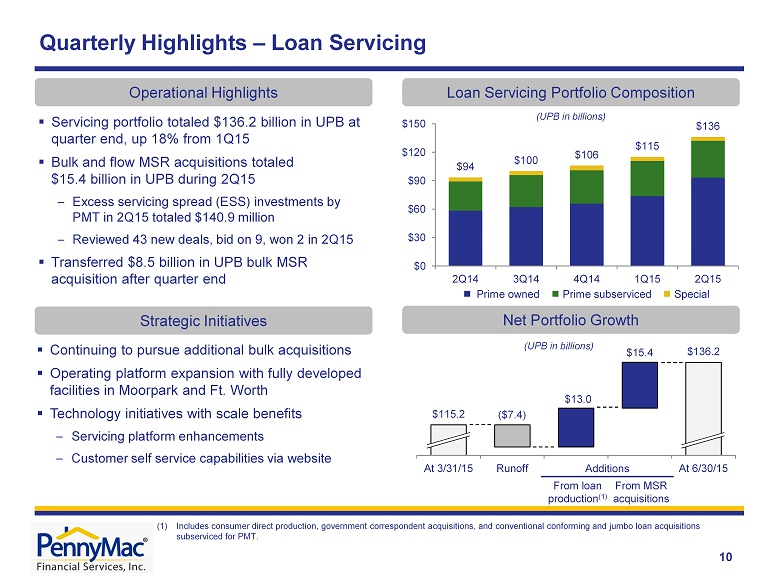
$115.2 $136.2 At 3/31/15 Runoff Additions from loan production MSR acquisitions At 6/30/15 (UPB in billions ) ▪ Servicing portfolio totaled $136.2 billion in UPB at quarter end, up 18% from 1Q15 ▪ Bulk and flow MSR acquisitions totaled $15.4 billion in UPB during 2Q15 – Excess servicing spread (ESS) investments by PMT in 2Q15 totaled $140.9 million – Reviewed 43 new deals, bid on 9 , won 2 in 2Q15 ▪ Transferred $8.5 billion in UPB bulk MSR acquisition after quarter end Quarterly Highlights – Loan Servicing Loan Servicing Portfolio Composition Operational Highlights Strategic Initiatives Ŷ Prime owned Ŷ Prime subserviced Ŷ Special Net Portfolio Growth ($7.4) $13.0 $15.4 (UPB in billions ) (1) $94 $100 $106 $115 $136 $0 $30 $60 $90 $120 $150 2Q14 3Q14 4Q14 1Q15 2Q15 ▪ Continuing to pursue additional bulk acquisitions ▪ Operating platform expansion with fully developed facilities in Moorpark and Ft. Worth ▪ Technology i nitiatives with scale benefits – Servicing platform enhancements – Customer self service capabilities via website 10 (1) Includes consumer direct production, government correspondent acquisitions, and conventional conforming and jumbo loan acquisitions subserviced for PMT. Additions From loan p roduction (1) From MSR acquisitions
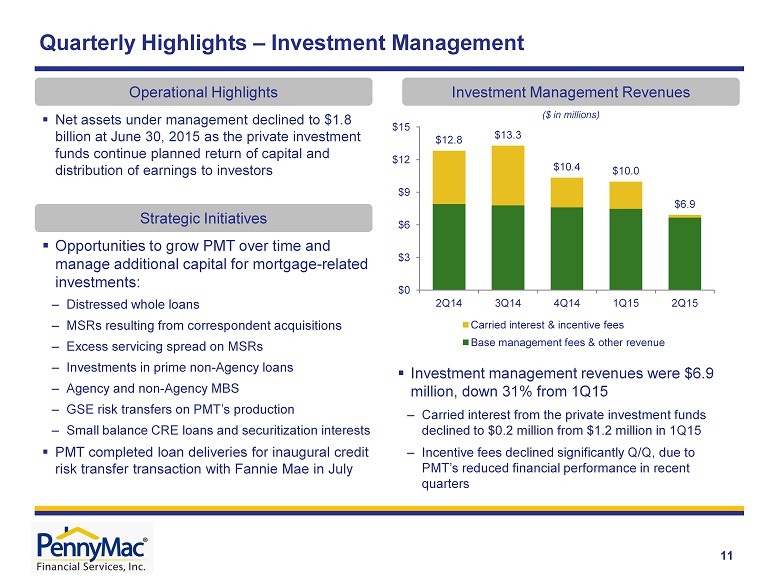
$12.8 $13.3 $10.4 $10.0 $6.9 $0 $3 $6 $9 $12 $15 2Q14 3Q14 4Q14 1Q15 2Q15 Carried interest & incentive fees Base management fees & other revenue 11 ($ in millions) ▪ Net assets under management declined to $1.8 billion at June 30, 2015 as the private investment funds continue planned return of capital and distribution of earnings to investors Quarterly Highlights – Investment Management Investment Management Revenues Operational Highlights Strategic Initiatives ▪ Opportunities to grow PMT over time and manage additional capital for mortgage - related investments: – Distressed whole loans – MSRs resulting from correspondent acquisitions – Excess servicing spread on MSRs – Investments in prime non - Agency loans – Agency and non - Agency MBS – GSE risk transfers on PMT’s production – Small balance CRE loans and securitization interests ▪ PMT completed loan deliveries for inaugural credit risk transfer transaction with Fannie Mae in July ▪ Investment management revenues were $6.9 million, down 31% from 1Q15 – Carried interest from the private investment funds declined to $0.2 million from $1.2 million in 1Q15 – Incentive fees declined significantly Q/Q, due to PMT’s reduced financial performance in recent quarters
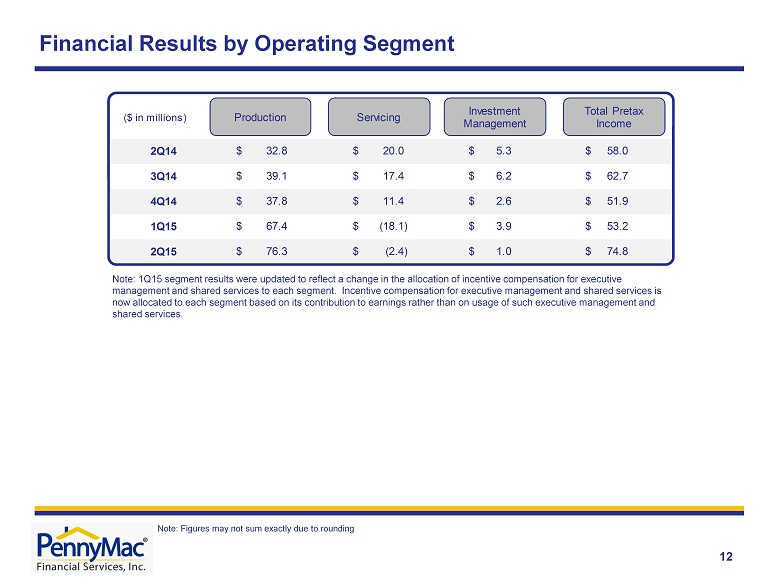
2Q14 32.8$ 20.0$ 5.3$ 58.0$ 3Q14 39.1$ 17.4$ 6.2$ 62.7$ 4Q14 37.8$ 11.4$ 2.6$ 51.9$ 1Q15 67.4$ (18.1)$ 3.9$ 53.2$ 2Q15 76.3$ (2.4)$ 1.0$ 74.8$ ($ in millions) Production Servicing Investment Management Total Pretax Income Financial Results by Operating Segment 12 Note: Figures may not sum exactly due to rounding Note: 1Q15 segment results were updated to reflect a change in the allocation of incentive compensation for executive management and shared services to each segment. Incentive compensation for executive management and shared services is now allocated to each segment based on its contribution to earnings rather than on usage of such executive management and shared services.
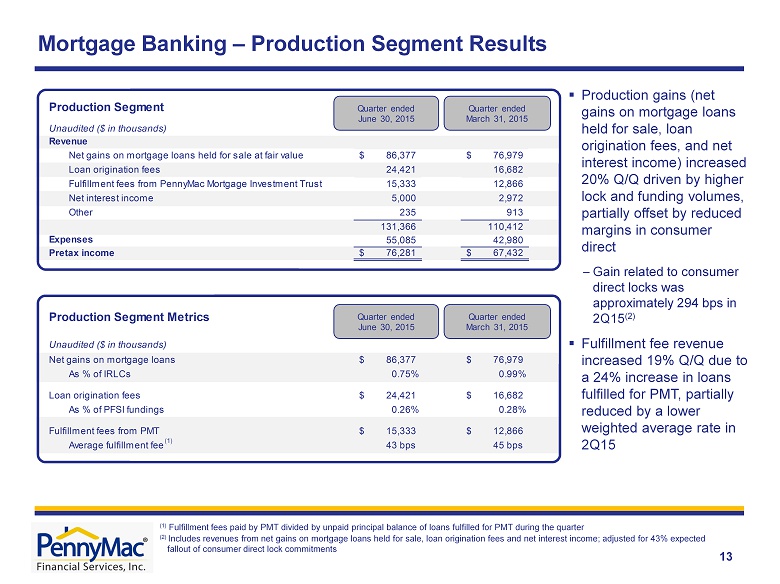
Net gains on mortgage loans held for sale at fair value 86,377$ 76,979$ Loan origination fees 24,421 16,682 Fulfillment fees from PennyMac Mortgage Investment Trust 15,333 12,866 Net interest income 5,000 2,972 Other 235 913 131,366 110,412 55,085 42,980 Pretax income 76,281$ 67,432$ Net gains on mortgage loans 86,377$ 76,979$ As % of IRLCs 0.75% 0.99% Loan origination fees 24,421$ 16,682$ As % of PFSI fundings 0.26% 0.28% Fulfillment fees from PMT 15,333$ 12,866$ Average fulfillment fee 43 bps 45 bps Production Segment Metrics Unaudited ($ in thousands) Expenses Production Segment Unaudited ($ in thousands) Revenue Quarter ended June 30 , 2015 Quarter ended March 31, 2015 Quarter ended June 30, 2015 Quarter ended March 31 , 2015 13 Mortgage Banking – Production Segment Results ( 1 ) Fulfillment fees paid by PMT divided by unpaid principal balance of loans fulfilled for PMT during the quarter (2) Includes revenues from net gains on mortgage loans held for sale, loan origination fees and net interest income; adjusted for 43% expected fallout of consumer direct lock commitments (1) ▪ Production gains (net gains on mortgage loans held for sale, loan origination fees, and net interest income) increased 20% Q/Q driven by higher lock and funding volumes, partially offset by reduced margins in consumer direct – Gain related to consumer direct locks was approximately 294 bps in 2Q15 (2) ▪ Fulfillment fee revenue increased 19% Q/Q due to a 24% increase in loans fulfilled for PMT, partially reduced by a lower weighted average rate in 2Q15
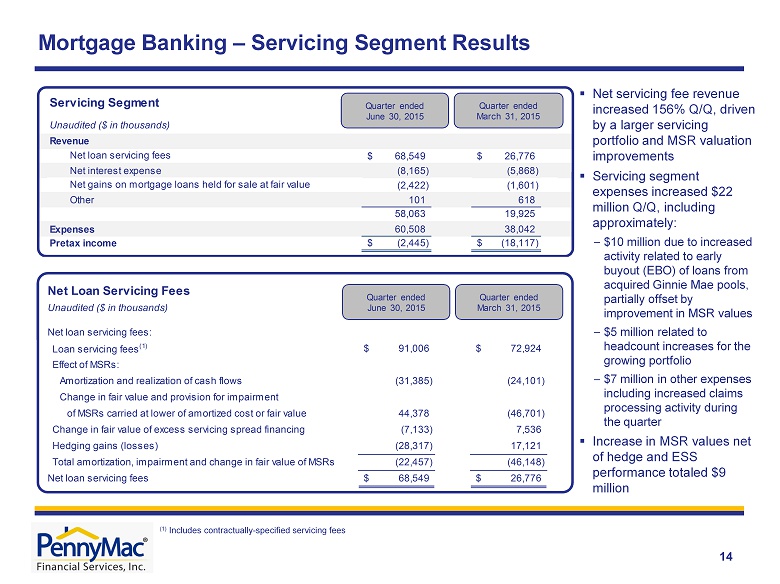
Revenue Net loan servicing fees 68,549$ 26,776$ Net interest expense (8,165) (5,868) Net gains on mortgage loans held for sale at fair value (2,422) (1,601) Other 101 618 58,063 19,925 Expenses 60,508 38,042 Pretax income (2,445)$ (18,117)$ Servicing Segment Unaudited ($ in thousands) Quarter ended June 30 , 2015 Quarter ended March 31 , 2015 Unaudited ($ in thousands) Net loan servicing fees: Loan servicing fees (1) 91,006$ 72,924$ Effect of MSRs: Amortization and realization of cash flows (31,385) (24,101) Change in fair value and provision for impairment of MSRs carried at lower of amortized cost or fair value 44,378 (46,701) Change in fair value of excess servicing spread financing (7,133) 7,536 Hedging gains (losses) (28,317) 17,121 Total amortization, impairment and change in fair value of MSRs (22,457) (46,148) Net loan servicing fees 68,549$ 26,776$ Net Loan Servicing Fees Quarter ended June 3 0 , 2015 Quarter ended March 31 , 201 5 Mortgage Banking – Servicing Segment Results (1) Includes contractually - specified servicing fees 14 ▪ Net servicing fee revenue increased 156% Q/Q, driven by a larger servicing portfolio and MSR valuation improvements ▪ Servicing segment expenses increased $22 million Q/Q, including approximately: – $10 million due to increased activity related to early buyout (EBO) of loans from acquired Ginnie Mae pools, partially offset by improvement in MSR values – $5 million related to headcount increases for the growing portfolio – $7 million in other expenses including increased claims processing activity during the quarter ▪ Increase in MSR values net of hedge and ESS performance totaled $9 million
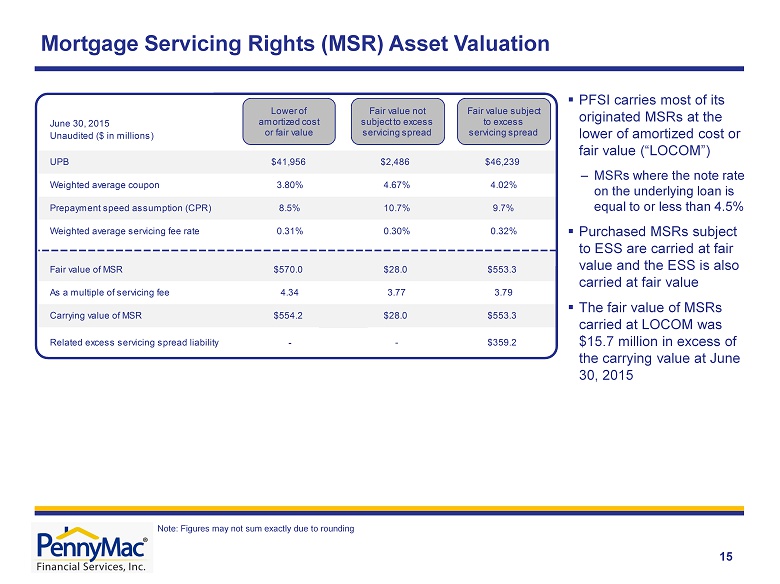
Mortgage Servicing Rights (MSR) Asset Valuation 15 ▪ PFSI carries most of its originated MSRs at the lower of amortized cost or fair value (“LOCOM”) – MSRs where the note rate on the underlying loan is equal to or less than 4.5 % ▪ Purchased MSRs subject to ESS are carried at fair value and the ESS is also carried at fair value ▪ The fair value of MSRs carried at LOCOM was $15.7 million in excess of the carrying value at June 30, 2015 Note: Figures may not sum exactly due to rounding UPB $41,956 $2,486 $46,239 Weighted average coupon 3.80% 4.67% 4.02% Prepayment speed assumption (CPR) 8.5% 10.7% 9.7% Weighted average servicing fee rate 0.31% 0.30% 0.32% Fair value of MSR $570.0 $28.0 $553.3 As a multiple of servicing fee 4.34 3.77 3.79 Carrying value of MSR $554.2 $28.0 $553.3 Related excess servicing spread liability - - $359.2 June 30, 2015 Unaudited ($ in millions) Lower of amortized cost or fair value Fair value not subject to excess servicing spread Fair value subject to excess servicing spread
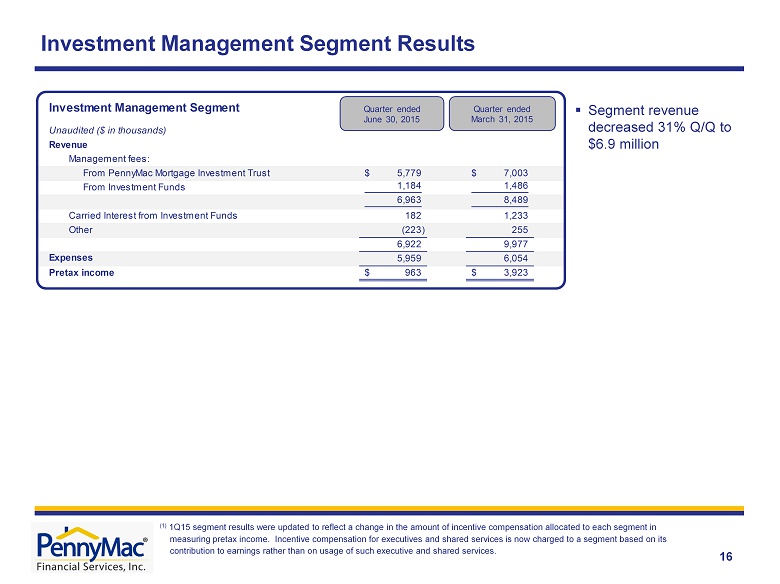
Management fees: From PennyMac Mortgage Investment Trust 5,779$ 7,003$ From Investment Funds 1,184 1,486 6,963 8,489 Carried Interest from Investment Funds 182 1,233 Other (223) 255 6,922 9,977 5,959 6,054 Pretax income 963$ 3,923$ Expenses Investment Management Segment Revenue Unaudited ($ in thousands) Quarter ended June 30 , 2015 Quarter ended March 31 , 2015 Investment Management Segment Results 16 ▪ Segment revenue decreased 31% Q/Q to $6.9 million (1) 1Q15 segment results were updated to reflect a change in the amount of incentive compensation allocated to each segment in measuring pretax income. Incentive compensation for executives and shared services is now charged to a segment based on its contribution to earnings rather than on usage of such executive and shared services.

Appendix
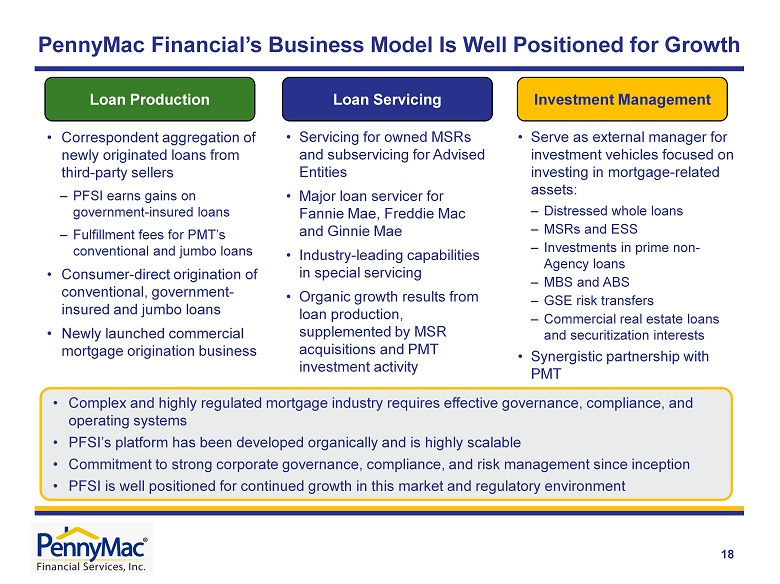
PennyMac Financial’s Business Model Is Well Positioned for Growth • Complex and highly regulated mortgage industry requires effective governance, compliance, and operating systems • PFSI’s platform has been developed organically and is highly scalable • Commitment to strong corporate governance, compliance, and risk management since inception • PFSI is well positioned for continued growth in this market and regulatory environment Loan Production Loan Servicing Investment Management • Servicing for owned MSRs and subservicing for Advised Entities • Major loan servicer for Fannie Mae, Freddie Mac and Ginnie Mae • Industry - leading capabilities in special servicing • Organic growth results from loan production, supplemented by MSR acquisitions and PMT investment activity • Serve as external manager for investment vehicles focused on investing in mortgage - related assets: – Distressed whole loans – MSRs and ESS – Investments in prime non - Agency loans – MBS and ABS – GSE risk transfers – Commercial real estate loans and securitization interests • Synergistic partnership with PMT • Correspondent aggregation of newly originated loans from third - party sellers – PFSI earns gains on government - insured loans – Fulfillment fees for PMT’s conventional and jumbo loans • Consumer - direct origination of conventional, government - insured and jumb o loans • Newly launched commercial mortgage origination business 18
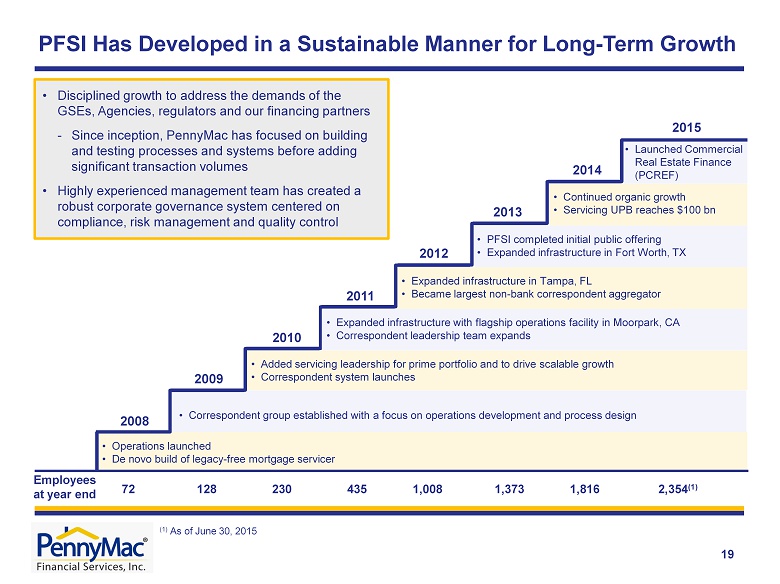
PFSI Has Developed in a Sustainable Manner for Long - Term Growth 72 128 230 435 1,008 1, 373 1,816 2,354 (1) • Operations launched • De novo build of legacy - free mortgage servicer 2008 E mployees at year end 19 2009 2010 2011 2012 2013 2014 2015 • Correspondent group established with a focus on operations development and process design • Added servicing leadership for prime portfolio and to drive scalable growth • Correspondent system launches • Expanded infrastructure with flagship operations facility in Moorpark, CA • Correspondent leadership team expands • Expanded infrastructure in Tampa, FL • Became largest non - bank correspondent aggregator • PFSI completed initial public offering • Expanded infrastructure in Fort Worth, TX • Continued organic growth • Servicing UPB reaches $100 bn • Launched Commercial Real Estate Finance (PCREF) • Disciplined growth to address the demands of the GSEs, Agencies, regulators and our financing partners - Since inception, PennyMac has focused on building and testing processes and systems before adding significant transaction volumes • Highly experienced management team has created a robust corporate governance system centered on compliance, risk management and quality control (1) As of June 30, 2015
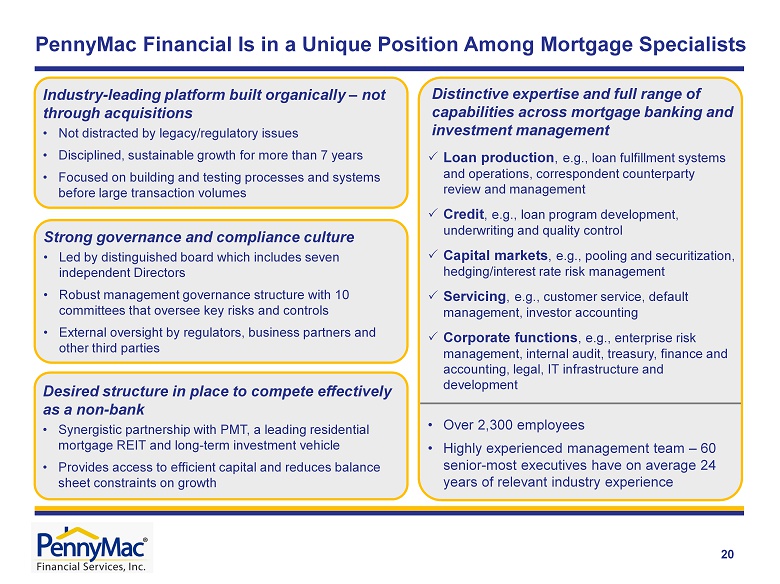
• Over 2,300 employees • Highly experienced management team – 60 senior - most executives have on average 24 years of relevant industry experience Strong governance and compliance culture • Led by distinguished board which includes seven independent Directors • Robust management governance structure with 10 committees that oversee key risks and controls • External oversight by regulators, business partners and other third parties Desired structure in place to compete effectively as a non - bank • Synergistic partnership with PMT, a leading residential mortgage REIT and long - term investment vehicle • Provides access to efficient capital and reduces balance sheet constraints on growth
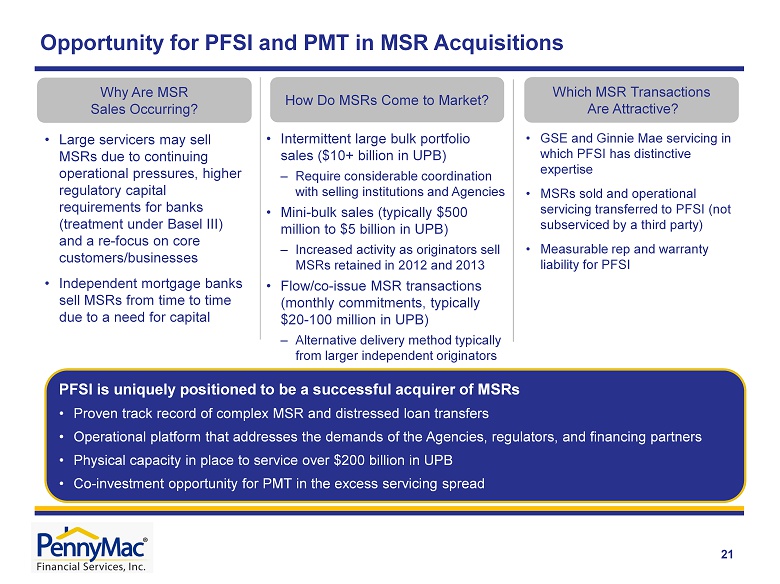
Opportunity for PFSI and PMT in MSR Acquisitions 21 Why Are MSR Sales Occurring? How Do MSRs Come to Market? • Large servicers may sell MSRs due to continuing operational pressures, higher regulatory capital requirements for banks (treatment under Basel III) and a re - focus on core customers/businesses • Independent mortgage banks sell MSRs from time to time due to a need for capital • Intermittent large bulk portfolio sales ($10+ billion in UPB) – Require considerable coordination with selling institutions and Agencies • Mini - bulk sales (typically $500 million to $5 billion in UPB) – Increased activity as originators sell MSRs retained in 2012 and 2013 • Flow/co - issue MSR transactions (monthly commitments, typically $20 - 100 million in UPB) – Alternative delivery method typically from larger independent originators Which MSR Transactions Are Attractive? • GSE and Ginnie Mae servicing in which PFSI has distinctive expertise • MSRs sold and operational servicing transferred to PFSI (not subserviced by a third party) • Measurable rep and warranty liability for PFSI PFSI is uniquely positioned to be a successful acquirer of MSRs • Proven track record of complex MSR and distressed loan transfers • Operational platform that addresses the demands of the Agencies, regulators, and financing partners • Physical capacity in place to service over $200 billion in UPB • Co - investment opportunity for PMT in the excess servicing spread
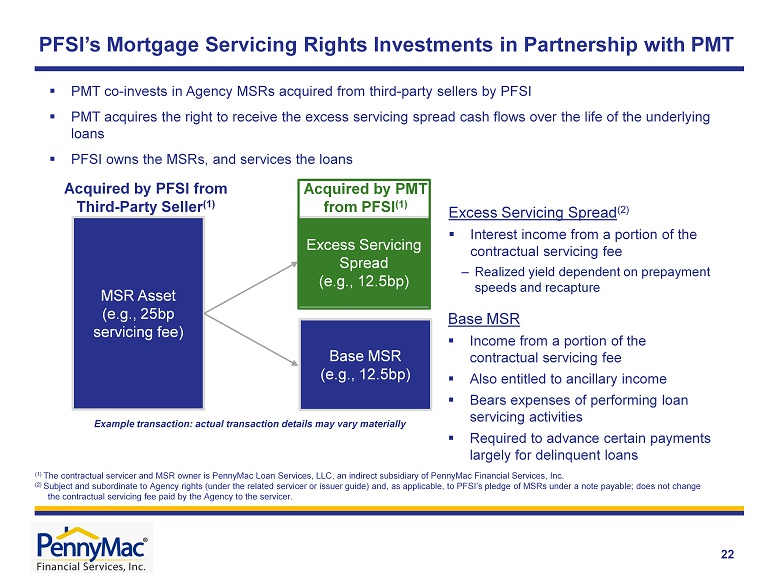
22 PFSI’s Mortgage Servicing Rights Investments in Partnership with PMT Excess Servicing Spread (e.g., 12.5bp) MSR Asset (e.g., 25bp servicing fee) Acquired by PFSI from Third - Party Seller (1) ▪ PMT co - invests in Agency MSRs acquired from third - party sellers by PFSI ▪ PMT acquires the right to receive the excess servicing spread cash flows over the life of the underlying loans ▪ PFSI owns the MSRs, and services the loans (1) The contractual servicer and MSR owner is PennyMac Loan Services, LLC, an indirect subsidiary of PennyMac Financial Services, Inc. (2) Subject and subordinate to Agency rights (under the related servicer or issuer guide ) and, as applicable, to PFSI’s pledge of MSRs under a note payable; does not change the contractual servicing fee paid by the Agency to the servicer. Excess Servicing Spread (2) ▪ Interest income from a portion of the contractual servicing fee – Realized yield dependent on prepayment speeds and recapture Base MSR ▪ Income from a portion of the contractual servicing fee ▪ Also entitled to ancillary income ▪ Bears expenses of performing loan servicing activities ▪ Required to advance certain payments largely for delinquent loans Base MSR (e.g., 12.5bp) Acquired by PMT from PFSI (1) Example transaction: actual transaction details may vary materially
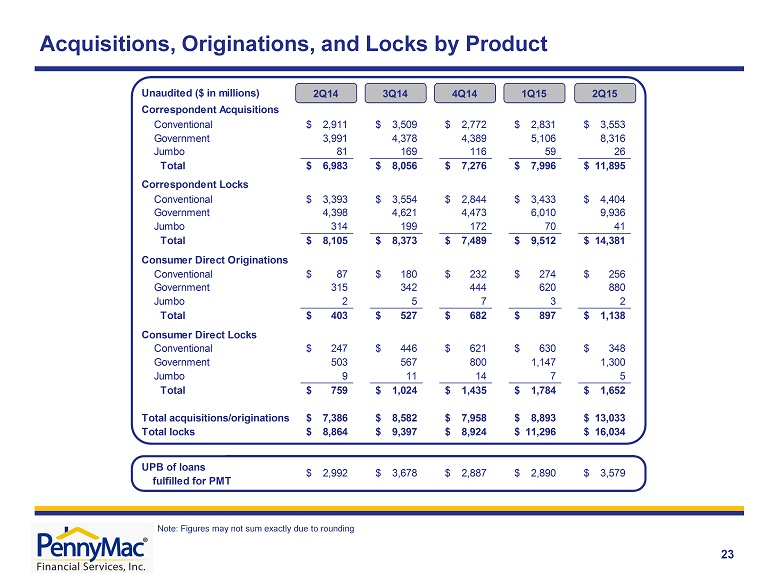
Unaudited ($ in millions) Correspondent Acquisitions Conventional 2,911$ 3,509$ 2,772$ 2,831$ 3,553$ Government 3,991 4,378 4,389 5,106 8,316 Jumbo 81 169 116 59 26 Total 6,983$ 8,056$ 7,276$ 7,996$ 11,895$ Correspondent Locks Conventional 3,393$ 3,554$ 2,844$ 3,433$ 4,404$ Government 4,398 4,621 4,473 6,010 9,936 Jumbo 314 199 172 70 41 Total 8,105$ 8,373$ 7,489$ 9,512$ 14,381$ Consumer Direct Originations Conventional 87$ 180$ 232$ 274$ 256$ Government 315 342 444 620 880 Jumbo 2 5 7 3 2 Total 403$ 527$ 682$ 897$ 1,138$ Consumer Direct Locks Conventional 247$ 446$ 621$ 630$ 348$ Government 503 567 800 1,147 1,300 Jumbo 9 11 14 7 5 Total 759$ 1,024$ 1,435$ 1,784$ 1,652$ Total acquisitions/originations 7,386$ 8,582$ 7,958$ 8,893$ 13,033$ Total locks 8,864$ 9,397$ 8,924$ 11,296$ 16,034$ UPB of loans fulfilled for PMT 3,579$ 2,890$ 2,887$ 3,678$ 2,992$ 2Q14 3Q14 4Q14 1Q15 2Q15 Acquisitions, Originations, and Locks by Product 23 Note: Figures may not sum exactly due to rounding