Attached files
| file | filename |
|---|---|
| 8-K - 8-K - ION GEOPHYSICAL CORP | a8k-2015xq2xearnings.htm |
| EX-10.1 - EXHIBIT 10.1 - ION GEOPHYSICAL CORP | ex101-ioncombinedfirstamen.htm |
| EX-99.1 - EXHIBIT 99.1 EARNINGS RELEASE - ION GEOPHYSICAL CORP | ex991earningsrelease2015-q2.htm |
ION Earnings Call – Q2 2015 Earnings Call Presentation August 6, 2015

Corporate Participants and Contact Information CONTACT INFORMATION If you have technical problems during the call, please contact DENNARD–LASCAR Associates at 713 529 6600. If you would like to view a replay of today's call, it will be available via webcast in the Investor Relations section of the Company's website at www.iongeo.com for approximately 12 months. BRIAN HANSON President and Chief Executive Officer STEVE BATE Executive Vice President and Chief Financial Officer 2
Forward-Looking Statements The information included herein contains forward-looking statements within the meaning of Section 27A of the Securities Act of 1933 and Section 21E of the Securities Exchange Act of 1934. Actual results may vary fundamentally from those described in these forward-looking statements. All forward-looking statements reflect numerous assumptions and involve a number of risks and uncertainties. These risks and uncertainties include risk factors that are disclosed by ION from time to time in its filings with the Securities and Exchange Commission. 3
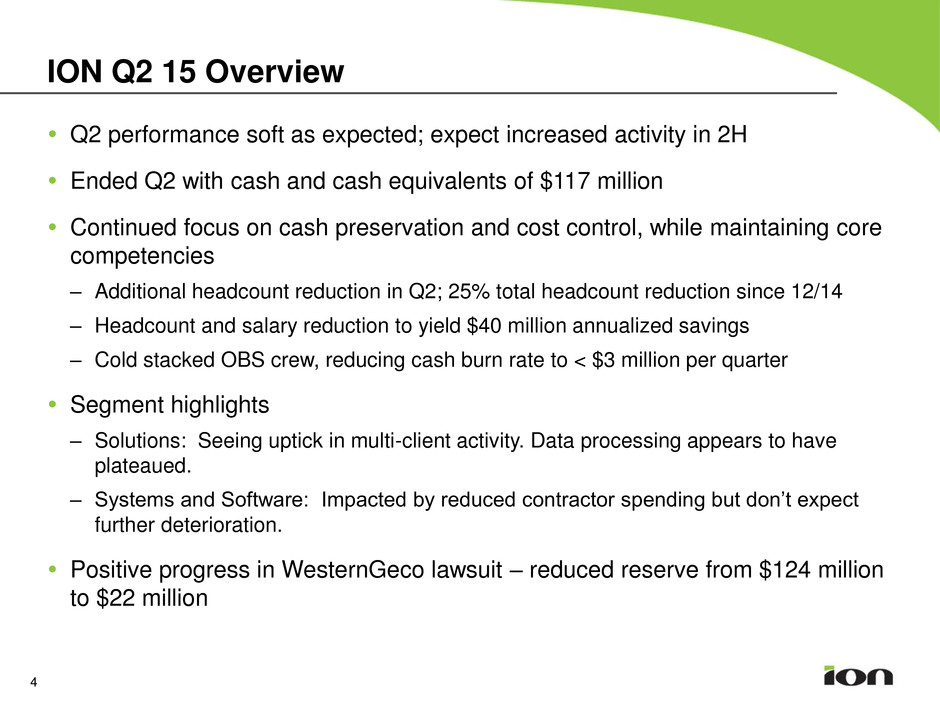
ION Q2 15 Overview Q2 performance soft as expected; expect increased activity in 2H Ended Q2 with cash and cash equivalents of $117 million Continued focus on cash preservation and cost control, while maintaining core competencies – Additional headcount reduction in Q2; 25% total headcount reduction since 12/14 – Headcount and salary reduction to yield $40 million annualized savings – Cold stacked OBS crew, reducing cash burn rate to < $3 million per quarter Segment highlights – Solutions: Seeing uptick in multi-client activity. Data processing appears to have plateaued. – Systems and Software: Impacted by reduced contractor spending but don’t expect further deterioration. Positive progress in WesternGeco lawsuit – reduced reserve from $124 million to $22 million 4
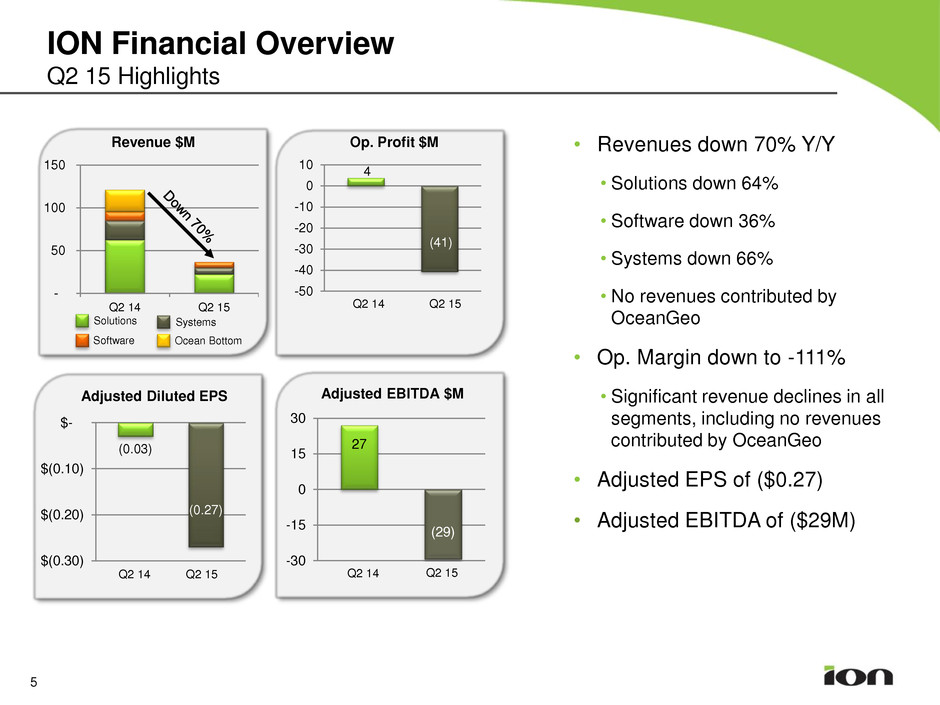
ION Financial Overview Q2 15 Highlights - 50 100 150 Q2 14 Q2 15 Software Systems Solutions Revenue $M Ocean Bottom 4 (41) -50 -40 -30 -20 -10 0 10 Op. Profit $M Q2 14 Q2 15 • Revenues down 70% Y/Y • Solutions down 64% • Software down 36% • Systems down 66% • No revenues contributed by OceanGeo • Op. Margin down to -111% • Significant revenue declines in all segments, including no revenues contributed by OceanGeo • Adjusted EPS of ($0.27) • Adjusted EBITDA of ($29M) (0.03) (0.27) $(0.30) $(0.20) $(0.10) $- Adjusted Diluted EPS Q2 14 Q2 15 27 (29) -30 -15 0 15 30 Adjusted EBITDA $M Q2 14 Q2 15 5
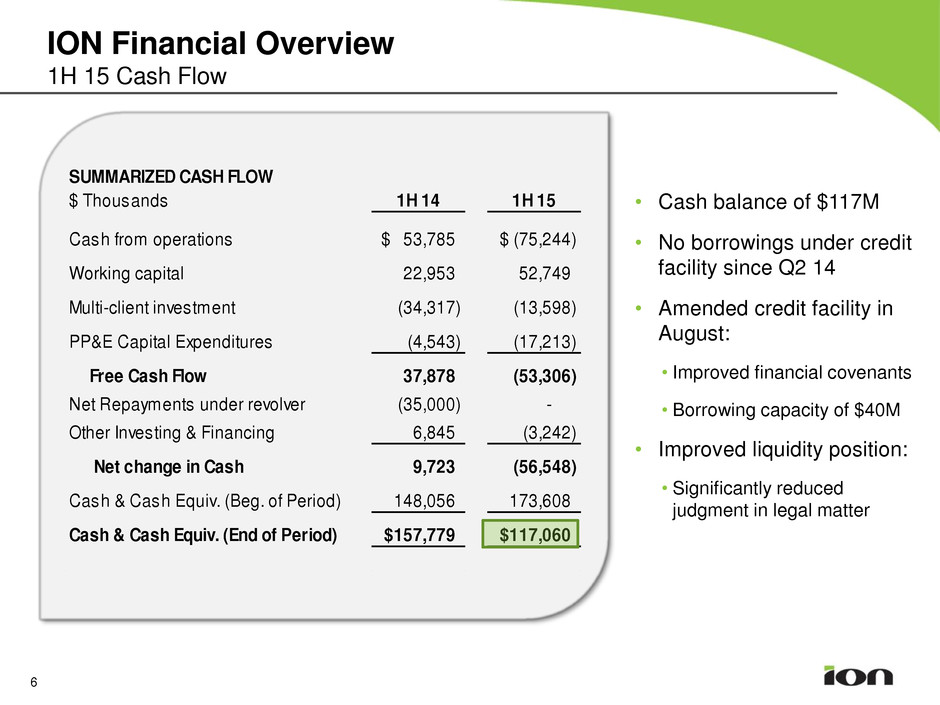
ION Financial Overview 1H 15 Cash Flow SUMMARIZED CASH FLOW $ Thousands 1H 14 1H 15 Cash from operations 53,785$ (75,244)$ Working capital 22,953 52,749 Multi-client investment (34,317) (13,598) PP&E Capital Expenditures (4,543) (17,213) Free Cash Flow 37,878 (53,306) Net Repayments under revolver (35,000) - Other Investing & Financing 6,845 (3,242) Net change in Cash 9,723 (56,548) Cash & Cash Equiv. (Beg. of Period) 148,056 173,608 Cash & Cash Equiv. (End of Period) 157,779$ 117,060$ 6 • Cash balance of $117M • No borrowings under credit facility since Q2 14 • Amended credit facility in August: • Improved financial covenants • Borrowing capacity of $40M • Improved liquidity position: • Significantly reduced judgment in legal matter
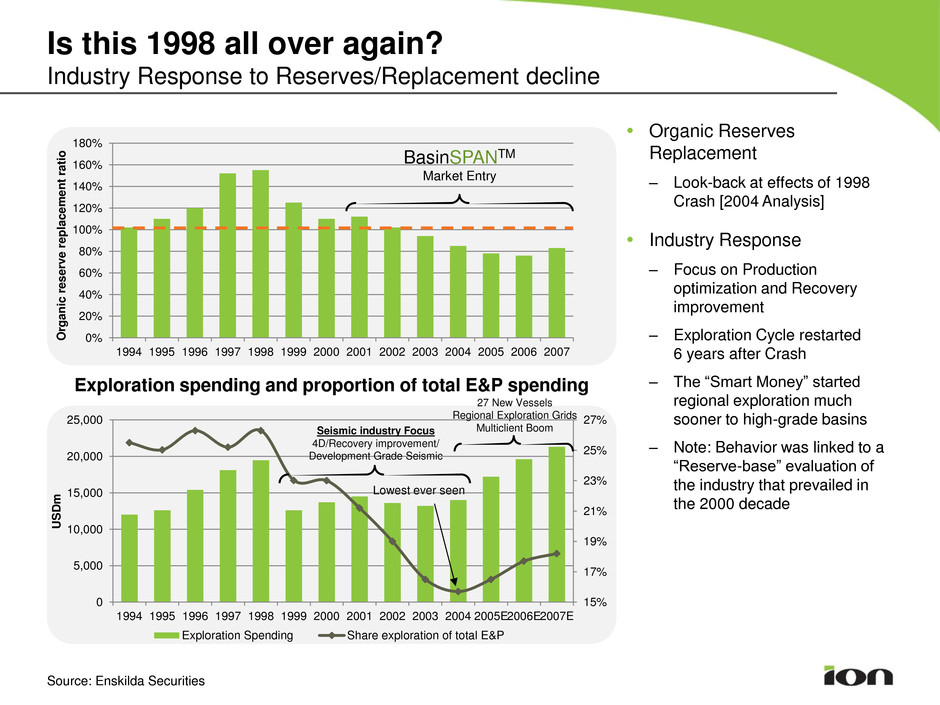
15% 17% 19% 21% 23% 25% 27% 0 5,000 10,000 15,000 20,000 25,000 1994 1995 1996 1997 1998 1999 2000 2001 2002 2003 2004 2005E2006E2007E US D m Exploration Spending Share exploration of total E&P Lowest ever seen 0% 20% 40% 60% 80% 100% 120% 140% 160% 180% 1994 1995 1996 1997 1998 1999 2000 2001 2002 2003 2004 2005 2006 2007 Is this 1998 all over again? Industry Response to Reserves/Replacement decline Organic Reserves Replacement – Look-back at effects of 1998 Crash [2004 Analysis] Industry Response – Focus on Production optimization and Recovery improvement – Exploration Cycle restarted 6 years after Crash – The “Smart Money” started regional exploration much sooner to high-grade basins – Note: Behavior was linked to a “Reserve-base” evaluation of the industry that prevailed in the 2000 decade Source: Enskilda Securities Seismic industry Focus 4D/Recovery improvement/ Development Grade Seismic 27 New Vessels Regional Exploration Grids Multiclient Boom BasinSPANTM Market Entry Exploration spending and proportion of total E&P spending O rg a n ic re s e rv e r e p la c e m e nt rat io
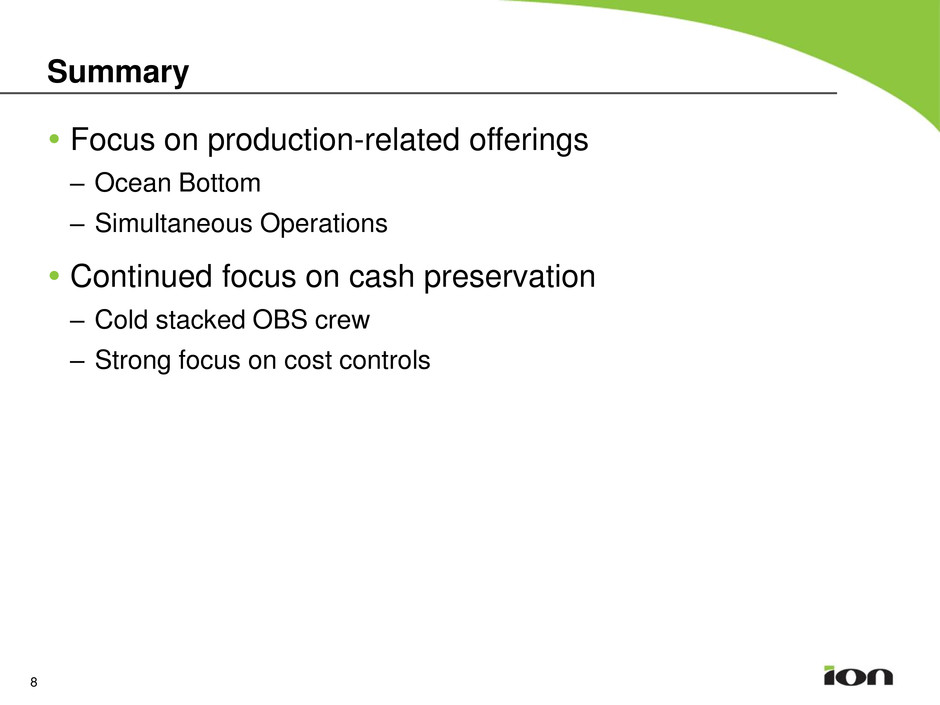
Summary Focus on production-related offerings – Ocean Bottom – Simultaneous Operations Continued focus on cash preservation – Cold stacked OBS crew – Strong focus on cost controls 8

9 Q&A
