Attached files
| file | filename |
|---|---|
| 8-K - 8-K - CF Industries Holdings, Inc. | a15-17045_18k.htm |
Exhibit 99.1
|
|
2015 Second Quarter Financial Results August 5, 2015 NYSE: CF |
|
|
Safe Harbor Statement All statements in this communication, other than those relating to historical facts, are “forward-looking statements.” These forward-looking statements are not guarantees of future performance and are subject to a number of assumptions, risks and uncertainties, many of which are beyond our control, which could cause actual results to differ materially from such statements. These statements include, but are not limited to, statements about future strategic plans; and statements about future financial and operating results. Important factors that could cause actual results to differ materially from our expectations include, among others: the volatility of natural gas prices in North America and the United Kingdom; the cyclical nature of our business and the agricultural sector; the global commodity nature of our fertilizer products, the impact of global supply and demand on our selling prices, and the intense global competition from other fertilizer producers; conditions in the U.S. and U.K. agricultural industry; difficulties in securing the supply and delivery of raw materials, increases in their costs or delays or interruptions in their delivery; reliance on third party providers of transportation services and equipment; the significant risks and hazards involved in producing and handling our products against which we may not be fully insured; risks associated with cyber security; weather conditions; our ability to complete our production capacity expansion projects on schedule as planned and on budget or at all; an inability to achieve, or delay in achieving, the expected benefits of the GrowHow transaction as contemplated; risks associated with other expansions of our business, including unanticipated adverse consequences and the significant resources that could be required; potential liabilities and expenditures related to environmental and health and safety laws and regulations; our potential inability to obtain or maintain required permits and governmental approvals or to meet financial assurance requirements from governmental authorities; future regulatory restrictions and requirements related to greenhouse gas emissions; the seasonality of the fertilizer business; the impact of changing market conditions on our forward sales programs; risks involving derivatives and the effectiveness of our risk measurement and hedging activities; our reliance on a limited number of key facilities; risks associated with joint ventures; acts of terrorism and regulations to combat terrorism; risks associated with international operations; losses on our investments in securities; deterioration of global market and economic conditions; and our ability to manage our indebtedness. More detailed information about factors that may affect our performance may be found in our filings with the Securities and Exchange Commission, including our most recent periodic reports filed on Form 10-K and Form 10-Q, which are available in the Investor Relations section of the CF Industries website. Forward-looking statements are given only as of the date of this release and we disclaim any obligation to update or revise the forward-looking statements, whether as a result of new information, future events or otherwise, except as required by law. 2 |
|
|
3 Record safety performance: lowest ever 12-month recordable incidence rate of 0.89 During the first six months of 2015, ammonia plants ran at system-wide capacity utilization rate of 99 percent while six ammonia terminals set distribution records Continued cost advantage of low price North American natural gas; full-year average price not over $4.00 until 2023 Donaldsonville and Port Neal expansion projects progressing well and capital cost in-line with $4.2 billion forecast, plus or minus a few percentage points Second Quarter Strong Performance Growth On Track See slide 18 for reconciliation of EBITDA. Strong Operating Performance in Second Quarter EBITDA(1) of $670 million and net earnings of $352 million, or $1.49 per diluted share Forward order book reflects confidence of retailers/dealers in the spring 2016 planting season Repurchased 4.5 million shares, and an additional 358,000 subsequent to quarter end, bringing the total shares outstanding down to 233.0 million Focused portfolio: closed acquisition of remaining GrowHow interest; divested KeyTrade and Houston ammonia terminal interests |
|
|
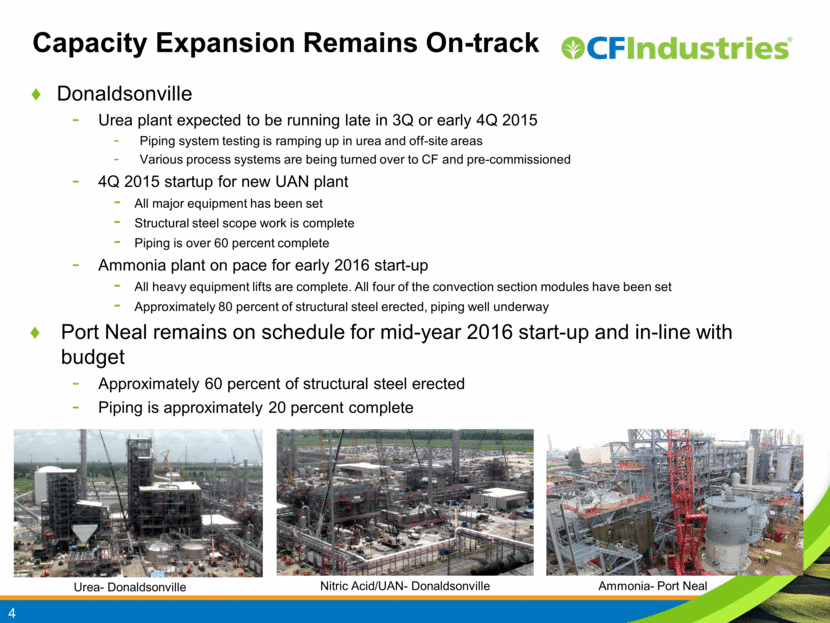
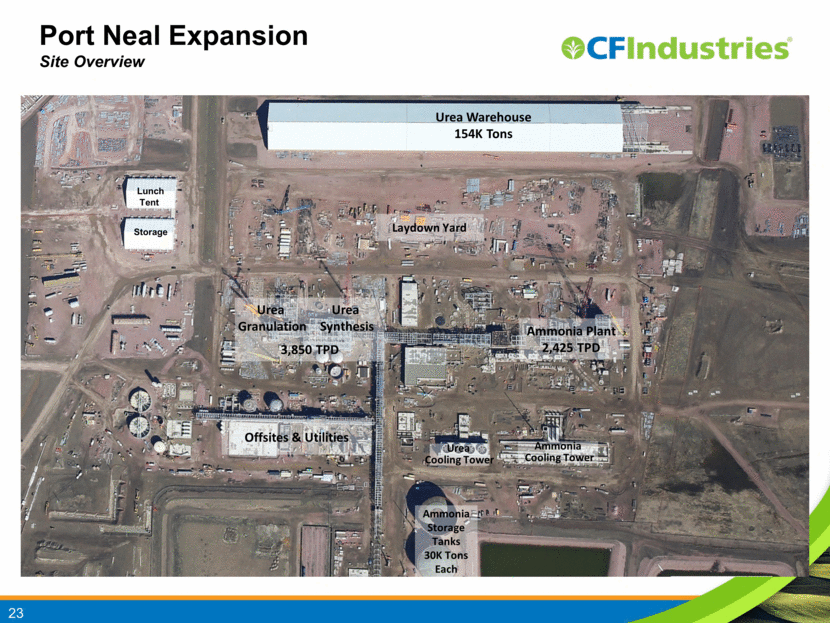
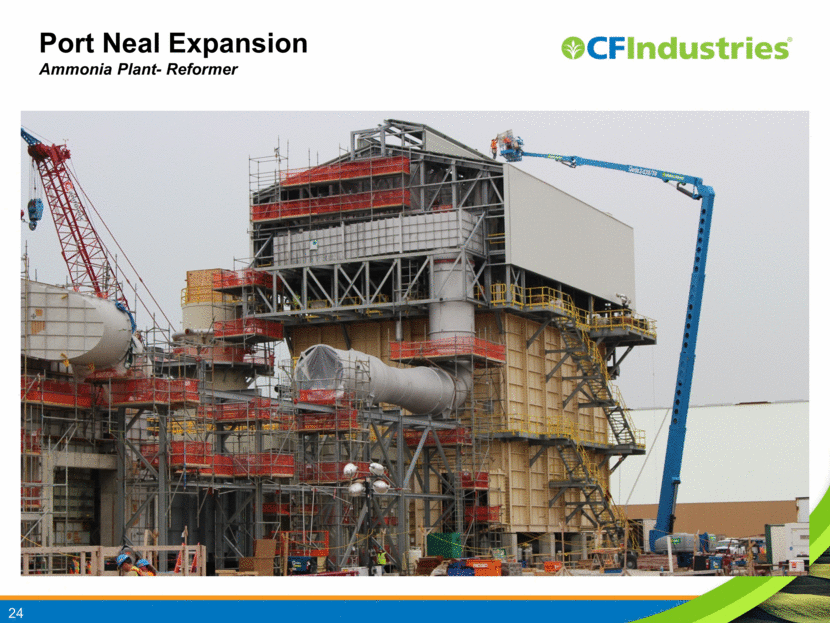
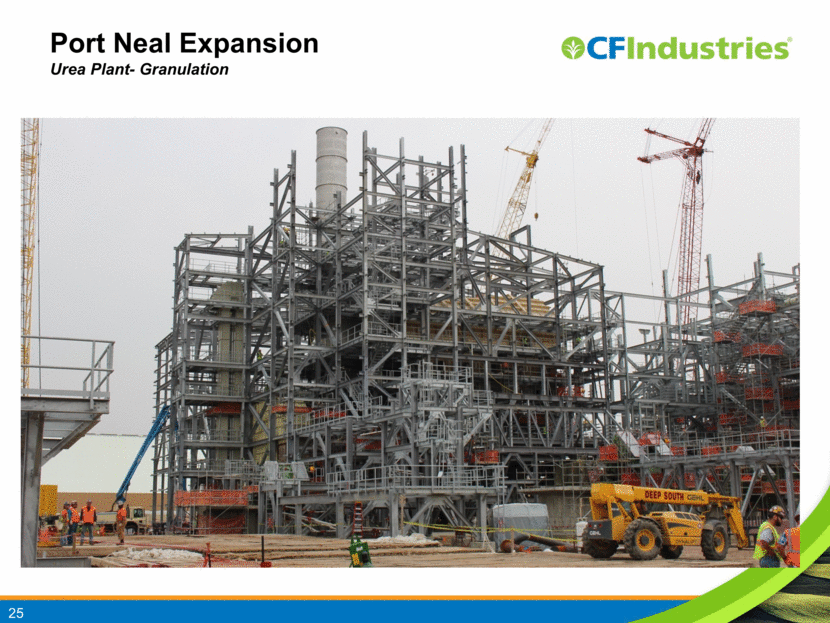
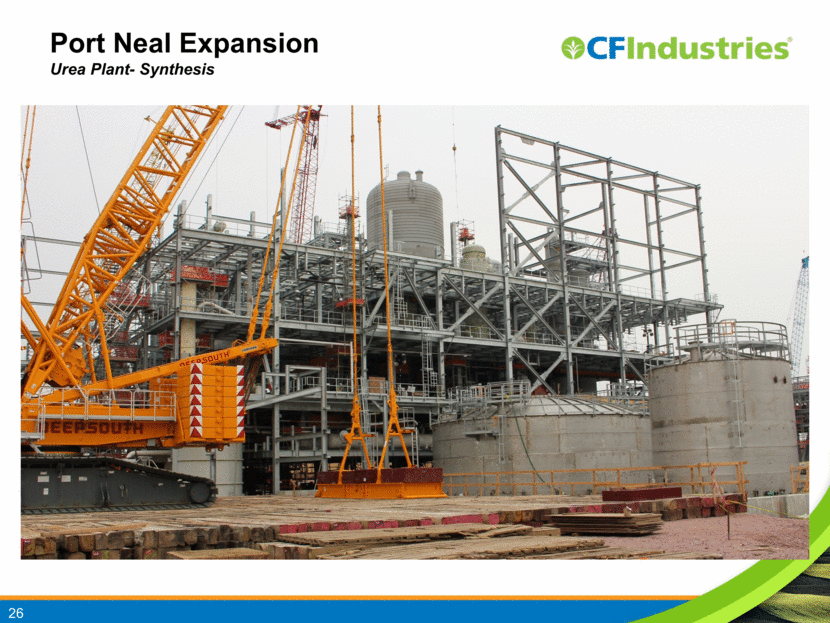
Capacity Expansion Remains On-track Donaldsonville Urea plant expected to be running late in 3Q or early 4Q 2015 Piping system testing is ramping up in urea and off-site areas Various process systems are being turned over to CF and pre-commissioned 4Q 2015 startup for new UAN plant All major equipment has been set Structural steel scope work is complete Piping is over 60 percent complete Ammonia plant on pace for early 2016 start-up All heavy equipment lifts are complete. All four of the convection section modules have been set Approximately 80 percent of structural steel erected, piping well underway Port Neal remains on schedule for mid-year 2016 start-up and in-line with budget Approximately 60 percent of structural steel erected Piping is approximately 20 percent complete 4 Urea- Donaldsonville Nitric Acid/UAN- Donaldsonville Ammonia- Port Neal |
|
|
Nitrogen Market Outlook 5 Recent movement in corn prices has improved 2016 planting economics 2016 corn planted acres estimated at 89.5M acres, up modestly from 88.9M acres in 2015, as corn returns are better than soybeans Farmers continue to have strong liquidity Nitrogen market expected to be long in the second half of 2015 due to new capacity coming online and continued pressure from Chinese exports Urea prices expected to trade around the floor level of Chinese anthracite-based urea producers, equivalent to $260 to $300 per ton at the U.S. Gulf. Continued substantial margin opportunity for North American nitrogen producers North American ammonia market supported by good pre-pay demand, indicating expectation of robust pre-plant application for fall season UAN market supported by strong fill demand for second half suggesting dealer/retailer optimism for a strong spring season |
|
|
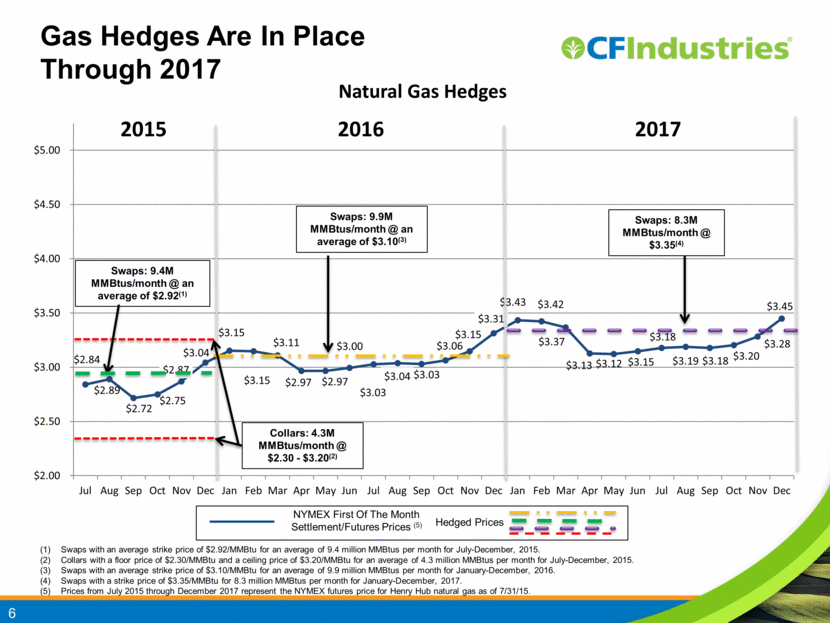
Gas Hedges Are In Place Through 2017 6 NYMEX First Of The Month Settlement/Futures Prices (5) Hedged Prices Swaps with an average strike price of $2.92/MMBtu for an average of 9.4 million MMBtus per month for July-December, 2015. Collars with a floor price of $2.30/MMBtu and a ceiling price of $3.20/MMBtu for an average of 4.3 million MMBtus per month for July-December, 2015. Swaps with an average strike price of $3.10/MMBtu for an average of 9.9 million MMBtus per month for January-December, 2016. Swaps with a strike price of $3.35/MMBtu for 8.3 million MMBtus per month for January-December, 2017. Prices from July 2015 through December 2017 represent the NYMEX futures price for Henry Hub natural gas as of 7/31/15. Swaps: 9.4M MMBtus/month @ an average of $2.92(1) Collars: 4.3M MMBtus/month @ $2.30 - $3.20(2) $2.84 $2.89 $2.72 $2.75 $2.87 $3.04 $3.15 $3.15 $3.11 $2.97 $2.97 $3.00 $3.03 $3.04 $3.03 $3.06 $3.15 $3.31 $3.43 $3.42 $3.37 $3.13 $3.12 $3.15 $3.18 $3.19 $3.18 $3.20 $3.28 $3.45 $2.00 $2.50 $3.00 $3.50 $4.00 $4.50 $5.00 Jul Aug Sep Oct Nov Dec Jan Feb Mar Apr May Jun Jul Aug Sep Oct Nov Dec Jan Feb Mar Apr May Jun Jul Aug Sep Oct Nov Dec Natural Gas Hedges 2015 2016 Swaps: 9.9M MMBtus /month @ an average of $3.10 (3) 2017 Swaps: 8.3M MMBtus/month @ $3.35 (4) |
|
|
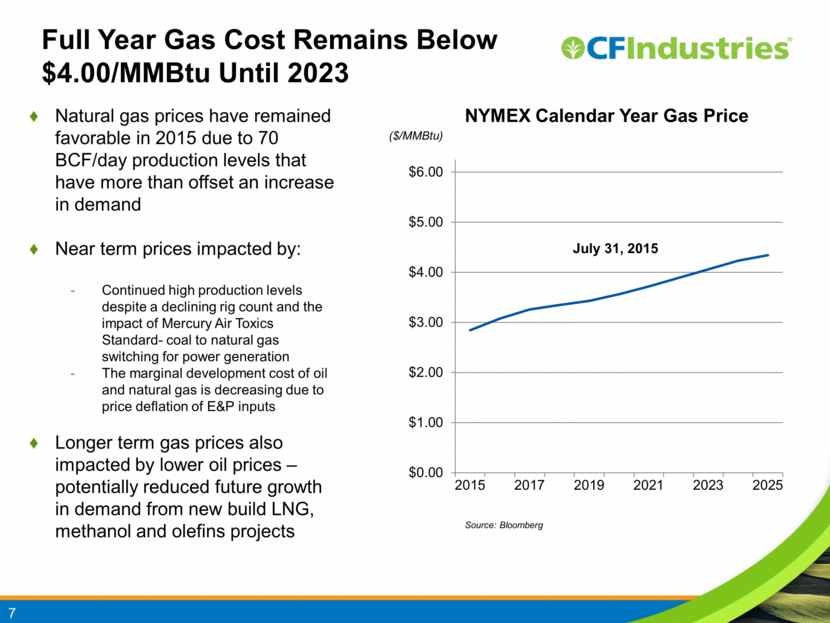
7 Full Year Gas Cost Remains Below $4.00/MMBtu Until 2023 Natural gas prices have remained favorable in 2015 due to 70 BCF/day production levels that have more than offset an increase in demand Near term prices impacted by: Continued high production levels despite a declining rig count and the impact of Mercury Air Toxics Standard- coal to natural gas switching for power generation The marginal development cost of oil and natural gas is decreasing due to price deflation of E&P inputs Longer term gas prices also impacted by lower oil prices – potentially reduced future growth in demand from new build LNG, methanol and olefins projects NYMEX Calendar Year Gas Price ($/MMBtu) Source: Bloomberg $0.00 $1.00 $2.00 $3.00 $4.00 $5.00 $6.00 2015 2017 2019 2021 2023 2025 July 31, 2015 |
|
|
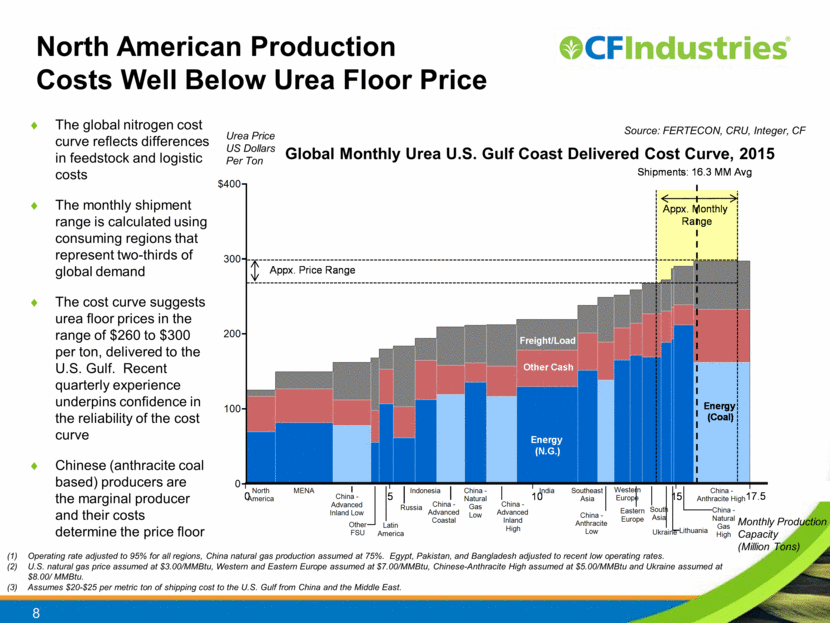
The global nitrogen cost curve reflects differences in feedstock and logistic costs The monthly shipment range is calculated using consuming regions that represent two-thirds of global demand The cost curve suggests urea floor prices in the range of $260 to $300 per ton, delivered to the U.S. Gulf. Recent quarterly experience underpins confidence in the reliability of the cost curve Chinese (anthracite coal based) producers are the marginal producer and their costs determine the price floor North American Production Costs Well Below Urea Floor Price Source: FERTECON, CRU, Integer, CF Monthly Production Capacity (Million Tons) Urea Price US Dollars Per Ton Global Monthly Urea U.S. Gulf Coast Delivered Cost Curve, 2015 8 Operating rate adjusted to 95% for all regions, China natural gas production assumed at 75%. Egypt, Pakistan, and Bangladesh adjusted to recent low operating rates. U.S. natural gas price assumed at $3.00/MMBtu, Western and Eastern Europe assumed at $7.00/MMBtu, Chinese-Anthracite High assumed at $5.00/MMBtu and Ukraine assumed at $8.00/ MMBtu. Assumes $20-$25 per metric ton of shipping cost to the U.S. Gulf from China and the Middle East. 0 100 200 300 $400 North America MENA Indonesia China - Natural Gas Low India Southeast Asia China - Anthracite High China - Advanced Inland Low Other FSU Latin America Russia China - Advanced Coastal China - Advanced Inland High China - Anthracite Low Western Europe Eastern Europe South Asia Ukraine Lithuania China - Natural Gas High Energy (Coal) Energy (N.G.) Other Cash Shipments: 16.3 MM Avg Appx . Monthly Range Freight/Load Appx . Price Range 0 5 10 15 20 21 17.5 |
|
|
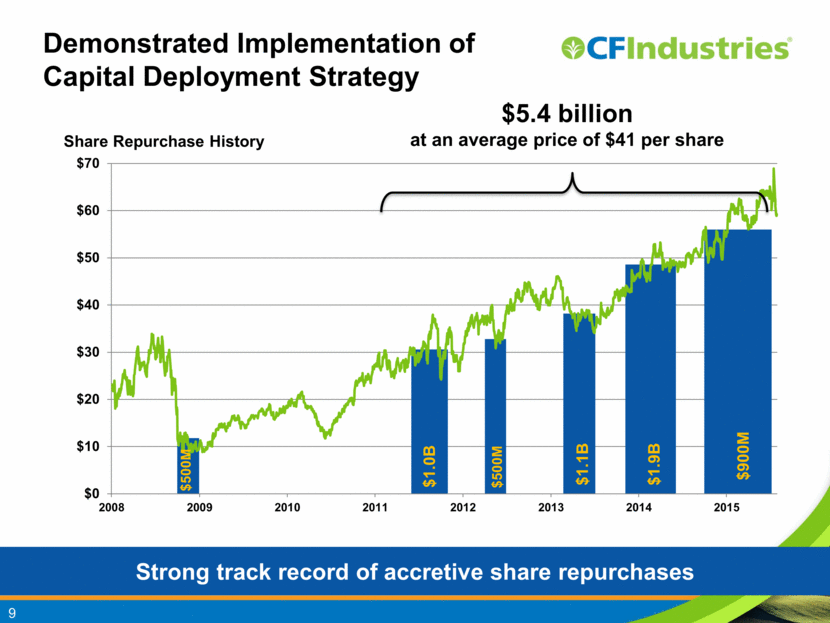
9 Strong track record of accretive share repurchases Demonstrated Implementation of Capital Deployment Strategy Share Repurchase History $5.4 billion at an average price of $41 per share $0 $10 $20 $30 $40 $50 $60 $70 2008 2009 2010 2011 2012 2013 2014 2015 $500M $1.9B $1.1B $500M $1.0B $900M |
|
|
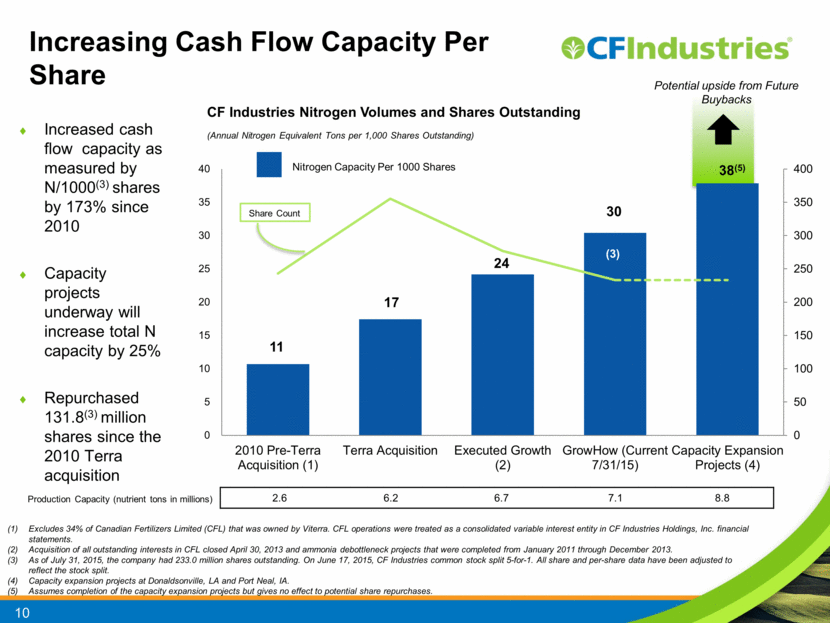
10 (Annual Nitrogen Equivalent Tons per 1,000 Shares Outstanding) Increasing Cash Flow Capacity Per Share Nitrogen Capacity Per 1000 Shares Potential upside from Future Buybacks (3) Increased cash flow capacity as measured by N/1000(3) shares by 173% since 2010 Capacity projects underway will increase total N capacity by 25% Repurchased 131.8(3) million shares since the 2010 Terra acquisition CF Industries Nitrogen Volumes and Shares Outstanding Excludes 34% of Canadian Fertilizers Limited (CFL) that was owned by Viterra. CFL operations were treated as a consolidated variable interest entity in CF Industries Holdings, Inc. financial statements. Acquisition of all outstanding interests in CFL closed April 30, 2013 and ammonia debottleneck projects that were completed from January 2011 through December 2013. As of July 31, 2015, the company had 233.0 million shares outstanding. On June 17, 2015, CF Industries common stock split 5-for-1. All share and per-share data have been adjusted to reflect the stock split. Capacity expansion projects at Donaldsonville, LA and Port Neal, IA. Assumes completion of the capacity expansion projects but gives no effect to potential share repurchases. 2.6 6.2 6.7 7.1 8.8 Production Capacity (nutrient tons in millions) 11 17 24 30 38 (5) 0 50 100 150 200 250 300 350 400 0 5 10 15 20 25 30 35 40 2010 Pre-Terra Acquisition (1) Terra Acquisition Executed Growth (2) GrowHow (Current 7/31/15) Capacity Expansion Projects (4) Share Count |
|
|
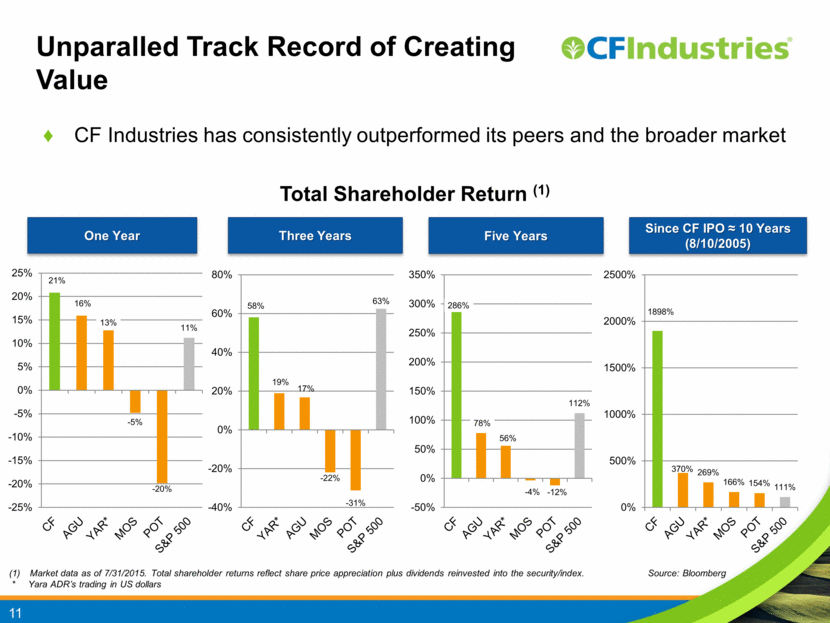
CF Industries has consistently outperformed its peers and the broader market Market data as of 7/31/2015. Total shareholder returns reflect share price appreciation plus dividends reinvested into the security/index. Source: Bloomberg * Yara ADR’s trading in US dollars Five Years One Year Total Shareholder Return (1) Since CF IPO 10 Years (8/10/2005) Three Years 11 Unparalled Track Record of Creating Value 1898% 370% 269% 166% 154% 111% 0% 500% 1000% 1500% 2000% 2500% 286% 78% 56% - 4% - 12% 112% -50% 0% 50% 100% 150% 200% 250% 300% 350% 58% 19% 17% - 22% - 31% 63% -40% -20% 0% 20% 40% 60% 80% 21% 16% 13% - 5% - 20% 11% -25% -20% -15% -10% -5% 0% 5% 10% 15% 20% 25% |
|
|
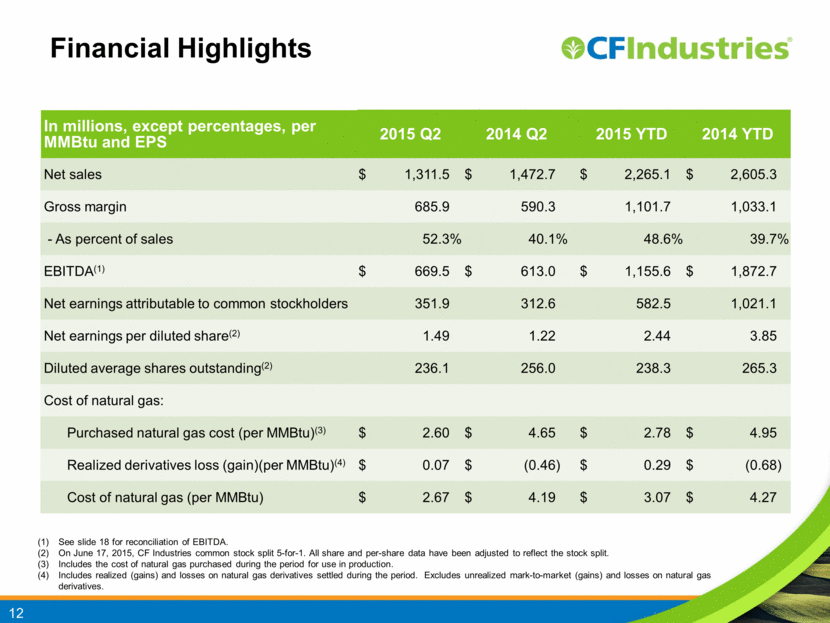
Financial Highlights See slide 18 for reconciliation of EBITDA. On June 17, 2015, CF Industries common stock split 5-for-1. All share and per-share data have been adjusted to reflect the stock split. Includes the cost of natural gas purchased during the period for use in production. Includes realized (gains) and losses on natural gas derivatives settled during the period. Excludes unrealized mark-to-market (gains) and losses on natural gas derivatives. 12 In millions, except percentages, per MMBtu and EPS 2015 Q2 2015 Q2 2014 Q2 2014 Q2 2015 YTD 2015 YTD 2014 YTD 2014 YTD Net sales $ 1,311.5 $ 1,472.7 $ 2,265.1 $ 2,605.3 Gross margin 685.9 590.3 1,101.7 1,033.1 - As percent of sales 52.3 % 40.1 % 48.6 % 39.7 % EBITDA(1) $ 669.5 $ 613.0 $ 1,155.6 $ 1,872.7 Net earnings attributable to common stockholders 351.9 312.6 582.5 1,021.1 Net earnings per diluted share(2) 1.49 1.22 2.44 3.85 Diluted average shares outstanding(2) 236.1 256.0 238.3 265.3 Cost of natural gas: Purchased natural gas cost (per MMBtu)(3) $ 2.60 $ 4.65 $ 2.78 $ 4.95 Realized derivatives loss (gain)(per MMBtu)(4) $ 0.07 $ (0.46 ) $ 0.29 $ (0.68 ) Cost of natural gas (per MMBtu) $ 2.67 $ 4.19 $ 3.07 $ 4.27 |
|
|
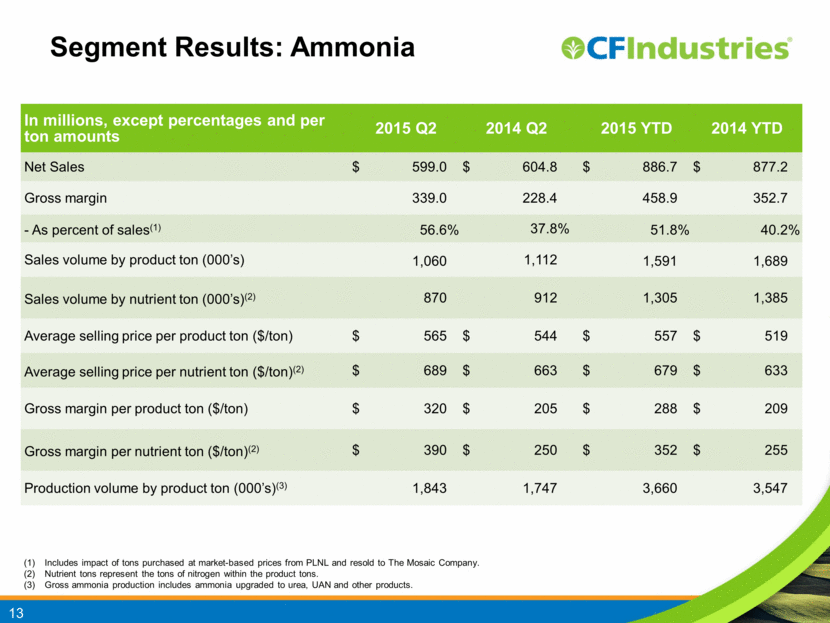
Segment Results: Ammonia 13 Includes impact of tons purchased at market-based prices from PLNL and resold to The Mosaic Company. Nutrient tons represent the tons of nitrogen within the product tons. Gross ammonia production includes ammonia upgraded to urea, UAN and other products. In millions, except percentages and per ton amounts 2015 Q2 2014 Q2 2015 YTD 2014 YTD Net Sales $ 599.0 $ 604.8 $ 886.7 $ 877.2 Gross margin 339.0 228.4 458.9 352.7 - As percent of sales(1) 56.6 % 37.8 % 51.8 % 40.2 % Sales volume by product ton (000’s) 1,060 1,112 1,591 1,689 Sales volume by nutrient ton (000’s)(2) 870 912 1,305 1,385 Average selling price per product ton ($/ton) $ 565 $ 544 $ 557 $ 519 Average selling price per nutrient ton ($/ton)(2) $ 689 $ 663 $ 679 $ 633 Gross margin per product ton ($/ton) $ 320 $ 205 $ 288 $ 209 Gross margin per nutrient ton ($/ton)(2) $ 390 $ 250 $ 352 $ 255 Production volume by product ton (000’s)(3) 1,843 1,747 3,660 3,547 |
|
|
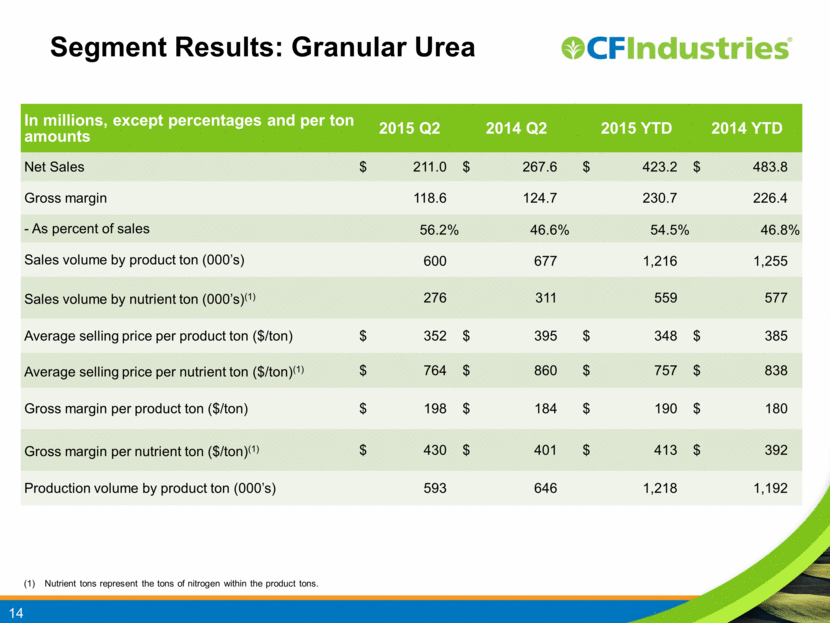
Segment Results: Granular Urea 14 Nutrient tons represent the tons of nitrogen within the product tons. In millions, except percentages and per ton amounts 2015 Q2 2014 Q2 2015 YTD 2014 YTD Net Sales $ 211.0 $ 267.6 $ 423.2 $ 483.8 Gross margin 118.6 124.7 230.7 226.4 - As percent of sales 56.2 % 46.6 % 54.5 % 46.8 % Sales volume by product ton (000’s) 600 677 1,216 1,255 Sales volume by nutrient ton (000’s)(1) 276 311 559 577 Average selling price per product ton ($/ton) $ 352 $ 395 $ 348 $ 385 Average selling price per nutrient ton ($/ton)(1) $ 764 $ 860 $ 757 $ 838 Gross margin per product ton ($/ton) $ 198 $ 184 $ 190 $ 180 Gross margin per nutrient ton ($/ton)(1) $ 430 $ 401 $ 413 $ 392 Production volume by product ton (000’s) 593 646 1,218 1,192 |
|
|
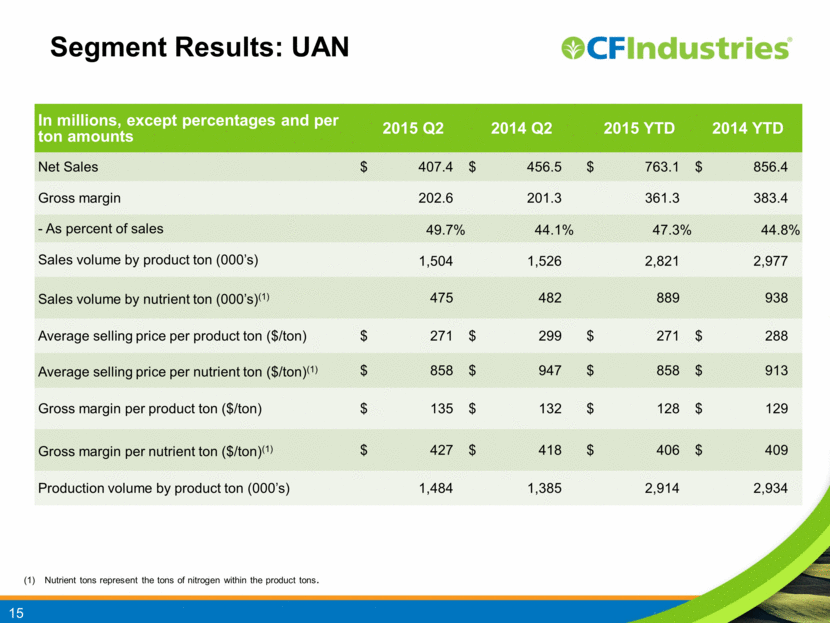
Segment Results: UAN 15 Nutrient tons represent the tons of nitrogen within the product tons. In millions, except percentages and per ton amounts 2015 Q2 2014 Q2 2015 YTD 2014 YTD Net Sales $ 407.4 $ 456.5 $ 763.1 $ 856.4 Gross margin 202.6 201.3 361.3 383.4 - As percent of sales 49.7 % 44.1 % 47.3 % 44.8 % Sales volume by product ton (000’s) 1,504 1,526 2,821 2,977 Sales volume by nutrient ton (000’s)(1) 475 482 889 938 Average selling price per product ton ($/ton) $ 271 $ 299 $ 271 $ 288 Average selling price per nutrient ton ($/ton)(1) $ 858 $ 947 $ 858 $ 913 Gross margin per product ton ($/ton) $ 135 $ 132 $ 128 $ 129 Gross margin per nutrient ton ($/ton)(1) $ 427 $ 418 $ 406 $ 409 Production volume by product ton (000’s) 1,484 1,385 2,914 2,934 |
|
|
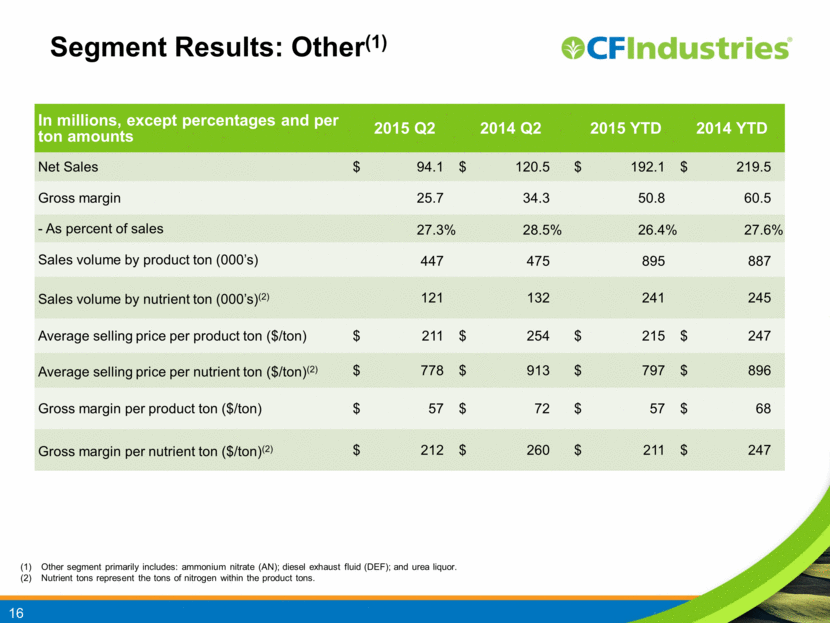
Segment Results: Other(1) 16 Other segment primarily includes: ammonium nitrate (AN); diesel exhaust fluid (DEF); and urea liquor. Nutrient tons represent the tons of nitrogen within the product tons. In millions, except percentages and per ton amounts 2015 Q2 2014 Q2 2015 YTD 2014 YTD Net Sales $ 94.1 $ 120.5 $ 192.1 $ 219.5 Gross margin 25.7 34.3 50.8 60.5 - As percent of sales 27.3 % 28.5 % 26.4 % 27.6 % Sales volume by product ton (000’s) 447 475 895 887 Sales volume by nutrient ton (000’s)(2) 121 132 241 245 Average selling price per product ton ($/ton) $ 211 $ 254 $ 215 $ 247 Average selling price per nutrient ton ($/ton)(2) $ 778 $ 913 $ 797 $ 896 Gross margin per product ton ($/ton) $ 57 $ 72 $ 57 $ 68 Gross margin per nutrient ton ($/ton)(2) $ 212 $ 260 $ 211 $ 247 |
|
|
For more information, please visit www.cfindustries.com 17 |
|
|
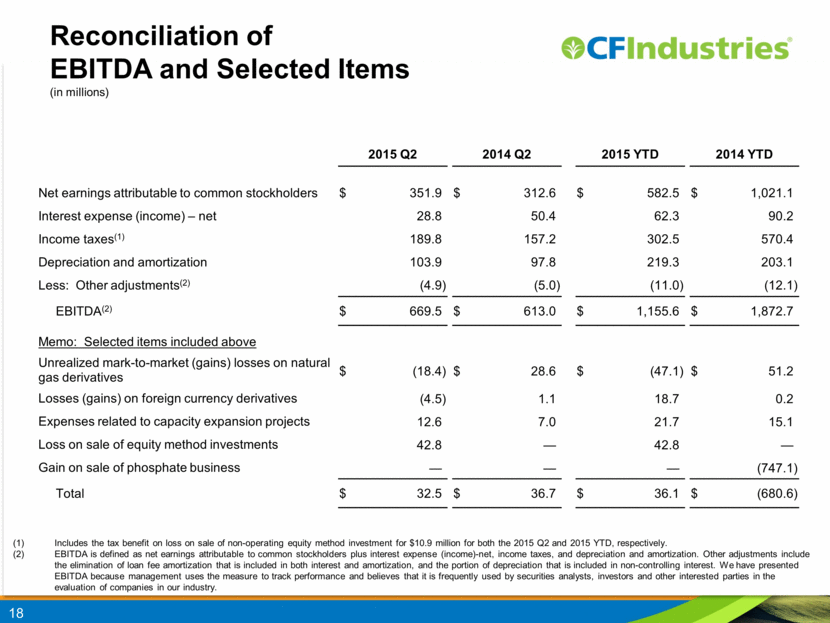
Reconciliation of EBITDA and Selected Items (in millions) 18 Includes the tax benefit on loss on sale of non-operating equity method investment for $10.9 million for both the 2015 Q2 and 2015 YTD, respectively. EBITDA is defined as net earnings attributable to common stockholders plus interest expense (income)-net, income taxes, and depreciation and amortization. Other adjustments include the elimination of loan fee amortization that is included in both interest and amortization, and the portion of depreciation that is included in non-controlling interest. We have presented EBITDA because management uses the measure to track performance and believes that it is frequently used by securities analysts, investors and other interested parties in the evaluation of companies in our industry. 2015 Q2 2014 Q2 2015 YTD 2014 YTD Net earnings attributable to common stockholders $ 351.9 $ 312.6 $ 582.5 $ 1,021.1 Interest expense (income) – net 28.8 50.4 62.3 90.2 Income taxes(1) 189.8 157.2 302.5 570.4 Depreciation and amortization 103.9 97.8 219.3 203.1 Less: Other adjustments(2) (4.9 ) (5.0 ) (11.0 ) (12.1 ) EBITDA(2) $ 669.5 $ 613.0 $ 1,155.6 $ 1,872.7 Memo: Selected items included above Unrealized mark-to-market (gains) losses on natural gas derivatives $ (18.4 ) $ 28.6 $ (47.1 ) $ 51.2 Losses (gains) on foreign currency derivatives (4.5 ) 1.1 18.7 0.2 Expenses related to capacity expansion projects 12.6 7.0 21.7 15.1 Loss on sale of equity method investments 42.8 — 42.8 — Gain on sale of phosphate business — — — (747.1 ) Total $ 32.5 $ 36.7 $ 36.1 $ (680.6 ) |
|
|
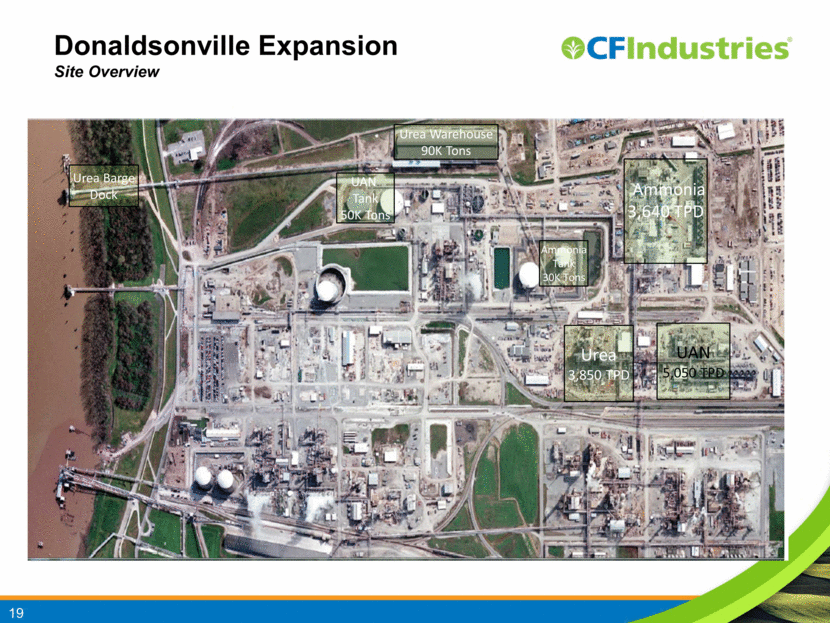
19 Donaldsonville Expansion Site Overview Urea Warehouse 90K Tons UAN Tank 50K Tons Ammonia 3,640 TPD Ammonia Tank 30K Tons UAN 5,050 TPD Urea 3,850 TPD Urea Barge Dock |
|
|
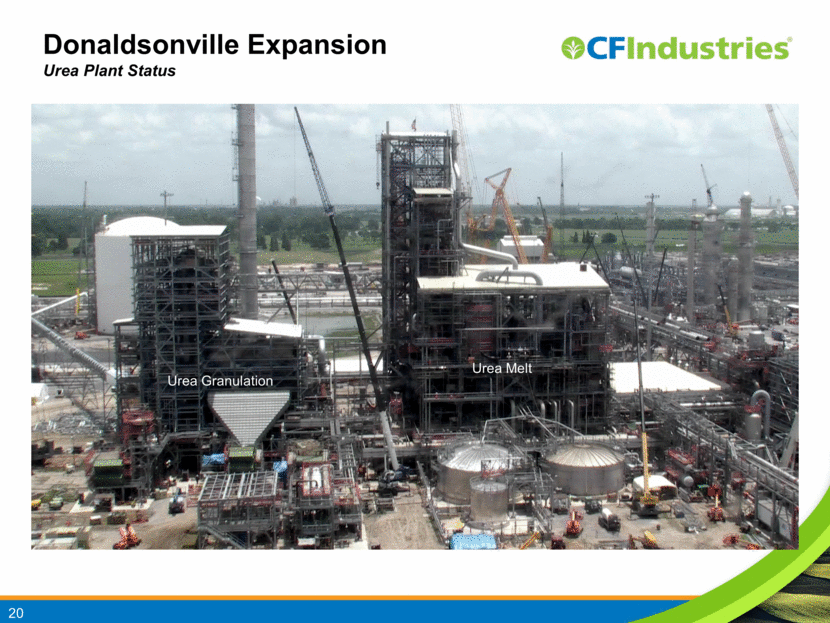
Donaldsonville Expansion Urea Plant Status Granulation Area Urea Melt Urea Granulation Urea Melt 20 Urea Granulation Urea Melt |
|
|
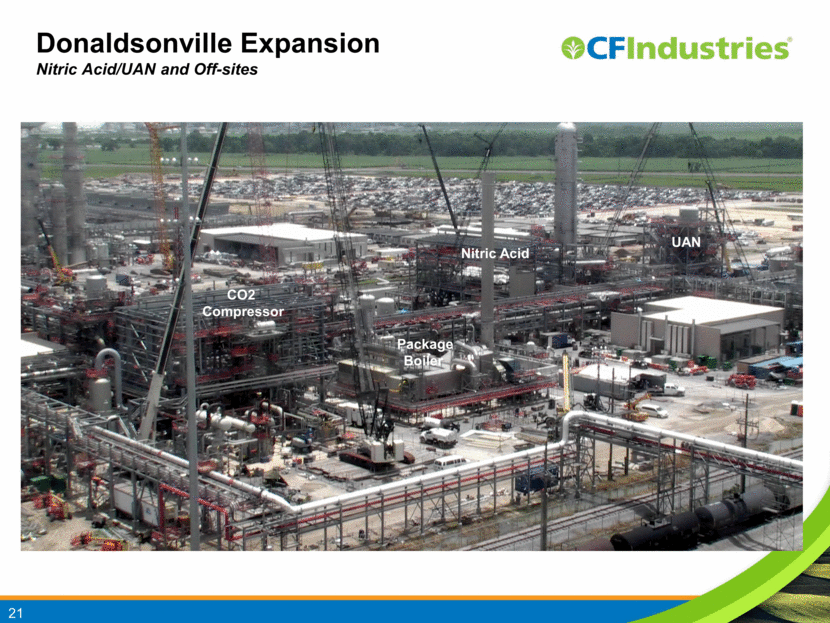
Donaldsonville Expansion Nitric Acid/UAN and Off-sites CO2 Compression Package Boiler Cooling Tower Nitric Acid UAN 21 |
|
|
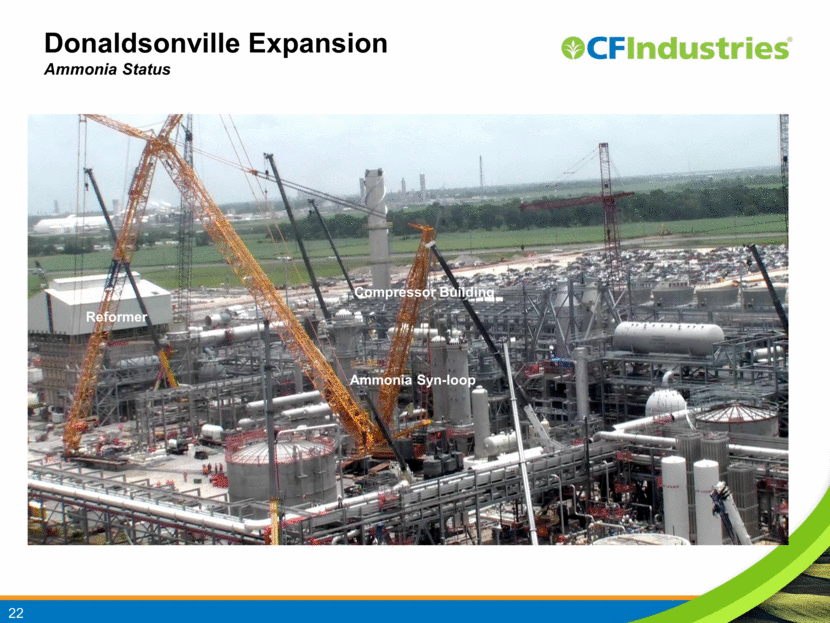
22 Donaldsonville Expansion Ammonia Status Reformer Compressor Building Ammonia Syn-loop |
|
|
Port Neal Expansion Site Overview Urea Warehouse 154K Tons Laydown Yard Urea Granulation 3,850 TPD Urea Synthesis Ammonia Plant 2,425 TPD Ammonia Cooling Tower Urea Cooling Tower Ammonia Storage Tanks 30K Tons Each Offsites & Utilities Lunch Tent Storage 23 |
|
|
Port Neal Expansion Ammonia Plant- Reformer 24 |
|
|
25 Port Neal Expansion Urea Plant- Granulation Granulation Synthesis |
|
|
26 Port Neal Expansion Urea Plant- Synthesis Granulation Synthesis |

