Attached files
| file | filename |
|---|---|
| 8-K - 8-K - PERDOCEO EDUCATION Corp | d39487d8k.htm |
| EX-99.1 - EX-99.1 - PERDOCEO EDUCATION Corp | d39487dex991.htm |
 CAREER
EDUCATION CORPORATION SECOND QUARTER 2015
INVESTOR CONFERENCE CALL
AUGUST 7, 2015 Dave Rawden Interim Chief Financial Officer Ron McCray Chairman & Interim Chief Executive Officer Jason Friesen Senior Vice President, Chief University Education Officer Ashish Ghia Vice President, Financial Planning and Analytics Todd Nelson Future President & Chief Executive Officer Exhibit 99.2 |
 This presentation contains “forward-looking statements,” as defined in Section 21E of the Securities Exchange Act of 1934, as amended, that reflect our current expectations regarding our future growth, results of operations,
cash flows, performance and business
prospects and opportunities, as well as assumptions made by (see, for example, Slide 14, and information currently available to, our management. We have tried to identify
forward- looking statements by using
words such as “believe,” “anticipate,” “will,” “expect,” “project,” “continue to,” “trends” and similar expressions, but these words are not the exclusive means of identifying
forward-looking statements. These
statements are based on information currently available to us and are subject to various risks, uncertainties, and other factors, including, but not limited to, those discussed in Item 1A,“Risk
Factors” of our Annual Report on Form
10-K for the year ended December 31, 2014 and our subsequent filings with the Securities and Exchange Commission that could cause our actual growth, results of operations, financial condition, cash
flows, performance and business prospects
and opportunities to differ materially from those expressed in, or implied by, these statements. Except as expressly required by the federal securities laws, we undertake no
obligation to update such factors or any
of the forward-looking statements to reflect future events, developments, or changed circumstances or for any other reason.
Certain financial information is presented on a
non-GAAP basis. The Company believes
it is useful to present non-GAAP
financial measures which exclude certain significant items as a means to understand the performance of its ongoing operations. As a general matter, the Company uses non-GAAP financial measures in conjunction
with results presented in accordance with GAAP to help
analyze the performance of its core business, assist with preparing the annual operating plan, and measure performance for some forms of compensation. In addition, the
Company believes that non-GAAP
financial information is used by analysts and others in the investment community to analyze the Company's historical results and to provide estimates of future performance and that
failure to report non-GAAP measures
could result in a misplaced perception that the Company's results have underperformed or exceeded expectations. The most directly comparable GAAP information and a reconciliation
between the non-GAAP and GAAP figures are provided
at the end of this presentation, and this presentation (including the reconciliation) has been posted to our website.
Cautionary Statements & Disclosures
2 |
 3 Agenda • Introduction of new CEO • Second Quarter Business Highlights • Review of Strategic Transformation • Financial Impacts of Strategic Transformation • Detailed Second Quarter Financial Results • Q&A Session |
 4 Second Quarter Highlights • Total University Group revenue of $138.2 million, up 2.6% year-over-year
– Driven by increase in total student enrollments • University Group operating income $29.4 million, an increase of 50.0% year-over-year
– Driven by revenue growth and cost initiatives • Adjusted EBITDA for the University Group and Corporate of $26.6 million, an increase
of 36.3% year-over-year
• Team remains focused on improving student outcomes – Intellipath adaptive learning technology provides competitive advantage in online platform – Introducing relevant new programs to address employer needs • New Master of Education (M.Ed) degrees in Primary and Secondary Education at AIU during the second quarter • Master of Nursing and Healthcare Management at CTU in first quarter – Developing mobile applications to enrich student experiences with an expected launch date of Q315
• Growing corporate partnerships – New student enrollments from partners increased roughly 55% in 2Q15 versus prior year
TM |
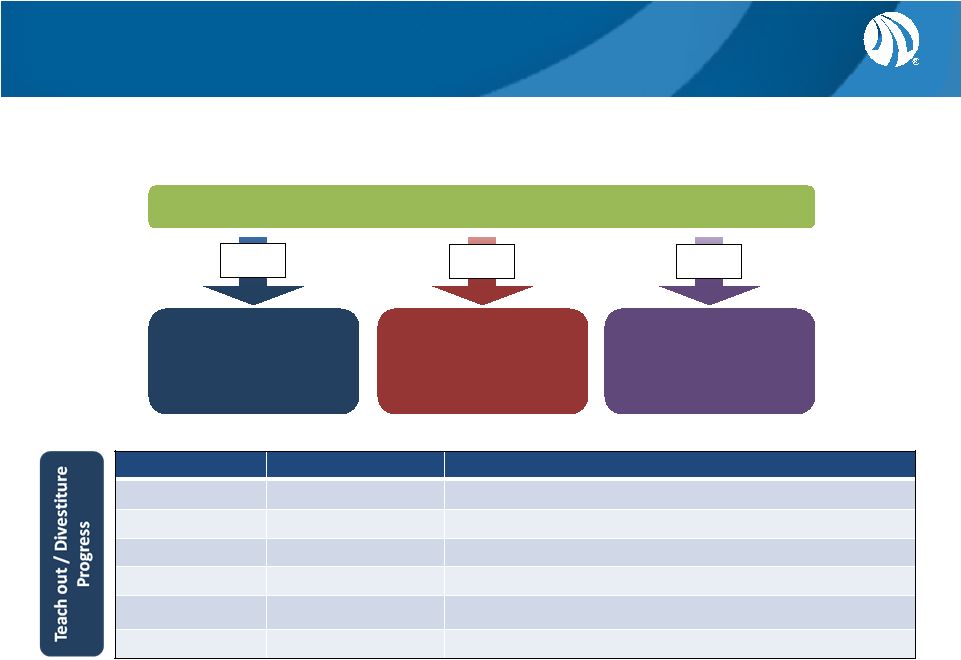 5 Strategy designed to right-size and re-engineer organization to create a profitable and
competitive company better positioned to serve and educate our students
Path to competitive operating margins
Teach out/Divest
Transitional Group and LCB Corporate Re-engineering University Efficiencies Leg 1 Leg 2 Leg 3 Update on Transformation Plan Institution Action Status Le Cordon Bleu Asset Held For Sale Expect to sign purchase agreement by year end Missouri College Pursuing Divestiture Asset purchase agreement signed Briarcliffe College Pursuing Divestiture Sale process remains ongoing Sanford-Brown Teaching out Initiated teach outs at the 15 Sanford-Brown campuses Brooks Institute Asset Sold Divestiture completed Harrington College Teaching out Agreement in place to transfer certain students to another institution |
 6 Transforming our Cost Structure Q215 Annualized Operating Expenses Leg 1 Leg 2 Leg 3 2018 Operating Expenses *Proportionate Savings Amounts are Not True to Scale 1. Refer to slide 14 for a listing of key assumptions inherent in these projections.
2. Operating expenses include both continuing operations and discontinued operations but exclude impairment.
3. University savings reflect only expense reductions. Our transformation strategy will reduce annualized 2015 operating expenses
approximately $375 million by the end of fiscal year 2018 (1) Savings of ~$375M Teach out/Divest Transitional Group & LCB* Corporate Re-engineering* University Efficiencies (3)* $900M (2) |
 7 University Group Performance |
 19,800 20,600 10,800 10,700 2Q 2014 2Q 2015 CTU AIU 8 Total University Student Enrollments 30,600 31,300 +2.3% |
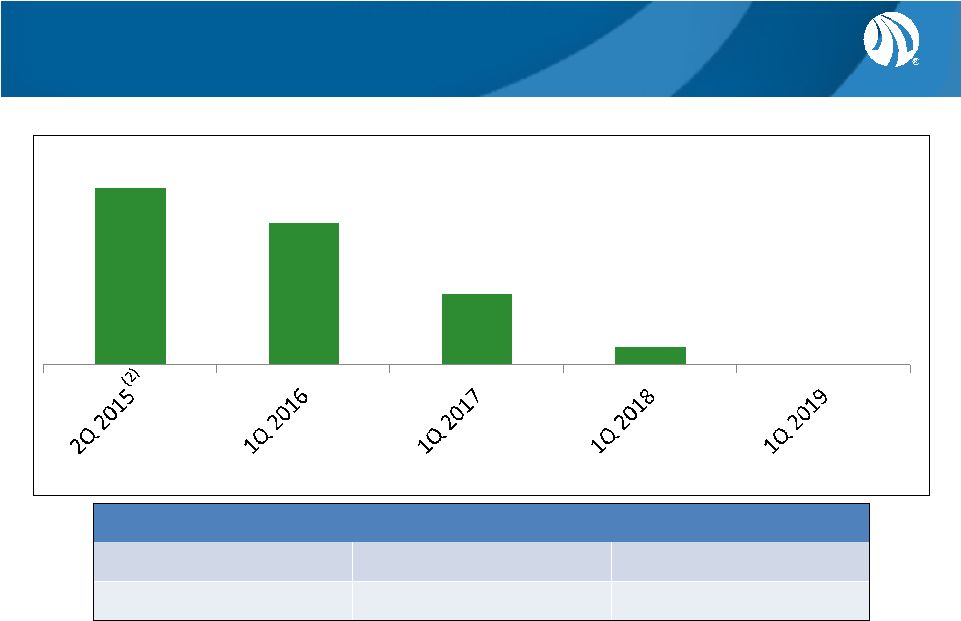 30 24 12 3 Phase Down of Transitional Group (1) 9 Review of Transitional Group The Company expects all campuses selected for teach-out to be closed by 2018.
(1) Teach-out dates are estimated based on current student enrollment and are subject to change.
(2) Q2 2015 campuses include the teach out and held for sale campuses announced in May 2015.
(3) Amounts for FY 2015 and FY 2016 exclude the impact of LCB. Refer to slide 14 for a listing of key assumptions inherent in
these projections.
Expected Adjusted EBITDA from Transitional Group & Discontinued Ops
(3)
2Q 2015 FY 2015 FY 2016 $(30.8) $(100) $(85) Represents the number of campuses remaining at the beginning of each period |
 10 Cash & Profitability Trends 2015 2016 2017 2018 Cash, cash equivalents, restricted cash and investments $190M Expected Adjusted EBITDA from Transitional Group & Discontinued Operations (1) ($100M) ($85M) Total CEC operating margins Mid- single digits (1) Amounts for FY 2015 and FY 2016 exclude the impact of LCB. Refer to slide 14 for a listing of key assumptions inherent in
these projections. |
 11 Summary Expectations • Remain on plan to complete divestitures and/or teach outs of all remaining Career Colleges
• Remain on plan to execute an agreement to sell Le Cordon Bleu by year end
• Remain on track to generate flat-to-modest total student enrollment growth within the University Group
over time • Expect total company operating margins to increase to mid-single digits in 2016, which would position us to
be competitive in our industry as we exit 2018
• As the transformation progresses, the Company will be in a better position to further leverage operational
and technological efficiencies to improve student outcomes
• Expect Adjusted EBITDA from Transitional/Discontinued Operations (excluding LCB) to be approximately
$(100) million in 2015 and ($85) million in 2016 – Will improve significantly as teach outs complete in 2017 and 2018 • Expect transformation strategy to remove approximately $375 million in operating expenses by the end of
2018, compared to annualized second quarter 2015 operating expenses, inclusive of all Career College and LCB costs, reductions in corporate overhead, and achievement of greater efficiencies within core University
Group • Expect to maintain year-end cash, cash equivalents, restricted cash and investments balance above $190
million in 2015, to remain stable in 2016 and to see growth in 2017 and
2018 •
Restructuring charges expected to range from approximately $32 million to $38
million total –
Approximately $12.6 million related to severance charges recorded in Q215 and
will be paid through 2018 –
$20-$25 million related to lease obligations will be recorded at each
campus’ teach-out date and will be paid through 2023,
at which point we anticipate exiting the last lease |
 12 Reconciliation of GAAP to Non-GAAP Items Adjusted EBITDA Q2 2015 Q1 2015 Q4 2014 Q3 2014 Q2 2014 University Group and Corporate: Pre-tax loss from continuing operations (10,218) $ (24,990) $
(7,747)
$
(31,651)
$
(11,664)
$
Transitional Group pre-tax
loss 32,624
30,470
23,788
40,764
25,364
Interest (income) expense, net
(52)
2
(38)
(120)
(177)
Depreciation and amortization
(3)
3,956
4,361
5,170
5,402
5,732
Stock-based compensation
(3)
530
940
966
950
1,020
Legal settlements
(3) (5)
-
-
-
-
(400)
-
-
-
73
-
(348)
556
(373)
(368)
(363)
-
-
-
(8,588)
-
94
93
1,354
-
-
Adjusted EBITDA--University Group and
Corporate (2)
26,586
$
11,432
$
23,120
$
6,462
$
19,512
$
Memo: Advertising Expenses
(3)
34,258
$
50,587
$
36,731
$
50,410
$
37,407
$
Transitional Group and Discontinued
Operations (4)
:
Pre-tax loss from discontinued
operations (11,252)
$
(102)
$
(17,195)
$
(15,201)
$
(33,046)
$
Transitional Group pre-tax
loss (32,624)
(30,470)
(23,788)
(40,764)
(25,364)
Loss on sale of business
(8)
917
-
-
-
311
Depreciation and amortization
(8)
3,231
2,351
7,319
7,739
8,662
Legal settlements
(5) (8)
(166)
1,485
-
225
2,000
11,372
6,019
14,203
14,412
7,454
(2,305)
(2,424)
(2,063)
(3,343)
920
13
(67)
1,029
-
-
Adjusted EBITDA--Transitional and Discontinued
Operations (2)
(30,814)
$
(23,208)
$
(20,495)
$
(36,932)
$
(39,063)
$
Consolidated Adjusted EBITDA
(4,228)
$
(11,776)
$
2,625
$
(30,470)
$
(19,551)
$
CAREER EDUCATION CORPORATION AND
SUBSIDIARIES UNAUDITED RECONCILIATION OF
GAAP TO NON-GAAP ITEMS (1)
(In thousands)
Insurance recovery
Cumulative adjustment related to revenue
recognition (3) (7)
Cumulative adjustment related to revenue
recognition (7) (8)
Asset impairments
(3)
Unused space charges
(3) (6)
Asset impairments
(8)
Unused space charges
(6) (8) |
 13 Reconciliation of GAAP to Non-GAAP Items – con’t (1) (2) (3) Quarterly amounts relate to the University Group and Corporate.
(4)
The Company announced the Culinary Arts segment as held
for sale during the fourth quarter of 2014 and it is therefore now reported within discontinued operations. Quarterly adjusted EBITDA amounts for Culinary Arts include:
Q2 2015
Q1 2015
Q4 2014
Q3 2014
Q2 2014
Pre-tax (loss) income
(10,532)
$
250
$
(15,927)
$
(12,602)
$
(19,771)
$
Depreciation and amortization
-
-
4,504 4,282
4,310
Legal
settlements -
775
- -
2,000 Asset impairments
9,687
-
10,320 1,523
7,400
Unused
space charges (982)
(377)
65
213 (467)
Cumulative adjustment related to revenue
recognition 5
54 514
- -
Total (1,822) $
702
$
(524)
$
(6,584)
$
(6,528)
$
(5)
Legal settlement amounts are net of insurance
recoveries. (6)
(7)
Non-GAAP financial measures, when viewed in a
reconciliation to corresponding GAAP financial measures, provide an additional way of viewing the company's results of operations and the factors and trends affecting the company's business. Non-GAAP financial measures should be considered as a
supplement to, and not as a substitute for, or superior to, the corresponding financial results presented in accordance with GAAP.
Management assesses results of operations for the
University Group and Corporate separately from the Transitional Group. As a result, management views adjusted EBITDA from the University Group and Corporate separately from the remainder of the organization, to assess results and make decisions.
Accordingly, the Transitional Group pre-tax losses are added back to pre-tax loss from continuing operations and subtracted from pre-tax loss from discontinued operations.
The Company believes it is useful to present
non-GAAP financial measures which exclude certain significant items as a means to understand the performance of its operations. As a general matter, the company uses non-GAAP financial measures in conjunction with results presented in accordance with
GAAP to help analyze the performance of its operations, assist with preparing the annual operating plan, and measure performance for some forms of compensation. In addition, the company
believes that non-GAAP financial information is used by analysts and others in the investment community to analyze the company's historical results and to provide estimates of future performance
and that failure to report non-GAAP measures could result in a misplaced perception that the company's results have underperformed or exceeded expectations.
Unused space charges represent the net present value of
remaining lease obligations less an estimated amount for sublease income as well as the subsequent accretion of these charges. Revenue recognition adjustment relates to the accounting for students who withdraw from one of our institutions
prior to completion of their program. This adjustment now reflects revenue earned on a cash-basis of accounting beginning in the fourth quarter of 2014 for these students.
We believe adjusted EBITDA allows us to compare our
current operating results with corresponding historical periods and with the operational performance of other companies in our industry because it does not give effect to potential differences caused by items we do not consider reflective of
underlying operating performance. We also present adjusted EBITDA because we believe it is frequently used by securities analysts, investors and other interested parties as a measure of performance.
In evaluating adjusted EBITDA, investors should be aware that in the future we may incur expenses similar to the adjustments presented above. Our presentation of adjusted EBITDA should not be
construed as an inference that our future results will be unaffected by expenses that are unusual, non-routine or non-recurring. Adjusted EBITDA has limitations as an analytical tool, and
you should not consider it in isolation, or as a substitute for net income (loss), operating income (loss), or any other performance measure derived in accordance and reported under GAAP or as an alternative
to cash flow from operating activities or as a measure of our liquidity. (8) Quarterly amounts relate to the Transitional Group and Discontinued Operations.
|
 Achievement of the transformation strategy estimated results included within
these slides are based on the following key assumptions and
factors, among others: •
Flat-to-modest total enrollment growth within the University Group over
time •
Teach-outs and divestitures to occur as planned and performance consistent
with historical experience
• Signed purchase agreement for LCB by year end and transaction closed by early 2016
• Achievement of projected rates of recovery for our real estate lease obligations which are
consistent with historical experience
• Right-sizing of our Corporate expense structure to serve primarily online institutions
• No material changes in the legal or regulatory environment • Consistent working capital trends as compared to historical results • All projections for 2016 and beyond assume a completed sale of our LCB campuses
Although these estimates and assumptions are based upon management’s good
faith beliefs regarding current events and actions that we may
undertake in the future, actual results could differ from estimates. 14 Key Transformation Assumptions |
 15 End of Presentation |