Attached files
| file | filename |
|---|---|
| 8-K - FORM 8-K - Apollo Residential Mortgage, Inc. | d43371d8k.htm |
| EX-99.1 - EX-99.1 - Apollo Residential Mortgage, Inc. | d43371dex991.htm |
 Information is as of June 30, 2015, except as otherwise noted.
It should not be assumed that investments made in the
future will be profitable or will equal the performance of investments in this document. Supplemental Financial Information Package – Q2 2015 August 6, 2015 Exhibit 99.2 |
 Forward Looking Statements and Other Disclosures
1
Certain statements contained in this presentation may
constitute forward-looking statements within the meaning of Section 27A of the Securities Act of 1933, as amended, and Section 21E of the Securities Exchange Act of 1934, as amended, and Apollo Residential Mortgage, Inc. (“AMTG” or the
“Company”) claims the protections of the safe harbor for forward looking statements contained in such sections. Forward-looking statements are subject to substantial risks and uncertainties, many of which
are difficult to predict and are generally beyond management’s control. These forward- looking statements include information about possible or assumed future results of Apollo Residential Mortgage,
Inc.’s the Company’s business, financial condition, liquidity, results of operations, plans and objectives. When used in this presentation, the words “believe," "expect,"
"anticipate," "estimate," "plan," "continue," "intend," "should," "may”, or similar expressions are intended to identify forward-looking statements. Statements regarding the following subjects, among others, may be
forward-looking: market trends in the Company’s industry, interest rates, real estate values, the debt securities markets, the U.S. housing market or the general economy or the demand for residential mortgage loans;
the Company’s business and investment strategy; the Company’s operating results and potential asset performance; availability of opportunities to acquire Agency RMBS, non-Agency RMBS,
residential mortgage loans and other residential mortgage assets or other real estate related assets; changes in the prepayment rates on the mortgage loans securing the Company’s RMBS; management’s
assumptions regarding default rates on the mortgage loans securing the Company’s non- Agency RMBS; the Company’s ability to borrow to finance its assets and the terms, including the cost,
maturity and other terms, of any such borrowing; the Company’s estimates regarding taxable income, the actual amount of which is dependent on a number of factors, including, but not limited to, changes in
the amount of interest income and financing costs, the method elected by the Company to accrete the market discount on non-Agency RMBS, realized losses and changes in the composition of the
Company’s Agency RMBS and non-Agency RMBS portfolios that may occur during the applicable tax period, including gain or loss on any RMBS disposals; expected leverage; general volatility of the
securities markets in which the Company participates; the Company’s expected portfolio and scope of the Company’s target assets; the Company’s expected investment and underwriting process;
interest rate mismatches between the Company’s target assets and any borrowings used to fund such assets; changes in interest rates and the market value of the Company’s target assets; rates of default
or decreased recovery rates on the Company’s assets; the degree to which the Company’s hedging strategies may or may not protect the Company from interest rate volatility and the effects of hedging
instruments on the Company’s assets; the impact of and changes in governmental regulations, tax law and rates, accounting guidance and similar matters affecting the Company’s business; the
timing and amount of distributions to stockholders, which are declared and paid at the discretion of the Company’s board of directors and will depend on, among other things, the Company’s
taxable income, the Company’s financial results and overall financial condition and liquidity; maintenance of the Company’s qualification as a real estate investment trust for U.S. Federal income
tax purposes and such other factors as the Company’s board of directors deems relevant; the Company’s ability to maintain its exclusion from registration as an investment company under the Investment
Company Act of 1940, as amended; availability of qualified personnel through ARM Manager, LLC; and the Company’s understanding of its competition.
The forward-looking statements
are based on management’s beliefs, assumptions and expectations of AMTG’s future performance, taking into account all information currently available to management. Forward-looking statements are not predictions of future events. These beliefs, assumptions and
expectations can change as a result of many possible events or factors, not all of which are known to AMTG. Some of these factors are described in the Company's Annual Report on Form 10-K for the year
ended December 31, 2014 and the Company’s other filings with the Securities and Exchange Commission (“SEC”). These and other risks, uncertainties and factors, including those
described in the Company’s annual, quarterly and current reports filed with the SEC, could cause the Company’s actual results to differ materially from those included in any forward-looking statements the
Company makes. All forward-looking statements speak only as of the date on which they are made. New risks and uncertainties arise over time, and it is not possible for management to predict those events
or how they may affect AMTG. Except as required by law, AMTG is not obligated to, and does not intend to, update or revise any forward-looking statements, whether as a result of new
information, future events or otherwise. This presentation contains information regarding the Company’s financial results that is calculated and
presented on the basis of methodologies other than in accordance with accounting principles generally accepted in the United States (“GAAP”), including Operating Earnings and Operating Earnings
per share. Please refer to page 3 for a definition of “Operating Earnings” and the reconciliation of “Operating Earnings” to the applicable GAAP financial measure set forth on pages 16 and 17. This
presentation may contain statistics and other data that in some cases has been obtained from or compiled from information made available by third-party service providers. AMTG makes no
representation or warranty, expressed or implied, with
respect to the accuracy, reasonableness or completeness of such information. Past performance is not indicative nor a guarantee of future
returns. Index performance and yield data are shown for illustrative purposes only and have limitations when used for
comparison or for other purposes due to, among other matters, volatility, credit or other factors (such as number and types of securities). Indices are unmanaged, do not charge any fees or expenses,
assume reinvestment of income and do not employ special investment techniques such as leveraging or short selling. No such index is indicative of the future results of any investment by AMTG.
|
 2 August 6, 2015 Michael A. Commaroto Chief Executive Officer Teresa D. Covello Chief Financial Officer Keith Rosenbloom Agency Portfolio Manager Paul Mangione Non-Agency Portfolio Manager Hilary Ginsberg Investor Relations Manager AMTG Q2 2015 Earnings Call |
 3 Second Quarter 2015 Summary Highlights Reported Operating Earnings of $18.0 million, or $0.56 per share of common stock for the second quarter of
2015
(1)
Declared a $0.48 per share of common stock quarterly
dividend for stockholders of record as of June 30, 2015 Book value per share of common stock of $18.31 at June 30, 2015
Residential Mortgage Backed Securities
(“RMBS”) portfolio totaled $3.4 billion at June 30, 2015 RMBS, securitized mortgage loan portfolio and other credit investments had a 2.94% effective net interest spread
and
a
16.98%
effective
levered
asset
yield
at
June
30,
2015
(2)
Had $20.5 million of advances outstanding on a warehouse
line receivable, held $18.0 million of legal title to real estate subject to bond-for-title contracts (“BFT Contracts”) and $5.7 million of mortgage loans
under Seller Financing
Program
(3)
at
June
30,
2015
Increased net position in Agency risk sharing securities
and small-balance commercial mortgage backed securities (“SBC-MBS”) by $33.8 million and $19.0 million, respectively
(1) Operating Earnings and Operating Earnings per share
of common stock are non-GAAP financial measures. Operating Earnings and Operating Earnings per share of common stock presented exclude, as applicable: (i) certain realized and unrealized
gains and losses recognized through
earnings; (ii) non-cash equity compensation; (iii) one-time events pursuant to changes in GAAP; and (iv) certain other non-cash charges. Please see pages 16 & 17 for a reconciliation of Operating Earnings and Operating Earnings
per share of common stock to GAAP net
income allocable to common stockholders and GAAP net income allocable to common stockholders per share of common stock. Operating Earnings represents the earnings, as adjusted, allocable to common stock.
(2) Effective net interest spread and effective levered
asset yield are non-GAAP financial measures, which include the cost of the Company’s Swaps as a component of its interest expense. Please see page 7. (3) The “Seller Financing Program” refers to the initiative whereby the Company provides funding
through a warehouse line to a
third-party to finance the acquisition and improvement of single-family homes. Once the homes are improved, they are marketed for sale, with the seller providing financing to the buyer in the form of a mortgage loan or a BFT Contract. The mortgage loans
and BFT Contracts may be purchased by the Company or by an unrelated third party from the counterparty, at which time the associated balance on the warehouse line is repaid. |
 Financial Summary 4 (1) Operating Earnings and Operating Earnings per share of common stock are non-GAAP financial measures.
Operating Earnings and Operating Earnings per share of common stock presented exclude, as applicable: (i) certain realized and unrealized gains and losses recognized through earnings; (ii) non-cash equity compensation; (iii) one-time events pursuant to changes
in GAAP; and (iv) certain other non-cash charges. Please see pages 16 & 17 for a reconciliation of Operating Earnings and Operating Earnings per share of common stock to GAAP net income allocable to common stockholders and GAAP net income allocable to common
stockholders per share of common stock. Operating Earnings represents the earnings, as adjusted, allocable to common stock. (2) Annualized Return on Average Assets is calculated as annualized Operating Earning plus preferred dividend
requirement for the period, as a percentage
of average interest earning assets, excluding cash. (3) Annualized Return on Average Equity is calculated as annualized Operating Earnings plus preferred dividend
requirement for the period, as a percentage of average equity over the period. ($ amounts in thousands except per share data) June 30, 2015 March 31, 2015 June 30, 2014 June 30, 2015 June 30, 2014 Interest Income $41,618 $39,295 $38,141 $80,913 $76,321 Interest Expense (8,234) (7,831) (7,510) (16,065) (14,778) Net Interest Income $33,384 $31,464 $30,631 $64,848 $61,543 Operating Earnings (1) $17,992 $16,303 $16,521 $34,318 $33,593 Weighted Average Shares of Common Stock Outstanding Basic 32,048 32,046 32,020 32,047 32,018 Operating Earnings per Share of Common Stock (1) $0.56 $0.51 $0.52 $1.07 $1.05 Average Leverage Multiple (Debt / Equity) 4.12x 4.09x 3.72x 4.10x 3.75x Annualized Return on Average Assets (2) 2.3% 2.1% 2.3% 2.2% 2.3% Annualized Return on Average Equity (3) 10.9% 9.9% 10.2% 10.4% 10.5% Three Months Ended Six Months Ended |
 5 Financial Summary Operating Earnings per Share of Common Stock (1) Dividends per Share of Common Stock Book Value per Share of Common Stock (1) Operating Earnings and Operating Earnings per share of common stock are non-GAAP financial measures.
Operating Earnings and Operating Earnings per share of common stock presented exclude, as applicable: (i) certain realized and unrealized gains and losses recognized through earnings; (ii) non-cash equity compensation; (iii) one-time events pursuant to changes
in GAAP; and (iv) certain other non-cash charges. Please see pages 16 & 17 for a reconciliation of Operating Earnings and Operating Earnings per share of common stock to GAAP net income allocable to common stockholders and GAAP net income allocable to common stockholders per
share of common stock. Operating Earnings represents the earnings, as adjusted, allocable to common stock. $0.52 $0.51 $0.53 $0.51 $0.56 $0.00 $0.15 $0.30 $0.45 $0.60 $0.75 Q2 2014 Q3 2014 Q4 2014 Q1 2015 Q2 2015 $0.42 $0.44 $0.45 $0.48 $0.48 $0.36 $0.38 $0.40 $0.42 $0.44 $0.46 $0.48 $0.50 Q2 2014 Q3 2014 Q4 2014 Q1 2015 Q2 2015 $19.49 $19.27 $19.12 $19.21 $18.31 $0.00 $5.00 $10.00 $15.00 $20.00 $25.00 Q2 2014 Q3 2014 Q4 2014 Q1 2015 Q2 2015 |
 Book Value Roll Forward 6 Book Value - March 31, 2015 19.21 $ Common stock dividend declared (0.48) Operating Earnings, net of preferred dividend
0.56
Non-Operating Items Impacting Net
Income: Changes in unrealized
gain/(loss) on Agency RMBS, net
(0.92)
Realized gain/(loss) on sales of Agency RMBS,
net (0.13)
Changes in unrealized gain/(loss) on
derivatives, net 0.73
Realized loss on expirations of Swaptions
(0.19)
Realized loss on TBA Contract terminations,
net -
Changes in unrealized gain/(loss)
on non-Agency RMBS, net
(0.37)
Changes in unrealized gain/(loss) on securitized
mortgage loans, net (0.06)
Changes in unrealized gain/(loss) on
derivatives, net 0.02
Realized (loss) on sales of non-Agency RMBS,
net (0.01)
Other credit, net
(0.05)
Book Value - June 30, 2015
18.31
$ |
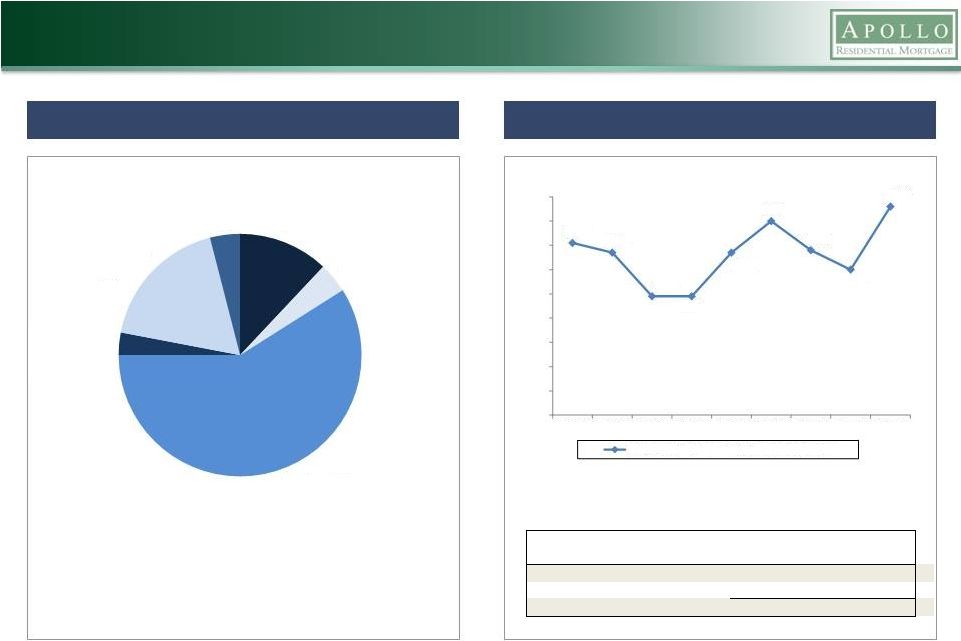
 Portfolio Summary and Net Interest Spread 7 Allocation of Portfolio Equity at June 30, 2015 (1) Effective Net Interest Spread at June 30, 2015
(2)
(1)
Percentages reflect amount of equity allocated to Agency
RMBS, non-Agency RMBS and other credit investments and securitized mortgage loans, net of associated assets and liabilities, including the fair value of interest rate derivatives. Cash and other net,
represents cash and other
assets and liabilities not specifically allocable to
Agency RMBS, non-Agency RMBS and other credit investments or securitized mortgage loans. (2) Effective net interest spread and effective levered asset yield are non-GAAP financial measures, which include
the cost of the Company’s Swaps as a component of its interest expense, as presented. (3) Debt/Equity multiples for each asset class are adjusted to reflect cash held to meet margin calls and certain other
assets and liabilities specifically allocable to Agency RMBS, non-Agency RMBS and other credit investments or securitized mortgage loans. (4) Reflects legal title to real estate subject to BFT Contracts at June 30, 2015, which had an aggregate principal
balance of $18,186 with a weighted average interest rate of 8.35%. (5) Net of $226 of accumulated depreciation. Other Investments at June 30, 2015 ($ in thousands) Amortized Cost Warehouse line receivable 20,464 $
Real estate subject to BFT
Contracts, net of accumulated depreciation
(4)(5)
17,960
Mortgage loans purchased through Seller Financing Program
5,665
Total Other Investments 44,089 $
Agency
RMBS
Non-Agency
RMBS and
Other
Credit
Investments
Securitized
Mortgage
Loans
Weighted
Average
Asset Yield
2.96%
6.33%
9.04%
4.60%
Interest Expense
0.38%
1.82%
2.86%
1.02%
Cost of Swaps
1.01%
-
1.58%
0.64%
Effective Net Interest Spread
1.57%
4.51%
4.60%
2.94%
Debt / Equity
(3)
9.39x
2.97x
1.96x
4.21x
Effective Levered Asset Yield
(2)
17.70%
19.72%
18.06%
16.98%
Securitized
Mortgage Loans
8%
Agency RMBS
26%
Cash and Other,
net
12%
Non-Agency
RMBS and
Other Credit
Investments
54% |
 Agency RMBS Portfolio at June 30, 2015 8 Agency RMBS Portfolio Overview Constant Prepayment Rates (“CPR”) (1) Other includes Agency interest only securities (“Agency IO”) and Agency inverse IO securities
(“Agency Inverse IO”).
7.1%
6.7%
4.9%
4.9%
6.7%
8.0%
6.8%
6.0%
8.6%
0.0%
1.0%
2.0%
3.0%
4.0%
5.0%
6.0%
7.0%
8.0%
9.0%
Q2 2013Q3 2013Q4 2013Q1 2014Q2 2014Q3 2014Q4 2014Q1
2015Q2 2015 Total Agency Portfolio average
one month CPR Short Reset
ARMs 12%
HARP / MHA /
High LTV 30 Year
Pass-Throughs
4%
Loan Balance 30
Year Pass-Throughs
59%
New
Production
30-
Year Pass-Throughs
3%
Low Credit 30-Year
Pass-Throughs
18%
Other(1)
4%
($ in thousands)
Estimated Fair
Value
Q2 2015 CPR
Agency Pass-Throughs
1,970,714
$
8.4%
Agency IO and Agency Inverse IO
74,839
14.6%
Total
2,045,553
$
8.6% |
 Agency RMBS Portfolio at June 30, 2015 9 Agency RMBS Portfolio Composition Summary (1) Amortized cost is reduced by unrealized losses that are classified as other-than-temporary
impairments. (2)
Estimated weighted average yield at the date presented
incorporates prepayment assumptions and forward interest rate assumptions on Agency RMBS. ($ in thousands) Principal Balance Premium Amortized Cost (1) Estimated Fair Value Weighted Average Coupon Estimated Weighted Average Yield (2) Agency pass-through RMBS 30-Year Mortgages ARM-RMBS 242,852 $
17,082
$
259,934
$
258,956
$
2.32%
1.32%
3.5% coupon
535,705
26,431
562,136
552,325
3.50%
2.79%
4.0% coupon
1,091,238
70,120
1,161,358
1,159,433
4.00%
3.02%
1,869,795
113,633
1,983,428
1,970,714
3.64%
2.74%
Agency IO
(3)
-
- 55,388
57,218 2.34%
7.63%
Agency Inverse IO
(3)
-
- 17,610
17,621 6.65%
13.63%
Total Agency RMBS
1,869,795
$
113,633
$
2,056,426
$
2,045,553
$
3.46%
2.96%
(3)
Agency IO and Agency Inverse IO are
interest only and inverse IO securities, respectively, that receive some or all of the interest payments, but no principal payments, made on a related series of Agency RMBS, based on a notional principal
balance. The notional principal balance is
used solely to determine interest distributions on interest-only classes of securities. At June 30, 2015, the Company’s investments in Agency IOs had a notional balance of $535,261 and the Company’s
investments in Agency Inverse IOs had a notional balance
of $85,217. |
 Non-Agency RMBS Portfolio at June 30, 2015 Non-Agency RMBS Portfolio Overview (1) Non-Agency RMBS Portfolio Vintage (1) Non-Agency RMBS Cash-Flow Profile (1) (1) Includes $59 million of small balance commercial mortgage backed securities and $91 million of Agency risk sharing
securities. 10
Subprime
65%
Agency Risk
Sharing
6%
Pay-Option
ARM
14%
Small-Balance
Commercial
4%
Alt-A
11%
4%
2003
5%
2004
21%
2005
28%
2006
19%
2007
6%
2013
1%
2014
10%
2015
6%
Current-Pay
63%
Locked-Out
37%
1998-2002 |
 Non-Agency RMBS Portfolio at June 30, 2015 (1) Credit enhancement is expressed as a percentage of all outstanding mortgage loan collateral. The
Company's non-Agency RMBS may incur
losses if credit enhancement is reduced to zero. (2) CRR represents conditional repayment rate. Information is based on loans for individual groups
owned by the Company. Amounts presented reflect the weighted average monthly performance for the three months ended June 30, 2015. 11 June 30, 2015 Portfolio Characteristics Estimated Fair Value ($ in thousands) $1,378,265 Amortized Cost to Par Value 83.5% Net Weighted Average Security Coupon 1.5% Collateral Attributes Weighted Average Loan Age (months) 121 Weighted Average Original Loan-to-Value 81.2% Weighted Average Original FICO Credit Score 637 Current Performance 60+ Day Delinquencies 30.9% Average Credit Enhancement (1) 29.7% 3 Month CRR (2) 3.4% |
 Financing and Derivative Instruments Overview 12 ($ in thousands) Weighted Weighted Average Average Weighted Months Until Swap Average Fixed Pay Rate for Option Notional Terms Fixed-Pay Underlying Swap Fair Value Expiration Amount (Years) Rate 2.34 - 2.75% 678 $
6.7
100,000
$
5.0
2.34%
2.76 -
3.00%
6,093
7.3
425,000
10.0
2.93%
3.01 -
3.25%
1,714
11.4
125,000
10.0
3.24%
3.26 -
3.50%
604
4.3
265,000
10.0
3.31%
3.51 -
3.68%
-
0.2
150,000
10.0
3.64%
9,089
$
6.0
1,065,000
$
9.5
3.11%
Option
Underlying Swap
($ in
thousands) Notional Amount Estimated Fair Value Swaps - assets 957,000 $ 8,528 $
Swaptions -
assets
1,065,000
9,089
Swaps -
(liabilities)
730,000
(8,641)
Short TBA Contracts -
(liabilities)
200,000
(95)
Total Derivative Instruments
2,952,000
$
8,881
$
($ in thousands)
Balance
Weighted
Average
Borrowing
Rate
Weighted
Average
Remaining
Maturity
(days)
Securities Financed:
Agency RMBS
1,868,994
$
0.38%
21
Non-Agency RMBS
(1)
1,189,357
1.88%
162
Other investment securities
119,328
1.76%
173
Total Borrowings
3,177,679
$
1.00%
79
($ in thousands)
Term to Maturity
Notional
Amount
Weighted
Average
Fixed Pay
Rate
Weighted
Average
Maturity
(Years)
More than 1 year up to and including 3
years 1,109,000
$
1.06%
2.0
More than 3 years up to and including 5
years 14,000
1.51%
4.7
Greater than 5 years
564,000
2.15%
7.5
Total
1,687,000
$
1.43%
3.9
Borrowings at June 30, 2015
Derivative Instruments at June 30, 2015
Swaps Overview at June 30, 2015
Swaptions
Overview at June 30, 2015
(1)
Includes $93,602 of repurchase
borrowings collateralized by non-Agency RMBS of $128,933 that were eliminated from the Company’s consolidated balance sheet in consolidation with the variable interest entity associated with our securitization transaction.
|
 13 Financials |
 14 Balance Sheet (in thousands—except share and per share data)
June 30, 2015
December 31, 2014
Assets:
(unaudited)
Cash and cash equivalents
113,350
$
114,443
$
Restricted cash
77,116
69,006 RMBS, at fair value ($3,192,641 and
$3,583,853 pledged as collateral, respectively) 3,423,818 3,755,632
Securitized mortgage loans transferred to consolidated
VIEs at fair value 178,904
104,438 Other investment securities, at fair
value ($149,801 and $34,228 pledged as collateral, respectively) 149,801 34,228
Other investments 44,089 40,561
Mortgage loans, at fair value ($0 and $13,602 pledged as collateral, respectively)
-
14,120 Investment related receivable ($131,407
and $168,705 pledged as collateral, respectively) 136,128 191,455
Interest receivable 10,389 10,455
Derivative instruments, at fair value 17,617 11,642
Other assets 1,370 2,073
Total Assets 4,152,582 $
4,348,053
$
Liabilities and
Stockholders' Equity
Liabilities:
Borrowings under repurchase agreements
3,177,679
$
3,402,327
$
Non-recourse
securitized debt, at fair value
25,893
34,176 Investment related payable
134,891
76,105 Obligation to return cash held as
collateral 11,366
2,546 Accrued interest
payable 8,551
13,026 Derivative instruments, at fair
value 8,736
8,949 Payable to related
party 4,600
4,968 Dividends and dividend
equivalents payable 19,192
18,305 Accounts payable, accrued expenses and
other liabilities 1,549
1,699 Total
Liabilities 3,392,457
$
3,562,101
$
Stockholders'
Equity: Preferred stock, $0.01 par value,
50,000,000 shares authorized, 6,900,000 shares issued and outstanding ($172,500 aggregate liquidation preference) 69 $
69
$
Common stock, $0.01 par value, 450,000,000 shares authorized, 32,100,609 and 32,088,045 shares issued and
outstanding
321
321 Additional
paid-in-capital
794,045
793,274 Accumulated deficit
(34,310)
(7,712) Total Stockholders' Equity
760,125
$
785,952
$
Total Liabilities and Stockholders' Equity
4,152,582
$
4,348,053
$
|
 Income Statement 15 (in thousands—except per share data) 2015 2014 2015 2014 Interest Income: RMBS 35,818 $
35,991
$
71,432
$
71,816
$
Securitized
mortgage loans 3,623
1,927
5,790
4,173
Other
2,177
223
3,691
332
Total Interest Income
41,618
38,141
80,913
76,321
Interest Expense:
Repurchase agreements
(7,901)
(7,078)
(15,366)
(13,904)
Securitized debt
(333)
(432)
(699)
(874)
Total Interest Expense
(8,234)
(7,510)
(16,065)
(14,778)
Net Interest Income
33,384
$
30,631
$
64,848
$
61,543
$
Other Income/(Loss),
net: Realized gain/(loss) on sale of RMBS,
net (4,530)
$
(7,072)
$
4,008
$
(18,882)
$
Realized gain on sale
of other investment securities, net
102
-
102
-
Unrealized gain/(loss) on RMBS, net
(41,354)
51,590
(29,149)
102,237
Unrealized gain/(loss) on securitized debt
1,001
(364)
1,014
(354)
Unrealized gain on securitized mortgage loans,
net (1,896)
2,042
466
3,096
Unrealized gain/(loss) on other investment
securities (2,649)
54
(2,678)
176
Realized and unrealized gain/(losses) on derivative
instruments, net 12,463
(27,133)
(14,058)
(64,323)
Other, net
(3)
(49)
9
(31)
Other Income/(Loss), net
(36,866)
$
19,068
$
(40,286)
$
21,919
$
Operating
Expenses: General and administrative
(includes ($304), ($408), ($797) and
($867) of non-cash stock based compensation,
respectively) (3,655)
$
(2,921)
$
(7,505)
$
(6,016)
$
Management
fee - related party
(2,895)
(2,774)
(5,682)
(5,560)
Total Operating Expenses
(6,550)
$
(5,695)
$
(13,187)
$
(11,576)
$
Net Income/(Loss)
(10,032)
$
44,004
$
11,375
$
71,886
$
Preferred Stock Dividends
Declared (3,450)
(3,450)
(6,900)
(6,900)
Net Income/(Loss) Allocable to Common Stock and
Participating Securities
(13,482)
$
40,554
$
4,475
$
64,986
$
Earnings/(Loss) per Share
of Common Stock - Basic and
Diluted (0.43)
$
1.26
$
0.13
$
2.02
$
Dividends Declared per Share of Common Stock
0.48
$
0.42
$
0.96
$
0.82
$
(Unaudited)
(Unaudited)
Three Months Ended
June 30,
Six Months Ended
June 30, |
 16 Reconciliation of Operating Earnings (1) (1) Operating Earnings and Operating Earnings per share of common stock are non-GAAP financial measures.
Operating Earnings and Operating Earnings per hare of common stock presented exclude, as applicable: (i) certain realized and unrealized gains and losses recognized through earnings; (ii) non-cash equity compensation; (iii) one-time events pursuant to
changes in GAAP; and (iv) certain other non-cash charges. Operating Earnings represents the earnings, as adjusted, allocable to common stock. (2) Reflects per share amount for each component presented.
(in thousands—except share and per share
data) June 30, 2015
Per Share
Amount
(2)
June 30, 2014
Per Share
Amount
(2)
Operating Earnings:
Net income/(loss) allocable to common
stockholders (13,635)
$
(0.43) $
40,291
$
1.26 $
Adjustments:
Realized loss on sale of RMBS, net
4,530
0.14 7,072 0.22
Realized (gain) on sale of other investment securities, net
(102)
- - - Unrealized (gain)/loss on RMBS, net 41,354 1.29
(51,590) (1.61)
Unrealized (gain)/loss on derivative instruments, net
(23,553)
(0.73) 14,467
0.45 Other unrealized (gain)/loss, net 3,544 0.11
(1,732) (0.05)
Non-cash stock-based compensation expense
304
0.01 408 0.01 Realized loss on Swap and Swaption terminations, net
6,170
0.19 7,585 0.24
Tax amortization of (loss) on Swaption terminations and
expirations, net
(620)
(0.02) (48)
- Other - - 68 - Total adjustments to arrive at operating earnings:
31,627
0.99 (23,770) (0.74)
Operating Earnings 17,992 $
0.56
$
16,521 $
0.52
$
Weighted average shares of common stock 32,048 32,020
Three Months Ended Three Months Ended |
 17 Reconciliation of Operating Earnings (1) (1) Operating Earnings and Operating Earnings per share of common stock are non-GAAP financial measures.
Operating Earnings and Operating Earnings per hare of common stock presented exclude, as applicable: (i) certain realized and unrealized gains and losses recognized through earnings; (ii) non-cash equity compensation; (iii) one-time events pursuant to
changes in GAAP; and (iv) certain other non-cash charges. Operating Earnings represents the earnings, as adjusted, allocable to common stock. (2) Reflects per share amount for each component presented.
(in thousands—except share and per share
data) June 30, 2015
Per Share
Amount
(2)
June 30, 2014
Per Share
Amount
(2)
Operating Earnings:
Net income allocable to common stockholders
4,168
$
0.13 $
64,570
$
2.02 $
Adjustments:
Realized (gain)/loss on sale of RMBS, net
(4,008)
(0.13) 18,882
0.59 Realized (gain) on sale of other investment securities, net
(102)
- - - Unrealized (gain)/loss on RMBS, net 29,149 0.91
(102,237) (3.19)
Unrealized (gain)/loss on derivative instruments, net
(7,835)
(0.24) 33,185
1.04 Other unrealized (gain)/loss, net 1,198 0.04
(2,918) (0.10)
Non-cash stock-based compensation expense
797
0.02 867 0.03 Realized loss on Swap and Swaption terminations, net
10,032
0.31 14,112 0.44
Realized loss on TBA Contracts 1,977 0.06
7,156 0.22
Tax amortization of (loss) on Swaption terminations and
expirations, net
(1,058)
(0.03) (92)
- Other - - 68 - Total adjustments to arrive at operating earnings:
30,150
0.94 (30,977) (0.97)
Operating Earnings 34,318 $
1.07
$
33,593 $
1.05
$
Weighted average shares of common stock 32,047 32,018
Six Months Ended Six Months Ended |
 18 Contact Information Hilary Ginsberg Investor Relations Manager 212-822-0767 |