Attached files
| file | filename |
|---|---|
| 8-K - 8-K - Triumph Bancorp, Inc. | tbk-8k_20150727.htm |
| EX-99.1 - EX-99.1 - Triumph Bancorp, Inc. | tbk-ex991_8.htm |

Q2 2015 Earnings Release July 27, 2015 Exhibit 99.2
Disclaimer Forward-Looking Statements This presentation contains forward-looking statements. Any statements about our expectations, beliefs, plans, predictions, forecasts, objectives, assumptions or future events or performance are not historical facts and may be forward-looking. You can identify forward-looking statements by the use of forward-looking terminology such as “believes,” “expects,” “could,” “may,” “will,” “should,” “seeks,” “likely,” “intends,” “plans,” “pro forma,” “projects,” “estimates” or “anticipates” or the negative of these words and phrases or similar words or phrases that are predictions of or indicate future events or trends and that do not relate solely to historical matters. You can also identify forward-looking statements by discussions of strategy, plans or intentions. Forward-looking statements involve numerous risks and uncertainties and you should not rely on them as predictions of future events. Forward-looking statements depend on assumptions, data or methods that may be incorrect or imprecise and we may not be able to realize them. We do not guarantee that the transactions and events described will happen as described (or that they will happen at all). The following factors, among others, could cause actual results and future events to differ materially from those set forth or contemplated in the forward-looking statements: our limited operating history as an integrated company; business and economic conditions generally and in the bank and non-bank financial services industries, nationally and within our local market area; our ability to mitigate our risk exposures; our ability to maintain our historical earnings trends; risks related to the integration of acquired businesses and any future acquisitions; changes in management personnel; interest rate risk; concentration of our factoring services in the transportation industry; credit risk associated with our loan portfolio; lack of seasoning in our loan portfolio; deteriorating asset quality and higher loan charge-offs; time and effort necessary to resolve nonperforming assets; inaccuracy of the assumptions and estimates we make in establishing reserves for probable loan losses and other estimates; lack of liquidity; fluctuations in the fair value and liquidity of the securities we hold for sale; impairment of investment securities, goodwill, other intangible assets or deferred tax assets; risks related to our asset management business; our risk management strategies; environmental liability associated with our lending activities; increased competition in the bank and non-bank financial services industries, nationally, regionally or locally, which may adversely affect pricing and terms; the obligations associated with being a public company; the accuracy of our financial statements and related disclosures; material weaknesses in our internal control over financial reporting; system failures or failures to prevent breaches of our network security; the institution and outcome of litigation and other legal proceedings against us or to which we become subject; changes in carry-forwards of net operating losses; changes in federal tax law or policy; the impact of recent and future legislative and regulatory changes, including changes in banking, securities and tax laws and regulations, such as the Dodd-Frank Wall Street Reform and Consumer Protection Act (the “Dodd-Frank Act”) and their application by our regulators; governmental monetary and fiscal policies; changes in the scope and cost of the Federal Deposit Insurance Corporation insurance and other coverages; failure to receive regulatory approval for future acquisitions; increases in our capital requirements; and risk retention requirements under the Dodd-Frank Act. While forward-looking statements reflect our good-faith beliefs, they are not guarantees of future performance. All forward-looking statements are necessarily only estimates of future results. Accordingly, actual results may differ materially from those expressed in or contemplated by the particular forward-looking statement, and, therefore, you are cautioned not to place undue reliance on such statements. Further, any forward-looking statement speaks only as of the date on which it is made, and we undertake no obligation to update any forward-looking statement to reflect events or circumstances after the date on which the statement is made or to reflect the occurrence of unanticipated events or circumstances, except as required by applicable law. Non-GAAP Financial Measures This presentation includes certain non‐GAAP financial measures intended to supplement, not substitute for, comparable GAAP measures. Reconciliations of non‐GAAP financial measures to GAAP financial measures are provided at the end of the presentation. Numbers in this presentation may not sum due to rounding. Unless otherwise referenced, all data presented is as of 6/30/2015.
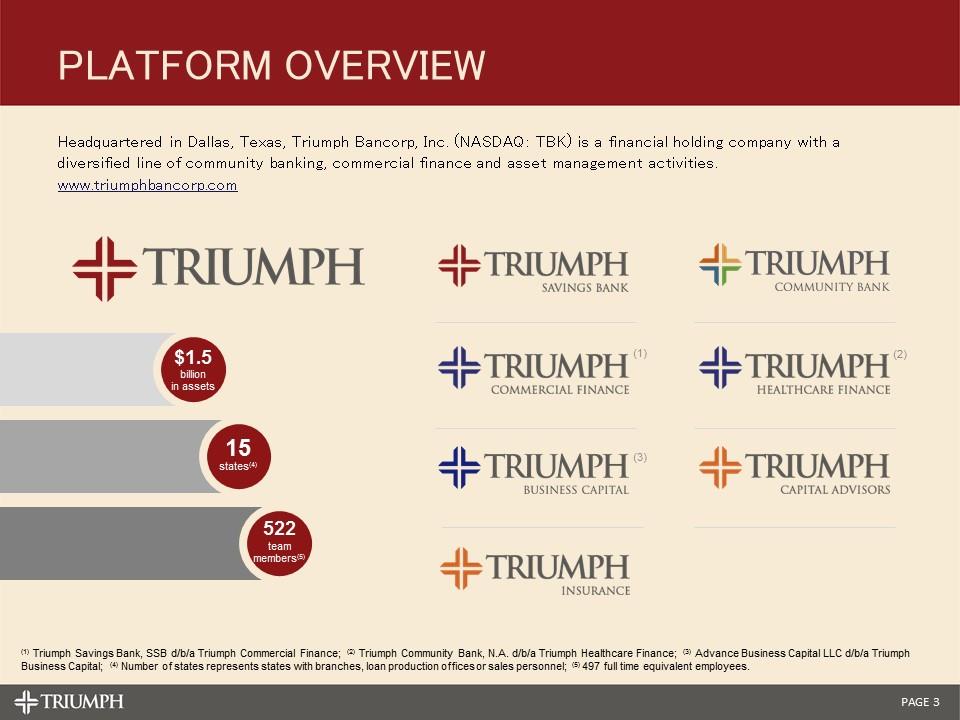
Headquartered in Dallas, Texas, Triumph Bancorp, Inc. (NASDAQ: TBK) is a financial holding company with a diversified line of community banking, commercial finance and asset management activities. www.triumphbancorp.com $1.5 billion in assets 15 states(4) 522 team members(5) (1) (2) (3) (1) Triumph Savings Bank, SSB d/b/a Triumph Commercial Finance; (2) Triumph Community Bank, N.A. d/b/a Triumph Healthcare Finance; (3) Advance Business Capital LLC d/b/a Triumph Business Capital; (4) Number of states represents states with branches, loan production offices or sales personnel; (5) 497 full time equivalent employees. Platform overview
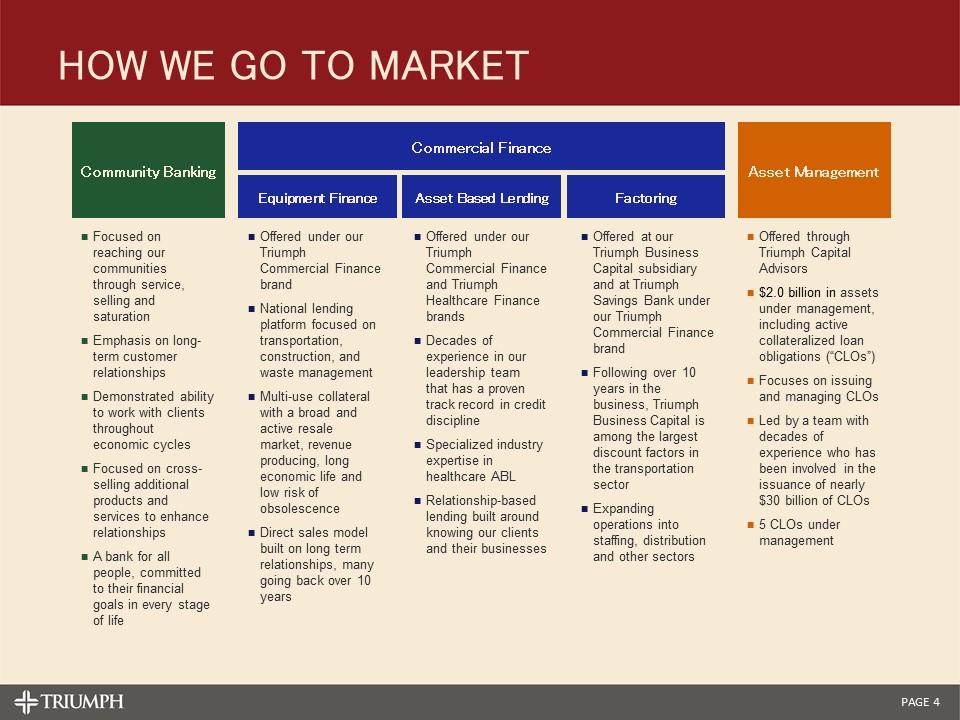
How we go to market Community Banking Focused on reaching our communities through service, selling and saturation Emphasis on long-term customer relationships Demonstrated ability to work with clients throughout economic cycles Focused on cross-selling additional products and services to enhance relationships A bank for all people, committed to their financial goals in every stage of life Factoring Offered at our Triumph Business Capital subsidiary and at Triumph Savings Bank under our Triumph Commercial Finance brand Following over 10 years in the business, Triumph Business Capital is among the largest discount factors in the transportation sector Expanding operations into staffing, distribution and other sectors Asset Based Lending Offered under our Triumph Commercial Finance and Triumph Healthcare Finance brands Decades of experience in our leadership team that has a proven track record in credit discipline Specialized industry expertise in healthcare ABL Relationship-based lending built around knowing our clients and their businesses Equipment Finance Offered under our Triumph Commercial Finance brand National lending platform focused on transportation, construction, and waste management Multi-use collateral with a broad and active resale market, revenue producing, long economic life and low risk of obsolescence Direct sales model built on long term relationships, many going back over 10 years Asset Management Offered through Triumph Capital Advisors $2.0 billion in assets under management, including active collateralized loan obligations (“CLOs”) Focuses on issuing and managing CLOs Led by a team with decades of experience who has been involved in the issuance of nearly $30 billion of CLOs 5 CLOs under management Commercial Finance
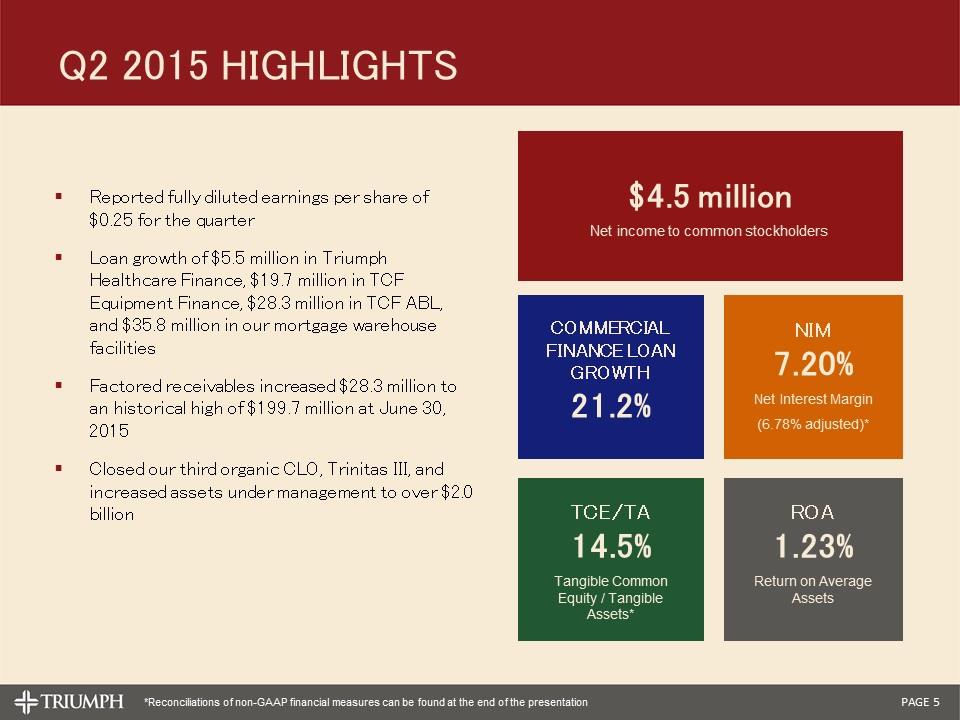
Reported fully diluted earnings per share of $0.25 for the quarter Loan growth of $5.5 million in Triumph Healthcare Finance, $19.7 million in TCF Equipment Finance, $28.3 million in TCF ABL, and $35.8 million in our mortgage warehouse facilities Factored receivables increased $28.3 million to an historical high of $199.7 million at June 30, 2015 Closed our third organic CLO, Trinitas III, and increased assets under management to over $2.0 billion $4.5 million Net income to common stockholders Q2 2015 highlights COMMERCIAL FINANCE LOAN GROWTH 21.2% NIM 7.20% Net Interest Margin (6.78% adjusted)* ROA 1.23% Return on Average Assets TCE/TA 14.5% Tangible Common Equity / Tangible Assets* *Reconciliations of non-GAAP financial measures can be found at the end of the presentation
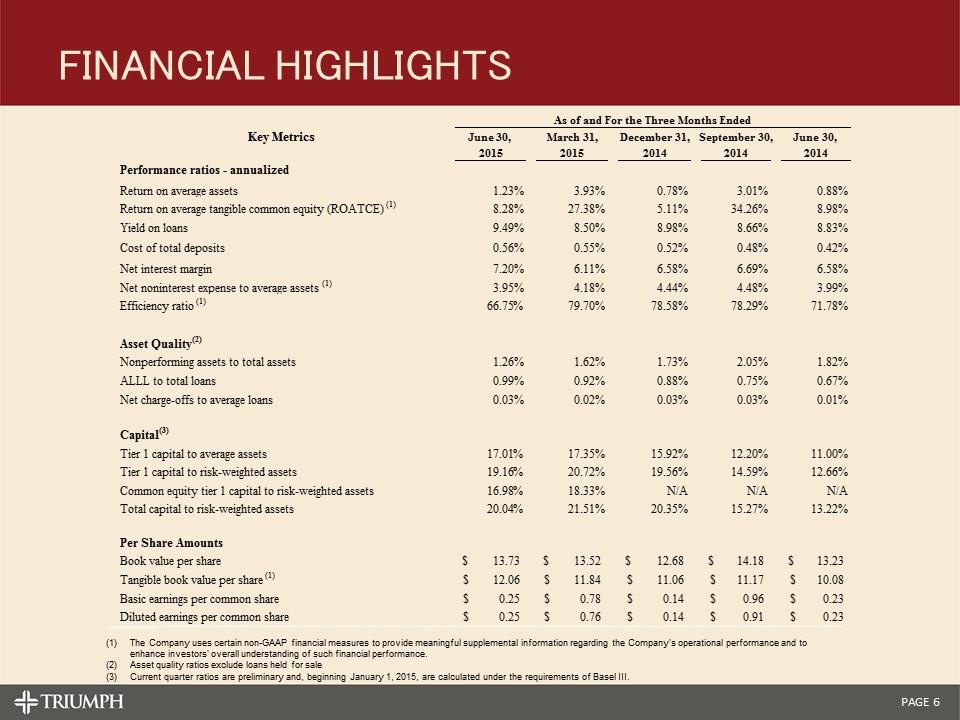
Financial highlights The Company uses certain non-GAAP financial measures to provide meaningful supplemental information regarding the Company's operational performance and to enhance investors' overall understanding of such financial performance. Asset quality ratios exclude loans held for sale Current quarter ratios are preliminary and, beginning January 1, 2015, are calculated under the requirements of Basel III. As of and For the Three Months Ended Key Metrics June 30, March 31,December 31,September 30,June 30, 20152015201420142014 Performance ratios - annualized Return on average assets 1.23%3.93%0.78%3.01%0.88% Return on average tangible common equity (ROATCE) (1)8.28%27.38%5.11%34.26%8.98% Yield on loans9.49%8.50%8.98%8.66%8.83% Cost of total deposits0.56%0.55%0.52%0.48%0.42% Net interest margin7.20%6.11%6.58%6.69%6.58% Net noninterest expense to average assets (1)3.95%4.18%4.44%4.48%3.99% Efficiency ratio (1)66.75%79.70%78.58%78.29%71.78% Asset Quality(2) Nonperforming assets to total assets1.26%1.62%1.73%2.05%1.82% ALLL to total loans0.99%0.92%0.88%0.75%0.67% Net charge-offs to average loans0.03%0.02%0.03%0.03%0.01% Capital(3) Tier 1 capital to average assets17.01%17.35%15.92%12.20%11.00% Tier 1 capital to risk-weighted assets19.16%20.72%19.56%14.59%12.66% Common equity tier 1 capital to risk-weighted assets16.98%18.33%N/AN/AN/A Total capital to risk-weighted assets20.04%21.51%20.35%15.27%13.22% Per Share Amounts Book value per share $13.73 $13.52 $12.68 $14.18 $13.23 Tangible book value per share (1) $12.06 $11.84 $11.06 $11.17 $10.08 Basic earnings per common share $0.25 $0.78 $0.14 $0.96 $0.23 Diluted earnings per common share $0.25 $0.76 $0.14 $0.91 $0.23
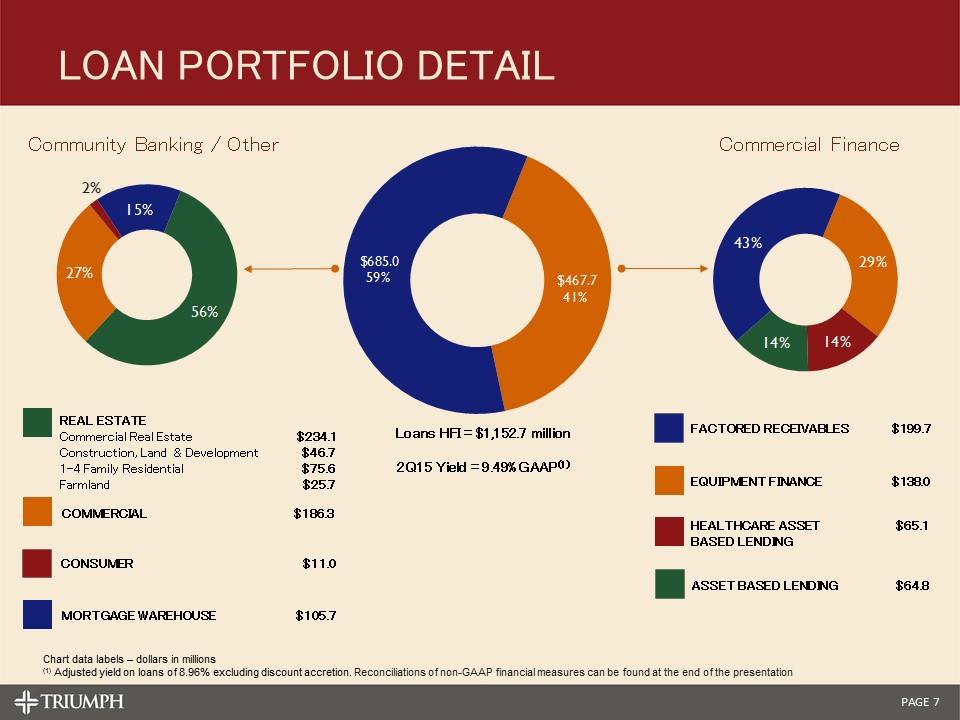
Real estate Commercial Real Estate $234.1 Construction, Land & Development $46.7 1-4 Family Residential $75.6 Farmland $25.7 Commercial $186.3 Consumer $11.0 Mortgage Warehouse $105.7 Loans HFI = $1,152.7 million 2Q15 Yield = 9.49% GAAP(1) Chart data labels – dollars in millions (1) Adjusted yield on loans of 8.96% excluding discount accretion. Reconciliations of non-GAAP financial measures can be found at the end of the presentation Healthcare asset $65.1 based lending Equipment Finance $138.0 Factored receivables $199.7 asset based lending $64.8 Loan portfolio detail Community Banking / Other Commercial Finance
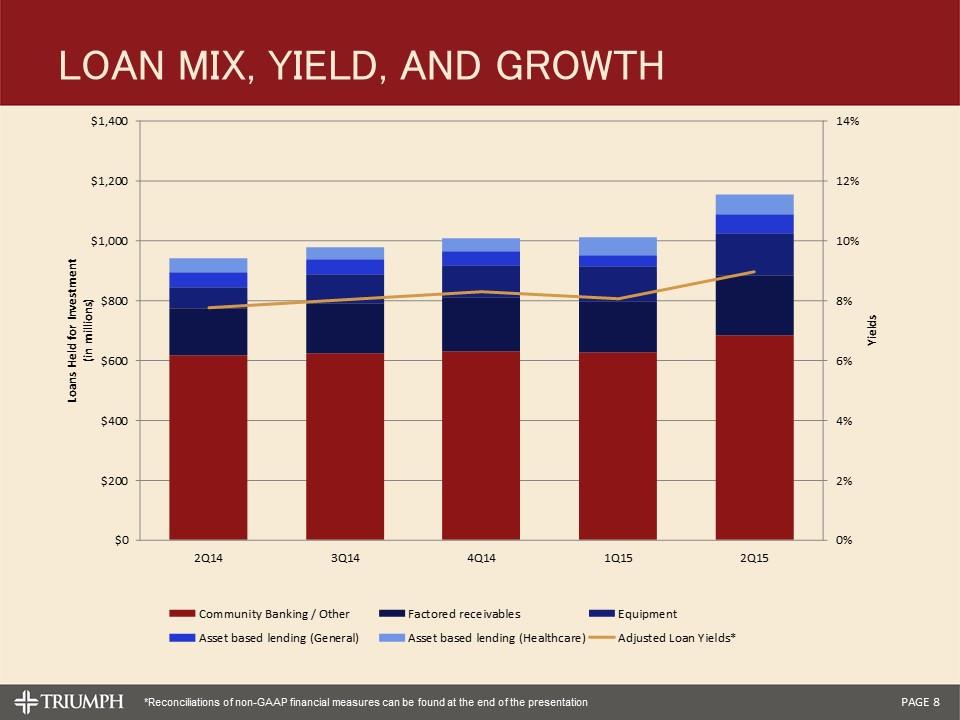
Loan mix, yield, and growth *Reconciliations of non-GAAP financial measures can be found at the end of the presentation
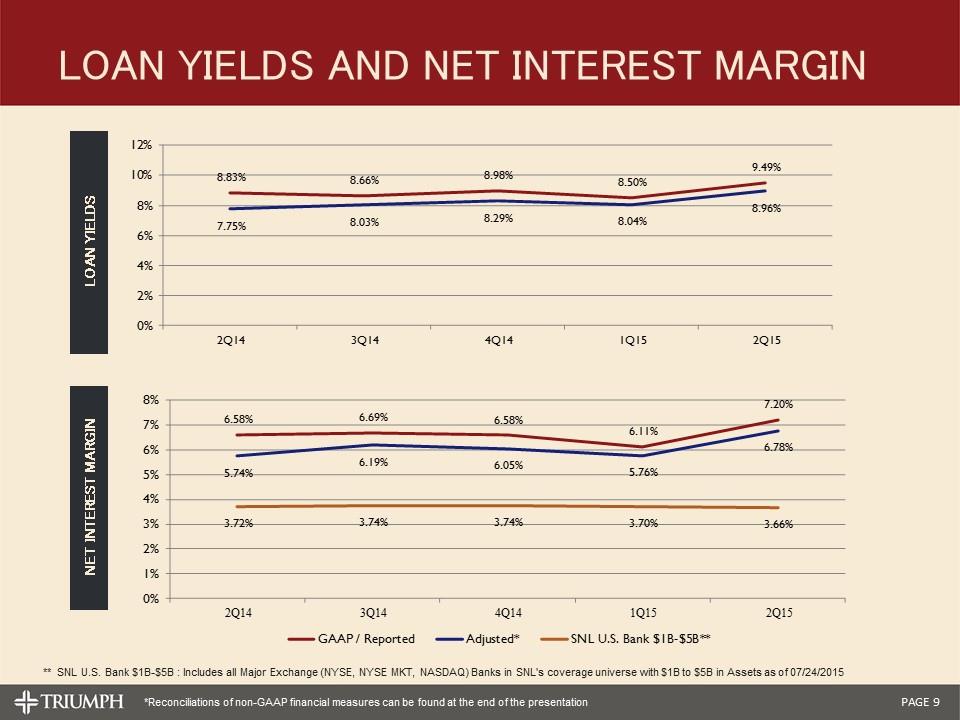
Loan yields and net interest margin Loan Yields Net Interest Margin ** SNL U.S. Bank $1B-$5B : Includes all Major Exchange (NYSE, NYSE MKT, NASDAQ) Banks in SNL's coverage universe with $1B to $5B in Assets as of 07/24/2015 *Reconciliations of non-GAAP financial measures can be found at the end of the presentation
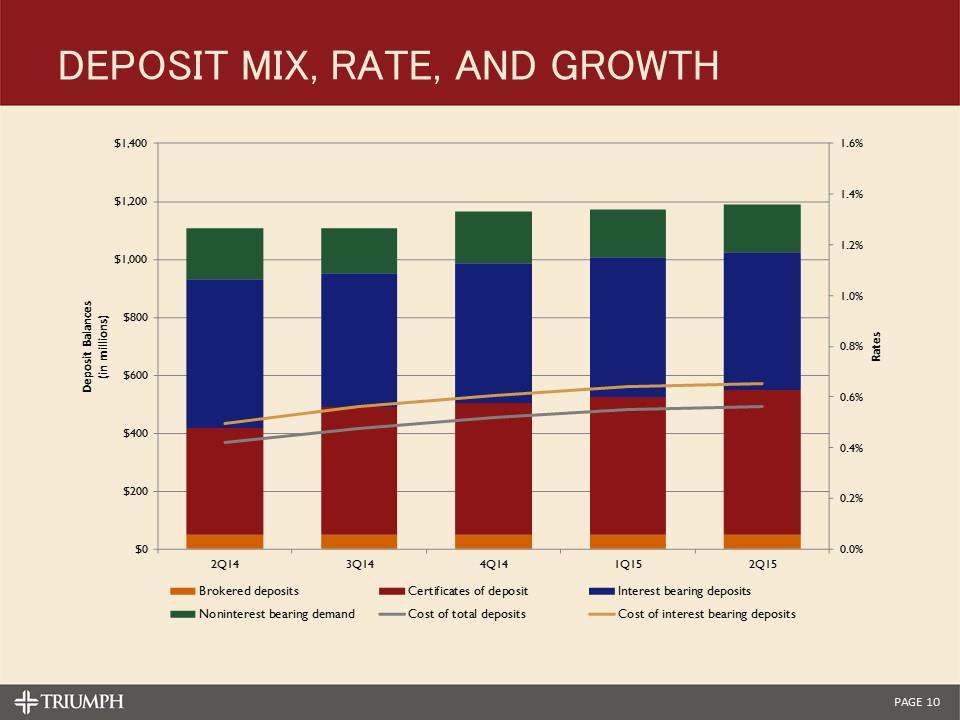
Deposit mix, rate, and growth
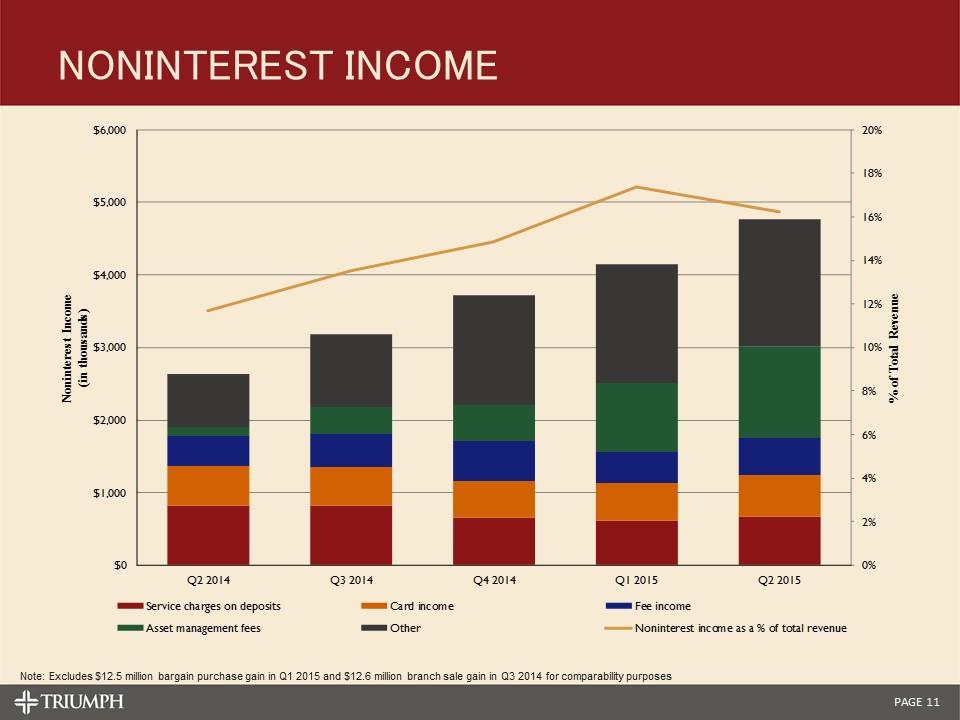
Noninterest Income Note: Excludes $12.5 million bargain purchase gain in Q1 2015 and $12.6 million branch sale gain in Q3 2014 for comparability purposes
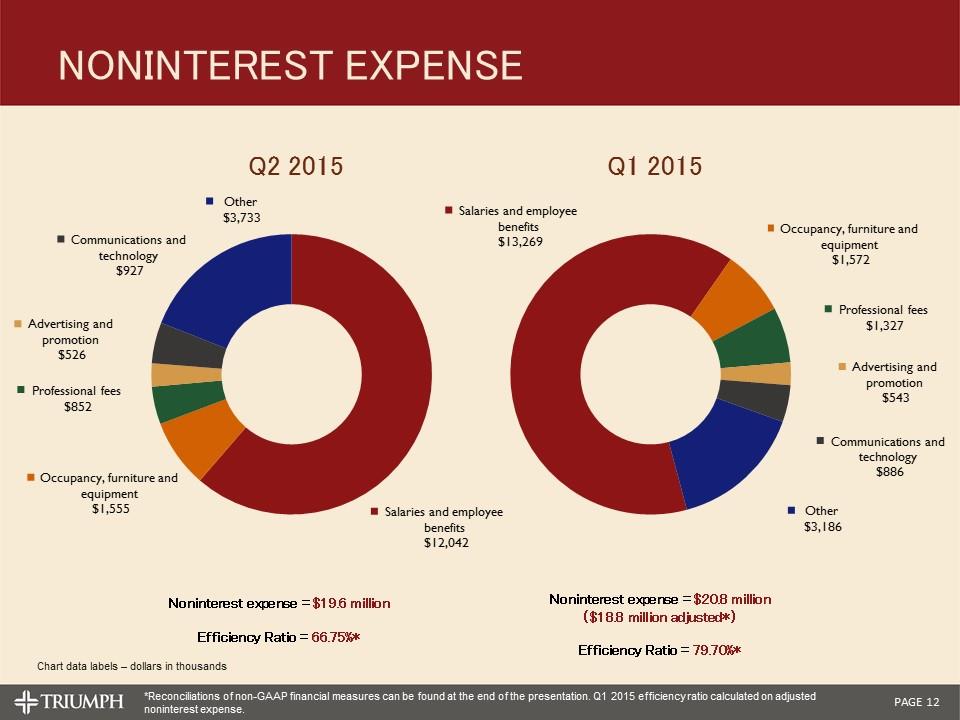
Noninterest Expense Noninterest expense = $19.6 million Efficiency Ratio = 66.75%* Q2 2015 Q1 2015 Chart data labels – dollars in thousands *Reconciliations of non-GAAP financial measures can be found at the end of the presentation. Q1 2015 efficiency ratio calculated on adjusted noninterest expense. Noninterest expense = $20.8 million ($18.8 million adjusted*) Efficiency Ratio = 79.70%*
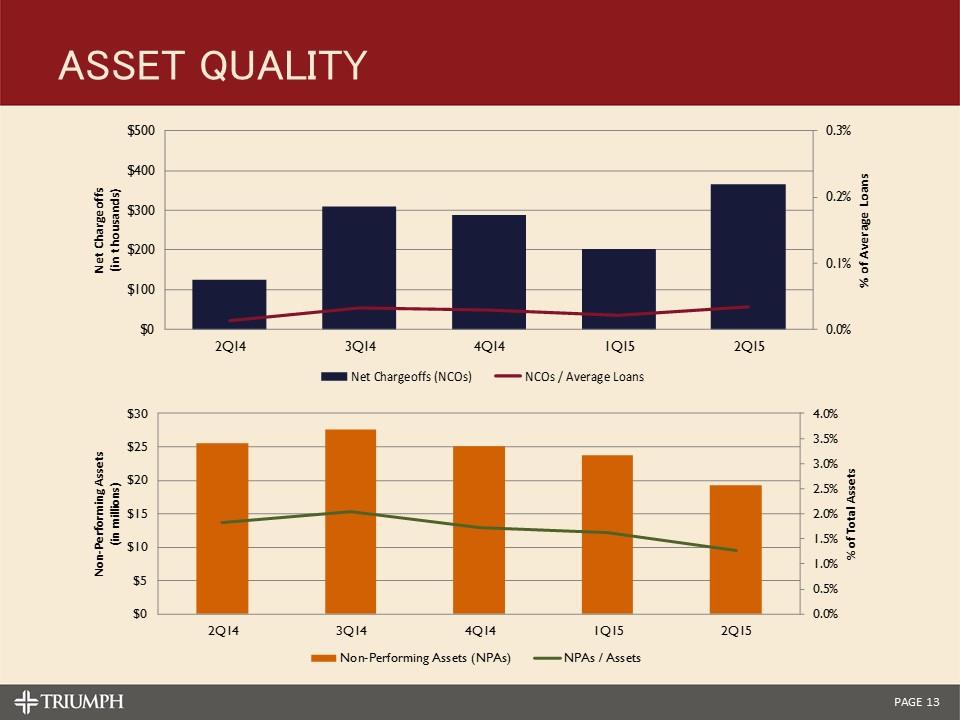
Asset Quality
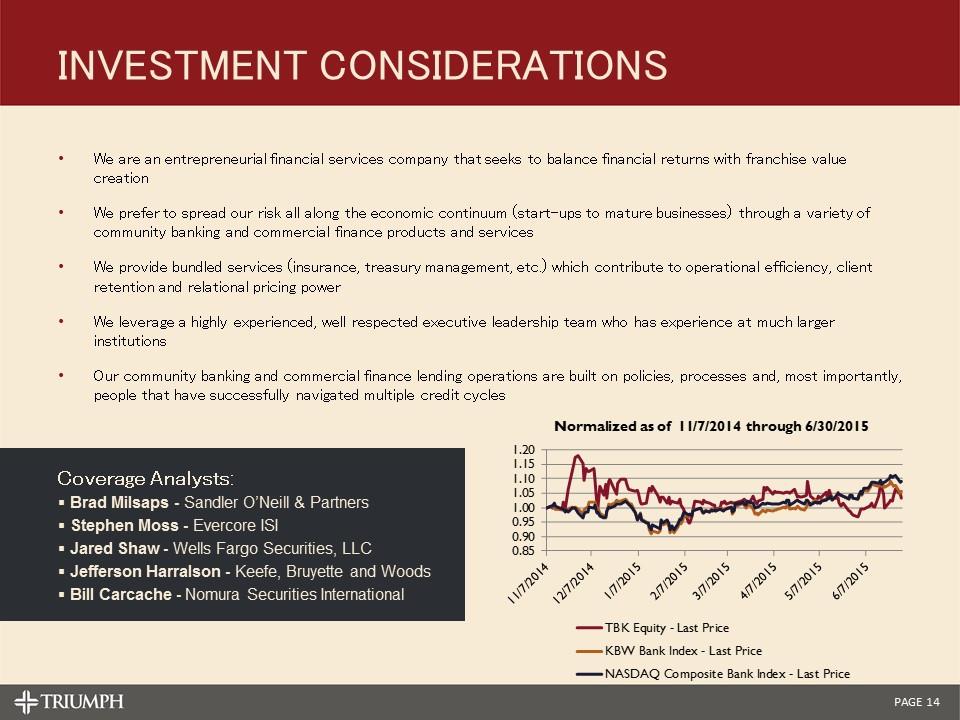
Coverage Analysts: Brad Milsaps - Sandler O’Neill & Partners Stephen Moss - Evercore ISI Jared Shaw - Wells Fargo Securities, LLC Jefferson Harralson - Keefe, Bruyette and Woods Bill Carcache - Nomura Securities International Investment Considerations We are an entrepreneurial financial services company that seeks to balance financial returns with franchise value creation We prefer to spread our risk all along the economic continuum (start-ups to mature businesses) through a variety of community banking and commercial finance products and services We provide bundled services (insurance, treasury management, etc.) which contribute to operational efficiency, client retention and relational pricing power We leverage a highly experienced, well respected executive leadership team who has experience at much larger institutions Our community banking and commercial finance lending operations are built on policies, processes and, most importantly, people that have successfully navigated multiple credit cycles

appendix
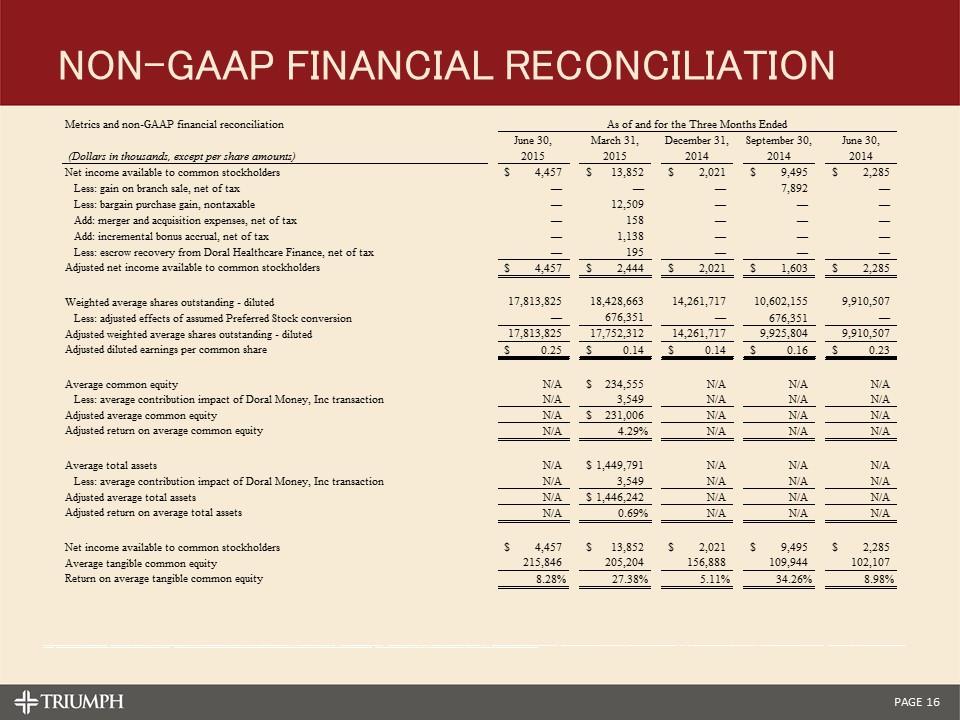
Non-GAAP Financial Reconciliation Metrics and non-GAAP financial reconciliation As of and for the Three Months Ended June 30, March 31, December 31, September 30, June 30, (Dollars in thousands, except per share amounts) 2015 2015 2014 2014 2014 Net income available to common stockholders $4,457 $13,852 $2,021 $9,495 $2,285 Less: gain on branch sale, net of tax — — — 7,892 — Less: bargain purchase gain, nontaxable — 12,509 — — — Add: merger and acquisition expenses, net of tax — 158 — — — Add: incremental bonus accrual, net of tax — 1,138 — — — Less: escrow recovery from Doral Healthcare Finance, net of tax — 195 — — — Adjusted net income available to common stockholders $4,457 $2,444 $2,021 $1,603 $2,285 Weighted average shares outstanding - diluted 17,813,825 18,428,663 14,261,717 10,602,155 9,910,507 Less: adjusted effects of assumed Preferred Stock conversion — 676,351 — 676,351 — Adjusted weighted average shares outstanding - diluted 17,813,825 17,752,312 14,261,717 9,925,804 9,910,507 Adjusted diluted earnings per common share $0.25 $0.14 $0.14 $0.16 $0.23 Average common equity N/A $234,555 N/A N/A N/A Less: average contribution impact of Doral Money, Inc transaction N/A 3,549 N/A N/A N/A Adjusted average common equity N/A $231,006 N/A N/A N/A Adjusted return on average common equity N/A 4.29% N/A N/A N/A Average total assets N/A $1,449,791 N/A N/A N/A Less: average contribution impact of Doral Money, Inc transaction N/A 3,549 N/A N/A N/A Adjusted average total assets N/A $1,446,242 N/A N/A N/A Adjusted return on average total assets N/A 0.69% N/A N/A N/A Net income available to common stockholders $4,457 $13,852 $2,021 $9,495 $2,285 Average tangible common equity 215,846 205,204 156,888 109,944 102,107 Return on average tangible common equity 8.28% 27.38% 5.11% 34.26% 8.98%
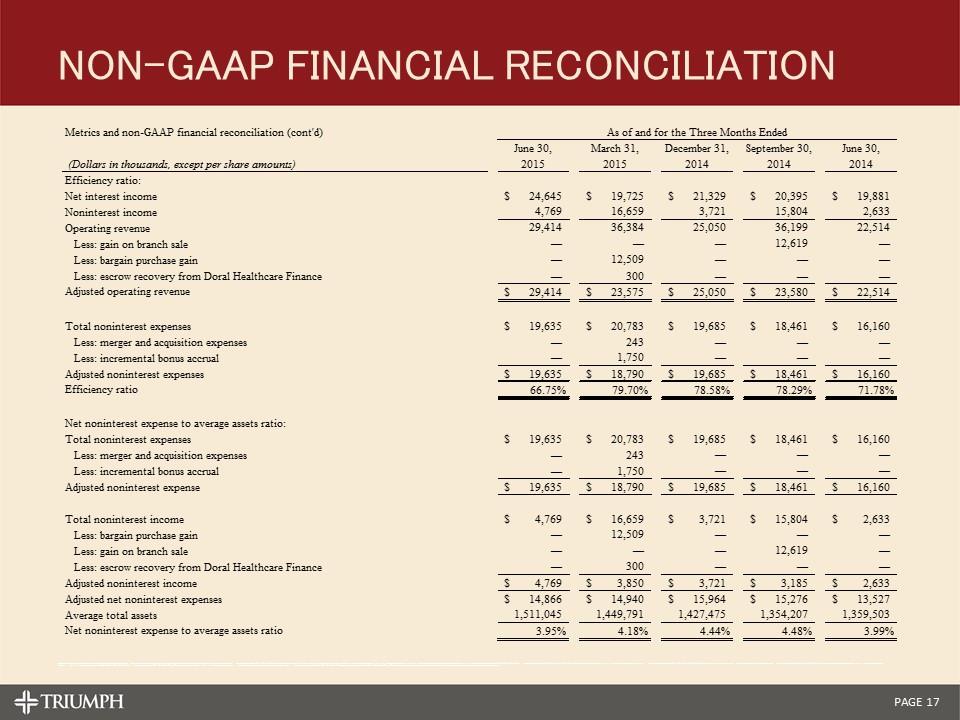
Non-GAAP Financial Reconciliation Metrics and non-GAAP financial reconciliation (cont'd) As of and for the Three Months Ended June 30, March 31, December 31, September 30, June 30, (Dollars in thousands, except per share amounts) 2015 2015 2014 2014 2014 Efficiency ratio: Net interest income $24,645 $19,725 $21,329 $20,395 $19,881 Noninterest income 4,769 16,659 3,721 15,804 2,633 Operating revenue 29,414 36,384 25,050 36,199 22,514 Less: gain on branch sale — — — 12,619 — Less: bargain purchase gain — 12,509 — — — Less: escrow recovery from Doral Healthcare Finance — 300 — — — Adjusted operating revenue $29,414 $23,575 $25,050 $23,580 $22,514 Total noninterest expenses $19,635 $20,783 $19,685 $18,461 $16,160 Less: merger and acquisition expenses — 243 — — — Less: incremental bonus accrual — 1,750 — — — Adjusted noninterest expenses $19,635 $18,790 $19,685 $18,461 $16,160 Efficiency ratio 66.75% 79.70% 78.58% 78.29% 71.78% Net noninterest expense to average assets ratio: Total noninterest expenses $19,635 $20,783 $19,685 $18,461 $16,160 Less: merger and acquisition expenses — 243 — — — Less: incremental bonus accrual — 1,750 — — — Adjusted noninterest expense $19,635 $18,790 $19,685 $18,461 $16,160 Total noninterest income $4,769 $16,659 $3,721 $15,804 $2,633 Less: bargain purchase gain — 12,509 — — — Less: gain on branch sale — — — 12,619 — Less: escrow recovery from Doral Healthcare Finance — 300 — — — Adjusted noninterest income $4,769 $3,850 $3,721 $3,185 $2,633 Adjusted net noninterest expenses $14,866 $14,940 $15,964 $15,276 $13,527 Average total assets 1,511,045 1,449,791 1,427,475 1,354,207 1,359,503 Net noninterest expense to average assets ratio 3.95% 4.18% 4.44% 4.48% 3.99%
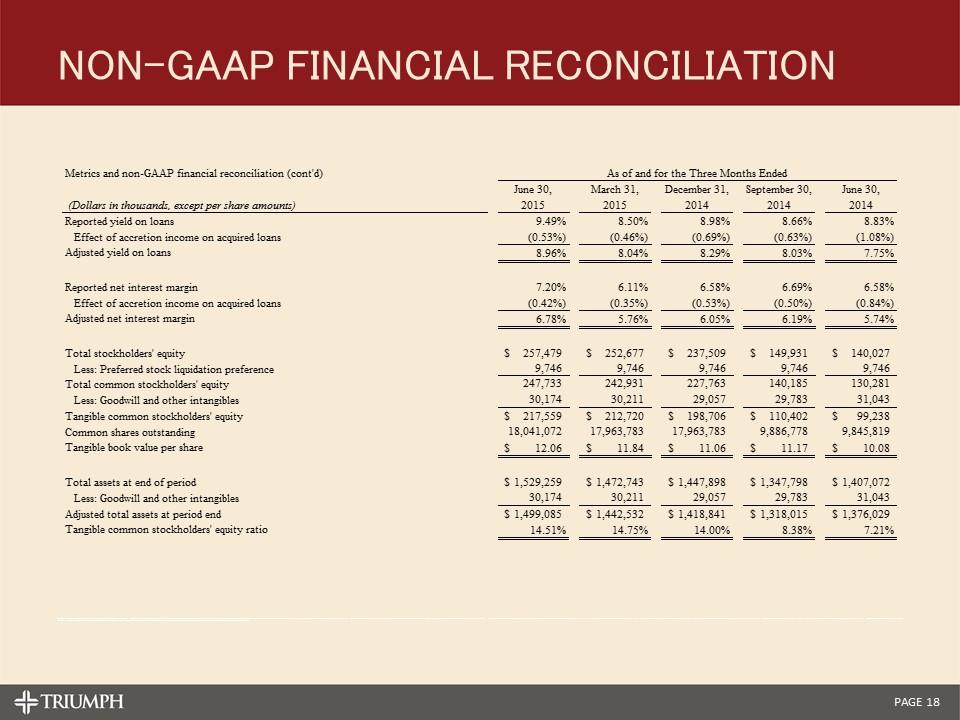
Non-GAAP Financial Reconciliation Metrics and non-GAAP financial reconciliation (cont'd) As of and for the Three Months Ended June 30, March 31, December 31, September 30, June 30, (Dollars in thousands, except per share amounts) 2015 2015 2014 2014 2014 Reported yield on loans 9.49% 8.50% 8.98% 8.66% 8.83% Effect of accretion income on acquired loans (0.53%) (0.46%) (0.69%) (0.63%) (1.08%) Adjusted yield on loans 8.96% 8.04% 8.29% 8.03% 7.75% Reported net interest margin 7.20% 6.11% 6.58% 6.69% 6.58% Effect of accretion income on acquired loans (0.42%) (0.35%) (0.53%) (0.50%) (0.84%) Adjusted net interest margin 6.78% 5.76% 6.05% 6.19% 5.74% Total stockholders' equity $257,479 $252,677 $237,509 $149,931 $140,027 Less: Preferred stock liquidation preference 9,746 9,746 9,746 9,746 9,746 Total common stockholders' equity 247,733 242,931 227,763 140,185 130,281 Less: Goodwill and other intangibles 30,174 30,211 29,057 29,783 31,043 Tangible common stockholders' equity $217,559 $212,720 $198,706 $110,402 $99,238 Common shares outstanding 18,041,072 17,963,783 17,963,783 9,886,778 9,845,819 Tangible book value per share $12.06 $11.84 $11.06 $11.17 $10.08 Total assets at end of period $1,529,259 $1,472,743 $1,447,898 $1,347,798 $1,407,072 Less: Goodwill and other intangibles 30,174 30,211 29,057 29,783 31,043 Adjusted total assets at period end $1,499,085 $1,442,532 $1,418,841 $1,318,015 $1,376,029 Tangible common stockholders' equity ratio 14.51% 14.75% 14.00% 8.38% 7.21%

Commercial Finance Primer July 2015
Asset Based Lending (“ABL”)
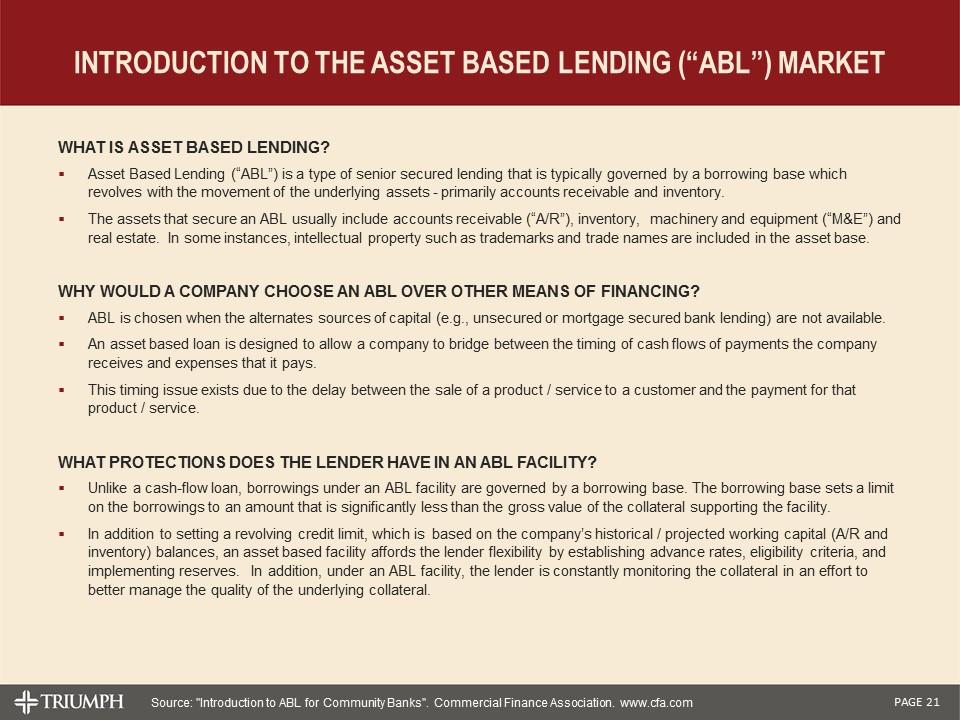
introduction to the Asset Based Lending (“ABL”) market What is Asset Based Lending? Asset Based Lending (“ABL”) is a type of senior secured lending that is typically governed by a borrowing base which revolves with the movement of the underlying assets - primarily accounts receivable and inventory. The assets that secure an ABL usually include accounts receivable (“A/R”), inventory, machinery and equipment (“M&E”) and real estate. In some instances, intellectual property such as trademarks and trade names are included in the asset base. Why would a company choose an ABL over other means of financing? ABL is chosen when the alternates sources of capital (e.g., unsecured or mortgage secured bank lending) are not available. An asset based loan is designed to allow a company to bridge between the timing of cash flows of payments the company receives and expenses that it pays. This timing issue exists due to the delay between the sale of a product / service to a customer and the payment for that product / service. What protections does the lender have in an ABL facility? Unlike a cash-flow loan, borrowings under an ABL facility are governed by a borrowing base. The borrowing base sets a limit on the borrowings to an amount that is significantly less than the gross value of the collateral supporting the facility. In addition to setting a revolving credit limit, which is based on the company’s historical / projected working capital (A/R and inventory) balances, an asset based facility affords the lender flexibility by establishing advance rates, eligibility criteria, and implementing reserves. In addition, under an ABL facility, the lender is constantly monitoring the collateral in an effort to better manage the quality of the underlying collateral. Source: "Introduction to ABL for Community Banks". Commercial Finance Association. www.cfa.com
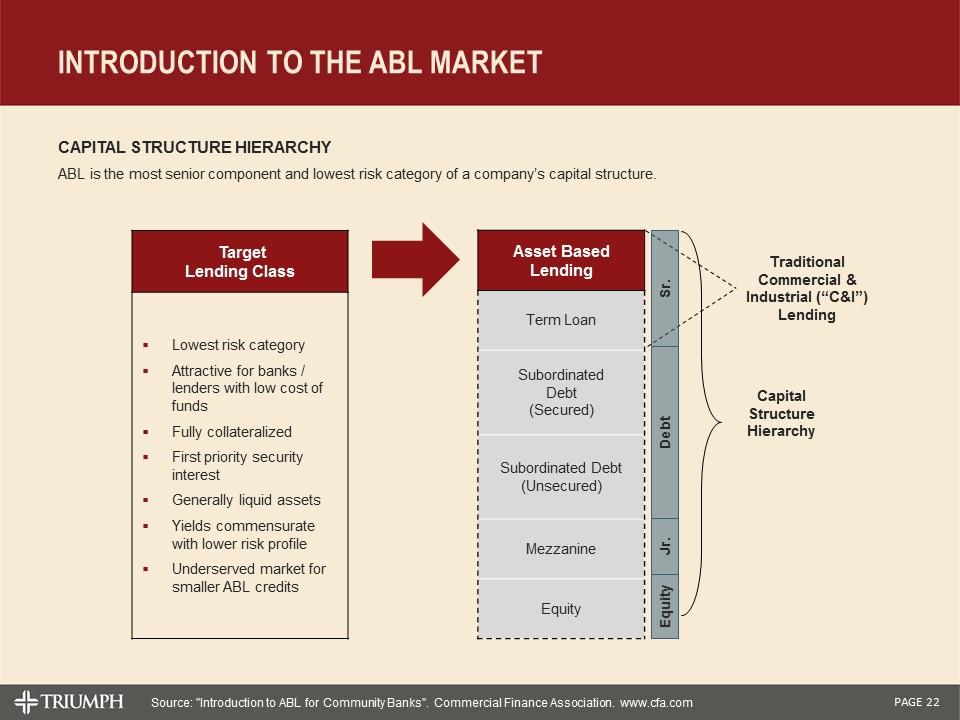
introduction to the ABL market Capital Structure Hierarchy ABL is the most senior component and lowest risk category of a company’s capital structure. Target Lending Class Lowest risk category Attractive for banks / lenders with low cost of funds Fully collateralized First priority security interest Generally liquid assets Yields commensurate with lower risk profile Underserved market for smaller ABL credits Asset Based Lending Term Loan Subordinated Debt (Secured) Subordinated Debt (Unsecured) Mezzanine Equity Equity Capital Structure Hierarchy Traditional Commercial & Industrial (“C&I”) Lending Source: "Introduction to ABL for Community Banks". Commercial Finance Association. www.cfa.com Jr. Debt Sr.
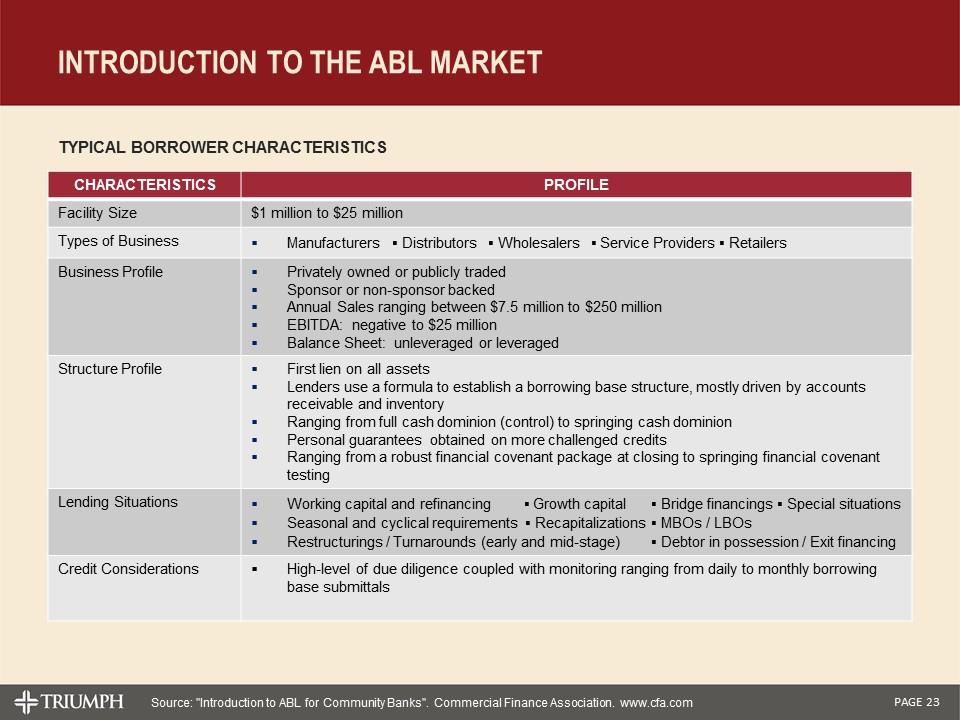
CHARACTERISTICS PROFILE Facility Size $1 million to $25 million Types of Business Manufacturers ▪ Distributors ▪ Wholesalers ▪ Service Providers ▪ Retailers Business Profile Privately owned or publicly traded Sponsor or non-sponsor backed Annual Sales ranging between $7.5 million to $250 million EBITDA: negative to $25 million Balance Sheet: unleveraged or leveraged Structure Profile First lien on all assets Lenders use a formula to establish a borrowing base structure, mostly driven by accounts receivable and inventory Ranging from full cash dominion (control) to springing cash dominion Personal guarantees obtained on more challenged credits Ranging from a robust financial covenant package at closing to springing financial covenant testing Lending Situations Working capital and refinancing ▪ Growth capital ▪ Bridge financings ▪ Special situations Seasonal and cyclical requirements ▪ Recapitalizations ▪ MBOs / LBOs Restructurings / Turnarounds (early and mid-stage) ▪ Debtor in possession / Exit financing Credit Considerations High-level of due diligence coupled with monitoring ranging from daily to monthly borrowing base submittals introduction to the ABL market Source: "Introduction to ABL for Community Banks". Commercial Finance Association. www.cfa.com Typical Borrower Characteristics
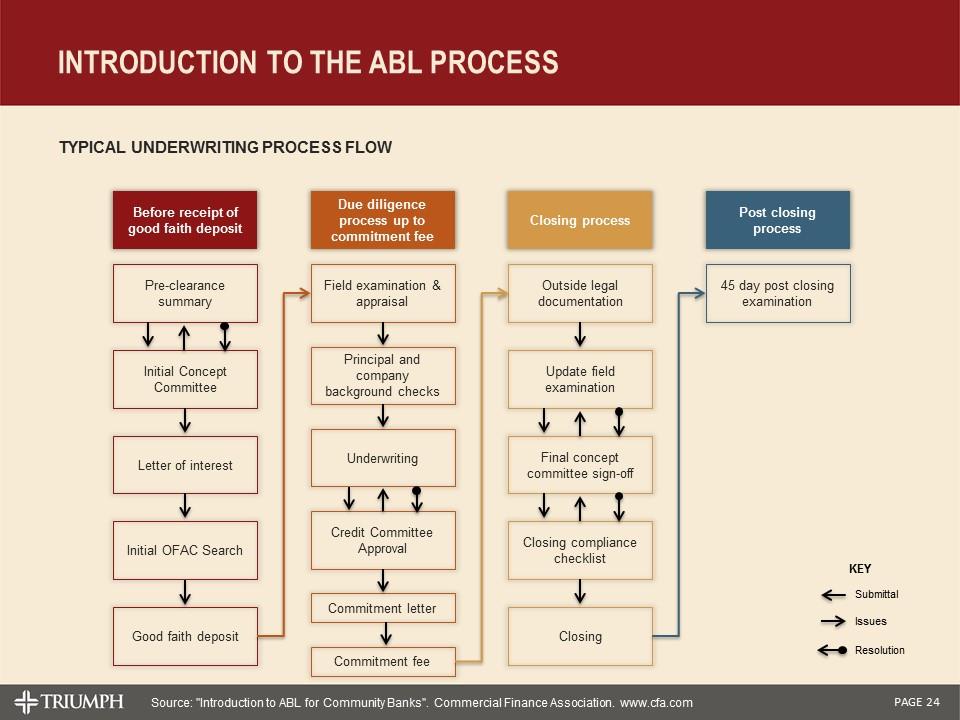
introduction to the ABL Process Source: "Introduction to ABL for Community Banks". Commercial Finance Association. www.cfa.com Typical Underwriting Process Flow Before receipt of good faith deposit Due diligence process up to commitment fee Closing process Post closing process Pre-clearance summary Initial Concept Committee Letter of interest Initial OFAC Search Good faith deposit Field examination & appraisal Principal and company background checks Underwriting Credit Committee Approval Commitment letter Commitment fee Outside legal documentation Update field examination Final concept committee sign-off Closing compliance checklist Closing 45 day post closing examination Submittal Issues Resolution KEY
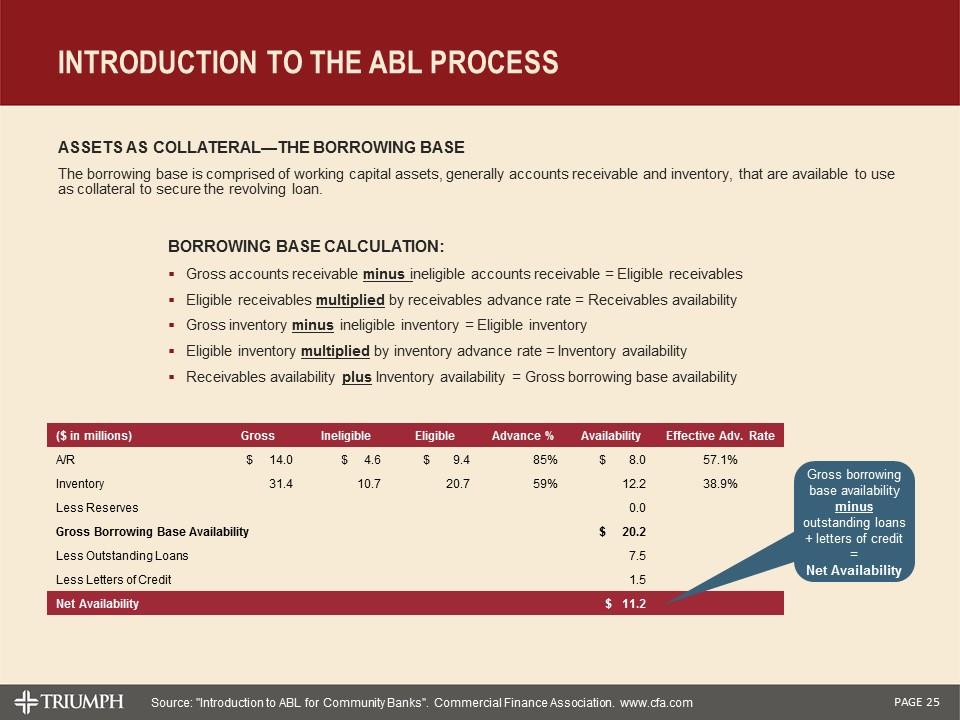
introduction to the ABL Process Source: "Introduction to ABL for Community Banks". Commercial Finance Association. www.cfa.com Assets as Collateral—The Borrowing Base The borrowing base is comprised of working capital assets, generally accounts receivable and inventory, that are available to use as collateral to secure the revolving loan. Borrowing Base Calculation: Gross accounts receivable minus ineligible accounts receivable = Eligible receivables Eligible receivables multiplied by receivables advance rate = Receivables availability Gross inventory minus ineligible inventory = Eligible inventory Eligible inventory multiplied by inventory advance rate = Inventory availability Receivables availability plus Inventory availability = Gross borrowing base availability ($ in millions) Gross Ineligible Eligible Advance % Availability Effective Adv. Rate A/R $ 14.0 $ 4.6 $ 9.4 85% $ 8.0 57.1% Inventory 31.4 10.7 20.7 59% 12.2 38.9% Less Reserves 0.0 Gross Borrowing Base Availability $ 20.2 Less Outstanding Loans 7.5 Less Letters of Credit 1.5 Net Availability $ 11.2 Gross borrowing base availability minus outstanding loans + letters of credit = Net Availability
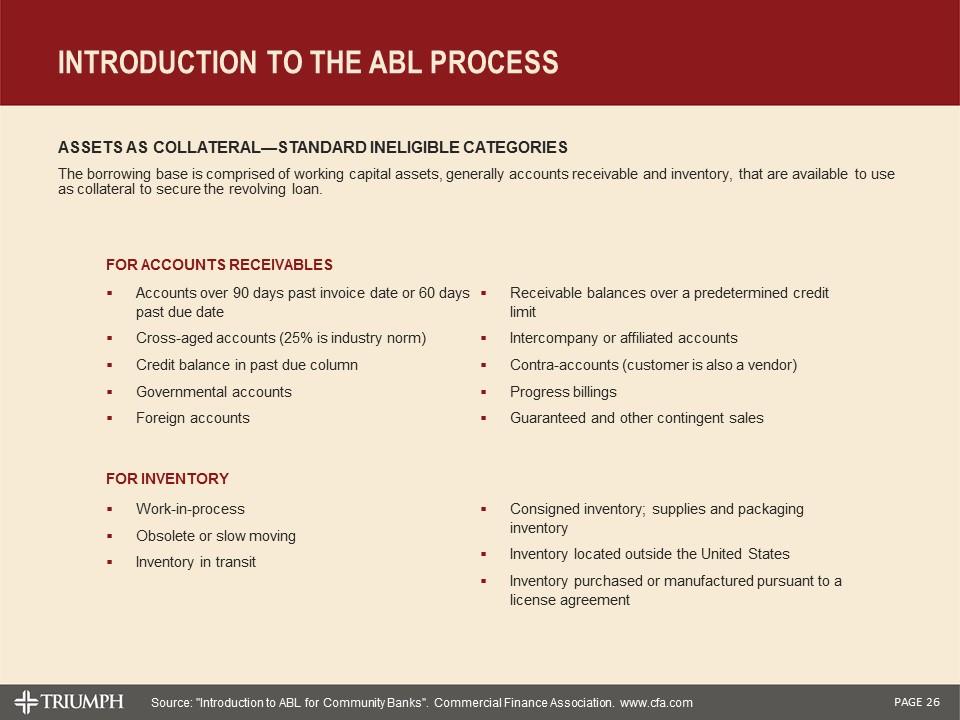
For Inventory Work-in-process Obsolete or slow moving Inventory in transit Consigned inventory; supplies and packaging inventory Inventory located outside the United States Inventory purchased or manufactured pursuant to a license agreement introduction to the ABL Process For Accounts Receivables Source: "Introduction to ABL for Community Banks". Commercial Finance Association. www.cfa.com Assets as Collateral—Standard Ineligible Categories The borrowing base is comprised of working capital assets, generally accounts receivable and inventory, that are available to use as collateral to secure the revolving loan. Accounts over 90 days past invoice date or 60 days past due date Cross-aged accounts (25% is industry norm) Credit balance in past due column Governmental accounts Foreign accounts Receivable balances over a predetermined credit limit Intercompany or affiliated accounts Contra-accounts (customer is also a vendor) Progress billings Guaranteed and other contingent sales
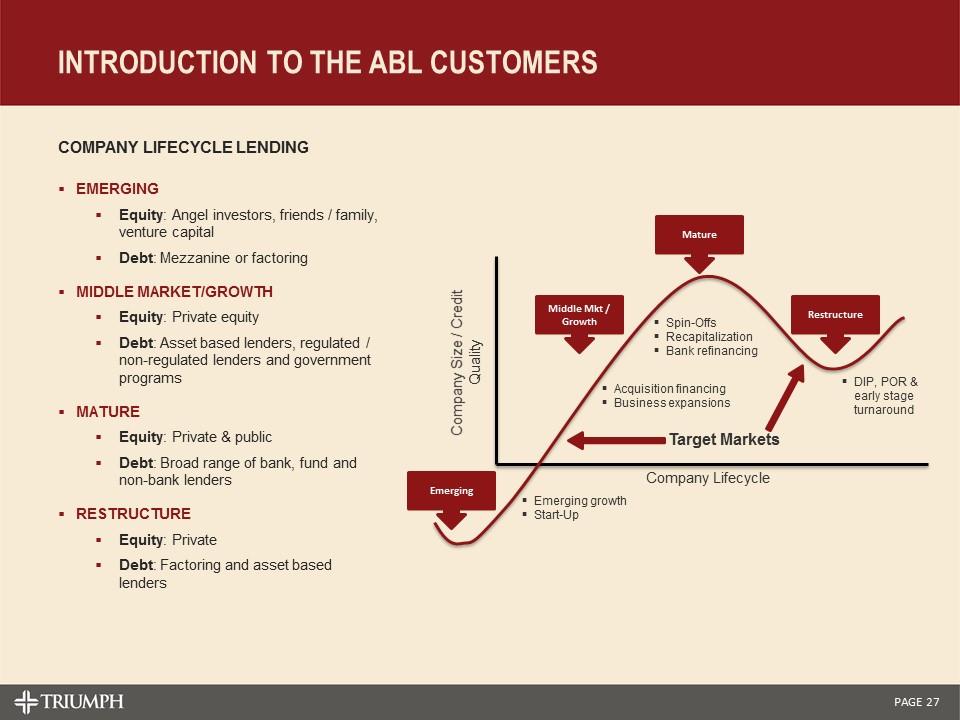
introduction to the ABL customers Emerging Middle Mkt / Growth Mature Restructure Emerging growth Start-Up Acquisition financing Business expansions Spin-Offs Recapitalization Bank refinancing DIP, POR & early stage turnaround Company Lifecycle Company Size / Credit Quality Target Markets Company Lifecycle Lending Emerging Equity: Angel investors, friends / family, venture capital Debt: Mezzanine or factoring Middle Market/Growth Equity: Private equity Debt: Asset based lenders, regulated / non-regulated lenders and government programs Mature Equity: Private & public Debt: Broad range of bank, fund and non-bank lenders Restructure Equity: Private Debt: Factoring and asset based lenders

Factoring
Invoice factoring is a style of working capital finance by which businesses (“clients”) sell their invoices (“accounts” or “accounts receivable”) to a third party commercial financial company, also known as a “factor”. Accounts are typically sold at a discount to their face value, thereby generating fee revenue for the factor. By selling its accounts, rather than borrowing from a bank, a factoring transaction simply converts one asset (accounts) into another asset (cash). Factoring does not put debt on a client’s balance sheet as there are no loans to repay. Upon acquiring the accounts, the factor (i.e., Triumph Business Capital) is provided a perfected interest in the acquired assets enabling it to collect directly from the client’s customer (referred to as the “account debtor”), which becomes the factor’s primary source of repayment. Transactions are 100% business-to-business, without involvement of non-commercial consumers. In the transportation sector, for example, the account debtors are ultimately the shippers who procure trucking services from Triumph Business Capital’s clients. Intermediaries, such as freight brokers and logistics companies, may be involved in the transaction as well. Because the invoices represent completed services with documented acceptance, freight bills represent some of the strongest collateral available to factors, and are substantially free of setoff or recoupment. Since trucking firms typically carry freight for different commodities, credit risk is enhanced by a broad range of industry diversification. To further reduce their exposure, many factors will engage only in “recourse” factoring transactions, in which the factor may “charge back” uncollected or problem accounts to the client, regardless of reason for non-payment. In “non-recourse” factoring, the factor assumes full responsibility for the credit risk associated with the account debtor. Triumph Business Capital offers factoring in both “recourse” and “non-recourse” structures. Beginning in 2014, Triumph Business Capital expanded its product offering to non-transportation, or “General”, clients, which present collateral with credit qualities and servicing protocols that are fundamentally similar to its existing transportation portfolio. The four basic factoring “products” are illustrated on the following page. Factoring Overview
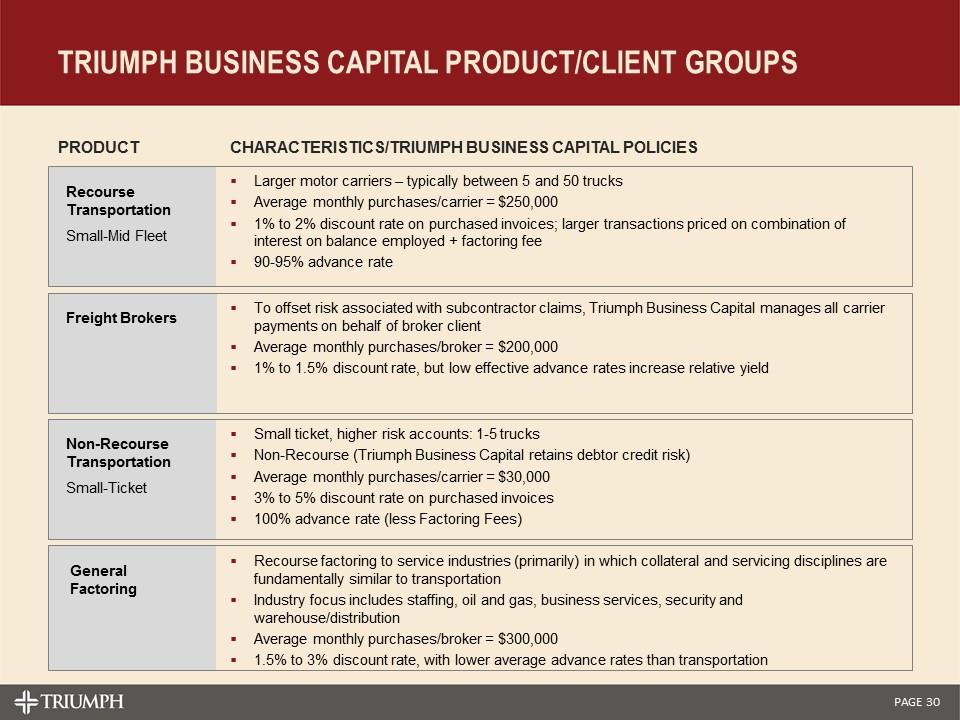
Non-Recourse Transportation Small-Ticket Recourse Transportation Small-Mid Fleet Freight Brokers General Factoring Small ticket, higher risk accounts: 1-5 trucks Non-Recourse (Triumph Business Capital retains debtor credit risk) Average monthly purchases/carrier = $30,000 3% to 5% discount rate on purchased invoices 100% advance rate (less Factoring Fees) To offset risk associated with subcontractor claims, Triumph Business Capital manages all carrier payments on behalf of broker client Average monthly purchases/broker = $200,000 1% to 1.5% discount rate, but low effective advance rates increase relative yield Larger motor carriers – typically between 5 and 50 trucks Average monthly purchases/carrier = $250,000 1% to 2% discount rate on purchased invoices; larger transactions priced on combination of interest on balance employed + factoring fee 90-95% advance rate Recourse factoring to service industries (primarily) in which collateral and servicing disciplines are fundamentally similar to transportation Industry focus includes staffing, oil and gas, business services, security and warehouse/distribution Average monthly purchases/broker = $300,000 1.5% to 3% discount rate, with lower average advance rates than transportation Triumph Business Capital Product/Client Groups Product Characteristics/Triumph Business Capital Policies
Collateral Acceptability and Client Reserves In all cases, a factor is in a primary, first-lien position against its client’s accounts receivable. There may be other liens on the accounts, but these are subordinate to the factor. An acceptable invoice is one that has no outstanding contingencies affecting the purchaser’s obligation for payment. In evaluating accounts receivable, a factor must first determine which assets are ineligible for advances. This process requires clearly defined procedures relating to account delinquencies, cross-aging, accounts due from affiliates (or otherwise subject to setoff), account debtor concentrations, etc. Most factors advance up to 95% of the face value of the invoice. The unfunded portion is held in a “client reserve’’, which factors use as protection against uncollected and/or doubtful accounts. When the invoices are paid, the factor will classify the client reserve as earned (or “cash reserve”), from which will be subtracted applicable discount fees, short-pays and any other amounts owed by the client to the factor. As an example, if a recourse factoring transaction has a 90 day repurchase provision, the factor may debit expired/ineligible accounts from the client’s reserve account. Factors ultimately distribute the cash reserve balances to the client’s designated bank account on a periodic basis, provided that the aggregate reserve does not fall below the contracted threshold against aggregate purchases. Given the strength of the contractual structure, a factor’s substantive risk of loss tends to be associated with client fraud – such as collateral misrepresentation and/or conversion of cash payments. Consequently, the most effective risk management programs focus on ongoing fraud detection, monitoring and vigilance, in addition to initial underwriting disciplines. The page which follows provides an example of a typical factoring transaction.
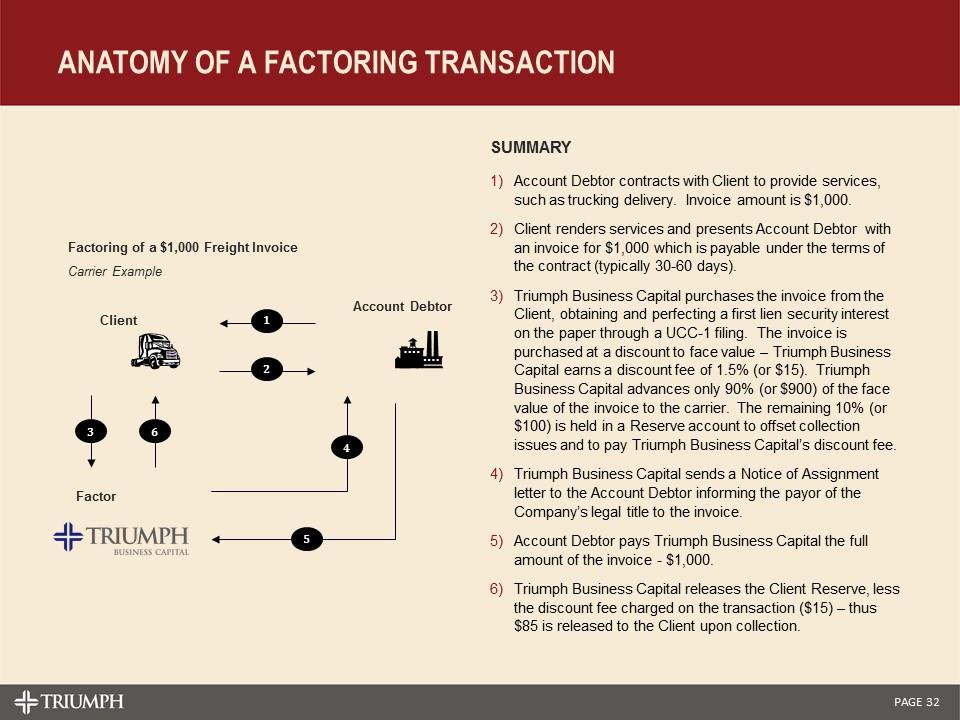
Anatomy of a Factoring Transaction Factoring of a $1,000 Freight Invoice Carrier Example Client Account Debtor Factor 1 2 3 6 4 5 Summary Account Debtor contracts with Client to provide services, such as trucking delivery. Invoice amount is $1,000. Client renders services and presents Account Debtor with an invoice for $1,000 which is payable under the terms of the contract (typically 30-60 days). Triumph Business Capital purchases the invoice from the Client, obtaining and perfecting a first lien security interest on the paper through a UCC-1 filing. The invoice is purchased at a discount to face value – Triumph Business Capital earns a discount fee of 1.5% (or $15). Triumph Business Capital advances only 90% (or $900) of the face value of the invoice to the carrier. The remaining 10% (or $100) is held in a Reserve account to offset collection issues and to pay Triumph Business Capital’s discount fee. Triumph Business Capital sends a Notice of Assignment letter to the Account Debtor informing the payor of the Company’s legal title to the invoice. Account Debtor pays Triumph Business Capital the full amount of the invoice - $1,000. Triumph Business Capital releases the Client Reserve, less the discount fee charged on the transaction ($15) – thus $85 is released to the Client upon collection.
