Attached files
| file | filename |
|---|---|
| 8-K - MIDSOUTH BANCORP FORM 8-K - MIDSOUTH BANCORP INC | form8-kxjuly27.htm |
| EX-99.1 - PRESS RELEASE - JULY 28, 2015 - MIDSOUTH BANCORP INC | mslq206302015er-8kex991.htm |

2Q15 Supplemental Materials July 27, 2015 1NYSE: MSL
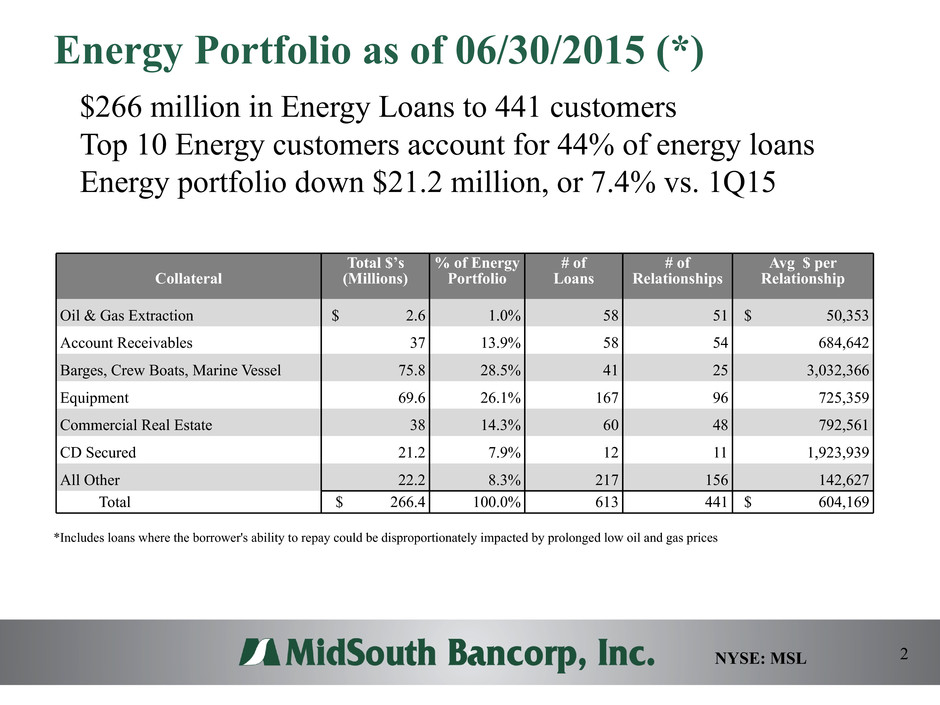
Energy Portfolio as of 06/30/2015 (*) *Includes loans where the borrower's ability to repay could be disproportionately impacted by prolonged low oil and gas prices 2NYSE: MSL $266 million in Energy Loans to 441 customers Top 10 Energy customers account for 44% of energy loans Energy portfolio down $21.2 million, or 7.4% vs. 1Q15 Collateral Total $’s (Millions) % of Energy Portfolio # of Loans # of Relationships Avg $ per Relationship Oil & Gas Extraction $ 2.6 1.0% 58 51 $ 50,353 Account Receivables 37 13.9% 58 54 684,642 Barges, Crew Boats, Marine Vessel 75.8 28.5% 41 25 3,032,366 Equipment 69.6 26.1% 167 96 725,359 Commercial Real Estate 38 14.3% 60 48 792,561 CD Secured 21.2 7.9% 12 11 1,923,939 All Other 22.2 8.3% 217 156 142,627 Total $ 266.4 100.0% 613 441 $ 604,169
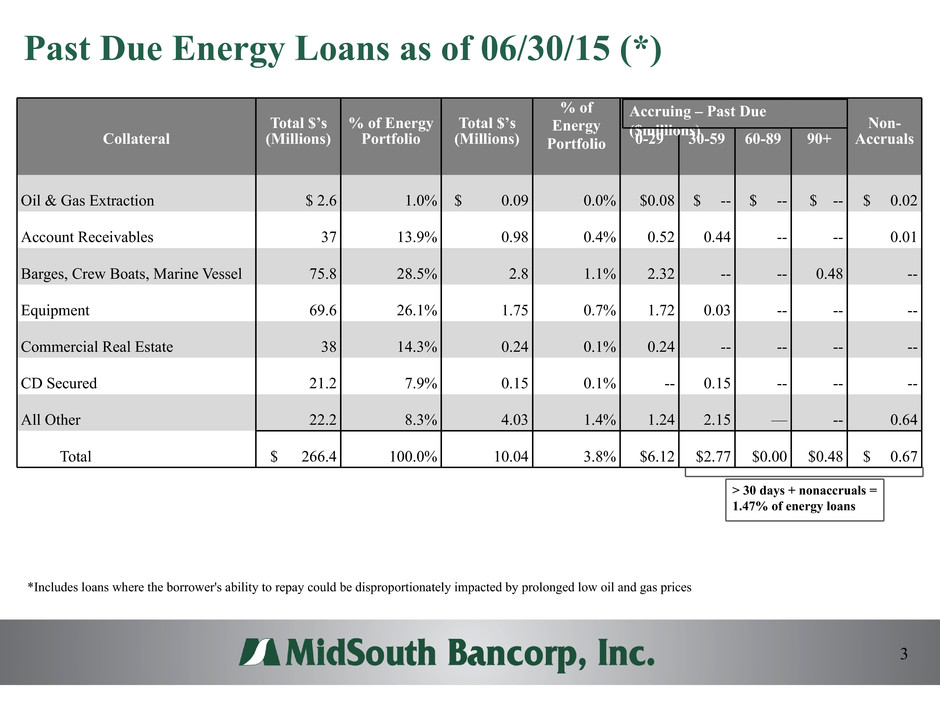
Past Due Energy Loans as of 06/30/15 (*) *Includes loans where the borrower's ability to repay could be disproportionately impacted by prolonged low oil and gas prices > 30 days + nonaccruals = 1.47% of energy loans 3 Collateral Total $’s (Millions) % of Energy Portfolio Total $’s (Millions) % of Energy Portfolio 0-29 30-59 60-89 90+ Non- Accruals Oil & Gas Extraction $ 2.6 1.0% $ 0.09 0.0% $0.08 $ -- $ -- $ -- $ 0.02 Account Receivables 37 13.9% 0.98 0.4% 0.52 0.44 -- -- 0.01 Barges, Crew Boats, Marine Vessel 75.8 28.5% 2.8 1.1% 2.32 -- -- 0.48 -- Equipment 69.6 26.1% 1.75 0.7% 1.72 0.03 -- -- -- Commercial Real Estate 38 14.3% 0.24 0.1% 0.24 -- -- -- -- CD Secured 21.2 7.9% 0.15 0.1% -- 0.15 -- -- -- All Other 22.2 8.3% 4.03 1.4% 1.24 2.15 — -- 0.64 Total $ 266.4 100.0% 10.04 3.8% $6.12 $2.77 $0.00 $0.48 $ 0.67 Accruing – Past Due ($millions)
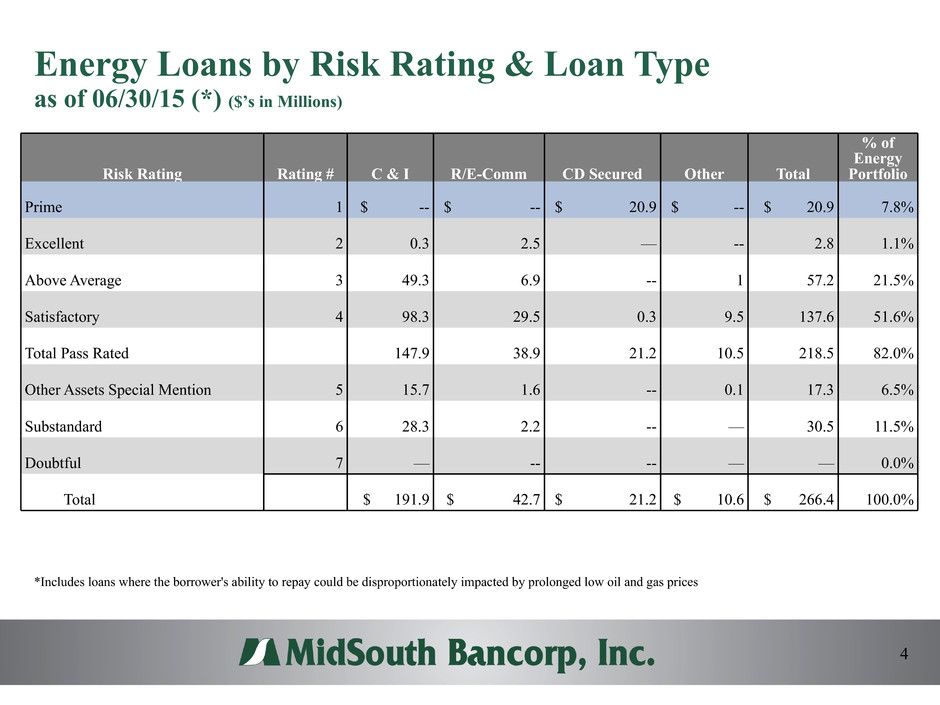
Energy Loans by Risk Rating & Loan Type as of 06/30/15 (*) ($’s in Millions) *Includes loans where the borrower's ability to repay could be disproportionately impacted by prolonged low oil and gas prices 4 Risk Rating Rating # C & I R/E-Comm CD Secured Other Total % of Energy Portfolio Prime 1 $ -- $ -- $ 20.9 $ -- $ 20.9 7.8% Excellent 2 0.3 2.5 — -- 2.8 1.1% Above Average 3 49.3 6.9 -- 1 57.2 21.5% Satisfactory 4 98.3 29.5 0.3 9.5 137.6 51.6% Total Pass Rated 147.9 38.9 21.2 10.5 218.5 82.0% Other Assets Special Mention 5 15.7 1.6 -- 0.1 17.3 6.5% Substandard 6 28.3 2.2 -- — 30.5 11.5% Doubtful 7 — -- -- — — 0.0% Total $ 191.9 $ 42.7 $ 21.2 $ 10.6 $ 266.4 100.0%
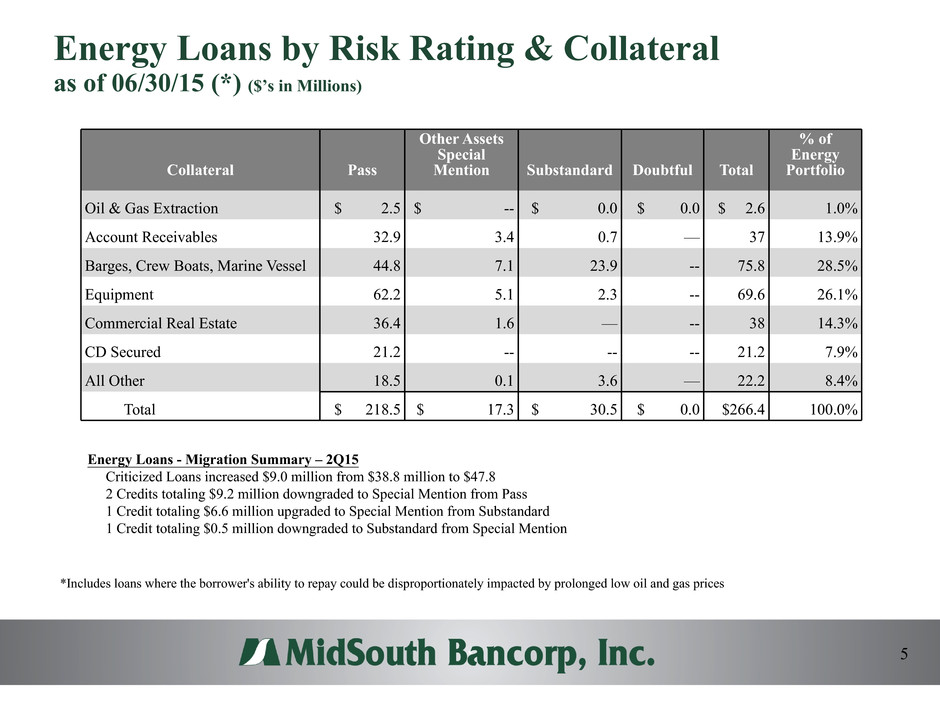
Energy Loans by Risk Rating & Collateral as of 06/30/15 (*) ($’s in Millions) *Includes loans where the borrower's ability to repay could be disproportionately impacted by prolonged low oil and gas prices 5 Collateral Pass Other Assets Special Mention Substandard Doubtful Total % of Energy Portfolio Oil & Gas Extraction $ 2.5 $ -- $ 0.0 $ 0.0 $ 2.6 1.0% Account Receivables 32.9 3.4 0.7 — 37 13.9% Barges, Crew Boats, Marine Vessel 44.8 7.1 23.9 -- 75.8 28.5% Equipment 62.2 5.1 2.3 -- 69.6 26.1% Commercial Real Estate 36.4 1.6 — -- 38 14.3% CD Secured 21.2 -- -- -- 21.2 7.9% All Other 18.5 0.1 3.6 — 22.2 8.4% Total $ 218.5 $ 17.3 $ 30.5 $ 0.0 $266.4 100.0% Energy Loans - Migration Summary – 2Q15 Criticized Loans increased $9.0 million from $38.8 million to $47.8 2 Credits totaling $9.2 million downgraded to Special Mention from Pass 1 Credit totaling $6.6 million upgraded to Special Mention from Substandard 1 Credit totaling $0.5 million downgraded to Substandard from Special Mention
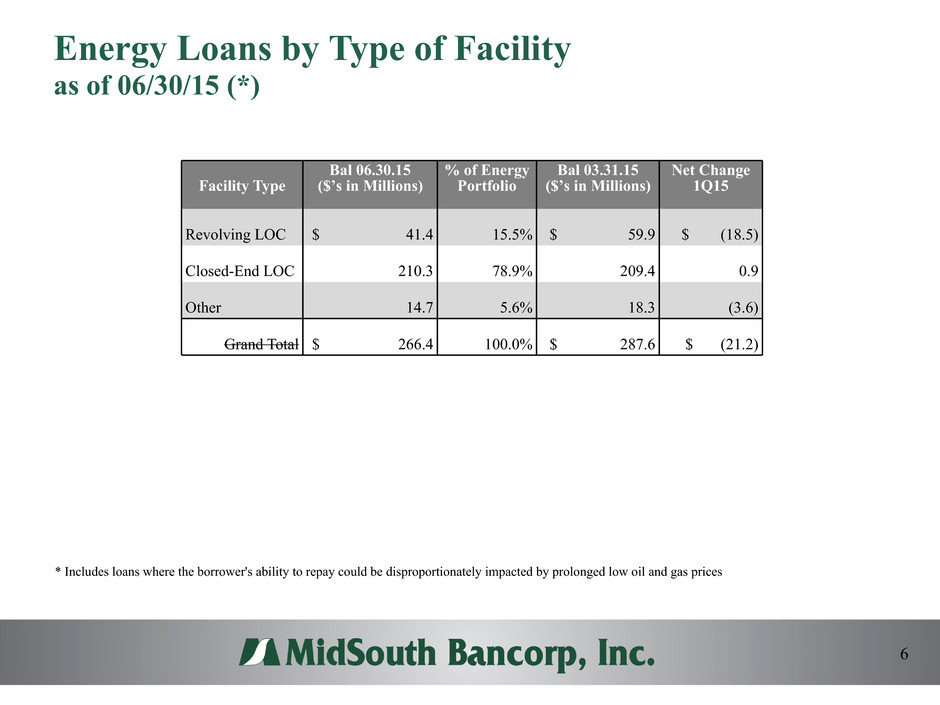
Energy Loans by Type of Facility as of 06/30/15 (*) * Includes loans where the borrower's ability to repay could be disproportionately impacted by prolonged low oil and gas prices 6 Facility Type Bal 06.30.15 ($’s in Millions) % of Energy Portfolio Bal 03.31.15 ($’s in Millions) Net Change 1Q15 Revolving LOC $ 41.4 15.5% $ 59.9 $ (18.5) Closed-End LOC 210.3 78.9% 209.4 0.9 Other 14.7 5.6% 18.3 (3.6) Grand Total $ 266.4 100.0% $ 287.6 $ (21.2)
