Attached files
| file | filename |
|---|---|
| 8-K - 8-K - SL GREEN REALTY CORP | a15-16121_18k.htm |
| EX-99.1 - EX-99.1 - SL GREEN REALTY CORP | a15-16121_1ex99d1.htm |
Exhibit 99.2

SECOND QUARTER 2015
SUPPLEMENTAL DATA
JUNE 30, 2015

|
|
|
|
|
|
|
|
|

SL Green Realty Corp. is a fully integrated, self-administered and self-managed Real Estate Investment Trust, or REIT, that primarily acquires, owns, manages, leases and repositions office properties in emerging, high-growth submarkets of Manhattan.
· SL Green’s common stock is listed on the New York Stock Exchange, and trades under the symbol SLG.
· SL Green maintains an internet site at www.slgreen.com at which most key investor relations data pertaining to dividend declaration, payout, current and historic share price, etc. can be found. Such information is not incorporated into this supplemental financial package. This supplemental financial package is available through the Company’s internet site.
· This data is furnished to supplement audited and unaudited regulatory filings of the Company and should be read in conjunction with those filings. The financial data herein is unaudited and is provided from the perspective of timeliness to assist readers of quarterly and annual financial filings. As such, data otherwise contained in future regulatory filings covering the same period may restate the data presented herein.
Questions pertaining to the information contained herein should be referred to Investor Relations at investor.relations@slgreen.com or at 212-594-2700.
Ratings
Ratings are not recommendations to buy, sell or hold the Company’s securities.
Forward-looking Statement
This press release includes certain statements that may be deemed to be “forward-looking statements” within the meaning of the Private Securities Litigation Reform Act of 1995 and are intended to be covered by the safe harbor provisions thereof. All statements, other than statements of historical facts, included in this press release that address activities, events or developments that we expect, believe or anticipate will or may occur in the future, are forward-looking statements. Forward-looking statements are not guarantees of future performance and we caution you not to place undue reliance on such statements. Forward-looking statements are generally identifiable by the use of the words “may,” “will,” “should,” “expect,” “anticipate,” “estimate,” “believe,” “intend,” “project,” “continue,” or the negative of these words, or other similar words or terms.
Forward-looking statements contained in this press release are subject to a number of risks and uncertainties, many of which are beyond our control, that may cause our actual results, performance or achievements to be materially different from future results, performance or achievements expressed or implied by forward- looking statements made by us. Factors and risks to our business that could cause actual results to differ from those contained in the forward-looking statements are described in our filings with the Securities and Exchange Commission. We undertake no obligation to publicly update or revise any forward-looking statements, whether as a result of future events, new information or otherwise.
The following discussion related to the consolidated financial statements of the Company should be read in conjunction with the financial statements for the quarter ended June 30, 2015 that will be released on Form 10-Q to be filed on or before August 10, 2015.
|
|
|
|
TABLE OF CONTENTS |
|
|
|
|

|
Highlights of Current Period Financial Performance |
|
|
|
|
|
|
|
|
|
Unaudited Financial Statements |
|
|
|
|
Corporate Profile |
|
4 |
|
|
Highlights |
|
5-14 |
|
|
Comparative Balance Sheets |
|
15-16 |
|
|
Comparative Statements of Operations |
|
17 |
|
|
Comparative Computation of FFO and FAD |
|
18 |
|
|
Consolidated Statement of Equity |
|
19 |
|
|
Joint Venture Statements |
|
20-22 |
|
|
|
|
|
|
|
Selected Financial Data |
|
23-26 |
|
|
Debt Summary Schedule |
|
27-29 |
|
|
Summary of Ground Lease Arrangements |
|
30 |
|
|
|
|
|
|
|
Debt and Preferred Equity Investments |
|
31-33 |
|
|
|
|
|
|
|
Selected Property Data |
|
|
|
|
Composition of Property Portfolio |
|
34-41 |
|
|
Largest Tenants |
|
42 |
|
|
Tenant Diversification |
|
43 |
|
|
Leasing Activity Summary |
|
44-47 |
|
|
Annual Lease Expirations |
|
48-50 |
|
|
|
|
|
|
|
Summary of Real Estate Acquisition/Disposition Activity |
|
51-56 |
|
|
Corporate Information |
|
57 |
|
|
Analyst Coverage |
|
58 |
|
|
Supplemental Definitions |
|
59 |
|
|
|
|
|
CORPORATE PROFILE |
|
|
|
|

SL Green Realty Corp., or the Company, is an S&P 500 company and New York City’s largest office landlord. The Company is a self-managed Real Estate Investment Trust, or REIT, with in-house capabilities in property management, acquisitions and dispositions, financing, development and redevelopment, construction and leasing.
SL Green, a Maryland corporation, and SL Green Operating Partnership, L.P., or the Operating Partnership, a Delaware limited partnership, were formed in June 1997 for the purpose of combining the commercial real estate business of S.L. Green Properties, Inc. and its affiliated partnerships and entities. The Operating Partnership received a contribution of interest in the real estate properties, as well as 95% of the economic interest in the management, leasing and construction companies, which are referred to as the Service Corporation, a consolidated variable interest entity. All of the management, leasing and construction services with respect to the properties that are wholly-owned by us are conducted through SL Green Management LLC which is 100% owned by the Operating Partnership.
Substantially all of our assets are held by, and all of our operations are conducted through the Operating Partnership. The Company is the sole managing general partner of the Operating Partnership.
Reckson Operating Partnership, L.P., or ROP, commenced operations in June 1995 and became a wholly-owned subsidiary of the Operating Partnership, in January 2007.
As of June 30, 2015, SL Green held interests in 120 Manhattan buildings totaling 44.1 million square feet. This included ownership interests in 29.0 million square feet of commercial buildings and debt and preferred equity investments secured by 15.1 million square feet of buildings. In addition to its Manhattan investments, SL Green held ownership interests in 37 suburban buildings totaling 5.9 million square feet in Brooklyn, Long Island, Westchester County, Connecticut and New Jersey.
|
|
|
|
SECOND QUARTER 2015 HIGHLIGHTS Unaudited |
|
|
|
|
SUMMARY
New York, NY, July 22, 2015 — SL Green Realty Corp. (NYSE: SLG) today reported funds from operations, or FFO, for the quarter ended June 30, 2015 of $171.7 million, or $1.65 per share, before transaction related costs of $3.1 million, or $0.03 per share, as compared to FFO for the same period in 2014 of $162.6 million, or $1.64 per share, before transaction related costs of $1.7 million, or $0.02 per share. FFO for the current quarter includes the recognition of the Company’s share of lease termination income at 919 Third Avenue of $5.8 million. Prior year FFO included a promote of $10.3 million recognized on the sale of 747 Madison Avenue.
Net loss attributable to common stockholders for the quarter ended June 30, 2015 totaled $39.1 million, or $0.39 per share, inclusive of $99.1 million, or $0.95 per share, of acceleration depreciation expense related to the properties that comprise the One Vanderbilt development site. Net income attributable to common stockholders for the quarter ended June 30, 2014 totaled $235.5 million, or $2.46 per share, inclusive of $117.8 million, or $1.18 per share, of gains recognized from the sale of 673 First Avenue and a purchase price fair value adjustment of $71.4 million, or $0.72 per share, related to the acquisition of the Company’s joint venture partner’s interest in 388-390 Greenwich Street.
All per share amounts in this press release are presented on a diluted basis
Operating and Leasing Activity
For the quarter ended June 30, 2015, the Company reported consolidated revenues and operating income of $409.1 million and $251.3 million, respectively, compared to $380.6 million and $233.7 million, respectively, for the same period in 2014.
Same-store cash NOI on a combined basis increased by 4.9 percent to $183.8 million and by 4.0 percent to $353.6 million for the three and six months ended June 30, 2015, respectively, as compared to the same periods in 2014. For the three months ended June 30, 2015, consolidated property same-store cash NOI increased by 5.0 percent to $163.3 million and unconsolidated joint venture property same-store cash NOI increased by 3.6 percent to $20.5 million, as compared to the same period in 2014. For the six months ended June 30, 2015, consolidated property same-store cash NOI increased by 3.7 percent to $313.1 million and unconsolidated joint venture property same-store cash NOI increased by 6.1 percent to $40.4 million, as compared to the same period in 2014.
During the second quarter, the Company signed 50 office leases in its Manhattan portfolio totaling 839,590 square feet. Seventeen leases comprising 306,913 square feet represented office leases that replaced previous vacancy. Thirty-three leases comprising 532,677 square feet, representing office leases on space that had been occupied within the prior twelve months, are considered replacement leases on which mark-to-market is
|
|
|
|
SECOND QUARTER 2015 HIGHLIGHTS Unaudited |
|

calculated. Those replacement leases had average starting rents of $60.74 per rentable square foot, representing an 11.3 percent increase over the previously fully escalated rents on the same office spaces. The average lease term on the Manhattan office leases signed in the second quarter was 11.2 years and average tenant concessions were 7.5 months of free rent with a tenant improvement allowance of $60.17 per rentable square foot.
During the first six months of 2015, the Company signed 94 office leases in its Manhattan portfolio totaling 1,305,838 square feet. Thirty-two leases comprising 621,191 square feet represented office leases that replaced previous vacancy. Sixty- two leases comprising 684,647 square feet, representing office leases on space that had been occupied within the prior twelve months, are considered replacement leases on which mark-to- market is calculated. Those replacement leases had average starting rents of $62.40 per rentable square foot, representing a 12.6 percent increase over the previously fully escalated rents on the same office spaces.
Manhattan same-store occupancy increased to 97.0 percent at June 30, 2015, inclusive of 103,385 square feet of leases signed but not yet commenced, as compared to 94.9 percent at June 30, 2014 and 95.9 percent at March 31, 2015.
During the second quarter, the Company signed 32 office leases in its Suburban portfolio totaling 203,768 square feet. Nine leases comprising 35,188 square feet represented office leases that replaced previous vacancy.
Twenty-three leases comprising the remaining 168,580 square feet, representing office leases on space that had been occupied within the prior twelve months, are considered replacement leases on which mark-to-market is calculated. Those replacement leases had average starting rents of $34.85 per rentable square foot, representing a 1.0 percent decrease over the previously fully escalated rents on the same office spaces. The average lease term on the Suburban office leases signed in the second quarter was 6.2 years and average tenant concessions were 5.0 months of free rent with a tenant improvement allowance of $26.65 per rentable square foot.
During the first six months of 2015, the Company signed 65 office leases in its Suburban portfolio totaling 414,678 square feet. Twenty leases comprising 131,329 square feet represented office leases that replaced previous vacancy. Forty- five leases comprising 283,349 square feet, representing office leases on space that had been occupied within the prior twelve months, are considered replacement leases on which mark-to- market is calculated. Those replacement leases had average starting rents of $34.07 per rentable square foot, representing a 3.5 percent decrease over the previously fully escalated rents on the same office spaces.
Same-store occupancy for the Company’s Suburban portfolio was 84.2 percent at June 30, 2015, inclusive of 127,646 square feet of leases signed but not yet commenced, as compared to 83.4 percent at June 30, 2014 and 83.5 percent at March 31, 2015.
|
|
|
|
SECOND QUARTER 2015 HIGHLIGHTS Unaudited |
|

Significant leases that were signed during the second quarter included:
· New lease on a total of 350,173 square feet on 10 floors with Bloomberg LP, the world’s premier information network, for 15.0 years at 919 Third Avenue;
· New lease on 133,208 square feet with WeWork for 15.0 years, comprising all nine floors at 315 West 36th Street;
· Early renewal on 70,145 square feet with Astor Parking, LLC at 1515 Broadway, bringing the remaining lease term to 10.1 years;
· New lease on 41,830 square feet with GIC (New York) Inc. at 280 Park Avenue for 15.0 years;
· New lease on 33,250 square feet with Golden Tree Asset Management LP at 485 Lexington Avenue for 10.5 years;
· Early renewal on 30,365 square feet with Haworth, Inc. at 125 Park Avenue, bringing the remaining lease term to 12.4 years;
· Early renewal on 27,321 square feet with UBS Financial Services at 750 Washington Boulevard, Stamford, Connecticut, bringing the remaining lease term to 6.8 years;
· New lease on 26,520 square feet with Shiseido at The Meadows, Rutherford, New Jersey for 10.8 years; and
· New lease on 21,981 square feet with Infor (US), Inc. at 641 Sixth Avenue for 10.8 years increasing its commitment to 136,029 square feet at 635-641 Sixth Avenue.
In July, the Company announced that Adidas signed a 10-year lease at 115 Spring Street, a prime location in one of Manhattan’s strongest retail areas. The two-level 5,218 square foot space will be the new home of sportswear company’s Originals boutique.
Marketing, general and administrative, or MG&A, expenses for the quarter ended June 30, 2015 were $23.2 million, or 5.0 percent of total revenues and an annualized 49 basis points of total assets including the Company’s share of joint venture revenues and assets.
Real Estate Investment Activity
In May, the New York City Council approved plans for the Company’s One Vanderbilt office tower and demolition has commenced on the site. Located directly west of Grand Central Terminal, the 63-story skyscraper will be 1,501 feet tall and contain 1.6 million rentable square feet of Class A commercial space. One Vanderbilt features open floor plans, efficient use of space, and the highest level of sustainable design in New York City. TD Bank will anchor approximately 200,000 square feet of space in One Vanderbilt, including a flagship retail store on the northeast corner of 42nd Street and Madison Avenue. The
|
|
|
|
SECOND QUARTER 2015 HIGHLIGHTS Unaudited |
|

Company will invest an $220.0 million in public infrastructure, constructing new, direct subway access points and circulation areas, easing platform and mezzanine crowding and allowing trains to move more quickly through the station at peak hours.
In May, the Company entered into an agreement to acquire Eleven Madison Avenue for $2.285 billion plus approximately $300.0 million in costs associated with lease stipulated improvements to the property. Eleven Madison Avenue is a 29-story, 2.3 million square foot Class-A, Midtown South office property that was built in 1929 and originally served as the headquarters of Metropolitan Life Insurance Company. After a $700.0 million modernization in the 1990s, it became the North American headquarters of Credit Suisse, which continues to be the largest tenant in the building today. It also will serve as the new headquarters for Sony Corp. of America. The transaction is expected to close in the third quarter of 2015, subject to customary closing conditions.
In July, the Company announced an agreement to sell Tower 45, the office building located at 120 West 45th Street, for $365.0 million, or approximately $830 per square foot. The 440,000- square-foot Tower 45 was acquired by the Company in 2007 as part of the merger with Reckson Associates. Subsequently, the Company executed a significant capital improvement program that successfully repositioned the property. Tower 45 is currently 96.2 percent leased. The transaction is expected to close in the third quarter of 2015, subject to customary closing conditions.
In July, the Company announced the formation of a joint venture with Invesco Real Estate (“Invesco”) for the ownership of 131-137 Spring Street, a 73,000 square foot mixed-use asset located in SoHo. Under the terms of the agreement, Invesco will acquire an 80.0 percent stake in the property, with the Company retaining a 20.0 percent ownership interest as well as management and leasing responsibilities. The transaction values the property at $277.8 million. 131-137 Spring Street, a six-story building in the heart of the popular SoHo shopping district, features 100 feet of ground floor frontage on Spring Street and houses the multi-level flagship stores for Diesel and Burberry while the balance of the building includes office space and residential rental units. The transaction is expected to close in the third quarter of 2015, subject to customary closing conditions.
The Company will recognize cash proceeds in excess of $400.0 million from the 131-137 Spring Street and Tower 45 transactions, combined, which were executed at a blended cap rate of 3.3 percent.
In April, the Company, together with its joint venture partner, entered into an agreement to sell the Meadows Office Complex, a two-building 604,000 square foot property in Rutherford, New Jersey, for $121.1 million. The Company owns a 50 percent joint venture interest in the property, which is 91 percent leased, with Onyx Equities.
|
|
|
|
SECOND QUARTER 2015 HIGHLIGHTS Unaudited |
|
In July, the Company announced an agreement to acquire a 90.0 percent interest in The SoHo Building at 110 Greene Street based on a gross asset valuation of $255.0 million. The 13-story iconic mixed-use property is located in the heart of historic SoHo, one of New York City’s most desirable submarkets. 110 Greene Street is the tallest building in the submarket, offering office and residential tenants unparalleled views, along with large floor plates and substantial common areas. Retail space at the building, along Greene and Mercer Streets, offers existing and future tenants high visibility on two of the strongest retail streets in Manhattan. Notwithstanding the building’s current prominence, the Company plans additional enhancements to the property as it reintroduces it to the marketplace. The transaction increases the Company’s sizable footprint in SoHo, adding the submarket’s best office space to the Company’s commercial portfolio, and extending its substantial retail presence. The transaction is expected to close in the third quarter of 2015, subject to customary closing conditions.
In July, the Company announced an agreement to acquire two mixed-use properties located at 187 Broadway and 5-7 Dey Street for $63.7 million. Located adjacent to the entrance to Downtown Manhattan’s new Fulton Transit Center and one block east of the World Trade Center, the site consists of two mixed- use, retail/office buildings in a neighborhood that has undergone rapid growth in the office, residential and retail segments. The transaction is expected to close in the third quarter of 2015, subject to customary closing conditions.
In June 2015, the Company closed on the off-market acquisition of a mixed-use residential and retail property located on the Upper East Side of Manhattan for $50.0 million. The property is situated directly across the street from two new subway stations that will anchor the Second Avenue subway line and presents long-term value add opportunities for the Company’s residential and retail business.
Debt and Preferred Equity Investment Activity
The carrying value of the Company’s debt and preferred equity investment portfolio totaled $1.7 billion at June 30, 2015. During the second quarter, the Company originated new debt and preferred equity investments totaling $302.5 million, of which $227.5 million was retained and $193.0 million was funded, at a weighted average current yield of 10.5 percent, and recorded $82.8 million of principal reductions from investments that were sold or repaid. As of June 30, 2015, the debt and preferred equity investment portfolio had a weighted average maturity of 1.7 years, excluding any extension options, and had a weighted average yield during the second quarter of 10.2 percent.
Dividends
During the second quarter of 2015, the Company declared quarterly dividends on its outstanding common and preferred stock as follows:
· $0.60 per share of common stock, which was paid on July 15, 2015 to shareholders of record on the close of business on June 30, 2015; and
|
|
|
|
SECOND QUARTER 2015 HIGHLIGHTS Unaudited |
|

· $0.40625 per share on the Company’s 6.50% Series I Cumulative Redeemable Preferred Stock for the period April 15, 2015 through and including July 14, 2015, which was paid on July 15, 2015 to shareholders of record on the close of business on June 30, 2015, and reflects the regular quarterly dividend, which is the equivalent of an annualized dividend of $1.625 per share.
|
|
|
|
SL Green Realty Corp. Key Financial Data June 30, 2015 (Dollars in Thousands Except Per Share) |
|

|
|
|
|
As of or for the three months ended |
| |||||||||||||
|
|
|
6/30/2015 |
|
3/31/2015 |
|
12/31/2014 |
|
9/30/2014 |
|
6/30/2014 |
| ||||||
|
|
|
|
|
|
|
|
|
|
|
|
| ||||||
|
Earnings Per Share |
|
|
|
|
|
|
|
|
|
|
| ||||||
|
Net (loss) income available to common stockholders - diluted |
|
$ |
(0.39 |
) |
$ |
0.44 |
|
$ |
0.59 |
|
$ |
0.68 |
|
$ |
2.46 |
| |
|
Funds from operations available to common stockholders - diluted |
|
$ |
1.62 |
|
$ |
1.50 |
|
$ |
1.43 |
|
$ |
1.28 |
|
$ |
1.62 |
| |
|
Reported funds available for distribution to common stockholders - diluted |
|
$ |
0.96 |
|
$ |
1.04 |
|
$ |
0.94 |
|
$ |
(0.07 |
) |
$ |
1.09 |
| |
|
Recurring funds available for distribution to common stockholders - diluted |
|
$ |
1.30 |
|
$ |
1.29 |
|
$ |
1.11 |
|
$ |
0.75 |
|
$ |
1.21 |
| |
|
|
|
|
|
|
|
|
|
|
|
|
| ||||||
|
Common Share Price & Dividends |
|
|
|
|
|
|
|
|
|
|
| ||||||
|
At the end of the period |
|
$ |
109.89 |
|
$ |
128.38 |
|
$ |
119.02 |
|
$ |
101.32 |
|
$ |
109.41 |
| |
|
High during period |
|
$ |
131.64 |
|
$ |
134.00 |
|
$ |
123.10 |
|
$ |
111.86 |
|
$ |
112.79 |
| |
|
Low during period |
|
$ |
109.89 |
|
$ |
121.32 |
|
$ |
101.23 |
|
$ |
101.32 |
|
$ |
107.89 |
| |
|
Common dividend per share |
|
$ |
0.60 |
|
$ |
0.60 |
|
$ |
0.60 |
|
$ |
0.50 |
|
$ |
0.50 |
| |
|
|
|
|
|
|
|
|
|
|
|
|
| ||||||
|
FFO payout ratio (trailing 12 months) |
|
39.4 |
% |
37.8 |
% |
35.9 |
% |
34.5 |
% |
31.2 |
% | ||||||
|
Reported FAD payout ratio (trailing 12 months) |
|
79.8 |
% |
73.0 |
% |
66.7 |
% |
70.4 |
% |
45.7 |
% | ||||||
|
Recurring FAD payout ratio (trailing 12 months) |
|
51.6 |
% |
50.4 |
% |
48.1 |
% |
49.1 |
% |
41.5 |
% | ||||||
|
|
|
|
|
|
|
|
|
|
|
|
| ||||||
|
Common Shares & Units |
|
|
|
|
|
|
|
|
|
|
| ||||||
|
Common shares outstanding |
|
99,590 |
|
99,533 |
|
97,325 |
|
95,945 |
|
95,587 |
| ||||||
|
Units outstanding |
|
3,907 |
|
3,913 |
|
3,973 |
|
3,735 |
|
3,500 |
| ||||||
|
Total common shares and units outstanding |
|
103,497 |
|
103,446 |
|
101,298 |
|
99,680 |
|
99,087 |
| ||||||
|
|
|
|
|
|
|
|
|
|
|
|
| ||||||
|
Weighted average common shares and units outstanding - basic |
|
103,487 |
|
102,366 |
|
100,561 |
|
99,319 |
|
98,970 |
| ||||||
|
Weighted average common shares and units outstanding - diluted |
|
103,946 |
|
103,019 |
|
101,034 |
|
99,706 |
|
99,484 |
| ||||||
|
|
|
|
|
|
|
|
|
|
|
|
| ||||||
|
Market Capitalization |
|
|
|
|
|
|
|
|
|
|
| ||||||
|
Market value of common equity |
|
$ |
11,373,285 |
|
$ |
13,280,397 |
|
$ |
12,056,488 |
|
$ |
10,099,578 |
|
$ |
10,841,109 |
| |
|
Liquidation value of preferred equity/units |
|
354,723 |
|
340,915 |
|
301,115 |
|
303,115 |
|
279,550 |
| ||||||
|
Consolidated debt |
|
8,375,984 |
|
8,089,085 |
|
8,432,729 |
|
8,736,352 |
|
8,357,632 |
| ||||||
|
Consolidated market capitalization |
|
$ |
20,103,992 |
|
$ |
21,710,397 |
|
$ |
20,790,332 |
|
$ |
19,139,045 |
|
$ |
19,478,291 |
| |
|
SLG portion of JV debt |
|
1,695,340 |
|
1,693,466 |
|
1,601,340 |
|
1,394,788 |
|
1,412,618 |
| ||||||
|
Combined market capitalization |
|
$ |
21,799,332 |
|
$ |
23,403,863 |
|
$ |
22,391,672 |
|
$ |
20,533,833 |
|
$ |
20,890,909 |
| |
|
|
|
|
|
|
|
|
|
|
|
|
| ||||||
|
Consolidated debt to market capitalization |
|
41.7 |
% |
37.3 |
% |
40.6 |
% |
45.6 |
% |
42.9 |
% | ||||||
|
Combined debt to market capitalization |
|
46.2 |
% |
41.8 |
% |
44.8 |
% |
49.3 |
% |
46.8 |
% | ||||||
|
|
|
|
|
|
|
|
|
|
|
|
| ||||||
|
Consolidated debt service coverage (trailing 12 months) |
|
2.63 |
x |
2.60 |
x |
2.53 |
x |
2.53 |
x |
2.57 |
x | ||||||
|
Consolidated fixed charge coverage (trailing 12 months) |
|
2.33 |
x |
2.30 |
x |
2.24 |
x |
2.24 |
x |
2.26 |
x | ||||||
|
Combined debt service coverage (trailing 12 months) |
|
2.36 |
x |
2.31 |
x |
2.26 |
x |
2.24 |
x |
2.25 |
x | ||||||
|
Combined fixed charge coverage (trailing 12 months) |
|
2.10 |
x |
2.07 |
x |
2.03 |
x |
2.01 |
x |
2.02 |
x | ||||||
|
Supplemental Information |
Second Quarter 2015 |
|
|
|
|
SL Green Realty Corp. Key Financial Data June 30, 2015 (Dollars in Thousands Except Per Share) |
|

|
|
|
As of or for the three months ended |
| |||||||||||||
|
|
|
6/30/2015 |
|
3/31/2015 |
|
12/31/2014 |
|
9/30/2014 |
|
6/30/2014 |
| |||||
|
|
|
|
|
|
|
|
|
|
|
|
| |||||
|
Selected Balance Sheet Data |
|
|
|
|
|
|
|
|
|
|
| |||||
|
Real estate assets before depreciation |
|
$ |
14,079,832 |
|
$ |
13,978,464 |
|
$ |
14,536,503 |
|
$ |
14,564,675 |
|
$ |
13,952,995 |
|
|
Investments in unconsolidated joint ventures |
|
$ |
1,262,723 |
|
$ |
1,244,185 |
|
$ |
1,172,020 |
|
$ |
996,842 |
|
$ |
971,926 |
|
|
Debt and preferred equity investments |
|
$ |
1,685,234 |
|
$ |
1,548,739 |
|
$ |
1,408,804 |
|
$ |
1,432,951 |
|
$ |
1,547,808 |
|
|
Cash and cash equivalents |
|
$ |
215,896 |
|
$ |
330,770 |
|
$ |
281,409 |
|
$ |
253,520 |
|
$ |
308,103 |
|
|
Investment in marketable securities |
|
$ |
46,251 |
|
$ |
47,716 |
|
$ |
39,429 |
|
$ |
39,293 |
|
$ |
39,912 |
|
|
|
|
|
|
|
|
|
|
|
|
|
| |||||
|
Total assets |
|
$ |
17,266,958 |
|
$ |
17,080,732 |
|
$ |
17,096,587 |
|
$ |
17,237,109 |
|
$ |
16,717,736 |
|
|
|
|
|
|
|
|
|
|
|
|
|
| |||||
|
Fixed rate & hedged debt |
|
$ |
5,841,563 |
|
$ |
6,016,084 |
|
$ |
6,140,787 |
|
$ |
5,941,950 |
|
$ |
5,905,031 |
|
|
Variable rate debt |
|
2,364,421 |
|
2,073,000 |
|
2,038,000 |
|
2,347,000 |
|
2,261,351 |
| |||||
|
Total consolidated debt |
|
$ |
8,205,984 |
|
$ |
8,089,084 |
|
$ |
8,178,787 |
|
$ |
8,288,950 |
|
$ |
8,166,382 |
|
|
|
|
|
|
|
|
|
|
|
|
|
| |||||
|
Total liabilities |
|
$ |
9,186,434 |
|
$ |
8,927,560 |
|
$ |
9,096,732 |
|
$ |
9,419,267 |
|
$ |
9,016,134 |
|
|
|
|
|
|
|
|
|
|
|
|
|
| |||||
|
Fixed rate & hedged debt - including SLG portion of JV debt |
|
$ |
6,798,495 |
|
$ |
6,973,410 |
|
$ |
6,898,199 |
|
$ |
6,526,496 |
|
$ |
6,489,898 |
|
|
Variable rate debt - including SLG portion of JV debt |
|
3,102,829 |
|
2,809,140 |
|
2,881,928 |
|
3,157,242 |
|
3,089,102 |
| |||||
|
Total combined debt |
|
$ |
9,901,324 |
|
$ |
9,782,550 |
|
$ |
9,780,127 |
|
$ |
9,683,738 |
|
$ |
9,579,000 |
|
|
|
|
|
|
|
|
|
|
|
|
|
| |||||
|
Selected Operating Data |
|
|
|
|
|
|
|
|
|
|
| |||||
|
Property operating revenues |
|
$ |
345,633 |
|
$ |
344,298 |
|
$ |
338,356 |
|
$ |
335,119 |
|
$ |
318,184 |
|
|
Property operating expenses |
|
(134,486 |
) |
(140,688 |
) |
(137,452 |
) |
(135,747 |
) |
(128,942 |
) | |||||
|
Property NOI |
|
$ |
211,147 |
|
$ |
203,610 |
|
$ |
200,904 |
|
$ |
199,372 |
|
$ |
189,242 |
|
|
NOI from discontinued operations |
|
— |
|
488 |
|
5,441 |
|
7,750 |
|
10,661 |
| |||||
|
Total property NOI - consolidated |
|
$ |
211,147 |
|
$ |
204,098 |
|
$ |
206,345 |
|
$ |
207,122 |
|
$ |
199,903 |
|
|
SLG share of property NOI from JVs |
|
38,640 |
|
35,054 |
|
34,757 |
|
33,232 |
|
41,508 |
| |||||
|
Total property NOI - combined |
|
$ |
249,787 |
|
$ |
239,152 |
|
$ |
241,102 |
|
$ |
240,354 |
|
$ |
241,411 |
|
|
Investment income |
|
45,191 |
|
42,069 |
|
41,048 |
|
43,969 |
|
39,714 |
| |||||
|
Other income |
|
18,250 |
|
9,932 |
|
7,223 |
|
11,186 |
|
22,734 |
| |||||
|
Marketing general & administrative expenses |
|
(23,200 |
) |
(25,464 |
) |
(22,710 |
) |
(22,649 |
) |
(23,872 |
) | |||||
|
EBITDA - combined |
|
$ |
290,028 |
|
$ |
265,689 |
|
$ |
266,663 |
|
$ |
272,860 |
|
$ |
279,987 |
|
|
Supplemental Information |
Second Quarter 2015 |
|
|
|
|
SL Green Realty Corp. Key Financial Data June 30, 2015 (Dollars in Thousands Except Per Share) |
|

Manhattan Properties
|
|
|
As of or for the three months ended |
| |||||||||||||
|
|
|
6/30/2015 |
|
3/31/2015 |
|
12/31/2014 |
|
9/30/2014 |
|
6/30/2014 |
| |||||
|
|
|
|
|
|
|
|
|
|
|
|
| |||||
|
Selected Operating Data |
|
|
|
|
|
|
|
|
|
|
| |||||
|
Property operating revenues |
|
$ |
307,325 |
|
$ |
306,206 |
|
$ |
300,026 |
|
$ |
297,411 |
|
$ |
280,020 |
|
|
Property operating expenses |
|
111,578 |
|
116,733 |
|
114,297 |
|
112,153 |
|
105,077 |
| |||||
|
Property NOI |
|
$ |
195,747 |
|
$ |
189,473 |
|
$ |
185,729 |
|
$ |
185,258 |
|
$ |
174,943 |
|
|
NOI from discontinued operations |
|
— |
|
490 |
|
5,438 |
|
7,749 |
|
10,688 |
| |||||
|
Total property NOI - consolidated |
|
$ |
195,747 |
|
$ |
189,963 |
|
$ |
191,167 |
|
$ |
193,007 |
|
$ |
185,631 |
|
|
|
|
|
|
|
|
|
|
|
|
|
| |||||
|
Other income - consolidated |
|
$ |
13,233 |
|
$ |
5,211 |
|
$ |
1,544 |
|
$ |
285 |
|
$ |
384 |
|
|
|
|
|
|
|
|
|
|
|
|
|
| |||||
|
SLG share of property NOI from unconsolidated JV |
|
$ |
34,150 |
|
$ |
30,823 |
|
$ |
31,039 |
|
$ |
29,909 |
|
$ |
34,935 |
|
|
|
|
|
|
|
|
|
|
|
|
|
| |||||
|
Portfolio Statistics |
|
|
|
|
|
|
|
|
|
|
| |||||
|
Consolidated office buildings in service |
|
24 |
|
23 |
|
23 |
|
23 |
|
23 |
| |||||
|
Unconsolidated office buildings in service |
|
7 |
|
7 |
|
7 |
|
7 |
|
7 |
| |||||
|
|
|
31 |
|
30 |
|
30 |
|
30 |
|
30 |
| |||||
|
|
|
|
|
|
|
|
|
|
|
|
| |||||
|
Consolidated office buildings in service - square footage |
|
18,533,045 |
|
18,429,045 |
|
18,429,045 |
|
18,429,045 |
|
18,429,045 |
| |||||
|
Unconsolidated office buildings in service - square footage |
|
3,476,115 |
|
3,476,115 |
|
3,476,115 |
|
3,476,115 |
|
3,476,115 |
| |||||
|
|
|
22,009,160 |
|
21,905,160 |
|
21,905,160 |
|
21,905,160 |
|
21,905,160 |
| |||||
|
|
|
|
|
|
|
|
|
|
|
|
| |||||
|
Quarter end occupancy- same store - combined office (consolidated + JV) |
|
96.5 |
%(1) |
95.4 |
% |
94.7 |
% |
94.8 |
% |
93.6 |
% | |||||
|
|
|
|
|
|
|
|
|
|
|
|
| |||||
|
Office Leasing Statistics |
|
|
|
|
|
|
|
|
|
|
| |||||
|
Total office leases commenced |
|
43 |
|
47 |
|
37 |
|
56 |
|
34 |
| |||||
|
|
|
|
|
|
|
|
|
|
|
|
| |||||
|
Commenced office square footage filling vacancy |
|
269,446 |
|
113,796 |
|
72,334 |
|
164,096 |
|
106,953 |
| |||||
|
Commenced office square footage on previously occupied space (M-T-M leasing) (2) |
|
303,986 |
|
186,511 |
|
231,343 |
|
565,219 |
|
207,985 |
| |||||
|
Total office square footage commenced |
|
573,432 |
|
300,307 |
|
303,677 |
|
729,315 |
|
314,938 |
| |||||
|
|
|
|
|
|
|
|
|
|
|
|
| |||||
|
Average starting cash rent psf - office leases commenced |
|
$ |
61.66 |
|
$ |
62.99 |
|
$ |
59.49 |
|
$ |
64.20 |
|
$ |
54.18 |
|
|
Previously escalated cash rent psf - office leases commenced |
|
$ |
52.94 |
|
$ |
57.67 |
|
$ |
51.85 |
|
$ |
53.98 |
|
$ |
53.90 |
|
|
Increase in new cash rent over previously escalated cash rent (2) |
|
16.5 |
% |
9.2 |
% |
14.7 |
% |
18.9 |
% |
0.5 |
% | |||||
|
Average lease term |
|
11.3 |
|
8.1 |
|
10.6 |
|
10.3 |
|
13.2 |
| |||||
|
Tenant concession packages psf |
|
$ |
54.43 |
|
$ |
45.05 |
|
$ |
40.41 |
|
$ |
46.60 |
|
$ |
49.47 |
|
|
Free rent months |
|
6.2 |
|
4.2 |
|
5.0 |
|
2.1 |
|
6.0 |
| |||||
(1) Manhattan same-store occupancy, inclusive of 103,385 square feet of leases signed but not yet commenced, is 97.0% as of June 30, 2015, as compared to 94.9% at June 30, 2014 and 95.9% at March 31, 2015.
(2) Calculated on space that was occupied within the previous 12 months.
|
Supplemental Information |
Second Quarter 2015 |
|
|
|
|
SL Green Realty Corp. Key Financial Data June 30, 2015 (Dollars in Thousands Except Per Share) |
|

Suburban Properties
|
|
|
As of or for the three months ended |
| |||||||||||||
|
|
|
6/30/2015 |
|
3/31/2015 |
|
12/31/2014 |
|
9/30/2014 |
|
6/30/2014 |
| |||||
|
|
|
|
|
|
|
|
|
|
|
|
| |||||
|
Selected Operating Data |
|
|
|
|
|
|
|
|
|
|
| |||||
|
Property operating revenues |
|
$ |
29,355 |
|
$ |
29,170 |
|
$ |
29,969 |
|
$ |
29,230 |
|
$ |
29,732 |
|
|
Property operating expenses |
|
16,045 |
|
16,797 |
|
15,341 |
|
15,925 |
|
16,505 |
| |||||
|
Property NOI |
|
$ |
13,310 |
|
$ |
12,373 |
|
$ |
14,628 |
|
$ |
13,305 |
|
$ |
13,227 |
|
|
NOI from discontinued operations |
|
— |
|
— |
|
— |
|
— |
|
— |
| |||||
|
Total property NOI - consolidated |
|
$ |
13,310 |
|
$ |
12,373 |
|
$ |
14,628 |
|
$ |
13,305 |
|
$ |
13,227 |
|
|
|
|
|
|
|
|
|
|
|
|
|
| |||||
|
Other income - consolidated |
|
$ |
395 |
|
$ |
299 |
|
$ |
299 |
|
$ |
1,141 |
|
$ |
546 |
|
|
|
|
|
|
|
|
|
|
|
|
|
| |||||
|
SLG share of property NOI from unconsolidated JV |
|
$ |
1,301 |
|
$ |
966 |
|
$ |
1,119 |
|
$ |
1,152 |
|
$ |
1,245 |
|
|
|
|
|
|
|
|
|
|
|
|
|
| |||||
|
Portfolio Statistics |
|
|
|
|
|
|
|
|
|
|
| |||||
|
Consolidated office buildings in service |
|
28 |
|
27 |
|
27 |
|
27 |
|
27 |
| |||||
|
Unconsolidated office buildings in service |
|
5 |
|
4 |
|
4 |
|
4 |
|
4 |
| |||||
|
|
|
33 |
|
31 |
|
31 |
|
31 |
|
31 |
| |||||
|
|
|
|
|
|
|
|
|
|
|
|
| |||||
|
Consolidated office buildings in service - square footage |
|
4,450,400 |
|
4,365,400 |
|
4,365,400 |
|
4,365,400 |
|
4,365,400 |
| |||||
|
Unconsolidated office buildings in service - square footage |
|
1,287,741 |
|
1,222,100 |
|
1,222,100 |
|
1,222,100 |
|
1,222,100 |
| |||||
|
|
|
5,738,141 |
|
5,587,500 |
|
5,587,500 |
|
5,587,500 |
|
5,587,500 |
| |||||
|
|
|
|
|
|
|
|
|
|
|
|
| |||||
|
Quarter end occupancy- same store - combined office (consolidated + JV) |
|
81.9 |
%(1) |
80.8 |
% |
81.7 |
% |
80.5 |
% |
81.0 |
% | |||||
|
|
|
|
|
|
|
|
|
|
|
|
| |||||
|
Office Leasing Statistics |
|
|
|
|
|
|
|
|
|
|
| |||||
|
Total office leases commenced |
|
32 |
|
31 |
|
34 |
|
29 |
|
22 |
| |||||
|
|
|
|
|
|
|
|
|
|
|
|
| |||||
|
Commenced office square footage filling vacancy |
|
111,895 |
|
39,609 |
|
138,822 |
|
53,218 |
|
32,865 |
| |||||
|
Commenced office square footage on previously occupied space (M-T-M leasing) (2) |
|
102,088 |
|
122,986 |
|
130,333 |
|
118,938 |
|
38,562 |
| |||||
|
Total office square footage commenced |
|
213,983 |
|
162,595 |
|
269,155 |
|
172,156 |
|
71,427 |
| |||||
|
|
|
|
|
|
|
|
|
|
|
|
| |||||
|
Average starting cash rent psf - office leases commenced |
|
$ |
36.28 |
|
$ |
34.78 |
|
$ |
32.74 |
|
$ |
31.47 |
|
$ |
33.96 |
|
|
Previously escalated cash rent psf - office leases commenced |
|
$ |
36.72 |
|
$ |
34.99 |
|
$ |
33.22 |
|
$ |
31.63 |
|
$ |
33.44 |
|
|
(Decrease) increase in new cash rent over previously escalated cash rent (2) |
|
-1.2 |
% |
-0.6 |
% |
-1.5 |
% |
-0.5 |
% |
1.5 |
% | |||||
|
Average lease term |
|
8.0 |
|
6.5 |
|
9.0 |
|
8.4 |
|
6.5 |
| |||||
|
Tenant concession packages psf |
|
$ |
31.92 |
|
$ |
14.30 |
|
$ |
29.99 |
|
$ |
28.83 |
|
$ |
26.12 |
|
|
Free rent months |
|
6.0 |
|
4.7 |
|
8.2 |
|
5.6 |
|
3.4 |
| |||||
(1) Suburban same-store occupancy, inclusive of 127,646 square feet of leases signed but not yet commenced, is 84.2% as of June 30, 2015, as compared to 83.4% at June 30, 2014 and 83.5% at March 31, 2015.
(2) Calculated on space that was occupied within the previous 12 months.
|
Supplemental Information |
Second Quarter 2015 |
|
|
|
|
COMPARATIVE BALANCE SHEETS
Unaudited (Dollars in Thousands) |
|

|
|
|
6/30/2015 |
|
3/31/2015 |
|
12/31/2014 |
|
9/30/2014 |
|
6/30/2014 |
| |||||
|
Assets |
|
|
|
|
|
|
|
|
|
|
| |||||
|
Commercial real estate properties, at cost: |
|
|
|
|
|
|
|
|
|
|
| |||||
|
Land & land interests |
|
$ |
3,756,488 |
|
$ |
3,830,787 |
|
$ |
3,844,518 |
|
$ |
3,833,305 |
|
$ |
3,466,587 |
|
|
Buildings & improvements fee interest |
|
8,397,117 |
|
8,697,145 |
|
8,778,593 |
|
8,679,637 |
|
8,843,315 |
| |||||
|
Buildings & improvements leasehold |
|
1,424,822 |
|
1,423,087 |
|
1,418,585 |
|
1,405,255 |
|
1,390,004 |
| |||||
|
Buildings & improvements under capital lease |
|
27,445 |
|
27,445 |
|
27,445 |
|
27,445 |
|
27,445 |
| |||||
|
|
|
13,605,872 |
|
13,978,464 |
|
14,069,141 |
|
13,945,642 |
|
13,727,351 |
| |||||
|
Less accumulated depreciation |
|
(2,081,646 |
) |
(1,973,674 |
) |
(1,905,165 |
) |
(1,826,027 |
) |
(1,769,428 |
) | |||||
|
Net real estate |
|
11,524,226 |
|
12,004,790 |
|
12,163,976 |
|
12,119,615 |
|
11,957,923 |
| |||||
|
Other real estate investments: |
|
|
|
|
|
|
|
|
|
|
| |||||
|
Investment in unconsolidated joint ventures |
|
1,262,723 |
|
1,244,185 |
|
1,172,020 |
|
996,842 |
|
971,926 |
| |||||
|
Debt and preferred equity investments, net |
|
1,685,234 |
|
1,548,739 |
|
1,408,804 |
|
1,432,951 |
|
1,547,808 |
| |||||
|
|
|
|
|
|
|
|
|
|
|
|
| |||||
|
Assets held for sale, net |
|
420,569 |
|
— |
|
462,430 |
|
753,457 |
|
339,809 |
| |||||
|
Cash and cash equivalents |
|
215,896 |
|
330,770 |
|
281,409 |
|
253,520 |
|
308,103 |
| |||||
|
Restricted cash |
|
128,234 |
|
128,834 |
|
149,176 |
|
159,303 |
|
157,225 |
| |||||
|
Investment in marketable securities |
|
46,251 |
|
47,716 |
|
39,429 |
|
39,293 |
|
39,912 |
| |||||
|
Tenant and other receivables, net of $16,369 reserve at 6/30/15 |
|
64,873 |
|
50,156 |
|
57,369 |
|
64,184 |
|
51,844 |
| |||||
|
Related party receivables |
|
11,395 |
|
12,088 |
|
11,735 |
|
13,262 |
|
8,915 |
| |||||
|
Deferred rents receivable, net of reserve for tenant credit loss of $23,656 at 6/30/15 |
|
433,999 |
|
408,229 |
|
374,944 |
|
364,284 |
|
354,388 |
| |||||
|
Deferred costs, net |
|
328,838 |
|
326,555 |
|
327,962 |
|
310,860 |
|
300,043 |
| |||||
|
Other assets |
|
1,144,720 |
|
978,670 |
|
647,333 |
|
729,538 |
|
679,840 |
| |||||
|
|
|
|
|
|
|
|
|
|
|
|
| |||||
|
Total Assets |
|
$ |
17,266,958 |
|
$ |
17,080,732 |
|
$ |
17,096,587 |
|
$ |
17,237,109 |
|
$ |
16,717,736 |
|
|
Supplemental Information |
Second Quarter 2015 |
|
|
|
|
COMPARATIVE BALANCE SHEETS
Unaudited (Amounts in Thousands) |
|

|
|
|
6/30/2015 |
|
3/31/2015 |
|
12/31/2014 |
|
9/30/2014 |
|
6/30/2014 |
| |||||
|
Liabilities |
|
|
|
|
|
|
|
|
|
|
| |||||
|
Mortgages and other loans payable |
|
$ |
5,287,934 |
|
$ |
5,359,043 |
|
$ |
5,586,709 |
|
$ |
5,890,782 |
|
$ |
5,939,176 |
|
|
Term loan and senior unsecured notes |
|
2,113,050 |
|
2,110,041 |
|
2,107,078 |
|
2,054,168 |
|
2,127,206 |
| |||||
|
Revolving credit facility |
|
705,000 |
|
520,000 |
|
385,000 |
|
244,000 |
|
— |
| |||||
|
Accrued interest and other liabilities |
|
161,188 |
|
162,910 |
|
137,634 |
|
127,811 |
|
128,730 |
| |||||
|
Accounts payable and accrued expenses |
|
147,028 |
|
151,427 |
|
173,246 |
|
183,001 |
|
164,215 |
| |||||
|
Deferred revenue |
|
337,571 |
|
369,626 |
|
187,148 |
|
215,527 |
|
223,394 |
| |||||
|
Capitalized lease obligations |
|
21,013 |
|
20,917 |
|
20,822 |
|
20,728 |
|
20,635 |
| |||||
|
Deferred land lease payable |
|
1,387 |
|
1,301 |
|
1,215 |
|
1,129 |
|
1,044 |
| |||||
|
Dividends and distributions payable |
|
66,026 |
|
65,868 |
|
64,393 |
|
53,571 |
|
53,193 |
| |||||
|
Security deposits |
|
67,985 |
|
66,427 |
|
66,614 |
|
66,659 |
|
65,166 |
| |||||
|
Liabilities related to assets held for sale |
|
178,252 |
|
— |
|
266,873 |
|
461,891 |
|
193,375 |
| |||||
|
Junior subordinated deferrable interest debentures |
|
100,000 |
|
100,000 |
|
100,000 |
|
100,000 |
|
100,000 |
| |||||
|
Total liabilities |
|
9,186,434 |
|
8,927,560 |
|
9,096,732 |
|
9,419,267 |
|
9,016,134 |
| |||||
|
|
|
|
|
|
|
|
|
|
|
|
| |||||
|
Noncontrolling interest in operating partnership (3,907 units outstanding) at 6/30/15 |
|
431,418 |
|
498,881 |
|
469,524 |
|
381,274 |
|
379,805 |
| |||||
|
|
|
|
|
|
|
|
|
|
|
|
| |||||
|
Preferred Units |
|
124,723 |
|
110,915 |
|
71,115 |
|
73,115 |
|
49,550 |
| |||||
|
|
|
|
|
|
|
|
|
|
|
|
| |||||
|
Equity |
|
|
|
|
|
|
|
|
|
|
| |||||
|
Stockholders’ Equity: |
|
|
|
|
|
|
|
|
|
|
| |||||
|
Series I Perpetual Preferred Shares |
|
221,932 |
|
221,932 |
|
221,932 |
|
221,932 |
|
221,932 |
| |||||
|
Common stock, $.01 par value, 160,000 shares authorized, 99,590 issued and outstanding at 6/30/15 |
|
1,033 |
|
1,032 |
|
1,010 |
|
996 |
|
993 |
| |||||
|
Additional paid—in capital |
|
5,570,746 |
|
5,572,410 |
|
5,289,479 |
|
5,130,858 |
|
5,085,965 |
| |||||
|
Treasury stock (3,643 shares) at 6/30/15 |
|
(325,207 |
) |
(325,207 |
) |
(320,471 |
) |
(320,222 |
) |
(320,152 |
) | |||||
|
Accumulated other comprehensive loss |
|
(10,906 |
) |
(11,810 |
) |
(6,980 |
) |
(2,896 |
) |
(6,196 |
) | |||||
|
Retained earnings |
|
1,657,911 |
|
1,690,578 |
|
1,752,404 |
|
1,813,956 |
|
1,797,580 |
| |||||
|
Total SL Green Realty Corp. stockholders’ equity |
|
7,115,509 |
|
7,148,935 |
|
6,937,374 |
|
6,844,624 |
|
6,780,122 |
| |||||
|
|
|
|
|
|
|
|
|
|
|
|
| |||||
|
Noncontrolling interest in other partnerships |
|
408,874 |
|
394,441 |
|
521,842 |
|
518,829 |
|
492,125 |
| |||||
|
|
|
|
|
|
|
|
|
|
|
|
| |||||
|
Total equity |
|
7,524,383 |
|
7,543,376 |
|
7,459,216 |
|
7,363,453 |
|
7,272,247 |
| |||||
|
|
|
|
|
|
|
|
|
|
|
|
| |||||
|
Total Liabilities and Equity |
|
$ |
17,266,958 |
|
$ |
17,080,732 |
|
$ |
17,096,587 |
|
$ |
17,237,109 |
|
$ |
16,717,736 |
|
|
Supplemental Information |
Second Quarter 2015 |
|
|
|
|
COMPARATIVE STATEMENTS OF OPERATIONS
Unaudited (Dollars in Thousands Except Per Share) |
|

|
|
|
Three Months Ended |
|
Three Months Ended |
|
Six Months Ended |
| |||||||||
|
|
|
June 30, |
|
June 30, |
|
March 31, |
|
June 30, |
|
June 30, |
| |||||
|
|
|
2015 |
|
2014 |
|
2015 |
|
2015 |
|
2014 |
| |||||
|
Revenues |
|
|
|
|
|
|
|
|
|
|
| |||||
|
Rental revenue, net |
|
$ |
304,226 |
|
$ |
279,608 |
|
$ |
303,329 |
|
$ |
607,555 |
|
$ |
535,584 |
|
|
Escalation and reimbursement revenues |
|
41,407 |
|
38,576 |
|
40,969 |
|
82,376 |
|
76,383 |
| |||||
|
Investment income |
|
45,191 |
|
39,714 |
|
42,069 |
|
87,260 |
|
93,798 |
| |||||
|
Other income |
|
18,250 |
|
22,734 |
|
9,932 |
|
28,182 |
|
37,312 |
| |||||
|
Total Revenues, net |
|
409,074 |
|
380,632 |
|
396,299 |
|
805,373 |
|
743,077 |
| |||||
|
|
|
|
|
|
|
|
|
|
|
|
| |||||
|
Equity in net income from unconsolidated joint ventures |
|
2,994 |
|
8,619 |
|
4,030 |
|
7,024 |
|
14,748 |
| |||||
|
Loss on early extinguishment of debt |
|
— |
|
(1,028 |
) |
(49 |
) |
(49 |
) |
(1,025 |
) | |||||
|
|
|
|
|
|
|
|
|
|
|
|
| |||||
|
Expenses |
|
|
|
|
|
|
|
|
|
|
| |||||
|
Operating expenses |
|
70,114 |
|
69,098 |
|
76,777 |
|
146,891 |
|
139,010 |
| |||||
|
Ground rent |
|
8,086 |
|
8,040 |
|
8,188 |
|
16,274 |
|
16,073 |
| |||||
|
Real estate taxes |
|
56,286 |
|
51,804 |
|
55,723 |
|
112,009 |
|
104,154 |
| |||||
|
Transaction related costs |
|
3,067 |
|
1,697 |
|
1,143 |
|
4,210 |
|
4,171 |
| |||||
|
Marketing, general and administrative |
|
23,200 |
|
23,872 |
|
25,464 |
|
48,664 |
|
47,128 |
| |||||
|
Total Operating Expenses |
|
160,753 |
|
154,511 |
|
167,295 |
|
328,048 |
|
310,536 |
| |||||
|
|
|
|
|
|
|
|
|
|
|
|
| |||||
|
Operating Income |
|
251,315 |
|
233,712 |
|
232,985 |
|
484,300 |
|
446,264 |
| |||||
|
|
|
|
|
|
|
|
|
|
|
|
| |||||
|
Interest expense, net of interest income |
|
75,746 |
|
77,870 |
|
75,807 |
|
151,553 |
|
154,048 |
| |||||
|
Amortization of deferred financing costs |
|
5,952 |
|
5,401 |
|
6,615 |
|
12,567 |
|
9,058 |
| |||||
|
Depreciation and amortization |
|
199,565 |
|
93,379 |
|
108,337 |
|
307,902 |
|
179,894 |
| |||||
|
|
|
|
|
|
|
|
|
|
|
|
| |||||
|
(Loss) Income from Continuing Operations |
|
(29,948 |
) |
57,062 |
|
42,226 |
|
12,278 |
|
103,264 |
| |||||
|
|
|
|
|
|
|
|
|
|
|
|
| |||||
|
Income from discontinued operations |
|
— |
|
5,645 |
|
427 |
|
427 |
|
11,414 |
| |||||
|
Gain on sale of discontinued operations |
|
— |
|
114,735 |
|
12,983 |
|
12,983 |
|
114,735 |
| |||||
|
Equity in net gain on sale of joint venture interest / real estate |
|
769 |
|
1,444 |
|
— |
|
769 |
|
106,084 |
| |||||
|
Purchase price fair value adjustment |
|
— |
|
71,446 |
|
— |
|
— |
|
71,446 |
| |||||
|
Net (Loss) Income |
|
(29,179 |
) |
250,332 |
|
55,636 |
|
26,457 |
|
406,943 |
| |||||
|
|
|
|
|
|
|
|
|
|
|
|
| |||||
|
Net income attributable to noncontrolling interests |
|
(5,049 |
) |
(10,488 |
) |
(7,670 |
) |
(12,719 |
) |
(16,707 |
) | |||||
|
Dividends on preferred units |
|
(1,140 |
) |
(565 |
) |
(951 |
) |
(2,091 |
) |
(1,130 |
) | |||||
|
|
|
|
|
|
|
|
|
|
|
|
| |||||
|
Net (Loss) Income Attributable to SL Green Realty Corp |
|
(35,368 |
) |
239,279 |
|
47,015 |
|
11,647 |
|
389,106 |
| |||||
|
|
|
|
|
|
|
|
|
|
|
|
| |||||
|
Dividends on perpetual preferred shares |
|
(3,738 |
) |
(3,738 |
) |
(3,738 |
) |
(7,476 |
) |
(7,475 |
) | |||||
|
|
|
|
|
|
|
|
|
|
|
|
| |||||
|
Net (Loss) Income Attributable to Common Stockholders |
|
$ |
(39,106 |
) |
$ |
235,541 |
|
$ |
43,277 |
|
$ |
4,171 |
|
$ |
381,631 |
|
|
|
|
|
|
|
|
|
|
|
|
|
| |||||
|
Earnings per Share |
|
|
|
|
|
|
|
|
|
|
| |||||
|
Net (loss) income per share (basic) |
|
$ |
(0.39 |
) |
$ |
2.47 |
|
$ |
0.44 |
|
$ |
0.04 |
|
$ |
4.01 |
|
|
Net (loss) income per share (diluted) |
|
$ |
(0.39 |
) |
$ |
2.46 |
|
$ |
0.44 |
|
$ |
0.04 |
|
$ |
3.99 |
|
|
Supplemental Information |
Second Quarter 2015 |
|
|
|
|
COMPARATIVE COMPUTATION OF FFO AND FAD
Unaudited (Dollars in Thousands Except Per Share) |
|

|
|
|
Three Months Ended |
|
Three Months Ended |
|
Six Months Ended |
| |||||||||
|
|
|
June 30, |
|
June 30, |
|
March 31, |
|
June 30, |
|
June 30, |
| |||||
|
|
|
2015 |
|
2014 |
|
2015 |
|
2015 |
|
2014 |
| |||||
|
Funds from Operations |
|
|
|
|
|
|
|
|
|
|
| |||||
|
Net (Loss) Income Attributable to Common Stockholders |
|
$ |
(39,106 |
) |
$ |
235,541 |
|
$ |
43,277 |
|
$ |
4,171 |
|
$ |
381,631 |
|
|
|
|
|
|
|
|
|
|
|
|
|
| |||||
|
Depreciation and amortization |
|
199,565 |
|
93,379 |
|
108,337 |
|
307,902 |
|
179,894 |
| |||||
|
Discontinued operations depreciation adjustments |
|
— |
|
1,459 |
|
— |
|
— |
|
4,756 |
| |||||
|
Joint ventures depreciation and noncontrolling interests adjustments |
|
4,435 |
|
8,161 |
|
8,622 |
|
13,057 |
|
21,148 |
| |||||
|
Net income attributable to noncontrolling interests |
|
5,049 |
|
10,488 |
|
7,670 |
|
12,719 |
|
16,707 |
| |||||
|
Gain on sale of discontinued operations |
|
— |
|
(114,735 |
) |
(12,983 |
) |
(12,983 |
) |
(114,735 |
) | |||||
|
Equity in net gain on sale of joint venture property / real estate |
|
(769 |
) |
(1,444 |
) |
— |
|
(769 |
) |
(106,084 |
) | |||||
|
Purchase price fair value adjustment |
|
— |
|
(71,446 |
) |
— |
|
— |
|
(71,446 |
) | |||||
|
Non-real estate depreciation and amortization |
|
(500 |
) |
(503 |
) |
(525 |
) |
(1,025 |
) |
(1,017 |
) | |||||
|
Funds From Operations |
|
$ |
168,674 |
|
$ |
160,900 |
|
$ |
154,398 |
|
$ |
323,072 |
|
$ |
310,854 |
|
|
|
|
|
|
|
|
|
|
|
|
|
| |||||
|
Funds From Operations - Basic per Share |
|
$ |
1.63 |
|
$ |
1.63 |
|
$ |
1.51 |
|
$ |
3.14 |
|
$ |
3.15 |
|
|
|
|
|
|
|
|
|
|
|
|
|
| |||||
|
Funds From Operations - Diluted per Share |
|
$ |
1.62 |
|
$ |
1.62 |
|
$ |
1.50 |
|
$ |
3.12 |
|
$ |
3.14 |
|
|
|
|
|
|
|
|
|
|
|
|
|
| |||||
|
Funds Available for Distribution |
|
|
|
|
|
|
|
|
|
|
| |||||
|
FFO |
|
$ |
168,674 |
|
$ |
160,900 |
|
$ |
154,398 |
|
$ |
323,072 |
|
$ |
310,854 |
|
|
|
|
|
|
|
|
|
|
|
|
|
| |||||
|
Non real estate depreciation and amortization |
|
500 |
|
503 |
|
525 |
|
1,025 |
|
1,017 |
| |||||
|
Amortization of deferred financing costs |
|
5,952 |
|
5,401 |
|
6,615 |
|
12,567 |
|
9,058 |
| |||||
|
Non-cash deferred compensation |
|
10,701 |
|
13,243 |
|
18,877 |
|
29,578 |
|
28,722 |
| |||||
|
FAD adjustment for Joint Ventures |
|
(2,357 |
) |
(6,447 |
) |
(8,690 |
) |
(11,047 |
) |
(20,366 |
) | |||||
|
FAD adjustment for discontinued operations |
|
— |
|
(3,204 |
) |
5 |
|
5 |
|
(4,339 |
) | |||||
|
Straight-line rental income and other non cash adjustments |
|
(36,127 |
) |
(14,752 |
) |
(43,891 |
) |
(80,018 |
) |
(29,044 |
) | |||||
|
Second cycle tenant improvements |
|
(26,299 |
) |
(29,717 |
) |
(9,376 |
) |
(35,675 |
) |
(43,699 |
) | |||||
|
Second cycle leasing commissions |
|
(10,671 |
) |
(1,985 |
) |
(5,838 |
) |
(16,509 |
) |
(5,183 |
) | |||||
|
Revenue enhancing recurring CAPEX |
|
(1,423 |
) |
(5,949 |
) |
(214 |
) |
(1,637 |
) |
(8,238 |
) | |||||
|
Non-revenue enhancing recurring CAPEX |
|
(9,160 |
) |
(9,077 |
) |
(4,818 |
) |
(13,978 |
) |
(13,452 |
) | |||||
|
|
|
|
|
|
|
|
|
|
|
|
| |||||
|
Reported Funds Available for Distribution |
|
$ |
99,790 |
|
$ |
108,916 |
|
$ |
107,593 |
|
$ |
207,383 |
|
$ |
225,330 |
|
|
Diluted per Share |
|
$ |
0.96 |
|
$ |
1.09 |
|
$ |
1.04 |
|
$ |
2.01 |
|
$ |
2.27 |
|
|
|
|
|
|
|
|
|
|
|
|
|
| |||||
|
1515 Broadway - Viacom capital contribution |
|
$ |
9,391 |
|
$ |
11,683 |
|
$ |
5,139 |
|
$ |
14,530 |
|
$ |
15,162 |
|
|
388-390 Greenwich - Citi capital contribution |
|
$ |
5,542 |
|
$ |
— |
|
$ |
— |
|
$ |
5,542 |
|
$ |
7,656 |
|
|
388-390 Greenwich - free rent |
|
$ |
20,459 |
|
$ |
— |
|
$ |
20,459 |
|
$ |
40,918 |
|
$ |
— |
|
|
|
|
|
|
|
|
|
|
|
|
|
| |||||
|
Recurring Funds Available for Distribution |
|
$ |
135,182 |
|
$ |
120,599 |
|
$ |
133,191 |
|
$ |
268,373 |
|
$ |
248,148 |
|
|
Diluted per Share |
|
$ |
1.30 |
|
$ |
1.21 |
|
$ |
1.29 |
|
$ |
2.59 |
|
$ |
2.50 |
|
|
|
|
|
|
|
|
|
|
|
|
|
| |||||
|
First cycle tenant improvements |
|
$ |
7,530 |
|
$ |
8,717 |
|
$ |
2,806 |
|
$ |
10,336 |
|
$ |
13,640 |
|
|
First cycle leasing commissions |
|
$ |
3,818 |
|
$ |
1,244 |
|
$ |
332 |
|
$ |
4,150 |
|
$ |
1,711 |
|
|
Redevelopment costs |
|
$ |
18,316 |
|
$ |
15,692 |
|
$ |
6,657 |
|
$ |
24,973 |
|
$ |
25,188 |
|
|
Capitalized interest |
|
$ |
7,528 |
|
$ |
10,636 |
|
$ |
8,439 |
|
$ |
15,967 |
|
$ |
22,801 |
|
|
Supplemental Information |
Second Quarter 2015 |
|
CONSOLIDATED STATEMENT OF EQUITY
Unaudited (Dollars in Thousands) |
|

|
|
|
|
|
|
|
|
|
|
|
|
|
|
|
Accumulated |
|
|
| ||||||||
|
|
|
Series I |
|
|
|
|
|
|
|
|
|
|
|
Other |
|
|
| ||||||||
|
|
|
Preferred |
|
Common |
|
Additional |
|
Treasury |
|
Retained |
|
Noncontrolling |
|
Comprehensive |
|
|
| ||||||||
|
|
|
Stock |
|
Stock |
|
Paid-In Capital |
|
Stock |
|
Earnings |
|
Interests |
|
Loss |
|
TOTAL |
| ||||||||
|
|
|
|
|
|
|
|
|
|
|
|
|
|
|
|
|
|
| ||||||||
|
Balance at December 31, 2014 |
|
$ |
221,932 |
|
$ |
1,010 |
|
$ |
5,289,479 |
|
$ |
(320,471 |
) |
$ |
1,752,404 |
|
$ |
521,842 |
|
$ |
(6,980 |
) |
$ |
7,459,216 |
|
|
|
|
|
|
|
|
|
|
|
|
|
|
|
|
|
|
|
| ||||||||
|
Net Income attributable to SL Green |
|
|
|
|
|
|
|
|
|
11,647 |
|
12,553 |
|
|
|
24,200 |
| ||||||||
|
Acquisition of subsidiary interest from noncontrolling interest |
|
|
|
|
|
(9,566 |
) |
|
|
|
|
(11,084 |
) |
|
|
(20,650 |
) | ||||||||
|
Preferred dividends |
|
|
|
|
|
|
|
|
|
(7,476 |
) |
|
|
|
|
(7,476 |
) | ||||||||
|
Cash distributions declared ($1.20 per common share) |
|
|
|
|
|
|
|
|
|
(119,334 |
) |
|
|
|
|
(119,334 |
) | ||||||||
|
Cash distributions to noncontrolling interests |
|
|
|
|
|
|
|
|
|
|
|
(112,948 |
) |
|
|
(112,948 |
) | ||||||||
|
Other comprehensive loss - unrealized loss on derivative instruments |
|
|
|
|
|
|
|
|
|
|
|
|
|
(2,985 |
) |
(2,985 |
) | ||||||||
|
Other comprehensive loss - SLG’s share of joint venture net |
|
|
|
|
|
|
|
|
|
|
|
|
|
|
|
|
| ||||||||
|
unrealized loss on derivative instruments |
|
|
|
|
|
|
|
|
|
|
|
|
|
(286 |
) |
(286 |
) | ||||||||
|
Other comprehensive loss - unrealized loss on marketable securities |
|
|
|
|
|
|
|
|
|
|
|
|
|
(655 |
) |
(655 |
) | ||||||||
|
Proceeds from stock options exercised |
|
|
|
2 |
|
11,800 |
|
|
|
|
|
|
|
|
|
11,802 |
| ||||||||
|
DRSPP proceeds |
|
|
|
8 |
|
99,497 |
|
|
|
|
|
|
|
|
|
99,505 |
| ||||||||
|
Conversion of units of the Operating Partnership to common stock |
|
|
|
3 |
|
37,989 |
|
|
|
|
|
|
|
|
|
37,992 |
| ||||||||
|
Contributions to consolidated joint venture |
|
|
|
|
|
|
|
|
|
|
|
8,655 |
|
|
|
8,655 |
| ||||||||
|
Reallocation of noncontrolling interests in the Operating Partnership |
|
|
|
|
|
|
|
|
|
20,670 |
|
|
|
|
|
20,670 |
| ||||||||
|
Reallocation of capital account relating to sale |
|
|
|
|
|
|
|
|
|
|
|
(10,144 |
) |
|
|
(10,144 |
) | ||||||||
|
Issuance of common stock |
|
|
|
10 |
|
124,989 |
|
|
|
|
|
|
|
|
|
124,999 |
| ||||||||
|
Deferred compensation plan and stock awards, net |
|
|
|
— |
|
1,638 |
|
(4,736 |
) |
|
|
|
|
|
|
(3,098 |
) | ||||||||
|
Amortization of deferred compensation plan |
|
|
|
|
|
14,920 |
|
|
|
|
|
|
|
|
|
14,920 |
| ||||||||
|
Balance at June 30, 2015 |
|
$ |
221,932 |
|
$ |
1,033 |
|
$ |
5,570,746 |
|
$ |
(325,207 |
) |
$ |
1,657,911 |
|
$ |
408,874 |
|
$ |
(10,906 |
) |
$ |
7,524,383 |
|
|
|
|
RECONCILIATION OF SHARES AND UNITS OUTSTANDING, AND DILUTION COMPUTATION |
|
|
|
|
|
Common Stock |
|
OP Units |
|
Stock-Based |
|
Sub-total |
|
Preferred |
|
Diluted Shares |
|
|
|
|
|
|
|
|
|
|
|
|
|
|
|
|
|
Share Count at December 31, 2014 |
|
97,325,200 |
|
3,973,016 |
|
— |
|
101,298,216 |
|
— |
|
101,298,216 |
|
|
|
|
|
|
|
|
|
|
|
|
|
|
|
|
|
YTD share activity |
|
2,264,445 |
|
(65,899 |
) |
— |
|
2,198,546 |
|
|
|
2,198,546 |
|
|
Share Count at June 30, 2015 - Basic |
|
99,589,645 |
|
3,907,117 |
|
— |
|
103,496,762 |
|
— |
|
103,496,762 |
|
|
|
|
|
|
|
|
|
|
|
|
|
|
|
|
|
Weighting factor |
|
(596,111 |
) |
28,671 |
|
493,108 |
|
(74,332 |
) |
|
|
(74,332 |
) |
|
Weighted Average Share Count at June 30, 2015 - Diluted |
|
98,993,534 |
|
3,935,788 |
|
493,108 |
|
103,422,430 |
|
— |
|
103,422,430 |
|
|
Supplemental Information |
Second Quarter 2015 |
|
JOINT VENTURE STATEMENTS Balance Sheet for Unconsolidated Joint Ventures Unaudited (Dollars in Thousands) |
|

|
|
|
June 30, 2015 |
|
March 31, 2015 |
|
December 31, 2014 |
| ||||||||||||
|
|
|
Total |
|
SLG Interest |
|
Total |
|
SLG Interest |
|
Total |
|
SLG Interest |
| ||||||
|
Land and land interests |
|
$ |
1,664,839 |
|
$ |
732,308 |
|
$ |
1,664,878 |
|
$ |
732,356 |
|
$ |
1,511,239 |
|
$ |
720,231 |
|
|
Buildings and improvements |
|
4,992,651 |
|
1,996,018 |
|
4,945,158 |
|
1,973,644 |
|
4,093,817 |
|
1,884,057 |
| ||||||
|
Building leasehold |
|
26,771 |
|
13,385 |
|
22,467 |
|
11,234 |
|
18,171 |
|
9,086 |
| ||||||
|
Buildings & improvements under capital lease |
|
189,558 |
|
94,779 |
|
189,558 |
|
94,779 |
|
189,558 |
|
94,779 |
| ||||||
|
|
|
6,873,819 |
|
2,836,490 |
|
6,822,061 |
|
2,812,013 |
|
5,812,785 |
|
2,708,153 |
| ||||||
|
Less accumulated depreciation |
|
(749,202 |
) |
(286,204 |
) |
(717,489 |
) |
(273,237 |
) |
(537,153 |
) |
(243,535 |
) | ||||||
|
Net real estate |
|
6,124,617 |
|
2,550,286 |
|
6,104,572 |
|
2,538,776 |
|
5,275,632 |
|
2,464,618 |
| ||||||
|
|
|
|
|
|
|
|
|
|
|
|
|
|
| ||||||
|
Cash and cash equivalents |
|
156,192 |
|
55,078 |
|
142,301 |
|
51,280 |
|
116,869 |
|
51,498 |
| ||||||
|
Restricted cash |
|
114,467 |
|
39,745 |
|
126,902 |
|
47,722 |
|
91,917 |
|
37,110 |
| ||||||
|
Debt and preferred equity investments, net |
|
145,691 |
|
145,691 |
|
145,665 |
|
145,665 |
|
145,875 |
|
145,875 |
| ||||||
|
Tenant and other receivables, net of $3,023 reserve at 6/30/15 |
|
44,411 |
|
18,034 |
|
44,525 |
|
18,138 |
|
39,537 |
|
16,607 |
| ||||||
|
Deferred rents receivable, net of reserve for |
|
|
|
|
|
|
|
|
|
|
|
|
| ||||||
|
tenant credit loss of $2,976 at 6/30/15 |
|
149,256 |
|
63,121 |
|
140,246 |
|
58,642 |
|
130,833 |
|
54,057 |
| ||||||
|
Deferred costs, net |
|
170,246 |
|
70,923 |
|
167,343 |
|
69,152 |
|
144,280 |
|
61,462 |
| ||||||
|
Other assets |
|
144,592 |
|
67,430 |
|
152,866 |
|
68,275 |
|
141,256 |
|
65,726 |
| ||||||
|
|
|
|
|
|
|
|
|
|
|
|
|
|
| ||||||
|
Total Assets |
|
$ |
7,049,472 |
|
$ |
3,010,308 |
|
$ |
7,024,420 |
|
$ |
2,997,650 |
|
$ |
6,086,199 |
|
$ |
2,896,953 |
|
|
|
|
|
|
|
|
|
|
|
|
|
|
|
| ||||||
|
Mortgage loans payable |
|
4,360,348 |
|
1,695,340 |
|
$ |
4,354,674 |
|
$ |
1,693,466 |
|
$ |
3,778,704 |
|
$ |
1,601,340 |
| ||
|
Accrued interest and other liabilities |
|
12,956 |
|
5,787 |
|
13,508 |
|
6,230 |
|
13,313 |
|
6,174 |
| ||||||
|
Accounts payable and accrued expenses |
|
81,987 |
|
34,897 |
|
87,803 |
|
37,601 |
|
80,206 |
|
36,584 |
| ||||||
|
Deferred revenue |
|
192,237 |
|
93,833 |
|
198,708 |
|
97,055 |
|
195,819 |
|
95,816 |
| ||||||
|
Capitalized lease obligations |
|
181,843 |
|
90,922 |
|
181,191 |
|
90,595 |
|
180,551 |
|
90,276 |
| ||||||
|
Security deposits |
|
26,500 |
|
9,160 |
|
25,558 |
|
8,699 |
|
15,683 |
|
7,520 |
| ||||||
|
Equity |
|
2,193,601 |
|
1,080,369 |
|
2,162,978 |
|
1,064,004 |
|
1,821,923 |
|
1,059,243 |
| ||||||
|
|
|
|
|
|
|
|
|
|
|
|
|
|
| ||||||
|
Total Liabilities and Equity |
|
$ |
7,049,472 |
|
$ |
3,010,308 |
|
$ |
7,024,420 |
|
$ |
2,997,650 |
|
$ |
6,086,199 |
|
$ |
2,896,953 |
|
|
Supplemental Information |
Second Quarter 2015 |
|
JOINT VENTURE STATEMENTS Statements of Operations for Unconsolidated Joint Ventures Unaudited (Dollars in Thousands) |
|

|
|
|
Three Months Ended June 30, 2015 |
|
Three Months Ended March 31, 2015 |
|
Three Months Ended June 30, 2014 |
| ||||||||||||
|
|
|
Total |
|
SLG Interest |
|
Total |
|
SLG Interest |
|
Total |
|
SLG Interest |
| ||||||
|
Revenues |
|
|
|
|
|
|
|
|
|
|
|
|
| ||||||
|
Rental revenue, net |
|
$ |
124,307 |
|
$ |
46,664 |
|
$ |
110,142 |
|
$ |
43,433 |
|
$ |
112,183 |
|
$ |
47,953 |
|
|
Escalation and reimbursement revenues |
|
9,041 |
|
3,910 |
|
8,546 |
|
3,627 |
|
7,952 |
|
3,572 |
| ||||||
|
Other income |
|
10,187 |
|
6,406 |
|
10,228 |
|
6,404 |
|
10,360 |
|
6,426 |
| ||||||
|
Total Revenues, net |
|
$ |
143,535 |
|
$ |
56,980 |
|
$ |
128,916 |
|
$ |
53,464 |
|
$ |
130,495 |
|
$ |
57,951 |
|
|
|
|
|
|
|
|
|
|
|
|
|
|
|
| ||||||
|
Expenses |
|
|
|
|
|
|
|
|
|
|
|
|
| ||||||
|
Operating expenses |
|
$ |
26,345 |
|
$ |
9,175 |
|
$ |
25,486 |
|
$ |
9,734 |
|
$ |
18,362 |
|
$ |
8,374 |
|
|
Ground rent |
|
2,572 |
|
1,286 |
|
2,592 |
|
1,296 |
|
2,632 |
|
1,316 |
| ||||||
|
Real estate taxes |
|
22,335 |
|
7,879 |
|
19,376 |
|
7,380 |
|
15,406 |
|
6,753 |
| ||||||
|
Total Operating Expenses |
|
$ |
51,252 |
|
$ |
18,340 |
|
$ |
47,454 |
|
$ |
18,410 |
|
$ |
36,400 |
|
$ |
16,443 |
|
|
|
|
|
|
|
|
|
|
|
|
|
|
|
| ||||||
|
NOI |
|
$ |
92,283 |
|
$ |
38,640 |
|
$ |
81,462 |
|
$ |
35,054 |
|
$ |
94,095 |
|
$ |
41,508 |
|
|
Cash NOI |
|
$ |
86,611 |
|
$ |
33,050 |
|
$ |
74,290 |
|
$ |
30,533 |
|
$ |
84,405 |
|
$ |
37,190 |
|
|
|
|
|
|
|
|
|
|
|
|
|
|
|
| ||||||
|
Transaction related costs, net of recoveries |
|
$ |
3 |
|
$ |
3 |
|
$ |
8 |
|
$ |
7 |
|
$ |
(207 |
) |
$ |
27 |
|
|
Interest expense, net of interest income |
|
51,715 |
|
18,259 |
|
44,007 |
|
15,255 |
|
44,728 |
|
15,427 |
| ||||||
|
Amortization of deferred financing costs |
|
3,145 |
|
1,344 |
|
3,010 |
|
1,321 |
|
2,026 |
|
832 |
| ||||||
|
Depreciation and amortization |
|
37,894 |
|
15,494 |
|
32,984 |
|
13,860 |
|
33,858 |
|
14,596 |
| ||||||
|
Loss on early extinguishment of debt |
|
— |
|
— |
|
833 |
|
407 |
|
3,546 |
|
1,787 |
| ||||||
|
|
|
|
|
|
|
|
|
|
|
|
|
|
| ||||||
|
Net (Loss) Income |
|
$ |
(474 |
) |
$ |
3,540 |
|
$ |
620 |
|
$ |
4,204 |
|
$ |
10,144 |
|
$ |
8,839 |
|
|
|
|
|
|
|
|
|
|
|
|
|
|
|
| ||||||
|
Real estate depreciation |
|
37,816 |
|
15,484 |
|
32,934 |
|
13,851 |
|
33,840 |
|
14,587 |
| ||||||
|
FFO Contribution |
|
$ |
37,342 |
|
$ |
19,024 |
|
$ |
33,554 |
|
$ |
18,055 |
|
$ |
43,984 |
|
$ |
23,426 |
|
|
|
|
|
|
|
|
|
|
|
|
|
|
|
| ||||||
|
FAD Adjustments: |
|
|
|
|
|
|
|
|
|
|
|
|
| ||||||
|
Non real estate depreciation and amortization |
|
$ |
3,223 |
|
$ |
1,354 |
|
$ |
3,060 |
|
$ |
1,331 |
|
$ |
1,944 |
|
$ |
790 |
|
|
Straight-line rental income and other non-cash adjustments |
|
(9,793 |
) |
(5,042 |
) |
(7,498 |
) |
(3,459 |
) |
(8,873 |
) |
(3,901 |
) | ||||||
|
Second cycle tenant improvement |
|
(4,099 |
) |
(1,837 |
) |
(1,755 |
) |
(751 |
) |
(3,730 |
) |
(1,806 |
) | ||||||
|
Second cycle leasing commissions |
|
(1,238 |
) |
(731 |
) |
(2,243 |
) |
(949 |
) |
(2,324 |
) |
(1,064 |
) | ||||||
|
Recurring CAPEX |
|
(1,563 |
) |
(831 |
) |
(254 |
) |
(132 |
) |
(993 |
) |
(466 |
) | ||||||
|
FAD Adjustment |
|
$ |
(13,470 |
) |
$ |
(7,087 |
) |
$ |
(8,690 |
) |
$ |
(3,960 |
) |
$ |
(13,976 |
) |
$ |
(6,447 |
) |
|
|
|
|
|
|
|
|
|
|
|
|
|
|
| ||||||
|
First cycle tenant improvement |
|
$ |
8,913 |
|
$ |
4,367 |
|
$ |
3,208 |
|
$ |
1,466 |
|
$ |
1,331 |
|
$ |
678 |
|
|
First cycle leasing commissions |
|
$ |
9,533 |
|
$ |
4,356 |
|
$ |
11,332 |
|
$ |
5,723 |
|
$ |
1,790 |
|
$ |
690 |
|
|
Redevelopment costs |
|
$ |
27,093 |
|
$ |
12,667 |
|
$ |
30,730 |
|
$ |
14,414 |
|
$ |
48,345 |
|
$ |
24,159 |
|
|
Capitalized interest |
|
$ |
8,427 |
|
$ |
4,215 |
|
$ |
12,308 |
|
$ |
6,038 |
|
$ |
10,636 |
|
$ |
5,268 |
|
|
Supplemental Information |
Second Quarter 2015 |
|
JOINT VENTURE STATEMENTS Statements of Operations for Unconsolidated Joint Ventures Unaudited (Amounts in Thousands) |
|

|
|
|
Six Months Ended June 30, 2015 |
|
Six Months Ended June 30, 2014 |
| ||||||||
|
|
|
Total |
|
SLG Interest |
|
Total |
|
SLG Interest |
| ||||
|
Revenues |
|
|
|
|
|
|
|
|
| ||||
|
Rental revenue, net |
|
$ |
234,449 |
|
$ |
90,097 |
|
$ |
255,451 |
|
$ |
109,449 |
|
|
Escalation and reimbursement revenues |
|
17,587 |
|
7,537 |
|
17,782 |
|
7,821 |
| ||||
|
Other income |
|
20,415 |
|
12,810 |
|
18,400 |
|
10,325 |
| ||||
|
Total Revenues, net |
|
$ |
272,451 |
|
$ |
110,444 |
|
$ |
291,633 |
|
$ |
127,595 |
|
|
|
|
|
|
|
|
|
|
|
| ||||
|
Expenses |
|
|
|
|
|
|
|
|
| ||||
|
Operating expenses |
|
$ |
51,831 |
|
$ |
18,909 |
|
$ |
45,045 |
|
$ |
20,344 |
|
|
Ground rent |
|
5,164 |
|
2,582 |
|
4,657 |
|
2,288 |
| ||||
|
Real estate taxes |
|
41,711 |
|
15,259 |
|
32,342 |
|
14,135 |
| ||||
|
Total Operating Expenses |
|
$ |
98,706 |
|
$ |
36,750 |
|
$ |
82,044 |
|
$ |
36,767 |
|
|
|
|
|
|
|
|
|
|
|
| ||||
|
NOI |
|
$ |
173,745 |
|
$ |
73,694 |
|
$ |
209,589 |
|
$ |
90,828 |
|
|
Cash NOI |
|
$ |
160,901 |
|
$ |
63,583 |
|
$ |
187,094 |
|
$ |
81,652 |
|
|
|
|
|
|
|
|
|
|
|
| ||||
|
Transaction related costs, net of recoveries |
|
$ |
11 |
|
$ |
10 |
|
$ |
64 |
|
$ |
100 |
|
|
Interest expense, net of interest income |
|
95,722 |
|
33,514 |
|
97,064 |
|
34,130 |
| ||||
|
Amortization of deferred financing costs |
|
6,155 |
|
2,665 |
|
6,659 |
|
3,458 |
| ||||
|
Depreciation and amortization |
|
70,878 |
|
29,354 |
|
79,462 |
|
34,519 |
| ||||
|
Loss on early extinguishment of debt |
|
833 |
|
407 |
|
6,743 |
|
3,382 |
| ||||
|
|
|
|
|
|
|
|
|
|
| ||||
|
Net Income |
|
$ |
146 |
|
$ |
7,744 |
|
$ |
19,597 |
|
$ |
15,239 |
|
|
|
|
|
|
|
|
|
|
|
| ||||
|
Real estate depreciation |
|
70,750 |
|
29,335 |
|
79,427 |
|
34,500 |
| ||||
|
FFO Contribution |
|
$ |
70,896 |
|
$ |
37,079 |
|
$ |
99,024 |
|
$ |
49,739 |
|
|
|
|
|
|
|
|
|
|
|
| ||||
|
FAD Adjustments: |
|
|
|
|
|
|
|
|
| ||||
|
Non real estate depreciation and amortization |
|
$ |
6,283 |
|
$ |
2,685 |
|
$ |
5,605 |
|
$ |
2,434 |
|
|
Straight-line rental income and other non-cash adjustments |
|
(17,291 |
) |
(8,501 |
) |
(23,271 |
) |
(9,543 |
) | ||||
|
Second cycle tenant improvement |
|
(5,854 |
) |
(2,588 |
) |
(10,287 |
) |
(5,066 |
) | ||||
|
Second cycle leasing commissions |
|
(3,481 |
) |
(1,680 |
) |
(14,670 |
) |
(7,265 |
) | ||||
|
Recurring CAPEX |
|
(1,817 |
) |
(963 |
) |
(1,985 |
) |
(926 |
) | ||||
|
FAD Adjustment |
|
$ |
(22,160 |
) |
$ |
(11,047 |
) |
$ |
(44,608 |
) |
$ |
(20,366 |
) |
|
|
|
|
|
|
|
|
|
|
| ||||
|
First cycle tenant improvement |
|
$ |
12,121 |
|
$ |
5,833 |
|
$ |
8,332 |
|
$ |
4,150 |
|
|
First cycle leasing commissions |
|
$ |
20,865 |
|
$ |
10,079 |
|
$ |
6,685 |
|
$ |
2,850 |
|
|
Redevelopment costs |
|
$ |
57,823 |
|
$ |
27,081 |
|
$ |
141,601 |
|
$ |
70,002 |
|
|
Capitalized interest |
|
$ |
20,735 |
|
$ |
10,253 |
|
$ |
22,801 |
|
$ |
11,301 |
|
|
Supplemental Information |
Second Quarter 2015 |
|
| |
|
SELECTED FINANCIAL DATA Property NOI and Components of Consolidated Debt Service and Fixed Charges Unaudited (Dollars in Thousands) |
|

|
|
|
Three Months Ended |
|
Three Months Ended |
|
Six Months Ended |
| |||||||||
|
|
|
June 30, |
|
June 30, |
|
March 31, |
|
June 30, |
|
June 30, |
| |||||
|
|
|
2015 |
|
2014 |
|
2015 |
|
2015 |
|
2014 |
| |||||
|
Property NOI |
|
|
|
|
|
|
|
|
|
|
| |||||
|
|
|
|
|
|
|
|
|
|
|
|
| |||||
|
Property NOI |
|
$ |
211,147 |
|
$ |
189,242 |
|
$ |
203,610 |
|
$ |
414,757 |
|
$ |
352,733 |
|
|
NOI from discontinued operations |
|
— |
|
10,661 |
|
488 |
|
488 |
|
24,599 |
| |||||
|
Total property NOI - consolidated |
|
211,147 |
|
199,903 |
|
204,098 |
|
415,245 |
|
377,332 |
| |||||
|
SLG share of property NOI from unconsolidated JVs |
|
38,640 |
|
41,508 |
|
35,054 |
|
73,694 |
|
90,828 |
| |||||
|
Combined NOI |
|
$ |
249,787 |
|
$ |
241,411 |
|
$ |
239,152 |
|
$ |
488,939 |
|
$ |
468,160 |
|
|
Partners’ share of property NOI - consolidated JVs |
|
(9,219 |
) |
(10,502 |
) |
(8,784 |
) |
(18,003 |
) |
$ |
(21,569 |
) | ||||
|
NOI - SLG share |
|
$ |
240,568 |
|
$ |
230,909 |
|
$ |
230,368 |
|
$ |
470,936 |
|
$ |
446,591 |
|
|
|
|
|
|
|
|
|
|
|
|
|
| |||||
|
NOI |
|
$ |
249,787 |
|
$ |
241,411 |
|
$ |
239,152 |
|
$ |
488,939 |
|
$ |
468,160 |
|
|
Free rent (net of amortization) |
|
(25,067 |
) |
(2,274 |
) |
(22,473 |
) |
(47,540 |
) |
(3,600 |
) | |||||
|
Net FAS 141 adjustment |
|
(8,903 |
) |
(5,918 |
) |
(14,543 |
) |
(23,446 |
) |
(10,207 |
) | |||||
|
Straightline revenue adjustment |
|
(12,494 |
) |
(16,953 |
) |
(13,402 |
) |
(25,896 |
) |
(33,541 |
) | |||||
|
Allowance for S/L tenant credit loss |
|
(71 |
) |
(1,031 |
) |
(912 |
) |
(983 |
) |
(2,256 |
) | |||||
|
Ground lease straight-line adjustment |
|
705 |
|
1,324 |
|
705 |
|
1,410 |
|
3,327 |
| |||||
|
Combined Cash NOI |
|
$ |
203,957 |
|
$ |
216,559 |
|
$ |
188,527 |
|
$ |
392,484 |
|
$ |
421,883 |
|
|
Partners’ share of property NOI - consolidated JVs |
|
(5,713 |
) |
(8,390 |
) |
(7,615 |
) |
(13,328 |
) |
(18,278 |
) | |||||
|
Cash NOI - SLG share |
|
$ |
198,244 |
|
$ |
208,169 |
|
$ |
180,912 |
|
$ |
379,156 |
|
$ |
403,605 |
|
|
|
|
|
|
|
|
|
|
|
|
|
| |||||
|
Components of Consolidated Debt Service and Fixed Charges |
|
|
|
|
|
|
|
|
|
|
| |||||
|
|
|
|
|
|
|
|
|
|
|
|
| |||||
|
Interest expense |
|
$ |
75,746 |
|
$ |
81,318 |
|
$ |
75,916 |
|
$ |
151,662 |
|
162,158 |
| |
|
Principal amortization payments |
|
7,530 |
|
10,696 |
|
7,666 |
|
15,196 |
|
21,468 |
| |||||
|
Total Consolidated Debt Service |
|
$ |
83,276 |
|
$ |
92,014 |
|
$ |
83,582 |
|
$ |
166,858 |
|
$ |
183,626 |
|
|
|
|
|
|
|
|
|
|
|
|
|
| |||||
|
Payments under ground lease arrangements |
|
$ |
7,592 |
|
$ |
8,095 |
|
$ |
7,694 |
|
$ |
15,286 |
|
16,890 |
| |
|
Dividends on preferred units |
|
1,140 |
|
565 |
|
951 |
|
2,091 |
|
1,130 |
| |||||
|
Dividends on perpetual preferred shares |
|
3,738 |
|
3,738 |
|
3,738 |
|
7,476 |
|
7,475 |
| |||||
|
Total Consolidated Fixed Charges |
|
$ |
95,746 |
|
$ |
104,412 |
|
$ |
95,965 |
|
$ |
191,711 |
|
$ |
209,121 |
|
|
Supplemental Information |
Second Quarter 2015 |
|
| |
|
SELECTED FINANCIAL DATA 2015 Same Store - Consolidated Unaudited (Dollars in Thousands) |
|

|
|
|
Three Months Ended |
|
|
|
Three Months Ended |
|
Six Months Ended |
|
|
| ||||||||||
|
|
|
June 30, |
|
June 30, |
|
|
|
March 31, |
|
June 30, |
|
June 30, |
|
|
| ||||||
|
|
|
2015 |
|
2014 |
|
% |
|
2015 |
|
2015 |
|
2014 |
|
% |
| ||||||
|
Revenues |
|
|
|
|
|
|
|
|
|
|
|
|
|
|
| ||||||
|
|
Rental revenue, net |
|
$ |
267,669 |
|
$ |
258,639 |
|
3.5 |
% |
$ |
258,770 |
|
$ |
526,438 |
|
$ |
507,425 |
|
3.7 |
% |
|
|
Escalation & reimbursement revenues |
|
40,813 |
|
37,248 |
|
9.6 |
% |
40,294 |
|
81,107 |
|
73,788 |
|
9.9 |
% | |||||
|
|
Other income |
|
13,592 |
|
789 |
|
1622.7 |
% |
1,518 |
|
15,109 |
|
2,002 |
|
654.7 |
% | |||||
|
|
Total Revenues |
|
$ |
322,074 |
|
$ |
296,676 |
|
8.6 |
% |
$ |
300,582 |
|
$ |
622,654 |
|
$ |
583,215 |
|
6.8 |
% |
|
Expenses |
|
|
|
|
|
|
|
|
|
|
|
|
|
|
| ||||||
|
|
Operating expenses |
|
$ |
65,324 |
|
$ |
63,121 |
|
3.5 |
% |
$ |
71,004 |
|
$ |
136,327 |
|
$ |
128,417 |
|
6.2 |
% |
|
|
Ground rent |
|
8,232 |
|
8,283 |
|
-0.6 |
% |
8,334 |
|
16,566 |
|
16,566 |
|
0.0 |
% | |||||
|
|
Real estate taxes |
|
55,738 |
|
50,357 |
|
10.7 |
% |
55,158 |
|
110,895 |
|
100,987 |
|
9.8 |
% | |||||
|
|
Transaction related costs, net of recoveries |
|
191 |
|
117 |
|
63.2 |
% |
— |
|
191 |
|
893 |
|
-78.6 |
% | |||||
|
|
|
|
$ |
129,485 |
|
$ |
121,878 |
|
6.2 |
% |
$ |
134,496 |
|
$ |
263,979 |
|
$ |
246,863 |
|
6.9 |
% |
|
|
|
|
|
|
|
|
|
|
|
|
|
|
|
|
|
| |||||
|
|
Operating Income |
|
$ |
192,589 |
|
$ |
174,798 |
|
10.2 |
% |
$ |
166,086 |
|
$ |
358,675 |
|
$ |
336,352 |
|
6.6 |
% |
|
|
|
|
|
|
|
|
|
|
|
|
|
|
|
|
|
| |||||
|
|
Interest expense & amortization of financing costs |
|
$ |
47,756 |
|
$ |
53,954 |
|
-11.5 |
% |
$ |
48,986 |
|
$ |
96,742 |
|
$ |
108,262 |
|
-10.6 |
% |
|
|
Depreciation & amortization |
|
82,509 |
|
84,887 |
|
-2.8 |
% |
80,767 |
|
163,276 |
|
165,857 |
|
-1.6 |
% | |||||
|
|
|
|
|
|
|
|
|
|
|
|
|
|
|
|
|
| |||||
|
|
Income before noncontrolling interest |
|
$ |
62,324 |
|
$ |
35,957 |
|
73.3 |
% |
$ |
36,333 |
|
$ |
98,657 |
|
$ |
62,233 |
|
58.5 |
% |
|
Plus: |
Real estate depreciation & amortization |
|
82,457 |
|
84,835 |
|
-2.8 |
% |
80,715 |
|
163,172 |
|
165,739 |
|
-1.5 |
% | |||||
|
|
|
|
|
|
|
|
|
|
|
|
|
|
|
|
|
| |||||
|
|
FFO Contribution |
|
$ |
144,781 |
|
$ |
120,792 |
|
19.9 |
% |
$ |
117,048 |
|
$ |
261,829 |
|
$ |
227,972 |
|
14.9 |
% |
|
|
|
|
|
|
|
|
|
|
|
|
|
|
|
|
|
| |||||
|
Less: |
Non—building revenue |
|
300 |
|
256 |
|
17.2 |
% |
484 |
|
784 |
|
441 |
|
77.8 |
% | |||||
|
|
|
|
|
|
|
|
|
|
|
|
|
|
|
|
|
| |||||
|
Plus: |
Transaction related costs, net of recoveries |
|
191 |
|
117 |
|
63.2 |
% |
— |
|
191 |
|
893 |
|
-78.6 |
% | |||||
|
|
Interest expense & amortization of financing costs |
|
47,756 |
|
53,954 |
|
-11.5 |
% |
48,986 |
|
96,742 |
|
108,262 |
|
-10.6 |
% | |||||
|
|
Non-real estate depreciation |
|
52 |
|
52 |
|
0.0 |
% |
52 |
|
104 |
|
118 |
|
-11.9 |
% | |||||
|
|
NOI |
|
$ |
192,480 |
|
$ |
174,659 |
|
10.2 |
% |
$ |
165,602 |
|
$ |
358,082 |
|
$ |
336,804 |
|
6.3 |
% |
|
|
|
|
|
|
|
|
|
|
|
|
|
|
|
|
|
| |||||
|
Cash Adjustments |
|
|
|
|
|
|
|
|
|
|
|
|
|
|
| ||||||
|
Less: |
Free rent (net of amortization) |
|
3,626 |
|
2,678 |
|
35.4 |
% |
2,265 |
|
5,892 |
|
2,456 |
|
139.9 |
% | |||||
|
|
Straightline revenue & other adjustments |
|
20,004 |
|
10,596 |
|
88.8 |
% |
9,760 |
|
29,763 |
|
20,035 |
|
48.6 |
% | |||||
|
|
Rental income - FAS 141 |
|
5,197 |
|
6,249 |
|
-16.8 |
% |
3,262 |
|
8,460 |
|
12,235 |
|
-30.9 |
% | |||||
|
Plus: |
Ground lease straight-line adjustment |
|
400 |
|
400 |
|
0.0 |
% |
400 |
|
801 |
|
801 |
|
0.0 |
% | |||||
|
|
Allowance for S/L tenant credit loss |
|
(723 |
) |
(4 |
) |
17975.0 |
% |
(914 |
) |
(1,636 |
) |
(950 |
) |
72.2 |
% | |||||
|
|
Cash NOI |
|
$ |
163,330 |
|
$ |
155,532 |
|
5.0 |
% |
$ |
149,801 |
|
$ |
313,132 |
|
$ |
301,929 |
|
3.7 |
% |
|
|
|
|
|
|
|
|
|
|
|
|
|
|
|
|
|
| |||||
|
Operating Margins |
|
|
|
|
|
|
|
|
|
|
|
|
|
|
| ||||||
|
|
NOI to real estate revenue, net |
|
60.0 |
% |
58.9 |
% |
|
|
55.4 |
% |
57.7 |
% |
57.9 |
% |
|
| |||||
|
|
Cash NOI to real estate revenue, net |
|
50.9 |
% |
52.5 |
% |
|
|
50.1 |
% |
50.5 |
% |
51.9 |
% |
|
| |||||
|
|
|
|
|
|
|
|
|
|
|
|
|
|
|
|
|
| |||||
|
|
NOI before ground rent/real estate revenue, net |
|
62.5 |
% |
61.7 |
% |
|
|
58.1 |
% |
60.4 |
% |
60.7 |
% |
|
| |||||
|
|
Cash NOI before ground rent/real estate revenue, net |
|
53.3 |
% |
55.1 |
% |
|
|
52.7 |
% |
53.0 |
% |
54.6 |
% |
|
| |||||
|
Supplemental Information |
Second Quarter 2015 |
|
| |
|
SELECTED FINANCIAL DATA 2015 Same Store - Joint Venture Unaudited (Dollars in Thousands) |
|

|
|
|
Three Months Ended |
|
|
|
Three Months Ended |
|
Six Months Ended |
|
|
| ||||||||||
|
|
|
June 30, |
|
June 30, |
|
|
|
March 31, |
|
June 30, |
|
June 30, |
|
|
| ||||||
|
|
|
2015 |
|
2014 |
|
% |
|
2015 |
|
2015 |
|
2014 |
|
% |
| ||||||
|
Revenues |
|
|
|
|
|
|
|
|
|
|
|
|
|
|
| ||||||
|
|
Rental revenue, net |
|
$ |
31,236 |
|
$ |
30,161 |
|
3.6 |
% |
$ |
31,887 |
|
$ |
63,123 |
|
$ |
60,254 |
|
4.8 |
% |
|
|
Escalation & reimbursement revenues |
|
3,010 |
|
2,340 |
|
28.6 |
% |
2,846 |
|
5,856 |
|
4,853 |
|
20.7 |
% | |||||
|
|
Other income |
|
207 |
|
250 |
|
-17.2 |
% |
312 |
|
520 |
|
524 |
|
-0.8 |
% | |||||
|
|
Total Revenues |
|
$ |
34,453 |
|
$ |
32,751 |
|
5.2 |
% |
$ |
35,045 |
|
$ |
69,499 |
|
$ |
65,631 |
|
5.9 |
% |
|
Expenses |
|
|
|
|
|
|
|
|
|
|
|
|
|
|
| ||||||
|
|
Operating expenses |
|
$ |
6,259 |
|
$ |
5,837 |
|
7.2 |
% |
$ |
6,968 |
|
$ |
13,227 |
|
$ |
12,474 |
|
6.0 |
% |
|
|
Real estate taxes |
|
5,319 |
|
4,659 |
|
14.2 |
% |
5,314 |
|
10,633 |
|
9,293 |
|
14.4 |
% | |||||
|
|
|
|
$ |
11,578 |
|
$ |
10,496 |
|
10.3 |
% |
$ |
12,282 |
|
$ |
23,860 |
|
$ |
21,767 |
|
9.6 |
% |
|
|
|
|
|
|
|
|
|
|
|
|
|
|
|
|
|
| |||||
|
|
Operating Income |
|
$ |
22,875 |
|
$ |
22,255 |
|
2.8 |
% |
$ |
22,763 |
|
$ |
45,639 |
|
$ |
43,864 |
|
4.0 |
% |
|
|
|
|
|
|
|
|
|
|
|
|
|
|
|
|
|
| |||||
|
|
Interest expense & amortization of financing costs |
|
$ |
9,748 |
|
$ |
8,148 |
|
19.6 |
% |
$ |
9,099 |
|
$ |
18,845 |
|
$ |
16,695 |
|
12.9 |
% |
|
|
Depreciation & amortization |
|
10,963 |
|
10,210 |
|
7.4 |
% |
10,658 |
|
21,622 |
|
20,069 |
|
7.7 |
% | |||||
|
|
|
|
|
|
|
|
|
|
|
|
|
|
|
|
|
| |||||
|
|
Income before noncontrolling interest |
|
$ |
2,164 |
|
$ |
3,897 |
|
-44.5 |
% |
$ |
3,006 |
|
$ |
5,172 |
|
$ |
7,100 |
|
-27.2 |
% |
|
Plus: |
Real estate depreciation & amortization |
|
10,955 |
|
10,202 |
|
7.4 |
% |
10,649 |
|
21,604 |
|
20,052 |
|
7.7 |
% | |||||
|
|
|
|
|
|
|
|
|
|
|
|
|
|
|
|
|
| |||||
|
|
FFO Contribution |
|
$ |
13,119 |
|
$ |
14,099 |
|
-7.0 |
% |
$ |
13,655 |
|
$ |
26,776 |
|
$ |
27,152 |
|
-1.4 |
% |
|
|
|
|
|
|
|
|
|
|
|
|
|
|
|
|
|
| |||||
|
Less: |
Non—building revenue |
|
7 |
|
39 |
|
-82.1 |
% |
116 |
|
123 |
|
82 |
|
50.0 |
% | |||||
|
|
|
|
|
|
|
|
|
|
|
|
|
|
|
|
|
| |||||
|
Plus: |
Interest expense & amortization of financing costs |
|
9,748 |
|
8,148 |
|
19.6 |
% |
9,099 |
|
18,845 |
|
16,695 |
|
12.9 |
% | |||||
|
|
Non-real estate depreciation |
|
8 |
|
8 |
|
0.0 |
% |
9 |
|
18 |
|
17 |
|
5.9 |
% | |||||
|
|
NOI |
|
$ |
22,868 |
|
$ |
22,216 |
|
2.9 |
% |
$ |
22,647 |
|
$ |
45,516 |
|
$ |
43,782 |
|
4.0 |
% |
|
|
|
|
|
|
|
|
|
|
|
|
|
|
|
|
|
| |||||
|
Cash Adjustments |
|
|
|
|
|
|
|
|
|
|
|
|
|
|
| ||||||
|
Less: |
Free rent (net of amortization) |
|
724 |
|
609 |
|
18.9 |
% |
531 |
|
1,255 |
|
1,593 |
|
-21.2 |
% | |||||
|
|
Straightline revenue & other adjustments |
|
1,273 |
|
1,434 |
|
-11.2 |
% |
1,616 |
|
2,890 |
|
3,269 |
|
-11.6 |
% | |||||
|
|
Rental income - FAS 141 |
|
258 |
|
390 |
|
-33.8 |
% |
535 |
|
793 |
|
854 |
|
-7.1 |
% | |||||
|
Plus: |
Allowance for S/L tenant credit loss |
|
(134 |
) |
(19 |
) |
605.3 |
% |
— |
|
(134 |
) |
52 |
|
-357.7 |
% | |||||
|
|
Cash NOI |
|
$ |
20,479 |
|
$ |
19,764 |
|
3.6 |
% |
$ |
19,965 |
|
$ |
40,444 |
|
$ |
38,118 |
|
6.1 |
% |
|
|
|
|
|
|
|
|
|
|
|
|
|
|
|
|
|
| |||||
|
Operating Margins |
|
|
|
|
|
|
|
|
|
|
|
|
|
|
| ||||||
|
|
NOI to real estate revenue, net |
|
66.6 |
% |
68.0 |
% |
|
|
64.8 |
% |
65.7 |
% |
66.7 |
% |
|
| |||||
|
|
Cash NOI to real estate revenue, net |
|
59.7 |
% |
60.5 |
% |
|
|
57.2 |
% |
58.4 |
% |
58.1 |
% |
|
| |||||
|
|
|
|
|
|
|
|
|
|
|
|
|
|
|
|
|
| |||||
|
|
NOI before ground rent/real estate revenue, net |
|
66.6 |
% |
68.0 |
% |
|
|
64.8 |
% |
65.7 |
% |
66.7 |
% |
|
| |||||
|
|
Cash NOI before ground rent/real estate revenue, net |
|
59.7 |
% |
60.5 |
% |
|
|
57.2 |
% |
58.4 |
% |
58.1 |
% |
|
| |||||
|
Supplemental Information |
Second Quarter 2015 |
|
| |
|
SELECTED FINANCIAL DATA 2015 Same Store - Combined Unaudited (Dollars in Thousands) |
|

|
|
|
|
Three Months Ended |
|
|
|
Three Months Ended |
|
Six Months Ended |
|
|
| |||||||||
|
|
|
|
June 30, |
|
June 30, |
|
|
|
March 31, |
|
June 30, |
|
June 30, |
|
|
| |||||
|
|
|
|
2015 |
|
2014 |
|
% |
|
2015 |
|
2015 |
|
2014 |
|
% |
| |||||
|
Revenues |
|
|
|
|
|
|
|
|
|
|
|
|
|
|
| ||||||
|
|
Rental revenue, net |
|
$ |
298,905 |
|
$ |
288,800 |
|
3.5 |
% |
$ |
290,657 |
|
$ |
589,561 |
|
$ |
567,679 |
|
3.9 |
% |
|
|
Escalation & reimbursement revenues |
|
43,823 |
|
39,588 |
|
10.7 |
% |
43,140 |
|
86,963 |
|
78,641 |
|
10.6 |
% | |||||
|
|
Other income |
|
13,799 |
|
1,039 |
|
1228.1 |
% |
1,830 |
|
15,629 |
|
2,526 |
|
518.7 |
% | |||||
|
|
Total Revenues |
|
$ |
356,527 |
|
$ |
329,427 |
|
8.2 |
% |
$ |
335,627 |
|
$ |
692,153 |
|
$ |
648,846 |
|
6.7 |
% |
|
Expenses |
|
|
|
|
|
|
|
|
|
|
|
|
|
|
| ||||||
|
|
Operating expenses |
|
$ |
71,583 |
|
$ |
68,958 |
|
3.8 |
% |
$ |
77,972 |
|
$ |
149,554 |
|
$ |
140,891 |
|
6.1 |
% |
|
|
Ground rent |
|
8,232 |
|
8,283 |
|
-0.6 |
% |
8,334 |
|
16,566 |
|
16,566 |
|
0.0 |
% | |||||
|
|
Real estate taxes |
|
61,057 |
|
55,016 |
|
11.0 |
% |
60,472 |
|
121,528 |
|
110,280 |
|
10.2 |
% | |||||
|
|
Transaction related costs, net of recoveries |
|
191 |
|
117 |
|
63.2 |
% |
— |
|
191 |
|
893 |
|
-78.6 |
% | |||||
|
|
|
|
$ |
141,063 |
|
$ |
132,374 |
|
6.6 |
% |
$ |
146,778 |
|
$ |
287,839 |
|
$ |
268,630 |
|
7.2 |
% |
|
|
|
|
|
|
|
|
|
|
|
|
|
|
|
|
|
| |||||
|
|
Operating Income |
|
$ |
215,464 |
|
$ |
197,053 |
|
9.3 |
% |
$ |
188,849 |
|
$ |
404,314 |
|
$ |
380,216 |
|
6.3 |
% |
|
|
|
|
|
|
|
|
|
|
|
|
|
|
|
|
|
| |||||
|
|
Interest expense & amortization of financing costs |
|
$ |
57,504 |
|
$ |
62,102 |
|
-7.4 |
% |
$ |
58,085 |
|
$ |
115,587 |
|
$ |
124,957 |
|
-7.5 |
% |
|
|
Depreciation & amortization |
|
93,472 |
|
95,097 |
|
-1.7 |
% |
91,425 |
|
184,898 |
|
185,926 |
|
-0.6 |
% | |||||
|
|
|
|
|
|
|
|
|
|
|
|
|
|
|
|
|
| |||||
|
|
Income before noncontrolling interest |
|
$ |
64,488 |
|
$ |
39,854 |
|
61.8 |
% |
$ |
39,339 |
|
$ |
103,829 |
|
$ |
69,333 |
|
49.8 |
% |
|
Plus: |
Real estate depreciation & amortization |
|
93,412 |
|
95,037 |
|
-1.7 |
% |
91,364 |
|
184,776 |
|
185,791 |
|
-0.5 |
% | |||||
|
|
|
|
|
|
|
|
|
|
|
|
|
|
|
|
|
| |||||
|
|
FFO Contribution |
|
$ |
157,900 |
|
$ |
134,891 |
|
17.1 |
% |
$ |
130,703 |
|
$ |
288,605 |
|
$ |
255,124 |
|
13.1 |
% |
|
|
|
|
|
|
|
|
|
|
|
|
|
|
|
|
|
| |||||
|
Less: |
Non—building revenue |
|
307 |
|
295 |
|
4.1 |
% |
600 |
|
907 |
|
523 |
|
73.4 |
% | |||||
|
|
|
|
|
|
|
|
|
|
|
|
|
|
|
|
|
| |||||
|
Plus: |
Transaction related costs, net of recoveries |
|
191 |
|
117 |
|
63.2 |
% |
— |
|
191 |
|
893 |
|
-78.6 |
% | |||||
|
|
Interest expense & amortization of financing costs |
|
57,504 |
|
62,102 |
|
-7.4 |
% |
58,085 |
|
115,587 |
|
124,957 |
|
-7.5 |
% | |||||
|
|
Non-real estate depreciation |
|
60 |
|
60 |
|
0.0 |
% |
61 |
|
122 |
|
135 |
|
-9.6 |
% | |||||
|
|
NOI |
|
$ |
215,348 |
|
$ |
196,875 |
|
9.4 |
% |
$ |
188,249 |
|
$ |
403,598 |
|
$ |
380,586 |
|
6.0 |
% |
|
|
|
|
|
|
|
|
|
|
|
|
|
|
|
|
|
| |||||
|
Cash Adjustments |
|
|
|
|
|
|
|
|
|
|
|
|
|
|
| ||||||
|
Less: |
Free rent (net of amortization) |
|
4,350 |
|
3,287 |
|
32.3 |
% |
2,796 |
|
7,147 |
|
4,049 |
|
76.5 |
% | |||||
|
|
Straightline revenue & other adjustments |
|
21,277 |
|
12,030 |
|
76.9 |
% |
11,376 |
|
32,653 |
|
23,304 |
|
40.1 |
% | |||||
|
|
Rental income - FAS 141 |
|
5,455 |
|
6,639 |
|
-17.8 |
% |
3,797 |
|
9,253 |
|
13,089 |
|
-29.3 |
% | |||||
|
Plus: |
Ground lease straight-line adjustment |
|
400 |
|
400 |
|
0.0 |
% |
400 |
|
801 |
|
801 |
|
0.0 |
% | |||||
|
|
Allowance for S/L tenant credit loss |
|
(857 |
) |
(23 |
) |
3626.1 |
% |
(914 |
) |
(1,770 |
) |
(898 |
) |
97.1 |
% | |||||
|
|
Cash NOI |
|
$ |
183,809 |
|
$ |
175,296 |
|
4.9 |
% |
$ |
169,766 |
|
$ |
353,576 |
|
$ |
340,047 |
|
4.0 |
% |
|
|
|
|
|
|
|
|
|
|
|
|
|
|
|
|
|
| |||||
|
Operating Margins |
|
|
|
|
|
|
|
|
|
|
|
|
|
|
| ||||||
|
|
NOI to real estate revenue, net |
|
60.6 |
% |
59.8 |
% |
|
|
56.3 |
% |
58.5 |
% |
58.8 |
% |
|
| |||||
|
|
Cash NOI to real estate revenue, net |
|
51.7 |
% |
53.3 |
% |
|
|
50.8 |
% |
51.3 |
% |
52.5 |
% |
|
| |||||
|
|
|
|
|
|
|
|
|
|
|
|
|
|
|
|
|
| |||||
|
|
NOI before ground rent/real estate revenue, net |
|
62.9 |
% |
62.3 |
% |
|
|
58.8 |
% |
60.9 |
% |
61.3 |
% |
|
| |||||
|
|
Cash NOI before ground rent/real estate revenue, net |
|
53.9 |
% |
55.7 |
% |
|
|
53.2 |
% |
53.6 |
% |
55.0 |
% |
|
| |||||
|
Supplemental Information |
Second Quarter 2015 |
|
| |
|
DEBT SUMMARY SCHEDULE - Consolidated
Unaudited (Dollars in Thousands) |
|

|
|
|
Principal |
|
|
|
2015 |
|
|
|
|
|
As-Of |
|
|
| |||
|
|
|
Outstanding |
|
|
|
Principal |
|
Maturity |
|
Due at |
|
Right |
|
Earliest |
| |||
|
|
|
6/30/2015 (1) |
|
Coupon (2) |
|
Amortization |
|
Date |
|
Maturity |
|
Extension |
|
Prepayment |
| |||
|
Fixed rate debt |
|
|
|
|
|
|
|
|
|
|
|
|
|
|
| |||
|
|
|
|
|
|
|
|
|
|
|
|
|
|
|
|
| |||
|
Secured fixed rate debt |
|
|
|
|
|
|
|
|
|
|
|
|
|
|
| |||
|
500 West Putnam Avenue |
|
22,676 |
|
5.52 |
% |
593 |
|
Jan-16 |
|
22,376 |
|
— |
|
Open |
| |||
|
1-6 Landmark Square |
|
80,424 |
|
4.00 |
% |
1,707 |
|
Dec-16 |
|
77,936 |
|
— |
|
Open |
| |||
|
485 Lexington Avenue |
|
450,000 |
|
5.61 |
% |
— |
|
Feb-17 |
|
450,000 |
|
— |
|
Open |
| |||
|
762 Madison Avenue (swapped) |
|
7,959 |
|
3.86 |
% |
173 |
|
Feb-17 |
|
7,679 |
|
— |
|
Open |
| |||
|
885 Third Avenue |
|
267,650 |
|
6.26 |
% |
— |
|
Jul-17 |
|
267,650 |
|
— |
|
Open |
| |||
|
388-390 Greenwich Street (swapped) |
|
1,004,000 |
|
3.25 |
% |
— |
|
Jun-18 |
(3) |
1,004,000 |
|
Jun-21 |
|
Open |
| |||
|
1 Madison Avenue |
|
554,405 |
|
5.91 |
% |
22,925 |
|
May-20 |
|
404,531 |
|
— |
|
Open |
| |||
|
100 Church Street |
|
226,862 |
|
4.68 |
% |
3,513 |
|
Jul-22 |
|
197,784 |
|
— |
|
Open |
| |||
|
919 Third Avenue |
|
500,000 |
|
5.12 |
% |
— |
|
Jun-23 |
|
441,594 |
|
— |
|
Open |
| |||
|
400 East 57th Street |
|
68,276 |
|
4.13 |
% |
1,146 |
|
Feb-24 |
|
48,588 |
|
— |
|
Open |
| |||
|
400 East 58th Street |
|
29,261 |
|
4.13 |
% |
491 |
|
Feb-24 |
|
20,823 |
|
— |
|
Open |
| |||
|
420 Lexington Avenue |
|
300,000 |
|
3.99 |
% |
— |
|
Oct-24 |
|
272,749 |
|
— |
|
Mar-18 |
| |||
|
1515 Broadway |
|
900,000 |
|
3.93 |
% |
— |
|
Mar-25 |
|
737,436 |
|
— |
|
Open |
| |||
|
|
|
$ |
4,411,513 |
|
4.53 |
% |
$ |
30,548 |
|
|
|
$ |
3,953,146 |
|
|
|
|
|
|
Unsecured fixed rate debt |
|
|
|
|
|
|
|
|
|
|
|
|
|
|
| |||
|
Unsecured notes |
|
$ |
255,272 |
|
6.00 |
% |
$ |
— |
|
Mar-16 |
|
$ |
255,308 |
|
— |
|
Open |
|
|
Convertible notes |
|
314,993 |
|
3.00 |
% |
— |
|
Oct-17 |
|
345,000 |
|
— |
|
Open |
| |||
|
1745 Broadway |
|
16,000 |
|
4.81 |
% |
— |
|
Jun-18 |
|
16,000 |
|
— |
|
Open |
| |||
|
Unsecured notes |
|
249,777 |
|
5.00 |
% |
— |
|
Aug-18 |
|
250,000 |
|
— |
|
Open |
| |||
|
Term loan (swapped) |
|
30,000 |
|
3.70 |
% |
— |
|
Jun-19 |
(4) |
30,000 |
|
— |
|
Open |
| |||
|
Unsecured notes |
|
250,000 |
|
7.75 |
% |
— |
|
Mar-20 |
|
250,000 |
|
— |
|
Open |
| |||
|
Unsecured notes |
|
200,000 |
|
4.50 |
% |
— |
|
Dec-22 |
|
200,000 |
|
— |
|
Open |
| |||
|
Convertible notes |
|
10,008 |
|
3.00 |
% |
— |
|
Mar-27 |
(5) |
10,008 |
|
— |
|
Mar-17 |
| |||
|
Junior subordinated deferrable interest debentures |
|
100,000 |
|
5.61 |
% |
— |
|
Jul-35 |
|
100,000 |
|
— |
|
Open |
| |||
|
Series J Preferred Units |
|
4,000 |
|
3.75 |
% |
— |
|
Apr-51 |
|
4,000 |
|
— |
|
Open |
| |||
|
|
|
$ |
1,430,050 |
|
5.14 |
% |
$ |
— |
|
|
|
$ |
1,460,316 |
|
|
|
|
|
|
|
|
|
|
|
|
|
|
|
|
|
|
|
|
|
| |||
|
Total Fixed Rate Debt/Wtd Avg |
|
$ |
5,841,563 |
|
4.68 |
% |
$ |
30,548 |
|
|
|
$ |
5,413,462 |
|
|
|
|
|
|
Floating rate debt |
|
|
|
|
|
|
|
|
|
|
|
|
|
|
| |||
|
Secured floating rate debt |
|
|
|
|
|
|
|
|
|
|
|
|
|
|
| |||
|
Debt & preferred equity facility (LIBOR + 325 bps) |
|
$ |
106,421 |
|
3.44 |
% |
$ |
— |
|
Dec-15 |
|
$ |
106,421 |
|
— |
|
Open |
|
|
388-390 Greenwich Street (LIBOR + 175 bps) |
|
446,000 |
|
1.93 |
% |
— |
|
Jun-18 |
|
446,000 |
|
Jun-21 |
|
Open |
| |||
|
248-252 Bedford Avenue (LIBOR + 150 bps) |
|
29,000 |
|
1.69 |
% |
— |
|
Jun-19 |
|
28,317 |
|
— |
|
Open |
| |||
|
220 East 42nd St. (LIBOR + 160 bps) |
|
275,000 |
|
1.79 |
% |
— |
|
Oct-20 |
|
275,000 |
|
— |
|
Open |
| |||
|
|
|
$ |
856,421 |
|
2.07 |
% |
$ |
— |
|
|
|
$ |
855,738 |
|
|
|
|
|
|
Unsecured floating rate debt |
|
|
|
|
|
|
|
|
|
|
|
|
|
|
| |||
|
Revolving credit facility (LIBOR + 125 bps) |
|
$ |
705,000 |
|
1.44 |
% |
$ |
— |
|
Mar-19 |
|
$ |
705,000 |
|
Mar-20 |
|
Open |
|
|
Term loan (LIBOR + 140 bps) |
|
803,000 |
|
1.59 |
% |
— |
|
Jun-19 |
|
803,000 |
|
— |
|
Open |
| |||
|
|
|
$ |
1,508,000 |
|
1.52 |
% |
$ |
— |
|
|
|
$ |
1,508,000 |
|
|
|
|
|
|
|
|
|
|
|
|
|
|
|
|
|
|
|
|
|
| |||
|
Total Floating Rate Debt/Wtd Avg |
|
$ |
2,364,421 |
|
1.72 |
% |
$ |
— |
|
|
|
$ |
2,363,738 |
|
|
|
|
|
|
|
|
|
|
|
|
|
|
|
|
|
|
|
|
|
| |||
|
Total Debt/Wtd Avg - Consolidated |
|
$ |
8,205,984 |
|
3.82 |
% |
$ |
30,548 |
|
|
|
$ |
7,777,200 |
|
|
|
|
|
|
|
|
|
|
|
|
|
|
|
|
|
|
|
|
|
| |||
|
Total Debt/Wtd Avg - Joint Venture |
|
$ |
1,695,339 |
|
4.38 |
% |
|
|
|
|
|
|
|
|
|
| ||
|
|
|
|
|
|
|
|
|
|
|
|
|
|
|
|
| |||
|
Total Debt including SLG’s share of JV Debt/Wtd Avg |
|
$ |
9,901,323 |
|
3.92 |
% |
|
|
|
|
|
|
|
|
|
| ||
|
|
|
|
|
|
|
|
|
|
|
|
|
|
|
|
| |||
|
Weighted Average Balance & Interest Rate for the quarter, including SLG’s share of JV Debt |
|
$ |
9,897,993 |
|
3.91 |
% |
|
|
|
|
|
|
|
|
|
| ||
(1) Excludes the mortgage related to 120 West 45th Street, which was held for sale as of June 30, 2015.
(2) Coupon for floating rate debt determined using the effective LIBOR rate at the end of the quarter. Coupon for loans that are subject to LIBOR floors were determined using the LIBOR floors.
(3) The interest rate swaps mature in December 2017.
(4) The interest rate swap matures in June 2016.
(5) Notes can be put to the Company, at the option of the holder, on March 30, 2017.
|
Supplemental Information |
Second Quarter 2015 |
|
|
|
|
DEBT SUMMARY SCHEDULE - Unconsolidated Joint Ventures
Unaudited (Dollars in Thousands) |
|

|
|
|
Principal Outstanding |
|
|
|
2015 |
|
|
|
|
|
As-Of |
|
|
| ||||||
|
|
|
6/30/2015 |
|
|
|
Principal |
|
Maturity |
|
Due at |
|
Right |
|
Earliest |
| ||||||
|
|
|
Gross Principal |
|
SLG Share |
|
Coupon (1) |
|
Amortization |
|
Date |
|
Maturity |
|
Extension |
|
Prepayment |
| ||||
|
Fixed rate debt |
|
|
|
|
|
|
|
|
|
|
|
|
|
|
|
|
| ||||
|
7 Renaissance |
|
$ |
2,600 |
|
$ |
1,300 |
|
10.00 |
% |
$ |
— |
|
Dec-15 |
|
$ |
1,300 |
|
— |
|
Open |
|
|
11 West 34th Street (swapped) |
|
16,749 |
|
5,025 |
|
4.82 |
% |
95 |
|
Jan-16 |
|
4,977 |
|
— |
|
Open |
| ||||
|
280 Park Avenue |
|
696,563 |
|
348,282 |
|
6.57 |
% |
3,604 |
|
Jun-16 |
|
344,899 |
|
— |
|
Open |
| ||||
|
1745 Broadway |
|
340,000 |
|
193,358 |
|
5.68 |
% |
— |
|
Jan-17 |
|
193,358 |
|
— |
|
Open |
| ||||
|
Jericho Plaza |
|
163,750 |
(2) |
33,176 |
|
5.65 |
% |
— |
|
May-17 |
|
33,176 |
|
— |
|
Open |
| ||||
|
800 Third Avenue (swapped) |
|
20,910 |
|
12,655 |
|
6.00 |
% |
— |
|
Aug-17 |
|
12,655 |
|
— |
|
Open |
| ||||
|
315 West 36th Street (swapped) |
|
25,000 |
|
8,875 |
|
3.16 |
% |
— |
|
Dec-17 |
|
8,670 |
|
— |
|
Open |
| ||||
|
521 Fifth Avenue (swapped) |
|
170,000 |
|
85,850 |
|
3.73 |
% |
— |
|
Nov-19 |
|
85,850 |
|
— |
|
Open |
| ||||
|
717 Fifth Avenue (mortgage) |
|
300,000 |
|
32,748 |
|
4.45 |
% |
— |
|
Jul-22 |
|
32,748 |
|
— |
|
Aug-15 |
| ||||
|
21 East 66th Street |
|
12,000 |
|
3,874 |
|
3.60 |
% |
— |
|
Apr-23 |
|
3,874 |
|
— |
|
Open |
| ||||
|
717 Fifth Avenue (mezzanine) |
|
319,900 |
|
34,920 |
|
9.00 |
% |
— |
|
Jul-24 |
|
50,965 |
|
— |
|
Open |
| ||||
|
3 Columbus Circle |
|
350,000 |
|
171,150 |
|
3.61 |
% |
— |
|
Mar-25 |
|
171,150 |
|
— |
|
Open |
| ||||
|
Stonehenge Portfolio |
|
434,492 |
(3) |
25,719 |
|
4.18 |
% |
285 |
|
Various |
(3) |
23,182 |
|
— |
|
Open |
| ||||
|
Total Fixed Rate Debt/Wtd Avg |
|
$ |
2,851,964 |
|
$ |
956,932 |
|
5.47 |
%(4) |
$ |
3,984 |
|
|
|
$ |
966,804 |
|
|
|
|
|
|
|
|
|
|
|
|
|
|
|
|
|
|
|
|
|
|
|
| ||||
|
Floating rate debt |
|
|
|
|
|
|
|
|
|
|
|
|
|
|
|
|
| ||||
|
Meadows (LIBOR + 575 bps) |
|
$ |
67,350 |
|
$ |
33,675 |
|
7.75 |
% |
$ |
— |
|
Sep-15 |
|
$ |
33,675 |
|
— |
|
Open |
|
|
1552 Broadway (LIBOR + 408 bps) |
|
188,410 |
|
94,205 |
|
4.26 |
% |
— |
|
Apr-16 |
|
94,205 |
|
— |
|
Open |
| ||||
|
Mezzanine Debt (LIBOR + 90 bps) |
|
30,000 |
|
15,000 |
|
1.08 |
% |
— |
|
Jun-16 |
|
15,000 |
|
— |
|
Open |
| ||||
|
650 Fifth Avenue (LIBOR + 350 bps) |
|
65,000 |
|
32,500 |
|
3.69 |
% |
— |
|
Oct-16 |
|
32,500 |
|
— |
|
Open |
| ||||
|
175-225 3rd Street (Prime + 100 bps) |
|
40,000 |
|
38,000 |
|
4.25 |
% |
— |
|
Dec-16 |
|
38,000 |
|
— |
|
Open |
| ||||
|
10 East 53rd Street (LIBOR + 250 bps) |
|
125,000 |
|
68,750 |
|
2.69 |
% |
— |
|
Feb-17 |
|
68,750 |
|
— |
|
Open |
| ||||
|
724 Fifth Avenue (LIBOR + 242 bps) |
|
275,000 |
|
137,500 |
|
2.60 |
% |
— |
|
Apr-17 |
|
137,500 |
|
— |
|
Open |
| ||||
|
33 Beekman (LIBOR + 275 bps) |
|
65,506 |
|
30,067 |
|
2.93 |
% |
28 |
|
Aug-17 |
|
29,890 |
|
— |
|
Open |
| ||||
|
600 Lexington Avenue (LIBOR + 200 bps) |
|
114,774 |
|
63,126 |
|
2.28 |
% |
2,137 |
|
Oct-17 |
|
58,493 |
|
— |
|
Open |
| ||||
|
55 West 46th Street (LIBOR + 230 bps) |
|
150,000 |
|
37,500 |
|
2.49 |
% |
— |
|
Oct-17 |
|
37,500 |
|
— |
|
Open |
| ||||
|
Stonehenge Portfolio (Prime) |
|
10,500 |
|
350 |
|
3.25 |
% |
— |
|
Dec-17 |
|
338 |
|
— |
|
Open |
| ||||
|
121 Greene Street (LIBOR + 150 bps) |
|
15,000 |
|
7,500 |
|
1.69 |
% |
— |
|
Nov-19 |
|
7,500 |
|
— |
|
Open |
| ||||
|
100 Park Avenue (LIBOR + 175 bps) |
|
360,000 |
|
179,640 |
|
1.94 |
% |
— |
|
Feb-21 |
|
175,859 |
|
— |
|
Feb-16 |
| ||||
|
21 East 66th Street (T 12 mos + 275 bps) |
|
1,844 |
|
595 |
|
2.88 |
% |
25 |
|
Jun-33 |
|
4 |
|
— |
|
Open |
| ||||
|
Total Floating Rate Debt/Wtd Avg |
|
$ |
1,508,384 |
|
$ |
738,408 |
|
2.97 |
%(4) |
$ |
2,190 |
|
|
|
$ |
729,214 |
|
|
|
|
|
|
|
|
|
|
|
|
|
|
|
|
|
|
|
|
|
|
|
| ||||
|
Total Joint Venture Debt/Wtd Avg |
|
$ |
4,360,348 |
|
$ |
1,695,340 |
|
4.38 |
%(4) |
$ |
6,174 |
|
|
|
$ |
1,696,018 |
|
|
|
|
|
(1) Coupon for floating rate debt determined using the effective LIBOR rate at the end of the quarter. Coupon for loans that are subject to LIBOR floors were determined using the LIBOR floors.
(2) This loan was in default as of June 30, 2015 due to the non-payment of debt service.
(3) Amount is comprised of $13.5 million, $56.0 million, $35.0 million, $7.4 million, $142.7 million, and $179.9 million in fixed-rate mortgages that mature in July 2016, June 2017, November 2017, February 2018, August 2019, and June 2024, respectively.
(4) The weighted average coupon rates are calculated based on SL Green’s share in the outstanding debt.
Covenants
|
SL GREEN REALTY CORP. |
| ||||
|
Revolving Credit Facility Covenants |
| ||||
|
|
|
Actual |
|
Required |
|
|
Total Debt / Total Assets |
|
46.7 |
x |
Less than 60% |
|
|
Fixed Charge Coverage |
|
2.29 |
x |
Greater than 1.5x |
|
|
Unsecured Notes Covenants |
| ||||
|
|
|
Actual |
|
Required |
|
|
Total Debt / Total Assets |
|
38.4 |
% |
Less than 60% |
|
|
Secured Debt / Total Assets |
|
19.6 |
% |
Less than 40% |
|
|
Debt Service Coverage |
|
3.32 |
x |
Greater than 1.5x |
|
|
Unencumbered Assets / Unsecured Debt |
|
442.4 |
% |
Greater than 150% |
|
|
Composition of Debt |
| |||||
|
Fixed Rate Debt |
|
|
|
|
| |
|
Consolidated |
|
$ |
5,841,563 |
|
|
|
|
SLG Share of JV |
|
956,932 |
|
|
| |
|
Total Fixed Rate Debt |
|
$ |
6,798,495 |
|
68.7% |
|
|
|
|
|
|
|
| |
|
Floating Rate Debt |
|
|
|
|
| |
|
Consolidated |
|
$ |
2,364,421 |
|
|
|
|
SLG Share of JV |
|
738,408 |
|
|
| |
|
|
|
3,102,829 |
|
|
| |
|
Debt & Preferred Equity and Other Investments |
|
(1,004,539 |
) |
|
| |
|
Total Floating Rate Debt |
|
$ |
2,098,290 |
|
21.2% |
|
|
|
|
|
|
|
|
|
|
Total Debt |
|
$ |
9,901,324 |
|
|
|
|
Supplemental Information |
Second Quarter 2015 |
|
|
|
|
DEBT SUMMARY SCHEDULE – Reckson Operating Partnership
Unaudited (Dollars in Thousands) |
|

|
|
|
Principal |
|
|
|
2015 |
|
|
|
|
|
As-Of |
|
|
| |||
|
|
|
Outstanding |
|
|
|
Principal |
|
Maturity |
|
Due at |
|
Right |
|
Earliest |
| |||
|
|
|
6/30/2015 |
|
Coupon (1) |
|
Amortization |
|
Date |
|
Maturity |
|
Extension |
|
Prepayment |
| |||
|
Fixed rate debt |
|
|
|
|
|
|
|
|
|
|
|
|
|
|
| |||
|
|
|
|
|
|
|
|
|
|
|
|
|
|
|
|
| |||
|
Secured fixed rate debt |
|
|
|
|
|
|
|
|
|
|
|
|
|
|
| |||
|
919 Third Avenue |
|
$ |
500,000 |
|
5.12 |
% |
$ |
— |
|
Jun-23 |
|
$ |
441,594 |
|
— |
|
Open |
|
|
|
|
$ |
500,000 |
|
5.12 |
% |
$ |
— |
|
|
|
$ |
441,594 |
|
|
|
|
|
|
|
|
|
|
|
|
|
|
|
|
|
|
|
|
|
| |||
|
Unsecured fixed rate debt |
|
|
|
|
|
|
|
|
|
|
|
|
|
|
| |||
|
Unsecured notes |
|
$ |
255,272 |
|
6.00 |
% |
$ |
— |
|
Mar-16 |
|
$ |
255,308 |
|
— |
|
Open |
|
|
Unsecured notes |
|
249,777 |
|
5.00 |
% |
— |
|
Aug-18 |
|
250,000 |
|
— |
|
Open |
| |||
|
Term loan (swapped) |
|
30,000 |
|
3.70 |
% |
— |
|
Jun-19 |
(2) |
30,000 |
|
— |
|
Open |
| |||
|
Unsecured notes |
|
250,000 |
|
7.75 |
% |
— |
|
Mar-20 |
|
250,000 |
|
— |
|
Open |
| |||
|
Unsecured notes |
|
200,000 |
|
4.50 |
% |
— |
|
Dec-22 |
|
200,000 |
|
— |
|
Open |
| |||
|
|
|
$ |
985,049 |
|
5.82 |
% |
$ |
— |
|
|
|
$ |
985,308 |
|
|
|
|
|
|
|
|
|
|
|
|
|
|
|
|
|
|
|
|
|
| |||
|
Total Fixed Rate Debt/Wtd Avg |
|
$ |
1,485,049 |
|
5.58 |
% |
$ |
— |
|
|
|
$ |
1,426,902 |
|
|
|
|
|
|
|
|
|
|
|
|
|
|
|
|
|
|
|
|
|
| |||
|
Floating rate debt |
|
|
|
|
|
|
|
|
|
|
|
|
|
|
| |||
|
|
|
|
|
|
|
|
|
|
|
|
|
|
|
|
| |||
|
Unsecured floating rate debt |
|
|
|
|
|
|
|
|
|
|
|
|
|
|
| |||
|
Revolving credit facility (LIBOR + 125 bps) |
|
$ |
705,000 |
|
1.44 |
% |
$ |
— |
|
Mar-19 |
|
$ |
705,000 |
|
Mar-20 |
|
Open |
|
|
Term loan (LIBOR + 140 bps) |
|
803,000 |
|
1.59 |
% |
— |
|
Jun-19 |
|
803,000 |
|
— |
|
Open |
| |||
|
Total Floating Rate Debt/Wtd Avg |
|
$ |
1,508,000 |
|
1.52 |
% |
$ |
— |
|
|
|
$ |
1,508,000 |
|
|
|
|
|
|
|
|
|
|
|
|
|
|
|
|
|
|
|
|
|
| |||
|
Total Debt/Wtd Avg - Consolidated |
|
$ |
2,993,049 |
|
3.53 |
% |
$ |
— |
|
|
|
$ |
2,934,902 |
|
|
|
|
|
(1) Coupon for floating rate debt determined using the effective LIBOR rate at the end of the quarter. Coupon for loans that are subject to LIBOR floors were determined using the LIBOR floors.
(2) The interest rate swap matures in June 2016.
Covenants
|
RECKSON OPERATING PARTNERSHIP, L.P. |
| ||||
|
Revolving Credit Facility Covenants |
| ||||
|
|
|
Actual |
|
Required |
|
|
Total Debt / Total Assets |
|
47.1 |
% |
Less than 60% |
|
|
Fixed Charge Coverage |
|
3.06 |
x |
Greater than 1.5x |
|
|
Secured Debt / Total Assets |
|
6.9 |
% |
Less than 40% |
|
|
Unsecured Debt / Unencumbered Assets |
|
50.7 |
% |
Less than 60% |
|
|
Supplemental Information |
Second Quarter 2015 |
|
|
|
|
SUMMARY OF GROUND LEASE ARRANGEMENTS
(Dollars in Thousands) |
|

|
|
|
|
|
|
|
|
|
|
|
Deferred |
|
|
| |||||
|
|
|
2015 Scheduled |
|
2016 Scheduled |
|
2017 Scheduled |
|
2018 Scheduled |
|
Land Lease |
|
Year of |
| |||||
|
Property |
|
Cash Payment |
|
Cash Payment |
|
Cash Payment |
|
Cash Payment |
|
Obligations(1) |
|
Maturity |
| |||||
|
|
|
|
|
|
|
|
|
|
|
|
|
|
| |||||
|
Consolidated Ground Lease Arrangements |
| |||||||||||||||||
|
|
|
|
|
|
|
|
|
|
|
|
|
|
| |||||
|
Operating Leases |
|
|
|
|
|
|
|
|
|
|
|
|
| |||||
|
625 Madison Avenue |
|
$ |
4,613 |
|
$ |
4,613 |
|
$ |
4,613 |
|
$ |
4,613 |
|
$ |
— |
|
2022 |
(2) |
|
461 Fifth Avenue |
|
2,100 |
|
2,100 |
|
2,100 |
|
2,100 |
|
474 |
|
2027 |
(3) | |||||
|
711 Third Avenue |
|
5,250 |
|
5,354 |
|
5,500 |
|
5,500 |
|
913 |
|
2033 |
(4) | |||||
|
1185 Avenue of the Americas |
|
6,909 |
|
6,909 |
|
6,909 |
|
6,909 |
|
— |
|
2043 |
| |||||
|
420 Lexington Avenue |
|
10,899 |
|
10,899 |
|
10,899 |
|
10,899 |
|
— |
|
2050 |
(5) | |||||
|
1055 Washington Blvd, Stamford |
|
615 |
|
615 |
|
615 |
|
615 |
|
— |
|
2090 |
| |||||
|
1080 Amsterdam Avenue |
|
105 |
|
122 |
|
209 |
|
209 |
|
— |
|
2111 |
| |||||
|
|
|
|
|
|
|
|
|
|
|
|
|
|
| |||||
|
Total |
|
$ |
30,491 |
|
$ |
30,612 |
|
$ |
30,845 |
|
$ |
30,845 |
|
$ |
1,387 |
|
|
|
|
|
|
|
|
|
|
|
|
|
|
|
|
|
| |||||
|
Capitalized Lease |
|
|
|
|
|
|
|
|
|
|
|
|
| |||||
|
1080 Amsterdam Avenue |
|
$ |
145 |
|
$ |
170 |
|
$ |
291 |
|
$ |
291 |
|
$ |
21,013 |
|
2111 |
|
|
|
|
|
|
|
|
|
|
|
|
|
|
|
| |||||
|
Unconsolidated Joint Venture Ground Lease Arrangement (SLG Share) |
| |||||||||||||||||
|
|
|
|
|
|
|
|
|
|
|
|
|
|
| |||||
|
Operating Lease |
|
|
|
|
|
|
|
|
|
|
|
|
| |||||
|
650 Fifth Avenue |
|
$ |
1,167 |
|
$ |
1,167 |
|
$ |
1,167 |
|
$ |
1,183 |
|
$ |
— |
|
2062 |
|
|
|
|
|
|
|
|
|
|
|
|
|
|
|
| |||||
|
Capitalized Lease |
|
|
|
|
|
|
|
|
|
|
|
|
| |||||
|
650 Fifth Avenue |
|
$ |
6,086 |
|
$ |
6,086 |
|
$ |
6,086 |
|
$ |
6,169 |
|
$ |
90,922 |
|
2062 |
|
(1) Per the balance sheet at June 30, 2015.
(2) Subject to renewal at the Company’s option through 2054.
(3) The Company has an option to purchase the ground lease for a fixed price on a specific date.
(4) Reflects 50% of the annual ground rent payment as the Company owns 50% of the fee interest.
(5) Subject to two 15-year renewals at the Company’s option through 2080.
|
Supplemental Information |
Second Quarter 2015 |
|
|
|
|
DEBT AND PREFERRED EQUITY INVESTMENTS
(Dollars in Thousands) |
|

|
|
|
|
|
Weighted Average Book |
|
Weighted Average |
|
Current |
| ||
|
|
|
Book Value(1) |
|
Value During Quarter |
|
Yield During Quarter |
|
Yield(2) |
| ||
|
|
|
|
|
|
|
|
|
|
| ||
|
6/30/2014 |
|
$ |
1,547,808 |
|
$ |
1,416,582 |
|
10.63 |
% |
10.47 |
% |
|
|
|
|
|
|
|
|
|
|
| ||
|
Debt originations/accretion(3) |
|
169,424 |
|
|
|
|
|
|
| ||
|
Preferred Equity originations/accretion |
|
3,324 |
|
|
|
|
|
|
| ||
|
Redemptions/Sales/Syndications/Amortization |
|
(287,605 |
) |
|
|
|
|
|
| ||
|
9/30/2014 |
|
$ |
1,432,951 |
|
$ |
1,456,997 |
|
10.53 |
% |
10.48 |
% |
|
|
|
|
|
|
|
|
|
|
| ||
|
Debt originations/accretion(3) |
|
199,997 |
|
|
|
|
|
|
| ||
|
Preferred Equity originations/accretion |
|
4,256 |
|
|
|
|
|
|
| ||
|
Redemptions/Sales/Syndications/Amortization |
|
(228,400 |
) |
|
|
|
|
|
| ||
|
12/31/2014 |
|
$ |
1,408,804 |
|
$ |
1,395,624 |
|
10.51 |
% |
10.38 |
% |
|
|
|
|
|
|
|
|
|
|
| ||
|
Debt originations/accretion(3) |
|
134,429 |
|
|
|
|
|
|
| ||
|
Preferred Equity originations/accretion |
|
34,002 |
|
|
|
|
|
|
| ||
|
Redemptions/Sales/Syndications/Amortization |
|
(28,496 |
) |
|
|
|
|
|
| ||
|
3/31/2015 |
|
$ |
1,548,739 |
|
$ |
1,503,047 |
|
10.37 |
% |
10.26 |
% |
|
|
|
|
|
|
|
|
|
|
| ||
|
Debt originations/accretion(3) |
|
215,869 |
|
|
|
|
|
|
| ||
|
Preferred Equity originations/accretion |
|
3,456 |
|
|
|
|
|
|
| ||
|
Redemptions/Sales/Syndications/Amortization |
|
(82,830 |
) |
|
|
|
|
|
| ||
|
6/30/2015 |
|
$ |
1,685,234 |
|
$ |
1,694,194 |
|
10.18 |
% |
10.15 |
% |
(1) Net of unamortized fees, discounts, and premiums.
(2) Calculated based on interest, fees and amortized discount recognized in the last month of the quarter.
(3) Accretion includes original issue discounts and/or compounding investment income.
|
Supplemental Information |
Second Quarter 2015 |
|
|
|
|
DEBT AND PREFERRED EQUITY INVESTMENTS
(Dollars in Thousands, Except Per Square Foot Amounts)
|
|

|
|
|
|
|
|
|
Weighted Average |
|
Weighted Average |
|
Current |
| |||
|
Type of Investment |
|
Book Value(1)(2) |
|
Senior Financing |
|
Exposure PSF |
|
Yield During Quarter |
|
Yield(3) |
| |||
|
|
|
|
|
|
|
|
|
|
|
|
| |||
|
New York City |
|
|
|
|
|
|
|
|
|
|
| |||
|
|
|
|
|
|
|
|
|
|
|
|
| |||
|
Senior Mortgage Debt |
|
$ |
292,816 |
|
$ |
— |
|
$ |
405 |
|
6.78 |
% |
6.71 |
% |
|
|
|
|
|
|
|
|
|
|
|
|
| |||
|
Junior Mortgage Participation |
|
189,053 |
|
1,656,497 |
|
$ |
2,024 |
|
9.23 |
% |
9.22 |
% | ||
|
|
|
|
|
|
|
|
|
|
|
|
| |||
|
Mezzanine Debt |
|
1,034,426 |
|
3,925,538 |
|
$ |
1,084 |
|
11.29 |
% |
11.30 |
% | ||
|
|
|
|
|
|
|
|
|
|
|
|
| |||
|
Preferred Equity |
|
168,939 |
|
680,795 |
|
$ |
321 |
|
10.24 |
% |
10.18 |
% | ||
|
|
|
|
|
|
|
|
|
|
|
|
| |||
|
Balance as of 6/30/15 |
|
$ |
1,685,234 |
|
$ |
6,262,830 |
|
$ |
975 |
|
10.18 |
% |
10.15 |
% |
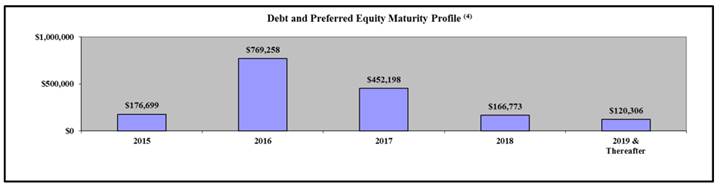
(1) Net of unamortized fees, discounts, and premiums.
(2) Approximately 57.3% of our investments are indexed to LIBOR.
(3) Calculated based on interest, fees and amortized discount recognized in the last month of the quarter.
(4) The weighted average maturity of the outstanding balance is 1.71 years. Approximately 58.3% of our portfolio of investments have extension options, some of which may be subject to certain conditions for extension.
|
Supplemental Information |
Second Quarter 2015 |
|
|
|
|
10 LARGEST DEBT AND PREFERRED EQUITY INVESTMENTS
(Dollars in Thousands, Except Per Square Foot Amounts)
|
|

|
|
|
Book Value(1) |
|
Property |
|
|
|
Senior |
|
|
|
Current |
| |||
|
Investment Type |
|
6/30/15 |
|
Type |
|
Location |
|
Financing |
|
Last $ PSF |
|
Yield(2) |
| |||
|
|
|
|
|
|
|
|
|
|
|
|
|
|
| |||
|
Preferred Equity |
|
$ |
126,817 |
|
Office |
|
New York City |
|
$ |
550,000 |
|
$ |
293 |
|
10.98 |
% |
|
|
|
|
|
|
|
|
|
|
|
|
|
|
| |||
|
Mortgage and Mezzanine |
|
117,999 |
|
Residential Land |
|
New York City |
|
— |
|
$ |
216 |
|
10.26 |
% | ||
|
|
|
|
|
|
|
|
|
|
|
|
|
|
| |||
|
Mortgage and Mezzanine |
|
109,910 |
|
Retail Land |
|
New York City |
|
— |
|
$ |
374 |
|
6.16 |
% | ||
|
|
|
|
|
|
|
|
|
|
|
|
|
|
| |||
|
Jr. Mortgage Participation and Mezzanine |
|
102,646 |
|
Office |
|
New York City |
|
1,109,000 |
|
$ |
1,175 |
|
9.59 |
% | ||
|
|
|
|
|
|
|
|
|
|
|
|
|
|
| |||
|
Mezzanine Loan |
|
99,269 |
|
Residential |
|
New York City |
|
360,000 |
|
$ |
843 |
|
8.11 |
% | ||
|
|
|
|
|
|
|
|
|
|
|
|
|
|
| |||
|
Mortgage and Mezzanine |
|
77,447 |
|
Residential |
|
New York City |
|
— |
|
$ |
528 |
|
11.55 |
% | ||
|
|
|
|
|
|
|
|
|
|
|
|
|
|
| |||
|
Mezzanine Loan |
|
74,014 |
|
Office |
|
New York City |
|
775,000 |
|
$ |
1,082 |
|
18.80 |
% | ||
|
|
|
|
|
|
|
|
|
|
|
|
|
|
| |||
|
Mezzanine Loan |
|
71,962 |
|
Office/Retail |
|
New York City |
|
165,000 |
|
$ |
1,987 |
|
9.86 |
% | ||
|
|
|
|
|
|
|
|
|
|
|
|
|
|
| |||
|
Jr. Mortgage Participation and Mezzanine |
|
71,909 |
|
Office/Retail |
|
New York City |
|
205,000 |
|
$ |
399 |
|
11.21 |
% | ||
|
|
|
|
|
|
|
|
|
|
|
|
|
|
| |||
|
Mezzanine Loan |
|
65,969 |
|
N/A(3) |
|
N/A(3) |
|
— |
|
$ |
— |
|
10.88 |
% | ||
|
|
|
|
|
|
|
|
|
|
|
|
|
|
| |||
|
Total |
|
$ |
917,942 |
|
|
|
|
|
$ |
3,164,000 |
|
|
|
10.45 |
% | |
(1) Net of unamortized fees, discounts, and premiums.
(2) Calculated based on interest, fees and amortized discounts recognized in the last month of the quarter.
(3) The loan is collateralized by defeasance securities.
|
Supplemental Information |
Second Quarter 2015 |
|
|
|
|
|
|
|
SELECTED PROPERTY DATA
Manhattan Operating Properties
|
|

|
|
|
Ownership |
|
|
|
|
|
# of |
|
Useable |
|
% of Total |
|
Occupancy (%) |
|
Annualized |
|
Annualized Cash Rent |
|
Total |
| |||||||||||
|
Properties |
|
Interest (%) |
|
SubMarket |
|
Ownership |
|
Bldgs |
|
Sq. Feet |
|
Sq. Feet |
|
Jun-15 |
|
Mar-15 |
|
Dec-14 |
|
Sep-14 |
|
Jun-14 |
|
Cash Rent ($’s) |
|
100% |
|
SLG% |
|
Tenants |
| |
|
CONSOLIDATED PROPERTIES |
|
|
|
|
|
|
|
|
|
|
|
|
|
|
|
|
|
|
|
|
|
|
|
|
|
|
|
|
|
|
| |
|
“Same Store” |
|
|
|
|
|
|
|
|
|
|
|
|
|
|
|
|
|
|
|
|
|
|
|
|
|
|
|
|
|
|
| |
|
100 Church Street |
|
100.0 |
|
Downtown |
|
Fee Interest |
|
1 |
|
1,047,500 |
|
4 |
|
99.0 |
|
99.0 |
|
98.7 |
|
98.7 |
|
98.7 |
|
$ |
38,581,923 |
|
3.6 |
|
3.0 |
|
18 |
|
|
110 East 42nd Street |
|
100.0 |
|
Grand Central |
|
Fee Interest |
|
1 |
|
215,400 |
|
1 |
|
99.9 |
|
99.4 |
|
98.8 |
|
88.7 |
|
83.2 |
|
10,640,214 |
|
1.0 |
|
0.8 |
|
23 |
| |
|
120 West 45th Street |
|
100.0 |
|
Midtown |
|
Fee Interest |
|
1 |
|
440,000 |
|
2 |
|
96.2 |
|
96.5 |
|
95.6 |
|
94.5 |
|
93.3 |
|
25,319,467 |
|
2.3 |
|
2.0 |
|
44 |
| |
|
125 Park Avenue |
|
100.0 |
|
Grand Central |
|
Fee Interest |
|
1 |
|
604,245 |
|
2 |
|
87.1 |
|
88.7 |
|
80.4 |
|
81.9 |
|
70.8 |
|
31,551,723 |
|
2.9 |
|
2.5 |
|
22 |
| |
|
220 East 42nd Street |
|
100.0 |
|
Grand Central |
|
Fee Interest |
|
1 |
|
1,135,000 |
|
4 |
|
91.6 |
|
92.4 |
|
92.2 |
|
92.0 |
|
91.5 |
|
48,351,093 |
|
4.5 |
|
3.8 |
|
32 |
| |
|
304 Park Avenue South |
|
100.0 |
|
Midtown South |
|
Fee Interest |
|
1 |
|
215,000 |
|
1 |
|
90.3 |
|
91.9 |
|
91.9 |
|
90.5 |
|
90.5 |
|
12,160,832 |
|
1.1 |
|
1.0 |
|
13 |
| |
|
420 Lexington Ave (Graybar) |
|
100.0 |
|
Grand Central North |
|
Leasehold Interest |
|
1 |
|
1,188,000 |
|
4 |
|
99.3 |
|
97.1 |
|
96.5 |
|
96.7 |
|
95.0 |
|
74,937,232 |
|
6.9 |
|
5.9 |
|
213 |
| |
|
461 Fifth Avenue (1) |
|
100.0 |
|
Midtown |
|
Leasehold Interest |
|
1 |
|
200,000 |
|
1 |
|
96.8 |
|
95.5 |
|
96.5 |
|
96.5 |
|
96.5 |
|
17,875,864 |
|
1.7 |
|
1.4 |
|
12 |
| |
|
485 Lexington Avenue |
|
100.0 |
|
Grand Central North |
|
Fee Interest |
|
1 |
|
921,000 |
|
3 |
|
100.0 |
|
100.0 |
|
100.0 |
|
100.0 |
|
100.0 |
|
57,605,189 |
|
5.3 |
|
4.6 |
|
24 |
| |
|
555 West 57th Street |
|
100.0 |
|
Midtown West |
|
Fee Interest |
|
1 |
|
941,000 |
|
3 |
|
99.9 |
|
99.9 |
|
99.9 |
|
99.9 |
|
99.9 |
|
38,672,481 |
|
3.6 |
|
3.1 |
|
10 |
| |
|
609 Fifth Avenue |
|
100.0 |
|
Rockefeller Center |
|
Fee Interest |
|
1 |
|
160,000 |
|
1 |
|
81.3 |
|
81.3 |
|
81.3 |
|
81.3 |
|
79.0 |
|
14,427,758 |
|
1.3 |
|
1.1 |
|
13 |
| |
|
625 Madison Avenue |
|
100.0 |
|
Plaza District |
|
Leasehold Interest |
|
1 |
|
563,000 |
|
2 |
|
97.1 |
|
96.6 |
|
92.1 |
|
92.1 |
|
92.1 |
|
55,369,028 |
|
5.1 |
|
4.4 |
|
22 |
| |
|
641 Sixth Avenue |
|
100.0 |
|
Midtown South |
|
Fee Interest |
|
1 |
|
163,000 |
|
1 |
|
100.0 |
|
92.1 |
|
92.1 |
|
92.1 |
|
92.1 |
|
10,375,689 |
|
1.0 |
|
0.8 |
|
8 |
| |
|
711 Third Avenue (2) |
|
100.0 |
|
Grand Central North |
|
Leasehold Interest |
|
1 |
|
524,000 |
|
2 |
|
83.5 |
|
84.1 |
|
80.6 |
|
80.6 |
|
80.6 |
|
25,738,744 |
|
2.4 |
|
2.0 |
|
17 |
| |
|
750 Third Avenue |
|
100.0 |
|
Grand Central North |
|
Fee Interest |
|
1 |
|
780,000 |
|
3 |
|
97.3 |
|
97.3 |
|
96.7 |
|
96.7 |
|
96.4 |
|
44,530,764 |
|
4.1 |
|
3.5 |
|
31 |
| |
|
810 Seventh Avenue |
|
100.0 |
|
Times Square |
|
Fee Interest |
|
1 |
|
692,000 |
|
2 |
|
84.8 |
|
85.6 |
|
81.0 |
|
83.4 |
|
84.2 |
|
38,278,130 |
|
3.5 |
|
3.0 |
|
47 |
| |
|
919 Third Avenue |
|
51.0 |
|
Grand Central North |
|
Fee Interest |
|
1 |
|
1,454,000 |
|
5 |
|
100.0 |
|
90.3 |
|
90.3 |
|
90.3 |
|
90.3 |
|
92,598,797 |
|
|
|
3.7 |
|
11 |
| |
|
1185 Avenue of the Americas |
|
100.0 |
|
Rockefeller Center |
|
Leasehold Interest |
|
1 |
|
1,062,000 |
|
4 |
|
99.9 |
|
99.9 |
|
99.9 |
|
99.9 |
|
99.9 |
|
88,537,145 |
|
8.2 |
|
7.0 |
|
19 |
| |
|
1350 Avenue of the Americas |
|
100.0 |
|
Rockefeller Center |
|
Fee Interest |
|
1 |
|
562,000 |
|
2 |
|
98.5 |
|
96.9 |
|
96.9 |
|
99.9 |
|
95.7 |
|
40,352,965 |
|
3.7 |
|
3.2 |
|
35 |
| |
|
1515 Broadway |
|
100.0 |
|
Times Square |
|
Fee Interest |
|
1 |
|
1,750,000 |
|
6 |
|
100.0 |
|
99.7 |
|
99.6 |
|
100.0 |
|
100.0 |
|
119,603,197 |
|
11.1 |
|
9.5 |
|
13 |
| |
|
1 Madison Avenue |
|
100.0 |
|
Park Avenue South |
|
Fee Interest |
|
1 |
|
1,176,900 |
|
4 |
|
100.0 |
|
100.0 |
|
100.0 |
|
100.0 |
|
100.0 |
|
68,578,132 |
|
6.3 |
|
5.4 |
|
2 |
| |
|
Subtotal / Weighted Average |
|
|
|
21 |
|
15,794,045 |
|
57 |
% |
96.8 |
% |
95.7 |
% |
94.8 |
% |
94.9 |
% |
94.1 |
% |
$ |
954,086,367 |
|
79.7 |
% |
71.8 |
% |
629 |
| ||||
|
|
|
|
|
|
|
|
|
|
|
|
|
|
|
|
|
|
|
|
|
|
|
|
|
|
|
|
|
|
|
|
| |
|
“Non Same Store” |
|
|
|
|
|
|
|
|
|
|
|
|
|
|
|
|
|
|
|
|
|
|
|
|
|
|
|
|
|
|
| |
|
388 & 390 Greenwich Street |
|
100.0 |
|
Downtown |
|
Fee Interest |
|
2 |
|
2,635,000 |
|
9 |
|
100.0 |
|
100.0 |
|
100.0 |
|
100.0 |
|
100.0 |
|
$ |
112,498,602 |
|
10.4 |
|
8.9 |
|
1 |
|
|
635 Sixth Avenue |
|
100.0 |
|
Midtown South |
|
Fee Interest |
|
1 |
|
104,000 |
|
0 |
|
100.0 |
|
72.5 |
|
72.5 |
|
72.5 |
|
48.8 |
|
8,554,001 |
|
0.8 |
|
0.7 |
|
2 |
| |
|
|
|
|
|
|
|
|
|
|
|
|
|
|
|
|
|
|
|
|
|
|
|
|
|
|
|
|
|
|
|
|
| |
|
Subtotal / Weighted Average |
|
|
|
3 |
|
2,739,000 |
|
10 |
% |
100.0 |
% |
99.0 |
% |
99.0 |
% |
99.0 |
% |
98.1 |
% |
$ |
121,052,603 |
|
11.2 |
% |
9.6 |
% |
3 |
| ||||
|
|
|
|
|
|
|
|
|
|
|
|
|
|
|
|
|
|
|
|
|
|
|
|
|
|
|
|
|
|
|
|
| |
|
Total / Weighted Average Consolidated Properties |
|
|
|
24 |
|
18,533,045 |
|
67 |
% |
97.3 |
% |
96.2 |
% |
95.4 |
% |
95.5 |
% |
94.7 |
% |
$ |
1,075,138,970 |
|
90.9 |
% |
81.4 |
% |
632 |
| ||||
|
|
|
|
|
|
|
|
|
|
|
|
|
|
|
|
|
|
|
|
|
|
|
|
|
|
|
|
|
|
|
|
| |
|
UNCONSOLIDATED PROPERTIES |
|
|
|
|
|
|
|
|
|
|
|
|
|
|
|
|
|
|
|
|
|
|
|
|
|
|
|
|
|
|
| |
|
“Same Store” |
|
|
|
|
|
|
|
|
|
|
|
|
|
|
|
|
|
|
|
|
|
|
|
|
|
|
|
|
|
|
| |
|
3 Columbus Circle |
|
48.9 |
|
Columbus Circle |
|
Fee Interest |
|
1 |
|
530,981 |
|
2 |
|
83.4 |
|
80.2 |
|
79.5 |
|
79.5 |
|
73.8 |
|
$ |
36,345,452 |
|
|
|
1.4 |
|
30 |
|
|
100 Park Avenue |
|
50.0 |
|
Grand Central South |
|
Fee Interest |
|
1 |
|
834,000 |
|
3 |
|
96.6 |
|
96.3 |
|
96.0 |
|
96.0 |
|
96.5 |
|
58,908,200 |
|
|
|
2.3 |
|
40 |
| |
|
315 West 36th Street |
|
35.5 |
|
Times Square South |
|
Fee Interest |
|
1 |
|
147,619 |
|
1 |
|
100.0 |
|
88.4 |
|
99.2 |
|
99.2 |
|
99.2 |
|
6,789,468 |
|
|
|
0.2 |
|
5 |
| |
|
521 Fifth Avenue |
|
50.5 |
|
Grand Central |
|
Fee Interest |
|
1 |
|
460,000 |
|
2 |
|
97.6 |
|
99.0 |
|
99.3 |
|
99.3 |
|
95.6 |
|
28,508,955 |
|
|
|
1.1 |
|
43 |
| |
|
600 Lexington Avenue |
|
55.0 |
|
East Side |
|
Fee Interest |
|
1 |
|
303,515 |
|
1 |
|
89.6 |
|
89.2 |
|
89.2 |
|
89.2 |
|
75.7 |
|
20,701,108 |
|
|
|
0.9 |
|
35 |
| |
|
800 Third Avenue |
|
60.5 |
|
Grand Central North |
|
Fee Interest |
|
1 |
|
526,000 |
|
2 |
|
98.4 |
|
97.5 |
|
94.8 |
|
94.8 |
|
93.5 |
|
32,596,884 |
|
|
|
1.6 |
|
44 |
| |
|
1745 Broadway |
|
56.88 |
|
Midtown |
|
Fee Interest |
|
1 |
|
674,000 |
|
2 |
|
100.0 |
|
100.0 |
|
100.0 |
|
100.0 |
|
100.0 |
|
42,805,380 |
|
|
|
1.9 |
|
1 |
| |
|
|
|
|
|
|
|
|
|
|
|
|
|
|
|
|
|
|
|
|
|
|
|
|
|
|
|
|
|
|
|
|
| |
|
Total / Weighted Average Unconsolidated Properties |
|
7 |
|
3,476,115 |
|
13 |
% |
95.2 |
% |
94.1 |
% |
94.0 |
% |
94.0 |
% |
91.4 |
% |
$ |
226,655,447 |
|
|
|
9.4 |
% |
198 |
| ||||||
|
|
|
|
|
|
|
|
|
|
|
|
|
|
|
|
|
|
|
|
|
|
|
|
|
|
|
|
|
|
|
|
| |
|
Manhattan Operating Properties Grand Total / Weighted Average |
|
31 |
|
22,009,160 |
|
79 |
% |
96.9 |
% |
95.9 |
% |
95.2 |
% |
95.3 |
% |
94.2 |
% |
$ |
1,301,794,416 |
|
|
|
|
|
830 |
| ||||||
|
Manhattan Operating Properties Grand Total - SLG share of Annualized Rent |
|
|
|
|
|
|
|
|
|
|
|
|
|
|
|
|
|
$ |
1,149,250,012 |
|
|
|
90.8 |
% |
|
| ||||||
|
Manhattan Operating Properties Same Store Occupancy % |
|
|
|
19,270,160 |
|
88 |
% |
96.5 |
%(3) |
95.4 |
% |
94.7 |
% |
94.8 |
% |
93.6 |
% |
|
|
|
|
|
|
|
| |||||||
(1) The Company has an option to acquire the fee interest for a fixed price on a specific date.
(2) The Company owns 50% of the fee interest.
(3) Manhattan same-store occupancy, inclusive of 103,385 square feet of leases signed but not yet commenced, is 97.0% as of June 30, 2015, as compared to 94.9% at June 30, 2014 and 95.9% at March 31, 2015.
|
Supplemental Information |
Second Quarter 2015 |
|
|
|
|
|
|
|
SELECTED PROPERTY DATA
Suburban Operating Properties |
|

|
|
|
Ownership |
|
|
|
|
|
# of |
|
Useable |
|
% of Total |
|
Occupancy (%) |
|
Annualized |
|
Annualized Cash Rent |
|
Total |
| |||||||||||
|
Properties |
|
Interest (%) |
|
SubMarket |
|
Ownership |
|
Bldgs |
|
Sq. Feet |
|
Sq. Feet |
|
Jun-15 |
|
Mar-15 |
|
Dec-14 |
|
Sep-14 |
|
Jun-14 |
|
Cash Rent ($’s) |
|
100% |
|
SLG% |
|
Tenants |
| |
|
CONSOLIDATED PROPERTIES |
|
|
|
|
|
|
|
|
|
|
|
|
|
|
|
|
|
|
|
|
|
|
|
|
|
|
|
|
|
|
| |
|
“Same Store” Westchester, New York |
|
|
|
|
|
|
|
|
|
|
|
|
|
|
|
|
|
|
|
|
|
|
|
|
|
|
|
|
|
|
| |
|
1100 King Street - 1 Int’l Drive |
|
100.0 |
|
Rye Brook, New York |
|
Fee Interest |
|
1 |
|
90,000 |
|
0 |
|
74.8 |
|
74.8 |
|
74.8 |
|
74.8 |
|
74.8 |
|
$ |
1,754,651 |
|
0.2 |
|
0.1 |
|
2 |
|
|
1100 King Street - 2 Int’l Drive |
|
100.0 |
|
Rye Brook, New York |
|
Fee Interest |
|
1 |
|
90,000 |
|
0 |
|
30.3 |
|
30.3 |
|
30.3 |
|
47.9 |
|
47.9 |
|
721,181 |
|
0.1 |
|
0.1 |
|
3 |
| |
|
1100 King Street - 3 Int’l Drive |
|
100.0 |
|
Rye Brook, New York |
|
Fee Interest |
|
1 |
|
90,000 |
|
0 |
|
21.7 |
|
21.7 |
|
21.7 |
|
21.7 |
|
57.2 |
|
728,586 |
|
0.1 |
|
0.1 |
|
2 |
| |
|
1100 King Street - 4 Int’l Drive |
|
100.0 |
|
Rye Brook, New York |
|
Fee Interest |
|
1 |
|
90,000 |
|
0 |
|
85.8 |
|
85.8 |
|
85.8 |
|
84.6 |
|
84.6 |
|
2,030,698 |
|
0.2 |
|
0.2 |
|
10 |
| |
|
1100 King Street - 5 Int’l Drive |
|
100.0 |
|
Rye Brook, New York |
|
Fee Interest |
|
1 |
|
90,000 |
|
0 |
|
93.1 |
|
93.1 |
|
92.0 |
|
92.0 |
|
92.0 |
|
2,056,949 |
|
0.2 |
|
0.2 |
|
9 |
| |
|
1100 King Street - 6 Int’l Drive |
|
100.0 |
|
Rye Brook, New York |
|
Fee Interest |
|
1 |
|
90,000 |
|
0 |
|
56.7 |
|
56.7 |
|
56.7 |
|
56.7 |
|
50.8 |
|
1,538,476 |
|
0.1 |
|
0.1 |
|
3 |
| |
|
520 White Plains Road |
|
100.0 |
|
Tarrytown, New York |
|
Fee Interest |
|
1 |
|
180,000 |
|
1 |
|
99.0 |
|
76.2 |
|
76.2 |
|
75.2 |
|
57.5 |
|
4,395,432 |
|
0.4 |
|
0.3 |
|
13 |
| |
|
115-117 Stevens Avenue |
|
100.0 |
|
Valhalla, New York |
|
Fee Interest |
|
1 |
|
178,000 |
|
1 |
|
75.6 |
|
75.6 |
|
75.1 |
|
74.3 |
|
74.8 |
|
2,851,000 |
|
0.3 |
|
0.2 |
|
10 |
| |
|
100 Summit Lake Drive |
|
100.0 |
|
Valhalla, New York |
|
Fee Interest |
|
1 |
|
250,000 |
|
1 |
|
72.9 |
|
72.9 |
|
72.9 |
|
70.7 |
|
70.7 |
|
4,559,478 |
|
0.4 |
|
0.4 |
|
10 |
| |
|
200 Summit Lake Drive |
|
100.0 |
|
Valhalla, New York |
|
Fee Interest |
|
1 |
|
245,000 |
|
1 |
|
81.1 |
|
81.1 |
|
80.2 |
|
80.2 |
|
80.2 |
|
4,809,943 |
|
0.4 |
|
0.4 |
|
8 |
| |
|
500 Summit Lake Drive |
|
100.0 |
|
Valhalla, New York |
|
Fee Interest |
|
1 |
|
228,000 |
|
1 |
|
96.6 |
|
96.6 |
|
97.8 |
|
97.8 |
|
96.5 |
|
5,133,593 |
|
0.5 |
|
0.4 |
|
6 |
| |
|
140 Grand Street |
|
100.0 |
|
White Plains, New York |
|
Fee Interest |
|
1 |
|
130,100 |
|
0 |
|
97.7 |
|
97.7 |
|
100.0 |
|
95.7 |
|
95.7 |
|
4,162,848 |
|
0.4 |
|
0.3 |
|
13 |
| |
|
360 Hamilton Avenue |
|
100.0 |
|
White Plains, New York |
|
Fee Interest |
|
1 |
|
384,000 |
|
1 |
|
92.3 |
|
92.3 |
|
92.3 |
|
90.9 |
|
90.2 |
|
13,201,491 |
|
1.2 |
|
1.0 |
|
19 |
| |
|
“Same Store” Westchester, New York Subtotal/Weighted Average |
|
|
|
13 |
|
2,135,100 |
|
9 |
% |
80.6 |
% |
78.7 |
% |
78.8 |
% |
78.6 |
% |
78.1 |
% |
$ |
47,944,326 |
|
4.4 |
% |
3.8 |
% |
108 |
| ||||
|
|
|
|
|
|
|
|
|
|
|
|
|
|
|
|
|
|
|
|
|
|
|
|
|
|
|
|
|
|
|
|
| |
|
“Non Same Store” Westchester, New York |
|
|
|
|
|
|
|
|
|
|
|
|
|
|
|
|
|
|
|
|
|
|
|
|
|
|
| |||||
|
150 Grand Street |
|
100.0 |
|
White Plains, New York |
|
Fee Interest |
|
1 |
|
85,000 |
|
0 |
|
76.6 |
|
41.7 |
|
43.8 |
|
38.0 |
|
36.1 |
|
$ |
1,535,628 |
|
0.1 |
|
0.1 |
|
21 |
|
|
“Non Same Store” Westchester, New York Subtotal/Weighted Average |
|
|
1 |
|
85,000 |
|
0 |
% |
76.6 |
% |
41.7 |
% |
43.8 |
% |
38.0 |
% |
36.1 |
% |
$ |
1,535,628 |
|
0.1 |
% |
0.1 |
% |
21 |
| |||||
|
|
|
|
|
|
|
|
|
|
|
|
|
|
|
|
|
|
|
|
|
|
|
|
|
|
|
|
|
|
|
|
| |
|
“Same Store” Connecticut |
|
|
|
|
|
|
|
|
|
|
|
|
|
|
|
|
|
|
|
|
|
|
|
|
|
|
|
|
|
|
| |
|
1 Landmark Square |
|
100.0 |
|
Stamford, Connecticut |
|
Fee Interest |
|
1 |
|
312,000 |
|
1 |
|
95.9 |
|
94.3 |
|
95.8 |
|
93.1 |
|
95.9 |
|
$ |
9,573,916 |
|
0.9 |
|
0.8 |
|
64 |
|
|
2 Landmark Square |
|
100.0 |
|
Stamford, Connecticut |
|
Fee Interest |
|
1 |
|
46,000 |
|
0 |
|
76.5 |
|
85.4 |
|
87.8 |
|
81.7 |
|
57.3 |
|
768,118 |
|
0.1 |
|
0.1 |
|
7 |
| |
|
3 Landmark Square |
|
100.0 |
|
Stamford, Connecticut |
|
Fee Interest |
|
1 |
|
130,000 |
|
0 |
|
59.0 |
|
48.4 |
|
48.4 |
|
51.7 |
|
55.1 |
|
2,345,477 |
|
0.2 |
|
0.2 |
|
18 |
| |
|
4 Landmark Square |
|
100.0 |
|
Stamford, Connecticut |
|
Fee Interest |
|
1 |
|
105,000 |
|
0 |
|
87.6 |
|
87.6 |
|
87.6 |
|
85.1 |
|
87.6 |
|
2,888,601 |
|
0.3 |
|
0.2 |
|
14 |
| |
|
5 Landmark Square |
|
100.0 |
|
Stamford, Connecticut |
|
Fee Interest |
|
1 |
|
61,000 |
|
0 |
|
99.3 |
|
99.0 |
|
99.0 |
|
98.8 |
|
98.8 |
|
975,448 |
|
0.1 |
|
0.1 |
|
10 |
| |
|
6 Landmark Square |
|
100.0 |
|
Stamford, Connecticut |
|
Fee Interest |
|
1 |
|
172,000 |
|
1 |
|
86.0 |
|
91.9 |
|
87.1 |
|
87.1 |
|
83.6 |
|
3,643,373 |
|
0.3 |
|
0.3 |
|
6 |
| |
|
7 Landmark Square |
|
100.0 |
|
Stamford, Connecticut |
|
Fee Interest |
|
1 |
|
36,800 |
|
0 |
|
100.0 |
|
76.9 |
|
76.9 |
|
76.9 |
|
76.9 |
|
313,533 |
|
0.0 |
|
0.0 |
|
1 |
| |
|
680 Washington Boulevard |
|
51.0 |
|
Stamford, Connecticut |
|
Fee Interest |
|
1 |
|
133,000 |
|
0 |
|
88.9 |
|
80.9 |
|
80.9 |
|
77.7 |
|
77.7 |
|
5,097,741 |
|
|
|
0.2 |
|
10 |
| |
|
750 Washington Boulevard |
|
51.0 |
|
Stamford, Connecticut |
|
Fee Interest |
|
1 |
|
192,000 |
|
1 |
|
97.8 |
|
97.8 |
|
97.8 |
|
99.1 |
|
93.3 |
|
7,869,766 |
|
|
|
0.3 |
|
11 |
| |
|
1055 Washington Boulevard |
|
100.0 |
|
Stamford, Connecticut |
|
Leasehold Interest |
|
1 |
|
182,000 |
|
1 |
|
88.0 |
|
89.2 |
|
89.2 |
|
90.6 |
|
90.6 |
|
6,208,949 |
|
0.6 |
|
0.5 |
|
21 |
| |
|
1010 Washington Boulevard |
|
100.0 |
|
Stamford, Connecticut |
|
Fee Interest |
|
1 |
|
143,400 |
|
1 |
|
75.6 |
|
77.1 |
|
77.1 |
|
75.6 |
|
72.2 |
|
3,598,215 |
|
0.3 |
|
0.3 |
|
22 |
| |
|
500 West Putnam Avenue |
|
100.0 |
|
Greenwich, Connecticut |
|
Fee Interest |
|
1 |
|
121,500 |
|
0 |
|
53.8 |
|
53.8 |
|
53.8 |
|
53.8 |
|
53.8 |
|
2,971,684 |
|
0.3 |
|
0.2 |
|
10 |
| |
|
“Same Store” Connecticut Subtotal/Weighted Average |
|
|
|
12 |
|
1,634,700 |
|
5 |
% |
84.9 |
% |
83.7 |
% |
83.6 |
% |
82.9 |
% |
81.8 |
% |
$ |
46,254,821 |
|
3.1 |
% |
3.2 |
% |
194 |
| ||||
|
|
|
|
|
|
|
|
|
|
|
|
|
|
|
|
|
|
|
|
|
|
|
|
|
|
|
|
|
|
|
|
| |
|
“Same Store” New Jersey |
|
|
|
|
|
|
|
|
|
|
|
|
|
|
|
|
|
|
|
|
|
|
|
|
|
|
|
|
|
|
| |
|
125 Chubb Way |
|
100.0 |
|
Lyndhurst, New Jersey |
|
Fee Interest |
|
1 |
|
278,000 |
|
1 |
|
66.2 |
|
66.2 |
|
62.4 |
|
61.1 |
|
61.1 |
|
$ |
4,097,884 |
|
0.4 |
|
0.3 |
|
6 |
|
|
“Same Store” New Jersey Subtotal/Weighted Average |
|
|
|
1 |
|
278,000 |
|
1 |
% |
66.2 |
% |
66.2 |
% |
62.4 |
% |
61.1 |
% |
61.1 |
% |
$ |
4,097,884 |
|
0.4 |
% |
0.3 |
% |
6 |
| ||||
|
|
|
|
|
|
|
|
|
|
|
|
|
|
|
|
|
|
|
|
|
|
|
|
|
|
|
|
|
|
|
|
| |
|
“Same Store” Brooklyn, New York |
|
|
|
|
|
|
|
|
|
|
|
|
|
|
|
|
|
|
|
|
|
|
|
|
|
|
|
|
|
|
| |
|
16 Court Street |
|
100.0 |
|
Brooklyn, New York |
|
Fee Interest |
|
1 |
|
317,600 |
|
1 |
|
95.6 |
|
94.7 |
|
94.7 |
|
94.4 |
|
93.8 |
|
12,008,730 |
|
1.1 |
|
0.9 |
|
69 |
| |
|
“Same Store” Brooklyn, New York Subtotal/Weighted Average |
|
|
|
1 |
|
317,600 |
|
1 |
% |
95.6 |
% |
94.7 |
% |
94.7 |
% |
94.4 |
% |
93.8 |
% |
$ |
12,008,730 |
|
1.1 |
% |
0.9 |
% |
69 |
| ||||
|
|
|
|
|
|
|
|
|
|
|
|
|
|
|
|
|
|
|
|
|
|
|
|
|
|
|
|
|
|
|
|
| |
|
Total / Weighted Average Consolidated Properties |
|
|
|
|
28 |
|
4,450,400 |
|
16 |
% |
82.3 |
% |
80.2 |
% |
80.0 |
% |
79.4 |
% |
78.7 |
% |
$ |
111,841,388 |
|
9.1 |
% |
8.3 |
% |
398 |
| |||
|
|
|
|
|
|
|
|
|
|
|
|
|
|
|
|
|
|
|
|
|
|
|
|
|
|
|
|
|
|
|
|
| |
|
UNCONSOLIDATED PROPERTIES |
|
|
|
|
|
|
|
|
|
|
|
|
|
|
|
|
|
|
|
|
|
|
|
|
|
|
|
|
|
|
| |
|
“Same Store” |
|
|
|
|
|
|
|
|
|
|
|
|
|
|
|
|
|
|
|
|
|
|
|
|
|
|
|
|
|
|
| |
|
The Meadows |
|
50.0 |
|
Rutherford, New Jersey |
|
Fee Interest |
|
2 |
|
582,100 |
|
2 |
|
91.4 |
|
91.4 |
|
91.4 |
|
87.1 |
|
87.9 |
|
13,474,980 |
|
|
|
0.5 |
|
55 |
| |
|
Jericho Plaza |
|
20.26 |
|
Jericho, New York |
|
Fee Interest |
|
2 |
|
640,000 |
|
2 |
|
70.0 |
|
69.8 |
|
86.0 |
|
83.6 |
|
90.5 |
|
15,669,096 |
|
|
|
0.3 |
|
36 |
| |
|
“Same Store” Subtotal/Weighted Average |
|
|
|
4 |
|
1,222,100 |
|
5 |
% |
80.2 |
% |
80.1 |
% |
88.6 |
% |
85.3 |
% |
89.3 |
% |
$ |
29,144,076 |
|
|
|
0.8 |
% |
91 |
| ||||
|
|
|
|
|
|
|
|
|
|
|
|
|
|
|
|
|
|
|
|
|
|
|
|
|
|
|
|
|
|
|
|
| |
|
“Non Same Store” |
|
|
|
|
|
|
|
|
|
|
|
|
|
|
|
|
|
|
|
|
|
|
|
|
|
|
|
|
|
|
| |
|
7 Renaissance Square |
|
50.0 |
|
White Plains, New York |
|
Fee Interest |
|
1 |
|
65,641 |
|
0 |
|
89.1 |
|
77.2 |
|
67.7 |
|
66.8 |
|
51.2 |
|
1,912,776 |
|
|
|
0.1 |
|
10 |
| |
|
“Non Same Store” Subtotal/Weighted Average |
|
1 |
|
65,641 |
|
0 |
% |
89.1 |
% |
77.2 |
% |
67.7 |
% |
66.8 |
% |
51.2 |
% |
$ |
1,912,776 |
|
|
|
0.1 |
% |
10 |
| ||||||
|
|
|
|
|
|
|
|
|
|
|
|
|
|
|
|
|
|
|
|
|
|
|
|
|
|
| |||||||
|
Total / Weighted Average Unconsolidated Properties |
|
5 |
|
1,287,741 |
|
5 |
% |
80.6 |
% |
79.9 |
% |
87.5 |
% |
84.3 |
% |
87.3 |
% |
$ |
31,056,852 |
|
|
|
0.9 |
% |
101 |
| ||||||
|
|
|
|
|
|
|
|
|
|
|
|
|
|
|
|
|
|
|
|
|
|
|
|
|
|
| |||||||
|
Suburban Operating Properties Grand Total / Weighted Average |
|
33 |
|
5,738,141 |
|
21 |
% |
81.9 |
% |
80.1 |
% |
81.7 |
% |
80.5 |
% |
80.7 |
% |
$ |
142,898,240 |
|
|
|
|
|
499 |
| ||||||
|
Suburban Operating Properties Grand Total - SLG share of Annualized Rent |
|
|
|
|
|
|
|
|
|
|
|
|
|
|
|
|
|
$ |
116,355,747 |
|
|
|
9.2 |
% |
|
| ||||||
|
Suburban Operating Properties Same Store Occupancy % |
|
|
|
5,587,500 |
|
97 |
% |
81.9 |
%(1) |
80.8 |
% |
82.4 |
% |
81.3 |
% |
81.7 |
% |
|
|
|
|
|
|
|
| |||||||
(1) Suburban same-store occupancy, inclusive of 127,646 square feet of leases signed but not yet commenced, is 84.2% as of June 30, 2015, as compared to 83.4% at June 30, 2014 and 83.5% at March 31, 2015.
|
Supplemental Information |
Second Quarter 2015 |
|
|
|
|
|
|
|
SELECTED PROPERTY DATA
Retail & Residential Properties |
|

|
|
|
Ownership |
|
|
|
|
|
# of |
|
Useable |
|
% of Total |
|
Occupancy (%) |
|
Annualized |
|
Annualized |
|
Gross Total RE |
|
Total |
| ||||||||||
|
Properties |
|
Interest (%) |
|
SubMarket |
|
Ownership |
|
Bldgs |
|
Sq. Feet |
|
Sq. Feet |
|
Jun-15 |
|
Mar-15 |
|
Dec-14 |
|
Sep-14 |
|
Jun-14 |
|
Cash Rent ($’s) |
|
Cash Rent (SLG%) |
|
Book Value |
|
Tenants |
| ||
|
|
|
|
|
|
|
|
|
|
|
|
|
|
|
|
|
|
|
|
|
|
|
|
|
|
|
|
|
|
|
|
| ||
|
“Same Store” Retail |
|
|
|
|
|
|
|
|
|
|
|
|
|
|
|
|
|
|
|
|
|
|
|
|
|
|
|
|
|
|
| ||
|
11 West 34th Street |
|
30.0 |
|
Herald Square/Penn Station |
|
Fee Interest |
|
1 |
|
17,150 |
|
2 |
|
100.0 |
|
100.0 |
|
100.0 |
|
100.0 |
|
100.0 |
|
$ |
2,450,408 |
|
1.2 |
|
$ |
15,482,405 |
|
1 |
|
|
19-21 East 65th Street (1) |
|
90.0 |
|
Plaza District |
|
Leasehold Interest |
|
2 |
|
23,610 |
|
3 |
|
66.0 |
|
66.0 |
|
66.0 |
|
66.0 |
|
83.0 |
|
1,173,811 |
|
1.7 |
|
7,548,256 |
|
17 |
| ||
|
21 East 66th Street |
|
32.28 |
|
Plaza District |
|
Fee Interest |
|
1 |
|
13,069 |
|
2 |
|
100.0 |
|
100.0 |
|
100.0 |
|
100.0 |
|
100.0 |
|
3,536,868 |
|
1.8 |
|
81,646,928 |
|
1 |
| ||
|
131-137 Spring Street |
|
100.0 |
|
Soho |
|
Fee Interest |
|
2 |
|
68,342 |
|
9 |
|
100.0 |
|
92.0 |
|
92.0 |
|
92.0 |
|
92.0 |
|
11,623,226 |
|
18.3 |
|
138,909,734 |
|
11 |
| ||
|
315 West 33rd Street - The Olivia |
|
100.0 |
|
Penn Station |
|
Fee Interest |
|
1 |
|
270,132 |
|
37 |
|
100.0 |
|
100.0 |
|
100.0 |
|
100.0 |
|
100.0 |
|
15,311,824 |
|
24.1 |
|
214,199,299 |
|
10 |
| ||
|
717 Fifth Avenue |
|
10.92 |
|
Midtown/Plaza District |
|
Fee Interest |
|
1 |
|
119,550 |
|
16 |
|
89.4 |
|
89.4 |
|
89.4 |
|
89.4 |
|
89.4 |
|
36,884,528 |
|
6.3 |
|
279,917,007 |
|
7 |
| ||
|
724 Fifth Avenue |
|
50.0 |
|
Plaza District |
|
Fee Interest |
|
1 |
|
65,010 |
|
9 |
|
81.7 |
|
74.8 |
|
74.8 |
|
68.2 |
|
76.7 |
|
21,576,863 |
|
17.0 |
|
226,453,677 |
|
8 |
| ||
|
752 Madison Avenue (2) |
|
90.0 |
|
Plaza District |
|
Leasehold Interest |
|
1 |
|
21,124 |
|
3 |
|
100.0 |
|
100.0 |
|
100.0 |
|
100.0 |
|
100.0 |
|
4,316,648 |
|
6.1 |
|
11,140,833 |
(3) |
1 |
| ||
|
762 Madison Avenue (1) |
|
90.0 |
|
Plaza District |
|
Fee Interest |
|
1 |
|
6,109 |
|
1 |
|
100.0 |
|
100.0 |
|
100.0 |
|
100.0 |
|
100.0 |
|
1,714,655 |
|
2.4 |
|
16,704,723 |
|
5 |
| ||
|
Williamsburg Terrace |
|
100.0 |
|
Brooklyn, New York |
|
Fee Interest |
|
1 |
|
52,000 |
|
7 |
|
100.0 |
|
100.0 |
|
100.0 |
|
100.0 |
|
100.0 |
|
1,561,500 |
|
2.5 |
|
16,357,696 |
|
3 |
| ||
|
Subtotal/Weighted Average |
|
|
|
12 |
|
656,096 |
|
89 |
% |
95.0 |
% |
93.5 |
% |
93.5 |
% |
92.9 |
% |
94.3 |
% |
$ |
100,150,332 |
|
81.4 |
% |
$ |
1,008,360,557 |
|
64 |
| ||||
|
|
|
|
|
|
|
|
|
|
|
|
|
|
|
|
|
|
|
|
|
|
|
|
|
|
|
|
|
|
|
|
| ||
|
“Non Same Store” Retail |
|
|
|
|
|
|
|
|
|
|
|
|
|
|
|
|
|
|
|
|
|
|
|
|
|
|
|
|
|
|
| ||
|
102 Greene Street |
|
100.0 |
|
Soho |
|
Fee Interest |
|
1 |
|
9,200 |
|
1 |
|
54.3 |
|
77.2 |
|
100.0 |
|
N/A |
|
N/A |
|
$ |
444,117 |
|
0.7 |
|
$ |
31,331,717 |
|
1 |
|
|
115 Spring Street |
|
100.0 |
|
Soho |
|
Fee Interest |
|
1 |
|
5,218 |
|
1 |
|
100.0 |
|
100.0 |
|
100.0 |
|
100.0 |
|
N/A |
|
963,606 |
|
1.5 |
|
53,290,025 |
|
1 |
| ||
|
121 Greene Street |
|
50.0 |
|
Soho |
|
Fee Interest |
|
1 |
|
7,131 |
|
1 |
|
100.0 |
|
100.0 |
|
100.0 |
|
100.0 |
|
N/A |
|
1,344,319 |
|
1.1 |
|
28,255,045 |
|
2 |
| ||
|
1552-1560 Broadway |
|
50.0 |
|
Times Square |
|
Fee Interest |
|
2 |
|
57,718 |
|
8 |
|
67.5 |
|
67.5 |
|
67.5 |
|
67.5 |
|
67.5 |
|
19,430,792 |
|
15.3 |
|
253,646,462 |
|
2 |
| ||
|
Subtotal/Weighted Average |
|
|
|
5 |
|
79,267 |
|
11 |
% |
71.0 |
% |
73.7 |
% |
76.3 |
% |
73.2 |
% |
67.5 |
% |
$ |
22,182,835 |
|
18.6 |
% |
$ |
366,523,249 |
|
6 |
| ||||
|
|
|
|
|
|
|
|
|
|
|
|
|
|
|
|
|
|
|
|
|
|
|
|
|
|
|
|
| ||||||
|
Total / Weighted Average Retail Properties |
|
|
|
17 |
|
735,363 |
|
100 |
% |
92.5 |
% |
91.4 |
% |
91.7 |
% |
91.0 |
% |
92.2 |
% |
$ |
122,333,166 |
|
100.0 |
% |
$ |
1,374,883,806 |
|
70 |
| ||||
Residential Properties
|
|
|
Ownership |
|
|
|
|
|
# of |
|
Useable |
|
Total Units |
|
Occupancy (%) |
|
Average Monthly |
|
Annualized |
|
Gross Total RE |
|
|
| |||||||||||
|
Properties |
|
Interest (%) |
|
SubMarket |
|
Ownership |
|
Bldgs |
|
Sq. Feet |
|
Residential |
|
Jun-15 |
|
Mar-15 |
|
Dec-14 |
|
Sep-14 |
|
Jun-14 |
|
Rent Per Unit ($’s) |
|
Cash Rent ($’s) |
|
Book Value |
|
|
| |||
|
|
|
|
|
|
|
|
|
|
|
|
|
|
|
|
|
|
|
|
|
|
|
|
|
|
|
|
|
|
|
|
| |||
|
“Same Store” Residential |
|
|
|
|
|
|
|
|
|
|
|
|
|
|
|
|
|
|
|
|
|
|
|
|
|
|
|
|
|
|
| |||
|
248-252 Bedford Avenue |
|
90.0 |
|
Brooklyn, New York |
|
Fee Interest |
|
1 |
|
66,611 |
|
75 |
|
92.0 |
|
84.4 |
|
89.6 |
|
79.2 |
|
84.4 |
|
$ |
3,810 |
|
$ |
3,154,318 |
|
$ |
40,378,839 |
|
|
|
|
315 West 33rd Street - The Olivia |
|
100.0 |
|
Penn Station |
|
Fee Interest |
|
|
|
222,855 |
|
333 |
|
96.4 |
|
96.1 |
|
95.8 |
|
96.1 |
|
91.0 |
|
3,856 |
|
14,805,720 |
|
176,711,329 |
|
|
| |||
|
400 East 57th Street (1) |
|
90.0 |
|
Upper East Side |
|
Fee Interest |
|
1 |
|
290,482 |
|
261 |
|
93.9 |
|
98.9 |
|
94.3 |
|
91.6 |
|
93.1 |
|
3,166 |
|
10,721,782 |
|
121,529,923 |
|
|
| |||
|
400 East 58th Street (1) |
|
90.0 |
|
Upper East Side |
|
Fee Interest |
|
1 |
|
140,000 |
|
125 |
|
94.4 |
|
97.6 |
|
96.8 |
|
96.0 |
|
96.8 |
|
3,122 |
|
4,912,130 |
|
53,959,209 |
|
|
| |||
|
Subtotal/Weighted Average |
|
|
|
3 |
|
719,948 |
|
794 |
|
94.8 |
% |
96.1 |
% |
94.9 |
% |
93.0 |
% |
92.0 |
% |
$ |
3,700 |
|
$ |
33,593,951 |
|
$ |
392,579,300 |
|
|
| ||||
|
|
|
|
|
|
|
|
|
|
|
|
|
|
|
|
|
|
|
|
|
|
|
|
|
|
|
|
|
|
|
|
| |||
|
“Non Same Store” Residential |
|
|
|
|
|
|
|
|
|
|
|
|
|
|
|
|
|
|
|
|
|
|
|
|
|
|
|
|
|
|
| |||
|
Upper East Side Residential |
|
90.0 |
|
Upper East Side |
|
Fee Interest |
|
1 |
|
27,000 |
|
28 |
|
96.4 |
|
N/A |
|
N/A |
|
N/A |
|
N/A |
|
$ |
2,177 |
|
$ |
1,144,840 |
|
$ |
50,073,674 |
|
|
|
|
1080 Amsterdam (1) |
|
92.5 |
|
Upper West Side |
|
Leasehold Interest |
|
1 |
|
82,250 |
|
96 |
|
96.9 |
|
96.9 |
|
97.9 |
|
94.8 |
|
2.2 |
|
3,716 |
|
4,399,140 |
|
46,393,191 |
|
|
| |||
|
Stonehenge Portfolio |
|
Various |
|
|
|
Fee Interest |
|
17 |
|
2,046,733 |
|
2,225 |
|
96.9 |
|
96.5 |
|
N/A |
|
N/A |
|
N/A |
|
3,487 |
|
102,099,102 |
|
970,556,487 |
|
|
| |||
|
Subtotal/Weighted Average |
|
|
|
19 |
|
2,155,983 |
|
2,349 |
|
96.9 |
% |
96.5 |
% |
97.9 |
% |
94.8 |
% |
2.2 |
% |
$ |
3,592 |
|
$ |
107,643,081 |
|
$ |
1,067,023,352 |
|
|
| ||||
|
|
|
|
|
|
|
|
|
|
|
|
|
|
|
|
|
|
|
|
|
|
|
|
|
|
|
|
|
|
|
|
| |||
|
Total / Weighted Average Residential Properties |
|
|
|
|
|
22 |
|
2,875,931 |
|
3,143 |
|
96.4 |
% |
96.4 |
% |
95.2 |
% |
93.2 |
% |
82.3 |
% |
$ |
3,619 |
|
$ |
141,237,032 |
|
$ |
1,459,602,652 |
|
|
| ||
(1) Stonehenge Portfolio Property.
(2) The Company owns an 90% interest in the leasehold position, which is treated as a consolidated joint venture, and later, through a separate entity, acquired 100% of the fee position.
(3) Excludes the fee position owned through a separate entity.
|
Supplemental Information |
Second Quarter 2015 |
|
|
|
|
SELECTED PROPERTY DATA
Development / Redevelopment & Land Properties |
|

|
|
|
Ownership |
|
|
|
|
|
# of |
|
Useable |
|
% of Total |
|
Occupancy (%) |
|
Annualized |
|
Annualized |
|
Gross Total RE |
|
Total |
| ||||||||||
|
Properties |
|
Interest (%) |
|
SubMarket |
|
Ownership |
|
Bldgs |
|
Sq. Feet |
|
Sq. Feet |
|
Jun-15 |
|
Mar-15 |
|
Dec-14 |
|
Sep-14 |
|
Jun-14 |
|
Cash Rent ($’s) |
|
Cash Rent (SLG%) |
|
Book Value |
|
Tenants |
| ||
|
Development / Redevelopment |
|
|
|
|
|
|
|
|
|
|
|
|
|
|
|
|
|
|
|
|
|
|
|
|
|
|
|
|
|
|
| ||
|
33 Beekman Street |
|
45.9 |
|
Downtown |
|
Fee Interest |
|
1 |
|
— |
|
— |
|
— |
|
— |
|
— |
|
— |
|
— |
|
— |
|
— |
|
$ |
93,187,860 |
|
— |
| |
|
280 Park Avenue |
|
50.0 |
|
Park Avenue |
|
Fee Interest |
|
1 |
|
1,219,158 |
|
45 |
|
69.3 |
|
65.2 |
|
55.4 |
|
55.5 |
|
58.2 |
|
83,465,864 |
|
82.8 |
|
1,260,810,175 |
|
30 |
| ||
|
51 East 42nd Street |
|
100.0 |
|
Grand Central |
|
Fee Interest |
|
1 |
|
142,000 |
|
5 |
|
— |
|
— |
|
10.1 |
|
18.4 |
|
62.2 |
|
— |
|
— |
|
86,168,904 |
|
— |
| ||
|
317 Madison Avenue |
|
100.0 |
|
Grand Central |
|
Fee Interest |
|
1 |
|
450,000 |
|
16 |
|
1.5 |
|
10.6 |
|
18.6 |
|
35.1 |
|
64.2 |
|
2,025,612 |
|
4.0 |
|
148,445,747 |
|
1 |
| ||
|
331 Madison Avenue |
|
100.0 |
|
Grand Central |
|
Fee Interest |
|
1 |
|
114,900 |
|
4 |
|
— |
|
9.8 |
|
19.6 |
|
74.9 |
|
77.5 |
|
— |
|
— |
|
84,562,887 |
|
— |
| ||
|
10 East 53rd Street |
|
55.0 |
|
Plaza District |
|
Fee Interest |
|
1 |
|
354,300 |
|
13 |
|
31.1 |
|
29.1 |
|
25.3 |
|
26.7 |
|
26.7 |
|
8,428,870 |
|
9.2 |
|
311,401,394 |
|
13 |
| ||
|
Fifth Avenue Retail Assemblage |
|
100.0 |
|
Plaza District |
|
Fee Interest |
|
3 |
|
66,962 |
|
2 |
|
63.7 |
|
63.7 |
|
63.7 |
|
66.2 |
|
69.8 |
|
1,224,600 |
|
2.4 |
|
152,456,000 |
|
1 |
| ||
|
650 Fifth Avenue |
|
50.0 |
|
Plaza District |
|
Leasehold Interest |
|
1 |
|
32,324 |
|
1 |
|
10.5 |
|
10.5 |
|
10.5 |
|
10.5 |
|
10.5 |
|
1,339,026 |
|
1.3 |
|
272,703,414 |
|
3 |
| ||
|
719 Seventh Avenue |
|
75.0 |
|
Times Square |
|
Fee Interest |
|
1 |
|
6,000 |
|
0 |
|
— |
|
— |
|
100.0 |
|
100.0 |
|
N/A |
|
— |
|
— |
|
42,514,932 |
|
— |
| ||
|
175-225 Third Street |
|
95.0 |
|
Brooklyn, New York |
|
Fee Interest |
|
1 |
|
— |
|
— |
|
— |
|
— |
|
— |
|
N/A |
|
N/A |
|
— |
|
— |
|
75,556,146 |
|
— |
| ||
|
55 West 46th Street |
|
25.0 |
|
Midtown |
|
Fee Interest |
|
1 |
|
347,000 |
|
13 |
|
— |
|
— |
|
— |
|
N/A |
|
N/A |
|
— |
|
— |
|
307,485,737 |
|
— |
| ||
|
1640 Flatbush Avenue |
|
100.0 |
|
Brooklyn, New York |
|
Fee Interest |
|
1 |
|
1,000 |
|
0 |
|
100.0 |
|
100.0 |
|
N/A |
|
N/A |
|
N/A |
|
85,152 |
|
0.2 |
|
6,800,000 |
|
1 |
| ||
|
Total / Weighted Average Development / Redevelopment Properties |
|
14 |
|
2,733,644 |
|
100 |
|
36.9 |
% |
36.7 |
% |
34.3 |
% |
45.9 |
% |
55.5 |
% |
$ |
96,569,124 |
|
100.0 |
% |
$ |
2,842,093,196 |
|
49 |
| ||||||
|
|
|
|
|
|
|
|
|
|
|
|
|
|
|
|
|
|
|
|
|
|
|
|
|
|
|
|
|
|
|
|
| ||
|
Land |
|
|
|
|
|
|
|
|
|
|
|
|
|
|
|
|
|
|
|
|
|
|
|
|
|
|
|
|
|
|
| ||
|
635 Madison Avenue (1) |
|
100.0 |
|
Plaza District |
|
Fee Interest |
|
1 |
|
176,530 |
|
23 |
|
100.0 |
|
100.0 |
|
100.0 |
|
100.0 |
|
N/A |
|
3,677,574 |
|
17.7 |
|
153,745,356 |
|
|
| ||
|
885 Third Avenue (1) |
|
100.0 |
|
Midtown/Plaza District |
|
Fee Interest |
|
1 |
|
607,000 |
|
77 |
|
100.0 |
|
100.0 |
|
100.0 |
|
100.0 |
|
100.0 |
|
17,068,716 |
|
82.3 |
|
329,943,115 |
|
|
| ||
|
Total / Weighted Average Land |
|
|
|
|
|
|
|
2 |
|
783,530 |
|
100 |
% |
100.0 |
% |
100.0 |
% |
100.0 |
% |
100.0 |
% |
100.0 |
% |
$ |
20,746,290 |
|
100.0 |
% |
$ |
483,688,471 |
|
|
|
(1) Subject to long-term, third party net operating leases.
|
Supplemental Information |
Second Quarter 2015 |
|
|
|
|
SELECTED PROPERTY DATA
Retail Properties |
|

|
|
|
Ownership |
|
|
|
|
|
# of |
|
Useable |
|
% of Total |
|
Occupancy (%) |
|
Annualized Retail |
|
Annualized Retail Cash Rent |
|
Total |
| |||||||||||
|
Properties |
|
Interest (%) |
|
SubMarket |
|
Ownership |
|
Bldgs |
|
Sq. Feet |
|
Sq. Feet |
|
Jun-15 |
|
Mar-15 |
|
Dec-14 |
|
Sep-14 |
|
Jun-14 |
|
Cash Rent ($’s) |
|
100% |
|
SLG |
|
Tenants |
| |
|
PRIME RETAIL - Consolidated Properties |
|
|
|
|
|
|
|
|
|
|
|
|
|
|
|
|
|
|
|
|
|
|
|
|
|
|
|
|
|
|
| |
|
19-21 East 65th Street |
|
90.0 |
|
Plaza District |
|
Leasehold Interest |
|
2 |
|
23,610 |
|
1 |
|
66.0 |
|
66.0 |
|
66.0 |
|
66.0 |
|
83.0 |
|
1,173,811 |
|
0 |
|
1 |
|
17 |
| |
|
102 Greene Street |
|
100.0 |
|
Soho |
|
Fee Interest |
|
1 |
|
9,200 |
|
0 |
|
54.3 |
|
77.2 |
|
100.0 |
|
N/A |
|
N/A |
|
444,117 |
|
0 |
|
0 |
|
1 |
| |
|
115 Spring Street |
|
100.0 |
|
Soho |
|
Fee Interest |
|
1 |
|
5,218 |
|
0 |
|
100.0 |
|
100.0 |
|
100.0 |
|
100.0 |
|
N/A |
|
963,606 |
|
0 |
|
1 |
|
1 |
| |
|
131-137 Spring Street |
|
100.0 |
|
Soho |
|
Fee Interest |
|
2 |
|
68,342 |
|
3 |
|
100.0 |
|
92.0 |
|
92.0 |
|
92.0 |
|
92.0 |
|
11,623,226 |
|
4 |
|
6 |
|
11 |
| |
|
315 West 33rd Street - The Olivia |
|
100.0 |
|
Penn Station |
|
Fee Interest |
|
1 |
|
270,132 |
|
13 |
|
100.0 |
|
100.0 |
|
100.0 |
|
100.0 |
|
100.0 |
|
15,311,824 |
|
6 |
|
8 |
|
10 |
| |
|
719 Seventh Avenue |
|
75.0 |
|
Times Square |
|
Fee Interest |
|
1 |
|
6,000 |
|
0 |
|
— |
|
— |
|
100.0 |
|
100.0 |
|
N/A |
|
— |
|
— |
|
— |
|
— |
| |
|
752 Madison Avenue(1) |
|
90.0 |
|
Plaza District |
|
Leasehold Interest |
|
1 |
|
21,124 |
|
1 |
|
100.0 |
|
100.0 |
|
100.0 |
|
100.0 |
|
100.0 |
|
4,316,648 |
|
2 |
|
2 |
|
1 |
| |
|
762 Madison Avenue |
|
90.0 |
|
Plaza District |
|
Fee Interest |
|
1 |
|
6,109 |
|
0 |
|
100.0 |
|
100.0 |
|
100.0 |
|
100.0 |
|
100.0 |
|
1,714,655 |
|
1 |
|
1 |
|
5 |
| |
|
Fifth Avenue Retail Assemblage |
|
100.0 |
|
Plaza District |
|
Fee Interest |
|
3 |
|
66,962 |
|
3 |
|
63.7 |
|
63.7 |
|
63.7 |
|
66.2 |
|
69.8 |
|
1,224,600 |
|
0 |
|
1 |
|
1 |
| |
|
Williamsburg Terrace |
|
100.0 |
|
Brooklyn, New York |
|
Fee Interest |
|
1 |
|
52,000 |
|
3 |
|
100.0 |
|
100.0 |
|
100.0 |
|
100.0 |
|
100.0 |
|
1,561,500 |
|
1 |
|
1 |
|
3 |
| |
|
1640 Flatbush Avenue |
|
100.0 |
|
Brooklyn, New York |
|
Fee Interest |
|
1 |
|
1,000 |
|
0 |
|
100.0 |
|
100.0 |
|
N/A |
|
N/A |
|
N/A |
|
85,152 |
|
0 |
|
0 |
|
1 |
| |
|
Subtotal / Weighted Average |
|
|
|
|
|
15 |
|
529,697 |
|
26 |
% |
92.0 |
% |
91.3 |
% |
92.8 |
% |
93.0 |
% |
94.1 |
% |
$ |
38,419,139 |
|
14 |
% |
20 |
% |
51 |
| ||
|
|
|
|
|
|
|
|
|
|
|
|
|
|
|
|
|
|
|
|
|
|
|
|
|
|
|
|
|
|
|
|
| |
|
PRIME RETAIL - Unconsolidated Properties |
|
|
|
|
|
|
|
|
|
|
|
|
|
|
|
|
|
|
|
|
|
|
|
|
|
|
|
|
|
|
| |
|
11 West 34th Street |
|
30.0 |
|
Herald Square/Penn Station |
|
Fee Interest |
|
1 |
|
17,150 |
|
1 |
|
100.0 |
|
100.0 |
|
100.0 |
|
100.0 |
|
100.0 |
|
2,450,408 |
|
1 |
|
0 |
|
1 |
| |
|
21 East 66th Street |
|
32.28 |
|
Plaza District |
|
Fee Interest |
|
1 |
|
13,069 |
|
1 |
|
100.0 |
|
100.0 |
|
100.0 |
|
100.0 |
|
100.0 |
|
3,536,868 |
|
1 |
|
1 |
|
1 |
| |
|
121 Greene Street |
|
50.0 |
|
Soho |
|
Fee Interest |
|
1 |
|
7,131 |
|
0 |
|
100.0 |
|
100.0 |
|
100.0 |
|
100.0 |
|
N/A |
|
1,344,319 |
|
1 |
|
0 |
|
2 |
| |
|
650 Fifth Avenue |
|
50.0 |
|
Plaza District |
|
Leasehold Interest |
|
1 |
|
32,324 |
|
2 |
|
10.5 |
|
10.5 |
|
10.5 |
|
10.5 |
|
10.5 |
|
1,339,026 |
|
1 |
|
0 |
|
3 |
| |
|
717 Fifth Avenue |
|
10.92 |
|
Midtown/Plaza District |
|
Fee Interest |
|
1 |
|
119,550 |
|
6 |
|
89.4 |
|
89.4 |
|
89.4 |
|
89.4 |
|
89.4 |
|
36,884,528 |
|
14 |
|
2 |
|
7 |
| |
|
724 Fifth Avenue |
|
50.0 |
|
Plaza District |
|
Fee Interest |
|
1 |
|
65,010 |
|
3 |
|
81.7 |
|
74.8 |
|
74.8 |
|
68.2 |
|
76.7 |
|
21,576,863 |
|
8 |
|
6 |
|
8 |
| |
|
1552-1560 Broadway |
|
50.0 |
|
Times Square |
|
Fee Interest |
|
2 |
|
57,718 |
|
3 |
|
67.5 |
|
67.5 |
|
67.5 |
|
67.5 |
|
67.5 |
|
19,430,792 |
|
7 |
|
5 |
|
2 |
| |
|
Subtotal / Weighted Average |
|
|
|
|
|
8 |
|
311,952 |
|
15 |
% |
76.9 |
% |
75.4 |
% |
75.4 |
% |
74.0 |
% |
75.2 |
% |
$ |
86,562,805 |
|
33 |
% |
15 |
% |
24 |
| ||
|
|
|
|
|
|
|
|
|
|
|
|
|
|
|
|
|
|
|
|
|
|
|
|
|
|
|
|
|
|
|
|
| |
|
Total / Weighted Average Prime Retail |
|
|
|
|
|
|
|
23 |
|
841,649 |
|
41 |
% |
86.4 |
% |
85.4 |
% |
86.4 |
% |
85.9 |
% |
87.1 |
% |
$ |
124,981,944 |
|
47 |
% |
35 |
% |
75 |
|
|
|
|
|
|
|
|
|
|
|
|
|
|
|
|
|
|
|
|
|
|
|
|
|
|
|
|
|
|
|
|
|
| |
|
OTHER RETAIL - Consolidated Properties |
|
|
|
|
|
|
|
|
|
|
|
|
|
|
|
|
|
|
|
|
|
|
|
|
|
|
|
|
|
|
| |
|
51 East 42nd Street |
|
100.0 |
|
Grand Central |
|
Fee Interest |
|
1 |
|
23,221 |
|
1 |
|
— |
|
— |
|
69.0 |
|
80.3 |
|
80.3 |
|
— |
|
— |
|
— |
|
— |
| |
|
100 Church Street |
|
100.0 |
|
Downtown |
|
Fee Interest |
|
1 |
|
49,992 |
|
2 |
|
100.0 |
|
100.0 |
|
100.0 |
|
100.0 |
|
100.0 |
|
2,668,353 |
|
1 |
|
1 |
|
7 |
| |
|
120 West 45th Street |
|
100.0 |
|
Midtown |
|
Fee Interest |
|
1 |
|
5,446 |
|
0 |
|
100.0 |
|
100.0 |
|
100.0 |
|
100.0 |
|
100.0 |
|
406,436 |
|
0 |
|
0 |
|
1 |
| |
|
125 Park Avenue |
|
100.0 |
|
Grand Central |
|
Fee Interest |
|
1 |
|
21,733 |
|
1 |
|
43.9 |
|
43.9 |
|
43.9 |
|
43.9 |
|
43.9 |
|
1,155,972 |
|
0 |
|
1 |
|
5 |
| |
|
220 East 42nd Street |
|
100.0 |
|
Grand Central |
|
Fee Interest |
|
1 |
|
49,970 |
|
2 |
|
96.5 |
|
96.5 |
|
96.5 |
|
96.5 |
|
96.5 |
|
3,425,841 |
|
1 |
|
2 |
|
6 |
| |
|
260 East 72nd Street |
|
90.0 |
|
Upper East Side |
|
Fee Interest |
|
1 |
|
4,150 |
|
0 |
|
88.0 |
|
N/A |
|
N/A |
|
N/A |
|
N/A |
|
439,454 |
|
0 |
|
0 |
|
4 |
| |
|
304 Park Avenue South |
|
100.0 |
|
Midtown South |
|
Fee Interest |
|
1 |
|
25,330 |
|
1 |
|
100.0 |
|
100.0 |
|
100.0 |
|
100.0 |
|
100.0 |
|
2,945,556 |
|
1 |
|
2 |
|
6 |
| |
|
317 Madison Avenue |
|
100.0 |
|
Grand Central |
|
Fee Interest |
|
1 |
|
26,935 |
|
1 |
|
25.3 |
|
25.3 |
|
25.3 |
|
25.3 |
|
100.0 |
|
2,025,612 |
|
1 |
|
1 |
|
1 |
| |
|
331 Madison Avenue |
|
100.0 |
|
Grand Central |
|
Fee Interest |
|
1 |
|
13,722 |
|
1 |
|
— |
|
72.9 |
|
72.9 |
|
82.9 |
|
84.7 |
|
— |
|
— |
|
— |
|
— |
| |
|
400 East 57th Street |
|
90.0 |
|
Upper East Side |
|
Fee Interest |
|
1 |
|
13,772 |
|
1 |
|
55.4 |
|
100.0 |
|
100.0 |
|
100.0 |
|
100.0 |
|
1,490,156 |
|
1 |
|
1 |
|
9 |
| |
|
400 East 58th Street |
|
90.0 |
|
Upper East Side |
|
Fee Interest |
|
1 |
|
3,156 |
|
0 |
|
100.0 |
|
100.0 |
|
100.0 |
|
100.0 |
|
100.0 |
|
490,756 |
|
0 |
|
0 |
|
5 |
| |
|
420 Lexington Ave (Graybar) |
|
100.0 |
|
Grand Central North |
|
Leasehold Interest |
|
1 |
|
49,375 |
|
2 |
|
100.0 |
|
100.0 |
|
100.0 |
|
100.0 |
|
100.0 |
|
4,062,478 |
|
2 |
|
2 |
|
6 |
| |
|
461 Fifth Avenue |
|
100.0 |
|
Midtown |
|
Leasehold Interest |
|
1 |
|
16,248 |
|
1 |
|
100.0 |
|
88.6 |
|
100.0 |
|
100.0 |
|
100.0 |
|
2,049,977 |
|
1 |
|
1 |
|
2 |
| |
|
485 Lexington Avenue |
|
100.0 |
|
Grand Central North |
|
Fee Interest |
|
1 |
|
45,394 |
|
2 |
|
100.0 |
|
100.0 |
|
100.0 |
|
100.0 |
|
100.0 |
|
3,992,700 |
|
2 |
|
2 |
|
5 |
| |
|
555 West 57th Street |
|
100.0 |
|
Midtown West |
|
Fee Interest |
|
1 |
|
60,389 |
|
3 |
|
100.0 |
|
100.0 |
|
100.0 |
|
100.0 |
|
100.0 |
|
1,726,905 |
|
1 |
|
1 |
|
2 |
| |
|
609 Fifth Avenue |
|
100.0 |
|
Rockefeller Center |
|
Fee Interest |
|
1 |
|
46,019 |
|
2 |
|
100.0 |
|
100.0 |
|
100.0 |
|
100.0 |
|
100.0 |
|
9,113,239 |
|
3 |
|
5 |
|
1 |
| |
|
625 Madison Avenue |
|
100.0 |
|
Plaza District |
|
Leasehold Interest |
|
1 |
|
74,937 |
|
4 |
|
89.3 |
|
85.1 |
|
85.1 |
|
85.1 |
|
85.1 |
|
20,470,714 |
|
8 |
|
11 |
|
15 |
| |
|
635 Sixth Avenue |
|
100.0 |
|
Midtown South |
|
Fee Interest |
|
1 |
|
23,250 |
|
1 |
|
100.0 |
|
— |
|
— |
|
— |
|
— |
|
3,094,575 |
|
1 |
|
2 |
|
1 |
| |
|
641 Sixth Avenue |
|
100.0 |
|
Midtown South |
|
Fee Interest |
|
1 |
|
28,500 |
|
1 |
|
100.0 |
|
100.0 |
|
100.0 |
|
100.0 |
|
100.0 |
|
3,337,488 |
|
1 |
|
2 |
|
2 |
| |
|
711 Third Avenue |
|
100.0 |
|
Grand Central North |
|
Leasehold Interest |
|
1 |
|
25,639 |
|
1 |
|
100.0 |
|
100.0 |
|
100.0 |
|
100.0 |
|
100.0 |
|
2,818,089 |
|
1 |
|
2 |
|
3 |
| |
|
750 Third Avenue |
|
100.0 |
|
Grand Central North |
|
Fee Interest |
|
1 |
|
24,827 |
|
1 |
|
100.0 |
|
100.0 |
|
100.0 |
|
100.0 |
|
100.0 |
|
2,448,380 |
|
1 |
|
1 |
|
7 |
| |
|
810 Seventh Avenue |
|
100.0 |
|
Times Square |
|
Fee Interest |
|
1 |
|
13,470 |
|
1 |
|
100.0 |
|
100.0 |
|
100.0 |
|
100.0 |
|
100.0 |
|
3,752,520 |
|
1 |
|
2 |
|
4 |
| |
|
919 Third Avenue |
|
51.0 |
|
Grand Central North |
|
Fee Interest |
|
1 |
|
31,004 |
|
2 |
|
98.9 |
|
98.9 |
|
98.9 |
|
100.0 |
|
100.0 |
|
3,039,768 |
|
1 |
|
1 |
|
4 |
| |
|
1080 Amsterdam |
|
92.5 |
|
Upper West Side |
|
Leasehold Interest |
|
1 |
|
1,800 |
|
0 |
|
100.0 |
|
100.0 |
|
100.0 |
|
100.0 |
|
100.0 |
|
252,000 |
|
0 |
|
0 |
|
1 |
| |
|
1185 Avenue of the Americas |
|
100.0 |
|
Rockefeller Center |
|
Leasehold Interest |
|
1 |
|
37,326 |
|
2 |
|
100.0 |
|
100.0 |
|
100.0 |
|
100.0 |
|
100.0 |
|
6,161,886 |
|
2 |
|
3 |
|
5 |
| |
|
1350 Avenue of the Americas |
|
100.0 |
|
Rockefeller Center |
|
Fee Interest |
|
1 |
|
17,797 |
|
1 |
|
100.0 |
|
100.0 |
|
100.0 |
|
100.0 |
|
100.0 |
|
2,295,420 |
|
1 |
|
1 |
|
5 |
| |
|
1515 Broadway |
|
100.0 |
|
Times Square |
|
Fee Interest |
|
1 |
|
185,333 |
|
9 |
|
100.0 |
|
97.0 |
|
95.8 |
|
100.0 |
|
100.0 |
|
27,042,556 |
|
10 |
|
15 |
|
7 |
| |
|
|
|
|
|
|
|
|
|
|
|
|
|
|
|
|
|
|
|
|
|
|
|
|
|
|
|
|
|
|
|
|
| |
|
Subtotal / Weighted Average |
|
|
|
27 |
|
918,735 |
|
45 |
% |
90.6 |
% |
88.3 |
% |
90.0 |
% |
91.3 |
% |
93.6 |
% |
$ |
110,706,830 |
|
42 |
% |
59 |
% |
114 |
| ||||
(1) SL Green owns an 90% interest in the leasehold position, which is treated as a consolidated joint venture, and later, through a separate entity, acquired 100% of the fee position.
|
Supplemental Information |
Second Quarter 2015 |
|
|
|
|
SELECTED PROPERTY DATA - Cont.
Retail Properties |
|

|
|
|
Ownership |
|
|
|
|
|
# of |
|
Useable |
|
% of Total |
|
Occupancy (%) |
|
Annualized Retail |
|
Annualized Retail Cash Rent |
|
Total |
| |||||||||||
|
Properties |
|
Interest (%) |
|
SubMarket |
|
Ownership |
|
Bldgs |
|
Sq. Feet |
|
Sq. Feet |
|
Jun-15 |
|
Mar-15 |
|
Dec-14 |
|
Sep-14 |
|
Jun-14 |
|
Cash Rent ($’s) |
|
100% |
|
SLG |
|
Tenants |
| |
|
OTHER RETAIL - Unconsolidated Properties |
|
|
|
|
|
|
|
|
|
|
|
|
|
|
|
|
|
|
|
|
|
|
|
|
|
|
|
|
|
|
| |
|
3 Columbus Circle |
|
48.9 |
|
Columbus Circle |
|
Fee Interest |
|
1 |
|
40,647 |
|
2 |
|
87.2 |
|
87.2 |
|
87.2 |
|
87.2 |
|
87.2 |
|
9,100,524 |
|
3 |
|
2 |
|
4 |
| |
|
10 East 53rd Street |
|
55.0 |
|
Plaza District |
|
Fee Interest |
|
1 |
|
8,786 |
|
0 |
|
81.7 |
|
81.7 |
|
81.7 |
|
100.0 |
|
100.0 |
|
721,488 |
|
0 |
|
0 |
|
2 |
| |
|
55 West 46th Street |
|
25.0 |
|
Midtown |
|
Leasehold Interest |
|
1 |
|
1,300 |
|
0 |
|
— |
|
— |
|
— |
|
N/A |
|
N/A |
|
— |
|
— |
|
— |
|
— |
| |
|
100 Park Avenue |
|
50.0 |
|
Grand Central South |
|
Fee Interest |
|
1 |
|
40,022 |
|
2 |
|
100.0 |
|
100.0 |
|
100.0 |
|
100.0 |
|
100.0 |
|
2,898,712 |
|
1 |
|
1 |
|
9 |
| |
|
280 Park Avenue |
|
50.0 |
|
Park Avenue |
|
Fee Interest |
|
1 |
|
18,545 |
|
1 |
|
18.9 |
|
18.9 |
|
18.9 |
|
18.9 |
|
18.9 |
|
788,856 |
|
0 |
|
0 |
|
2 |
| |
|
315 West 36th Street |
|
35.5 |
|
Times Square South |
|
Fee Interest |
|
1 |
|
10,271 |
|
1 |
|
100.0 |
|
100.0 |
|
100.0 |
|
100.0 |
|
100.0 |
|
405,508 |
|
0 |
|
0 |
|
3 |
| |
|
521 Fifth Avenue |
|
50.5 |
|
Grand Central |
|
Fee Interest |
|
1 |
|
53,157 |
|
3 |
|
100.0 |
|
100.0 |
|
100.0 |
|
100.0 |
|
100.0 |
|
4,909,296 |
|
2 |
|
1 |
|
3 |
| |
|
600 Lexington Avenue |
|
55.0 |
|
East Side |
|
Fee Interest |
|
1 |
|
4,264 |
|
0 |
|
100.0 |
|
100.0 |
|
100.0 |
|
100.0 |
|
100.0 |
|
788,256 |
|
0 |
|
0 |
|
2 |
| |
|
800 Third Avenue |
|
60.5 |
|
Grand Central North |
|
Fee Interest |
|
1 |
|
9,900 |
|
0 |
|
100.0 |
|
100.0 |
|
100.0 |
|
100.0 |
|
100.0 |
|
1,826,496 |
|
1 |
|
1 |
|
2 |
| |
|
Stonehenge Portfolio |
|
Various |
|
|
|
Fee Interest |
|
10 |
|
88,984 |
|
4 |
|
79.0 |
|
78.5 |
|
N/A |
|
N/A |
|
N/A |
|
8,563,387 |
|
3 |
|
0 |
|
33 |
| |
|
Subtotal / Weighted Average |
|
|
|
|
|
19 |
|
275,876 |
|
14 |
% |
84.8 |
% |
84.7 |
% |
59.4 |
% |
60.2 |
% |
60.2 |
% |
$ |
30,002,523 |
|
11 |
% |
6 |
% |
60 |
| ||
|
|
|
|
|
|
|
|
|
|
|
|
|
|
|
|
|
|
|
|
|
|
|
|
|
|
|
|
|
|
|
|
| |
|
Total / Weighted Average Other Retail |
|
|
|
|
|
|
|
46 |
|
1,194,611 |
|
59 |
% |
89.3 |
% |
87.5 |
% |
82.9 |
% |
84.2 |
% |
85.9 |
% |
$ |
140,709,354 |
|
53 |
% |
65 |
% |
174 |
|
|
|
|
|
|
|
|
|
|
|
|
|
|
|
|
|
|
|
|
|
|
|
|
|
|
|
|
|
|
|
|
|
| |
|
Retail Grand Total / Weighted Average |
|
|
|
|
|
|
|
69 |
|
2,036,260 |
|
100 |
% |
88.1 |
% |
86.6 |
% |
84.3 |
% |
84.9 |
% |
86.3 |
% |
$ |
265,691,298 |
|
100 |
% |
|
|
249 |
|
|
Retail Grand Total - SLG share of Annualized Rent |
|
|
|
|
|
|
|
|
|
|
|
|
|
|
|
|
|
|
|
|
|
$ |
185,423,980 |
|
|
|
100 |
% |
|
| ||
|
Supplemental Information |
Second Quarter 2015 |
|
|
|
|
SELECTED PROPERTY DATA
Manhattan Operating Properties - Reckson Portfolio |
|

|
|
|
Ownership |
|
|
|
|
|
Useable |
|
% of Total |
|
Occupancy (%) |
|
Annualized |
|
Annualized Cash Rent |
|
Total |
| |||||||||||
|
Properties |
|
Interest (%) |
|
SubMarket |
|
Ownership |
|
Sq. Feet |
|
Sq. Feet |
|
Jun-15 |
|
Mar-15 |
|
Dec-14 |
|
Sep-14 |
|
Jun-14 |
|
Cash Rent ($’s) |
|
100% |
|
SLG% |
|
Tenants |
| |
|
CONSOLIDATED PROPERTIES |
|
|
|
|
|
|
|
|
|
|
|
|
|
|
|
|
|
|
|
|
|
|
|
|
|
|
|
|
| |
|
“Same Store” |
|
|
|
|
|
|
|
|
|
|
|
|
|
|
|
|
|
|
|
|
|
|
|
|
|
|
|
|
| |
|
110 East 42nd Street |
|
100.0 |
|
Grand Central |
|
Fee Interest |
|
215,400 |
|
2 |
|
99.9 |
|
99.4 |
|
98.8 |
|
88.7 |
|
83.2 |
|
10,640,214 |
|
2.1 |
|
1.9 |
|
23 |
| |
|
125 Park Avenue |
|
100.0 |
|
Grand Central |
|
Fee Interest |
|
604,245 |
|
5 |
|
87.1 |
|
88.7 |
|
80.4 |
|
81.9 |
|
70.8 |
|
31,551,723 |
|
6.2 |
|
5.6 |
|
22 |
| |
|
304 Park Avenue South |
|
100.0 |
|
Midtown South |
|
Fee Interest |
|
215,000 |
|
2 |
|
90.3 |
|
91.9 |
|
91.9 |
|
90.5 |
|
90.5 |
|
12,160,832 |
|
2.4 |
|
2.2 |
|
13 |
| |
|
461 Fifth Avenue (1) |
|
100.0 |
|
Midtown |
|
Leasehold Interest |
|
200,000 |
|
2 |
|
96.8 |
|
95.5 |
|
96.5 |
|
96.5 |
|
96.5 |
|
17,875,864 |
|
3.5 |
|
3.2 |
|
12 |
| |
|
555 West 57th Street |
|
100.0 |
|
Midtown West |
|
Fee Interest |
|
941,000 |
|
8 |
|
99.9 |
|
99.9 |
|
99.9 |
|
99.9 |
|
99.9 |
|
38,672,481 |
|
7.6 |
|
6.8 |
|
10 |
| |
|
609 Fifth Avenue |
|
100.0 |
|
Rockefeller Center |
|
Fee Interest |
|
160,000 |
|
1 |
|
81.3 |
|
81.3 |
|
81.3 |
|
81.3 |
|
79.0 |
|
14,427,758 |
|
2.8 |
|
2.6 |
|
13 |
| |
|
625 Madison Avenue |
|
100.0 |
|
Plaza District |
|
Leasehold Interest |
|
563,000 |
|
5 |
|
97.1 |
|
96.6 |
|
92.1 |
|
92.1 |
|
92.1 |
|
55,369,028 |
|
10.8 |
|
9.8 |
|
22 |
| |
|
641 Sixth Avenue |
|
100.0 |
|
Midtown South |
|
Fee Interest |
|
163,000 |
|
1 |
|
100.0 |
|
92.1 |
|
92.1 |
|
92.1 |
|
92.1 |
|
10,375,689 |
|
2.0 |
|
1.8 |
|
8 |
| |
|
711 Third Avenue (2) |
|
100.0 |
|
Grand Central North |
|
Leasehold Interest |
|
524,000 |
|
4 |
|
83.5 |
|
84.1 |
|
80.6 |
|
80.6 |
|
80.6 |
|
25,738,744 |
|
5.0 |
|
4.6 |
|
17 |
| |
|
750 Third Avenue |
|
100.0 |
|
Grand Central North |
|
Fee Interest |
|
780,000 |
|
7 |
|
97.3 |
|
97.3 |
|
96.7 |
|
96.7 |
|
96.4 |
|
44,530,764 |
|
8.7 |
|
7.9 |
|
31 |
| |
|
810 Seventh Avenue |
|
100.0 |
|
Times Square |
|
Fee Interest |
|
692,000 |
|
6 |
|
84.8 |
|
85.6 |
|
81.0 |
|
83.4 |
|
84.2 |
|
38,278,130 |
|
7.5 |
|
6.8 |
|
47 |
| |
|
919 Third Avenue |
|
51.0 |
|
Grand Central North |
|
Fee Interest |
|
1,454,000 |
|
12 |
|
100.0 |
|
90.3 |
|
90.3 |
|
90.3 |
|
90.3 |
|
92,598,797 |
|
|
|
8.4 |
|
11 |
| |
|
1185 Avenue of the Americas |
|
100.0 |
|
Rockefeller Center |
|
Leasehold Interest |
|
1,062,000 |
|
9 |
|
99.9 |
|
99.9 |
|
99.9 |
|
99.9 |
|
99.9 |
|
88,537,145 |
|
17.3 |
|
15.7 |
|
19 |
| |
|
1350 Avenue of the Americas |
|
100.0 |
|
Rockefeller Center |
|
Fee Interest |
|
562,000 |
|
5 |
|
98.5 |
|
96.9 |
|
96.9 |
|
99.9 |
|
95.7 |
|
40,352,965 |
|
7.9 |
|
7.1 |
|
35 |
| |
|
Subtotal / Weighted Average |
|
|
|
|
|
|
|
8,135,645 |
|
70 |
% |
95.4 |
% |
93.6 |
% |
92.0 |
% |
92.2 |
% |
90.9 |
% |
$ |
521,110,134 |
|
83.8 |
% |
84.2 |
% |
283 |
|
|
|
|
|
|
|
|
|
|
|
|
|
|
|
|
|
|
|
|
|
|
|
|
|
|
|
|
|
|
|
| |
|
“Non Same Store” |
|
|
|
|
|
|
|
|
|
|
|
|
|
|
|
|
|
|
|
|
|
|
|
|
|
|
|
|
| |
|
635 Sixth Avenue |
|
100.0 |
|
Midtown South |
|
Fee Interest |
|
104,000 |
|
1 |
|
100.0 |
|
72.5 |
|
72.5 |
|
72.5 |
|
48.8 |
|
8,554,001 |
|
1.7 |
|
1.5 |
|
2 |
| |
|
Subtotal / Weighted Average |
|
|
|
|
|
|
|
104,000 |
|
1 |
% |
100.0 |
% |
72.5 |
% |
72.5 |
% |
72.5 |
% |
48.8 |
% |
$ |
8,554,001 |
|
2 |
% |
2 |
% |
2 |
|
|
|
|
|
|
|
|
|
|
|
|
|
|
|
|
|
|
|
|
|
|
|
|
|
|
|
|
|
|
|
| |
|
Total / Weighted Average Manhattan Consolidated Properties |
|
|
|
|
|
|
|
8,239,645 |
|
71 |
% |
95.5 |
% |
93.3 |
% |
91.7 |
% |
92.0 |
% |
90.4 |
% |
$ |
529,664,135 |
|
85.5 |
% |
|
|
285 |
|
|
Total Manhattan Consolidated Properties - SLG share of Annualized Rent |
|
|
|
|
|
|
|
|
|
|
|
|
|
|
|
|
|
$ |
484,290,724 |
|
|
|
85.7 |
% |
|
| ||||
Suburban Operating Properties - Reckson Portfolio
|
CONSOLIDATED PROPERTIES |
|
|
|
|
|
|
|
|
|
|
|
|
|
|
|
|
|
|
|
|
|
|
|
|
|
|
|
|
| |
|
“Same Store” Westchester, New York |
|
|
|
|
|
|
|
|
|
|
|
|
|
|
|
|
|
|
|
|
|
|
|
|
|
|
|
|
| |
|
1100 King Street - 1 Int’l Drive |
|
100.0 |
|
Rye Brook, New York |
|
Fee Interest |
|
90,000 |
|
1 |
|
74.8 |
|
74.8 |
|
74.8 |
|
74.8 |
|
74.8 |
|
1,754,651 |
|
0.3 |
|
0.3 |
|
2 |
| |
|
1100 King Street - 2 Int’l Drive |
|
100.0 |
|
Rye Brook, New York |
|
Fee Interest |
|
90,000 |
|
1 |
|
30.3 |
|
30.3 |
|
30.3 |
|
47.9 |
|
47.9 |
|
721,181 |
|
0.1 |
|
0.1 |
|
3 |
| |
|
1100 King Street - 3 Int’l Drive |
|
100.0 |
|
Rye Brook, New York |
|
Fee Interest |
|
90,000 |
|
1 |
|
21.7 |
|
21.7 |
|
21.7 |
|
21.7 |
|
57.2 |
|
728,586 |
|
0.1 |
|
0.1 |
|
2 |
| |
|
1100 King Street - 4 Int’l Drive |
|
100.0 |
|
Rye Brook, New York |
|
Fee Interest |
|
90,000 |
|
1 |
|
85.8 |
|
85.8 |
|
85.8 |
|
84.6 |
|
84.6 |
|
2,030,698 |
|
0.4 |
|
0.4 |
|
10 |
| |
|
1100 King Street - 5 Int’l Drive |
|
100.0 |
|
Rye Brook, New York |
|
Fee Interest |
|
90,000 |
|
1 |
|
93.1 |
|
93.1 |
|
92.0 |
|
92.0 |
|
92.0 |
|
2,056,949 |
|
0.4 |
|
0.4 |
|
9 |
| |
|
1100 King Street - 6 Int’l Drive |
|
100.0 |
|
Rye Brook, New York |
|
Fee Interest |
|
90,000 |
|
1 |
|
56.7 |
|
56.7 |
|
56.7 |
|
56.7 |
|
50.8 |
|
1,538,476 |
|
0.3 |
|
0.3 |
|
3 |
| |
|
520 White Plains Road |
|
100.0 |
|
Tarrytown, New York |
|
Fee Interest |
|
180,000 |
|
2 |
|
99.0 |
|
76.2 |
|
76.2 |
|
75.2 |
|
57.5 |
|
4,395,432 |
|
0.9 |
|
0.8 |
|
13 |
| |
|
115-117 Stevens Avenue |
|
100.0 |
|
Valhalla, New York |
|
Fee Interest |
|
178,000 |
|
2 |
|
75.6 |
|
75.6 |
|
75.1 |
|
74.3 |
|
74.8 |
|
2,851,000 |
|
0.6 |
|
0.5 |
|
10 |
| |
|
100 Summit Lake Drive |
|
100.0 |
|
Valhalla, New York |
|
Fee Interest |
|
250,000 |
|
2 |
|
72.9 |
|
72.9 |
|
72.9 |
|
70.7 |
|
70.7 |
|
4,559,478 |
|
0.9 |
|
0.8 |
|
10 |
| |
|
200 Summit Lake Drive |
|
100.0 |
|
Valhalla, New York |
|
Fee Interest |
|
245,000 |
|
2 |
|
81.1 |
|
81.1 |
|
80.2 |
|
80.2 |
|
80.2 |
|
4,809,943 |
|
0.9 |
|
0.9 |
|
8 |
| |
|
500 Summit Lake Drive |
|
100.0 |
|
Valhalla, New York |
|
Fee Interest |
|
228,000 |
|
2 |
|
96.6 |
|
96.6 |
|
97.8 |
|
97.8 |
|
96.5 |
|
5,133,593 |
|
1.0 |
|
0.9 |
|
6 |
| |
|
140 Grand Street |
|
100.0 |
|
White Plains, New York |
|
Fee Interest |
|
130,100 |
|
1 |
|
97.7 |
|
97.7 |
|
100.0 |
|
95.7 |
|
95.7 |
|
4,162,848 |
|
0.8 |
|
0.7 |
|
13 |
| |
|
360 Hamilton Avenue |
|
100.0 |
|
White Plains, New York |
|
Fee Interest |
|
384,000 |
|
3 |
|
92.3 |
|
92.3 |
|
92.3 |
|
90.9 |
|
90.2 |
|
13,201,491 |
|
2.6 |
|
2.3 |
|
19 |
| |
|
Westchester, New York Subtotal / Weighted Average |
|
|
|
|
|
2,135,100 |
|
18 |
% |
80.6 |
% |
78.7 |
% |
78.8 |
% |
78.6 |
% |
78.1 |
% |
$ |
47,944,326 |
|
9.4 |
% |
8.5 |
% |
108 |
| ||
|
|
|
|
|
|
|
|
|
|
|
|
|
|
|
|
|
|
|
|
|
|
|
|
|
|
|
|
|
|
| |
|
“Same Store” Connecticut |
|
|
|
|
|
|
|
|
|
|
|
|
|
|
|
|
|
|
|
|
|
|
|
|
|
|
|
|
| |
|
7 Landmark Square |
|
100.0 |
|
Stamford, Connecticut |
|
Fee Interest |
|
36,800 |
|
0 |
|
100.0 |
|
76.9 |
|
76.9 |
|
76.9 |
|
76.9 |
|
313,533 |
|
0.1 |
|
0.1 |
|
1 |
| |
|
680 Washington Boulevard |
|
51.0 |
|
Stamford, Connecticut |
|
Fee Interest |
|
133,000 |
|
1 |
|
88.9 |
|
80.9 |
|
80.9 |
|
77.7 |
|
77.7 |
|
5,097,741 |
|
|
|
0.5 |
|
10 |
| |
|
750 Washington Boulevard |
|
51.0 |
|
Stamford, Connecticut |
|
Fee Interest |
|
192,000 |
|
2 |
|
97.8 |
|
97.8 |
|
97.8 |
|
99.1 |
|
93.3 |
|
7,869,766 |
|
|
|
0.7 |
|
11 |
| |
|
1055 Washington Boulevard |
|
100.0 |
|
Stamford, Connecticut |
|
Leasehold Interest |
|
182,000 |
|
2 |
|
88.0 |
|
89.2 |
|
89.2 |
|
90.6 |
|
90.6 |
|
6,208,949 |
|
1.2 |
|
1.1 |
|
21 |
| |
|
1010 Washington Boulevard |
|
100.0 |
|
Stamford, Connecticut |
|
Fee Interest |
|
143,400 |
|
1 |
|
75.6 |
|
77.1 |
|
77.1 |
|
75.6 |
|
72.2 |
|
3,598,215 |
|
0.7 |
|
0.6 |
|
22 |
| |
|
Connecticut Subtotal/Weighted Average |
|
|
|
|
|
|
|
687,200 |
|
6 |
% |
89.0 |
% |
86.8 |
% |
86.8 |
% |
86.6 |
% |
84.3 |
% |
$ |
23,088,204 |
|
2.0 |
% |
3.0 |
% |
65 |
|
|
|
|
|
|
|
|
|
|
|
|
|
|
|
|
|
|
|
|
|
|
|
|
|
|
|
|
|
|
|
| |
|
“Same Store” New Jersey |
|
|
|
|
|
|
|
|
|
|
|
|
|
|
|
|
|
|
|
|
|
|
|
|
|
|
|
|
| |
|
125 Chubb Way |
|
100.0 |
|
Lyndhurst, New Jersey |
|
Fee Interest |
|
278,000 |
|
2 |
|
66.2 |
|
66.2 |
|
62.4 |
|
61.1 |
|
61.1 |
|
4,097,884 |
|
0.8 |
|
0.7 |
|
6 |
| |
|
New Jersey Subtotal / Weighted Average |
|
|
|
|
|
|
|
278,000 |
|
2 |
% |
66.2 |
% |
66.2 |
% |
62.4 |
% |
61.1 |
% |
61.1 |
% |
$ |
4,097,884 |
|
0.8 |
% |
0.7 |
% |
6 |
|
|
|
|
|
|
|
|
|
|
|
|
|
|
|
|
|
|
|
|
|
|
|
|
|
|
|
|
|
|
|
| |
|
“Same Store” Brooklyn, New York |
|
|
|
|
|
|
|
|
|
|
|
|
|
|
|
|
|
|
|
|
|
|
|
|
|
|
|
|
| |
|
16 Court Street |
|
100.0 |
|
Brooklyn, New York |
|
Fee Interest |
|
317,600 |
|
3 |
|
95.6 |
|
94.7 |
|
94.7 |
|
94.4 |
|
93.8 |
|
12,008,730 |
|
2.3 |
|
2.1 |
|
69 |
| |
|
Brooklyn, New York Subtotal / Weighted Average |
|
|
|
|
|
317,600 |
|
3 |
% |
95.6 |
% |
94.7 |
% |
94.7 |
% |
94.4 |
% |
93.8 |
% |
$ |
12,008,730 |
|
2.3 |
% |
2.1 |
% |
69 |
| ||
|
|
|
|
|
|
|
|
|
|
|
|
|
|
|
|
|
|
|
|
|
|
|
|
|
|
|
|
|
|
| |
|
Total / Weighted Average Suburban Consolidated Properties |
|
|
|
|
|
|
|
3,417,900 |
|
29 |
% |
82.5 |
% |
80.8 |
% |
80.5 |
% |
80.2 |
% |
79.4 |
% |
$ |
87,139,144 |
|
14.5 |
% |
|
|
248 |
|
|
Total Suburban Consolidated Properties - SLG share of Annualized Rent |
|
|
|
|
|
|
|
|
|
|
|
|
|
|
|
|
|
|
|
$ |
80,785,065 |
|
|
|
14.3 |
% |
|
| ||
|
|
|
|
|
|
|
|
|
|
|
|
|
|
|
|
|
|
|
|
|
|
|
|
|
|
|
|
|
|
| |
|
Reckson Operating Properties Grand Total / Weighted Average |
|
|
|
|
|
|
|
11,657,545 |
|
100 |
% |
91.7 |
% |
89.6 |
% |
88.4 |
% |
88.5 |
% |
87.2 |
% |
$ |
616,803,279 |
|
100.0 |
% |
|
|
533 |
|
|
Reckson Operating Properties Grand Total - SLG Share of Annualized Rent |
|
|
|
|
|
|
|
|
|
|
|
|
|
|
|
|
|
|
|
$ |
565,075,790 |
|
|
|
100.0 |
% |
|
| ||
|
Reckson Operating Properties Same Store Occupancy % |
|
|
|
|
|
|
|
11,553,545 |
|
99 |
% |
91.6 |
% |
89.8 |
% |
88.6 |
% |
88.7 |
% |
87.5 |
% |
|
|
|
|
|
|
|
| |
(1) The Company has an option to acquire the fee interest for a fixed price on a specific date.
(2) The Company owns 50% of the fee interest.
|
Supplemental Information |
Second Quarter 2015 |
|
|
|
|
SELECTED PROPERTY DATA
Retail, Land & Residential Properties - Reckson Portfolio |
|

|
|
|
Ownership |
|
|
|
|
|
Useable |
|
% of Total |
|
Occupancy (%) |
|
Annualized |
|
Annualized |
|
Gross Total RE |
|
Total |
| ||||||||||
|
Properties |
|
Interest (%) |
|
SubMarket |
|
Ownership |
|
Sq. Feet |
|
Sq. Feet |
|
Jun-15 |
|
Mar-15 |
|
Dec-14 |
|
Sep-14 |
|
Jun-14 |
|
Cash Rent ($’s) |
|
Cash Rent (SLG%) |
|
Book Value |
|
Tenants |
| ||
|
|
|
|
|
|
|
|
|
|
|
|
|
|
|
|
|
|
|
|
|
|
|
|
|
|
|
|
|
|
| ||
|
Retail |
|
|
|
|
|
|
|
|
|
|
|
|
|
|
|
|
|
|
|
|
|
|
|
|
|
|
|
|
| ||
|
102 Greene Street |
|
100.0 |
|
Soho |
|
Fee Interest |
|
9,200 |
|
2 |
|
54.3 |
|
77.2 |
|
100.0 |
|
N/A |
|
N/A |
|
444,117 |
|
1.5 |
|
31,331,717 |
|
1 |
| ||
|
115 Spring Street |
|
100.0 |
|
Soho |
|
Fee Interest |
|
5,218 |
|
1 |
|
100.0 |
|
100.0 |
|
100.0 |
|
100.0 |
|
N/A |
|
963,606 |
|
3.2 |
|
53,290,025 |
|
1 |
| ||
|
131-137 Spring Street |
|
100.0 |
|
Soho |
|
Fee Interest |
|
68,342 |
|
17 |
|
100.0 |
|
92.0 |
|
92.0 |
|
92.0 |
|
92.0 |
|
11,623,226 |
|
38.9 |
|
138,909,734 |
|
11 |
| ||
|
315 West 33rd Street - The Olivia |
|
100.0 |
|
Penn Station |
|
Fee Interest |
|
270,132 |
|
67 |
|
100.0 |
|
100.0 |
|
100.0 |
|
100.0 |
|
100.0 |
|
15,311,824 |
|
51.2 |
|
214,199,299 |
|
10 |
| ||
|
Williamsburg Terrace |
|
100.0 |
|
Brooklyn, New York |
|
Fee Interest |
|
52,000 |
|
13 |
|
100.0 |
|
100.0 |
|
100.0 |
|
100.0 |
|
100.0 |
|
1,561,500 |
|
5.2 |
|
16,357,696 |
|
3 |
| ||
|
Total Retail Properties |
|
|
|
|
|
|
|
404,892 |
|
100 |
% |
99.0 |
% |
98.1 |
% |
98.6 |
% |
98.6 |
% |
98.6 |
% |
$ |
29,904,273 |
|
100.0 |
% |
$ |
454,088,471 |
|
26 |
|
|
|
|
|
|
|
|
|
|
|
|
|
|
|
|
|
|
|
|
|
|
|
|
|
|
|
|
|
|
|
| ||
|
Land |
|
|
|
|
|
|
|
|
|
|
|
|
|
|
|
|
|
|
|
|
|
|
|
|
|
|
|
|
| ||
|
635 Madison Avenue |
|
100.0 |
|
Plaza District |
|
Fee Interest |
|
176,530 |
|
100 |
|
100.0 |
|
100.0 |
|
100.0 |
|
100.0 |
|
N/A |
|
3,677,574 |
|
100.0 |
|
153,745,356 |
|
|
| ||
|
Total Land Properties |
|
|
|
|
|
|
|
176,530 |
|
100 |
% |
100.0 |
% |
100.0 |
% |
100.0 |
% |
100.0 |
% |
— |
|
$ |
3,677,574 |
|
100.0 |
% |
$ |
153,745,356 |
|
|
|
Residential Properties - Reckson Portfolio
|
|
|
Ownership |
|
|
|
|
|
Useable |
|
Total |
|
Occupancy (%) |
|
Annualized |
|
Average Monthly |
|
Gross Total RE |
|
Total |
| |||||||||||
|
Properties |
|
Interest (%) |
|
SubMarket |
|
Ownership |
|
Sq. Feet |
|
Units |
|
Jun-15 |
|
Mar-15 |
|
Dec-14 |
|
Sep-14 |
|
Jun-14 |
|
Cash Rent ($’s) |
|
Rent Per Unit ($’s) |
|
Book Value |
|
Tenants |
| |||
|
315 West 33rd Street - The Olivia |
|
100.0 |
|
Penn Station |
|
Fee Interest |
|
222,855 |
|
333 |
|
96.4 |
|
96.1 |
|
95.8 |
|
96.1 |
|
91.0 |
|
14,805,720 |
|
3,856 |
|
176,711,329 |
|
321 |
| |||
|
Total Residential Properties |
|
|
|
|
|
|
|
222,855 |
|
333 |
|
96.4 |
% |
96.1 |
% |
95.8 |
% |
96.1 |
% |
91.0 |
% |
$ |
14,805,720 |
|
$ |
3,856 |
|
$ |
176,711,329 |
|
321 |
|
|
Supplemental Information |
Second Quarter 2015 |
|
LARGEST TENANTS BY SQUARE FEET LEASED
Manhattan and Suburban Properties |
|

|
|
|
|
|
|
|
|
|
|
|
|
|
|
|
|
|
% of |
|
|
| |||
|
|
|
|
|
|
|
|
|
|
|
|
|
% of |
|
SLG Share of |
|
SLG Share of |
|
|
| |||
|
|
|
|
|
Lease |
|
Total |
|
Annualized |
|
PSF |
|
Annualized |
|
Annualized |
|
Annualized |
|
Credit |
| |||
|
Tenant Name |
|
Property |
|
Expiration |
|
Square Feet |
|
Cash Rent ($) |
|
Annualized |
|
Cash Rent |
|
Cash Rent($) |
|
Cash Rent |
|
Rating (2) |
| |||
|
Citigroup, N.A. |
|
388 & 390 Greenwich Street, 485 Lexington Avenue, 750 Third Avenue, 800 Third Avenue, 750 Washington Blvd |
|
Various |
|
3,023,423 |
|
$ |
134,366,049 |
(1) |
$ |
44.44 |
|
9.3 |
% |
$ |
132,358,531 |
|
10.5 |
% |
A- |
|
|
Viacom International, Inc. |
|
1515 Broadway |
|
2031 |
|
1,330,735 |
|
82,152,769 |
|
$ |
61.73 |
|
5.7 |
% |
82,152,769 |
|
6.5 |
% |
BBB |
| ||
|
Credit Suisse Securities (USA), Inc. |
|
1 Madison Avenue & 1055 Washington Blvd |
|
2019 & 2020 |
|
1,149,406 |
|
66,666,214 |
|
$ |
58.00 |
|
4.6 |
% |
66,666,214 |
|
5.3 |
% |
A |
| ||
|
Random House, Inc. |
|
1745 Broadway |
|
2018 & 2023 |
|
644,598 |
|
42,805,380 |
|
$ |
66.41 |
|
3.0 |
% |
24,343,420 |
|
1.9 |
% |
BBB+ |
| ||
|
Debevoise & Plimpton, LLP |
|
919 Third Avenue |
|
2021 |
|
575,324 |
|
41,309,043 |
|
$ |
71.80 |
|
2.9 |
% |
21,067,612 |
|
1.7 |
% |
|
| ||
|
The City of New York |
|
16 Court Street & 100 Church Street |
|
2015, 2017 & 2034 |
|
546,075 |
|
17,991,433 |
|
$ |
32.95 |
|
1.2 |
% |
17,991,433 |
|
1.4 |
% |
Aa2 |
| ||
|
Omnicom Group, Inc. |
|
220 East 42nd Street |
|
2017 |
|
493,560 |
|
21,215,123 |
|
$ |
42.98 |
|
1.5 |
% |
21,215,123 |
|
1.7 |
% |
BBB+ |
| ||
|
Ralph Lauren Corporation |
|
625 Madison Avenue |
|
2019 |
|
359,125 |
|
25,777,820 |
|
$ |
71.78 |
|
1.8 |
% |
25,777,820 |
|
2.0 |
% |
A |
| ||
|
Advance Magazine Group, Fairchild Publications |
|
750 Third Avenue & 485 Lexington Avenue |
|
2021 |
|
339,195 |
|
16,023,594 |
|
$ |
47.24 |
|
1.1 |
% |
16,023,594 |
|
1.3 |
% |
|
| ||
|
Metro-North Commuter Railroad Company |
|
420 Lexington Avenue |
|
2021 & 2034 |
|
303,980 |
|
14,285,739 |
|
$ |
47.00 |
|
1.0 |
% |
14,285,739 |
|
1.1 |
% |
Aa2 |
| ||
|
C.B.S. Broadcasting, Inc. |
|
555 West 57th Street |
|
2023 |
|
295,226 |
|
12,384,088 |
|
$ |
41.95 |
|
0.9 |
% |
12,384,088 |
|
1.0 |
% |
BBB |
| ||
|
Schulte, Roth & Zabel LLP |
|
919 Third Avenue |
|
2036 |
|
263,186 |
|
17,197,773 |
|
$ |
65.34 |
|
1.2 |
% |
8,770,864 |
|
0.7 |
% |
|
| ||
|
HF Management Services LLC |
|
100 Church Street & 521 Fifth Avenue |
|
2015 & 2032 |
|
252,762 |
|
8,728,348 |
|
$ |
34.53 |
|
0.6 |
% |
8,027,439 |
|
0.6 |
% |
|
| ||
|
BMW of Manhattan |
|
555 West 57th Street |
|
2022 |
|
227,782 |
|
6,392,708 |
|
$ |
28.07 |
|
0.4 |
% |
6,392,708 |
|
0.5 |
% |
A+ |
| ||
|
The City University of New York - CUNY |
|
555 West 57th Street & 16 Court Street |
|
2020, 2024 & 2030 |
|
227,622 |
|
9,336,005 |
|
$ |
41.02 |
|
0.6 |
% |
9,336,005 |
|
0.7 |
% |
Aa2 |
| ||
|
Bloomberg LP |
|
919 Third Avenue |
|
2029 |
|
201,849 |
|
10,043,587 |
|
$ |
49.76 |
|
0.7 |
% |
5,122,229 |
|
0.4 |
% |
|
| ||
|
Newmark & Company Real Estate Inc. |
|
125 Park Avenue, 110 East 42nd Street & The Meadows |
|
2016, 2024 & 2031 |
|
193,962 |
|
9,920,720 |
|
$ |
51.15 |
|
0.7 |
% |
9,544,439 |
|
0.8 |
% |
BBB- |
| ||
|
Amerada Hess Corp. |
|
1185 Avenue of the Americas |
|
2027 |
|
181,569 |
|
13,781,826 |
|
$ |
75.90 |
|
1.0 |
% |
13,781,826 |
|
1.1 |
% |
BBB |
| ||
|
The Travelers Indemnity Company |
|
485 Lexington Avenue |
|
2021 |
|
173,278 |
|
10,023,120 |
|
$ |
57.84 |
|
0.7 |
% |
10,023,120 |
|
0.8 |
% |
AA |
| ||
|
Verizon |
|
120 West 45th Street, 1100 King Street Bldg 1, 1 Landmark Square, 2 Landmark Square & 500 Summit Lake Drive |
|
Various |
|
172,102 |
|
5,177,489 |
|
$ |
30.08 |
|
0.4 |
% |
5,177,489 |
|
0.4 |
% |
BBB+ |
| ||
|
United Nations |
|
220 East 42nd Street |
|
2017, 2021 & 2022 |
|
171,091 |
|
8,120,827 |
|
$ |
47.46 |
|
0.6 |
% |
8,120,827 |
|
0.6 |
% |
|
| ||
|
News America Incorporated |
|
1185 Avenue of the Americas |
|
2020 |
|
161,722 |
|
15,060,624 |
|
$ |
93.13 |
|
1.0 |
% |
15,060,624 |
|
1.2 |
% |
BBB+ |
| ||
|
King & Spalding |
|
1185 Avenue of the Americas |
|
2025 |
|
159,943 |
|
14,118,433 |
|
$ |
88.27 |
|
1.0 |
% |
14,118,433 |
|
1.1 |
% |
|
| ||
|
Young & Rubicam, Inc. |
|
3 Columbus Circle |
|
2033 |
|
159,292 |
|
9,909,020 |
|
$ |
62.21 |
|
0.7 |
% |
4,845,511 |
|
0.4 |
% |
BBB |
| ||
|
Amazon Corporate LLC |
|
1185 Avenue of the Americas & 1350 Avenue of the Americas |
|
2016, 2019 & 2023 |
|
158,688 |
|
11,200,924 |
|
$ |
70.58 |
|
0.8 |
% |
11,200,924 |
|
0.9 |
% |
AA- |
| ||
|
Bloomingdales, Inc. |
|
919 Third Avenue |
|
2024 |
|
157,961 |
|
8,885,197 |
|
$ |
56.25 |
|
0.6 |
% |
4,531,451 |
|
0.4 |
% |
BBB+ |
| ||
|
National Hockey League |
|
1185 Avenue of the Americas |
|
2022 |
|
148,217 |
|
12,963,908 |
|
$ |
87.47 |
|
0.9 |
% |
12,963,908 |
|
1.0 |
% |
|
| ||
|
Beth Israel Medical Center & The Mount Sinai Hospital |
|
555 West 57th Street & 625 Madison Avenue |
|
2030 & 2031 |
|
147,613 |
|
7,176,730 |
|
$ |
48.62 |
|
0.5 |
% |
7,176,730 |
|
0.6 |
% |
|
| ||
|
BNP Paribas |
|
919 Third Avenue |
|
2016 |
|
145,834 |
|
9,825,665 |
|
$ |
67.38 |
|
0.7 |
% |
5,011,089 |
|
0.4 |
% |
A+ |
| ||
|
Eisner Amper, LLP |
|
750 Third Avenue |
|
2020 |
|
141,546 |
|
9,646,708 |
|
$ |
68.15 |
|
0.7 |
% |
9,646,708 |
|
0.8 |
% |
|
| ||
|
|
|
|
|
|
|
|
|
|
|
|
|
|
|
|
|
|
|
|
| |||
|
Total |
|
|
|
|
|
12,506,666 |
|
$ |
672,486,863 |
|
$ |
53.77 |
|
46.5 |
% |
$ |
603,118,666 |
|
47.7 |
% |
|
|
(1) Reflects the net rent as of June 30, 2015 of $42.70 PSF for the 388-390 Greenwich Street lease.
(2) Corporate or bond rating from S&P or Moody’s.
|
Supplemental Information |
Second Quarter 2015 |
|
TENANT DIVERSIFICATION |
|
|
| |
|
| |
|
Based on SLG Share of Annualized Cash Rent |

|
Category |
|
Manhattan Properties |
|
Suburban Properties |
|
|
Arts, Ent. & Recreation |
|
4.2 |
% |
0.1 |
% |
|
Business Services |
|
2.8 |
% |
3.9 |
% |
|
Financial Services |
|
32.9 |
% |
30.1 |
% |
|
Government / Non Profit |
|
3.5 |
% |
5.7 |
% |
|
Legal |
|
7.8 |
% |
10.8 |
% |
|
Manufacturing |
|
2.2 |
% |
10.2 |
% |
|
Medical |
|
2.2 |
% |
4.6 |
% |
|
Other |
|
5.4 |
% |
3.3 |
% |
|
Professional Services |
|
5.8 |
% |
13.3 |
% |
|
Retail |
|
9.2 |
% |
3.1 |
% |
|
|
|
|
|
|
|
|
TAMI |
|
|
|
|
|
|
Technology |
|
1.6 |
% |
3.2 |
% |
|
Advertising |
|
5.2 |
% |
1.0 |
% |
|
Media |
|
16.8 |
% |
10.7 |
% |
|
Information |
|
0.4 |
% |
0.1 |
% |
|
|
|
|
|
|
|
|
Total |
|
100.0 |
% |
100.0 |
% |
|
Supplemental Information |
Second Quarter 2015 |
|
LEASING ACTIVITY - Manhattan Operating Properties |
|
|
| |
|
| |
|
Available Space |

|
Activity |
|
Building Address |
|
# of Leases |
|
Useable SF |
|
Rentable SF |
|
Escalated |
| |
|
|
|
|
|
|
|
|
|
|
|
|
| |
|
Available Space at 3/31/15 |
|
|
|
|
|
877,670 |
|
|
|
|
| |
|
|
|
|
|
|
|
|
|
|
|
|
| |
|
Add: Property no longer in redevelopment |
|
635 Sixth Avenue |
|
|
|
28,555 |
|
|
|
|
| |
|
|
|
|
|
|
|
|
|
|
|
|
| |
|
Space which became available during the Quarter (2): |
|
|
|
|
|
|
|
|
| |||
|
Office |
|
|
|
|
|
|
|
|
|
|
| |
|
|
|
110 East 42nd Street |
|
1 |
|
2,313 |
|
2,313 |
|
$ |
54.38 |
|
|
|
|
120 West 45th Street |
|
3 |
|
36,994 |
|
36,994 |
|
$ |
67.90 |
|
|
|
|
125 Park Avenue |
|
1 |
|
11,027 |
|
12,437 |
|
$ |
68.00 |
|
|
|
|
220 East 42nd Street |
|
1 |
|
15,338 |
|
15,338 |
|
$ |
54.36 |
|
|
|
|
315 West 36th Street |
|
4 |
|
103,010 |
|
104,210 |
|
$ |
35.07 |
|
|
|
|
420 Lexington Avenue |
|
6 |
|
17,007 |
|
25,687 |
|
$ |
55.23 |
|
|
|
|
521 Fifth Avenue |
|
2 |
|
6,089 |
|
6,089 |
|
$ |
49.80 |
|
|
|
|
600 Lexington Avenue |
|
2 |
|
17,750 |
|
17,750 |
|
$ |
77.27 |
|
|
|
|
711 Third Avenue |
|
1 |
|
2,886 |
|
3,141 |
|
$ |
51.22 |
|
|
|
|
800 Third Avenue |
|
1 |
|
2,837 |
|
2,837 |
|
$ |
53.44 |
|
|
|
|
810 Seventh Avenue |
|
1 |
|
5,457 |
|
5,457 |
|
$ |
56.07 |
|
|
|
|
919 Third Avenue |
|
1 |
|
44,029 |
|
44,029 |
|
$ |
70.62 |
|
|
|
|
Total/Weighted Average |
|
24 |
|
264,737 |
|
276,282 |
|
$ |
53.54 |
|
|
|
|
|
|
|
|
|
|
|
|
|
| |
|
Retail |
|
|
|
|
|
|
|
|
|
|
| |
|
|
|
304 Park Avenue South |
|
1 |
|
3,300 |
|
3,300 |
|
$ |
99.79 |
|
|
|
|
625 Madison Avenue |
|
1 |
|
625 |
|
625 |
|
$ |
243.20 |
|
|
|
|
919 Third Avenue |
|
1 |
|
718 |
|
718 |
|
$ |
6.40 |
|
|
|
|
Total/Weighted Average |
|
3 |
|
4,643 |
|
4,643 |
|
$ |
104.65 |
|
|
|
|
|
|
|
|
|
|
|
|
|
| |
|
Storage |
|
|
|
|
|
|
|
|
|
|
| |
|
|
|
125 Park Avenue |
|
2 |
|
1,724 |
|
2,046 |
|
$ |
24.54 |
|
|
|
|
521 Fifth Avenue |
|
1 |
|
239 |
|
239 |
|
$ |
27.76 |
|
|
|
|
Total/Weighted Average |
|
3 |
|
1,963 |
|
2,285 |
|
$ |
24.88 |
|
|
|
|
|
|
|
|
|
|
|
|
|
| |
|
|
|
Total Space which became available during the Quarter |
|
|
|
|
| |||||
|
|
|
Office |
|
24 |
|
264,737 |
|
276,282 |
|
$ |
53.54 |
|
|
|
|
Retail |
|
3 |
|
4,643 |
|
4,643 |
|
$ |
104.65 |
|
|
|
|
Storage |
|
3 |
|
1,963 |
|
2,285 |
|
$ |
24.88 |
|
|
|
|
|
|
30 |
|
271,343 |
|
283,210 |
|
$ |
54.15 |
|
|
|
|
|
|
|
|
|
|
|
|
|
| |
|
|
|
Total Available Space |
|
|
|
1,177,568 |
|
|
|
|
| |
(1) Escalated rent is calculated as total annual lease related income excluding electric charges.
(2) Includes expiring space, relocating tenants and move-outs where tenants vacated. Excludes lease expirations where tenants heldover.
|
Supplemental Information |
Second Quarter 2015 |
|
LEASING ACTIVITY - Manhattan Operating Properties Commenced Leasing |
|

|
Activity |
|
Building Address |
|
# of Leases |
|
Term (Yrs) |
|
Useable SF |
|
Rentable SF |
|
New Cash |
|
Prev. |
|
TI / |
|
Free Rent |
| |||
|
Available Space |
|
|
|
|
|
|
|
1,177,568 |
|
|
|
|
|
|
|
|
|
|
| |||
|
|
|
|
|
|
|
|
|
|
|
|
|
|
|
|
|
|
|
|
| |||
|
Office |
|
|
|
|
|
|
|
|
|
|
|
|
|
|
|
|
|
|
| |||
|
|
|
3 Columbus Circle |
|
4 |
|
5.8 |
|
17,052 |
|
16,991 |
|
$ |
80.30 |
|
$ |
— |
|
$ |
71.40 |
|
2.1 |
|
|
|
|
100 Park Avenue |
|
1 |
|
4.1 |
|
2,628 |
|
2,677 |
|
$ |
74.00 |
|
$ |
— |
|
$ |
92.17 |
|
2.0 |
|
|
|
|
110 East 42nd Street |
|
2 |
|
5.0 |
|
3,555 |
|
3,653 |
|
$ |
55.70 |
|
$ |
53.92 |
|
$ |
13.14 |
|
1.0 |
|
|
|
|
120 West 45th Street |
|
5 |
|
2.0 |
|
35,735 |
|
36,741 |
|
$ |
63.23 |
|
$ |
61.32 |
|
$ |
0.03 |
|
0.8 |
|
|
|
|
220 East 42nd Street |
|
1 |
|
5.2 |
|
6,240 |
|
6,447 |
|
$ |
60.50 |
|
$ |
— |
|
$ |
10.89 |
|
2.0 |
|
|
|
|
315 West 36th Street |
|
2 |
|
15.9 |
|
120,179 |
|
117,411 |
|
$ |
50.00 |
|
$ |
37.27 |
|
$ |
95.00 |
|
11.0 |
|
|
|
|
420 Lexington Avenue |
|
6 |
|
15.7 |
|
42,483 |
|
55,678 |
|
$ |
56.85 |
|
$ |
48.94 |
|
$ |
46.90 |
|
4.1 |
|
|
|
|
600 Lexington Avenue |
|
2 |
|
6.4 |
|
18,864 |
|
19,343 |
|
$ |
68.46 |
|
$ |
— |
|
$ |
93.59 |
|
1.1 |
|
|
|
|
800 Third Avenue |
|
2 |
|
5.6 |
|
7,797 |
|
7,275 |
|
$ |
70.76 |
|
$ |
53.44 |
|
$ |
— |
|
1.9 |
|
|
|
|
919 Third Avenue |
|
2 |
|
13.7 |
|
185,289 |
|
201,131 |
|
$ |
58.80 |
|
$ |
64.51 |
|
$ |
65.51 |
|
9.1 |
|
|
|
|
1350 Avenue of the Americas |
|
2 |
|
8.2 |
|
9,087 |
|
9,155 |
|
$ |
77.81 |
|
$ |
61.40 |
|
$ |
14.51 |
|
3.9 |
|
|
|
|
Total/Weighted Average |
|
29 |
|
12.5 |
|
448,909 |
|
476,502 |
|
$ |
58.54 |
|
$ |
48.74 |
|
$ |
63.93 |
|
7.4 |
|
|
|
|
|
|
|
|
|
|
|
|
|
|
|
|
|
|
|
|
|
| |||
|
Retail |
|
|
|
|
|
|
|
|
|
|
|
|
|
|
|
|
|
|
| |||
|
|
|
461 Fifth Avenue |
|
1 |
|
10.5 |
|
1,850 |
|
1,751 |
|
$ |
400.00 |
|
$ |
202.67 |
|
$ |
— |
|
6.0 |
|
|
|
|
625 Madison Avenue |
|
2 |
|
10.5 |
|
3,423 |
|
3,372 |
|
$ |
1,232.08 |
|
$ |
253.76 |
|
$ |
148.28 |
|
5.8 |
|
|
|
|
635 Sixth Avenue |
|
1 |
|
15.0 |
|
28,555 |
|
23,250 |
|
$ |
133.10 |
|
$ |
— |
|
$ |
124.70 |
|
— |
|
|
|
|
641 Sixth Avenue |
|
1 |
|
15.0 |
|
12,900 |
|
12,916 |
|
$ |
133.10 |
|
$ |
— |
|
$ |
124.70 |
|
— |
|
|
|
|
919 Third Avenue |
|
1 |
|
13.8 |
|
718 |
|
718 |
|
$ |
34.82 |
|
$ |
6.40 |
|
$ |
— |
|
— |
|
|
|
|
1515 Broadway |
|
1 |
|
10.0 |
|
4,400 |
|
7,020 |
|
$ |
986.47 |
|
$ |
392.91 |
|
$ |
148.73 |
|
4.0 |
|
|
|
|
Total/Weighted Average |
|
7 |
|
13.8 |
|
51,846 |
|
49,027 |
|
$ |
338.97 |
|
$ |
324.12 |
|
$ |
123.48 |
|
1.2 |
|
|
|
|
|
|
|
|
|
|
|
|
|
|
|
|
|
|
|
|
|
| |||
|
Storage |
|
|
|
|
|
|
|
|
|
|
|
|
|
|
|
|
|
|
| |||
|
|
|
125 Park Avenue |
|
2 |
|
11.6 |
|
3,057 |
|
3,241 |
|
$ |
15.50 |
|
$ |
— |
|
$ |
— |
|
— |
|
|
|
|
220 East 42nd Street |
|
1 |
|
5.2 |
|
323 |
|
528 |
|
$ |
20.00 |
|
$ |
— |
|
$ |
— |
|
2.0 |
|
|
|
|
461 Fifth Avenue |
|
1 |
|
10.5 |
|
740 |
|
867 |
|
$ |
35.00 |
|
$ |
— |
|
$ |
— |
|
6.0 |
|
|
|
|
Total/Weighted Average |
|
4 |
|
10.6 |
|
4,120 |
|
4,636 |
|
$ |
19.66 |
|
$ |
— |
|
$ |
— |
|
1.3 |
|
|
|
|
|
|
|
|
|
|
|
|
|
|
|
|
|
|
|
|
|
| |||
|
Leased Space |
|
|
|
|
|
|
|
|
|
|
|
|
|
|
|
|
|
|
| |||
|
|
|
Office (3) |
|
29 |
|
12.5 |
|
448,909 |
|
476,502 |
|
$ |
58.54 |
|
$ |
48.74 |
|
$ |
63.93 |
|
7.4 |
|
|
|
|
Retail |
|
7 |
|
13.8 |
|
51,846 |
|
49,027 |
|
$ |
338.97 |
|
$ |
324.12 |
|
$ |
123.48 |
|
1.2 |
|
|
|
|
Storage |
|
4 |
|
10.6 |
|
4,120 |
|
4,636 |
|
$ |
19.66 |
|
$ |
— |
|
$ |
— |
|
1.3 |
|
|
|
|
Total |
|
40 |
|
12.6 |
|
504,875 |
|
530,165 |
|
$ |
84.13 |
|
$ |
61.53 |
|
$ |
68.88 |
|
6.8 |
|
|
|
|
|
|
|
|
|
|
|
|
|
|
|
|
|
|
|
|
|
| |||
|
Total Available Space as of 6/30/15 |
|
|
|
|
|
672,693 |
|
|
|
|
|
|
|
|
|
|
| |||||
|
|
|
|
|
|
|
|
|
|
|
|
|
|
|
|
|
|
|
|
| |||
|
Early Renewals |
|
|
|
|
|
|
|
|
|
|
|
|
|
|
|
|
|
|
| |||
|
Office |
|
|
|
|
|
|
|
|
|
|
|
|
|
|
|
|
|
|
| |||
|
|
|
3 Columbus Circle |
|
1 |
|
5.0 |
|
2,946 |
|
3,798 |
|
$ |
64.00 |
|
$ |
45.88 |
|
$ |
5.63 |
|
— |
|
|
|
|
110 East 42nd Street |
|
2 |
|
2.4 |
|
19,226 |
|
19,790 |
|
$ |
58.08 |
|
$ |
57.32 |
|
$ |
5.70 |
|
0.4 |
|
|
|
|
125 Park Avenue |
|
1 |
|
10.0 |
|
30,365 |
|
30,365 |
|
$ |
79.00 |
|
$ |
76.02 |
|
$ |
14.82 |
|
— |
|
|
|
|
420 Lexington Avenue |
|
4 |
|
3.8 |
|
5,119 |
|
6,536 |
|
$ |
54.37 |
|
$ |
46.07 |
|
$ |
1.90 |
|
1.0 |
|
|
|
|
600 Lexington Avenue |
|
2 |
|
5.2 |
|
8,445 |
|
8,462 |
|
$ |
64.58 |
|
$ |
73.00 |
|
$ |
5.27 |
|
1.9 |
|
|
|
|
625 Madison Avenue |
|
1 |
|
1.0 |
|
4,000 |
|
4,000 |
|
$ |
82.00 |
|
$ |
69.45 |
|
$ |
— |
|
— |
|
|
|
|
641 Sixth Avenue |
|
1 |
|
1.0 |
|
12,000 |
|
13,090 |
|
$ |
88.00 |
|
$ |
40.90 |
|
$ |
— |
|
— |
|
|
|
|
1350 Avenue of the Americas |
|
1 |
|
5.0 |
|
3,580 |
|
3,676 |
|
$ |
70.00 |
|
$ |
60.30 |
|
$ |
10.00 |
|
1.0 |
|
|
|
|
1515 Broadway |
|
1 |
|
4.8 |
|
6,732 |
|
7,213 |
|
$ |
62.00 |
|
$ |
59.47 |
|
$ |
10.00 |
|
3.0 |
|
|
|
|
Total/Weighted Average |
|
14 |
|
5.3 |
|
92,413 |
|
96,930 |
|
$ |
70.95 |
|
$ |
61.90 |
|
$ |
7.74 |
|
0.6 |
|
|
|
|
|
|
|
|
|
|
|
|
|
|
|
|
|
|
|
|
|
| |||
|
Retail |
|
|
|
|
|
|
|
|
|
|
|
|
|
|
|
|
|
|
| |||
|
|
|
1515 Broadway |
|
1 |
|
10.0 |
|
72,355 |
|
70,145 |
|
$ |
47.76 |
|
$ |
40.58 |
|
$ |
— |
|
— |
|
|
|
|
Total/Weighted Average |
|
1 |
|
10.0 |
|
72,355 |
|
70,145 |
|
$ |
47.76 |
|
$ |
40.58 |
|
$ |
— |
|
— |
|
|
|
|
|
|
|
|
|
|
|
|
|
|
|
|
|
|
|
|
|
| |||
|
Storage |
|
|
|
|
|
|
|
|
|
|
|
|
|
|
|
|
|
|
| |||
|
|
|
625 Madison Avenue |
|
1 |
|
1.0 |
|
612 |
|
612 |
|
$ |
25.00 |
|
$ |
25.00 |
|
$ |
— |
|
— |
|
|
|
|
Total/Weighted Average |
|
1 |
|
1.0 |
|
612 |
|
612 |
|
$ |
25.00 |
|
$ |
25.00 |
|
$ |
— |
|
— |
|
|
|
|
|
|
|
|
|
|
|
|
|
|
|
|
|
|
|
|
|
| |||
|
Renewals |
|
|
|
|
|
|
|
|
|
|
|
|
|
|
|
|
|
|
| |||
|
|
|
Early Renewals Office |
|
14 |
|
5.3 |
|
92,413 |
|
96,930 |
|
$ |
70.95 |
|
$ |
61.90 |
|
$ |
7.74 |
|
0.6 |
|
|
|
|
Early Renewals Retail |
|
1 |
|
10.0 |
|
72,355 |
|
70,145 |
|
$ |
47.76 |
|
$ |
40.58 |
|
$ |
— |
|
— |
|
|
|
|
Early Renewals Storage |
|
1 |
|
1.0 |
|
612 |
|
612 |
|
$ |
25.00 |
|
$ |
25.00 |
|
$ |
— |
|
— |
|
|
|
|
Total |
|
16 |
|
7.2 |
|
165,380 |
|
167,687 |
|
$ |
61.08 |
|
$ |
52.85 |
|
$ |
4.47 |
|
0.3 |
|
(1) Annual initial base rent.
(2) Escalated rent is calculated as total annual lease related income excluding electric charges.
(3) Average starting office rent excluding new tenants replacing vacancies is $57.31/rsf for 207,056 rentable SF.
Average starting office rent for office space (leased and early renewals, excluding new tenants replacing vacancies) is $61.66/rsf for 303,986 rentable SF.
|
Supplemental Information |
Second Quarter 2015 |
|
LEASING ACTIVITY - Suburban Operating Properties Available Space |
|

|
Activity |
|
Building Address |
|
# of Leases |
|
Useable SF |
|
Rentable SF |
|
Escalated |
| |
|
|
|
|
|
|
|
|
|
|
|
|
| |
|
Available Space at 3/31/15 |
|
|
|
|
|
1,221,031 |
|
|
|
|
| |
|
|
|
|
|
|
|
|
|
|
|
|
| |
|
Add: Properties no longer in redevelopment |
|
150 Grand Street, White Plains, New York |
|
|
|
49,516 |
|
|
|
|
| |
|
|
|
7 Renaissance Square, White Plains, New York |
|
|
|
14,994 |
|
|
|
|
| |
|
|
|
|
|
|
|
|
|
|
|
|
| |
|
Space which became available during the Quarter (2): |
|
|
|
|
|
|
|
|
| |||
|
Office |
|
|
|
|
|
|
|
|
|
|
| |
|
|
|
140 Grand Street, White Plains, New York |
|
1 |
|
2,265 |
|
2,265 |
|
$ |
37.73 |
|
|
|
|
1 Landmark Square, Stamford, Connecticut |
|
2 |
|
3,520 |
|
3,520 |
|
$ |
37.73 |
|
|
|
|
2 Landmark Square, Stamford, Connecticut |
|
1 |
|
5,189 |
|
5,189 |
|
$ |
40.29 |
|
|
|
|
6 Landmark Square, Stamford, Connecticut |
|
1 |
|
10,074 |
|
10,074 |
|
$ |
43.97 |
|
|
|
|
1010 Washington Boulevard, Stamford, Connecticut |
|
3 |
|
4,608 |
|
4,608 |
|
$ |
32.50 |
|
|
|
|
1055 Washington Boulevard, Stamford, Connecticut |
|
1 |
|
4,125 |
|
4,125 |
|
$ |
36.29 |
|
|
|
|
The Meadows, Rutherford, New Jersey |
|
3 |
|
18,759 |
|
18,904 |
|
$ |
26.84 |
|
|
|
|
16 Court Street, Brooklyn, New York |
|
3 |
|
5,391 |
|
5,713 |
|
$ |
36.83 |
|
|
|
|
Total/Weighted Average |
|
15 |
|
53,931 |
|
54,398 |
|
$ |
34.70 |
|
|
Storage |
|
|
|
|
|
|
|
|
|
|
| |
|
|
|
|
|
|
|
|
|
|
|
|
| |
|
|
|
1 Landmark Square, Stamford, Connecticut |
|
2 |
|
300 |
|
300 |
|
$ |
12.00 |
|
|
|
|
Total/Weighted Average |
|
2 |
|
300 |
|
300 |
|
$ |
12.00 |
|
|
|
|
|
|
|
|
|
|
|
|
|
| |
|
|
|
Total Space which became available during the Quarter |
|
|
|
|
|
|
|
|
| |
|
|
|
Office |
|
15 |
|
53,931 |
|
54,398 |
|
$ |
34.70 |
|
|
|
|
Storage |
|
2 |
|
300 |
|
300 |
|
$ |
12.00 |
|
|
|
|
|
|
17 |
|
54,231 |
|
54,698 |
|
$ |
34.57 |
|
|
|
|
|
|
|
|
|
|
|
|
|
| |
|
|
|
Total Available Space |
|
|
|
1,339,772 |
|
|
|
|
| |
(1) Escalated rent is calculated as total annual lease related income excluding electric charges.
(2) Includes expiring space, relocating tenants and move-outs where tenants vacated. Excludes lease expirations where tenants heldover.
|
Supplemental Information |
Second Quarter 2015 |
|
LEASING ACTIVITY - Suburban Operating Properties
Commenced Leasing |
|

|
Activity |
|
Building Address |
|
# of Leases |
|
Term (Yrs) |
|
Useable SF |
|
Rentable SF |
|
New Cash |
|
Prev. |
|
TI / |
|
Free Rent |
| |||
|
|
|
|
|
|
|
|
|
|
|
|
|
|
|
|
|
|
|
|
| |||
|
Available Space |
|
|
|
|
|
|
|
1,339,772 |
|
|
|
|
|
|
|
|
|
|
| |||
|
|
|
|
|
|
|
|
|
|
|
|
|
|
|
|
|
|
|
|
| |||
|
Office |
|
|
|
|
|
|
|
|
|
|
|
|
|
|
|
|
|
|
| |||
|
|
|
520 White Plains Road, Tarrytown, New York |
|
2 |
|
9.7 |
|
40,696 |
|
34,176 |
|
$ |
23.27 |
|
$ |
— |
|
$ |
55.22 |
|
10.4 |
|
|
|
|
140 Grand Street, White Plains, New York |
|
1 |
|
1.1 |
|
2,265 |
|
2,265 |
|
$ |
37.73 |
|
$ |
37.73 |
|
$ |
— |
|
— |
|
|
|
|
150 Grand Street, White Plains, New York |
|
3 |
|
16.0 |
|
29,666 |
|
28,665 |
|
$ |
20.44 |
|
$ |
23.27 |
|
$ |
47.79 |
|
17.1 |
|
|
|
|
7 Renaissance Square, White Plains, New York |
|
1 |
|
10.6 |
|
7,860 |
|
7,426 |
|
$ |
34.00 |
|
$ |
— |
|
$ |
55.00 |
|
7.0 |
|
|
|
|
1 Landmark Square, Stamford, Connecticut |
|
1 |
|
7.1 |
|
8,621 |
|
8,621 |
|
$ |
42.00 |
|
$ |
35.61 |
|
$ |
55.00 |
|
1.0 |
|
|
|
|
2 Landmark Square, Stamford, Connecticut |
|
1 |
|
3.2 |
|
1,108 |
|
1,108 |
|
$ |
33.00 |
|
$ |
32.12 |
|
$ |
7.00 |
|
2.0 |
|
|
|
|
3 Landmark Square, Stamford, Connecticut |
|
2 |
|
6.5 |
|
13,810 |
|
14,110 |
|
$ |
26.03 |
|
$ |
— |
|
$ |
12.76 |
|
6.0 |
|
|
|
|
7 Landmark Square, Stamford, Connecticut |
|
1 |
|
15.0 |
|
8,500 |
|
7,900 |
|
$ |
40.00 |
|
$ |
— |
|
$ |
75.00 |
|
— |
|
|
|
|
680 Washington Boulevard, Stamford, Connecticut |
|
1 |
|
10.6 |
|
10,634 |
|
10,634 |
|
$ |
40.00 |
|
$ |
— |
|
$ |
55.00 |
|
7.0 |
|
|
|
|
1010 Washington Boulevard, Stamford, Connecticut |
|
2 |
|
5.2 |
|
2,473 |
|
2,473 |
|
$ |
34.01 |
|
$ |
32.82 |
|
$ |
9.14 |
|
2.9 |
|
|
|
|
1055 Washington Boulevard, Stamford, Connecticut |
|
1 |
|
3.0 |
|
1,969 |
|
1,969 |
|
$ |
40.00 |
|
$ |
— |
|
$ |
45.48 |
|
— |
|
|
|
|
The Meadows, Rutherford, New Jersey |
|
3 |
|
2.3 |
|
18,405 |
|
17,947 |
|
$ |
22.02 |
|
$ |
27.57 |
|
$ |
12.47 |
|
1.9 |
|
|
|
|
Jericho Plaza, Jericho, New York |
|
1 |
|
10.2 |
|
1,646 |
|
1,729 |
|
$ |
32.50 |
|
$ |
— |
|
$ |
40.00 |
|
2.0 |
|
|
|
|
16 Court Street, Brooklyn, New York |
|
4 |
|
9.0 |
|
8,128 |
|
9,605 |
|
$ |
47.16 |
|
$ |
33.16 |
|
$ |
22.63 |
|
2.6 |
|
|
|
|
Total/Weighted Average |
|
24 |
|
9.6 |
|
155,781 |
|
148,628 |
|
$ |
28.89 |
|
$ |
31.19 |
|
$ |
41.23 |
|
7.7 |
|
|
|
|
|
|
|
|
|
|
|
|
|
|
|
|
|
|
|
|
|
| |||
|
Storage |
|
|
|
|
|
|
|
|
|
|
|
|
|
|
|
|
|
|
| |||
|
|
|
520 White Plains Road, Tarrytown, New York |
|
1 |
|
10.2 |
|
400 |
|
400 |
|
$ |
13.00 |
|
$ |
— |
|
$ |
— |
|
— |
|
|
|
|
5 Landmark Square, Stamford, Connecticut |
|
1 |
|
5.2 |
|
200 |
|
220 |
|
$ |
15.00 |
|
$ |
— |
|
$ |
— |
|
— |
|
|
|
|
Total/Weighted Average |
|
2 |
|
8.4 |
|
600 |
|
620 |
|
$ |
13.71 |
|
$ |
— |
|
$ |
— |
|
— |
|
|
|
|
|
|
|
|
|
|
|
|
|
|
|
|
|
|
|
|
|
| |||
|
Leased Space |
|
|
|
|
|
|
|
|
|
|
|
|
|
|
|
|
|
|
| |||
|
|
|
Office (3) |
|
24 |
|
9.6 |
|
155,781 |
|
148,628 |
|
$ |
28.89 |
|
$ |
31.19 |
|
$ |
41.23 |
|
7.7 |
|
|
|
|
Storage |
|
2 |
|
8.4 |
|
600 |
|
620 |
|
$ |
13.71 |
|
$ |
— |
|
$ |
— |
|
— |
|
|
|
|
Total |
|
26 |
|
9.6 |
|
156,381 |
|
149,248 |
|
$ |
28.83 |
|
$ |
31.19 |
|
$ |
41.06 |
|
7.6 |
|
|
|
|
|
|
|
|
|
|
|
|
|
|
|
|
|
|
|
|
|
| |||
|
Total Available Space as of 6/30/15 |
|
|
|
|
|
1,183,391 |
|
|
|
|
|
|
|
|
|
|
| |||||
|
|
|
|
|
|
|
|
|
|
|
|
|
|
|
|
|
|
|
|
| |||
|
Early Renewals |
| |||||||||||||||||||||
|
Office |
|
|
|
|
|
|
|
|
|
|
|
|
|
|
|
|
|
|
| |||
|
|
|
100 Summit Lake Drive, Valhalla, New York |
|
1 |
|
3.8 |
|
6,365 |
|
6,365 |
|
$ |
30.00 |
|
$ |
27.00 |
|
$ |
5.35 |
|
— |
|
|
|
|
200 Summit Lake Drive, Valhalla, New York |
|
1 |
|
3.3 |
|
2,512 |
|
2,512 |
|
$ |
25.25 |
|
$ |
27.64 |
|
$ |
6.42 |
|
3.0 |
|
|
|
|
360 Hamilton Avenue, White Plains, New York |
|
1 |
|
5.3 |
|
16,197 |
|
16,197 |
|
$ |
36.00 |
|
$ |
37.75 |
|
$ |
15.00 |
|
3.0 |
|
|
|
|
1 Landmark Square, Stamford, Connecticut |
|
1 |
|
1.5 |
|
4,966 |
|
4,966 |
|
$ |
34.50 |
|
$ |
34.50 |
|
$ |
— |
|
1.0 |
|
|
|
|
750 Washington Boulevard, Stamford, Connecticut |
|
1 |
|
5.3 |
|
27,321 |
|
27,321 |
|
$ |
47.00 |
|
$ |
49.30 |
|
$ |
15.00 |
|
3.0 |
|
|
|
|
The Meadows, Rutherford, New Jersey |
|
3 |
|
3.3 |
|
7,783 |
|
7,994 |
|
$ |
32.12 |
|
$ |
29.07 |
|
$ |
— |
|
— |
|
|
|
|
Total/Weighted Average |
|
8 |
|
4.5 |
|
65,144 |
|
65,355 |
|
$ |
39.01 |
|
$ |
39.83 |
|
$ |
10.76 |
|
2.2 |
|
|
|
|
|
|
|
|
|
|
|
|
|
|
|
|
|
|
|
|
|
| |||
|
Storage |
|
|
|
|
|
|
|
|
|
|
|
|
|
|
|
|
|
|
| |||
|
|
|
100 Summit Lake Drive, Valhalla, New York |
|
1 |
|
3.8 |
|
125 |
|
125 |
|
$ |
10.00 |
|
10.00 |
|
$ |
— |
|
— |
| |
|
|
|
Total/Weighted Average |
|
1 |
|
3.8 |
|
125 |
|
125 |
|
$ |
10.00 |
|
$ |
10.00 |
|
$ |
— |
|
— |
|
|
|
|
|
|
|
|
|
|
|
|
|
|
|
|
|
|
|
|
|
| |||
|
Renewals |
|
|
|
|
|
|
|
|
|
|
|
|
|
|
|
|
|
|
| |||
|
|
|
Early Renewals Office |
|
8 |
|
4.5 |
|
65,144 |
|
65,355 |
|
$ |
39.01 |
|
$ |
39.83 |
|
$ |
10.76 |
|
2.2 |
|
|
|
|
Early Renewals Storage |
|
1 |
|
3.8 |
|
125 |
|
125 |
|
$ |
10.00 |
|
$ |
10.00 |
|
$ |
— |
|
— |
|
|
|
|
Total |
|
9 |
|
4.5 |
|
65,269 |
|
65,480 |
|
$ |
38.96 |
|
$ |
39.78 |
|
$ |
10.74 |
|
2.2 |
|
(1) Annual initial base rent.
(2) Escalated rent is calculated as total annual lease related income excluding electric charges.
(3) Average starting office rent excluding new tenants replacing vacancies is $31.43/rsf for 36,733 rentable SF.
Average starting office rent for office space (leased and early renewals, excluding new tenants replacing vacancies) is $36.28/rsf for 102,088 rentable SF.
|
Supplemental Information |
Second Quarter 2015 |
|
ANNUAL LEASE EXPIRATIONS - Manhattan Operating Properties Office, Retail and Storage Leases |
|

|
|
|
Consolidated Properties |
|
Joint Venture Properties |
| ||||||||||||||||||||||||||
|
Year of Lease |
|
Number of |
|
Rentable Square |
|
Percentage |
|
Annualized |
|
Annualized |
|
Current |
|
Number of |
|
Rentable Square |
|
Percentage of |
|
Annualized |
|
Annualized |
|
Current |
| ||||||
|
|
|
|
|
|
|
|
|
|
|
|
|
|
|
|
|
|
|
|
|
|
|
|
|
|
| ||||||
|
1st Quarter 2015 (1) |
|
5 |
|
31,067 |
|
0.17 |
% |
$ |
2,405,715 |
|
$ |
77.44 |
|
$ |
65.47 |
|
0 |
|
0 |
|
0.00 |
% |
$ |
0 |
|
$ |
0.00 |
|
$ |
0.00 |
|
|
2nd Quarter 2015 (1) |
|
2 |
|
6,135 |
|
0.03 |
% |
$ |
468,044 |
|
$ |
76.29 |
|
$ |
151.06 |
|
3 |
|
30,582 |
|
0.90 |
% |
$ |
2,047,295 |
|
$ |
66.94 |
|
$ |
66.47 |
|
|
3rd Quarter 2015 |
|
17 |
|
97,607 |
|
0.53 |
% |
$ |
4,664,213 |
|
$ |
47.79 |
|
$ |
62.52 |
|
6 |
|
41,890 |
|
1.23 |
% |
$ |
2,163,805 |
|
$ |
51.65 |
|
$ |
69.46 |
|
|
4th Quarter 2015 |
|
19 |
|
238,692 |
|
1.28 |
% |
$ |
13,727,118 |
|
$ |
57.51 |
|
$ |
64.37 |
|
9 |
|
118,012 |
|
3.47 |
% |
$ |
6,617,473 |
|
$ |
56.07 |
|
$ |
63.20 |
|
|
|
|
|
|
|
|
|
|
|
|
|
|
|
|
|
|
|
|
|
|
|
|
|
|
|
| ||||||
|
Total 2015 |
|
43 |
|
373,501 |
|
2.01 |
% |
$ |
21,265,090 |
|
$ |
56.93 |
|
$ |
65.40 |
|
18 |
|
190,484 |
|
5.61 |
% |
$ |
10,828,573 |
|
$ |
56.85 |
|
$ |
65.10 |
|
|
|
|
|
|
|
|
|
|
|
|
|
|
|
|
|
|
|
|
|
|
|
|
|
|
|
| ||||||
|
2016 |
|
78 |
|
922,159 |
|
4.96 |
% |
$ |
57,808,607 |
|
$ |
62.69 |
|
$ |
69.21 |
|
17 |
|
136,251 |
|
4.01 |
% |
$ |
8,406,765 |
|
$ |
61.70 |
|
$ |
70.60 |
|
|
2017 |
|
88 |
|
1,523,025 |
|
8.20 |
% |
$ |
87,072,318 |
|
$ |
57.17 |
|
$ |
64.36 |
|
17 |
|
173,987 |
|
5.12 |
% |
$ |
14,921,283 |
|
$ |
85.76 |
|
$ |
76.31 |
|
|
2018 |
|
70 |
|
701,678 |
|
3.78 |
% |
$ |
51,167,641 |
|
$ |
72.92 |
|
$ |
100.65 |
|
27 |
|
473,821 |
|
13.94 |
% |
$ |
34,383,956 |
|
$ |
72.57 |
|
$ |
71.07 |
|
|
2019 |
|
66 |
|
995,725 |
|
5.36 |
% |
$ |
64,848,978 |
|
$ |
65.13 |
|
$ |
67.34 |
|
24 |
|
233,454 |
|
6.87 |
% |
$ |
17,182,110 |
|
$ |
73.60 |
|
$ |
76.78 |
|
|
2020 |
|
71 |
|
2,398,540 |
|
12.91 |
% |
$ |
144,117,968 |
|
$ |
60.09 |
|
$ |
66.27 |
|
18 |
|
303,099 |
|
8.92 |
% |
$ |
16,376,001 |
|
$ |
54.03 |
|
$ |
67.35 |
|
|
2021 |
|
46 |
|
1,723,873 |
|
9.28 |
% |
$ |
99,045,075 |
|
$ |
57.45 |
|
$ |
62.22 |
|
12 |
|
187,143 |
|
5.51 |
% |
$ |
13,226,240 |
|
$ |
70.67 |
|
$ |
89.88 |
|
|
2022 |
|
41 |
|
895,639 |
|
4.82 |
% |
$ |
54,254,153 |
|
$ |
60.58 |
|
$ |
78.94 |
|
14 |
|
160,157 |
|
4.71 |
% |
$ |
9,862,079 |
|
$ |
61.58 |
|
$ |
68.64 |
|
|
2023 |
|
32 |
|
645,867 |
|
3.48 |
% |
$ |
35,081,848 |
|
$ |
54.32 |
|
$ |
62.06 |
|
16 |
|
774,922 |
|
22.81 |
% |
$ |
49,884,247 |
|
$ |
64.37 |
|
$ |
66.88 |
|
|
2024 |
|
21 |
|
485,333 |
|
2.61 |
% |
$ |
30,293,581 |
|
$ |
62.42 |
|
$ |
67.94 |
|
13 |
|
146,694 |
|
4.32 |
% |
$ |
9,277,045 |
|
$ |
63.24 |
|
$ |
67.99 |
|
|
Thereafter |
|
85 |
|
5,282,238 |
|
28.43 |
% |
$ |
317,685,109 |
|
$ |
60.14 |
|
$ |
69.88 |
|
23 |
|
617,901 |
|
18.18 |
% |
$ |
42,307,146 |
|
$ |
68.47 |
|
$ |
76.82 |
|
|
|
|
641 |
|
15,947,578 |
|
85.82 |
% |
$ |
962,640,368 |
|
$ |
60.36 |
|
$ |
69.17 |
|
199 |
|
3,397,913 |
|
100.00 |
% |
$ |
226,655,447 |
|
$ |
66.70 |
|
$ |
71.92 |
|
|
|
|
|
|
|
|
|
|
|
|
|
|
|
|
|
|
|
|
|
|
|
|
|
|
|
| ||||||
|
|
(5) |
1 |
|
2,634,670 |
|
14.18 |
% |
$ |
112,498,602 |
|
|
|
|
|
|
|
|
|
|
|
|
|
|
|
|
| |||||
|
|
|
642 |
|
18,582,248 |
|
100.00 |
% |
$ |
1,075,138,970 |
|
|
|
|
|
|
|
|
|
|
|
|
|
|
|
|
| |||||
(1) Includes month to month holdover tenants that expired prior to June 30, 2015.
(2) Tenants may have multiple leases.
(3) Represents in place annualized rent allocated by year of maturity.
(4) Management’s estimate of average asking rents for currently occupied space as of June 30, 2015. Taking rents are typically lower than asking rents and may vary from property to property.
(5) Citigroup’s net lease at 388-390 Greenwich Street which expires in 2035.
|
Supplemental Information |
Second Quarter 2015 |
|
|
|
|
ANNUAL LEASE EXPIRATIONS - Suburban Operating Properties
Office, Retail and Storage Leases |
|

|
|
|
Consolidated Properties |
|
Joint Venture Properties |
| ||||||||||||||||||||||||||
|
Year of Lease |
|
Number of |
|
Rentable Square |
|
Percentage |
|
Annualized |
|
Annualized |
|
Current |
|
Number of |
|
Rentable Square |
|
Percentage of |
|
Annualized |
|
Annualized |
|
Current |
| ||||||
|
|
|
|
|
|
|
|
|
|
|
|
|
|
|
|
|
|
|
|
|
|
|
|
|
|
| ||||||
|
1st Quarter 2015 (1) |
|
12 |
|
43,678 |
|
1.27 |
% |
$ |
1,551,276 |
|
$ |
35.52 |
|
$ |
38.31 |
|
3 |
|
11,659 |
|
1.17 |
% |
$ |
486,849 |
|
$ |
41.76 |
|
$ |
36.00 |
|
|
2nd Quarter 2015 (1) |
|
9 |
|
38,438 |
|
1.12 |
% |
$ |
1,561,696 |
|
$ |
40.63 |
|
$ |
35.32 |
|
1 |
|
3,975 |
|
0.40 |
% |
$ |
104,789 |
|
$ |
26.36 |
|
$ |
27.53 |
|
|
3rd Quarter 2015 |
|
13 |
|
88,572 |
|
2.57 |
% |
$ |
3,497,507 |
|
$ |
39.49 |
|
$ |
38.41 |
|
3 |
|
35,106 |
|
3.53 |
% |
$ |
1,185,231 |
|
$ |
33.76 |
|
$ |
32.84 |
|
|
4th Quarter 2015 |
|
16 |
|
83,682 |
|
2.43 |
% |
$ |
2,599,340 |
|
$ |
31.06 |
|
$ |
32.70 |
|
5 |
|
16,612 |
|
1.67 |
% |
$ |
533,815 |
|
$ |
32.13 |
|
$ |
26.00 |
|
|
|
|
|
|
|
|
|
|
|
|
|
|
|
|
|
|
|
|
|
|
|
|
|
|
|
| ||||||
|
Total 2015 |
|
50 |
|
254,370 |
|
7.38 |
% |
$ |
9,209,819 |
|
$ |
36.21 |
|
$ |
36.05 |
|
12 |
|
67,352 |
|
6.77 |
% |
$ |
2,310,684 |
|
$ |
34.31 |
|
$ |
31.39 |
|
|
|
|
|
|
|
|
|
|
|
|
|
|
|
|
|
|
|
|
|
|
|
|
|
|
|
| ||||||
|
2016 |
|
54 |
|
401,483 |
|
11.65 |
% |
$ |
13,956,084 |
|
$ |
34.76 |
|
$ |
37.00 |
|
9 |
|
56,128 |
|
5.65 |
% |
$ |
1,584,497 |
|
$ |
28.23 |
|
$ |
28.67 |
|
|
2017 |
|
51 |
|
215,535 |
|
6.25 |
% |
$ |
8,544,574 |
|
$ |
39.64 |
|
$ |
40.31 |
|
12 |
|
82,160 |
|
8.26 |
% |
$ |
2,697,184 |
|
$ |
32.83 |
|
$ |
33.69 |
|
|
2018 |
|
55 |
|
305,603 |
|
8.87 |
% |
$ |
10,700,485 |
|
$ |
35.01 |
|
$ |
36.37 |
|
11 |
|
99,647 |
|
10.02 |
% |
$ |
3,505,422 |
|
$ |
35.18 |
|
$ |
31.42 |
|
|
2019 |
|
44 |
|
560,622 |
|
16.27 |
% |
$ |
16,242,643 |
|
$ |
28.97 |
|
$ |
29.74 |
|
20 |
|
96,304 |
|
9.69 |
% |
$ |
2,703,416 |
|
$ |
28.07 |
|
$ |
29.85 |
|
|
2020 |
|
33 |
|
351,041 |
|
10.19 |
% |
$ |
11,539,066 |
|
$ |
32.87 |
|
$ |
34.62 |
|
6 |
|
59,606 |
|
6.00 |
% |
$ |
2,005,605 |
|
$ |
33.65 |
|
$ |
32.47 |
|
|
2021 |
|
24 |
|
309,012 |
|
8.97 |
% |
$ |
8,269,441 |
|
$ |
26.76 |
|
$ |
28.13 |
|
6 |
|
95,052 |
|
9.56 |
% |
$ |
3,354,785 |
|
$ |
35.29 |
|
$ |
35.39 |
|
|
2022 |
|
16 |
|
104,781 |
|
3.04 |
% |
$ |
4,005,641 |
|
$ |
38.23 |
|
$ |
37.49 |
|
2 |
|
19,883 |
|
2.00 |
% |
$ |
682,983 |
|
$ |
34.35 |
|
$ |
36.53 |
|
|
2023 |
|
18 |
|
196,372 |
|
5.70 |
% |
$ |
6,642,900 |
|
$ |
33.83 |
|
$ |
35.00 |
|
4 |
|
65,588 |
|
6.60 |
% |
$ |
2,063,630 |
|
$ |
31.46 |
|
$ |
33.12 |
|
|
2024 |
|
16 |
|
243,445 |
|
7.06 |
% |
$ |
8,007,073 |
|
$ |
32.89 |
|
$ |
37.90 |
|
5 |
|
160,809 |
|
16.17 |
% |
$ |
5,039,573 |
|
$ |
31.34 |
|
$ |
29.88 |
|
|
Thereafter |
|
36 |
|
504,102 |
|
14.63 |
% |
$ |
14,723,662 |
|
$ |
29.21 |
|
$ |
30.91 |
|
12 |
|
191,706 |
|
19.28 |
% |
$ |
5,109,074 |
|
$ |
26.65 |
|
$ |
28.21 |
|
|
|
|
397 |
|
3,446,366 |
|
100.00 |
% |
$ |
111,841,388 |
|
$ |
32.45 |
|
$ |
33.93 |
|
99 |
|
994,235 |
|
100.00 |
% |
$ |
31,056,852 |
|
$ |
31.24 |
|
$ |
31.09 |
|
(1) Includes month to month holdover tenants that expired prior to June 30, 2015.
(2) Tenants may have multiple leases.
(3) Represents in place annualized rent allocated by year of maturity.
(4) Management’s estimate of average asking rents for currently occupied space as of June 30, 2015. Taking rents are typically lower than asking rents and may vary from property to property.
|
Supplemental Information |
Second Quarter 2015 |
|
ANNUAL LEASE EXPIRATIONS Retail Leases |
|

|
|
|
Consolidated Properties |
|
Joint Venture Properties |
| ||||||||||||||||||||||||||
|
Year of Lease |
|
Number of |
|
Rentable Square |
|
Percentage |
|
Annualized |
|
Annualized |
|
Current |
|
Number of |
|
Rentable Square |
|
Percentage |
|
Annualized |
|
Annualized |
|
Current |
| ||||||
|
Prime Retail |
|
|
|
|
|
|
|
|
|
|
|
|
|
|
|
|
|
|
|
|
|
|
|
|
| ||||||
|
2015 (1) |
|
8 |
|
38,583 |
|
7.87 |
% |
$ |
601,317 |
|
$ |
15.59 |
|
$ |
15.65 |
|
5 |
|
20,406 |
|
8.52 |
% |
$ |
1,404,336 |
|
$ |
68.82 |
|
$ |
69.79 |
|
|
2016 |
|
9 |
|
61,253 |
|
12.50 |
% |
$ |
3,022,078 |
|
$ |
49.34 |
|
$ |
51.28 |
|
2 |
|
18,202 |
|
7.60 |
% |
$ |
1,477,809 |
|
$ |
81.19 |
|
$ |
81.50 |
|
|
2017 |
|
9 |
|
60,694 |
|
12.38 |
% |
$ |
3,405,464 |
|
$ |
56.11 |
|
$ |
122.20 |
|
3 |
|
10,498 |
|
4.38 |
% |
$ |
837,022 |
|
$ |
79.73 |
|
$ |
126.27 |
|
|
2018 |
|
3 |
|
21,420 |
|
4.37 |
% |
$ |
1,376,640 |
|
$ |
64.27 |
|
$ |
74.69 |
|
1 |
|
4,500 |
|
1.88 |
% |
$ |
410,939 |
|
$ |
91.32 |
|
$ |
92.00 |
|
|
2019 |
|
0 |
|
0 |
|
0.00 |
% |
$ |
0 |
|
$ |
0.00 |
|
$ |
0.00 |
|
0 |
|
0 |
|
0.00 |
% |
$ |
0 |
|
$ |
0.00 |
|
$ |
0.00 |
|
|
2020 |
|
8 |
|
39,535 |
|
8.07 |
% |
$ |
7,033,962 |
|
$ |
177.92 |
|
$ |
294.19 |
|
0 |
|
0 |
|
0.00 |
% |
$ |
0 |
|
$ |
0.00 |
|
$ |
0.00 |
|
|
2021 |
|
1 |
|
108,148 |
|
22.07 |
% |
$ |
7,405,638 |
|
$ |
68.48 |
|
$ |
70.00 |
|
4 |
|
21,724 |
|
9.07 |
% |
$ |
3,814,416 |
|
$ |
175.59 |
|
$ |
252.59 |
|
|
2022 |
|
1 |
|
1,366 |
|
0.28 |
% |
$ |
205,836 |
|
$ |
150.69 |
|
$ |
299.00 |
|
3 |
|
55,437 |
|
23.13 |
% |
$ |
18,327,712 |
|
$ |
330.60 |
|
$ |
469.54 |
|
|
2023 |
|
1 |
|
6,476 |
|
1.32 |
% |
$ |
644,184 |
|
$ |
99.47 |
|
$ |
134.08 |
|
2 |
|
7,131 |
|
2.98 |
% |
$ |
1,344,312 |
|
$ |
188.52 |
|
$ |
350.00 |
|
|
2024 |
|
3 |
|
53,651 |
|
10.95 |
% |
$ |
2,402,208 |
|
$ |
44.77 |
|
$ |
53.68 |
|
1 |
|
7,793 |
|
3.25 |
% |
$ |
944,856 |
|
$ |
121.24 |
|
$ |
898.00 |
|
|
Thereafter |
|
8 |
|
98,963 |
|
20.19 |
% |
$ |
12,321,813 |
|
$ |
124.51 |
|
$ |
391.35 |
|
8 |
|
93,948 |
|
39.20 |
% |
$ |
58,001,403 |
|
$ |
617.38 |
|
$ |
700.15 |
|
|
|
|
51 |
|
490,089 |
|
100.00 |
% |
$ |
38,419,139 |
|
$ |
78.39 |
|
$ |
152.72 |
|
29 |
|
239,639 |
|
100.00 |
% |
$ |
86,562,805 |
|
$ |
361.22 |
|
$ |
465.02 |
|
|
|
|
|
|
|
|
|
|
|
|
|
|
|
|
|
|
|
|
|
|
|
|
|
|
|
| ||||||
|
Vacancy (5) |
|
|
|
29,856 |
|
|
|
|
|
|
|
$ |
561.74 |
|
|
|
45,358 |
|
|
|
|
|
|
|
$ |
713.14 |
| ||||
|
|
|
|
|
519,945 |
|
|
|
|
|
|
|
$ |
176.21 |
|
|
|
284,997 |
|
|
|
|
|
|
|
$ |
504.51 |
| ||||
|
|
|
|
|
|
|
|
|
|
|
|
|
|
|
|
|
|
|
|
|
|
|
|
|
|
| ||||||
|
Other Retail |
|
|
|
|
|
|
|
|
|
|
|
|
|
|
|
|
|
|
|
|
|
|
|
|
| ||||||
|
2015 (1) |
|
7 |
|
27,360 |
|
3.27 |
% |
$ |
2,662,928 |
|
$ |
97.33 |
|
$ |
116.91 |
|
2 |
|
1,030 |
|
0.44 |
% |
$ |
178,891 |
|
$ |
173.68 |
|
$ |
175.00 |
|
|
2016 |
|
9 |
|
64,948 |
|
7.76 |
% |
$ |
6,972,906 |
|
$ |
107.36 |
|
$ |
145.21 |
|
3 |
|
15,452 |
|
6.59 |
% |
$ |
869,520 |
|
$ |
56.27 |
|
$ |
83.65 |
|
|
2017 |
|
8 |
|
35,021 |
|
4.19 |
% |
$ |
4,524,654 |
|
$ |
129.20 |
|
$ |
227.13 |
|
4 |
|
6,940 |
|
2.96 |
% |
$ |
1,894,812 |
|
$ |
273.03 |
|
$ |
408.42 |
|
|
2018 |
|
10 |
|
63,522 |
|
7.59 |
% |
$ |
11,581,742 |
|
$ |
182.33 |
|
$ |
454.75 |
|
7 |
|
16,104 |
|
6.87 |
% |
$ |
1,942,097 |
|
$ |
120.60 |
|
$ |
158.02 |
|
|
2019 |
|
7 |
|
56,854 |
|
6.80 |
% |
$ |
3,332,199 |
|
$ |
58.61 |
|
$ |
100.96 |
|
2 |
|
10,100 |
|
4.31 |
% |
$ |
1,476,853 |
|
$ |
146.22 |
|
$ |
222.87 |
|
|
2020 |
|
9 |
|
60,172 |
|
7.19 |
% |
$ |
8,372,549 |
|
$ |
139.14 |
|
$ |
136.61 |
|
4 |
|
35,250 |
|
15.04 |
% |
$ |
1,497,609 |
|
$ |
42.49 |
|
$ |
54.07 |
|
|
2021 |
|
9 |
|
14,392 |
|
1.72 |
% |
$ |
1,417,145 |
|
$ |
98.47 |
|
$ |
122.95 |
|
3 |
|
15,992 |
|
6.82 |
% |
$ |
4,447,605 |
|
$ |
278.11 |
|
$ |
351.29 |
|
|
2022 |
|
12 |
|
109,669 |
|
13.11 |
% |
$ |
12,984,078 |
|
$ |
118.39 |
|
$ |
169.07 |
|
6 |
|
12,603 |
|
5.38 |
% |
$ |
1,573,629 |
|
$ |
124.86 |
|
$ |
177.98 |
|
|
2023 |
|
6 |
|
40,412 |
|
4.83 |
% |
$ |
5,277,607 |
|
$ |
130.60 |
|
$ |
134.08 |
|
2 |
|
3,248 |
|
1.39 |
% |
$ |
428,575 |
|
$ |
131.95 |
|
$ |
137.80 |
|
|
2024 |
|
7 |
|
28,143 |
|
3.36 |
% |
$ |
4,649,505 |
|
$ |
165.21 |
|
$ |
171.74 |
|
10 |
|
29,917 |
|
12.77 |
% |
$ |
3,228,497 |
|
$ |
107.92 |
|
$ |
124.67 |
|
|
Thereafter |
|
30 |
|
335,932 |
|
40.16 |
% |
$ |
48,931,517 |
|
$ |
145.66 |
|
$ |
189.96 |
|
17 |
|
87,717 |
|
37.43 |
% |
$ |
12,464,436 |
|
$ |
142.10 |
|
$ |
164.78 |
|
|
|
|
114 |
|
836,425 |
|
100.00 |
% |
$ |
110,706,830 |
|
$ |
132.36 |
|
$ |
188.67 |
|
60 |
|
234,353 |
|
100.00 |
% |
$ |
30,002,523 |
|
$ |
128.02 |
|
$ |
160.02 |
|
|
|
|
|
|
|
|
|
|
|
|
|
|
|
|
|
|
|
|
|
|
|
|
|
|
|
| ||||||
|
Vacancy (5) |
|
|
|
16,845 |
|
|
|
|
|
|
|
$ |
199.46 |
|
|
|
110,538 |
|
|
|
|
|
|
|
$ |
127.19 |
| ||||
|
|
|
|
|
853,270 |
|
|
|
|
|
|
|
$ |
188.88 |
|
|
|
344,891 |
|
|
|
|
|
|
|
$ |
149.50 |
| ||||
(1) Includes month to month holdover tenants that expired prior to June 30, 2015.
(2) Tenants may have multiple leases.
(3) Represents in place annualized rent allocated by year of maturity.
(4) Management’s estimate of average asking rents for currently occupied space as of June 30, 2015. Taking rents are typically lower than asking rents and may vary from property to property.
(5) Includes square footage on leases signed but not yet commenced.
|
Supplemental Information |
Second Quarter 2015 |
|
SUMMARY OF REAL ESTATE ACQUISITION ACTIVITY Manhattan |
|

|
|
|
|
|
|
|
|
|
|
|
Occupancy (%) |
|
Acquisition |
| |||
|
|
|
Property |
|
Type of Ownership |
|
Submarket |
|
Net Rentable SF |
|
at acquisition |
|
6/30/2015 |
|
Price ($’s) (1) |
| |
|
1998 Acquisitions |
|
|
|
|
|
|
|
|
|
|
|
|
|
|
| |
|
Mar-98 |
|
420 Lexington Avenue |
|
Operating Sublease |
|
Grand Central |
|
1,188,000 |
|
83.0 |
|
99.3 |
|
$ |
78,000,000 |
|
|
May-98 |
|
711 3rd Avenue |
|
Operating Sublease |
|
Grand Central |
|
524,000 |
|
79.0 |
|
83.5 |
|
$ |
65,600,000 |
|
|
Jun-98 |
|
440 9th Avenue |
|
Fee Interest |
|
Penn Station |
|
339,000 |
|
76.0 |
|
N/A |
|
$ |
32,000,000 |
|
|
|
|
|
|
|
|
|
|
2,051,000 |
|
|
|
|
|
$ |
175,600,000 |
|
|
1999 Acquisitions |
|
|
|
|
|
|
|
|
|
|
|
|
|
|
| |
|
Jan-99 |
|
420 Lexington Leasehold |
|
Sub-leasehold |
|
Grand Central |
|
— |
|
— |
|
— |
|
$ |
27,300,000 |
|
|
Jan-99 |
|
555 West 57th Street - 65% JV |
|
Fee Interest |
|
Midtown West |
|
941,000 |
|
100.0 |
|
99.9 |
|
$ |
66,700,000 |
|
|
Aug-99 |
|
1250 Broadway - 50% JV |
|
Fee Interest |
|
Penn Station |
|
670,000 |
|
96.5 |
|
N/A |
|
$ |
93,000,000 |
|
|
Nov-99 |
|
555 West 57th Street - remaining 35% |
|
Fee Interest |
|
Midtown West |
|
— |
|
|
|
99.9 |
|
$ |
34,100,000 |
|
|
|
|
|
|
|
|
|
|
1,611,000 |
|
|
|
|
|
$ |
221,100,000 |
|
|
2000 Acquisitions |
|
|
|
|
|
|
|
|
|
|
|
|
|
|
| |
|
Feb-00 |
|
100 Park Avenue - 50% JV |
|
Fee Interest |
|
Grand Central |
|
834,000 |
|
96.5 |
|
96.6 |
|
$ |
192,000,000 |
|
|
|
|
|
|
|
|
|
|
834,000 |
|
|
|
|
|
$ |
192,000,000 |
|
|
2001 Acquisitions |
|
|
|
|
|
|
|
|
|
|
|
|
|
|
| |
|
Jun-01 |
|
317 Madison Avenue |
|
Fee Interest |
|
Grand Central |
|
450,000 |
|
95.0 |
|
1.5 |
|
$ |
105,600,000 |
|
|
Acquisition of JV Interest |
|
|
|
|
|
|
|
|
|
|
|
|
|
|
| |
|
Sep-01 |
|
1250 Broadway - 49.9% JV (2) |
|
Fee Interest |
|
Penn Station |
|
670,000 |
|
97.7 |
|
N/A |
|
$ |
126,500,000 |
|
|
|
|
|
|
|
|
|
|
1,120,000 |
|
|
|
|
|
$ |
232,100,000 |
|
|
2002 Acquisitions |
|
|
|
|
|
|
|
|
|
|
|
|
|
|
| |
|
May-02 |
|
1515 Broadway - 55% JV |
|
Fee Interest |
|
Times Square |
|
1,750,000 |
|
98.0 |
|
100.0 |
|
$ |
483,500,000 |
|
|
|
|
|
|
|
|
|
|
1,750,000 |
|
|
|
|
|
$ |
483,500,000 |
|
|
2003 Acquisitions |
|
|
|
|
|
|
|
|
|
|
|
|
|
|
| |
|
Feb-03 |
|
220 East 42nd Street |
|
Fee Interest |
|
Grand Central |
|
1,135,000 |
|
91.9 |
|
91.6 |
|
$ |
265,000,000 |
|
|
Mar-03 |
|
125 Broad Street |
|
Fee Interest |
|
Downtown |
|
525,000 |
|
100.0 |
|
N/A |
|
$ |
92,000,000 |
|
|
Oct-03 |
|
461 Fifth Avenue |
|
Leasehold Interest |
|
Midtown |
|
200,000 |
|
93.9 |
|
96.8 |
|
$ |
60,900,000 |
|
|
Dec-03 |
|
1221 Avenue of the Americas - 45% JV |
|
Fee Interest |
|
Rockefeller Center |
|
2,550,000 |
|
98.8 |
|
N/A |
|
$ |
1,000,000,000 |
|
|
|
|
|
|
|
|
|
|
4,410,000 |
|
|
|
|
|
$ |
1,417,900,000 |
|
|
2004 Acquisitions |
|
|
|
|
|
|
|
|
|
|
|
|
|
|
| |
|
Mar-04 |
|
19 West 44th Street - 35% JV |
|
Fee Interest |
|
Midtown |
|
292,000 |
|
86.0 |
|
N/A |
|
$ |
67,000,000 |
|
|
Jul-04 |
|
750 Third Avenue |
|
Fee Interest |
|
Grand Central |
|
779,000 |
|
100.0 |
|
97.3 |
|
$ |
255,000,000 |
|
|
Jul-04 |
|
485 Lexington Avenue - 30% JV |
|
Fee Interest |
|
Grand Central |
|
921,000 |
|
100.0 |
|
100.0 |
|
$ |
225,000,000 |
|
|
Oct-04 |
|
625 Madison Avenue |
|
Leasehold Interest |
|
Plaza District |
|
563,000 |
|
68.0 |
|
97.1 |
|
$ |
231,500,000 |
|
|
|
|
|
|
|
|
|
|
2,555,000 |
|
|
|
|
|
$ |
778,500,000 |
|
|
2005 Acquisitions |
|
|
|
|
|
|
|
|
|
|
|
|
|
|
| |
|
Feb-05 |
|
28 West 44th Street |
|
Fee Interest |
|
Midtown |
|
359,000 |
|
87.0 |
|
N/A |
|
$ |
105,000,000 |
|
|
Apr-05 |
|
1 Madison Avenue - 55% JV |
|
Fee Interest |
|
Park Avenue South |
|
1,177,000 |
|
96.0 |
|
100.0 |
|
$ |
803,000,000 |
|
|
Apr-05 |
|
5 Madison Avenue Clock Tower |
|
Fee Interest |
|
Park Avenue South |
|
267,000 |
|
N/A |
|
N/A |
|
$ |
115,000,000 |
|
|
Jun-05 |
|
19 West 44th Street - remaining 65% |
|
Fee Interest |
|
Midtown |
|
— |
|
|
|
N/A |
|
$ |
91,200,000 |
|
|
|
|
|
|
|
|
|
|
1,803,000 |
|
|
|
|
|
$ |
1,114,200,000 |
|
|
2006 Acquisitions |
|
|
|
|
|
|
|
|
|
|
|
|
|
|
| |
|
Mar-06 |
|
521 Fifth Avenue |
|
Leasehold Interest |
|
Midtown |
|
460,000 |
|
97.0 |
|
97.6 |
|
$ |
210,000,000 |
|
|
Jun-06 |
|
609 Fifth Avenue |
|
Fee Interest |
|
Midtown |
|
160,000 |
|
98.5 |
|
81.3 |
|
$ |
182,000,000 |
|
|
Dec-06 |
|
485 Lexington Avenue - remaining 70% |
|
Fee Interest |
|
Grand Central |
|
— |
|
|
|
100.0 |
|
$ |
578,000,000 |
|
|
Dec-06 |
|
800 Third Avenue - 42.95% JV |
|
Fee Interest |
|
Grand Central North |
|
526,000 |
|
96.9 |
|
98.4 |
|
$ |
285,000,000 |
|
|
|
|
|
|
|
|
|
|
1,146,000 |
|
|
|
|
|
$ |
1,255,000,000 |
|
|
2007 Acquisitions |
|
|
|
|
|
|
|
|
|
|
|
|
|
|
| |
|
Jan-07 |
|
Reckson - NYC Portfolio |
|
Fee Interests / Leasehold Interest |
|
Various |
|
5,612,000 |
|
98.3 |
|
96.9 |
|
$ |
3,679,530,000 |
|
|
Apr-07 |
|
331 Madison Avenue |
|
Fee Interest |
|
Grand Central |
|
114,900 |
|
97.6 |
|
— |
|
$ |
73,000,000 |
|
|
Apr-07 |
|
1745 Broadway - 32.3% JV |
|
Fee Interest |
|
Midtown |
|
674,000 |
|
100.0 |
|
100.0 |
|
$ |
520,000,000 |
|
|
Jun-07 |
|
333 West 34th Street |
|
Fee Interest |
|
Penn Station |
|
345,400 |
|
100.0 |
|
N/A |
|
$ |
183,000,000 |
|
|
Aug-07 |
|
1 Madison Avenue - remaining 45% |
|
Fee Interest |
|
Park Avenue South |
|
1,177,000 |
|
99.8 |
|
100.0 |
|
$ |
1,000,000,000 |
|
|
Dec-07 |
|
388 & 390 Greenwich Street - 50.6% JV |
|
Fee Interest |
|
Downtown |
|
2,635,000 |
|
100.0 |
|
100.0 |
|
$ |
1,575,000,000 |
|
|
|
|
|
|
|
|
|
|
10,558,300 |
|
|
|
|
|
$ |
7,030,530,000 |
|
|
2010 Acquisitions |
|
|
|
|
|
|
|
|
|
|
|
|
|
|
| |
|
Jan-10 |
|
100 Church Street |
|
Fee Interest |
|
Downtown |
|
1,047,500 |
|
41.3 |
|
99.0 |
|
$ |
181,600,000 |
|
|
May-10 |
|
600 Lexington Avenue - 55% JV |
|
Fee Interest |
|
East Side |
|
303,515 |
|
93.6 |
|
89.6 |
|
$ |
193,000,000 |
|
|
Aug-10 |
|
125 Park Avenue |
|
Fee Interest |
|
Grand Central |
|
604,245 |
|
99.1 |
|
87.1 |
|
$ |
330,000,000 |
|
|
|
|
|
|
|
|
|
|
1,955,260 |
|
|
|
|
|
$ |
704,600,000 |
|
|
Supplemental Information |
Second Quarter 2015 |
|
SUMMARY OF REAL ESTATE ACQUISITION ACTIVITY - Cont. Manhattan |
|

|
|
|
|
|
|
|
|
|
|
|
Occupancy (%) |
|
Acquisition |
| |||
|
|
|
Property |
|
Type of Ownership |
|
Submarket |
|
Net Rentable SF |
|
at acquisition |
|
1/0/1900 |
|
Price ($’s) (1) |
| |
|
2011 Acquisitions |
|
|
|
|
|
|
|
|
|
|
|
|
|
|
| |
|
Jan-11 |
|
521 Fifth Avenue - remaining 49.9% |
|
Leasehold Interest |
|
Midtown |
|
460,000 |
|
80.7 |
|
97.6 |
|
$ |
245,700,000 |
|
|
Apr-11 |
|
1515 Broadway - remaining 45% |
|
Fee Interest |
|
Times Square |
|
1,750,000 |
|
98.5 |
|
100.0 |
|
$ |
1,210,000,000 |
|
|
May-11 |
|
110 East 42nd Street |
|
Fee Interest |
|
Grand Central |
|
205,000 |
|
72.6 |
|
99.9 |
|
$ |
85,570,000 |
|
|
May-11 |
|
280 Park Avenue - 49.5% JV |
|
Fee Interest |
|
Park Avenue |
|
1,219,158 |
|
78.2 |
|
69.3 |
|
$ |
1,110,000,000 |
|
|
Nov-11 |
|
180 Maiden Lane - 49.9% JV |
|
Fee Interest |
|
Financial East |
|
1,090,000 |
|
97.7 |
|
N/A |
|
$ |
425,680,000 |
|
|
Nov-11 |
|
51 East 42nd Street |
|
Fee Interest |
|
Grand Central |
|
142,000 |
|
95.5 |
|
— |
|
$ |
80,000,000 |
|
|
|
|
|
|
|
|
|
|
4,866,158 |
|
|
|
|
|
$ |
3,156,950,000 |
|
|
2012 Acquisitions |
|
|
|
|
|
|
|
|
|
|
|
|
|
|
| |
|
Feb-12 |
|
10 East 53rd Street - 55% JV |
|
Fee Interest |
|
Plaza District |
|
354,300 |
|
91.9 |
|
31.1 |
|
$ |
252,500,000 |
|
|
Jun-12 |
|
304 Park Avenue South |
|
Fee Interest |
|
Midtown South |
|
215,000 |
|
95.8 |
|
90.3 |
|
$ |
135,000,000 |
|
|
Sep-12 |
|
641 Sixth Avenue |
|
Fee Interest |
|
Midtown South |
|
163,000 |
|
92.1 |
|
100.0 |
|
$ |
90,000,000 |
|
|
Dec-12 |
|
315 West 36th Street - 35.5% JV |
|
Fee Interest |
|
Times Square South |
|
147,619 |
|
99.2 |
|
100.0 |
|
$ |
46,000,000 |
|
|
|
|
|
|
|
|
|
|
879,919 |
|
|
|
|
|
$ |
523,500,000 |
|
|
2014 Acquisitions |
|
|
|
|
|
|
|
|
|
|
|
|
|
|
| |
|
May-14 |
|
388 & 390 Greenwich Street - remaining 49.4% |
|
Fee Interest |
|
Downtown |
|
2,635,000 |
|
100.0 |
|
100.0 |
|
$ |
1,585,000,000 |
|
|
|
|
|
|
|
|
|
|
2,635,000 |
|
|
|
|
|
$ |
1,585,000,000 |
|
(1) Acquisition price represents purchase price for consolidated acquisitions and purchase price or imputed value for joint venture properties.
(2) Ownership interest from November 2001 - May 2008 was 55%. (From 9/1/01-10/31/01 the Company owned 99.8% of this property.)
|
Supplemental Information |
Second Quarter 2015 |
|
| |
|
SUMMARY OF REAL ESTATE SALES ACTIVITY Manhattan |
|

|
|
|
|
|
|
|
|
|
|
|
Sales |
|
Sales |
| ||
|
|
|
Property |
|
Type of Ownership |
|
Submarket |
|
Net Rentable SF |
|
Price ($’s) |
|
Price ($’s/SF) |
| ||
|
2000 Sales |
|
|
|
|
|
|
|
|
|
|
|
|
| ||
|
Feb-00 |
|
29 West 35th Street |
|
Fee Interest |
|
Penn Station |
|
78,000 |
|
$ |
11,700,000 |
|
$ |
150 |
|
|
Mar-00 |
|
36 West 44th Street |
|
Fee Interest |
|
Grand Central |
|
178,000 |
|
$ |
31,500,000 |
|
$ |
177 |
|
|
May-00 |
|
321 West 44th Street - 35% JV |
|
Fee Interest |
|
Times Square |
|
203,000 |
|
$ |
28,400,000 |
|
$ |
140 |
|
|
Nov-00 |
|
90 Broad Street |
|
Fee Interest |
|
Financial |
|
339,000 |
|
$ |
60,000,000 |
|
$ |
177 |
|
|
Dec-00 |
|
17 Battery South |
|
Fee Interest |
|
Financial |
|
392,000 |
|
$ |
53,000,000 |
|
$ |
135 |
|
|
|
|
|
|
|
|
|
|
1,190,000 |
|
$ |
184,600,000 |
|
$ |
156 |
|
|
2001 Sales |
|
|
|
|
|
|
|
|
|
|
|
|
| ||
|
Jan-01 |
|
633 Third Ave |
|
Fee Interest |
|
Grand Central North |
|
40,623 |
|
$ |
13,250,000 |
|
$ |
326 |
|
|
May-01 |
|
1 Park Ave - 45% JV |
|
Fee Interest |
|
Grand Central South |
|
913,000 |
|
$ |
233,900,000 |
|
$ |
256 |
|
|
Jun-01 |
|
1412 Broadway |
|
Fee Interest |
|
Times Square South |
|
389,000 |
|
$ |
90,700,000 |
|
$ |
233 |
|
|
Jul-01 |
|
110 East 42nd Street |
|
Fee Interest |
|
Grand Central |
|
69,700 |
|
$ |
14,500,000 |
|
$ |
208 |
|
|
Sep-01 |
|
1250 Broadway (1) |
|
Fee Interest |
|
Penn Station |
|
670,000 |
|
$ |
126,500,000 |
|
$ |
189 |
|
|
|
|
|
|
|
|
|
|
2,082,323 |
|
$ |
478,850,000 |
|
$ |
242 |
|
|
2002 Sales |
|
|
|
|
|
|
|
|
|
|
|
|
| ||
|
Jun-02 |
|
469 Seventh Avenue |
|
Fee Interest |
|
Penn Station |
|
253,000 |
|
$ |
53,100,000 |
|
$ |
210 |
|
|
|
|
|
|
|
|
|
|
253,000 |
|
$ |
53,100,000 |
|
$ |
210 |
|
|
2003 Sales |
|
|
|
|
|
|
|
|
|
|
|
|
| ||
|
Mar-03 |
|
50 West 23rd Street |
|
Fee Interest |
|
Chelsea |
|
333,000 |
|
$ |
66,000,000 |
|
$ |
198 |
|
|
Jul-03 |
|
1370 Broadway |
|
Fee Interest |
|
Times Square South |
|
255,000 |
|
$ |
58,500,000 |
|
$ |
229 |
|
|
Dec-03 |
|
321 West 44th Street |
|
Fee Interest |
|
Times Square |
|
203,000 |
|
$ |
35,000,000 |
|
$ |
172 |
|
|
|
|
|
|
|
|
|
|
791,000 |
|
$ |
159,500,000 |
|
$ |
202 |
|
|
2004 Sales |
|
|
|
|
|
|
|
|
|
|
|
|
| ||
|
May-04 |
|
1 Park Avenue (2) |
|
Fee Interest |
|
Grand Central South |
|
913,000 |
|
$ |
318,500,000 |
|
$ |
349 |
|
|
Oct-04 |
|
17 Battery Place North |
|
Fee Interest |
|
Financial |
|
419,000 |
|
$ |
70,000,000 |
|
$ |
167 |
|
|
Nov-04 |
|
1466 Broadway |
|
Fee Interest |
|
Times Square |
|
289,000 |
|
$ |
160,000,000 |
|
$ |
554 |
|
|
|
|
|
|
|
|
|
|
1,621,000 |
|
$ |
548,500,000 |
|
$ |
338 |
|
|
2005 Sales |
|
|
|
|
|
|
|
|
|
|
|
|
| ||
|
Apr-05 |
|
1414 Avenue of the Americas |
|
Fee Interest |
|
Plaza District |
|
111,000 |
|
$ |
60,500,000 |
|
$ |
545 |
|
|
Aug-05 |
|
180 Madison Avenue |
|
Fee Interest |
|
Grand Central |
|
265,000 |
|
$ |
92,700,000 |
|
$ |
350 |
|
|
|
|
|
|
|
|
|
|
376,000 |
|
$ |
153,200,000 |
|
$ |
407 |
|
|
2006 Sales |
|
|
|
|
|
|
|
|
|
|
|
|
| ||
|
Jul-06 |
|
286 & 290 Madison Avenue |
|
Fee Interest |
|
Grand Central |
|
149,000 |
|
$ |
63,000,000 |
|
$ |
423 |
|
|
Aug-06 |
|
1140 Avenue of the Americas |
|
Leasehold Interest |
|
Rockefeller Center |
|
191,000 |
|
$ |
97,500,000 |
|
$ |
510 |
|
|
Dec-06 |
|
521 Fifth Avenue (3) |
|
Leasehold Interest |
|
Midtown |
|
460,000 |
|
$ |
240,000,000 |
|
$ |
522 |
|
|
|
|
|
|
|
|
|
|
800,000 |
|
$ |
400,500,000 |
|
$ |
501 |
|
|
2007 Sales |
|
|
|
|
|
|
|
|
|
|
|
|
| ||
|
Mar-07 |
|
1 Park Avenue |
|
Fee Interest |
|
Grand Central South |
|
913,000 |
|
$ |
550,000,000 |
|
$ |
602 |
|
|
Mar-07 |
|
70 West 36th Street |
|
Fee Interest |
|
Garment |
|
151,000 |
|
$ |
61,500,000 |
|
$ |
407 |
|
|
Jun-07 |
|
110 East 42nd Street |
|
Fee Interest |
|
Grand Central North |
|
181,000 |
|
$ |
111,500,000 |
|
$ |
616 |
|
|
Jun-07 |
|
125 Broad Street |
|
Fee Interest |
|
Downtown |
|
525,000 |
|
$ |
273,000,000 |
|
$ |
520 |
|
|
Jun-07 |
|
5 Madison Clock Tower |
|
Fee Interest |
|
Park Avenue South |
|
267,000 |
|
$ |
200,000,000 |
|
$ |
749 |
|
|
Jul-07 |
|
292 Madison Avenue |
|
Fee Interest |
|
Grand Central South |
|
187,000 |
|
$ |
140,000,000 |
|
$ |
749 |
|
|
Jul-07 |
|
1372 Broadway (4) |
|
Fee Interest |
|
Penn Station/Garment |
|
508,000 |
|
$ |
335,000,000 |
|
$ |
659 |
|
|
Nov-07 |
|
470 Park Avenue South |
|
Fee Interest |
|
Park Avenue South/Flatiron |
|
260,000 |
|
$ |
157,000,000 |
|
$ |
604 |
|
|
|
|
|
|
|
|
|
|
2,992,000 |
|
$ |
1,828,000,000 |
|
$ |
611 |
|
|
2008 Sales |
|
|
|
|
|
|
|
|
|
|
|
|
| ||
|
Jan-08 |
|
440 Ninth Avenue |
|
Fee Interest |
|
Penn Station |
|
339,000 |
|
$ |
160,000,000 |
|
$ |
472 |
|
|
May-08 |
|
1250 Broadway |
|
Fee Interest |
|
Penn Station |
|
670,000 |
|
$ |
310,000,000 |
|
$ |
463 |
|
|
Oct-08 |
|
1372 Broadway (5) |
|
Fee Interest |
|
Penn Station/Garment |
|
508,000 |
|
$ |
274,000,000 |
|
$ |
539 |
|
|
|
|
|
|
|
|
|
|
1,517,000 |
|
$ |
744,000,000 |
|
$ |
490 |
|
|
2010 Sales |
|
|
|
|
|
|
|
|
|
|
|
|
| ||
|
May-10 |
|
1221 Avenue of the Americas (6) |
|
Fee Interest |
|
Rockefeller Center |
|
2,550,000 |
|
$ |
1,280,000,000 |
|
$ |
502 |
|
|
Sep-10 |
|
19 West 44th Street |
|
Fee Interest |
|
Midtown |
|
292,000 |
|
$ |
123,150,000 |
|
$ |
422 |
|
|
|
|
|
|
|
|
|
|
2,842,000 |
|
$ |
1,403,150,000 |
|
$ |
494 |
|
|
2011 Sales |
|
|
|
|
|
|
|
|
|
|
|
|
| ||
|
May-11 |
|
28 West 44th Street |
|
Fee Interest |
|
Midtown |
|
359,000 |
|
$ |
161,000,000 |
|
$ |
448 |
|
|
|
|
|
|
|
|
|
|
|
|
|
|
|
| ||
|
2013 Sales |
|
|
|
|
|
|
|
|
|
|
|
|
| ||
|
Aug-13 |
|
333 West 34th Street |
|
Fee Interest |
|
Penn Station |
|
345,400 |
|
$ |
220,250,000 |
|
$ |
638 |
|
|
|
|
|
|
|
|
|
|
|
|
|
|
|
| ||
|
2014 Sales |
|
|
|
|
|
|
|
|
|
|
|
|
| ||
|
May-14 |
|
673 First Avenue |
|
Leasehold Interest |
|
Grand Central South |
|
422,000 |
|
$ |
145,000,000 |
|
$ |
344 |
|
(1) Company sold a 45% JV interest in the property at an implied $126.5 million sales price.
(2) Company sold a 75% JV interest in the property at an implied $318.5 million sales price.
(3) Company sold a 50% JV interest in the property at an implied $240.0 million sales price
(4) Company sold a 85% JV interest in the property at an implied $335.0 million sales price.
(5) Company sold a 15% JV interest in the property at an implied $274.0 million sales price.
(6) Company sold a 45% JV interest in the property at an implied $1.28 billion sales price.
|
Supplemental Information |
Second Quarter 2015 |
|
|
|
|
SUMMARY OF REAL ESTATE ACQUISITION ACTIVITY Suburban |
|

|
|
|
|
|
|
|
|
|
|
|
Occupancy (%) |
|
Acquisition |
| |||
|
|
|
Property |
|
Type of Ownership |
|
Submarket |
|
Net Rentable SF |
|
at acquisition |
|
6/30/2015 |
|
Price ($’s) (1) |
| |
|
2007 Acquisition |
|
|
|
|
|
|
|
|
|
|
|
|
|
|
| |
|
Jan-07 |
|
300 Main Street |
|
Fee Interest |
|
Stamford, Connecticut |
|
130,000 |
|
92.5 |
|
N/A |
|
$ |
15,000,000 |
|
|
Jan-07 |
|
399 Knollwood Road |
|
Fee Interest |
|
White Plains, New York |
|
145,000 |
|
96.6 |
|
N/A |
|
$ |
31,600,000 |
|
|
Jan-07 |
|
Reckson - Connecticut Portfolio |
|
Fee Interests / Leasehold Interest |
|
Stamford, Connecticut |
|
1,369,800 |
|
88.9 |
|
88.7 |
|
$ |
490,750,000 |
|
|
Jan-07 |
|
Reckson - Westchester Portfolio |
|
Fee Interests / Leasehold Interest |
|
Westchester |
|
2,346,100 |
|
90.6 |
|
80.6 |
|
$ |
570,190,000 |
|
|
Apr-07 |
|
Jericho Plazas - 20.26% JV |
|
Fee Interest |
|
Jericho, New York |
|
640,000 |
|
98.4 |
|
70.0 |
|
$ |
210,000,000 |
|
|
Jun-07 |
|
1010 Washington Boulevard |
|
Fee Interest |
|
Stamford, Connecticut |
|
143,400 |
|
95.6 |
|
75.6 |
|
$ |
38,000,000 |
|
|
Jun-07 |
|
500 West Putnam Avenue |
|
Fee Interest |
|
Greenwich, Connecticut |
|
121,500 |
|
94.4 |
|
53.8 |
|
$ |
56,000,000 |
|
|
Jul-07 |
|
16 Court Street - 35% JV |
|
Fee Interest |
|
Brooklyn, New York |
|
317,600 |
|
80.6 |
|
95.6 |
|
$ |
107,500,000 |
|
|
Aug-07 |
|
150 Grand Street |
|
Fee Interest |
|
White Plains, New York |
|
85,000 |
|
52.9 |
|
76.6 |
|
$ |
6,700,000 |
|
|
Sep-07 |
|
The Meadows - 25% JV |
|
Fee Interest |
|
Rutherford, New Jersey |
|
582,100 |
|
81.3 |
|
91.4 |
|
$ |
111,500,000 |
|
|
|
|
|
|
|
|
|
|
5,880,500 |
|
|
|
|
|
$ |
1,637,240,000 |
|
|
2013 Acquisition |
|
|
|
|
|
|
|
|
|
|
|
|
|
|
| |
|
Apr-13 |
|
16 Court Street - additional JV interest |
|
Fee Interest |
|
Brooklyn, New York |
|
317,600 |
|
84.9 |
|
95.6 |
|
$ |
96,200,000 |
|
|
|
|
|
|
|
|
|
|
317,600 |
|
|
|
|
|
$ |
96,200,000 |
|
|
SUMMARY OF REAL ESTATE SALES ACTIVITY Suburban |
|
|
|
|
|
|
|
|
|
|
|
Sales |
|
Sales |
| ||
|
|
|
Property |
|
Type of Ownership |
|
Submarket |
|
Net Rentable SF |
|
Price ($’s) |
|
Price ($’s/SF) |
| ||
|
2008 Sales |
|
|
|
|
|
|
|
|
|
|
|
|
| ||
|
Oct-08 |
|
100 & 120 White Plains Road |
|
Fee Interest |
|
Tarrytown, New York |
|
211,000 |
|
$ |
48,000,000 |
|
$ |
227 |
|
|
|
|
|
|
|
|
|
|
|
|
|
|
|
| ||
|
2009 Sales |
|
|
|
|
|
|
|
|
|
|
|
|
| ||
|
Jan-09 |
|
55 Corporate Drive |
|
Fee Interest |
|
Bridgewater, New Jersey |
|
670,000 |
|
$ |
230,000,000 |
|
$ |
343 |
|
|
Aug-09 |
|
399 Knollwood Road |
|
Fee Interest |
|
White Plains, New York |
|
145,000 |
|
$ |
20,767,307 |
|
$ |
143 |
|
|
|
|
|
|
|
|
|
|
815,000 |
|
$ |
250,767,307 |
|
|
| |
|
|
|
|
|
|
|
|
|
|
|
|
|
|
| ||
|
2012 Sales |
|
|
|
|
|
|
|
|
|
|
|
|
| ||
|
Jul-12 |
|
One Court Square |
|
Fee Interest |
|
Long Island City, New York |
|
1,402,000 |
|
$ |
481,100,000 |
|
$ |
343 |
|
|
|
|
|
|
|
|
|
|
|
|
|
|
|
| ||
|
2013 Sales |
|
|
|
|
|
|
|
|
|
|
|
|
| ||
|
Sep-13 |
|
300 Main Street |
|
Fee Interest |
|
Stamford, Connecticut |
|
130,000 |
|
$ |
13,500,000 |
|
$ |
104 |
|
(1) Acquisition price represents purchase price for consolidated acquisitions and purchase price or imputed value for joint venture properties.
|
Supplemental Information |
Second Quarter 2015 |
|
|
|
|
SUMMARY OF REAL ESTATE ACQUISITION ACTIVITY Retail, Residential, Development / Redevelopment & Land |
|

|
|
|
|
|
|
|
|
|
|
|
Occupancy (%) |
|
Acquisition |
| |||
|
|
|
Property |
|
Type of Ownership |
|
Submarket |
|
Net Rentable SF |
|
at acquisition |
|
6/30/2015 |
|
Price ($’s) (1) |
| |
|
2005 Acquisition |
|
|
|
|
|
|
|
|
|
|
|
|
|
|
| |
|
Jul-05 |
|
1551-1555 Broadway - 10% JV |
|
Fee Interest |
|
Times Square |
|
25,600 |
|
N/A |
|
N/A |
|
$ |
85,000,000 |
|
|
Jul-05 |
|
21 West 34th Street - 50% JV |
|
Fee Interest |
|
Herald Square |
|
30,100 |
|
N/A |
|
N/A |
|
$ |
17,500,000 |
|
|
Sep-05 |
|
141 Fifth Avenue - 50% JV |
|
Fee Interest |
|
Flatiron |
|
21,500 |
|
N/A |
|
N/A |
|
$ |
13,250,000 |
|
|
Nov-05 |
|
1604 Broadway - 63% JV |
|
Leasehold Interest |
|
Times Square |
|
29,876 |
|
17.2 |
|
N/A |
|
$ |
4,400,000 |
|
|
Dec-05 |
|
379 West Broadway - 45% JV |
|
Leasehold Interest |
|
Cast Iron/Soho |
|
62,006 |
|
100.0 |
|
N/A |
|
$ |
19,750,000 |
|
|
|
|
|
|
|
|
|
|
169,082 |
|
|
|
|
|
$ |
139,900,000 |
|
|
|
|
|
|
|
|
|
|
|
|
|
|
|
|
|
| |
|
2006 Acquisition |
|
|
|
|
|
|
|
|
|
|
|
|
|
|
| |
|
Jan-06 |
|
25-29 West 34th Street - 50% JV |
|
Fee Interest |
|
Herald Square/Penn Station |
|
41,000 |
|
55.8 |
|
N/A |
|
$ |
30,000,000 |
|
|
Sep-06 |
|
717 Fifth Avenue - 32.75% JV |
|
Fee Interest |
|
Midtown/Plaza District |
|
119,550 |
|
63.1 |
|
89.4 |
|
$ |
251,900,000 |
|
|
|
|
|
|
|
|
|
|
160,550 |
|
|
|
|
|
$ |
281,900,000 |
|
|
|
|
|
|
|
|
|
|
|
|
|
|
|
|
|
| |
|
2007 Acquisition |
|
|
|
|
|
|
|
|
|
|
|
|
|
|
| |
|
Aug-07 |
|
180 Broadway - 50% JV |
|
Fee Interest |
|
Cast Iron / Soho |
|
24,300 |
|
85.2 |
|
N/A |
|
$ |
13,600,000 |
|
|
Apr-07 |
|
Two Herald Square - 55% JV |
|
Fee Interest |
|
Herald Square |
|
N/A |
|
N/A |
|
N/A |
|
$ |
225,000,000 |
|
|
Jul-07 |
|
885 Third Avenue - 55% JV |
|
Fee Interest |
|
Midtown / Plaza District |
|
N/A |
|
N/A |
|
N/A |
|
$ |
317,000,000 |
|
|
|
|
|
|
|
|
|
|
24,300 |
|
|
|
|
|
$ |
555,600,000 |
|
|
|
|
|
|
|
|
|
|
|
|
|
|
|
|
|
| |
|
2008 Acquisition |
|
|
|
|
|
|
|
|
|
|
|
|
|
|
| |
|
Jan-08 |
|
125 Chubb Way |
|
Fee Interest |
|
Lyndhurst, New Jersey |
|
278,000 |
|
— |
|
66.2 |
|
$ |
29,364,000 |
|
|
Feb-08 |
|
182 Broadway - 50% JV |
|
Fee Interest |
|
Cast Iron / Soho |
|
46,280 |
|
83.8 |
|
N/A |
|
$ |
30,000,000 |
|
|
|
|
|
|
|
|
|
|
324,280 |
|
|
|
|
|
$ |
59,364,000 |
|
|
|
|
|
|
|
|
|
|
|
|
|
|
|
|
|
| |
|
2010 Acquisition |
|
|
|
|
|
|
|
|
|
|
|
|
|
|
| |
|
Nov-10 |
|
Williamsburg Terrace |
|
Fee Interest |
|
Brooklyn, New York |
|
52,000 |
|
100.0 |
|
100.0 |
|
$ |
18,000,000 |
|
|
Dec-10 |
|
11 West 34th Street - 30% JV |
|
Fee Interest |
|
Herald Square/Penn Station |
|
17,150 |
|
100.0 |
|
100.0 |
|
$ |
10,800,000 |
|
|
Dec-10 |
|
7 Renaissance Square - 50% JV |
|
Fee Interest |
|
White Plains, New York |
|
65,641 |
|
— |
|
89.1 |
|
$ |
4,000,000 |
|
|
Dec-10 |
|
Two Herald Square - 45% (2) |
|
Fee Interest |
|
Herald Square |
|
354,400 |
|
100.0 |
|
N/A |
|
$ |
247,500,000 |
|
|
Dec-10 |
|
885 Third Avenue - 45% (2) |
|
Fee Interest |
|
Midtown / Plaza District |
|
607,000 |
|
100.0 |
|
100.0 |
|
$ |
352,000,000 |
|
|
Dec-10 |
|
292 Madison Avenue |
|
Fee Interest |
|
Grand Central South |
|
203,800 |
|
N/A |
|
N/A |
|
$ |
78,300,000 |
|
|
|
|
|
|
|
|
|
|
1,299,991 |
|
|
|
|
|
$ |
710,600,000 |
|
|
|
|
|
|
|
|
|
|
|
|
|
|
|
|
|
| |
|
2011 Acquisition |
|
|
|
|
|
|
|
|
|
|
|
|
|
|
| |
|
Jan-11 |
|
3 Columbus Circle - 48.9% |
|
Fee Interest |
|
Columbus Circle |
|
741,500 |
|
20.1 |
|
83.4 |
|
$ |
500,000,000 |
|
|
Aug-11 |
|
1552-1560 Broadway - 50% |
|
Fee Interest |
|
Times Square |
|
35,897 |
|
59.7 |
|
67.5 |
|
$ |
136,550,000 |
|
|
Sep-11 |
|
747 Madison Avenue - 33.33% |
|
Fee Interest |
|
Plaza District |
|
10,000 |
|
100.0 |
|
N/A |
|
$ |
66,250,000 |
|
|
|
|
|
|
|
|
|
|
787,397 |
|
|
|
|
|
$ |
702,800,000 |
|
|
|
|
|
|
|
|
|
|
|
|
|
|
|
|
|
| |
|
2012 Acquisition |
|
|
|
|
|
|
|
|
|
|
|
|
|
|
| |
|
Jan-12 |
|
DFR Residential and Retail Portfolio - 80% |
|
Fee Interests / Leasehold Interest |
|
Plaza District, Upper East Side |
|
489,882 |
|
95.1 |
|
93.0 |
|
$ |
193,000,000 |
|
|
Jan-12 |
|
724 Fifth Avenue - 50% |
|
Fee Interest |
|
Plaza District |
|
65,010 |
|
92.9 |
|
81.7 |
|
$ |
223,000,000 |
|
|
Jul-12 |
|
West Coast Office Portfolio - 27.63% |
|
Fee Interest |
|
|
|
4,473,603 |
|
76.3 |
|
N/A |
|
$ |
880,103,924 |
|
|
Aug-12 |
|
33 Beekman Street - 45.9% |
|
Fee Interest |
|
Downtown |
|
— |
|
— |
|
— |
|
$ |
31,160,000 |
|
|
Sep-12 |
|
635 Sixth Avenue |
|
Fee Interest |
|
Midtown South |
|
104,000 |
|
— |
|
100.0 |
|
$ |
83,000,000 |
|
|
Oct-12 |
|
1080 Amsterdam - 87.5% |
|
Leasehold Interest |
|
Upper West Side |
|
82,250 |
|
2.2 |
|
96.9 |
|
$ |
— |
|
|
Dec-12 |
|
21 East 66th Street - 32.28% |
|
Fee Interest |
|
Plaza District |
|
16,736 |
|
100.0 |
|
100.0 |
|
$ |
75,000,000 |
|
|
Dec-12 |
|
985-987 Third Avenue |
|
Fee Interest |
|
Upper East Side |
|
13,678 |
|
— |
|
N/A |
|
$ |
18,000,000 |
|
|
Dec-12 |
|
131-137 Spring Street |
|
Fee Interest |
|
Soho |
|
68,342 |
|
100.0 |
|
100.0 |
|
$ |
122,300,000 |
|
|
|
|
|
|
|
|
|
|
5,313,501 |
|
|
|
|
|
$ |
1,625,563,924 |
|
|
|
|
|
|
|
|
|
|
|
|
|
|
|
|
|
| |
|
2013 Acquisition |
|
|
|
|
|
|
|
|
|
|
|
|
|
|
| |
|
Mar-13 |
|
248-252 Bedford Avenue - 90% |
|
Fee Interest |
|
Brooklyn, New York |
|
66,611 |
|
— |
|
92.0 |
|
$ |
54,900,000 |
|
|
Nov-13 |
|
650 Fifth Avenue - 50% |
|
Leasehold Interest |
|
Plaza District |
|
32,324 |
|
63.6 |
|
10.5 |
|
$ |
— |
|
|
Nov-13 |
|
315 West 33rd Street - The Olivia |
|
Fee Interest |
|
Penn Station |
|
492,987 |
|
96.6 |
|
98.4 |
|
$ |
386,775,000 |
|
|
Nov-13 |
|
Fifth Avenue Retail Assemblage |
|
Fee Interest |
|
Plaza District |
|
66,962 |
|
74.6 |
|
63.7 |
|
$ |
146,221,990 |
|
|
|
|
|
|
|
|
|
|
658,884 |
|
|
|
|
|
$ |
587,896,990 |
|
|
|
|
|
|
|
|
|
|
|
|
|
|
|
|
|
| |
|
2014 Acquisition |
|
|
|
|
|
|
|
|
|
|
|
|
|
|
| |
|
Jul-14 |
|
719 Seventh Avenue - 75% |
|
Fee Interest |
|
Times Square |
|
6,000 |
|
100.0 |
|
— |
|
$ |
41,149,000 |
|
|
Jul-14 |
|
115 Spring Street |
|
Fee Interest |
|
Soho |
|
5,218 |
|
100.0 |
|
100.0 |
|
$ |
52,000,000 |
|
|
Jul-14 |
|
752 Madison Avenue |
|
Fee Interest |
|
Plaza District |
|
21,124 |
|
100.0 |
|
100.0 |
|
$ |
282,415,000 |
|
|
Sep-14 |
|
121 Greene Street - 50% |
|
Fee Interest |
|
Soho |
|
7,131 |
|
100.0 |
|
100.0 |
|
$ |
27,400,000 |
|
|
Sep-14 |
|
635 Madison Avenue (2) |
|
Fee Interest |
|
Plaza District |
|
176,530 |
|
100.0 |
|
100.0 |
|
$ |
145,000,000 |
|
|
Oct-14 |
|
102 Greene Street |
|
Fee Interest |
|
Soho |
|
9,200 |
|
100.0 |
|
54.3 |
|
$ |
32,250,000 |
|
|
Oct-14 |
|
175-225 Third Street - 95% |
|
Fee Interest |
|
Brooklyn, New York |
|
— |
|
— |
|
— |
|
$ |
72,500,000 |
|
|
Nov-14 |
|
55 West 46th Street |
|
Fee Interest |
|
Midtown |
|
347,000 |
|
— |
|
— |
|
$ |
295,000,000 |
|
|
|
|
|
|
|
|
|
|
572,203 |
|
|
|
|
|
$ |
947,714,000 |
|
|
|
|
|
|
|
|
|
|
|
|
|
|
|
|
|
| |
|
2015 Acquisition |
|
|
|
|
|
|
|
|
|
|
|
|
|
|
| |
|
Feb-15 |
|
Stonehenge Portfolio |
|
Fee Interest |
|
|
|
2,589,184 |
|
96.5 |
|
96.9 |
|
$ |
40,000,000 |
|
|
Mar-15 |
|
1640 Flatbush Avenue |
|
Fee Interest |
|
Brooklyn, New York |
|
1,000 |
|
100.0 |
|
100.0 |
|
$ |
6,798,627 |
|
|
Jun-15 |
|
Upper East Side Residential - 90% |
|
Fee Interest |
|
Upper East Side |
|
27,000 |
|
96.4 |
|
96.4 |
|
$ |
50,073,674 |
|
|
|
|
|
|
|
|
|
|
2,617,184 |
|
|
|
|
|
$ |
96,872,301 |
|
(1) Acquisition price represents purchase price for consolidated acquisitions and purchase price or imputed value for joint venture properties.
(2) Subject to long-term, third party net operating leases.
|
Supplemental Information |
Second Quarter 2015 |
|
SUMMARY OF REAL ESTATE SALES ACTIVITY Retail, Residential, Development / Redevelopment & Land |
|

|
|
|
|
|
|
|
|
|
|
|
Sales |
|
Sales |
| ||
|
|
|
Property |
|
Type of Ownership |
|
Submarket |
|
Net Rentable SF |
|
Price ($’s) |
|
Price ($’s/SF) |
| ||
|
2011 Sales |
|
|
|
|
|
|
|
|
|
|
|
|
| ||
|
Sep-11 |
|
1551-1555 Broadway (1) |
|
Fee Interest |
|
Times Square |
|
25,600 |
|
$ |
276,757,000 |
|
$ |
10,811 |
|
|
|
|
|
|
|
|
|
|
|
|
|
|
|
| ||
|
2012 Sales |
|
|
|
|
|
|
|
|
|
|
|
|
| ||
|
Feb-12 |
|
141 Fifth Avenue (2) |
|
Fee Interest |
|
Flatiron |
|
13,000 |
|
$ |
46,000,000 |
|
$ |
3,538 |
|
|
Feb-12 |
|
292 Madison Avenue |
|
Fee Interest |
|
Grand Central South |
|
203,800 |
|
$ |
85,000,000 |
|
$ |
417 |
|
|
Apr-12 |
|
379 West Broadway |
|
Leasehold Interest |
|
Cast Iron/Soho |
|
62,006 |
|
$ |
48,500,000 |
|
$ |
782 |
|
|
Jun-12 |
|
717 Fifth Avenue (3) |
|
Fee Interest |
|
Midtown/Plaza District |
|
119,550 |
|
$ |
617,583,774 |
|
$ |
5,166 |
|
|
Sep-12 |
|
3 Columbus Circle (4) |
|
Fee Interest |
|
Columbus Circle |
|
214,372 |
|
$ |
143,600,000 |
|
$ |
670 |
|
|
|
|
|
|
|
|
|
|
612,728 |
|
$ |
940,683,774 |
|
|
| |
|
2013 Sales |
|
|
|
|
|
|
|
|
|
|
|
|
| ||
|
Feb-13 |
|
44 West 55th Street |
|
Fee Interest |
|
Plaza District |
|
8,557 |
|
$ |
6,250,000 |
|
$ |
730 |
|
|
Jun-13 |
|
West Coast Office Portfolio |
|
Fee Interest |
|
Los Angeles, California |
|
406,740 |
|
$ |
111,925,000 |
|
$ |
275 |
|
|
Aug-13 |
|
West Coast Office Portfolio |
|
Fee Interest |
|
Fountain Valley, California |
|
302,037 |
|
$ |
66,993,750 |
|
$ |
222 |
|
|
Sep-13 |
|
West Coast Office Portfolio |
|
Fee Interest |
|
San Diego, California |
|
110,511 |
|
$ |
45,400,000 |
|
$ |
411 |
|
|
Dec-13 |
|
27-29 West 34th Street |
|
Fee Interest |
|
Herald Square/Penn Station |
|
15,600 |
|
$ |
70,052,158 |
|
$ |
4,491 |
|
|
|
|
|
|
|
|
|
|
843,445 |
|
$ |
300,620,908 |
|
|
| |
|
2014 Sales |
|
|
|
|
|
|
|
|
|
|
|
|
| ||
|
Jan-14 |
|
21-25 West 34th Street |
|
Fee Interest |
|
Herald Square/Penn Station |
|
30,100 |
|
$ |
114,947,844 |
|
$ |
3,819 |
|
|
Mar-14 |
|
West Coast Office Portfolio |
|
Fee Interest |
|
|
|
3,654,315 |
|
$ |
756,000,000 |
|
$ |
207 |
|
|
May-14 |
|
747 Madison Avenue |
|
Fee Interest |
|
Plaza District |
|
10,000 |
|
$ |
160,000,000 |
|
$ |
16,000 |
|
|
Jul-14 |
|
985-987 Third Avenue |
|
Fee Interest |
|
Upper East Side |
|
13,678 |
|
$ |
68,700,000 |
|
$ |
5,023 |
|
|
Sep-14 |
|
180-182 Broadway |
|
Fee Interest |
|
Cast Iron / Soho |
|
156,086 |
|
$ |
222,500,000 |
|
$ |
1,425 |
|
|
Nov-14 |
|
2 Herald Square |
|
Fee Interest |
|
Herald Square/Penn Station |
|
354,400 |
|
$ |
365,000,000 |
|
$ |
1,030 |
|
|
|
|
|
|
|
|
|
|
4,218,579 |
|
$ |
1,687,147,844 |
|
|
| |
|
2015 Sales |
|
|
|
|
|
|
|
|
|
|
|
|
| ||
|
Jan-15 |
|
180 Maiden Lane |
|
Fee Interest |
|
Financial East |
|
1,090,000 |
|
$ |
470,000,000 |
|
$ |
431 |
|
(1) Company sold our remaining 10% JV interest in the property at an implied $276.8 million sales price.
(2) Inclusive of the fee position which was acquired simultaneously with the sale pursuant to an option.
(3) Company sold 50% of its remaining interest after a promote. The Company retained a 10.92% interest in the property.
(4) The joint venture sold a 29% condominium interest in the property.
|
Supplemental Information |
Second Quarter 2015 |
|
|
|
|
Executive & Senior Management
|
|
|
|
|

Stephen L. Green
Chairman of the Board
Marc Holliday
Chief Executive Officer
Andrew Mathias
President
Matthew J. DiLiberto
Chief Financial Officer
Andrew S. Levine
Chief Legal Officer
Steven M. Durels
Executive Vice President, Director of Leasing and Real Property
Edward V. Piccinich
Executive Vice President, Property Management and Construction
Neil H. Kessner
Executive Vice President, General Counsel - Real Property
David M. Schonbraun
Co-Chief Investment Officer
Isaac Zion
Co-Chief Investment Officer
Maggie Hui
Chief Accounting Officer
|
|
|
|
ANALYST COVERAGE
|
|
|
|
|

ANALYST COVERAGE
|
Firm |
|
Analyst |
|
Phone |
|
|
|
Bank of America Merrill Lynch |
|
James C. Feldman |
|
(646) 855-5808 |
|
james.feldman@baml.com |
|
Barclays Capital |
|
Ross Smotrich |
|
(212) 526-2306 |
|
ross.smotrich@barcap.com |
|
Cantor Fitzgerald |
|
David Toti |
|
(212) 915-1219 |
|
dtoti@cantor.com |
|
Citigroup |
|
Michael Bilerman |
|
(212) 816-1383 |
|
michael.bilerman@citigroup.com |
|
Credit Suisse |
|
Ian C. Weissman |
|
(212) 538-6889 |
|
ian.weissman@credit-suisse.com |
|
Deutsche Bank |
|
Vin Chao |
|
(212) 250-6799 |
|
vincent.chao@db.com |
|
Goldman Sachs & Co. |
|
Brad Burke |
|
(917) 343-2082 |
|
brad.burke@gs.com |
|
Green Street Advisors |
|
Michael Knott |
|
(949) 640-8780 |
|
mknott@greenstreetadvisors.com |
|
ISI Group |
|
Steve Sakwa |
|
(212) 446-9462 |
|
ssakwa@isigrp.com |
|
Jefferies & Company |
|
Tayo Okusanya |
|
(212) 336-7076 |
|
tokusanya@jefferies.com |
|
JMP Securities |
|
Mitchell Germain |
|
(212) 906-3546 |
|
mgermain@jmpsecurities.com |
|
JP Morgan Securities, Inc. |
|
Anthony Paolone |
|
(212) 622-6682 |
|
anthony.paolone@jpmorgan.com |
|
KeyBanc Capital Markets |
|
Jordan Sadler |
|
(917) 368-2280 (212) 761-0078 |
|
jsadler@keybanccm.com vance.edelson@morganstanley.com |
|
RW Baird |
|
David Rodgers |
|
(216) 737-7341 |
|
drodgers@rwbaird.com |
|
Sandler O’Neill + Partners, L.P. |
|
Alexander D. Goldfarb |
|
(212) 466-7937 |
|
agoldfarb@sandleroneill.com |
|
Stifel Nicolaus |
|
John Guinee |
|
(443) 224-1307 |
|
jwguinee@stifel.com |
|
SunTrust Robinson Humphrey |
|
Michael Lewis |
|
(404) 926-5000 |
|
michael.lewis@suntrust.com |
|
UBS Securities LLC |
|
Ross T. Nussbaum |
|
(212) 713-2484 |
|
ross.nussbaum@ubs.com |
|
Wells Fargo Securities, LLC |
|
Brendan Maiorana |
|
(443) 263-6516 |
|
brendan.maiorana@wachovia.com |
FIXED INCOME COVERAGE
|
Firm |
|
Analyst |
|
Phone |
|
|
|
Bank of America Merrill Lynch |
|
Larry Zaccherio |
|
(646) 855-7662 |
|
larry.zaccherio@baml.com |
|
Citigroup |
|
Thomas Cook |
|
(212) 723-1112 |
|
thomas.n.cook@citi.com |
|
Goldman Sachs & Co. |
|
Louise Pitt |
|
(212) 902-3644 |
|
louise.pitt@gs.com |
|
JP Morgan Securities, Inc. |
|
Mark Streeter |
|
(212) 834-6601 |
|
mark.streeter@jpmorgan.com |
|
Wells Fargo Securities, LLC |
|
Thierry B. Perrein |
|
(704) 715-8455 |
|
thierry.perrein@wellsfargo.com |
SL Green Realty Corp. is followed by the analysts listed above. Please note that any opinions, estimates or forecasts regardi ng SL Green Realty Corp.’s performance made by these analysts are theirs alone and do not represent opinions, forecasts or predictions of SL Green Realty Corp. or its management. SL Green Realty Corp. does not by its reference above or distribution imply its endorsement of or concurrence with such information, conclusions or recommendations.
|
|
|
|
SUPPLEMENTAL DEFINITIONS
|
|
|
|
|

Adjusted EBITDA is calculated by adding income taxes, loan loss reserves and our share of joint venture depreciation and amortization to operating income.
Annualized rent is calculated as monthly base rent and escalations per the lease, as of a certain date, multiplied by 12.
Debt service coverage is adjusted EBITDA divided by total interest and principal payments.
Fixed charge is the total payments for interest, principal amortization, ground leases and preferred stock dividend.
Fixed charge coverage is adjusted EBITDA divided by fixed charge.
Funds available for distribution (FAD) is defined as FFO plus non-real estate depreciation, allowance for straight line credit loss, adjustment for straight line ground rent, non-cash deferred compensation, a pro-rata adjustment for FAD for SLG’s unconsolidated JV, less straight line rental income, free rent net of amortization, second cycle tenant improvement and leasing costs, and recurring building improvements.
Funds from operations (FFO) is defined under the White Paper approved by the Board of Governors of NAREIT in April 2002, as amended, as net income (loss) (computed in accordance with GAAP), excluding gains (or losses) from debt restructuring, sales of properties and real estate related impairment charges, plus real estate depreciation and amortization and after adjustments for unconsolidated partnerships and joint ventures.
Interest coverage is adjusted EBITDA divided by total interest expense. Junior Mortgage Participations are subordinate interests in first mortgages. Mezzanine Debt Loans are loans secured by ownership interests.
Percentage leased represents the percentage of leased square feet, including month-to-month leases, to total rentable square feet owned, as of the date reported. Space is considered leased when the tenant has either taken physical or economic occupancy.
Preferred Equity Investments are equity investments entitled to preferential returns that are senior to common equity.
Recurring capital expenditures represents non-incremental building improvements and leasing costs required to maintain current revenues. Recurring capital expenditures do not include immediate building improvements that were taken into consideration when underwriting the purchase of a building or which are incurred to bring a building up to “operating standard.”
Redevelopment costs are non-recurring capital expenditures incurred in order to improve buildings to SLG’s “operating standards.” These building costs are taken into consideration during the underwriting for a given property’s acquisition.
Same-store NOI growth is the change in the NOI of the same-store properties from the prior year reporting period to the current year reporting period.
Same-store properties include all properties that were owned in the same manner during both the current and prior year reporting periods, and excludes development properties prior to being stabilized for both the current and prior reporting period.
Second generation TIs and LCs are tenant improvements, lease commissions, and other leasing costs incurred during leasing of second generation space. Costs incurred prior to leasing available square feet are not included until such space is leased. Second generation space excludes square footage vacant at acquisition.
SLG’s share of total debt to market capitalization is calculated as SLG’s share of total debt divided by the sum of total debt plus market equity and preferred stock at liquidation value. SLG’s share of total debt includes total consolidated debt plus SLG’s pro rata share of the debt of unconsolidated joint ventures. Market equity assumes conversion of all OP units into common stock.
Total square feet owned represents 100% of the square footage of properties either owned directly by SLG or in which SLG has an interest (e.g. joint ventures).