Attached files
| file | filename |
|---|---|
| EX-99.1 - EX-99.1 - JUNIPER NETWORKS INC | d149800dex991.htm |
| 8-K - FORM 8-K - JUNIPER NETWORKS INC | d149800d8k.htm |
Exhibit 99.2

Juniper Networks, Inc.
1133 Innovation Way
Sunnyvale, CA 94089
July 23, 2015
CFO Commentary on Second Quarter 2015 Financial Results
Related Information
The following commentary is provided by management and should be referenced in conjunction with Juniper Networks’ second quarter 2015 financial results press release available on its Investor Relations website at http://investor.juniper.net. These remarks represent management’s current views of the Company’s financial and operational performance and outlook and are provided to give investors and analysts further insight into its performance in advance of the earnings call webcast.
Q2 2015 Financial Results
GAAP
| (in millions, except per share amounts and percentages) | Q2’15 | Q1’15 | Q2’14 | Q/Q Change | Y/Y Change | |||||||||||||||
| Revenue |
$ | 1,222.2 | $ | 1,067.4 | $ | 1,229.5 | 15 | % | (1 | )% | ||||||||||
| Product |
899.7 | 764.1 | 929.2 | 18 | % | (3 | )% | |||||||||||||
| Service |
322.5 | 303.3 | 300.3 | 6 | % | 7 | % | |||||||||||||
| Gross margin % |
63.9 | % | 61.6 | % | 60.9 | % | 2.3 | pts | 3.0 | pts | ||||||||||
| Research and development |
251.6 | 248.7 | 255.5 | 1 | % | (2 | )% | |||||||||||||
| Sales and marketing |
232.4 | 220.2 | 258.0 | 6 | % | (10 | )% | |||||||||||||
| General and administrative |
56.3 | 55.2 | 60.6 | 2 | % | (7 | )% | |||||||||||||
| Restructuring and other (credit) charges |
(1.9 | ) | 1.4 | 58.2 | (236 | )% | (103 | )% | ||||||||||||
|
|
|
|
|
|
|
|||||||||||||||
| Total operating expenses |
538.4 | 525.5 | 632.3 | 2 | % | (15 | )% | |||||||||||||
|
|
|
|
|
|
|
|||||||||||||||
| Operating margin % |
19.9 | % | 12.3 | % | 9.4 | % | 7.6 | pts | 10.5 | pts | ||||||||||
|
|
|
|
|
|
|
|||||||||||||||
| Net income |
$ | 158.0 | $ | 80.2 | $ | 221.1 | 97 | % | (29 | )% | ||||||||||
|
|
|
|
|
|
|
|||||||||||||||
| EPS (Diluted) |
$ | 0.40 | $ | 0.19 | $ | 0.46 | 111 | % | (13 | )% | ||||||||||
|
|
|
|
|
|
|
|||||||||||||||
Non-GAAP
| (in millions, except per share amounts and percentages) |
Q3’15 Guidance | Q2’15 | Q1’15 | Q2’14 | Q/Q Change | Y/Y Change | ||||||||||||||||
| Revenue(*) |
$1,230 +/-$20 | $ | 1,222.2 | $ | 1,067.4 | $ | 1,198.1 | 15 | % | 2 | % | |||||||||||
| Product(*) |
899.7 | 764.1 | 913.3 | 18 | % | (1 | )% | |||||||||||||||
| Service(*) |
322.5 | 303.3 | 284.8 | 6 | % | 13 | % | |||||||||||||||
| Gross margin % |
64% +/- 0.5% | 64.8% | 63.1 | % | 64.2 | % | 1.7 | pts | 0.6 | pts | ||||||||||||
| Research and development |
218.4 | 216.8 | 222.9 | 1 | % | (2 | )% | |||||||||||||||
| Sales and marketing |
217.6 | 212.8 | 241.5 | 2 | % | (10 | )% | |||||||||||||||
| General and administrative |
47.7 | 47.1 | 50.8 | 1 | % | (6 | )% | |||||||||||||||
|
|
|
|
|
|
|
|||||||||||||||||
| Total operating expenses |
$485 +/- $5 | 483.7 | 476.7 | 515.2 | 1 | % | (6 | )% | ||||||||||||||
|
|
|
|
|
|
|
|||||||||||||||||
| Operating margin % |
24.5% (mdpt. of rev.) | 25.2 | % | 18.5 | % | 22.3 | % | 6.7 | pts | 2.9 | pts | |||||||||||
|
|
|
|
|
|
|
|||||||||||||||||
| Net income |
$ | 208.8 | $ | 131.6 | $ | 190.3 | 59 | % | 10 | % | ||||||||||||
|
|
|
|
|
|
|
|||||||||||||||||
| EPS (Diluted) |
$0.50 - $0.54 | $ | 0.53 | $ | 0.32 | $ | 0.40 | 66 | % | 33 | % | |||||||||||
|
|
|
|
|
|
|
|||||||||||||||||
| (*) | Revenue numbers are GAAP, other than for Q2’14, which have been normalized for the sale of Junos Pulse. |
The following CFO Commentary contains non-GAAP financial measures, and the reconciliations to GAAP can be found at the end of this document. Also, prior year revenue has been normalized for the sale of Junos Pulse.
Overview
For the second quarter of 2015, we delivered strong financial results, which reflects the strength in our underlying business and the focused execution of our strategy. Our results exceeded both our revenue and earnings expectations for the quarter and reflect solid sequential growth across routing, switching, and security. The following factors contributed to the revenue outperformance this quarter:
| • | Revenue recognized from product deferred revenue, the majority of which was due to the delivery of product and feature commitments, and a sell through of channel inventory. |
| • | Demand was also better than we anticipated in the following areas: Cloud and Cable Providers, Enterprise, and to a lesser extent, a sequential improvement from regional Carriers in the Americas. |
| • | This improved demand was also reflected in Security, which had a growth quarter due to the timing of high-end SRX deployments. |
The underlying demand metrics were healthy this quarter with product book-to-bill greater than 1. Product backlog increased both sequentially and year-over-year. As noted above, the sequential decline of approximately 19% in product deferred revenue positively contributed to our results this quarter.
Solid execution, focus on revenue growth, effective management of our cost structure, and the significant reduction in share count enabled us to deliver strong year-over-year and quarter-over-quarter non-GAAP operating margin and earnings per share expansion.
In the quarter, we completed $600 million of share repurchases. Since Q1 2014, inclusive of share repurchases and dividends, we have returned approximately $3.4 billion of capital to shareholders against our commitment to return $4.1 billion by the end of 2016.
Revenue
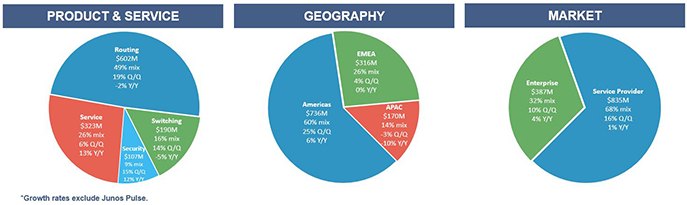
Product & Service
| • | Routing product revenue: $602 million, down 2% year-over-year and up 19% from the prior quarter. The year-over-year decline was due to expected softness from large US Carriers, partially offset by continued momentum from Cloud and Cable Providers and an increase from Enterprise in EMEA and the Americas. Sequentially, the increase was due to similar factors but we also saw good quarter-over-quarter growth from regional US Carriers which was partially offset by weakness from China and the timing of demand with Middle East Carriers. |
| • | Switching product revenue: $190 million, a decrease of 5% year-over-year, primarily due to a decrease in Enterprise campus and branch partially offset by an increase in data center and Service Providers. Quarter-over-quarter, switching product revenue increased 14% due to strength in Enterprise and growth from Cloud Providers and Carriers. |
| • | Security product revenue: $107 million, up 12% year-over-year and 15% sequentially. The year-over-year increase was due to growth in the Americas from Cloud and Cable Providers, as well as Enterprise. The sequential increase resulted from growth in Service Providers in the Americas, as well as strength from the Enterprise market in EMEA. |
SRX Platform and Security Software was up 22% year-over-year and 18% quarter-over-quarter, while our Screen OS and Other Legacy products were down 34% year-over-year and flat from the prior quarter.
Despite the improvement in security revenue this quarter, there is still work to do to stabilize this area of our business and we remain focused on executing our strategy.
| • | Service revenue: $323 million, up 13% year-over-year and 6% quarter-over-quarter. The year-over-year and sequential increase in service revenue was primarily driven by new service contracts, the delivery of certain projects, and strong contract renewals. |
Geography
| • | Americas: $736 million, up 6% year-over-year and 25% quarter-over-quarter. The year-over-year increase was primarily due to growth from Cloud and Cable Providers and Enterprise partially offset by the expected decline from large US Carriers. The quarter-over-quarter strength was primarily due to good growth from Service Providers—despite continued softness from large Carriers—across all technologies and growth from routing and switching in Enterprise. |
| • | EMEA: $316 million, flat year-over-year and up 4% from the prior quarter. Year-over-year and sequentially, we saw good growth in the Enterprise market offset by modest declines in Service Providers. The sequential strength from Cloud and Cable Providers was partially offset by lower revenues from Carriers due to the timing of deployments specifically in the Middle East and Scandinavia. |
| • | APAC: $170 million, down 10% year-over-year and 3% quarter-over-quarter. The year-over-year and sequential decrease was primarily due to significant revenue declines in China, and to a lesser extent Japan and Korea. APAC revenue, excluding China, would have grown 11% sequentially. |
Market
| • | Service Provider: $835 million, up 1% year-over-year and 16% from the prior quarter. Cloud and Cable Providers increased year-over-year and sequentially. As expected, Carriers were down from the prior year but increased modestly quarter-over-quarter primarily due to regional US Carriers. By technology, we saw good sequential growth across routing, switching and security. |
| • | Enterprise: $387 million, up 4% from the prior year and 10% from last quarter. Overall, in Enterprise we saw continued year-over-year and quarter-over-quarter momentum in the data center. Campus and branch declined from the prior year but increased sequentially. |
Gross Margins
| • | Non-GAAP gross margins: 64.8%, compared to 64.2% from prior year and 63.1% from last quarter. |
| • | Non-GAAP product gross margins: 66.1%, up seven tenths of a point from a year ago and 2.2 points from last quarter due to lower costs, higher revenue, and product mix. While the pricing environment is consistently competitive, we remain focused on delivering innovation and continued improvements to our cost structure. |
| • | Non-GAAP service gross margins: 61.3%, up eight tenths of a point from a year ago and flat quarter-over-quarter. The year-over-year increase was due to higher service contracts and lower delivery costs. Sequentially, the favorable variance due to higher revenue was offset by higher service delivery costs primarily for spare parts. |
Operating Expenses
| • | Non-GAAP operating expenses: $484 million, a reduction of $32 million, or 6% year-over-year. We are pleased with our continued focus on managing our operating expenses. We were able to deliver operating expenses close to our guidance range despite significant additional variable costs due to higher revenues. Operating expenses were 39.6% of revenue, as reported for the quarter, down 2.3 points year-over-year and 5.1 points quarter-over-quarter, demonstrating good progress towards our long-term model of 39%. |
Operating Margins
| • | Non-GAAP operating margins: 25.2%, an improvement of 2.9 points year-over-year and 6.7 points sequentially. This reflects our continued focus on top line growth and cost management. |
Tax Rate
| • | Non-GAAP tax rate: 27.4%, an increase compared to 26.9% last quarter, mainly due to a change in the geographic mix of earnings. |
Diluted Earnings Per Share
| • | Non-GAAP diluted earnings per share: $0.53, increased $0.13 year-over-year primarily due to the positive impact from reduced share count, cost reductions, and higher revenue. The sequential increase of $0.21 was primarily due to higher revenue and gross margins and the positive impact from reduced share count. |
Balance Sheet, Cash Flow, and Capital Return
| (in millions) | Q2’15 | Q1’15 | Q4’14 | Q3’14 | Q2’14 | |||||||||||||||
| Cash(1) |
$ | 3,076.3 | $ | 3,450.6 | $ | 3,104.9 | $ | 3,321.0 | $ | 3,960.4 | ||||||||||
| Debt |
1,948.6 | 1,948.6 | 1,349.0 | 1,348.9 | 1,348.9 | |||||||||||||||
| Net cash and investments |
1,127.7 | 1,502.0 | 1,755.9 | 1,972.1 | 2,611.5 | |||||||||||||||
| Operating cash flow(4) |
263.2 | 219.3 | 284.9 | (69.7 | ) | 423.6 | (2) | |||||||||||||
| Share repurchases |
600.0 | 400.0 | 500.0 | 850.0 | (3) | — | ||||||||||||||
| Dividends |
$ | 38.7 | $ | 40.8 | $ | 42.2 | $ | 43.8 | $ | — | ||||||||||
| Diluted shares |
397.2 | 414.2 | 432.4 | 454.8 | 476.5 | |||||||||||||||
| (1) | Cash includes cash, cash equivalents, and investments. |
| (2) | Includes $75 million from a patent litigation settlement. |
| (3) | Includes $300 million of shares that were delivered pursuant to the $1.2 billion accelerated share repurchase. |
| (4) | Certain prior period amounts have been reclassified to conform to the current period presentation. |
Balance Sheet
| • | Cash: $3.1 billion, with 9% held onshore. We believe our strong cash flow generation will increase our onshore cash balances in the second half of 2015. |
| • | Debt: $1.9 billion. We continue to maintain investment grade credit ratings of BBB/Baa2 by S&P and Moody’s. We believe that our debt also has well staggered maturities and aligns with our focus on an optimal capital structure. |
| • | Net cash and investments: $1.1 billion. A decline of $374 million quarter-over-quarter primarily due to share repurchases and dividend payments totaling $639 million offset by cash flow from operations of $263 million. |
Cash Flow
| • | Cash flow from operations: Cash flow from operations was $263 million, up from $219 million from the prior quarter, consistent with the growth in net income as well as good cash management. |
Capital Return
| • | We continue to deliver on our commitment to shareholders and execute on our capital return plan. |
| • | We repurchased $600 million of shares in the quarter. |
| • | Diluted share count declined 17% year-over-year. |
| • | Since Q1 2014, inclusive of share repurchases and dividends, we have returned approximately $3.4 billion of capital to shareholders against our commitment to return $4.1 billion by end of 2016. |
| • | A quarterly dividend of $0.10 per share was paid in June with the intent to grow it over time. |
| • | The Board approved a dividend of $0.10 per share for the third quarter of 2015 and approved an incremental $500 million share repurchase authorization. This approval is part of our commitment to return $4.1 billion of capital to shareholders by the end of 2016. |
Other Financial Metrics
| (in millions, except product book-to-bill, days sales outstanding (“DSO”), and headcount) | Q2’15 | Q1’15 | Q4’14 | Q3’14 | Q2’14 | |||||||||||||||
| Product book-to-bill |
>1 | >1 | >1 | 1 | 1 | |||||||||||||||
| DSO |
39 | 43 | 49 | 49 | 41 | |||||||||||||||
| Depreciation and amortization |
$ | 39.9 | $ | 46.0 | $ | 42.5 | $ | 44.3 | $ | 45.3 | ||||||||||
| Capital expenditures |
$ | 39.6 | $ | 44.2 | $ | 51.9 | $ | 42.4 | $ | 41.2 | ||||||||||
| Headcount |
8,815 | 8,772 | 8,806 | 9,059 | 9,083 | |||||||||||||||
Demand metrics
| • | Product book-to-bill was greater than 1. |
| • | Total deferred revenue was $1,104 million down $69 million year-over-year and $70 million quarter-over-quarter. |
| • | Product deferred revenue was $205 million, a decline of $46 million year-over-year and $48 million from the prior quarter. Sequentially, the reduction was due to the delivery of product and feature commitments and a decrease in channel inventory. |
DSO
| • | DSO: 39 days, compared to 43 days from the prior quarter, a decline of 4 days. The sequential decline was in-line with historical patterns and primarily due to improved shipment linearity and higher revenue compared to the prior quarter. |
Headcount
| • | 8,815, a decline of 268 employees or 3% year-over-year. |
Outlook
These metrics are provided on a non-GAAP basis, except for revenue and share count.
Industry trends continue to unfold largely as we expected. Consistent with our view last quarter, we anticipate an improvement in our revenue in the second half of 2015 relative to both the second half of 2014 and the first half of 2015.
Juniper Networks estimates that for the quarter ending September 30, 2015:
| • | Revenues will be approximately $1,230 million plus or minus $20 million. |
| • | Non-GAAP gross margin will be approximately 64%, plus or minus 0.5%. |
| • | Non-GAAP operating expenses will be $485 million, plus or minus $5 million. |
| • | Non-GAAP operating margin will be roughly 24.5% at the midpoint of revenue guidance. |
| • | Non-GAAP net income per share will range between $0.50 and $0.54 on a diluted basis. This assumes a share count of 390 million and a non-GAAP tax rate flat from the second quarter, assuming no renewal of the R&D tax credit for 2015. |
Forward-Looking Statements
Statements in this CFO Commentary and related conference call concerning Juniper Networks’ business, economic and market outlook, future financial and operating results, ability to deliver significant margin expansion, innovation pipeline, capital return program, and overall future prospects are forward looking statements that involve a number of uncertainties and risks. Actual results or events could differ materially from those anticipated in those forward-looking statements as a result of several factors, including: general economic and political conditions globally or regionally; business and economic conditions in the networking industry; changes in overall technology spending and spending by communication service providers and major customers; the network capacity requirements of communication service providers; contractual terms that may result in the deferral of revenue; increases in and the effect of competition; the timing of orders and their fulfillment; manufacturing and supply chain constraints; availability of key product components; ability to establish and maintain relationships with distributors, resellers and other partners; variations in the expected mix of products sold; changes in customer mix; changes in geography mix; customer and industry analyst perceptions of Juniper Networks and its technology, products and future prospects; delays in scheduled product availability; market acceptance of Juniper Networks products and services; rapid technological and market change; adoption of regulations or standards affecting Juniper Networks products, services or the networking industry; the ability to successfully acquire, integrate and manage businesses and technologies; product defects, returns or vulnerabilities; the ability to recruit and retain key personnel; significant effects of tax legislation and judicial or administrative interpretation of tax regulations; currency fluctuations; litigation settlements and resolutions; the potential impact of activities related to the execution of capital return and product rationalization; and other factors listed in Juniper Networks’ most recent report on Form 10-Q filed with the Securities and Exchange Commission (“SEC”). All statements contained in this CFO Commentary and related conference call are made only as of the date set forth at the beginning of this document. Juniper Networks undertakes no obligation to update the information contained in this document or the related conference call in the event facts or circumstances subsequently change after the date of this document.
Use of Non-GAAP Financial Measures
This CFO Commentary contains references to the following non-GAAP financial measures: revenue; product revenue; service revenue; gross margin; product gross margin; service gross margin; product gross margin as a percentage of product revenue; service gross margin as a percentage of service revenue; gross margin as a percentage of revenue; research and development expense; sales and marketing expense; general and administrative expense; operating expense; operating expense as a percentage of revenue; operating income; operating margin; income tax rate; net income; and diluted net income per share. For important commentary on why Juniper Networks considers non-GAAP information a useful view of the company’s financial results, please see the press release furnished with our Form 8-K filed today with the SEC. With respect to future financial guidance provided on a non-GAAP basis, we have excluded estimates for amortization of intangible assets, share-based compensation expenses, acquisition-related charges, restructuring and other charges, impairment charges, professional services related to non-routine stockholder matters, litigation settlement and resolution charges, gain or loss on equity investments, retroactive impact of certain tax settlements, non-recurring income tax adjustments, valuation allowance on deferred tax assets, and income tax effect of non-GAAP exclusions. These measures are not presented in accordance with, nor are they a substitute for U.S. generally accepted accounting principles or GAAP. In addition, these measures may be different from non-GAAP measures used by other companies, limiting their usefulness for comparison purposes. The non-GAAP financial measures used in this CFO Commentary should not be considered in isolation from measures of financial performance prepared in accordance with GAAP. Investors are cautioned that there are material limitations associated with the use of non-GAAP financial measures as an analytical tool. In particular, many of the adjustments to our GAAP financial measures reflect the exclusion of items that are recurring and will be reflected in our financial results for the foreseeable future.
A reconciliation of non-GAAP guidance measures to corresponding GAAP measures is not available on a forward-looking basis due to the high variability and low visibility with respect to the charges which are excluded from these non-GAAP measures.
Juniper Networks, Inc.
Supplemental Data
(in millions)
Deferred Revenue
| As of | ||||||||
| June 30, 2015 |
December 31, 2014 |
|||||||
| Deferred product revenue: |
||||||||
| Undelivered product commitments and other product deferrals |
$ | 185.6 | $ | 180.3 | ||||
| Distributor inventory and other sell-through items |
62.3 | 103.7 | ||||||
|
|
|
|
|
|||||
| Deferred gross product revenue |
247.9 | 284.0 | ||||||
| Deferred cost of product revenue |
(42.8 | ) | (58.4 | ) | ||||
|
|
|
|
|
|||||
| Deferred product revenue, net |
205.1 | 225.6 | ||||||
| Deferred service revenue |
899.3 | 850.1 | ||||||
|
|
|
|
|
|||||
| Total |
$ | 1,104.4 | $ | 1,075.7 | ||||
|
|
|
|
|
|||||
| Reported as: |
||||||||
| Current |
$ | 795.4 | $ | 780.8 | ||||
| Long-term |
309.0 | 294.9 | ||||||
|
|
|
|
|
|||||
| Total |
$ | 1,104.4 | $ | 1,075.7 | ||||
|
|
|
|
|
|||||
Security Products: Quarterly Revenue Trend
| Q1’14(*) | Q2’14(*) | Q3’14(*) | Q4’14(*) | Q1’15 | Q2’15 | |||||||||||||||||||
| SRX Platform and Security Software |
$ | 91.3 | $ | 78.0 | $ | 87.6 | $ | 81.4 | $ | 81.1 | $ | 95.4 | ||||||||||||
| Screen OS and Other Legacy |
25.3 | 17.7 | 18.3 | 15.1 | 11.7 | 11.7 | ||||||||||||||||||
| Junos Pulse |
17.6 | 15.9 | 15.4 | — | — | — | ||||||||||||||||||
|
|
|
|
|
|
|
|
|
|
|
|
|
|||||||||||||
| Total product revenue |
$ | 134.2 | $ | 111.6 | $ | 121.3 | $ | 96.5 | $ | 92.8 | $ | 107.1 | ||||||||||||
|
|
|
|
|
|
|
|
|
|
|
|
|
|||||||||||||
| (*) | Certain prior period amounts have been reclassified to conform to the current period presentation. |
Juniper Networks, Inc.
GAAP to Non-GAAP Reconciliations
(in millions, except percentages and per share amounts)
Revenue by Product & Service Ex-Junos Pulse
| Revenue, As Reported | ||||||||||||||||||||||||||||||||||||||||
| Q1’14 | Q2’14 | Q3’14 | Q4’14 | Q1’15 | Q2’15 | Q/Q | Y/Y | |||||||||||||||||||||||||||||||||
| Routing |
$ | 549.8 | $ | 617.8 | $ | 533.2 | $ | 523.1 | $ | 504.8 | $ | 602.4 | $ | 97.6 | 19 | % | $ | (15.4 | ) | (2 | )% | |||||||||||||||||||
| Switching |
192.0 | 199.8 | 155.0 | 174.4 | 166.5 | 190.2 | 23.7 | 14 | % | (9.6 | ) | (5 | )% | |||||||||||||||||||||||||||
| Security |
134.2 | 111.6 | 121.3 | 96.5 | 92.8 | 107.1 | 14.3 | 15 | % | (4.5 | ) | (4 | )% | |||||||||||||||||||||||||||
|
|
|
|
|
|
|
|
|
|
|
|
|
|
|
|
|
|||||||||||||||||||||||||
| Product |
876.0 | 929.2 | 809.5 | 794.0 | 764.1 | 899.7 | 135.6 | 18 | % | (29.5 | ) | (3 | )% | |||||||||||||||||||||||||||
| Service |
294.1 | 300.3 | 316.4 | 307.6 | 303.3 | 322.5 | 19.2 | 6 | % | 22.2 | 7 | % | ||||||||||||||||||||||||||||
|
|
|
|
|
|
|
|
|
|
|
|
|
|
|
|
|
|||||||||||||||||||||||||
| Total |
$ | 1,170.1 | $ | 1,229.5 | $ | 1,125.9 | $ | 1,101.6 | $ | 1,067.4 | $ | 1,222.2 | $ | 154.8 | 15 | % | $ | (7.3 | ) | (1 | )% | |||||||||||||||||||
|
|
|
|
|
|
|
|
|
|
|
|
|
|
|
|
|
|||||||||||||||||||||||||
| Revenue, Ex-Junos Pulse | ||||||||||||||||||||||||||||||||||||||||
| Q1’14 | Q2’14 | Q3’14 | Q4’14 | Q1’15 | Q2’15 | Q/Q | Y/Y | |||||||||||||||||||||||||||||||||
| Routing |
$ | 549.8 | $ | 617.8 | $ | 533.2 | $ | 523.1 | $ | 504.8 | $ | 602.4 | $ | 97.6 | 19 | % | $ | (15.4 | ) | (2 | )% | |||||||||||||||||||
| Switching |
192.0 | 199.8 | 155.0 | 174.4 | 166.5 | 190.2 | 23.7 | 14 | % | (9.6 | ) | (5 | )% | |||||||||||||||||||||||||||
| Security |
116.6 | 95.7 | 105.9 | 96.5 | 92.8 | 107.1 | 14.3 | 15 | % | 11.4 | 12 | % | ||||||||||||||||||||||||||||
|
|
|
|
|
|
|
|
|
|
|
|
|
|
|
|
|
|||||||||||||||||||||||||
| Product |
858.4 | 913.3 | 794.1 | 794.0 | 764.1 | 899.7 | 135.6 | 18 | % | (13.6 | ) | (1 | )% | |||||||||||||||||||||||||||
| Service |
278.7 | 284.8 | 301.2 | 307.6 | 303.3 | 322.5 | 19.2 | 6 | % | 37.7 | 13 | % | ||||||||||||||||||||||||||||
|
|
|
|
|
|
|
|
|
|
|
|
|
|
|
|
|
|||||||||||||||||||||||||
| Total |
$ | 1,137.1 | $ | 1,198.1 | $ | 1,095.3 | $ | 1,101.6 | $ | 1,067.4 | $ | 1,222.2 | $ | 154.8 | 15 | % | $ | 24.1 | 2 | % | ||||||||||||||||||||
|
|
|
|
|
|
|
|
|
|
|
|
|
|
|
|
|
|||||||||||||||||||||||||
Revenue by Geography Ex-Junos Pulse
| Revenue, As Reported | ||||||||||||||||||||||||||||||||||||||||
| Q1’14 | Q2’14 | Q3’14 | Q4’14 | Q1’15 | Q2’15 | Q/Q | Y/Y | |||||||||||||||||||||||||||||||||
| Americas |
$ | 681.5 | $ | 711.0 | $ | 678.3 | $ | 559.5 | $ | 589.0 | $ | 735.8 | $ | 146.8 | 25 | % | $ | 24.8 | 3 | % | ||||||||||||||||||||
| EMEA |
295.7 | 324.8 | 290.5 | 352.3 | 303.8 | 316.3 | 12.5 | 4 | % | (8.5 | ) | (3 | )% | |||||||||||||||||||||||||||
| APAC |
192.9 | 193.7 | 157.1 | 189.8 | 174.6 | 170.1 | (4.5 | ) | (3 | )% | (23.6 | ) | (12 | )% | ||||||||||||||||||||||||||
|
|
|
|
|
|
|
|
|
|
|
|
|
|
|
|
|
|||||||||||||||||||||||||
| Total |
$ | 1,170.1 | $ | 1,229.5 | $ | 1,125.9 | $ | 1,101.6 | $ | 1,067.4 | $ | 1,222.2 | $ | 154.8 | 15 | % | $ | (7.3 | ) | (1 | )% | |||||||||||||||||||
|
|
|
|
|
|
|
|
|
|
|
|
|
|
|
|
|
|||||||||||||||||||||||||
| Revenue, Ex-Junos Pulse | ||||||||||||||||||||||||||||||||||||||||
| Q1’14 | Q2’14 | Q3’14 | Q4’14 | Q1’15 | Q2’15 | Q/Q | Y/Y | |||||||||||||||||||||||||||||||||
| Americas |
$ | 662.7 | $ | 693.9 | $ | 662.2 | $ | 559.5 | $ | 589.0 | $ | 735.8 | $ | 146.8 | 25 | % | $ | 41.9 | 6 | % | ||||||||||||||||||||
| EMEA |
286.7 | 315.3 | 280.6 | 352.3 | 303.8 | 316.3 | 12.5 | 4 | % | 1.0 | — | % | ||||||||||||||||||||||||||||
| APAC |
187.7 | 188.9 | 152.5 | 189.8 | 174.6 | 170.1 | (4.5 | ) | (3 | )% | (18.8 | ) | (10 | )% | ||||||||||||||||||||||||||
|
|
|
|
|
|
|
|
|
|
|
|
|
|
|
|
|
|||||||||||||||||||||||||
| Total |
$ | 1,137.1 | $ | 1,198.1 | $ | 1,095.3 | $ | 1,101.6 | $ | 1,067.4 | $ | 1,222.2 | $ | 154.8 | 15 | % | $ | 24.1 | 2 | % | ||||||||||||||||||||
|
|
|
|
|
|
|
|
|
|
|
|
|
|
|
|
|
|||||||||||||||||||||||||
Revenue by Market Ex-Junos Pulse
| Revenue, As Reported | ||||||||||||||||||||||||||||||||||||||||
| Q1’14 | Q2’14 | Q3’14 | Q4’14 | Q1’15 | Q2’15 | Q/Q | Y/Y | |||||||||||||||||||||||||||||||||
| SP |
$ | 782.7 | $ | 831.8 | $ | 741.5 | $ | 744.4 | $ | 717.0 | $ | 835.3 | $ | 118.3 | 16 | % | $ | 3.5 | — | % | ||||||||||||||||||||
| Enterprise |
387.4 | 397.7 | 384.4 | 357.2 | 350.4 | 386.9 | 36.5 | 10 | % | (10.8 | ) | (3 | )% | |||||||||||||||||||||||||||
|
|
|
|
|
|
|
|
|
|
|
|
|
|
|
|
|
|||||||||||||||||||||||||
| Total |
$ | 1,170.1 | $ | 1,229.5 | $ | 1,125.9 | $ | 1,101.6 | $ | 1,067.4 | $ | 1,222.2 | $ | 154.8 | 15 | % | $ | (7.3 | ) | (1 | )% | |||||||||||||||||||
|
|
|
|
|
|
|
|
|
|
|
|
|
|
|
|
|
|||||||||||||||||||||||||
| Revenue, Ex-Junos Pulse | ||||||||||||||||||||||||||||||||||||||||
| Q1’14 | Q2’14 | Q3’14 | Q4’14 | Q1’15 | Q2’15 | Q/Q | Y/Y | |||||||||||||||||||||||||||||||||
| SP |
$ | 777.4 | $ | 827.5 | $ | 733.8 | $ | 744.4 | $ | 717.0 | $ | 835.3 | $ | 118.3 | 16 | % | $ | 7.8 | 1 | % | ||||||||||||||||||||
| Enterprise |
359.7 | 370.6 | 361.5 | 357.2 | 350.4 | 386.9 | 36.5 | 10 | % | 16.3 | 4 | % | ||||||||||||||||||||||||||||
|
|
|
|
|
|
|
|
|
|
|
|
|
|
|
|
|
|||||||||||||||||||||||||
| Total |
$ | 1,137.1 | $ | 1,198.1 | $ | 1,095.3 | $ | 1,101.6 | $ | 1,067.4 | $ | 1,222.2 | $ | 154.8 | 15 | % | $ | 24.1 | 2 | % | ||||||||||||||||||||
|
|
|
|
|
|
|
|
|
|
|
|
|
|
|
|
|
|||||||||||||||||||||||||
Juniper Networks, Inc.
GAAP to Non-GAAP Reconciliations
(in millions, except percentages and per share amounts)
| Q2’15 | Q1’15 | Q2’14 | ||||||||||
| GAAP gross margin - Product |
$ | 588.0 | $ | 475.3 | $ | 569.9 | ||||||
| GAAP product gross margin % of product revenue |
65.4 | % | 62.2 | % | 61.3 | % | ||||||
| Share-based compensation expense |
1.5 | 1.7 | 1.3 | |||||||||
| Share-based payroll tax expense |
0.1 | 0.1 | 0.2 | |||||||||
| Amortization of purchased intangible assets |
4.7 | 10.8 | 8.4 | |||||||||
| Restructuring and other charges |
— | — | 13.8 | |||||||||
| Memory-related, supplier component remediation charge |
— | — | 13.7 | |||||||||
|
|
|
|
|
|
|
|||||||
| Non-GAAP gross margin - Product |
$ | 594.3 | $ | 487.9 | $ | 607.3 | ||||||
|
|
|
|
|
|
|
|||||||
| Non-GAAP product gross margin % of product revenue |
66.1 | % | 63.9 | % | 65.4 | % | ||||||
| GAAP gross margin - Service |
$ | 193.5 | $ | 182.0 | $ | 178.3 | ||||||
| GAAP service gross margin % of service revenue |
60.0 | % | 60.0 | % | 59.4 | % | ||||||
| Share-based compensation expense |
3.8 | 3.4 | 3.1 | |||||||||
| Share-based payroll tax expense |
0.3 | 0.4 | 0.4 | |||||||||
|
|
|
|
|
|
|
|||||||
| Non-GAAP gross margin - Service |
$ | 197.6 | $ | 185.8 | $ | 181.8 | ||||||
|
|
|
|
|
|
|
|||||||
| Non-GAAP service gross margin % of service revenue |
61.3 | % | 61.3 | % | 60.5 | % | ||||||
| GAAP gross margin |
$ | 781.5 | $ | 657.3 | $ | 748.2 | ||||||
| GAAP gross margin % of revenue |
63.9 | % | 61.6 | % | 60.9 | % | ||||||
| Share-based compensation expense |
5.3 | 5.1 | 4.4 | |||||||||
| Share-based payroll tax expense |
0.4 | 0.5 | 0.6 | |||||||||
| Amortization of purchased intangible assets |
4.7 | 10.8 | 8.4 | |||||||||
| Restructuring and other charges |
— | — | 13.8 | |||||||||
| Memory-related, supplier component remediation charge |
— | — | 13.7 | |||||||||
|
|
|
|
|
|
|
|||||||
| Non-GAAP gross margin |
$ | 791.9 | $ | 673.7 | $ | 789.1 | ||||||
|
|
|
|
|
|
|
|||||||
| Non-GAAP gross margin % of revenue |
64.8 | % | 63.1 | % | 64.2 | % | ||||||
| GAAP research and development expense |
$ | 251.6 | $ | 248.7 | $ | 255.5 | ||||||
| Share-based compensation expense |
(32.5 | ) | (30.7 | ) | (31.6 | ) | ||||||
| Share-based payroll tax expense |
(0.7 | ) | (1.2 | ) | (1.0 | ) | ||||||
|
|
|
|
|
|
|
|||||||
| Non-GAAP research and development expense |
$ | 218.4 | $ | 216.8 | $ | 222.9 | ||||||
|
|
|
|
|
|
|
|||||||
| GAAP sales and marketing expense |
$ | 232.4 | $ | 220.2 | $ | 258.0 | ||||||
| Share-based compensation expense |
(13.4 | ) | (5.8 | ) | (14.4 | ) | ||||||
| Share-based payroll tax expense |
(0.8 | ) | (0.8 | ) | (1.0 | ) | ||||||
| Amortization of purchased intangible assets |
(0.6 | ) | (0.8 | ) | (1.1 | ) | ||||||
|
|
|
|
|
|
|
|||||||
| Non-GAAP sales and marketing expense |
$ | 217.6 | $ | 212.8 | $ | 241.5 | ||||||
|
|
|
|
|
|
|
|||||||
| GAAP general and administrative expense |
$ | 56.3 | $ | 55.2 | $ | 60.6 | ||||||
| Share-based compensation expense |
(7.7 | ) | (4.4 | ) | (8.9 | ) | ||||||
| Share-based payroll tax expense |
(0.1 | ) | (0.4 | ) | (0.1 | ) | ||||||
| Amortization of purchased intangible assets |
(0.3 | ) | (0.3 | ) | (0.3 | ) | ||||||
| Professional services related to non-routine stockholder matters |
— | (3.0 | ) | (0.4 | ) | |||||||
| Other |
(0.5 | ) | — | (0.1 | ) | |||||||
|
|
|
|
|
|
|
|||||||
| Non-GAAP general and administrative expense |
$ | 47.7 | $ | 47.1 | $ | 50.8 | ||||||
|
|
|
|
|
|
|
|||||||
Juniper Networks, Inc.
GAAP to Non-GAAP Reconciliations
(in millions, except percentages and per share amounts)
| Q2’15 | Q1’15 | Q2’14 | ||||||||||
| GAAP operating expenses |
$ | 538.4 | $ | 525.5 | $ | 632.3 | ||||||
| GAAP operating expenses % of revenue |
44.1 | % | 49.2 | % | 51.4 | % | ||||||
| Share-based compensation expense |
(53.6 | ) | (40.9 | ) | (54.9 | ) | ||||||
| Share-based payroll tax expense |
(1.6 | ) | (2.4 | ) | (2.1 | ) | ||||||
| Amortization of purchased intangible assets |
(0.9 | ) | (1.1 | ) | (1.4 | ) | ||||||
| Restructuring and other (credit) charges |
1.9 | (1.4 | ) | (58.2 | ) | |||||||
| Professional services related to non-routine stockholder matters |
— | (3.0 | ) | (0.4 | ) | |||||||
| Other |
(0.5 | ) | — | (0.1 | ) | |||||||
|
|
|
|
|
|
|
|||||||
| Non-GAAP operating expenses |
$ | 483.7 | $ | 476.7 | $ | 515.2 | ||||||
|
|
|
|
|
|
|
|||||||
| Non-GAAP operating expenses % of revenue |
39.6 | % | 44.7 | % | 41.9 | % | ||||||
| GAAP operating income |
$ | 243.1 | $ | 131.8 | $ | 115.9 | ||||||
| GAAP operating margin |
19.9 | % | 12.3 | % | 9.4 | % | ||||||
| Share-based compensation expense |
58.9 | 46.0 | 59.3 | |||||||||
| Share-based payroll tax expense |
2.0 | 2.9 | 2.7 | |||||||||
| Amortization of purchased intangible assets |
5.6 | 11.9 | 9.8 | |||||||||
| Restructuring and other (credit) charges |
(1.9 | ) | 1.4 | 72.0 | ||||||||
| Memory-related, supplier component remediation charge |
— | — | 13.7 | |||||||||
| Professional services related to non-routine stockholder matters |
— | 3.0 | 0.4 | |||||||||
| Other |
0.5 | — | 0.1 | |||||||||
|
|
|
|
|
|
|
|||||||
| Non-GAAP operating income |
$ | 308.2 | $ | 197.0 | $ | 273.9 | ||||||
|
|
|
|
|
|
|
|||||||
| Non-GAAP operating margin |
25.2 | % | 18.5 | % | 22.3 | % | ||||||
| GAAP income tax provision |
$ | 68.0 | $ | 35.8 | $ | 73.4 | ||||||
| GAAP income tax rate |
30.1 | % | 30.9 | % | 24.9 | % | ||||||
| Income tax effect of non-GAAP exclusions |
10.8 | 12.7 | (6.5 | ) | ||||||||
|
|
|
|
|
|
|
|||||||
| Non-GAAP provision for income tax |
$ | 78.8 | $ | 48.5 | $ | 66.9 | ||||||
|
|
|
|
|
|
|
|||||||
| Non-GAAP income tax rate |
27.4 | % | 26.9 | % | 26.0 | % | ||||||
| GAAP net income |
$ | 158.0 | $ | 80.2 | $ | 221.1 | ||||||
| Share-based compensation expense |
58.9 | 46.0 | 59.3 | |||||||||
| Share-based payroll tax expense |
2.0 | 2.9 | 2.7 | |||||||||
| Amortization of purchased intangible assets |
5.6 | 11.9 | 9.8 | |||||||||
| Restructuring and other (credit) charges |
(1.9 | ) | 1.4 | 72.0 | ||||||||
| Memory-related, supplier component remediation charge |
— | — | 13.7 | |||||||||
| Professional services related to non-routine stockholder matters |
— | 3.0 | 0.4 | |||||||||
| Other |
(3.0 | ) | (1.1 | ) | 0.1 | |||||||
| Gain on legal settlement, net |
— | — | (195.3 | ) | ||||||||
| Income tax effect of non-GAAP exclusions |
(10.8 | ) | (12.7 | ) | 6.5 | |||||||
|
|
|
|
|
|
|
|||||||
| Non-GAAP net income |
$ | 208.8 | $ | 131.6 | $ | 190.3 | ||||||
|
|
|
|
|
|
|
|||||||
| GAAP diluted net income per share |
$ | 0.40 | $ | 0.19 | $ | 0.46 | ||||||
|
|
|
|
|
|
|
|||||||
| Non-GAAP diluted net income per share |
$ | 0.53 | $ | 0.32 | $ | 0.40 | ||||||
|
|
|
|
|
|
|
|||||||
| Shares used in computing diluted net income per share |
397.2 | 414.2 | 476.5 | |||||||||
|
|
|
|
|
|
|
|||||||