Attached files
| file | filename |
|---|---|
| 8-K - 8-K - AMAG PHARMACEUTICALS, INC. | a15-16116_18k.htm |
| EX-99.1 - EX-99.1 - AMAG PHARMACEUTICALS, INC. | a15-16116_1ex99d1.htm |
Exhibit 99.2
|
|
AMAG Pharmaceuticals 2Q 2015 Financial Results July 23, 2015 |
|
|
This presentation contains forward-looking statements within the meaning of the Private Securities Litigation Reform Act of 1995 (PSLRA) and other federal securities laws. Any statements contained herein which do not describe historical facts, including among others, statements regarding AMAG’s positioning for future acquisitions; AMAG’s updated 2015 financial guidance, including net product sales, revenues, adjusted EBITDA and cash earnings; the market opportunity for Makena, including opportunities to increase market share; beliefs that the acquisition of CBR will expand AMAG’s maternal health platform as well as the size of the addressable market and market conditions; expected timeline, benefits and synergies for the closing of the CBR acquisition, including that it will be immediately accretive to adjusted EBITDA and provide a durable, high-margin business; expectations for the Velo option, including its impact on AMAG’s position as, and AMAG’s belief that it is, a leader in maternal health and the transaction’s characterization as a measured investment at key value inflection points; Makena’s growth strategies and drivers for 2015; potential regulatory approval and launch of the single-dose, preservative-free Makena formulation, including timing, and expectations for other lifecycle management initiatives; Feraheme market dynamics, including plans to grow market share, drive total IV iron market growth and realize the benefits of pricing and contracting strategies; Feraheme growth opportunities in the CKD market and if approval of the broader IDA label is pursued and received; transformative growth expectations, including estimated pro-forma 2015 revenues and adjusted EBITDA; AMAG’s plans to execute on its business development strategy and beliefs that AMAG possesses commercial and operational excellence and its impact on continued growth; AMAG’s 2015 goals, including product growth across the portfolio, increase in adjusted EBITDA margin, execution on Makena’s line extension/lifecycle management program, the path forward (if any) for the broad IDA indication in the U.S., the closing of, integration of and realization of benefits/synergies from the CBR transaction and plans to further expand AMAG’s product portfolio are forward-looking statements which involve risks and uncertainties that could cause actual results to differ materially from those discussed in such forward-looking statements. Such risks and uncertainties include, among others, those risks identified in AMAG’s filings with the U.S. Securities and Exchange Commission (SEC), including its Annual Report on Form 10-K for the year ended December 31, 2014 and subsequent filings with the SEC. Any of the above risks and uncertainties could materially and adversely affect AMAG’s results of operations, its profitability and its cash flows, which would, in turn, have a significant and adverse impact on AMAG’s stock price. Use of the term “including” in this paragraph shall mean in each case “including, but not limited to.” AMAG cautions you not to place undue reliance on any forward-looking statements, which speak only as of the date they are made. AMAG disclaims any obligation to publicly update or revise any such statements to reflect any change in expectations or in events, conditions or circumstances on which any such statements may be based, or that may affect the likelihood that actual results will differ from those set forth in the forward-looking statements. AMAG Pharmaceuticals® and Feraheme® are registered trademarks of AMAG Pharmaceuticals, Inc. Lumara Health™ is a trademark of Lumara Health Inc. Makena® is a registered trademark of Lumara Health Inc. MuGard® is a registered trademark of Abeona Therapeutics, Inc. (formerly known as PlasmaTech Biopharmaceuticals, Inc. and Access Pharmaceuticals, Inc.). Cord Blood Registry® and CBR® are registered trademarks of CBR Systems, Inc. Forward-Looking Statements |
|
|
2Q15 Earnings Call Agenda 2 Agenda 2Q15 Highlights and Recent Developments 2Q15 Results and Financial Update Commercial Performance Update Maternal Health Hematology/Oncology & Hospital Portfolio Expansion Update 2015 Goals and Closing Remarks Q&A Speakers: Bill Heiden, Chief Executive Officer Frank Thomas, President & Chief Operating Officer Linda Lennox, Vice President, Investor Relations & Corporate Communications |
|
|
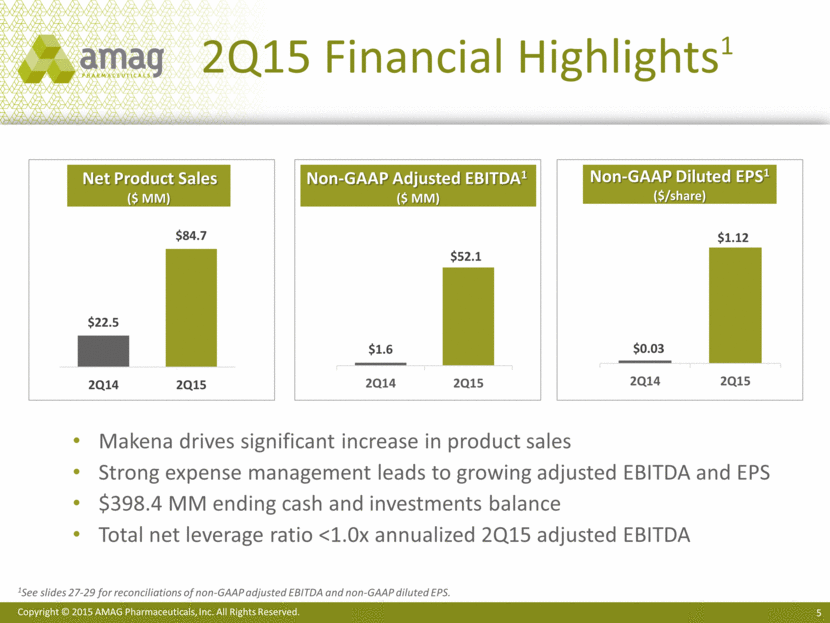
2Q15 Highlights and Recent Developments Achieved record sales and profitability Net product sales of $84.7 MM driven by Makena (+58% vs. 2Q14)1 Non-GAAP adjusted EBITDA increased to $52.1 MM2 Progressed Makena lifecycle management program Continued execution of BD strategy to further expand portfolio Announced planned acquisition of Cord Blood Registry Purchased option to acquire global rights to an orphan drug candidate for the treatment of severe preeclampsia in pregnant women Well positioned for future acquisitions 1Unaudited. Pro forma sales for the second quarter of 2014. Makena product acquired in November 2014. 2See slides 27-29 for reconciliation of GAAP to non-GAAP adjusted EBITDA. |
|
|
2Q15 Results & Financial Update Frank Thomas, President & COO |
|
|
2Q15 Financial Highlights1 Net Product Sales ($ MM) Non-GAAP Adjusted EBITDA1 ($ MM) Non-GAAP Diluted EPS1 ($/share) Makena drives significant increase in product sales Strong expense management leads to growing adjusted EBITDA and EPS $398.4 MM ending cash and investments balance Total net leverage ratio <1.0x annualized 2Q15 adjusted EBITDA 1See slides 27-29 for reconciliations of non-GAAP adjusted EBITDA and non-GAAP diluted EPS. $1.6 $52.1 2Q14 2Q15 $0.03 $1.12 2Q14 2Q15 |
|
|
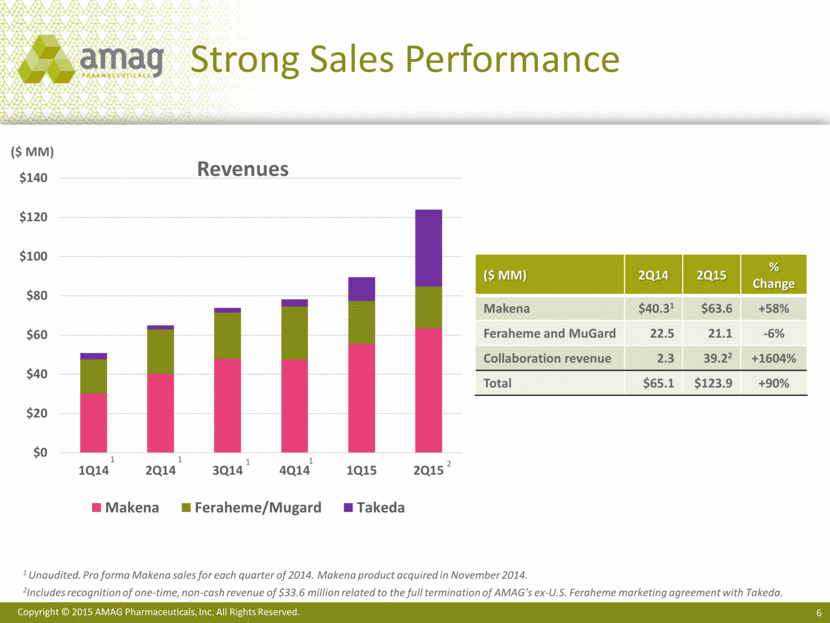
Strong Sales Performance 1 Unaudited. Pro forma Makena sales for each quarter of 2014. Makena product acquired in November 2014. 2Includes recognition of one-time, non-cash revenue of $33.6 million related to the full termination of AMAG’s ex-U.S. Feraheme marketing agreement with Takeda. ($ MM) 2Q14 2Q15 % Change Makena $40.31 $63.6 +58% Feraheme and MuGard 22.5 21.1 -6% Collaboration revenue 2.3 39.22 +1604% Total $65.1 $123.9 +90% 1 1 1 1 Revenues ($ MM) 2 $0 $20 $40 $60 $80 $100 $120 $140 1Q14 2Q14 3Q14 4Q14 1Q15 2Q15 Makena Feraheme/Mugard Takeda |
|
|
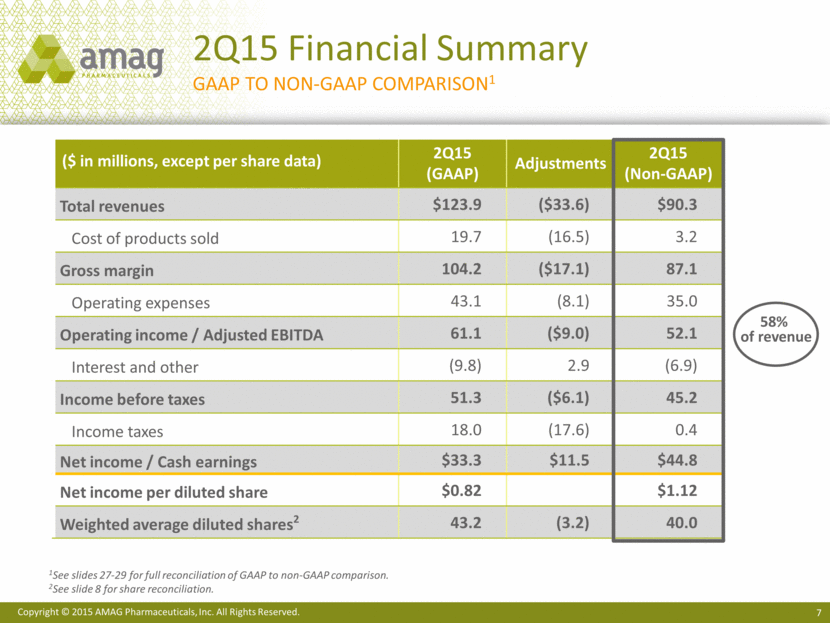
($ in millions, except per share data) 2Q15 (GAAP) Adjustments 2Q15 (Non-GAAP) Total revenues $123.9 ($33.6) $90.3 Cost of products sold 19.7 (16.5) 3.2 Gross margin 104.2 ($17.1) 87.1 Operating expenses 43.1 (8.1) 35.0 Operating income / Adjusted EBITDA 61.1 ($9.0) 52.1 Interest and other (9.8) 2.9 (6.9) Income before taxes 51.3 ($6.1) 45.2 Income taxes 18.0 (17.6) 0.4 Net income / Cash earnings $33.3 $11.5 $44.8 Net income per diluted share $0.82 $1.12 Weighted average diluted shares2 43.2 (3.2) 40.0 2Q15 Financial Summary GAAP to NON-GAAP Comparison1 1See slides 27-29 for full reconciliation of GAAP to non-GAAP comparison. 2See slide 8 for share reconciliation. 58% of revenue |
|
|
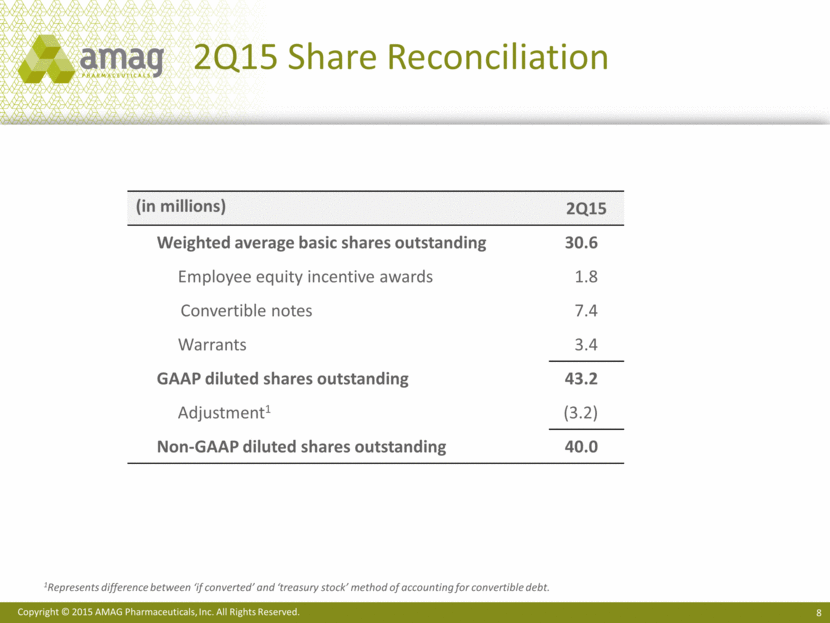
2Q15 Share Reconciliation 1Represents difference between ‘if converted’ and ‘treasury stock’ method of accounting for convertible debt. (in millions) 2Q15 Weighted average basic shares outstanding 30.6 Employee equity incentive awards 1.8 Convertible notes 7.4 Warrants 3.4 GAAP diluted shares outstanding 43.2 Adjustment1 (3.2) Non-GAAP diluted shares outstanding 40.0 |
|
|
|
|
|
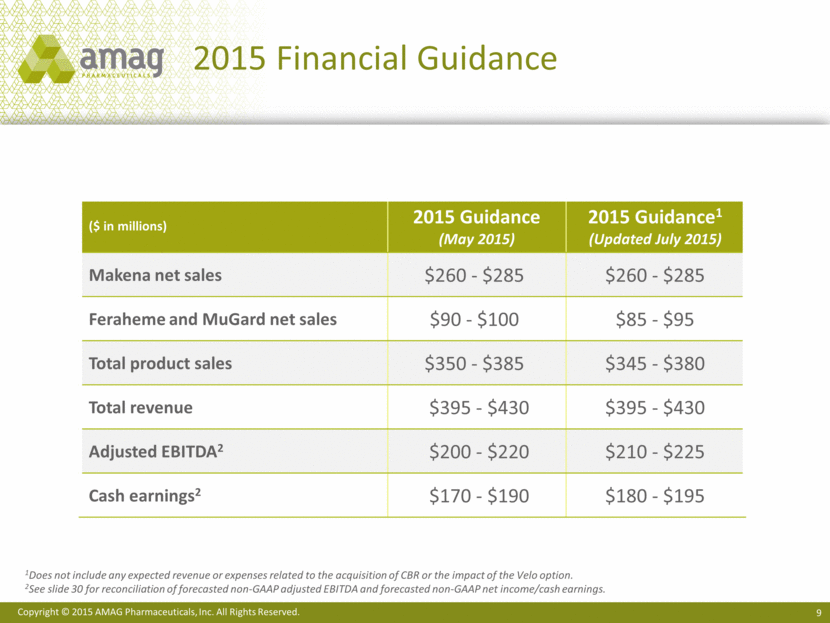
2015 Financial Guidance 1Does not include any expected revenue or expenses related to the acquisition of CBR or the impact of the Velo option. 2See slide 30 for reconciliation of forecasted non-GAAP adjusted EBITDA and forecasted non-GAAP net income/cash earnings. ($ in millions) 2015 Guidance (May 2015) 2015 Guidance1 (Updated July 2015) Makena net sales $260 - $285 $260 - $285 Feraheme and MuGard net sales $90 - $100 $85 - $95 Total product sales $350 - $385 $345 - $380 Total revenue $395 - $430 $395 - $430 Adjusted EBITDA2 $200 - $220 $210 - $225 Cash earnings2 $170 - $190 $180 - $195 |
|
|
Maternal Health Bill Heiden, CEO |
|
|
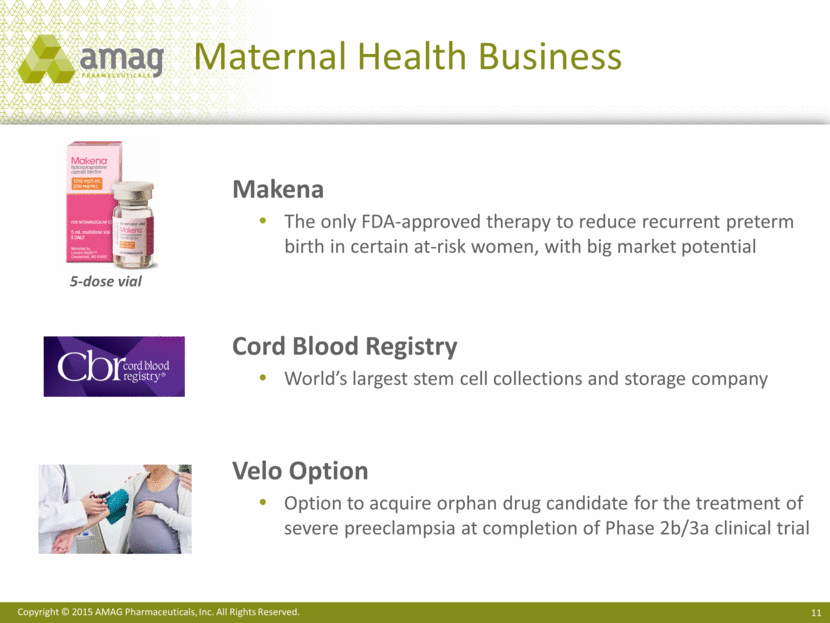
Maternal Health Business Makena The only FDA-approved therapy to reduce recurrent preterm birth in certain at-risk women, with big market potential Cord Blood Registry World’s largest stem cell collections and storage company Velo Option Option to acquire orphan drug candidate for the treatment of severe preeclampsia at completion of Phase 2b/3a clinical trial 5-dose vial |
|
|
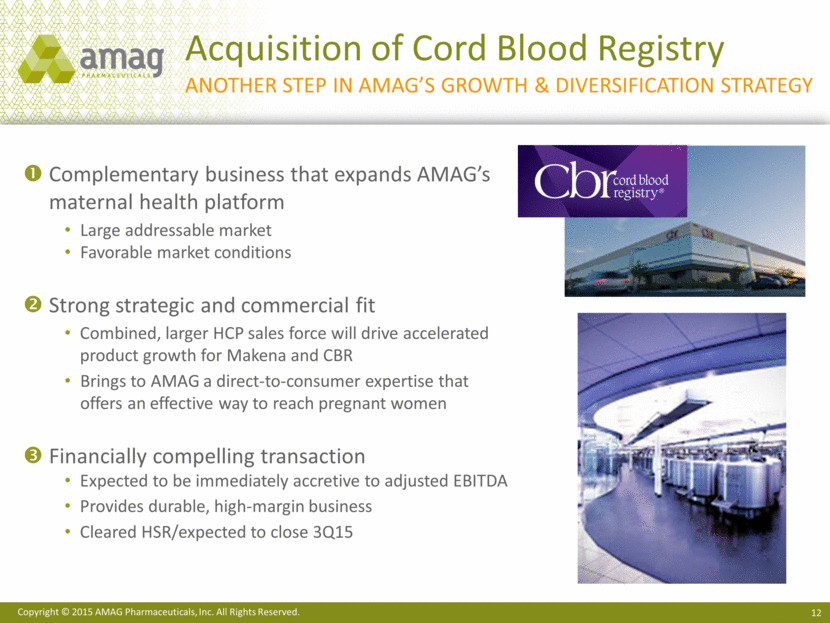
Complementary business that expands AMAG’s maternal health platform Large addressable market Favorable market conditions Strong strategic and commercial fit Combined, larger HCP sales force will drive accelerated product growth for Makena and CBR Brings to AMAG a direct-to-consumer expertise that offers an effective way to reach pregnant women Financially compelling transaction Expected to be immediately accretive to adjusted EBITDA Provides durable, high-margin business Cleared HSR/expected to close 3Q15 Acquisition of Cord Blood Registry Another step in AMAG’s Growth & Diversification strategy |
|
|
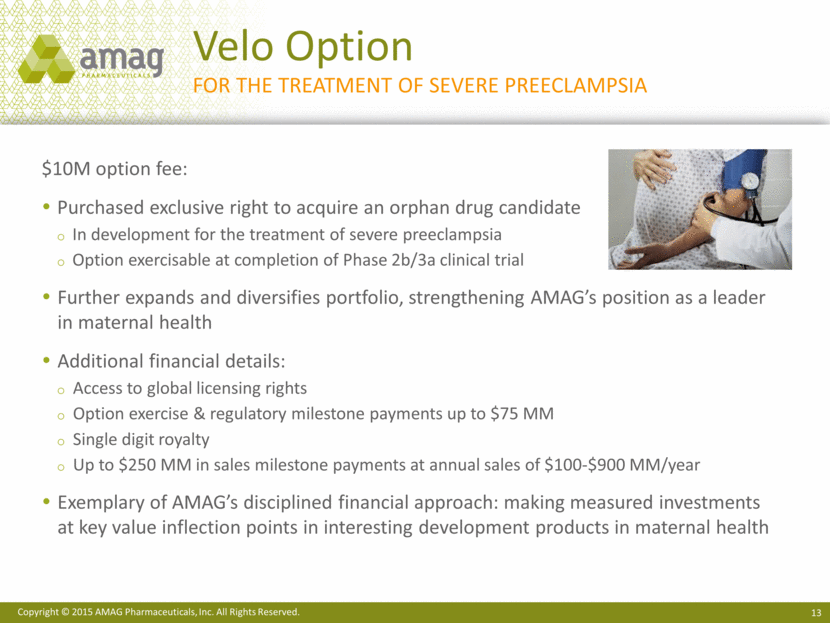
Velo Option For the treatment of severe preeclampsia $10M option fee: Purchased exclusive right to acquire an orphan drug candidate In development for the treatment of severe preeclampsia Option exercisable at completion of Phase 2b/3a clinical trial Further expands and diversifies portfolio, strengthening AMAG’s position as a leader in maternal health Additional financial details: Access to global licensing rights Option exercise & regulatory milestone payments up to $75 MM Single digit royalty Up to $250 MM in sales milestone payments at annual sales of $100-$900 MM/year Exemplary of AMAG’s disciplined financial approach: making measured investments at key value inflection points in interesting development products in maternal health |
|
|
Makena |
|
|
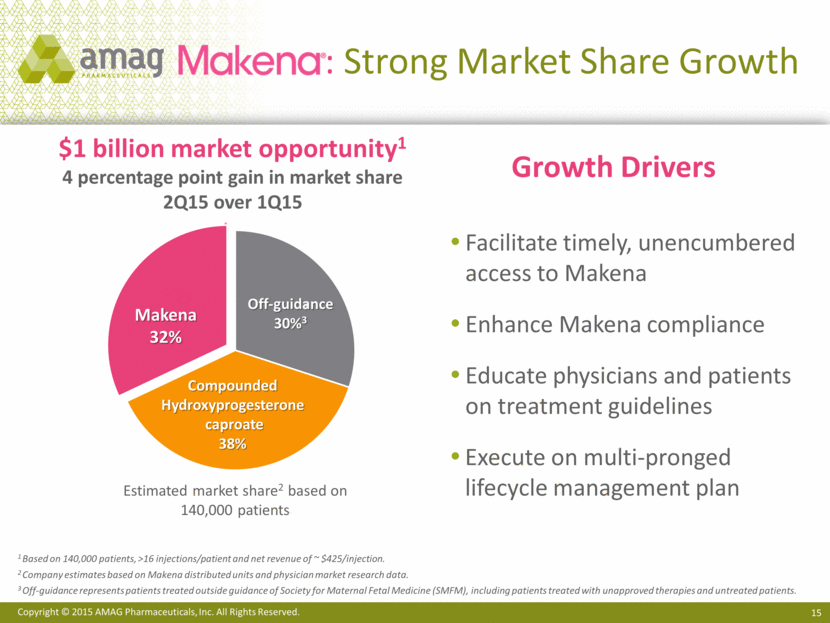
: Strong Market Share Growth Estimated market share2 based on 140,000 patients $1 billion market opportunity1 4 percentage point gain in market share 2Q15 over 1Q15 Compounded Hydroxyprogesterone caproate 38% Makena 32% Off-guidance 30%3 1 Based on 140,000 patients, >16 injections/patient and net revenue of ~ $425/injection. 2 Company estimates based on Makena distributed units and physician market research data. 3 Off-guidance represents patients treated outside guidance of Society for Maternal Fetal Medicine (SMFM), including patients treated with unapproved therapies and untreated patients. Facilitate timely, unencumbered access to Makena Enhance Makena compliance Educate physicians and patients on treatment guidelines Execute on multi-pronged lifecycle management plan Growth Drivers 3 |
|
|
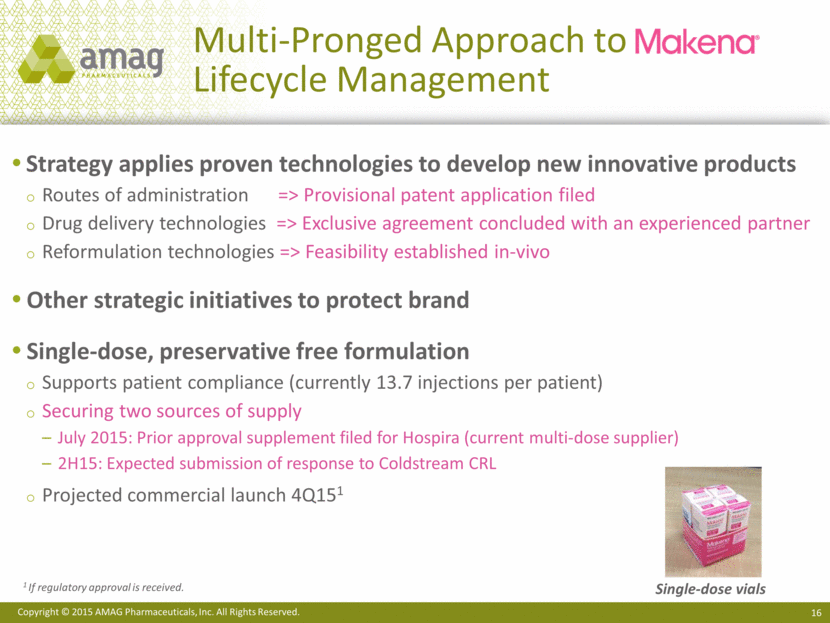
Multi-Pronged Approach to Lifecycle Management Strategy applies proven technologies to develop new innovative products Routes of administration => Provisional patent application filed Drug delivery technologies => Exclusive agreement concluded with an experienced partner Reformulation technologies => Feasibility established in-vivo Other strategic initiatives to protect brand Single-dose, preservative free formulation Supports patient compliance (currently 13.7 injections per patient) Securing two sources of supply July 2015: Prior approval supplement filed for Hospira (current multi-dose supplier) 2H15: Expected submission of response to Coldstream CRL Projected commercial launch 4Q151 Single-dose vials 1 If regulatory approval is received. |
|
|
Hematology / Oncology and Hospital |
|
|
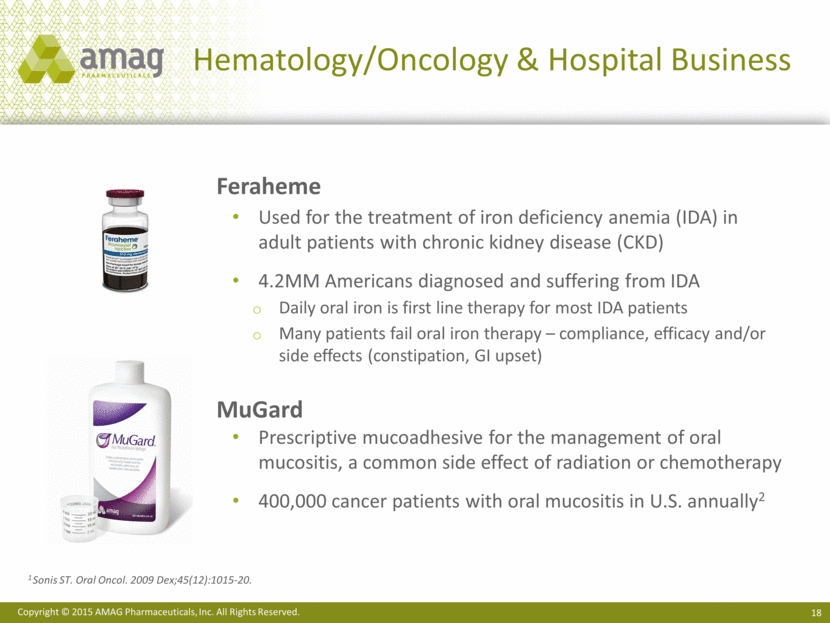
Hematology/Oncology & Hospital Business Feraheme Used for the treatment of iron deficiency anemia (IDA) in adult patients with chronic kidney disease (CKD) 4.2MM Americans diagnosed and suffering from IDA Daily oral iron is first line therapy for most IDA patients Many patients fail oral iron therapy – compliance, efficacy and/or side effects (constipation, GI upset) MuGard Prescriptive mucoadhesive for the management of oral mucositis, a common side effect of radiation or chemotherapy 400,000 cancer patients with oral mucositis in U.S. annually2 1 Sonis ST. Oral Oncol. 2009 Dex;45(12):1015-20. |
|
|
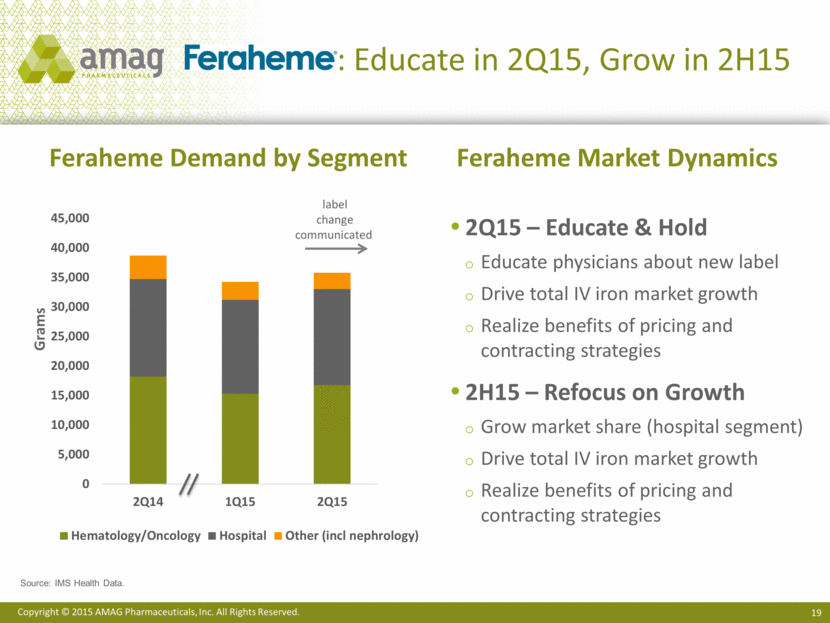
: Educate in 2Q15, Grow in 2H15 2Q15 – Educate & Hold Educate physicians about new label Drive total IV iron market growth Realize benefits of pricing and contracting strategies 2H15 – Refocus on Growth Grow market share (hospital segment) Drive total IV iron market growth Realize benefits of pricing and contracting strategies Feraheme Market Dynamics Feraheme Demand by Segment Source: IMS Health Data. Grams label change communicated |
|
|
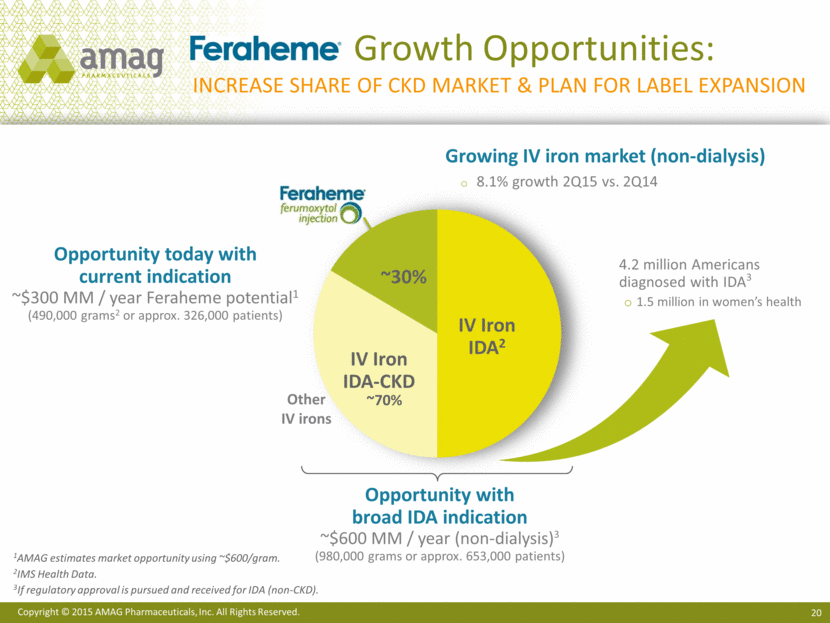
Growth Opportunities: Increase share of ckd market & plan for label expansion ~30% 1AMAG estimates market opportunity using ~$600/gram. 2IMS Health Data. 3 If regulatory approval is pursued and received for IDA (non-CKD). Opportunity with broad IDA indication ~$600 MM / year (non-dialysis)3 (980,000 grams or approx. 653,000 patients) IV Iron IDA2 ~70% IV Iron IDA-CKD Opportunity today with current indication ~$300 MM / year Feraheme potential1 (490,000 grams2 or approx. 326,000 patients) Other IV irons Growing IV iron market (non-dialysis) 8.1% growth 2Q15 vs. 2Q14 4.2 million Americans diagnosed with IDA3 1.5 million in women’s health |
|
|
Portfolio Expansion |
|
|
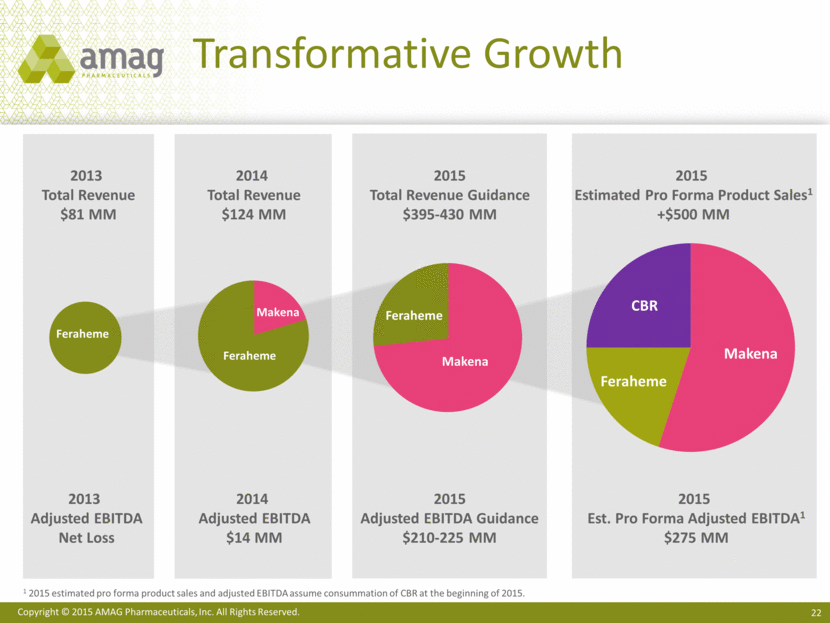
Transformative Growth 2013 Total Revenue $81 MM 2014 Total Revenue $124 MM 2015 Total Revenue Guidance $395-430 MM 2015 Estimated Pro Forma Product Sales1 +$500 MM 2013 Adjusted EBITDA Net Loss 2014 Adjusted EBITDA $14 MM 2015 Adjusted EBITDA Guidance $210-225 MM 2015 Est. Pro Forma Adjusted EBITDA1 $275 MM 1 2015 estimated pro forma product sales and adjusted EBITDA assume consummation of CBR at the beginning of 2015. Makena Feraheme CBR Makena Feraheme Makena Feraheme |
|
|
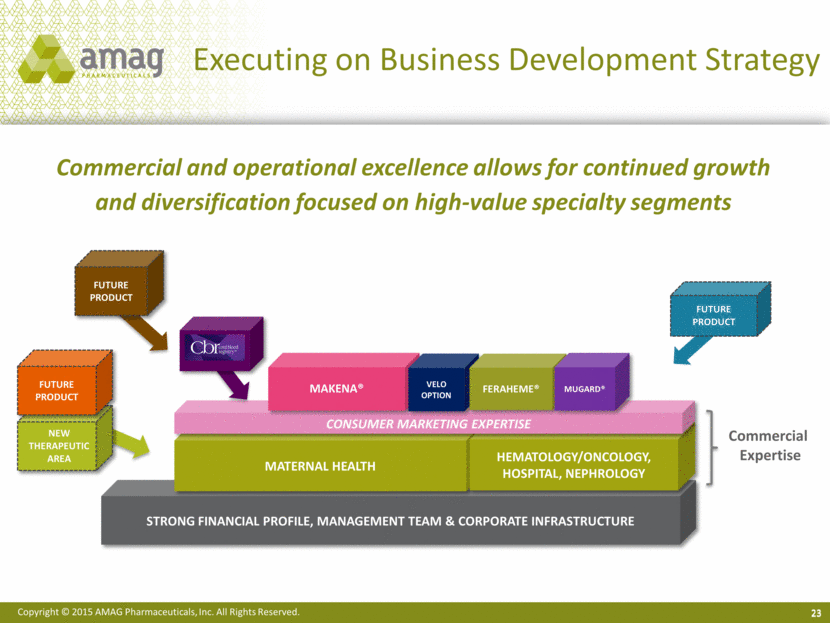
Strong Financial profile, management team & corporate infrastructure Executing on Business Development Strategy 23 Commercial and operational excellence allows for continued growth and diversification focused on high-value specialty segments FUTURE PRODUCT Maternal Health Hematology/Oncology, Hospital, Nephrology Consumer marketing expertise Makena® FUTURE PRODUCT CBR Commercial Expertise Velo Option FUTURE PRODUCT New Therapeutic Area Feraheme® MuGard® |
|
|
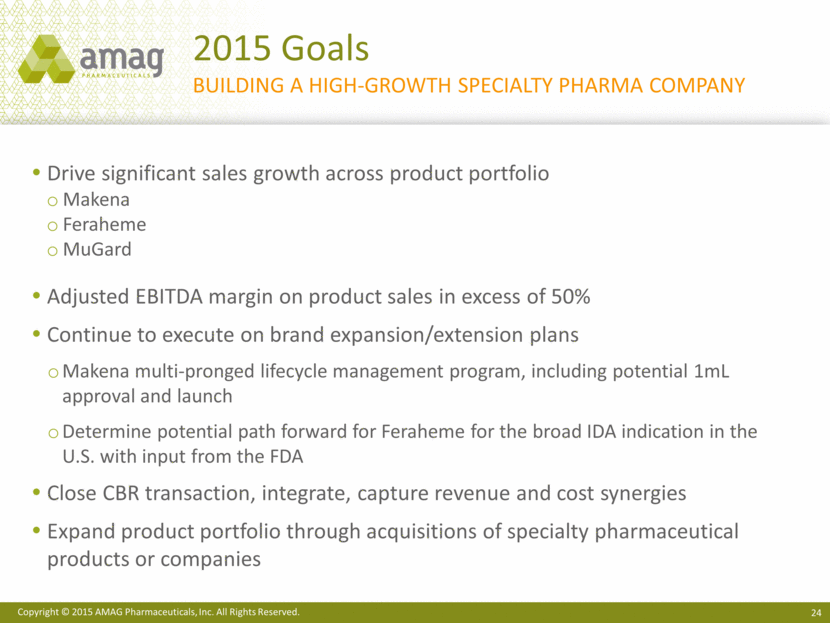
2015 Goals building a high-growth specialty pharma company Drive significant sales growth across product portfolio Makena Feraheme MuGard Adjusted EBITDA margin on product sales in excess of 50% Continue to execute on brand expansion/extension plans Makena multi-pronged lifecycle management program, including potential 1mL approval and launch Determine potential path forward for Feraheme for the broad IDA indication in the U.S. with input from the FDA Close CBR transaction, integrate, capture revenue and cost synergies Expand product portfolio through acquisitions of specialty pharmaceutical products or companies |
|
|
AMAG Pharmaceuticals 2Q15 Financial Results July 23, 2015 |
|
|
AMAG Pharmaceuticals Appendix 2Q 2015 Financial Results July 23, 2015 |
|
|
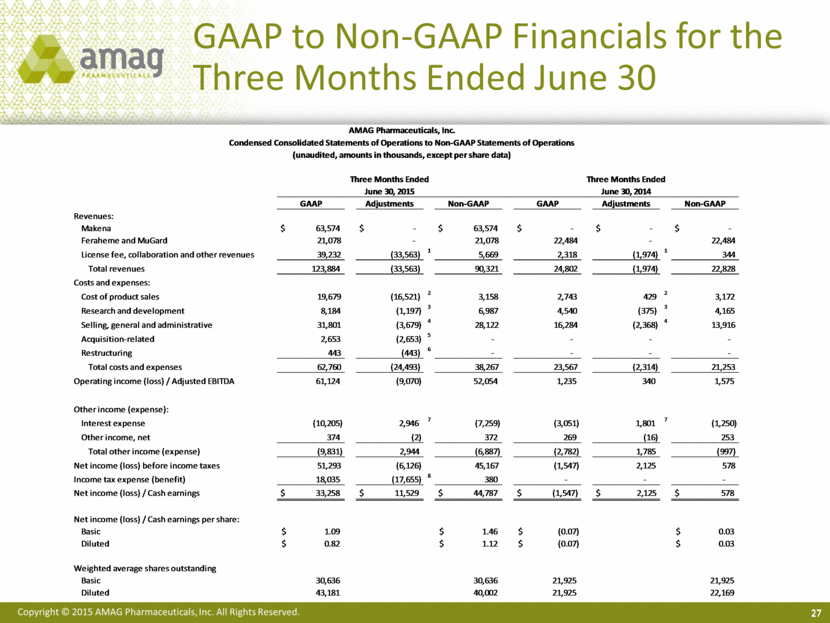
27 GAAP to Non-GAAP Financials for the Three Months Ended June 30 AMAG Pharmaceuticals, Inc. Condensed Consolidated Statements of Operations to Non-GAAP Statements of Operations (unaudited, amounts in thousands, except per share data) Three Months Ended Three Months Ended June 30, 2015 June 30, 2014 GAAP Adjustments Non-GAAP GAAP Adjustments Non-GAAP Revenues: Makena $ 63,574 $ - $ 63,574 $ - $ - $ - Feraheme and MuGard 21,078 - 21,078 22,484 - 22,484 License fee, collaboration and other revenues 39,232 (33,563) 1 5,669 2,318 (1,974) 1 344 Total revenues 123,884 (33,563) 90,321 24,802 (1,974) 22,828 Costs and expenses: Cost of product sales 19,679 (16,521) 2 3,158 2,743 429 2 3,172 Research and development 8,184 (1,197) 3 6,987 4,540 (375) 3 4,165 Selling, general and administrative 31,801 (3,679) 4 28,122 16,284 (2,368) 4 13,916 Acquisition-related 2,653 (2,653) 5 - - - - Restructuring 443 (443) 6 - - - - Total costs and expenses 62,760 (24,493) 38,267 23,567 (2,314) 21,253 Operating income (loss) / Adjusted EBITDA 61,124 (9,070) 52,054 1,235 340 1,575 Other income (expense): Interest expense (10,205) 2,946 7 (7,259) (3,051) 1,801 7 (1,250) Other income, net 374 (2) 372 269 (16) 253 Total other income (expense) (9,831) 2,944 (6,887) (2,782) 1,785 (997) Net income (loss) before income taxes 51,293 (6,126) 45,167 (1,547) 2,125 578 Income tax expense (benefit) 18,035 (17,655) 8 380 - - - Net income (loss) / Cash earnings $ 33,258 $ 11,529 $ 44,787 $ (1,547) $ 2,125 $ 578 Net income (loss) / Cash earnings per share: Basic $ 1.09 $ 1.46 $ (0.07) $ 0.03 Diluted $ 0.82 $ 1.12 $ (0.07) $ 0.03 Weighted average shares outstanding Basic 30,636 30,636 21,925 21,925 Diluted 43,181 40,002 21,925 22,169 |
|
|
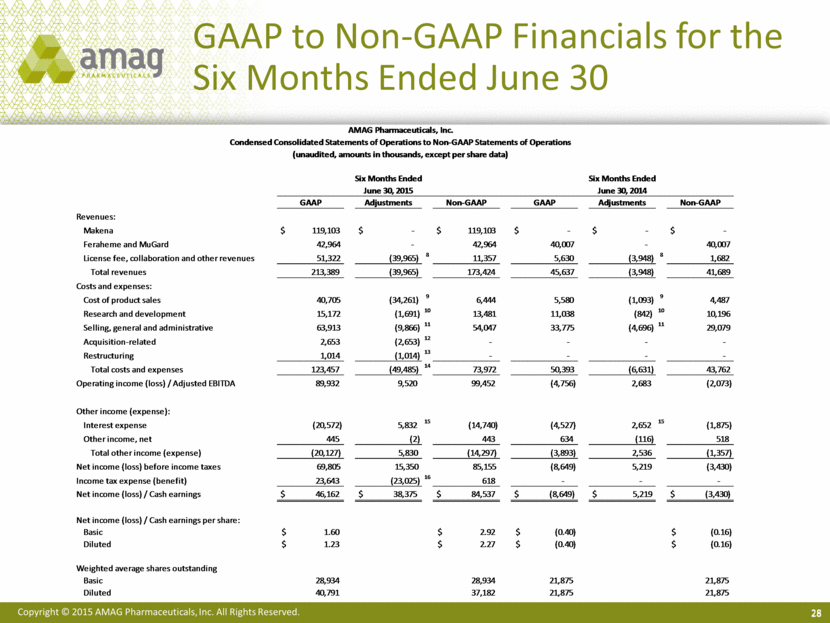
28 GAAP to Non-GAAP Financials for the Six Months Ended June 30 AMAG Pharmaceuticals, Inc. Condensed Consolidated Statements of Operations to Non-GAAP Statements of Operations (unaudited, amounts in thousands, except per share data) Six Months Ended Six Months Ended June 30, 2015 June 30, 2014 GAAP Adjustments Non-GAAP GAAP Adjustments Non-GAAP Revenues: Makena $ 119,103 $ - $ 119,103 $ - $ - $ - Feraheme and MuGard 42,964 - 42,964 40,007 - 40,007 License fee, collaboration and other revenues 51,322 (39,965) 8 11,357 5,630 (3,948) 8 1,682 Total revenues 213,389 (39,965) 173,424 45,637 (3,948) 41,689 Costs and expenses: Cost of product sales 40,705 (34,261) 9 6,444 5,580 (1,093) 9 4,487 Research and development 15,172 (1,691) 10 13,481 11,038 (842) 10 10,196 Selling, general and administrative 63,913 (9,866) 11 54,047 33,775 (4,696) 11 29,079 Acquisition-related 2,653 (2,653) 12 - - - - Restructuring 1,014 (1,014) 13 - - - - Total costs and expenses 123,457 (49,485) 14 73,972 50,393 (6,631) 43,762 Operating income (loss) / Adjusted EBITDA 89,932 9,520 99,452 (4,756) 2,683 (2,073) Other income (expense): Interest expense (20,572) 5,832 15 (14,740) (4,527) 2,652 15 (1,875) Other income, net 445 (2) 443 634 (116) 518 Total other income (expense) (20,127) 5,830 (14,297) (3,893) 2,536 (1,357) Net income (loss) before income taxes 69,805 15,350 85,155 (8,649) 5,219 (3,430) Income tax expense (benefit) 23,643 (23,025) 16 618 - - - Net income (loss) / Cash earnings $ 46,162 $ 38,375 $ 84,537 $ (8,649) $ 5,219 $ (3,430) Net income (loss) / Cash earnings per share: Basic $ 1.60 $ 2.92 $ (0.40) $ (0.16) Diluted $ 1.23 $ 2.27 $ (0.40) $ (0.16) Weighted average shares outstanding Basic 28,934 28,934 21,875 21,875 Diluted 40,791 37,182 21,875 21,875 |
|
|
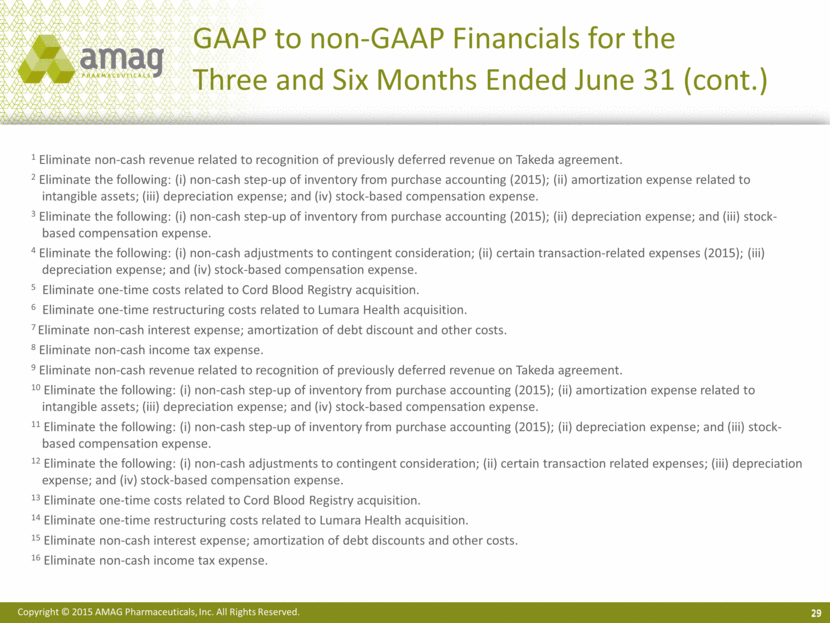
GAAP to non-GAAP Financials for the Three and Six Months Ended June 31 (cont.) 29 1 Eliminate non-cash revenue related to recognition of previously deferred revenue on Takeda agreement. 2 Eliminate the following: (i) non-cash step-up of inventory from purchase accounting (2015); (ii) amortization expense related to intangible assets; (iii) depreciation expense; and (iv) stock-based compensation expense. 3 Eliminate the following: (i) non-cash step-up of inventory from purchase accounting (2015); (ii) depreciation expense; and (iii) stock-based compensation expense. 4 Eliminate the following: (i) non-cash adjustments to contingent consideration; (ii) certain transaction-related expenses (2015); (iii) depreciation expense; and (iv) stock-based compensation expense. 5 Eliminate one-time costs related to Cord Blood Registry acquisition. 6 Eliminate one-time restructuring costs related to Lumara Health acquisition. 7 Eliminate non-cash interest expense; amortization of debt discount and other costs. 8 Eliminate non-cash income tax expense. 9 Eliminate non-cash revenue related to recognition of previously deferred revenue on Takeda agreement. 10 Eliminate the following: (i) non-cash step-up of inventory from purchase accounting (2015); (ii) amortization expense related to intangible assets; (iii) depreciation expense; and (iv) stock-based compensation expense. 11 Eliminate the following: (i) non-cash step-up of inventory from purchase accounting (2015); (ii) depreciation expense; and (iii) stock-based compensation expense. 12 Eliminate the following: (i) non-cash adjustments to contingent consideration; (ii) certain transaction related expenses; (iii) depreciation expense; and (iv) stock-based compensation expense. 13 Eliminate one-time costs related to Cord Blood Registry acquisition. 14 Eliminate one-time restructuring costs related to Lumara Health acquisition. 15 Eliminate non-cash interest expense; amortization of debt discounts and other costs. 16 Eliminate non-cash income tax expense. |
|
|
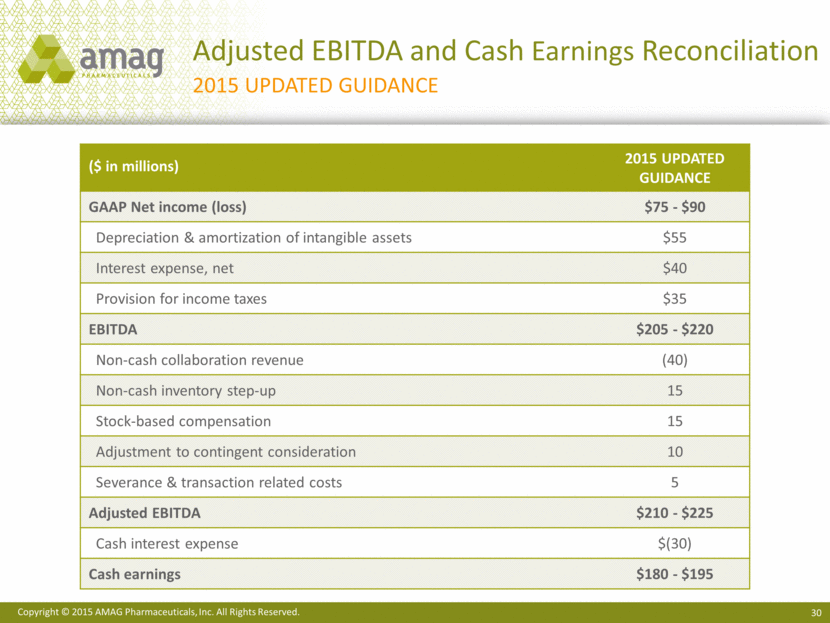
Adjusted EBITDA and Cash Earnings Reconciliation 2015 Updated Guidance ($ in millions) 2015 Updated Guidance GAAP Net income (loss) $75 - $90 Depreciation & amortization of intangible assets $55 Interest expense, net $40 Provision for income taxes $35 EBITDA $205 - $220 Non-cash collaboration revenue (40) Non-cash inventory step-up 15 Stock-based compensation 15 Adjustment to contingent consideration 10 Severance & transaction related costs 5 Adjusted EBITDA $210 - $225 Cash interest expense $(30) Cash earnings $180 - $195 |
|
|
AMAG Pharmaceuticals 2Q15 Financial Results July 23, 2015 |

