Attached files
| file | filename |
|---|---|
| 8-K - 8-K - BANCORPSOUTH INC | d50836d8k.htm |
| EX-99.1 - EX-99.1 - BANCORPSOUTH INC | d50836dex991.htm |
Exhibit 99.2

BancorpSouth, Inc. Financial Information As of and for the three months ended June 30, 2015

Forward Looking Information Certain statements contained in this this presentation and the accompanying slides may not be based upon historical facts and are “forward-looking statements” within the meaning of Section 27A of the Securities Act of 1933, as amended, and Section 21E of the Securities Exchange Act of 1934, as amended. These forward-looking statements may be identified by their reference to a future period or periods or by the use of forward-looking terminology such as “anticipate,” “believe,” “could,” “estimate,” “expect,” “foresee,” “hope,” “intend,” “may,” “might,” “plan,” “will,” or “would” or future or conditional verb tenses and variations or negatives of such terms. These forward-looking statements include, without limitation, those relating to the terms, timing and closings of the proposed mergers with Ouachita Bancshares Corp. and Central Community Corporation, the Company’s ability to operate its regulatory compliance programs consistent with federal, state ,and local laws, including its BSA/AML compliance program, the findings and results of the joint investigation by the Consumer Financial Protection Bureau (the “CFPB”) and the United States Department of Justice (“DOJ”) of the Company’s fair lending practices, the acceptance by customers of Ouachita Bancshares Corp. and Central Community Corporation of the Company’s products and services if the proposed mergers close, the outcome of any instituted, pending or threatened material litigation, amortization expense for intangible assets, goodwill impairments, loan impairment, utilization of appraisals and inspections for real estate loans, maturity, renewal or extension of construction, acquisition and development loans, net interest revenue, fair value determinations, the amount of the Company’s non-performing loans and leases, additions to Other Real Estate Owned (“OREO”), credit quality, credit losses, liquidity, off-balance sheet commitments and arrangements, valuation of mortgage servicing rights, allowance and provision for credit losses, continued weakness in the economic environment, early identification and resolution of credit issues, utilization of non-GAAP financial measures, the ability of the Company to collect all amounts due according to the contractual terms of loan agreements, the Company’s reserve for losses from representation and warranty obligations, the Company’s foreclosure process related to mortgage loans, the resolution of non-performing loans that are collaterally dependent, real estate values, fully-indexed interest rates, interest rate risk, interest rate sensitivity, calculation of economic value of equity, impaired loan charge-offs, troubled debt restructurings, diversification of the Company’s revenue stream, liquidity needs and strategies, sources of funding, net interest margin, declaration and payment of dividends, cost saving initiatives, improvement in the Company’s efficiencies, operating expense trends, future acquisitions and consideration to be used therefor, the impact of litigation regarding debit card fees and the impact of certain claims and ongoing, pending or threatened litigation, administrative and investigatory matters. The Company cautions readers not to place undue reliance on the forward-looking statements contained in this this presentation and the accompanying slides, in that actual results could differ materially from those indicated in such forward-looking statements as a result of a variety of factors. These factors may include, but are not limited to, the Company’s ability to operate its regulatory compliance programs consistent with federal, state ,and local laws, including its BSA/AML compliance program, the findings and results of the CFPB and the DOJ in their review of the Company’s fair lending practices, the ability of the Company, Ouachita Bancshares Corp. and Central Community Corporation to obtain regulatory approval of and close the proposed mergers, the potential impact upon the Company of the delay in the closings of these proposed mergers, the impact of any ongoing, pending or threatened litigation, administrative and investigatory matters involving the Company, conditions in the financial markets and economic conditions generally, the adequacy of the Company’s provision and allowance for credit losses to cover actual credit losses, the credit risk associated with real estate construction, acquisition and development loans, losses resulting from the significant amount of the Company’s OREO, limitations on the Company’s ability to declare and pay dividends, the availability of capital on favorable terms if and when needed, liquidity risk, governmental regulation, including the Dodd-Frank Act, and supervision of the Company’s operations, the short-term and long-term impact of changes to banking capital standards on the Company’s regulatory capital and liquidity, the impact of regulations on service charges on the Company’s core deposit accounts, the susceptibility of the Company’s business to local economic and environmental conditions, the soundness of other financial institutions, changes in interest rates, the impact of monetary policies and economic factors on the Company’s ability to attract deposits or make loans, volatility in capital and credit markets, reputational risk, the impact of the loss of any key Company personnel, the impact of hurricanes or other adverse weather events, any requirement that the Company write down goodwill or other intangible assets, diversification in the types of financial services the Company offers, the Company’s ability to adapt its products and services to evolving industry standards and consumer preferences, competition with other financial services companies, risks in connection with completed or potential acquisitions, the Company’s growth strategy, interruptions or breaches in the Company’s information system security, the failure of certain third-party vendors to perform, unfavorable ratings by rating agencies, dilution caused by the Company’s issuance of any additional shares of its common stock to raise capital or acquire other banks, bank holding companies, financial holding companies and insurance agencies, other factors generally understood to affect the assets, business, cash flows, financial condition, liquidity, prospects and/or results of operations of financial services companies and other factors detailed from time to time in the Company’s press and this presentation and the accompanying slides, reports and other filings with the SEC. Forward-looking statements speak only as of the date that they were made, and, except as required by law, the Company does not undertake any obligation to update or revise forward-looking statements to reflect events or circumstances that occur after the date of this this presentation and the accompanying slides.
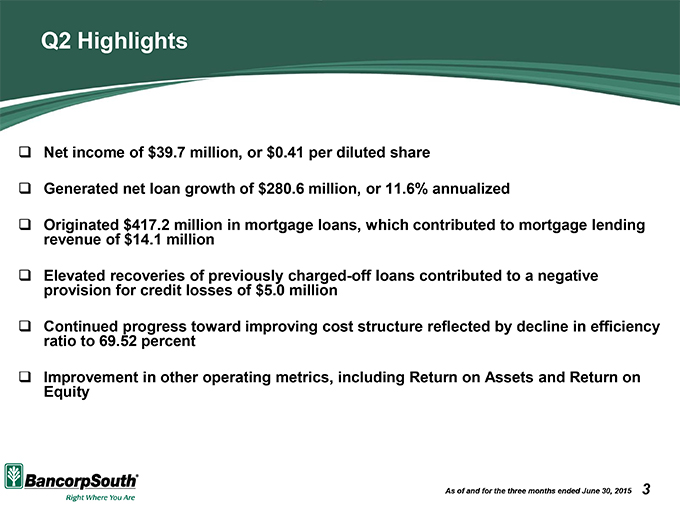
Q2 Highlights Net income of $39.7 million, or $0.41 per diluted share Generated net loan growth of $280.6 million, or 11.6% annualized Originated $417.2 million in mortgage loans, which contributed to mortgage lending revenue of $14.1 million Elevated recoveries of previously charged-off loans contributed to a negative provision for credit losses of $5.0 million Continued progress toward improving cost structure reflected by decline in efficiency ratio to 69.52 percent Improvement in other operating metrics, including Return on Assets and Return on Equity As of and for the three months ended June 30, 2015 3
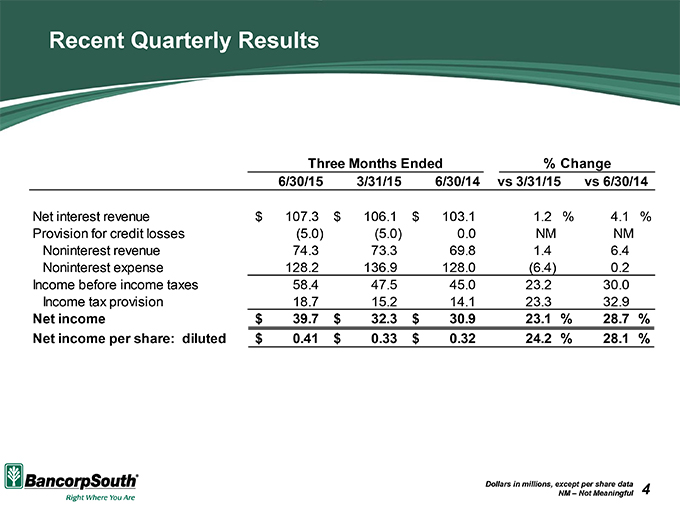
Recent Quarterly Results Three Months Ended % Change 6/30/15 3/31/15 6/30/14 vs 3/31/15 vs 6/30/14 Net interest revenue $ 107.3 $ 106.1 $ 103.1 1.2 % 4.1 % Provision for credit losses (5.0) (5.0) 0.0 NM NM Noninterest revenue 74.3 73.3 69.8 1.4 6.4 Noninterest expense 128.2 136.9 128.0 (6.4) 0.2 Income before income taxes 58.4 47.5 45.0 23.2 30.0 Income tax provision 18.7 15.2 14.1 23.3 32.9 Net income $ 39.7 $ 32.3 $ 30.9 23.1 % 28.7 % Net income per share: diluted $ 0.41 $ 0.33 $ 0.32 24.2 % 28.1 % Dollars in millions, except per share data NM – Not Meaningful 4
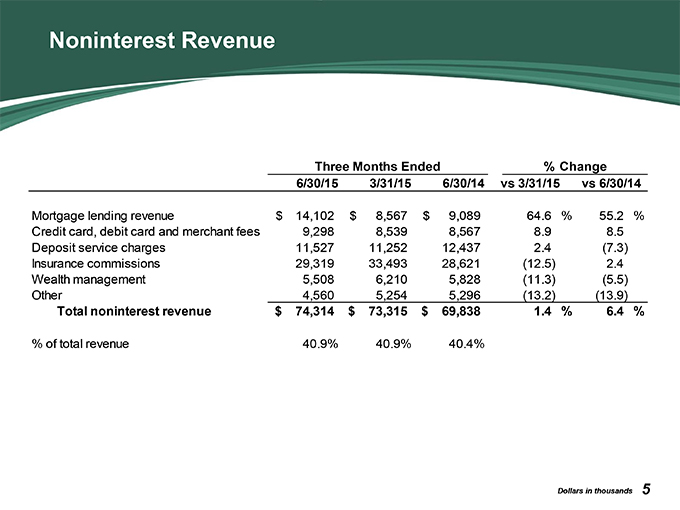
Noninterest Revenue Three Months Ended % Change 6/30/15 3/31/15 6/30/14 vs 3/31/15 vs 6/30/14 Mortgage lending revenue $ 14,102 $ 8,567 $ 9,089 64.6 % 55.2 % Credit card, debit card and merchant fees 9,298 8,539 8,567 8.9 8.5 Deposit service charges 11,527 11,252 12,437 2.4 (7.3) Insurance commissions 29,319 33,493 28,621 (12.5) 2.4 Wealth management 5,508 6,210 5,828 (11.3) (5.5) Other 4,560 5,254 5,296 (13.2) (13.9) Total noninterest revenue $ 74,314 $ 73,315 $ 69,838 1.4 % 6.4 % % of total revenue 40.9% 40.9% 40.4% Dollars in thousands 5
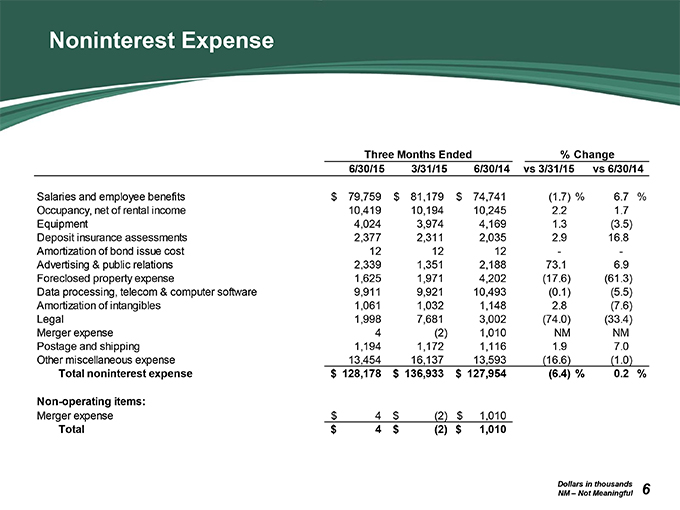
Noninterest Expense Three Months Ended % Change 6/30/15 3/31/15 6/30/14 vs 3/31/15 vs 6/30/14 Salaries and employee benefits $ 79,759 $ 81,179 $ 74,741 (1.7) % 6.7 % Occupancy, net of rental income 10,419 10,194 10,245 2.2 1.7 Equipment 4,024 3,974 4,169 1.3 (3.5) Deposit insurance assessments 2,377 2,311 2,035 2.9 16.8 Amortization of bond issue cost 12 12 12 — Advertising & public relations 2,339 1,351 2,188 73.1 6.9 Foreclosed property expense 1,625 1,971 4,202 (17.6) (61.3) Data processing, telecom & computer software 9,911 9,921 10,493 (0.1) (5.5) Amortization of intangibles 1,061 1,032 1,148 2.8 (7.6) Legal 1,998 7,681 3,002 (74.0) (33.4) Merger expense 4 (2) 1,010 NM NM Postage and shipping 1,194 1,172 1,116 1.9 7.0 Other miscellaneous expense 13,454 16,137 13,593 (16.6) (1.0) Total noninterest expense $ 128,178 $ 136,933 $ 127,954 (6.4) % 0.2 % Non-operating items: Merger expense $ 4 $ (2) $ 1,010 Total $ 4 $ (2) $ 1,010 Dollars in thousands NM – Not Meaningful 6
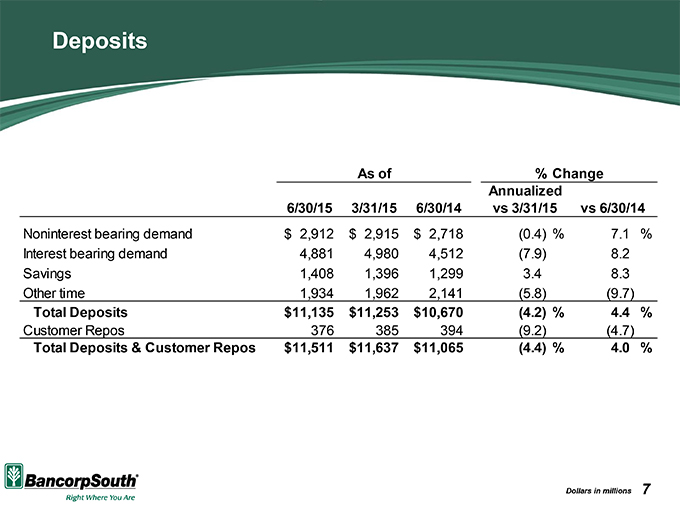
Deposits As of % Change Annualized 6/30/15 3/31/15 6/30/14 vs 3/31/15 vs 6/30/14 Noninterest bearing demand $ 2,912 $ 2,915 $ 2,718 (0.4) % 7.1 % Interest bearing demand 4,881 4,980 4,512 (7.9) 8.2 Savings 1,408 1,396 1,299 3.4 8.3 Other time 1,934 1,962 2,141 (5.8) (9.7) Total Deposits $ 11,135 $ 11,253 $ 10,670 (4.2) % 4.4 % Customer Repos 376 385 394 (9.2) (4.7) Total Deposits & Customer Repos $ 11,511 $ 11,637 $ 11,065 (4.4) % 4.0 % Dollars in millions 7
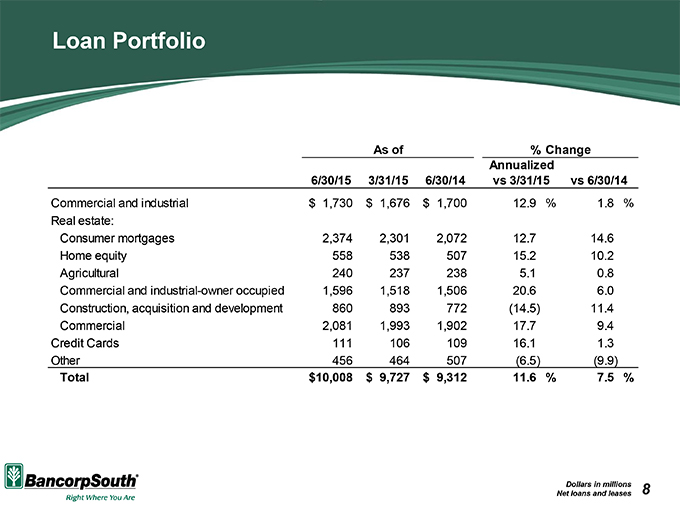
Loan Portfolio As of % Change Annualized 6/30/15 3/31/15 6/30/14 vs 3/31/15 vs 6/30/14 Commercial and industrial $ 1,730 $ 1,676 $ 1,700 12.9 % 1.8 % Real estate: Consumer mortgages 2,374 2,301 2,072 12.7 14.6 Home equity 558 538 507 15.2 10.2 Agricultural 240 237 238 5.1 0.8 Commercial and industrial-owner occupied 1,596 1,518 1,506 20.6 6.0 Construction, acquisition and development 860 893 772 (14.5) 11.4 Commercial 2,081 1,993 1,902 17.7 9.4 Credit Cards 111 106 109 16.1 1.3 Other 456 464 507 (6.5) (9.9) Total $ 10,008 $ 9,727 $ 9,312 11.6 % 7.5 % Dollars in millions Net loans and leases 8
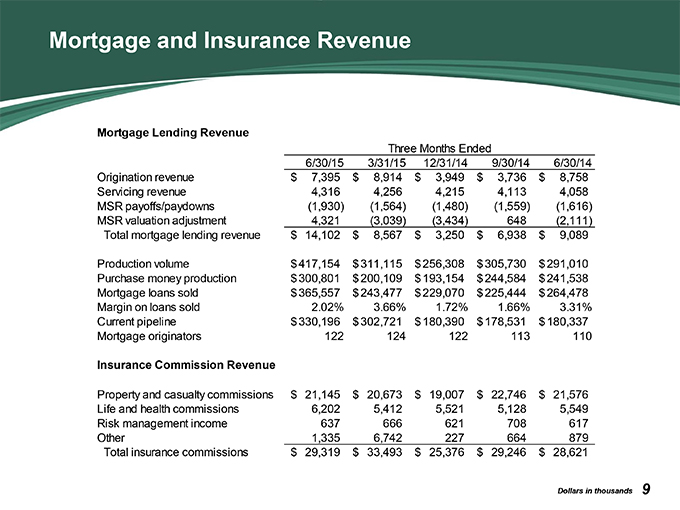
Mortgage and Insurance Revenue Mortgage Lending Revenue Three Months Ended 6/30/15 3/31/15 12/31/14 9/30/14 6/30/14 Origination revenue $ 7,395 $ 8,914 $ 3,949 $ 3,736 $ 8,758 Servicing revenue 4,316 4,256 4,215 4,113 4,058 MSR payoffs/paydowns (1,930) (1,564) (1,480) (1,559) (1,616) MSR valuation adjustment 4,321 (3,039) (3,434) 648 (2,111) Total mortgage lending revenue $ 14,102 $ 8,567 $ 3,250 $ 6,938 $ 9,089 Production volume $ 417,154 $ 311,115 $ 256,308 $ 305,730 $ 291,010 Purchase money production $ 300,801 $ 200,109 $ 193,154 $ 244,584 $ 241,538 Mortgage loans sold $ 365,557 $ 243,477 $ 229,070 $ 225,444 $ 264,478 Margin on loans sold 2.02% 3.66% 1.72% 1.66% 3.31% Current pipeline $ 330,196 $ 302,721 $ 180,390 $ 178,531 $ 180,337 Mortgage originators 122 124 122 113 110 Insurance Commission Revenue Property and casualty commissions $ 21,145 $ 20,673 $ 19,007 $ 22,746 $ 21,576 Life and health commissions 6,202 5,412 5,521 5,128 5,549 Risk management income 637 666 621 708 617 Other 1,335 6,742 227 664 879 Total insurance commissions $ 29,319 $ 33,493 $ 25,376 $ 29,246 $ 28,621 Dollars in thousands 9
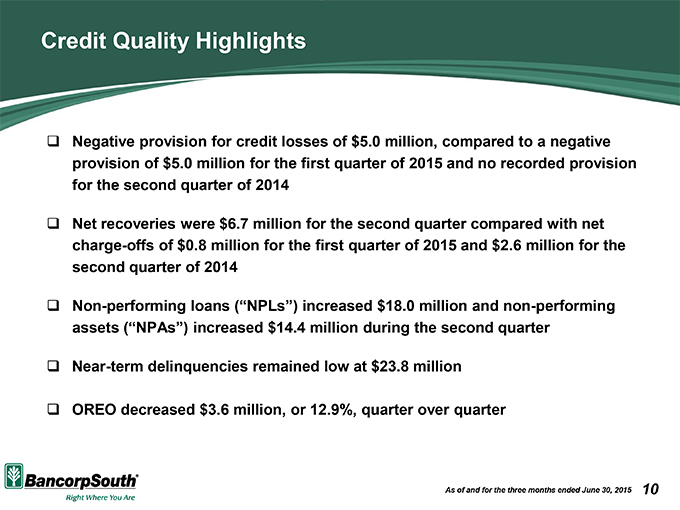
Credit Quality Highlights Negative provision for credit losses of $5.0 million, compared to a negative provision of $5.0 million for the first quarter of 2015 and no recorded provision for the second quarter of 2014 Net recoveries were $6.7 million for the second quarter compared with net charge-offs of $0.8 million for the first quarter of 2015 and $2.6 million for the second quarter of 2014 Non-performing loans (“NPLs”) increased $18.0 million and non-performing assets (“NPAs”) increased $14.4 million during the second quarter Near-term delinquencies remained low at $23.8 million OREO decreased $3.6 million, or 12.9%, quarter over quarter As of and for the three months ended June 30, 2015 10
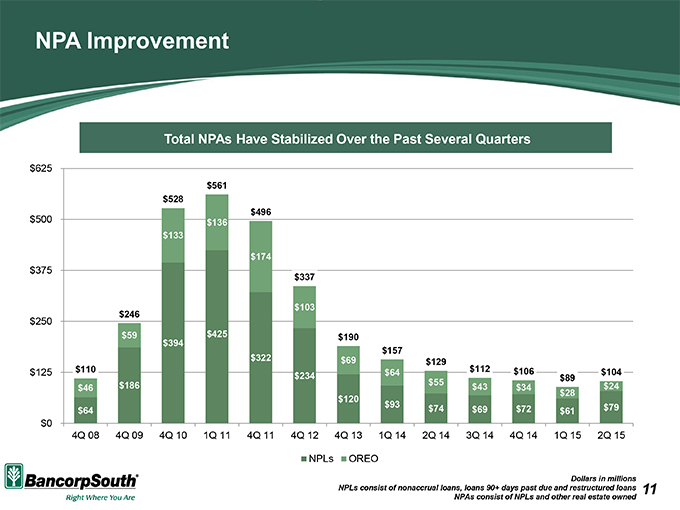
NPA Improvement Total NPAs Have Stabilized Over the Past Several Quarters Dollars in millions NPLs consist of nonaccrual loans, loans 90+ days past due and restructured loans NPAs consist of NPLs and other real estate owned 11
Summary Highlights Continued improvement in profitability Meaningful loan growth Improvement in efficiency Current Focus Continue to grow – loans, deposits, and fee revenue sources Challenge expenses and continue to improve efficiency Q&A 12