Attached files
| file | filename |
|---|---|
| 8-K - 8-K - COMERICA INC /NEW/ | cma-20150630xform8xk.htm |
| EX-99.1 - EXHIBIT - COMERICA INC /NEW/ | cma-20150630ex991.htm |

Comerica Incorporated Second Quarter 2015Financial Review July 17, 2015 2 Safe Harbor Statement Any statements in this presentation that are not historical facts are forward-looking statements as defined in the Private Securities LitigationReform Act of 1995. Words such as “anticipates,” “believes,” “contemplates,” “feels,” “expects,” “estimates,” “seeks,” “strives,” “plans,” “intends,”“outlook,” “forecast,” “position,” “target,” “mission,” “assume,” “achievable,” “potential,” “strategy,” “goal,” “aspiration,” “opportunity,” “initiative,”“outcome,” “continue,” “remain,” “maintain,” “on course,” “trend,” “objective,” “looks forward,” “projects,” “models” and variations of such words andsimilar expressions, or future or conditional verbs such as “will,” “would,” “should,” “could,” “might,” “can,” “may” or similar expressions, as theyrelate to Comerica or its management, are intended to identify forward-looking statements. These forward-looking statements are predicated onthe beliefs and assumptions of Comerica's management based on information known to Comerica's management as of the date of thispresentation and do not purport to speak as of any other date. Forward-looking statements may include descriptions of plans and objectives ofComerica's management for future or past operations, products or services, and forecasts of Comerica's revenue, earnings or other measures ofeconomic performance, including statements of profitability, business segments and subsidiaries, estimates of credit trends and global stability.Such statements reflect the view of Comerica's management as of this date with respect to future events and are subject to risks anduncertainties. Should one or more of these risks materialize or should underlying beliefs or assumptions prove incorrect, Comerica's actual resultscould differ materially from those discussed. Factors that could cause or contribute to such differences are changes in general economic, politicalor industry conditions; changes in monetary and fiscal policies, including changes in interest rates; changes in regulation or oversight; Comerica'sability to maintain adequate sources of funding and liquidity; the effects of more stringent capital or liquidity requirements; declines or otherchanges in the businesses or industries of Comerica's customers, including the energy industry; operational difficulties, failure of technologyinfrastructure or information security incidents; reliance on other companies to provide certain key components of business infrastructure; factorsimpacting noninterest expenses which are beyond Comerica's control; changes in the financial markets, including fluctuations in interest rates andtheir impact on deposit pricing; changes in Comerica's credit rating; unfavorable developments concerning credit quality; the interdependence offinancial service companies; the implementation of Comerica's strategies and business initiatives; Comerica's ability to utilize technology toefficiently and effectively develop, market and deliver new products and services; competitive product and pricing pressures among financialinstitutions within Comerica's markets; changes in customer behavior; any future strategic acquisitions or divestitures; management's ability tomaintain and expand customer relationships; management's ability to retain key officers and employees; the impact of legal and regulatoryproceedings or determinations; the effectiveness of methods of reducing risk exposures; the effects of terrorist activities and other hostilities; theeffects of catastrophic events including, but not limited to, hurricanes, tornadoes, earthquakes, fires, droughts and floods; changes in accountingstandards and the critical nature of Comerica's accounting policies. Comerica cautions that the foregoing list of factors is not exclusive. Fordiscussion of factors that may cause actual results to differ from expectations, please refer to our filings with the Securities and ExchangeCommission. In particular, please refer to “Item 1A. Risk Factors” beginning on page 12 of Comerica's Annual Report on Form 10-K for the yearended December 31, 2014. Forward-looking statements speak only as of the date they are made. Comerica does not undertake to updateforward-looking statements to reflect facts, circumstances, assumptions or events that occur after the date the forward-looking statements aremade. For any forward-looking statements made in this presentation or in any documents, Comerica claims the protection of the safe harbor forforward-looking statements contained in the Private Securities Litigation Reform Act of 1995.

3 Financial Summary $ in millions, except per share data ● n/a – not applicable ● 1Excluding the $44M impact of accounting presentation of a cardprogram in 2Q15 and 1Q15. The Corporation believes this information will assist investors, regulators, management and others in comparing results to prior quarters ● 2Reflects a $31 million decrease in litigation-related expense in 2Q15. ● 3Basel III capital rules (standardized approach) became effective for Comerica on 1/1/15. The ratio reflects transitional treatment for certain regulatory deductions and adjustments. Capital ratios for prior periods are based on Basel I rules. ● 4See Supplemental Financial Data slides for a reconciliation of non-GAAP financial measures. ● 5Estimated 2Q15 1Q15 2Q14 Diluted income per common share $0.73 $0.73 $0.80 Net interest income $421 $413 $416 Provision for credit losses 47 14 11 Noninterest income 261 255 220 Excl. impact of accounting presentation1 217 211 220 Noninterest expenses2 436 459 404 Excl. impact of accounting presentation1,2 392 415 404 Net income 135 134 151 Total average loans $48,833 $48,151 $46,725 Total average deposits 57,398 56,990 53,384 Basel III common equity Tier 1 capital ratio3 10.53%5 10.40% n/a Tier 1 common capital ratio3,4 n/a n/a 10.50% Average diluted shares (millions) 182 182 186 4 Second Quarter 2015 Results $ in millions, except per share data ● n/a – not applicable ● 2Q15 compared to 1Q15 ● 1Excluding the $44MM impact ofaccounting presentation of a card program in 2Q15. The Corporation believes this information will assist investors,regulators, management and others in comparing results to prior quarters. ● 2EPS based on diluted income per share. ● 3See Supplemental Financial Data slides for a reconciliation of non-GAAP financial measures. ● 4Equity repurchases under the equity repurchase program. 2Q15 Change From1Q15 2Q14Total average loans 48,833 682 2,108 Total average deposits 57,398 408 4,014 Net interest income 421 8 5 Provision for credit losses 47 33 36 Noninterest income 261 6 41 Excl. impact of acct. presentation1 217 n/a (3) Noninterest expenses 436 (23) 32 Excl. impact of acct. presentation1 392 n/a (12) Net income 135 1 (16) Earnings per share (EPS)2 0.73 - (0.07) Tangible Book Value Per Share3 38.53 0.06 1.41 Equity repurchases4 1MM shares & 0.5MM warrants or $59MM Key QoQ Performance Drivers Solid average loan growth, particularly in Mortgage Banker, partially offset by decline in Energy Net interest income increased with loan growth & one additional day Provision reflects continued reserve build & increase in net charge-offs to 15 bps from a very low level Noninterest income increased primarily due to card fees Expenses reflect $31 million reduction in litigation-related expense Equity repurchases4, combined with dividends, returned $96 million to shareholders

5 Diverse Footprint Drives Growth $ in billions 11.0 11.1 11.3 11.5 11.2 2Q14 3Q14 4Q14 1Q15 2Q15 Average Loans 10.7 10.6 10.8 11.1 11.0 2Q14 3Q14 4Q14 1Q15 2Q15 Average Deposits 15.4 15.5 15.8 16.2 16.4 2Q14 3Q14 4Q14 1Q15 2Q15 Average Loans 15.4 16.4 18.0 16.8 17.3 2Q14 3Q14 4Q14 1Q15 2Q15 Average Deposits 13.5 13.3 13.2 13.3 13.3 2Q14 3Q14 4Q14 1Q15 2Q15 Average Loans 20.7 21.2 21.6 21.7 21.7 2Q14 3Q14 4Q14 1Q15 2Q15 Average Deposits +2.6% +2.2% +6.4% +12.4% +4.9% -1.4% -2.4% -0.5% +1.5% +2.6% stable +0.5% 6 Average Loan Growth of 1.4%Loan Yields Increase 1bp 2Q15 compared to 1Q15 ● 1Utilization of commercial commitments as a percentage of total commercial commitments at period-end. Total Loans($ in billions) 46.7 47.2 47.4 48.2 48.8 49.1 49.7 3.31 3.22 3.22 3.19 3.20 2Q14 3Q14 4Q14 1Q15 2Q15 1Q15 2Q15 Loan Yields Average Balances Period-end Total average loans increased $682MM + $690MM Mortgage Banker+ $131MM General Middle Market+ $121MM Private Banking+ $ 89MM National Dealer Services+ $ 64MM Small Business+ $ 62MM TLS- $276MM Energy- $151MM Corporate BankingPeriod-end loans grew $669MM Commitments increased to $57.1B Line utilization1 of 51%, up from 50% Loan pipeline increasedLoan yields increased 1 bp, reflecting increase in 30-day LIBOR
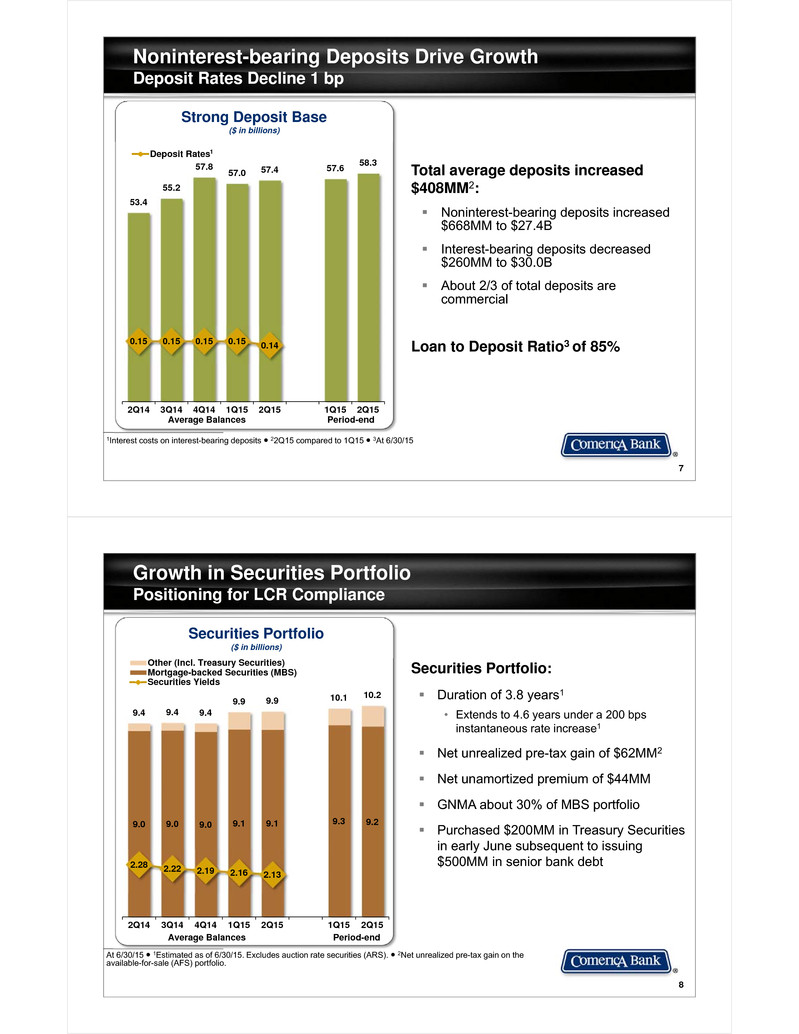
7 Noninterest-bearing Deposits Drive GrowthDeposit Rates Decline 1 bp 1Interest costs on interest-bearing deposits ● 22Q15 compared to 1Q15 ● 3At 6/30/15 Average Balances Period-end Strong Deposit Base($ in billions) 53.4 55.2 57.8 57.0 57.4 57.6 58.3 0.15 0.15 0.15 0.15 0.14 2Q14 3Q14 4Q14 1Q15 2Q15 1Q15 2Q15 Deposit Rates1 Total average deposits increased $408MM2: Noninterest-bearing deposits increased $668MM to $27.4B Interest-bearing deposits decreased $260MM to $30.0B About 2/3 of total deposits are commercial Loan to Deposit Ratio3 of 85% 8 Growth in Securities Portfolio Positioning for LCR Compliance At 6/30/15 ● 1Estimated as of 6/30/15. Excludes auction rate securities (ARS). ● 2Net unrealized pre-tax gain on the available-for-sale (AFS) portfolio. Securities Portfolio: Duration of 3.8 years1 • Extends to 4.6 years under a 200 bps instantaneous rate increase1 Net unrealized pre-tax gain of $62MM2 Net unamortized premium of $44MM GNMA about 30% of MBS portfolio Purchased $200MM in Treasury Securities in early June subsequent to issuing $500MM in senior bank debt 9.0 9.0 9.0 9.1 9.1 9.3 9.2 9.4 9.4 9.4 9.9 9.9 10.1 10.2 2.28 2.22 2.19 2.16 2.13 2Q14 3Q14 4Q14 1Q15 2Q15 1Q15 2Q15 Other (Incl. Treasury Securities)Mortgage-backed Securities (MBS)Securities Yields Securities Portfolio($ in billions) Average Balances Period-end

9 Net Interest Income Increases 2%Driven by Loan Growth & 1 Additional Day 12Q15 compared to 1Q15 ● 2For standard model assumptions see slide #16. Estimate is based on simulation modeling analysis. 10 3 9 2 2 416 414 415 413 421 2.78 2.67 2.57 2.64 2.65 2Q14 3Q14 4Q14 1Q15 2Q15 Accretion NIM Net Interest Income($ in millions) Net Interest Income and Rate NIM1: $413MM 1Q15 2.64% +11 Loan impacts:+5MM Loan growth+4MM One add’l day in 2Q15+2MM Higher loan yields 0.01 -3 Other: -Lower securities yields -Lower avg. balance at Fed -Higher debt expense $421MM 2Q15 2.65% +200 bps rate rise = ~$220MM2 Estimated increase to net interest income over 12 months 9 3 1 8 18 8 3 1 7 15 2Q14 3Q14 4Q14 1Q15 2Q15 NCO Ratio 10 Credit Metrics Remain Below Historical Normal LevelsProvision of $47MM At 6/30/15 ● 1Criticized loans are consistent with regulatory defined Special Mention, Substandard, Doubtful & Loss loan classifications. ● 2This information includes all loans related to energy at 6/30/15, ~$3.3B of loans in our Energy business line & ~$725MM loans in other businesses that have a sizable portion of their revenue related to energy or could be otherwise disproportionately negatively impacted by prolonged low oil and gas prices. ● 3”Normal” estimates are based on internal historical analysis & management judgement. Provision increased $33MM: • Increased criticized energy2 loans • Continued energy price uncertainty Nonaccrual loans increased $83MM:• 0.7% of total loans• Energy2 increased $97MM to $119MM Criticized loans increased $294MM:• Energy2 increased $329MM to $578MM Energy2 net charge-offs $2MM 633 635 635 640 668 1.7 1.7 2.1 2.2 1.7 2Q14 3Q14 4Q14 1Q15 2Q15 Allowance for LoanLosses as a % of NPL's Net Loan Charge-offs($ in millions) (bps) Normal Net Charge-Offs ~40 bps3 326 329 273 266 349 4.6 4.4 3.9 4.2 4.7 2Q14 3Q14 4Q14 1Q15 2Q15 NALs Criticized as a % of Total Loans Criticized Loans1($ in millions) Normal Criticized Loans of ~8.5% of Total Loans3 Allowance for Credit Losses($ in millions) 2,188 2,094 1,893 2,067 2,361
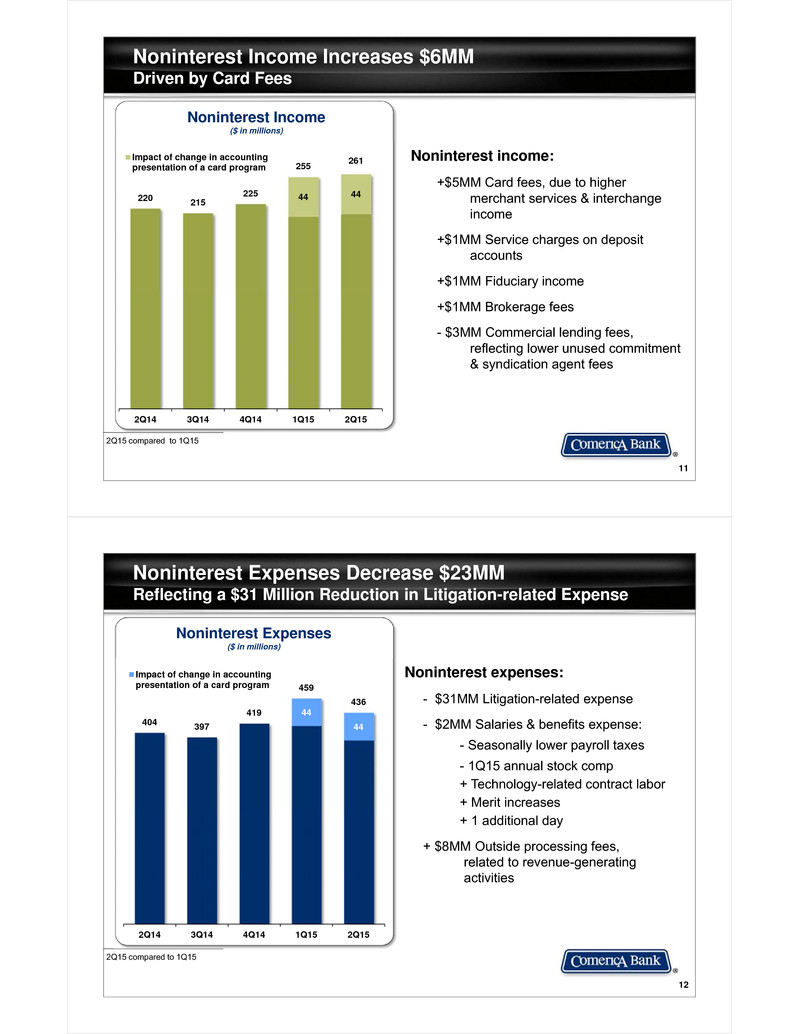
11 Noninterest Income Increases $6MMDriven by Card Fees 2Q15 compared to 1Q15 44 44220 215 225 255 261 2Q14 3Q14 4Q14 1Q15 2Q15 Impact of change in accountingpresentation of a card program Noninterest Income ($ in millions) Noninterest income: +$5MM Card fees, due to higher merchant services & interchange income +$1MM Service charges on deposit accounts +$1MM Fiduciary income +$1MM Brokerage fees - $3MM Commercial lending fees, reflecting lower unused commitment & syndication agent fees 12 Noninterest Expenses Decrease $23MMReflecting a $31 Million Reduction in Litigation-related Expense 2Q15 compared to 1Q15 Noninterest expenses: - $31MM Litigation-related expense - $2MM Salaries & benefits expense: - Seasonally lower payroll taxes- 1Q15 annual stock comp+ Technology-related contract labor+ Merit increases+ 1 additional day + $8MM Outside processing fees, related to revenue-generating activities 44 44404 397 419 459 436 2Q14 3Q14 4Q14 1Q15 2Q15 Impact of change in accountingpresentation of a card program Noninterest Expenses($ in millions)
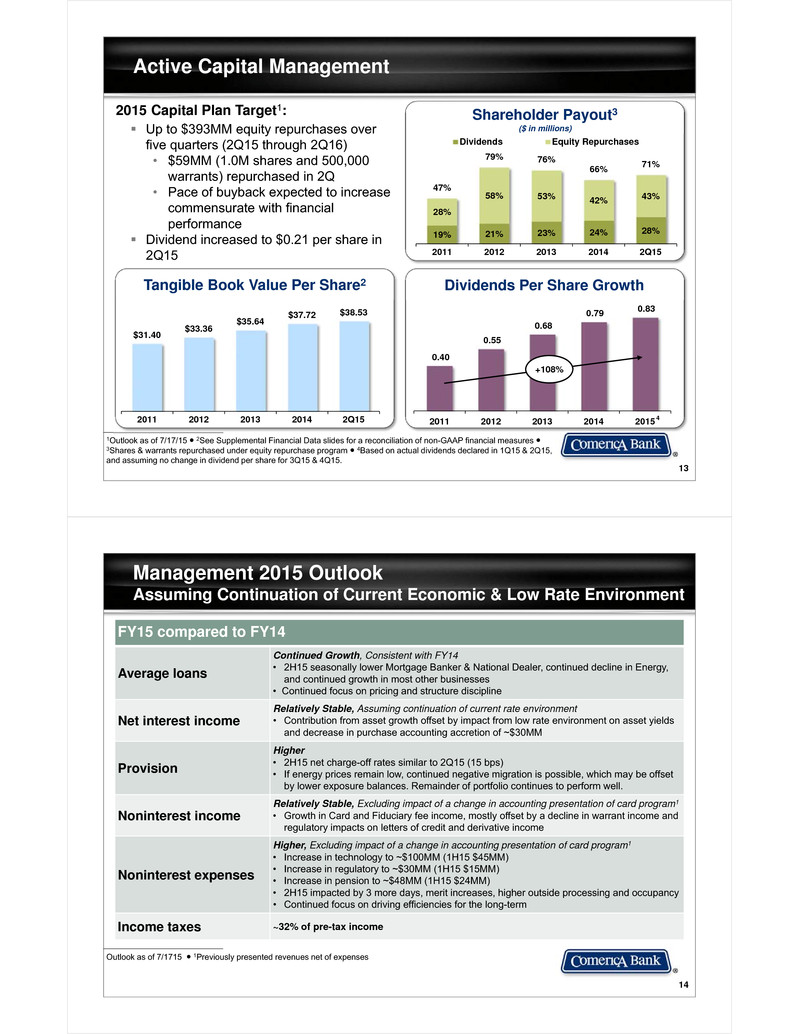
13 19% 21% 23% 24% 28% 28% 58% 53% 42% 43%47% 79% 76% 66% 71% 2011 2012 2013 2014 2Q15 Dividends Equity Repurchases Active Capital Management 1Outlook as of 7/17/15 ● 2See Supplemental Financial Data slides for a reconciliation of non-GAAP financial measures ●3Shares & warrants repurchased under equity repurchase program ● 4Based on actual dividends declared in 1Q15 & 2Q15, and assuming no change in dividend per share for 3Q15 & 4Q15. Shareholder Payout3($ in millions)2015 Capital Plan Target1: Up to $393MM equity repurchases over five quarters (2Q15 through 2Q16)• $59MM (1.0M shares and 500,000 warrants) repurchased in 2Q• Pace of buyback expected to increase commensurate with financial performance Dividend increased to $0.21 per share in 2Q15 Dividends Per Share Growth 0.40 0.55 0.68 0.79 0.83 2011 2012 2013 2014 2015 +108% $31.40 $33.36 $35.64 $37.72 $38.53 2011 2012 2013 2014 2Q15 Tangible Book Value Per Share2 4 14 Management 2015 OutlookAssuming Continuation of Current Economic & Low Rate Environment Outlook as of 7/1715 ● 1Previously presented revenues net of expenses FY15 compared to FY14 Average loans Continued Growth, Consistent with FY14 • 2H15 seasonally lower Mortgage Banker & National Dealer, continued decline in Energy, and continued growth in most other businesses• Continued focus on pricing and structure discipline Net interest income Relatively Stable, Assuming continuation of current rate environment• Contribution from asset growth offset by impact from low rate environment on asset yields and decrease in purchase accounting accretion of ~$30MM Provision Higher• 2H15 net charge-off rates similar to 2Q15 (15 bps)• If energy prices remain low, continued negative migration is possible, which may be offset by lower exposure balances. Remainder of portfolio continues to perform well. Noninterest income Relatively Stable, Excluding impact of a change in accounting presentation of card program1• Growth in Card and Fiduciary fee income, mostly offset by a decline in warrant income and regulatory impacts on letters of credit and derivative income Noninterest expenses Higher, Excluding impact of a change in accounting presentation of card program1• Increase in technology to ~$100MM (1H15 $45MM)• Increase in regulatory to ~$30MM (1H15 $15MM) • Increase in pension to ~$48MM (1H15 $24MM)• 2H15 impacted by 3 more days, merit increases, higher outside processing and occupancy• Continued focus on driving efficiencies for the long-term Income taxes ~32% of pre-tax income

Appendix 16 Interest Rate SensitivityRemain Well Positioned for Rising Rates At 6/30/15 ● For methodology see the Company’s Form 10Q, as filed with the SEC. Estimates are based on simulation modeling analysis. ● 1Standard Model Assumption for deposit balances reflects historical experience and management judgement regarding deposit runoff in light of unprecedented liquidity. Estimated Net Interest Income: Annual (12 month) SensitivitiesBased on Various AssumptionsAdditional Scenarios are Relative to 2Q15 Standard Model($ in millions) ~110 ~190 ~200 ~210 ~220 ~260 ~330 Up 100bps Addl. $3BDepositDecline Addl.20%Increasein Beta Addl. $1BDepositDecline 2Q15StandardModel Addl.~3%LoanGrowth Up 300bps 0.1 Interest Rates 200 bps gradual, non-parallel rise Loan Balances Modest increase Deposit Balances Moderate decrease1 Deposit Pricing (Beta) Historical price movements with short-term rates Securities Portfolio Increased for LCR compliance Loan Spreads Held at current levels MBS Prepayments Third-party projections and historical experience Hedging (Swaps) No additions modeled Standard Model Assumptions
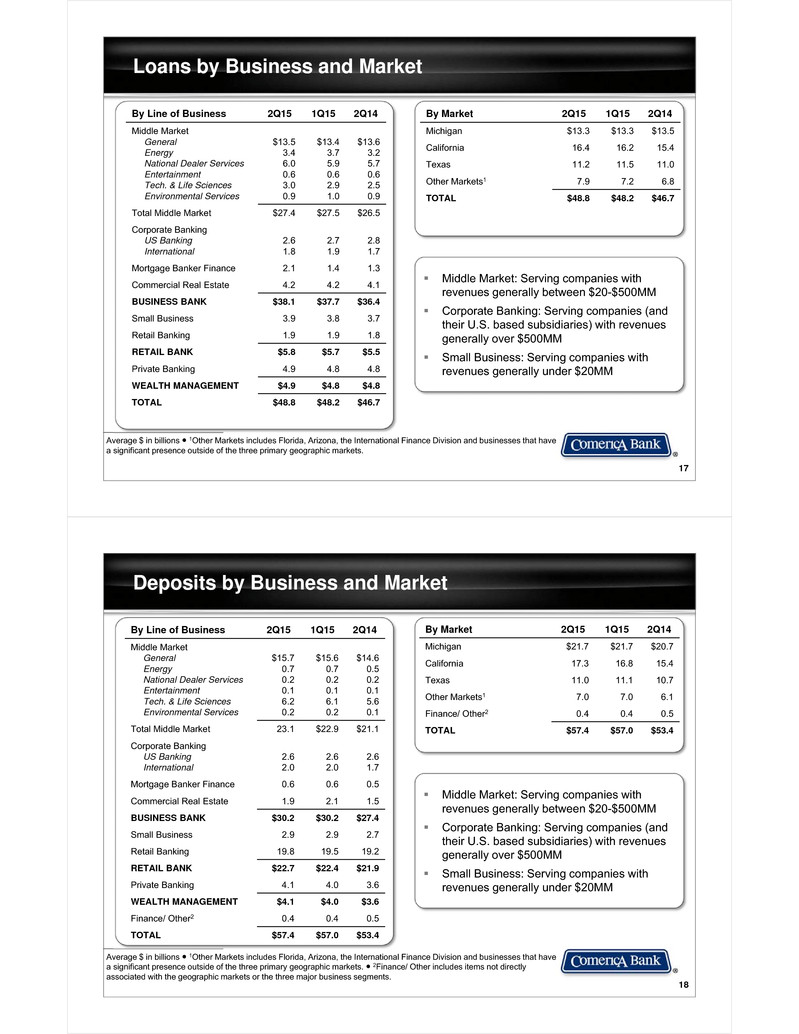
17 Loans by Business and Market Average $ in billions ● 1Other Markets includes Florida, Arizona, the International Finance Division and businesses that have a significant presence outside of the three primary geographic markets. Middle Market: Serving companies with revenues generally between $20-$500MM Corporate Banking: Serving companies (and their U.S. based subsidiaries) with revenues generally over $500MM Small Business: Serving companies with revenues generally under $20MM By Line of Business 2Q15 1Q15 2Q14 Middle MarketGeneralEnergyNational Dealer ServicesEntertainmentTech. & Life SciencesEnvironmental Services $13.53.46.00.63.00.9 $13.43.75.90.62.91.0 $13.63.25.70.62.50.9 Total Middle Market $27.4 $27.5 $26.5 Corporate BankingUS BankingInternational 2.61.8 2.71.9 2.81.7 Mortgage Banker Finance 2.1 1.4 1.3 Commercial Real Estate 4.2 4.2 4.1 BUSINESS BANK $38.1 $37.7 $36.4 Small Business 3.9 3.8 3.7 Retail Banking 1.9 1.9 1.8 RETAIL BANK $5.8 $5.7 $5.5 Private Banking 4.9 4.8 4.8 WEALTH MANAGEMENT $4.9 $4.8 $4.8 TOTAL $48.8 $48.2 $46.7 By Market 2Q15 1Q15 2Q14 Michigan $13.3 $13.3 $13.5 California 16.4 16.2 15.4 Texas 11.2 11.5 11.0 Other Markets1 7.9 7.2 6.8 TOTAL $48.8 $48.2 $46.7 18 Deposits by Business and Market Average $ in billions ● 1Other Markets includes Florida, Arizona, the International Finance Division and businesses that have a significant presence outside of the three primary geographic markets. ● 2Finance/ Other includes items not directly associated with the geographic markets or the three major business segments. Middle Market: Serving companies with revenues generally between $20-$500MM Corporate Banking: Serving companies (and their U.S. based subsidiaries) with revenues generally over $500MM Small Business: Serving companies with revenues generally under $20MM By Line of Business 2Q15 1Q15 2Q14 Middle MarketGeneralEnergyNational Dealer ServicesEntertainmentTech. & Life SciencesEnvironmental Services $15.70.70.20.16.20.2 $15.60.70.20.16.10.2 $14.60.50.20.15.60.1 Total Middle Market 23.1 $22.9 $21.1 Corporate BankingUS BankingInternational 2.62.0 2.62.0 2.61.7 Mortgage Banker Finance 0.6 0.6 0.5 Commercial Real Estate 1.9 2.1 1.5 BUSINESS BANK $30.2 $30.2 $27.4 Small Business 2.9 2.9 2.7 Retail Banking 19.8 19.5 19.2 RETAIL BANK $22.7 $22.4 $21.9 Private Banking 4.1 4.0 3.6 WEALTH MANAGEMENT $4.1 $4.0 $3.6 Finance/ Other2 0.4 0.4 0.5 TOTAL $57.4 $57.0 $53.4 By Market 2Q15 1Q15 2Q14 Michigan $21.7 $21.7 $20.7 California 17.3 16.8 15.4 Texas 11.0 11.1 10.7 Other Markets1 7.0 7.0 6.1 Finance/ Other2 0.4 0.4 0.5 TOTAL $57.4 $57.0 $53.4
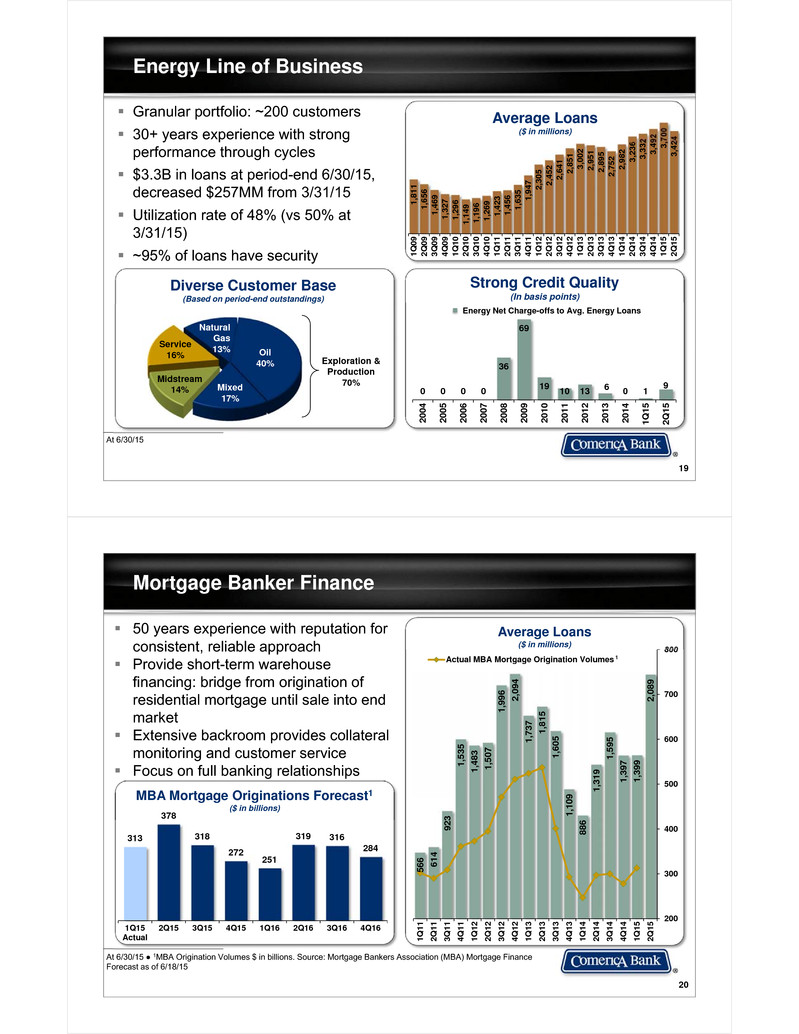
19 Energy Line of Business At 6/30/15 Granular portfolio: ~200 customers 30+ years experience with strong performance through cycles $3.3B in loans at period-end 6/30/15, decreased $257MM from 3/31/15 Utilization rate of 48% (vs 50% at 3/31/15) ~95% of loans have security 1,81 1 1,65 6 1,46 9 1,32 7 1,29 6 1,14 9 1,19 6 1,26 9 1,42 3 1,45 6 1,63 5 1,94 7 2,30 5 2,45 2 2,64 1 2,85 1 3,00 2 2,95 1 2,89 5 2,75 2 2,98 2 3,23 6 3,33 2 3,49 2 3,70 0 3,42 4 1Q0 9 2Q0 9 3Q0 9 4Q0 9 1Q1 0 2Q1 0 3Q1 0 4Q1 0 1Q1 1 2Q1 1 3Q1 1 4Q1 1 1Q1 2 2Q1 2 3Q1 2 4Q1 2 1Q1 3 2Q1 3 3Q1 3 4Q1 3 1Q1 4 2Q1 4 3Q1 4 4Q1 4 1Q1 5 2Q1 5 Average Loans($ in millions) 0 0 0 0 36 69 19 10 13 6 0 1 9 200 4 200 5 200 6 200 7 200 8 200 9 201 0 201 1 201 2 201 3 201 4 1Q1 5 2Q1 5 Strong Credit Quality(In basis points) Energy Net Charge-offs to Avg. Energy Loans Exploration & Production 70%Midstream14% Service16% Natural Gas 13% Oil40% Mixed17% Diverse Customer Base(Based on period-end outstandings) 20 At 6/30/15 ● 1MBA Origination Volumes $ in billions. Source: Mortgage Bankers Association (MBA) Mortgage Finance Forecast as of 6/18/15 566 61 4 923 1,53 5 1,48 3 1,50 7 1,99 6 2,09 4 1,73 7 1,81 5 1,60 5 1,10 9 886 1,31 9 1,59 5 1,39 7 1,39 9 2,08 9 200 300 400 500 600 700 800 1Q1 1 2Q1 1 3Q1 1 4Q1 1 1Q1 2 2Q1 2 3Q1 2 4Q1 2 1Q1 3 2Q1 3 3Q1 3 4Q1 3 1Q1 4 2Q1 4 3Q1 4 4Q1 4 1Q1 5 2Q1 5 Actual MBA Mortgage Origination Volumes Average Loans($ in millions) Mortgage Banker Finance MBA Mortgage Originations Forecast1($ in billions) 313 378 318 272 251 319 316 284 1Q15Actual 2Q15 3Q15 4Q15 1Q16 2Q16 3Q16 4Q16 1 50 years experience with reputation for consistent, reliable approach Provide short-term warehouse financing: bridge from origination of residential mortgage until sale into end market Extensive backroom provides collateral monitoring and customer service Focus on full banking relationships

21 National Dealer Services At 6/30/15 ● 1Other includes obligations where a primary franchise is indeterminable (rental car and leasing companies, heavy truck, recreational vehicles, and non-floor plan loans) Toyota/Lexus15% Honda/Acura 14% Ford 9% GM 9% Chrysler 10% Mercedes 3% Nissan/ Infiniti 7%Other European 12% Other Asian 11% Other110% Franchise Distribution(Based on period-end loan outstandings) Geographic DispersionCalifornia 63% Texas 8%Michigan 18% Other 11% Average Loans($ in billions) 65+ years of Floor Plan lending, with 20+ years on a national basis Top tier strategy Focus on “Mega Dealer” (five or more dealerships in group) Strong credit quality Robust monitoring of company inventory and performance 1.9 1.7 1.3 1.5 1.9 2.3 2.3 2.5 2.8 3.1 2.9 3.2 3.2 3.5 3.2 3.4 3.5 3.6 3.8 3.6 3.1 3.4 3.8 4.3 4.3 4.6 4.9 5.1 4.9 5.3 5.3 5.7 5.5 5.7 5.9 6.0 1Q1 1 2Q1 1 3Q1 1 4Q1 1 1Q1 2 2Q1 2 3Q1 2 4Q1 2 1Q1 3 2Q1 3 3Q1 3 4Q1 3 1Q1 4 2Q1 4 3Q1 4 4Q1 4 1Q1 5 2Q1 5 Floor Plan 22 Technology and Life Sciences At 6/30/15 20+ years experience provides competitive advantage Products and services tailored to meet the needs of emerging companies throughout their lifecycle Strong relationships with top-tier investors National business headquartered in Palo Alto, CA, operating from 14 offices in the U.S. and Toronto Top notch relationship managers with extensive industry expertise Customer Segment Overview(% based on loan outstandings) ~20% Early Stage ~40%Growth ~10% Late Stage ~25%Equity Funds Services ~5%Leveraged Finance Average Loans($ in billions) 1.1 1.1 1.1 1.2 1.2 1.2 1. 3 1.5 1.6 1.7 1 .8 1.9 2.0 1.9 2.0 2. 1 2.3 2. 5 2.6 2.7 2. 9 3.0 1Q1 0 2Q1 0 3Q1 0 4Q1 0 1Q1 1 2Q1 1 3Q1 1 4Q1 1 1Q1 2 2Q1 2 3Q1 2 4Q1 2 1Q1 3 2Q1 3 3Q1 3 4Q1 3 1Q1 4 2Q1 4 3Q1 4 4Q1 4 1Q1 5 2Q1 5 3.3 3.4 3.3 3.5 3. 7 4.1 4.2 4.4 4 .7 5.1 5.2 5.2 5.0 5.0 5.1 5.2 5 .7 5.6 5.9 6 .2 6.1 6.2 1Q1 0 2Q1 0 3Q1 0 4Q1 0 1Q1 1 2Q1 1 3Q1 1 4Q1 1 1Q1 2 2Q1 2 3Q1 2 4Q1 2 1Q1 3 2Q1 3 3Q1 3 4Q1 3 1Q1 4 2Q1 4 3Q1 4 4Q1 4 1Q1 5 2Q1 5 Average Deposits($ in billions)

23 Commercial Real Estate Line of Business At 6/30/15 ● 1Includes CRE line of business loans not secured by real estate. ● 2Excludes CRE line of business loans not secured by real estate. 5.7 5.4 5.1 4.8 4.4 4.0 4.4 4.6 4.4 4.3 3.9 3.7 3.7 3.8 3.8 3.8 4 .0 4.1 4.2 4.2 4.2 4.2 1Q1 0 2Q1 0 3Q1 0 4Q1 0 1Q1 1 2Q1 1 3Q1 1 4Q1 1 1Q1 2 2Q1 2 3Q1 2 4Q1 2 1Q1 3 2Q1 3 3Q1 3 4Q1 3 1Q1 4 2Q1 4 3Q1 4 4Q1 4 1Q1 5 2Q1 5 Commercial MortgagesReal Estate ConstructionCommercial & Other Average Loans($ in billions) 5.6 6.1 6.4 6.4 6.6 2Q14 3Q14 4Q14 1Q15 2Q15 Commitments($ in billions; Based on period-end) 19% 1 Michigan$237 7% California$1,607 46% Texas$957 28%Florida$127 4% Other$519 15% CRE by Market2($ in millions; Based on location of property) 24 Shared National Credit (SNC) Relationships At 6/30/15 ● SNCs are not a line of business. The balances shown above are included in the line of business balances. ●SNCs are facilities greater than $20 million shared by three or more federally supervised financial institutions which are reviewed by regulatory authorities at the agent bank level. SNC relationships included in business line balances Approximately 830 borrowers Comerica is agent for approx. 20% Strategy: Pursue full relationships with ancillary business Adhere to same credit underwriting standards as rest of loan book Period-end Loans of $10.6B Commercial Real Estate$0.7B 6% Corporate $2.6B 25% General$2.4B 22%National Dealer $0.5B 4% Energy$3.1B 30% Entertainment$0.3B 3% Tech. & Life Sciences$0.3B 3% Environmental Services $0.3B 3% Mortgage Banker$0.4B 4% = Total Middle Market (65%)

25 Government Card ProgramsGenerate Valuable Retail Deposits At 6/30/15 ● 1Source: the Nilson Report July 2015, based on 2014 data ● 2Based on a 2014 survey conducted by KRC Research ● 3Source: U.S. Department of the Treasury ● 4Source: Social Security Administration 720 948 1,221 1,444 1,650 2011 2012 2013 2014 YTD 2015 US Treasury ProgramState Card Programs Growing Average Noninterest-Bearing Deposits($ in millions) #2 prepaid card issuer in US1 State/ Local government benefit programs:• 49 distinct programs US Treasury DirectExpress Program:• Exclusive provider of prepaid debit cards since 2008; contract extended to January 2020• ~80k new accounts per month• 95% of Direct Express card holders report they are satisfied2• Eliminating monthly benefit checks, resulting in significant taxpayer savings3 # of Social Security Beneficiaries4(in millions) 25 30 35 40 45 50 55 60 1970 1975 1980 1985 1990 1995 2000 2005 2010 Key Facts 26 Funding and Maturity Profile At 6/30/15 ● 1Face value at maturity. Access to wholesale debt markets Federal Home Loan Bank of Dallas• $-0- outstanding • $5B borrowing capacity Brokered deposits Fed funds/ Repo markets ~$7B unencumbered securities Loan to deposit ratio of 85% Multiple Funding Sources Debt Profile by Maturity1($ in millions) 300 650 500 350 900 2015 2016 2017 2019 2020+ Subordinated Notes Senior Notes Equity$7.5B 11% Interest-Bearing Deposits$30.1B 44% Noninterest-Bearing Deposits$28.2B 41% Wholesale Debt $2.9B 4% Funding ProfileAt June 30, 2015

27 Expenses Remain Well ControlledContinued Focus on Efficiency At 6/30/15 ● 1Normal fed fund rate of 3-4% not necessary to reach long-term goal. ● 2Goal as of 7/17/15. 11,4 44 11,3 50 11,2 87 11,2 09 10,8 92 10,8 16 10,7 00 10,7 82 10,1 86 9,40 2 9,07 3 9,46 8 9,03 5 8,94 8 8,87 6 8,83 1 8,90 1 $6.0 $6 .8 $7.1 $7 .5 $7.4 $7 .8 $8.4 $8.5 $9 .2 $9.2 $8.8 $8.9 $ 10.3 $10 .7 $11 .4 $11 .9 $11 .9 200 0 200 1 200 2 200 3 200 4 200 5 200 6 200 7 200 8 200 9 201 0 201 1 201 2 201 3 201 4 1Q1 5 2Q1 5 Employees Avg. Loans + Deposits/Employee Driving Efficiency While Growing Loans & Deposits($ in millions) Factors Expected to Drive Long-Term Efficiency Ratio Goal2 51.8 % 50.7 % 50.4 % 54.0 % 47.1 % 53.2 % 55.6 % 58.0 % 58.9 % 58.6 % 68.6 % 63.7 % 199 8 199 9 200 0 200 1 200 2 200 3 200 4 200 5 200 6 200 7 1Q1 5 2Q1 5 Average: 53.8% 10-Years Prior to the Downturn Long-TermGoal: Below 60% Long-Term Efficiency Ratio Goal2: < 60% 2Q15 Long-Term Goal Expense Growth Fee Income Growth Loan Growth ~2-3% Normal1(~3-4%) Fed Funds Rate 64% 2-3% 3-4% 3-4% Below 60% Senior Unsecured/Long-Term Issuer Rating S&P Moody’s Fitch Cullen Frost A A2 -- BB&T A- A2 A+ BOK Financial A- A2 A Comerica A- A3 A M&T Bank A- A3 A- KeyCorp BBB+ Baa1 A- Fifth Third BBB+ Baa1 A SunTrust BBB+ Baa1 BBB+ Huntington BBB Baa1 A- Regions Financial BBB Baa3 BBB Zions Bancorporation BBB- Ba1 BBB- First Horizon National Corp BB+ Baa3 BBB- Wells Fargo & Company A+ A2 AA- U.S. Bancorp A+ A1 AA- JP Morgan A A3 A+ PNC Financial Services Group A- A3 A+ Bank of America A- Baa1 A 28 Holding Company Debt Rating As of 7/7/15 ● Source: SNL Financial ● Debt Ratings are not a recommendation to buy, sell, or hold securities Pee r Ba nks Larg e Ba nks

Supplemental Financial DataReconciliation of non-GAAP financial measures with financial measures defined by GAAP ($ in millions) The Tier 1 common capital ratio removes preferred stock and qualifying trust preferred securities from Tier 1 capital as defined by and calculated in conformity with Basel I risk-based capital rules in effect through 12/31/14. Effective 1/1/15, regulatory capital components and risk-weighted assets are defined by and calculated in conformity with Basel III risk-based capital rules. The tangible common equity ratio removes preferred stock and the effect of intangible assets from capital and the effect of intangible assets from total assets. Tangible common equity per share of common stock removes the effect of intangible assets from common shareholders equity per share of common stock.The Corporation believes these measurements are meaningful measures of capital adequacy used by investors, regulators, management and others to evaluate the adequacy of common equity and to compare against other companies in the industry.1Tier 1 Capital and risk-weighted assets as defined by Basel I risk-based capital rules.n/a – not applicable. 6/30/15 3/31/15 12/31/14 6/30/14 12/31/13 12/31/12 12/31/11 Tier 1 and Tier 1 common capital1Risk-weighted assets1Tier 1 and Tier 1 common capital ratio n/an/an/a n/an/an/a 7,16968,26910.50% 7,02766,90910.50% 6,89564,82510.64% 6,70566,11510.14% Common shareholders’ equityLess: GoodwillLess: Other intangible assets $7,52363515 $7,50063515 $7,40263515 $7,36963515 $7,15063517 $6,93963522 $6,86563532 Tangible common equity 6,873 $6,850 $6,752 $6,719 $6,498 $6,282 $6,198 Total assetsLess: GoodwillLess: Other intangible assets $69,94563515 $69,33363515 $69,18663515 $65,32363515 $65,22463517 $65,06663522 $61,00563532 Tangible assets 69,295 $68,683 $68,536 $64,673 $64,572 $64,409 $60,338Common equity ratio 10.76% 10.82% 10.70% 11.28% 10.97% 10.67% 11.26%Tangible common equity ratio 9.92 9.97 9.85 10.39 10.07 9.76 10.27 Common shareholders’ equity $7,523 $7,500 $7,402 $7,369 $7,150 $6,939 $6,865Tangible common equity 6,873 $6,850 $6,752 $6,719 $6,498 $6,282 $6,198Shares of common stock outstanding (in millions) 178 178 179 181 182 188 197 Common shareholders’ equity per share of common stock $42.18 $42.12 $41.35 $40.72 $39.22 $36.86 $34.79 Tangible common equity per share of common stock 38.53 38.47 37.72 37.12 35.64 33.36 31.40 29
