Attached files
| file | filename |
|---|---|
| EX-23.1 - EX-23.1 - SRA Companies, Inc. | d17548dex231.htm |
| EX-10.21 - EX-10.21 - SRA Companies, Inc. | d17548dex1021.htm |
| EX-10.19 - EX-10.19 - SRA Companies, Inc. | d17548dex1019.htm |
| EX-10.18 - EX-10.18 - SRA Companies, Inc. | d17548dex1018.htm |
| EX-10.20 - EX-10.20 - SRA Companies, Inc. | d17548dex1020.htm |
Table of Contents
As filed with the U.S. Securities and Exchange Commission on July 7, 2015
Registration No. 333-
UNITED STATES
SECURITIES AND EXCHANGE COMMISSION
Washington, D.C. 20549
FORM S-1
REGISTRATION STATEMENT
UNDER
THE SECURITIES ACT OF 1933
SRA Companies, Inc.
(Exact name of registrant as specified in its charter)
| Delaware | 7370 | 45-2449380 | ||
| (State or other jurisdiction of incorporation or organization) |
(Primary Standard Industrial Classification Code Number) |
(I.R.S. Employer Identification Number) |
4300 Fair Lakes Court
Fairfax, Virginia 22033
(703) 803-1500
(Address, including zip code, and telephone number, including area code, of registrant’s principal executive offices)
Anne M. Donohue, Esq.
Senior Vice President & General Counsel
SRA Companies, Inc.
4300 Fair Lakes Court
Fairfax, Virginia 22033
(703) 803-1500
(Name, address, including zip code, and telephone number, including area code, of agent for service)
with copies to:
| Steven J. Slutzky, Esq. Debevoise & Plimpton LLP 919 Third Avenue New York, NY 10022 (212) 909-6000 |
Alexander D. Lynch, Esq. Weil, Gotshal & Manges LLP 767 Fifth Avenue New York, NY 10153 (212) 310-8000 |
Approximate date of commencement of proposed sale of the securities to the public: As soon as practicable after this registration statement becomes effective.
If any of the securities being registered on this Form are to be offered on a delayed or continuous basis pursuant to Rule 415 under the Securities Act of 1933, check the following box: ¨
If this Form is filed to register additional securities for an offering pursuant to Rule 462(b) under the Securities Act, please check the following box and list the Securities Act registration statement number of the earlier effective registration statement for the same offering: ¨
If this Form is a post-effective amendment filed pursuant to Rule 462(c) under the Securities Act, check the following box and list the Securities Act registration statement number of the earlier effective registration statement for the same offering. ¨
If this Form is a post-effective amendment filed pursuant to Rule 462(d) under the Securities Act, check the following box and list the Securities Act registration statement number of the earlier effective registration statement for the same offering. ¨
Indicate by check mark whether the registrant is a large accelerated filer, an accelerated filer, a non-accelerated filer, or a smaller reporting company. See the definitions of “large accelerated filer,” “accelerated filer,” and “smaller reporting company” in Rule 12b-2 of the Exchange Act.
| Large accelerated filer | ¨ | Accelerated filer | ¨ | |||||
| Non-accelerated filer | x | (Do not check if a smaller reporting company) | Smaller reporting company | ¨ | ||||
CALCULATION OF REGISTRATION FEE
|
| ||||
| Title of Each Class of Securities to Be Registered |
Proposed Maximum Aggregate Offering Price(1)(2) |
Amount of Registration Fee | ||
| Common stock, par value $0.01 per share |
$100,000,000 | $11,620 | ||
|
| ||||
|
| ||||
| (1) | Estimated solely for the purpose of calculating the registration fee in accordance with Rule 457 of the Securities Act of 1933. |
| (2) | Includes shares of common stock subject to the underwriters’ option to purchase additional shares. |
The registrant hereby amends this registration statement on such date or dates as may be necessary to delay its effective date until the registrant shall file a further amendment which specifically states that this registration statement shall thereafter become effective in accordance with Section 8(a) of the Securities Act of 1933 or until this registration statement shall become effective on such date as the Securities and Exchange Commission, acting pursuant to said Section 8(a), may determine.
Table of Contents
The information in this prospectus is not complete and may be changed. We may not sell these securities until the registration statement filed with the U.S. Securities and Exchange Commission is effective. This prospectus is not an offer to sell these securities and we are not soliciting offers to buy these securities in any state where the offer or sale is not permitted.
SUBJECT TO COMPLETION, DATED JULY 7, 2015
Shares

SRA Companies, Inc.
Common Stock
This is an initial public offering of shares of common stock of SRA Companies, Inc. All of the shares of common stock are being sold by us.
Prior to this offering, there has been no public market for our common stock. We intend to apply to list our common stock on the under the symbol “ .”
We anticipate that the initial public offering price will be between $ and $ per share.
After the completion of this offering, we expect to be a “controlled company” within the meaning of the corporate governance standards of the .
Investing in our common stock involves risks. See “Risk Factors” beginning on page 16 of this prospectus.
| Per Share |
Total | |||||||
| Initial public offering price |
$ | $ | ||||||
| Underwriting discounts and commissions(1) |
$ | $ | ||||||
| Proceeds, before expenses, to us |
$ | $ | ||||||
| (1) | See “Underwriting” for additional compensation details. |
The underwriters also may purchase up to additional shares from us at the initial offering price less the underwriting discounts and commissions, within 30 days from the date of this prospectus, to cover over-allotments of shares.
Neither the U.S. Securities and Exchange Commission nor any state securities commission has approved or disapproved of these securities or passed upon the adequacy or accuracy of this prospectus. Any representation to the contrary is a criminal offense.
The underwriters expect to deliver the shares to purchasers on or about , 2015.
| BofA Merrill Lynch | Citigroup | |
Prospectus dated , 2015
Table of Contents
| 1 | ||||
| 16 | ||||
| 37 | ||||
| 38 | ||||
| 39 | ||||
| 40 | ||||
| 42 | ||||
| Management’s Discussion and Analysis of Financial Condition and Results of Operations |
44 | |||
| 64 | ||||
| 76 | ||||
| 81 | ||||
| 97 | ||||
| 101 | ||||
| 105 | ||||
| 107 | ||||
| 113 | ||||
| 115 | ||||
| 119 | ||||
| 127 | ||||
| 127 | ||||
| 127 | ||||
| F-1 |
You should rely only on the information contained in this prospectus or in any free writing prospectus that we authorize be distributed to you. We have not, and the underwriters have not, authorized anyone to provide you with different information. If anyone provides you with different or inconsistent information, you should not rely on it. This prospectus does not constitute an offer to sell, or a solicitation of an offer to purchase, the securities offered by this prospectus in any jurisdiction in which it is unlawful to make such offer or solicitation. You should assume that the information contained in this prospectus is accurate only as of the date of this prospectus.
For investors outside the United States: Neither we nor any of the underwriters have done anything that would permit this offering or possession or distribution of this prospectus in any jurisdiction where action for that purpose is required, other than in the United States. You are required to inform yourselves about and to observe any restrictions relating to this offering and the distribution of this prospectus outside of the United States.
i
Table of Contents
SPECIAL NOTE REGARDING FORWARD-LOOKING STATEMENTS
This prospectus includes forward-looking statements. Some of the forward-looking statements can be identified by the use of terms such as “believes,” “expects,” “may,” “will,” “should,” “could,” “seeks,” “intends,” “plans,” “potential,” “estimates,” “anticipates,” or other comparable terms. These forward-looking statements include all matters that are not related to present facts or current conditions or that are not historical facts. They appear in a number of places throughout this prospectus and include statements regarding our intentions, beliefs, or current expectations concerning, among other things, our consolidated results of operations, financial condition, liquidity, prospects and growth strategies, future performance, and the markets in which we compete.
Forward-looking statements are subject to known and unknown risks and uncertainties, many of which are beyond our control. We caution you that forward-looking statements are not guarantees of future performance and that our actual consolidated results of operations, financial condition and liquidity, and industry development may differ materially from those made in or suggested by the forward-looking statements contained in this prospectus. In addition, even if our consolidated results of operations, financial condition and liquidity, and industry development are consistent with the forward-looking statements contained in this prospectus, those results or developments may not be indicative of results or developments in subsequent periods. There may be events in the future that we are not able to predict accurately or control, including the factors listed in the section captioned “Risk Factors.” These factors, and other cautionary language in this prospectus, provide some, but not all, possible examples of risks, uncertainties, and events that may cause our actual results to differ materially from the expectations we describe in our forward-looking statements.
Factors or risks that could cause our actual results to differ materially from the results we anticipate include, but are not limited to:
| • | reduced spending levels and changing budget priorities of our largest customer, the United States federal government, which accounted for more than 97% of our revenue in fiscal 2014 and the first nine months of fiscal 2015; |
| • | failure of our customers to fund a contract or exercise options to extend contracts, or our inability to successfully execute awarded contracts; |
| • | failure to convert our backlog into revenue and the timing of our receipt of revenue under contracts included in backlog; |
| • | changes in estimates used in recognizing revenue; |
| • | our ability to generate revenue under certain of our contracts; |
| • | future spending cuts to civil and defense programs as a result of sequestration, government shutdowns, or other budget constraints; |
| • | failure to maintain strong relationships with government entities and agencies and other contractors and subcontractors; |
| • | limitations as a result of our substantial indebtedness which could adversely affect our financial health, operational flexibility, and strategic plans; |
| • | failure to generate cash sufficient to pay the principal of, interest on, or other amounts due on our debt; |
| • | failure to comply with complex laws and regulations, including, but not limited to, the False Claims Act, the Federal Acquisition Regulation, or FAR, the Defense Federal Acquisition Regulation Supplement, and the U.S. Government Cost Accounting Standards; |
| • | possible delays or overturning of our government contract awards due to bid protests, loss of contract revenue, or diminished opportunities based on the existence of organizational conflicts of interest or failure to perform by other companies on which we depend to deliver products and services; |
ii
Table of Contents
| • | security threats, attacks, or other disruptions to our information infrastructure, or failure to comply with complex network security, data privacy or legal and contractual obligations, or the failure to protect sensitive information; |
| • | our history of net losses and ability to become profitable in the future; |
| • | inability or failure to adequately protect our proprietary information or intellectual property rights or violation of third-party intellectual rights; |
| • | potential for significant economic or personal liabilities resulting from failures, errors, delays, or defects associated with products, services, and systems we supply, including risks associated with work performed through joint venture arrangements; |
| • | adverse changes in federal government practices; |
| • | pricing pressure on new work, reduced profitability, or loss of market share due to intense competition and commoditization of services we offer; |
| • | adverse results of audits and investigations conducted by the Defense Contract Audit Agency, Internal Revenue Service, or IRS, or any of the Inspectors General for various agencies with which we contract, including, without limitation, any determination that our purchasing, property, estimating, cost accounting, labor, billing, compensation, management information systems, or contractor internal control systems are deficient; |
| • | adverse determinations of any tax authority successfully challenging our operational structure, transfer pricing policies, or the taxable presence of our remaining subsidiaries in certain countries, or a finding against us in a material tax dispute, could increase our effective tax rate on our earnings and materially decrease earnings and negatively affect cash flows from operations; |
| • | required payments under the Tax Receivable Agreement may be in excess of our actual cash tax savings and may be accelerated in certain circumstances; |
| • | changes in the mix of our contracts and difficulties accurately estimating contract costs and contract performance requirements; |
| • | failure to collect, or delays in the collection of, our receivables; |
| • | failure of any government audit or compliance requirement including any failure to comply with laws and regulations applicable to government services providers; |
| • | possible impairment of goodwill, trade names, and other assets as a result of customer budget pressures and reduced U.S. federal government spending; |
| • | challenges attracting and retaining key personnel or high-quality employees, particularly those with security clearances; |
| • | failure to manage acquisitions or divestitures successfully, including identifying, evaluating, and valuing acquisition targets, integrating acquired companies, businesses or assets, losses associated with divestitures, and the inability to effect divestitures at attractive prices and on a desired timeline; |
| • | possible future losses that exceed our insurance coverage; |
| • | pending litigation and any resulting expenses, payments, or sanctions, including, but not limited to, penalties, compensatory damages, or suspension or debarment from future government contracting; |
| • | the significant influence Providence (as defined herein) and Dr. Ernst Volgenau have over corporate decisions; and |
| • | other risks and factors included under “Risk Factors” and elsewhere in this prospectus. |
You should read this prospectus completely and with the understanding that actual future results may be materially different from expectations. All forward-looking statements made in this prospectus are qualified by these cautionary statements. These forward-looking statements are made only as of the date of this prospectus,
iii
Table of Contents
and we do not undertake any obligation, other than as may be required by law, to update or revise any forward-looking or cautionary statements to reflect changes in assumptions, the occurrence of events, unanticipated or otherwise, changes in future results of operations over time, or otherwise.
Comparisons of results for current and any prior periods are not intended to express any future trends, or indications of future performance, unless expressed as such, and should only be viewed as historical data.
We use various trademarks, service marks, and brand names, such as Acuity Insightful Solutions, Agile For Gov, A4G, Cal/Gang, Cybergami, CyberLock, DevOps For Gov, D4G, DocMatcher, Elite, Enduring Values. Inspired Performance, GangNet, GovCyber, Honesty and Service, ITSM4Gov, NetOwl, OneView, ORIONLeads, Owl Design, P2RMIS, PILLAR, RIDGE, RIDGE and design, SRA, Stratify, TaskForce, and wellwithin, which we deem particularly important to the advertising activities and operation of our various lines of business and some of these marks are registered in the United States and, in some cases, other jurisdictions. Solely for convenience, the trademarks, service marks and brand names referred to in this prospectus may be listed with a ©, ® and ™ symbol, but we will assert, to the fullest extent under the applicable law, our rights to these trademarks, service marks and brand names. This prospectus also refers to the brand names, trademarks, or service marks of other companies. We do not intend our use or display of other trade names, trademarks, or service marks to imply relationships with, or endorsement of us by, any other company. All brand names and other trademarks or service marks cited in this prospectus are the property of their respective holders.
This prospectus includes estimates regarding market and industry data and forecasts, which are based on publicly available information, industry publications and surveys, reports from government agencies, reports by market research firms, and our own estimates based on our management’s knowledge of and experience in the market sectors in which we compete. We have not independently verified market and industry data from third-party sources. This information cannot always be verified with complete certainty due to the limits on the availability and reliability of raw data, the voluntary nature of the data gathering process, and other limitations and uncertainties inherent in surveys of market size. Accordingly, investors should not place undue weight on the industry data presented in this prospectus.
Unless the context otherwise indicates or requires, as used in this prospectus, the terms (i) “we,” “our,” “us,” “SRA,” and the “Company” refer to SRA Companies, Inc. and its directly and indirectly owned subsidiaries as a combined entity, except where it is clear that the terms mean only SRA Companies, Inc. exclusive of its subsidiaries and (ii) the term “SRA International, Inc.” refers to SRA International, Inc., our primary operating company and an indirect wholly-owned subsidiary of SRA Companies, Inc.
The consolidated statements of operations and cash flows are presented in this prospectus for the Predecessor and the Successor, which relate to the period from July 1 to July 20, 2011 (preceding the Providence Acquisition (as defined herein)) and the period July 21, 2011 to June 30, 2012 and all periods subsequent to June 30, 2012 (succeeding the Providence Acquisition), respectively. We have prepared our discussion of the results of operations by comparing the mathematical combination of the Successor and Predecessor period in the fiscal year ended June 30, 2012, or fiscal 2012, to the results of operations for the fiscal years ended June 30, 2013, or fiscal 2013, and June 30, 2014, or fiscal 2014. Although the combination of the Predecessor income statement for the period July 1, 2011 to July 20, 2011 with the Successor income
iv
Table of Contents
statement for the period of July 21, 2011 to June 30, 2012 does not comply with accounting principles generally accepted in the United States of America, or GAAP, we believe that it provides a meaningful method of comparison.
We have also prepared our discussion of all operating metrics based on the combination of Successor and Predecessor results in fiscal 2012 compared to the Successor results. We believe this combination of results for the Predecessor entity and Successor entity periods facilitates an investor’s understanding of our results of operations and changes in our results of operations by making the periods more comparable. This combination should not be used in isolation or substituted for the separate Predecessor entity and Successor entity results, nor do the combined results reflect our Predecessor results on a comparative or pro forma basis or what our results would have been had the Providence Acquisition taken place at the beginning of fiscal 2012.
During the fiscal year ended June 30, 2011, or fiscal 2011, we made the decision to divest our Era Systems, or Era, and Global Clinical Development, or GCD, businesses. We sold the airport operations solutions, or AOS, component of Era in the second quarter of fiscal 2011 and Era’s foreign air traffic management and military and security component in the second quarter of fiscal 2012. We also sold the GCD business in the first quarter of fiscal 2012. The Era and GCD businesses are presented as discontinued operations for all periods presented herein. All financial data contained herein are from continuing operations unless otherwise specified.
References to “government fiscal year” refer to the federal government fiscal year ended September 30 of any such year.
v
Table of Contents
The following summary highlights information contained elsewhere in this prospectus and does not contain all of the information that you should consider before investing in our common stock. You should read this entire prospectus, including the sections entitled “Risk Factors” and “Management’s Discussion and Analysis of Financial Condition and Results of Operations,” and our consolidated financial statements and the related notes to those statements, before making an investment decision.
Our Company
We are a leading provider of sophisticated information technology, or IT, and professional services to the U.S. federal government. Our services help our government customers address complex IT needs in order to achieve their missions more effectively, while also increasing efficiency and reducing expenses. Approximately 70% of our revenue is derived from IT service offerings, including software and systems development, network infrastructure and cloud services, and cybersecurity, with the remaining 30% derived from domain-specific professional services in areas such as intelligence analysis, bioinformatics and health sciences, energy and environmental consulting, and enterprise planning and resource management. Our business has an attractive operating model, characterized by recurring revenues, diverse multi-year contracts and strong free cash flow conversion.
We believe that the large size of our addressable market and our focus on higher growth areas of the market provide us with ample opportunities to grow. We estimate, based in part on data from the Federal Procurement Data System, or FPDS, that the U.S. federal government spent approximately $125 billion in government fiscal year 2014 with third parties on the types of IT and professional services that we provide, which we refer to as our addressable market. Within our addressable market, we generated approximately 77% of our revenue in fiscal 2014 from the health, civil, intelligence, homeland security, and law enforcement end markets. Spending by the federal government in the health and civil IT markets is forecasted by International Data Corporation, or IDC, to grow 5.1% annually from government fiscal year 2014 to 2019, which is approximately twice the rate of growth in the administration’s 2016 Department of Defense, or DoD, budget request over the same period. In addition, we generated approximately 23% of our revenue in fiscal 2014 from the defense end market, where we focus on technically complex IT services with long-term demand drivers, such as cybersecurity, mobility, big data, data center optimization, common networking infrastructure, cloud and supporting applications. Less than 2% of our fiscal 2014 revenue was derived from the declining portion of the defense end market tied to Overseas Contingency Operations, or OCO, funding.
In addition to focusing on attractive and growing segments of our addressable market, we have invested in business development capabilities that we believe will enable us to continue to grow our market share. Since 2011, we have nearly doubled headcount in our business development functions, while also reorganizing our resources to more effectively pursue and win new business in our target markets. Through these efforts, we increased the volume of new contract opportunities for which we submitted bids from $2.2 billion in fiscal 2011 to $6.1 billion in fiscal 2015. We have also enhanced the quality of our business development process by identifying and pursuing new business opportunities earlier and focusing on contracts where our services are differentiated from our competitors. As a result, we have maintained stable new business win rates in both fiscal 2014 and during the first nine months of fiscal 2015 and increased new business contract wins from $334 million in fiscal 2012 to $559 million in the twelve months ended March 31, 2015.
Our revenue is diversified across more than 900 unique contracts, with no single government agency representing more than 10% of revenue and no single contract representing more than 5% of revenue for the nine months ended March 31, 2015. Moreover, we have an attractive mix of contract types with approximately 70% of our fiscal 2014 revenue generated from fixed-price or time-and-materials contracts, which typically generate higher margins than cost-plus-fee contracts.
1
Table of Contents
Our attractive business model consists of multi-year contracts with high revenue visibility, attractive margins, and strong free cash flow conversion. We typically serve our customers under long-term contracts that span three to seven years, and we have served many of our customers for more than 20 years. Our long-term contracts and relationships provide us with high revenue visibility, with average contract lengths of approximately five years as of March 31, 2015. Further, our $3.2 billion of total backlog as of March 31, 2015 represents approximately 2.3 times fiscal 2014 revenue, providing us with a base of future revenues supported by existing contracts. We achieved a 13.1% Adjusted EBITDA margin for the nine months ended March 31, 2015, which we believe is among the highest across our public company peers in our industry. We believe that our strong margin profile is due to the sophisticated nature of our work, our efficient operating structure, and our favorable mix of contract types. In addition, with capital expenditures of less than 1% of revenue and low working capital requirements, we have historically had strong free cash flow conversion, allowing us to generate approximately $387 million of cash available for debt reduction or acquisitions since the Providence Acquisition in July 2011.
We direct substantial resources towards recruiting, training and promoting our employees and foster a high-performance culture throughout our organization. Our culture is based on a set of core principles that have defined our business throughout our nearly 40-year history: integrity, quality work for our customers, employee satisfaction, and service to our country and communities. We believe that our emphasis on developing and maintaining a high performance team and culture based on our foundational ethic of Honesty and Service® is a key competitive strength, helping to ensure we efficiently deliver consistent, high-quality work for our customers.
Our revenue, Adjusted EBITDA, and net loss for the nine months ended March 31, 2015 were $1,030.3 million, $140.7 million, and $12.9 million, respectively. Our revenue, Adjusted EBITDA, and net loss for fiscal 2014 were approximately $1.4 billion, $178.8 million, and $24.2 million, respectively. See “—Summary Historical Consolidated Financial and Other Operating Data” for a discussion of Adjusted EBITDA and a reconciliation to net loss.
Our Opportunity
We believe that we are well-positioned to take advantage of the growing needs of our customers for our sophisticated capabilities and services within the large government market for IT and professional services.
Large addressable market that provides ample opportunity for us to grow. We estimate that the U.S. federal government spent approximately $125 billion in government fiscal year 2014 with third parties on the types of IT and professional services that we provide. We believe that this overall addressable market is poised to grow, as the administration’s fiscal year 2016 budget request proposes to increase IT spending by $2 billion, or 2.3%, across substantially all of our end markets over the 2015 budget request level. Due to the large size of the market and our estimated market share of 1.1% based on fiscal 2014 revenues, we believe that there are ample new business opportunities to drive revenue growth and take market share by leveraging the sophisticated nature of our capabilities. We also believe that we have a differentiated position in our addressable market due to our broad footprint across more than 150 agencies in the health, civil, intelligence, homeland security, law enforcement and defense end markets, which allows us to be selective with the opportunities that we pursue and to focus on segments that are experiencing growth.
Increased government demand for IT and professional services. We believe the federal government is in the process of transforming its IT infrastructure and software systems in order to increase efficiency and reduce expenses. For example, guidance from the Office of Management and Budget, or OMB, mandates that federal agencies transform their IT infrastructures to realize cost savings through data center consolidation and
2
Table of Contents
utilization of innovative technologies, such as cloud computing. In order to rapidly address this transformation by the most efficient available means, the federal government frequently engages professional services providers, like us, who have expertise in and focus on IT and related professional services. The capabilities and expertise we provide address the priority areas of IT investment for the federal government, including cloud computing, cybersecurity, and Agile-based software development methodologies. The government’s investment and increased spending in cloud computing is generating new opportunities in areas such as cloud readiness assessments, cloud deployment strategies, and integrated security solutions, including privacy and protection of data stored in the cloud. As a result, Deltek predicts that the market for cloud computing services will increase from $2.4 billion in government fiscal year 2015 to $6.5 billion in government fiscal year 2019, a compound annual growth rate, or CAGR, of approximately 28%. In addition, evolving cyber threats, the pace of technological change, and increasing reliance on mobile solutions make cybersecurity a global priority and an imperative for our government customers. Deltek estimates that the market for non-classified cybersecurity services will grow to $10 billion by government fiscal year 2019.
Focus on higher growth end markets. Many of our end markets are forecasted by IDC to grow faster than overall government IT spending. Of note, 77% of our fiscal 2014 revenue is derived from the health, civil, intelligence, homeland security, and law enforcement agencies of the U.S. federal government. Within this market, health and civil agencies formed the largest component of federal government spending on IT, at $44 billion for government fiscal year 2014. Overall, the health and civil IT markets are forecasted by IDC to increase spending at a CAGR of 5.1% from government fiscal year 2014 to 2019, which compares to a CAGR of 2.6% for the administration’s 2016 DoD budget request over the same period. In particular, many of the largest and most sophisticated customers of our Health and Civil group are expected to experience even stronger IT spending growth over the same period, including IDC-forecasted CAGRs of 6.5% at the Department of State, or DoS, 8.5% at the Department of Health and Human Services, or HHS, and 9.5% at the Department of Veterans Affairs, or VA.
Our Business Groups
Our company is organized into two business groups: Health & Civil (54% of revenue for fiscal 2014) and National Security (46% of revenue for fiscal 2014).
Health & Civil Group
Health
Health, which was the fastest growing component of our business in fiscal 2014, represented approximately 22% of our revenue for fiscal 2014. We believe demand for federal health IT services will continue to expand due to demographic trends, data privacy concerns, and the increased infrastructure required to support the Patient Protection and Affordable Care Act of 2010. We believe that we are well-positioned to take advantage of these trends in the federal health landscape, due to our extensive domain knowledge across key areas of the health market, combined with our technical expertise. We provide these combined IT services and domain expertise to a broad base of health customers through key contract vehicles and contracts that are used by health agencies to procure such services. Our primary customers in the health market include the HHS operating divisions, such as the National Institutes of Health, Health Resources and Services Administration, the Centers for Disease Control and Prevention, the Centers for Medicare and Medicaid Services, and the Food and Drug Administration, as well as the VA and other military health customers.
Civil Agencies
Revenue earned from our civil government business represented approximately 32% of our revenue for fiscal 2014. We believe we have a differentiated position in the civilian market due to our broad footprint across
3
Table of Contents
civilian agencies, which allows us to be selective with the opportunities that we pursue and to focus on high growth areas. Our current work includes contracts supporting the Department of Agriculture, the DoS, the Department of Transportation, the Environmental Protection Agency, the Department of Energy, and the Government Accountability Office, among many others.
National Security Group
Intelligence, Homeland Security, and Law Enforcement
We derived approximately 23% of our revenue in fiscal 2014 from customers in the intelligence, homeland security, and law enforcement market. This market has an ongoing need for sophisticated solutions to help protect the nation from terrorist and other attacks and to carry out core functions, such as transportation security, cybersecurity, counter-terrorism, enforcement and administration of our immigration laws, intelligence analysis, disaster preparedness, and border security. We believe our differentiated expertise in this market lies in our ability to apply analytical, IT-enabled approaches to evaluate and counteract terrorist networks, criminal groups, and other organizations that represent a threat to national security. We believe that our experience addressing these challenges and our extensive team of experts with requisite security clearances have solidified our position as a leader in this market. Our primary customers in this market include agencies and organizations within the U.S. Intelligence Community, the Department of Homeland Security, or DHS, the Department of Justice, or DoJ, and a limited number of state and local law enforcement agencies.
Defense
Our defense business represented approximately 23% of our revenue for fiscal 2014. Within the defense market, we are predominantly focused on technically complex and mission-critical services that have disproportionate government focus and spending, including special forces organizations and joint commands that support high-profile missions. As a result we believe we face fewer government award determinations based solely on price as compared to the broader defense market. In addition, we have limited exposure to areas that face pressure from the drawdown of troops overseas, including OCO spending, which accounted for less than 2% of our revenue in fiscal 2014. Our key customers in the defense market include the U.S. Air Force, U.S. Navy, U.S. Army, U.S. Marine Corps, U.S. European Command, U.S. Africa Command, U.S. Special Operations Command, and a number of other Unified Combatant Commands and joint operations, as well as independent defense agencies.
Our Core Capabilities
We strive to be a trusted partner to government agencies, supporting their most important IT programs on an outsourced basis, so that they can achieve their missions more effectively while also increasing efficiency and reducing expenses. We maintain technical talent across all of our core capabilities, including software and systems development, infrastructure services, cloud computing and migration services, cybersecurity, business intelligence and big data, and mobile solutions. We also have in-house personnel that provide domain-specific expertise and professional services in key areas of focus for the federal government. In order to deliver the most effective solutions as quickly and efficiently as possible, we organize our technical talent into both customer-focused groups and capability-based groups, ensuring that all of our customers have access to our strongest talent and best technical solutions. We believe this organization enhances our ability to provide advanced and differentiated capabilities throughout our customer portfolio. Our Core Capabilities include:
| • | Software and Systems Development. We leverage advanced software practices, architectures, and technologies to deliver customized solutions for our customers that meet the challenges of expanding data sets, mobile work forces and domain-specific requirements. |
4
Table of Contents
| • | Infrastructure and Cloud Services. We help our customers transform and manage their IT infrastructure solutions to meet growing data storage and access needs by providing cloud computing services, mobile solution development, data center consolidation and management, and networks, server and storage engineering. |
| • | Cybersecurity. We meet the growing needs of our government customers to implement and improve cybersecurity capabilities by designing and implementing cybersecurity solutions. We have more than 14 years of computer network defense and operations experience and we currently operate some of the largest cybersecurity operations centers within the U.S. federal government, positioning us to assist our customers with evolving threats. |
| • | Domain-Specific Services. We provide a broad array of differentiated domain-specific professional services including intelligence analysis, bioinformatics and health sciences, energy and environmental consulting, and enterprise planning and resource management. |
Our Strengths
We believe the following are our key strengths:
Strong presence in attractive end markets. We believe that our contract mix is focused on the most attractive end markets within our estimated $125 billion addressable market. In fiscal 2014, we generated approximately 77% of our revenue from the health, civil, intelligence, homeland security, and law enforcement end markets and approximately 23% of our revenue from the defense end market, where we focus on technically complex IT services with long-term demand drivers. The health and civil IT markets are forecasted by IDC to grow at a CAGR of 5.1% from government fiscal year 2014 to 2019, approximately twice the forecasted growth in the administration’s 2016 DoD budget request over the same period. In addition, less than 2% of our fiscal 2014 revenue was derived from the declining portion of the defense end market tied to OCO funding.
Diversified base of customers and contracts. Our revenue is diversified across more than 900 unique contracts, with no single government agency representing more than 10% of revenue and no single contract representing more than 5% of revenue for the nine months ended March 31, 2015. Our broad array of government-wide acquisition contracts, or GWACs, and indefinite delivery/indefinite quantity, or ID/IQ, contract vehicles allows us to pursue opportunities across the vast majority of the departments of the U.S. government we serve, which we believe positions us well to capture new business.
Trusted partner with longstanding relationships across broad customer base. During our nearly 40-year history, we have established deep and enduring relationships across our key customers, serving many of our over 150 customer agencies for more than 20 years. Our workforce is highly integrated with the operations of our customers, with a majority of our professionals working on-site alongside the customers they serve. These relationships afford us differentiated insight into the IT and domain-specific needs of our customers and allow us to engage with customers long before a formal request for proposals, or RFP, for a new procurement is ever released. Today, our approach to pursuing new business opportunities includes pre-RFP engagement of 12-18 months, during which time our customers may consider our input as they define the breadth and scope of their long-term IT plans, and the requirements to be solicited.
Extensive business development capabilities. Since 2011, we have nearly doubled headcount in our business development functions, while also reorganizing our resources to more effectively pursue and win new business in our target markets. We believe this investment will continue to yield meaningful growth opportunities going forward. For example, we increased the volume of bids we submitted for new prime contract opportunities from approximately $2.2 billion in fiscal 2011 to approximately $6.1 billion in fiscal 2015. At the same time, we have made investments to increase the quality of our contract bids, and, as a result, new business wins have increased from $334 million in fiscal 2012 to $559 million in the twelve month period ended March 31, 2015.
5
Table of Contents
Attractive business model with strong free cash flow conversion. Our business model is characterized by long-term revenue visibility, attractive margins, and strong free cash flow conversion. We operate our business through multi-year contracts that generally range from three to seven years. As a result, we have a $3.2 billion total backlog as of March 31, 2015, which represents approximately 2.3 times fiscal 2014 revenue. We achieved a 13.1% Adjusted EBITDA margin for the nine months ended March 31, 2015, which we believe is among the highest across our public company peers in our industry, due to the sophisticated nature of our work, our attractive contract mix, and our efficient operating focus. We also have low capital needs, with capital expenditures representing less than 1% of revenue in each of the last three fiscal years and minimal working capital requirements. These factors have allowed us to generate approximately $387 million of cash available for debt reduction or acquisitions since the Providence Acquisition in July 2011.
High-performance culture and management team. Our enduring values of Honesty and Service® have been in place since our inception and represent our commitment to acting with integrity, delivering quality work and customer satisfaction, taking care of our employees, and serving our country and communities. We are inspired by our customers’ missions and provide who we believe are the best people, working together to generate the best ideas and deliver the best possible performance. We have built upon that foundational culture since 2011 by investing in leadership development programs that extend several layers into our organizational structure. In recent years, we have promoted many strong performers into new leadership roles, resulting in an average tenure of over 11 years among our senior management team. In the process, we have cultivated what we believe is a powerful culture focused on providing value to our customers, hard results, enterprise growth, and cost efficiency.
Our Strategy
The key elements of our growth strategy are to:
Invest in growth. We continue to invest in our business development capabilities and other drivers of growth in order to capitalize on opportunities to increase our market share within our large addressable market. We approach new business opportunities with a rigorous pursuit process, ensuring effective customer engagement and customer understanding of our sophisticated IT and professional services. We leverage the extensive customer knowledge and relationships of our business development professionals to position ourselves for new business opportunities well in advance of the release of an RFP, which we have found greatly improves our chances of success. Through these efforts, we increased the volume of new contract opportunities for which we submitted bids from $2.2 billion in fiscal 2011 to $6.1 billion in fiscal 2015. In addition, new business wins have increased from $334 million in fiscal 2012 to $559 million in the twelve month period ended March 31, 2015.
Maintain a rigorous opportunity selection process. We aim to identify the most attractive new business opportunities across all of our end markets. A strong team of business development professionals, combined with our nearly 40-year history in the industry and deep customer knowledge, enables us to evaluate whether an opportunity meets certain key criteria early in the pipeline qualification process. Our strategy is to identify new business pursuits which do not have an incumbent provider, whose existing provider may be vulnerable to competition, or where we have a long history with the customer. We also look for opportunities to differentiate our proposals with technical merit, either in the form of an innovative technology solution or a unique deployment methodology that is particularly well-suited to the customer’s needs. We specifically avoid bidding on contract opportunities that have established low price as the primary award criterion.
Focus on priority end markets. A key element of our opportunity selection process is the prioritization of investments in the fastest growing end markets for our services, including health, civil, intelligence, homeland security, and law enforcement agencies. We believe our past performance and customer relationships across a broad number of these agencies position us favorably in our pursuit of new business opportunities. We also
6
Table of Contents
leverage our broad footprint and our array of GWAC and ID/IQ contract vehicles, which give us access to what we consider the most attractive end markets while also generally narrowing the competition for task orders.
Invest in our core capabilities and technology. We continue to invest in our core capabilities and technology in order to deliver the most effective and efficient solutions to our customers and further differentiate ourselves. We have established capability centers across our organization, which are focused on institutionalizing best practices, methodologies, technology, and knowledge of the federal environment. Our capability centers allow us to develop sophisticated offerings that we can provide across large portions of our customer base, differentiating us from our competitors and enabling our project teams to utilize best practices and continually introduce innovation to our existing customers. Our capability centers encompass the following areas of expertise: infrastructure and cloud, cybersecurity and privacy, software development and Agile-based services, data analytics and business intelligence, user experience, and mobility and collaboration.
Execute with efficiency. We continue to seek operational improvements to maximize efficiency across both our customer-facing and back office operations, which is a critical component of our competitiveness and margin growth. In fiscal 2012 and 2013, we streamlined our selling, general and administrative costs in the areas of facilities, fringe benefits and indirect labor while increasing our investment in our growth capabilities. In fiscal 2014 and 2015, we continued those efforts and broadened our efficiency initiatives by instituting continuous improvement programs to better manage direct costs. These programs will be deployed on an ongoing and regular basis in order to drive continued operating efficiency.
Identify and pursue strategic acquisition opportunities. As a complement to our organic growth initiatives, we will continue to pursue selective acquisitions to enhance our offerings, expand our customer footprint, and increase our scale. Key selection criteria for potential acquisitions include customer relationships, capabilities and financial performance, as well as our ability to enhance these characteristics through our own business development capabilities and technical expertise as well as any cost efficiencies that come from the potential combination. Over the last four years, we completed two tuck-in acquisitions that allowed us to enhance our capabilities and expand our footprint with key government customers, including defense health agencies, DHS, and specialized portions of the U.S. Intelligence Community.
Risks Related to Our Business
Investing in our common stock involves a high degree of risk. You should carefully consider all of the information in this prospectus prior to investing in our common stock, including the risks related to our business that are described under “Risk Factors” elsewhere in this prospectus. Among these important risks are, without limitation, the following:
| • | reduced spending levels and changing budget priorities of our largest customer, the United States federal government, which accounted for more than 97% of our revenue in each of fiscal 2014 and the first nine months of fiscal 2015; |
| • | failure of our customers to fund a contract or exercise options to extend contracts, or our inability to successfully execute awarded contracts; |
| • | failure to convert our backlog into revenue and the timing of our receipt of revenue under contracts included in backlog; |
| • | future spending cuts to civil and defense programs as a result of sequestration, government shutdowns, or other budget constraints; |
| • | limitations as a result of our substantial indebtedness which could adversely affect our financial health, operational flexibility, and strategic plans; |
7
Table of Contents
| • | security threats, attacks, or other disruptions to our information infrastructure, or failure to comply with complex network security, data privacy or legal and contractual obligations or the failure to protect sensitive information; |
| • | pricing pressure on new work, reduced profitability, or loss of market share due to intense competition and commoditization of services we offer; |
| • | changes in the mix of our contracts and difficulties accurately estimating contract costs and contract performance requirements; |
| • | failure of any government audit or compliance requirement including any failure to comply with laws and regulations applicable to government services providers; |
| • | challenges attracting and retaining key personnel or high-quality employees, particularly those with security clearances; and |
| • | other risks included under “Risk Factors” and elsewhere in this prospectus. |
Ownership and Organizational Capital Structure
On March 31, 2011, we entered into an Agreement and Plan of Merger with affiliates of Providence Equity Partners L.L.C., or Providence, and on July 20, 2011 we completed the transaction, which we refer to as the Providence Acquisition, whereby funds affiliated with Providence, or the PEP Funds, together with our founder, Dr. Volgenau, acquired all of the equity interests in SRA International, Inc. After giving effect to this offering, the PEP Funds and Dr. Volgenau will beneficially own approximately % of the shares of our outstanding common stock.
Providence is a premier global asset management firm which manages funds with over $40 billion in commitments, including one of the largest sector-focused private equity funds dedicated to the media, communications, education and information services industries. Providence’s investment in our company is out of Providence Equity Partners VI, L.P., a $12.1 billion private equity fund. Since the firm’s inception in 1989, Providence has invested in over 140 companies in more than 20 countries. Providence is headquartered in Providence, Rhode Island and has offices in New York, London, Hong Kong, Singapore and New Delhi.
8
Table of Contents
The following chart illustrates our ownership and organizational structure, after giving effect to this offering:
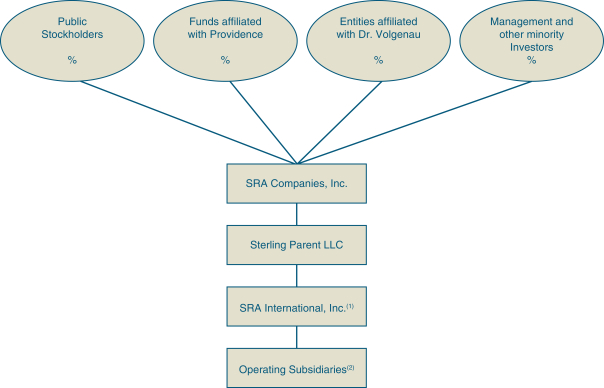
| (1) | Borrower of our Existing Senior Secured Credit Facilities and issuer of the Senior Notes. See “Description of Certain Indebtedness” for a description of our Existing Senior Secured Credit Facilities and the Senior Notes. |
| (2) | Our domestic operating subsidiaries guarantee our existing indebtedness. See “Description of Certain Indebtedness.” |
Tax Receivable Agreement
In connection with this offering, we will enter into a tax receivable agreement, which we refer to as the Tax Receivable Agreement, which will become effective upon the completion of this offering. The Tax Receivable Agreement will provide for our payment to our existing stockholders of 85% of the amount of federal, state and local income tax savings, if any, that we actually realize (or in certain cases are deemed to realize) as a result of our utilization of certain tax attributes that are attributable to taxable periods (or portions thereof) ending on or prior to the closing date of this offering.
For additional information regarding the Tax Receivable Agreement, see “Certain Relationships and Related Party Transactions—Tax Receivable Agreement.”
* * * * *
SRA Companies, Inc. is a Delaware corporation. Our corporate headquarters are located at 4300 Fair Lakes Court, Fairfax, Virginia 22033, and our telephone number at that address is (703) 803-1500. Our website is www.sra.com. Information on, and which can be accessed through, our website is not incorporated in this prospectus.
9
Table of Contents
THE OFFERING
| Common stock offered |
shares. |
| Option to purchase additional shares of common stock |
The underwriters have a 30-day option to purchase up to an additional shares of common stock from us at the initial public offering price, less underwriting discounts and commissions, to cover over-allotments of shares. |
| Common stock to be outstanding after this offering |
shares (or shares if the underwriters exercise in full their option to purchase additional shares). |
| Use of proceeds |
We intend to use the proceeds from this offering to repay a portion of SRA International, Inc.’s outstanding indebtedness. See “Use of Proceeds.” |
| Dividend policy |
We do not currently anticipate paying dividends on our common stock for the foreseeable future. See “Dividend Policy.” |
| Proposed trading symbol |
“ .” |
| Risk factors |
See “Risk Factors” for a discussion of factors that you should consider carefully before deciding to invest in shares of our common stock. |
The number of shares of our common stock to be outstanding immediately following this offering is based on the number of our shares of common stock outstanding as of , 2015, and excludes:
| • | shares of common stock issuable upon exercise of options to purchase shares outstanding as of , 2015 at a weighted average exercise price of $ per share; |
| • | shares of restricted stock outstanding as of , 2015; and |
| • | shares of common stock reserved for future issuance following this offering under our equity plans. |
Unless otherwise indicated, all information in this prospectus:
| • | gives effect to the issuance of shares of common stock in this offering; |
| • | assumes a -for- stock split of our common stock to be effected on , 2015; |
| • | assumes no exercise by the underwriters of their option to purchase additional shares; |
| • | assumes that the initial public offering price of our common stock will be $ per share (which is the midpoint of the price range set forth on the cover page of this prospectus); and |
| • | gives effect to amendments to our amended and restated certificate of incorporation and amended and restated by-laws to be adopted prior to the completion of this offering. |
10
Table of Contents
SUMMARY HISTORICAL CONSOLIDATED FINANCIAL AND OTHER OPERATING DATA
The following tables set forth summary historical consolidated financial and other operating data as of the dates and for the periods indicated. The summary historical consolidated financial data as of March 31, 2015 and for the nine months ended March 31, 2015 and March 31, 2014 have been derived from our unaudited condensed consolidated financial statements and related notes included in this prospectus. The summary historical consolidated balance sheet data as of March 31, 2014 has been derived from our unaudited condensed consolidated financial statements and related notes not included in this prospectus. The summary historical consolidated financial data as of June 30, 2014 and 2013, for the fiscal years ended June 30, 2014 and 2013, and in the Predecessor period from July 1, 2011 to July 20, 2011 and the Successor period from July 21, 2011 to June 30, 2012 have been derived from our audited consolidated financial statements and related notes included in this prospectus. The summary historical consolidated balance sheet data as of June 30, 2012 and July 20, 2011 have been derived from our audited consolidated financial statements and related notes not included in this prospectus.
The summary historical financial and other operating data set forth below are not necessarily indicative of the results of future operations and are qualified in their entirety by, and should be read in conjunction with, our audited consolidated financial statements and related notes, our unaudited condensed consolidated financial statements and related notes, and “Management’s Discussion and Analysis of Financial Condition and Results of Operations” included elsewhere in this prospectus.
We sold the AOS component of Era in the second quarter of fiscal 2011 and Era’s foreign air traffic management and military and security component in the second quarter of fiscal 2012. We also sold the GCD business in the first quarter of fiscal 2012. All financial data presented below are from continuing operations (unless otherwise noted) and reflect the presentation of Era and GCD as discontinued operations.
| Predecessor | Successor | |||||||||||||||||||||||
| July 1, 2011 through July 20, 2011 |
July 21, 2011 through June 30, 2012 |
Fiscal Year Ended June 30, |
Nine Months Ended March 31, |
|||||||||||||||||||||
| 2013 | 2014 | 2014 | 2015 | |||||||||||||||||||||
| (dollars in thousands, except share and per share data) | ||||||||||||||||||||||||
| Statement of Operations |
||||||||||||||||||||||||
| Revenue |
$ | 99,308 | $ | 1,575,872 | $ | 1,507,722 | $ | 1,386,363 | $ | 1,039,465 | $ | 1,030,341 | ||||||||||||
| Operating costs and expenses: |
||||||||||||||||||||||||
| Cost of services |
78,550 | 1,191,256 | 1,140,014 | 1,060,407 | 800,506 | 786,725 | ||||||||||||||||||
| Selling, general and administrative |
13,721 | 215,369 | 198,338 | 181,937 | 135,751 | 132,646 | ||||||||||||||||||
| Depreciation and amortization of property and equipment |
837 | 14,186 | 12,199 | 9,194 | 7,156 | 6,170 | ||||||||||||||||||
| Amortization of intangible assets |
442 | 91,551 | 88,147 | 72,711 | 54,647 | 43,473 | ||||||||||||||||||
| Transaction costs(1) |
68,069 | 699 | — | — | — | — | ||||||||||||||||||
| Impairment of goodwill and other assets |
— | — | 345,753 | — | — | — | ||||||||||||||||||
| Gain on the sale of a portion of the Health & Civil business |
— | — | — | (1,564 | ) | (1,564 | ) | — | ||||||||||||||||
|
|
|
|
|
|
|
|
|
|
|
|
|
|||||||||||||
| Total operating costs and expenses |
161,619 | 1,513,061 | 1,784,451 | 1,322,685 | 996,496 | 969,014 | ||||||||||||||||||
|
|
|
|
|
|
|
|
|
|
|
|
|
|||||||||||||
| Operating (loss) income |
(62,311 | ) | 62,811 | (276,729 | ) | 63,678 | 42,969 | 61,327 | ||||||||||||||||
| Interest expense |
(19 | ) | (101,715 | ) | (100,777 | ) | (104,191 | ) | (78,241 | ) | (80,062 | ) | ||||||||||||
| Interest income |
13 | 85 | 43 | 65 | 43 | 34 | ||||||||||||||||||
|
|
|
|
|
|
|
|
|
|
|
|
|
|||||||||||||
| (Loss) income from continuing operations before income taxes |
(62,317 | ) | (38,819 | ) | (377,463 | ) | (40,448 | ) | (35,229 | ) | (18,701 | ) | ||||||||||||
| (Benefit from) provision for income taxes |
(18,462 | ) | (14,768 | ) | (60,169 | ) | (16,286 | ) | (14,233 | ) | (5,841 | ) | ||||||||||||
|
|
|
|
|
|
|
|
|
|
|
|
|
|||||||||||||
| (Loss) income from continuing operations |
$ | (43,855 | ) | $ | (24,051 | ) | $ | (317,294 | ) | $ | (24,162 | ) | $ | (20,996 | ) | $ | (12,860 | ) | ||||||
|
|
|
|
|
|
|
|
|
|
|
|
|
|||||||||||||
11
Table of Contents
| Predecessor | Successor | |||||||||||||||||||||||
| |
July 1, 2011 through July 20, 2011 |
|
|
July 21, 2011 through June 30, 2012 |
|
|
Fiscal Year Ended June 30, |
|
|
Nine Months Ended March 31, |
| |||||||||||||
| 2013 | 2014 | 2014 | 2015 | |||||||||||||||||||||
| (dollars in thousands, except share and per share data) | ||||||||||||||||||||||||
| Weighted average shares outstanding |
||||||||||||||||||||||||
| Basic |
||||||||||||||||||||||||
| Diluted |
||||||||||||||||||||||||
| Earnings per share |
||||||||||||||||||||||||
| Basic |
||||||||||||||||||||||||
| Diluted |
||||||||||||||||||||||||
| Pro forma weighted average shares outstanding |
||||||||||||||||||||||||
| Basic |
||||||||||||||||||||||||
| Diluted |
||||||||||||||||||||||||
| Pro forma earnings per share |
||||||||||||||||||||||||
| Basic |
||||||||||||||||||||||||
| Diluted |
||||||||||||||||||||||||
| Balance Sheet Data (as of period end): |
||||||||||||||||||||||||
| Cash and cash equivalents |
$ | 213,545 | $ | 3,647 | $ | 5,050 | $ | 108,840 | $ | 53,848 | $ | 143,452 | ||||||||||||
| Working capital(2) |
315,581 | 100,531 | 96,817 | 75,980 | 82,963 | 128,732 | ||||||||||||||||||
| Total assets(3) |
1,179,063 | 2,088,526 | 1,626,953 | 1,576,056 | 1,592,908 | 1,559,178 | ||||||||||||||||||
| Long-term debt |
— | 1,127,521 | 1,108,667 | 1,047,927 | 1,068,545 | 1,059,863 | ||||||||||||||||||
| Total stockholders’ equity |
846,039 | 475,848 | 161,169 | 140,648 | 142,965 | 135,485 | ||||||||||||||||||
| Other Financial and Operating Data: |
||||||||||||||||||||||||
| Adjusted EBITDA(4) |
193,851 | 178,799 | 127,201 | 140,663 | ||||||||||||||||||||
| Free cash flow(5) |
55,034 | 138,298 | 43,306 | 45,445 | ||||||||||||||||||||
| Adjusted net income(6) |
47,945 | 38,953 | 25,053 | 30,563 | ||||||||||||||||||||
| Adjusted working capital(7) |
90,378 | (7,124 | ) | 74,254 | (11,173 | ) | ||||||||||||||||||
| Total backlog(8) |
N/A | (10) | $ | 3,595,100 | $ | 3,284,500 | $ | 3,478,400 | $ | 3,361,700 | $ | 3,240,000 | ||||||||||||
| Days sales outstanding(9) |
N/A | (10) | 64 | 64 | 54 | 63 | 53 | |||||||||||||||||
| Cash Flow Data: |
||||||||||||||||||||||||
| Net Cash provided by (used in): |
||||||||||||||||||||||||
| Operating activities(11) |
$ | 43,136 | $ | 54,215 | $ | 66,825 | $ | 145,653 | $ | 50,274 | $ | 51,571 | ||||||||||||
| Investment activities(11)(12) |
(1,876 | ) | (1,736,302 | ) | (45,422 | ) | (1,863 | ) | (1,476 | ) | (6,126 | ) | ||||||||||||
| Financing activities(11) |
505 | 1,472,380 | (20,000 | ) | (40,000 | ) | — | (10,833 | ) | |||||||||||||||
| Capital expenditures(11) |
(1,876 | ) | (10,741 | ) | (11,791 | ) | (7,355 | ) | (6,968 | ) | (6,126 | ) | ||||||||||||
| (1) | Transaction costs include legal, accounting and other expenses, including accelerated stock compensation expense, incurred in connection with the Providence Acquisition. |
| (2) | Working capital is defined as total current assets (excluding current assets of discontinued operations) minus total current liabilities (excluding current liabilities of discontinued operations). |
| (3) | Total assets as of June 30, 2012 exclude current assets of discontinued operations. |
| (4) | We use Adjusted EBITDA as a supplemental measure in the evaluation of our business because we believe it provides a meaningful measure of operational performance by eliminating the effects of period-to-period changes in taxes and interest expense, among other things. Adjusted EBITDA, or Consolidated EBITDA as it is defined in our Existing Credit Agreement (as described herein), is also used to determine our compliance with incurrence covenants contained in our Existing Credit Agreement. Adjusted EBITDA is a supplemental measure of our performance that is not required by, or presented in accordance with GAAP. Adjusted EBITDA should not be considered as an alternative to (loss) income from continuing operations or any other performance measures derived in accordance with GAAP. We define Adjusted EBITDA as (loss) income from continuing operations plus (i) provision for (benefit from) income taxes, (ii) net interest (income) expense, (iii) depreciation and amortization of property and equipment, and (iv) amortization of intangible assets, or EBITDA, adjusted to exclude certain items that do not relate directly to our ongoing operations or which are non-cash in nature and to include the pro forma impact of acquisitions and cost savings initiatives. |
We believe that Adjusted EBITDA is useful to our investors as it is a measure frequently used by securities analysts and investors in their evaluation of companies. Adjusted EBITDA is not necessarily comparable to other similarly titled financial measures of other companies due to the potential inconsistencies in the methods of calculation.
12
Table of Contents
Adjusted EBITDA has limitations as an analytical tool, and should not be considered in isolation or as a substitute for analyzing our results as reported under GAAP. Some of these limitations are:
| • | Adjusted EBITDA does not reflect changes in, or cash requirements for, our working capital needs; |
| • | Adjusted EBITDA does not reflect our interest expense, or the requirements necessary to service interest or principal payments on our debt; |
| • | Adjusted EBITDA does not reflect our income tax expenses or the cash requirements to pay our taxes; |
| • | Adjusted EBITDA does not reflect historical cash expenditures or future requirements for capital expenditures or contractual commitments; |
| • | although depreciation and amortization charges are non-cash charges, the assets being depreciated and amortized will often have to be replaced in the future, and Adjusted EBITDA does not reflect any cash requirements for such replacements. |
The following table sets forth a reconciliation of Adjusted EBITDA to (loss) income from continuing operations for the periods presented, which we consider to be the most directly comparable GAAP financial measure, to Adjusted EBITDA:
| Fiscal Year Ended June 30, | Nine Months Ended March 31, | |||||||||||||||
| 2013 | 2014 | 2014 | 2015 | |||||||||||||
| (dollars in thousands) | ||||||||||||||||
| Loss from continuing operations |
$ | (317,294 | ) | $ | (24,162 | ) | $ | (20,996 | ) | $ | (12,860 | ) | ||||
| Benefit from income taxes |
(60,169 | ) | (16,286 | ) | (14,233 | ) | (5,841 | ) | ||||||||
| Interest expense, net |
100,734 | 104,126 | 78,198 | 80,028 | ||||||||||||
| Depreciation and amortization of property and equipment |
13,484 | 10,725 | 8,279 | 6,964 | ||||||||||||
| Amortization of intangible assets |
88,147 | 72,711 | 54,647 | 43,473 | ||||||||||||
| Stock compensation(a) |
2,836 | 3,346 | 2,565 | 3,419 | ||||||||||||
| Severance(b) |
1,723 | 1,479 | 1,313 | 670 | ||||||||||||
| Facility exit charge(c) |
3,811 | 12,810 | 8,556 | 3,304 | ||||||||||||
| Other, net(d) |
6,353 | 4,007 | 2,335 | 4,661 | ||||||||||||
| Impairment of goodwill and other assets(e) |
345,753 | — | — | — | ||||||||||||
| Gain on the sale of a portion of the Health & Civil business(f) |
— | (1,564 | ) | (1,564 | ) | — | ||||||||||
| Impact of acquisitions(g) |
4,139 | — | — | 10,183 | ||||||||||||
| Impact of cost savings(h) |
4,334 | 11,607 | 8,101 | 6,662 | ||||||||||||
|
|
|
|
|
|
|
|
|
|||||||||
| Adjusted EBITDA |
$ | 193,851 | $ | 178,799 | $ | 127,201 | $ | 140,663 | ||||||||
|
|
|
|
|
|
|
|
|
|||||||||
| (a) | Represents the stock compensation expense related to our equity plans. These charges are included in SG&A expenses in our consolidated statement of operations. |
| (b) | Represents the severance charges incurred to primarily reduce our indirect labor force. These gross charges are included in SG&A expenses in our consolidated statement of operations. |
| (c) | Represents the facility exit charges related to the exit of underutilized space in certain of our leased facilities. These charges are included in SG&A expenses in our consolidated statement of operations. |
| (d) | Other, net includes certain items including the following: |
| Fiscal Year Ended June 30, | Nine Months Ended March 31, | |||||||||||||||
| 2013 | 2014 | 2014 | 2015 | |||||||||||||
| (dollars in thousands) | ||||||||||||||||
| Signing and retention bonuses of certain executive officers |
$ | 1,141 | $ | 100 | $ | — | $ | — | ||||||||
| Providence management fees |
1,751 | 1,750 | 1,313 | 1,313 | ||||||||||||
| Merger and acquisition costs |
2,214 | 887 | 656 | 465 | ||||||||||||
| Loss on sale of receivables |
— | 410 | 162 | 714 | ||||||||||||
| Facility opening costs |
— | — | — | 1,202 | ||||||||||||
| Other |
1,247 | 860 | 204 | 967 | ||||||||||||
|
|
|
|
|
|
|
|
|
|||||||||
| Other, net |
$ | 6,353 | $ | 4,007 | $ | 2,335 | $ | 4,661 | ||||||||
|
|
|
|
|
|
|
|
|
|||||||||
| (e) | Represents the impairment of goodwill and trade names as a result of the annual impairment analysis for fiscal 2013. |
13
Table of Contents
| (f) | Represents the gain on the sale of a portion of our Health & Civil business in the first quarter of fiscal 2014. |
| (g) | Represents the impact of the acquisitions of MorganFranklin Corporation’s National Security Solutions division in December 2012 and of substantially all of the Government Services business from Qbase LLC in April 2015. We add the estimated impact of acquisitions as if the businesses had been acquired on the first day of the respective period in which an adjustment is recorded, and not for any prior periods. There was no impact on Adjusted EBITDA for the divestitures of Era and GCD, as they are reported in discontinued operations. |
| (h) | As defined in the Existing Credit Agreement, cost savings represent the impact of quantifiable run-rate cost savings for actions taken or expected to be taken within 12 months of the reporting date as if they had been realized on the first day of the relevant period. Specifically, for the periods presented, the cost savings adjustment represents the estimated impact of actions taken to exit underutilized space in certain of our leased facilities, the run-rate cost savings associated with indirect labor reductions, savings associated with certain fringe benefit changes and cost savings associated with actions to improve the profitability of our contract base. |
| (5) | Free cash flow is defined as Cash flow provided by operating activities minus capital expenditures. Free cash flow is a supplemental measure of our performance that is not required by, or presented in accordance with GAAP. Management believes Free cash flow is useful to illustrate the underlying cash generation of our business. Free cash flow should not be considered as an alternative to net cash provided by operating activities or any other measures of our cash flow or liquidity. |
The following table sets forth a reconciliation of Free cash flow to Net cash provided by operating activities for the periods presented, which we consider to be the most directly comparable GAAP financial measure, to Free cash flow:
| Fiscal Year Ended June 30, | Nine Months Ended March 31, | |||||||||||||||
| 2013 | 2014 | 2014 | 2015 | |||||||||||||
| (dollars in thousands) | ||||||||||||||||
| Net cash provided by operating activities |
$ | 66,825 | $ | 145,653 | $ | 50,274 | $ | 51,571 | ||||||||
| Capital expenditures |
(11,791 | ) | (7,355 | ) | (6,968 | ) | (6,126 | ) | ||||||||
|
|
|
|
|
|
|
|
|
|||||||||
| Free cash flow |
$ | 55,034 | $ | 138,298 | $ | 43,306 | $ | 45,445 | ||||||||
|
|
|
|
|
|
|
|
|
|||||||||
| (6) | Adjusted net income is a supplemental measure of our performance that is not required by, or presented in accordance with, GAAP. Management believes Adjusted net income is useful to our investors, as it is a measure frequently used by securities analysts and investors in their evaluation of companies. Adjusted net income is not necessarily comparable to other similarly titled financial measures of other companies due to the potential inconsistencies in the methods of calculation. Adjusted net income has limitations as an analytical tool, and should not be considered in isolation or as a substitute for analyzing our results as reported under GAAP. |
The following table sets forth a reconciliation of Adjusted net income to (loss) income from continuing operations for the periods presented, which we consider to be the most directly comparable GAAP financial measure, to Adjusted net income:
| Fiscal Year Ended June 30, | Nine Months Ended March 31, | |||||||||||||||
| 2013 | 2014 | 2014 | 2015 | |||||||||||||
| (dollars in thousands) | ||||||||||||||||
| Loss from continuing operations |
$ | (317,294 | ) | $ | (24,162 | ) | $ | (20,996 | ) | $ | (12,860 | ) | ||||
| Plus: Amortization of intangible assets |
88,147 | 72,711 | 54,647 | 43,473 | ||||||||||||
| Plus: Stock compensation |
2,836 | 3,346 | 2,565 | 3,419 | ||||||||||||
| Plus: Severance |
1,723 | 1,479 | 1,313 | 670 | ||||||||||||
| Plus: Facility exit charge |
3,811 | 12,810 | 8,556 | 3,304 | ||||||||||||
| Plus: Other, net |
6,353 | 4,007 | 2,335 | 4,661 | ||||||||||||
| Plus: Impairment of goodwill and other assets |
345,753 | — | — | — | ||||||||||||
| Less: Gain on the sale of a portion of the Health & Civil business |
— | (1,564 | ) | (1,564 | ) | — | ||||||||||
| Plus: Impact of acquisitions |
4,139 | — | — | 10,183 | ||||||||||||
| Plus: Impact of cost savings |
4,334 | 11,607 | 8,101 | 6,662 | ||||||||||||
| Less: Tax adjustment for line items above(a) |
(91,857 | ) | (41,281 | ) | (29,904 | ) | (28,949 | ) | ||||||||
|
|
|
|
|
|
|
|
|
|||||||||
| Adjusted net income |
$ | 47,945 | $ | 38,953 | $ | 25,053 | $ | 30,563 | ||||||||
|
|
|
|
|
|
|
|
|
|||||||||
| (a) | Calculated as 40.0% of the sum of the line items added and subtracted above, excluding the $227,453 non-deductible portion of the fiscal 2013 goodwill impairment charge and excluding the $1,193 non-deductible portion of fiscal 2014 disposed goodwill related to the sale of a portion of the Health & Civil business. |
14
Table of Contents
| (7) | Adjusted working capital is defined as total current assets (excluding current assets of discontinued operations, cash and cash equivalents, and restricted cash) minus total current liabilities (excluding current liabilities of discontinued operations, current maturities of long term debt, and deferred income taxes). Adjusted working capital is a supplemental measure of our performance and liquidity that is not required by, or presented in accordance with GAAP. Management believes Adjusted working capital is useful in analyzing the cash flow and working capital needs of our business. We exclude cash and cash equivalents, restricted cash, current maturities of long term debt, and deferred income taxes to evaluate the investment in working capital required to support our business independent of capital structure and financing decisions. |
The following table sets forth a reconciliation of Adjusted working capital to Working capital for the periods presented, which we consider to be the most directly comparable GAAP financial measure, to Adjusted working capital:
| Fiscal Year Ended June 30, | Nine Months Ended March 31, | |||||||||||||||
| 2013 | 2014 | 2014 | 2015 | |||||||||||||
| (dollars in thousands) | ||||||||||||||||
| Working capital |
$ | 96,817 | $ | 75,980 | $ | 82,963 | $ | 128,732 | ||||||||
| Less: Cash and cash equivalents |
5,050 | 108,840 | 53,848 | 143,452 | ||||||||||||
| Less: Restricted cash |
1,389 | 1,619 | 2,319 | 681 | ||||||||||||
| Plus: Current maturities of long term debt |
— | 22,000 | 41,000 | — | ||||||||||||
| Plus: Deferred income taxes |
— | 5,355 | 6,458 | 4,228 | ||||||||||||
|
|
|
|
|
|
|
|
|
|||||||||
| Adjusted working capital |
$ | 90,378 | $ | (7,124 | ) | $ | 74,254 | $ | (11,173 | ) | ||||||
|
|
|
|
|
|
|
|
|
|||||||||
| (8) | For a discussion of backlog, see “Management’s Discussion and Analysis of Financial Condition and Results of Operations—Key Metrics—Submittals, Awards, Book-to-Bill, and Backlog.” |
| (9) | The days sales outstanding, or DSO, at the end of each fiscal year is the fourth quarter DSO. We calculate DSO by dividing accounts receivable at the end of each quarter, net of billings in excess of revenue, by revenue per day for the quarter. Revenue per day for a quarter is determined by dividing total revenue by 90 days, adjusted for partial periods related to acquisitions and divestitures if necessary. |
| (10) | Not compiled as of July 20, 2011. |
| (11) | Includes results of discontinued operations. |
| (12) | On April 15, 2015, approximately $71.5M of cash on hand was used to complete an asset purchase of substantially all of the government services business of Qbase LLC. |
15
Table of Contents
Investing in our common stock involves a high degree of risk. You should consider and read carefully all of the risks and uncertainties described below, as well as other information included in this prospectus, including our audited consolidated financial statements and related notes appearing at the end of this prospectus, before making an investment decision. This prospectus also contains forward-looking statements and estimates that involve risks and uncertainties. Our actual results could differ materially from those anticipated in the forward-looking statements as a result of specific factors, including the risks and uncertainties described below. In such case, the trading price of our common stock could decline, and you may lose all or part of your investment.
Risks Related to Our Business
Our largest customer, the U.S. federal government, accounts for substantially all of our revenue and earnings. Inherent in the government contracting process are unique risks that may have a material adverse effect on our business, financial condition and results of operations.
We generated greater than 97% of our revenue from services provided on engagements with various agencies of the U.S. federal government in each of fiscal 2014 and the first nine months of fiscal 2015. We expect to continue to derive most of our future revenues from the U.S. government. In this market, customer relationships involve certain unique risks that can impact our business and results of operations:
| • | A reduction in federal government spending or changes in spending policies or budget priorities may result from changes in U.S. government leadership, the number of and intensity of and strategy related to military conflicts, the size of the federal budget deficit, increasing political pressure to reduce overall levels of government spending, disruptions in the U.S. Treasury bond markets, shifts in spending priorities as a result of competing demands for federal funds, in-sourcing efforts aimed at improving the organic capabilities of the federal government, or other factors. |
| • | The failure by Congress to pass the annual budget on a timely basis may delay funding for customers who are expected to pay for work we are already performing and may also result in any new initiatives being delayed, and potentially canceled. Further, a failure to pass a budget or continuing resolution may result in a federal government shutdown such as the one that occurred in October 2013. Revenue for fiscal 2014 was negatively impacted by the government shutdown in October 2013 by approximately $12 million. |
| • | The amount of U.S. federal government debt is limited by statute, and this limit, referred to as the debt ceiling, can only be raised by an act of Congress. If Congress does not act timely to raise the debt ceiling when necessary, federal government spending would be subject to reduction, suspension or cancellation. |
| • | Although the OMB has issued guidance on the implementation of sequestration, the impact spending cuts will have on contractors supporting the U.S. federal government remains uncertain. Budget cuts or automatic spending cuts on our business and the reaction of federal agencies to budgetary constraints and related concerns will continue to place downward pressure on government spending levels that may reduce, delay or cancel funding for certain of our contracts and programs. On February 2, 2015, President Obama released his budget proposal for government fiscal year 2016, which would eliminate the sequester for government fiscal year 2016 and future years through a series of ten-year offsets that include trimming programs and raising tax revenues. It is unclear whether Congress will enact the President’s proposal, but if so, spending cuts as part of this plan may reduce, delay, or cancel funding for certain of our contracts. |
| • | Federal government contracts typically span one or more base years and multiple option years. Congress generally appropriates funds for these contracts for only one year at a time. The government generally has the unilateral right to reduce or modify contracts or subcontracts, or decline to exercise an option to renew a multi-year contract. A decision by our customers not to exercise option periods or |
16
Table of Contents
| to terminate contracts for convenience could result in significant shortfalls compared to anticipated revenues from these customers. |
| • | We generally encounter intense competition to win federal government contracts and spend substantial cost and managerial time and effort to prepare bids and proposals for contracts that may not be awarded to us. We win a limited percentage of the contracts we bid for. We may need to expend resources, make financial commitments (such as procuring leased premises), and bid on engagements in advance of the completion of the design of our technologies, which may result in unforeseen difficulties in execution, cost overruns, and the loss of committed costs. Increased competition in the industry may cause some of the services we provide to become “commoditized” and more competitively priced and less profitable. For example, we were unsuccessful in our bid on a recompete of work performed for the Federal Deposit Insurance Corporation, or FDIC, in 2012, which was our largest contract at that time. |
| • | Many federal government contract award decisions are commonly subject to protest by competitors, which may statutorily require the contracting federal agency or department to suspend our performance pending the outcome of the protest and may also result in a requirement to resubmit bids for a previously awarded contract or in the termination, reduction, or modification of an awarded contract. |
| • | Government regulations on organizational conflicts of interest may limit our ability to compete for or perform certain contracts. The government could determine that an organizational conflict of interest or other conflict of interest, such as a personal conflict of interest, exists. If a conflict is perceived or exists we may be deemed unable to render impartial assistance or advice to the government. As a result, we may be ineligible to compete for any such related contracts as we could be perceived as having an unfair competitive advantage. |
| • | Many government contracts require that our employees maintain various levels of security clearances and that we have certain facility security clearances, which can be difficult and time-consuming to obtain. To the extent we are not able to obtain facility clearances, engage employees with the required security clearances for a particular contract, or maintain connections to controlled government information systems, we may not be able to bid or win new contracts, or effectively re-compete on expiring contracts. |
| • | Federal government contracts generally allow the government to terminate a contract, with short or no prior notice, for convenience, as well as for default in the event we fail to meet contractual obligations. If a government customer terminates one of our contracts for convenience, we would generally be able to recover only our incurred or committed costs, settlement expenses, and profit on work completed prior to the termination. If one of our contracts is terminated for default, we would generally be entitled to payments for our work that has been accepted by the government. A termination for default could expose us to liability for the customer’s costs of re-procurement, damage our reputation, and impair our ability to compete for future contracts. |
| • | Federal government contracts contain certain provisions that are unfavorable to us and are subject to laws and regulations that give the government certain rights and remedies, some of which are not typically found in commercial contracts. Our federal customers may cancel pending solicitations, decline to exercise options on existing contracts, or determine not to allot additional funding to cost-reimbursement contracts despite the fact that we may have incurred costs related to pursuing a particular opportunity. The government may also reduce contract scope pursuant to the FAR “Changes” clause, cancel multi-year contracts if funds are not available for contract performance for a subsequent program year, suspend or delay performance, issue stop work orders, opt not to purchase more than the minimum under an ID/IQ contract, terminate contracts for the government’s convenience, or not renew programs. With fewer federal funds available, issues once resolved as routine contract administration matters (e.g., requests for equitable adjustments, change orders, economic price adjustments, delay claims, etc.) may increasingly lead to more litigation. Extensive contract terminations or contract scope reductions could require us to layoff employees and incur significant severance, relocation and facility closing costs, reducing our revenues and margins. |
17
Table of Contents
| • | In connection with the Small Business Administration, or SBA, set-aside program, the government may decide to restrict certain procurements only to bidders that qualify as small, small-disadvantaged, minority-owned businesses, or other such programs. As a result, we would not be eligible to perform as a prime contractor on those programs and would be restricted to a minority ownership interest and a maximum of 49% of the work as a subcontractor on such programs. An increase in the amount of procurements under the set-aside program may affect our ability to bid on new procurements as a prime contractor, or restrict our eligibility to compete on incumbent work that is set aside for small businesses. |
| • | The U.S. government may adopt new contract rules and regulations or revise its procurement practices in a manner adverse to us at any time. Our industry has experienced, and we expect it will continue to experience, significant changes to business practices as a result of an increased focus on affordability, efficiencies, and recovery of costs, among other items. U.S. government agencies may limit the creation of new government-wide or agency-specific multiple award contracts, and may also face restrictions or pressure regarding the type and amount of services that they may obtain from private contractors. Legislation, regulations and initiatives dealing with procurement reform, mitigation of potential conflicts of interest and environmental responsibility or sustainability, as well as any resulting shifts in the buying practices of U.S. government agencies, such as increased usage of fixed-price contracts, multiple award contracts and small business set-aside contracts, could have adverse effects on government contractors, including us. Any of these changes could alter our contract mix unfavorably or impair our ability to obtain new contracts or renew our existing contracts when those contracts are recompeted. Any new contracting requirements or procurement methods established by the government could be costly or administratively difficult for us to implement and could have a material adverse effect on our business, financial condition, and results of operations. |
We may not realize the full value of our backlog, which may result in lower than expected revenue.
As of March 31, 2015, our total backlog was $3.2 billion, of which $604 million was funded. We define backlog to include the following two components:
| • | Funded Backlog. Funded backlog represents the revenue value of orders for services under existing contracts for which funding is appropriated or otherwise authorized, less revenue previously recognized on these contracts. |
| • | Unfunded Backlog. Unfunded backlog represents the revenue value of orders for services under existing contracts for which funding has not been appropriated or otherwise authorized. |
Backlog includes all contract options that have been priced but not yet funded, and includes an estimate of the contract value under single award ID/IQ contracts against which we expect future task orders to be issued without competition. Backlog does not include any value for the ceiling of multiple award contracts, nor does it include any estimate of future potential delivery orders that might be awarded under multiple award ID/IQ vehicles, GWACs, or General Services Administration, or GSA, schedule contracts.
We historically have not realized all of the revenue included in our total backlog, and we may not realize all of the revenue included in our total backlog in the future. There is a somewhat higher degree of risk in this regard with respect to unfunded backlog and priced options. In addition, there can be no assurance that our backlog will result in actual revenue in any particular period. This is because the actual receipt, timing, and amount of revenue under contracts included in backlog are subject to various contingencies many of which are beyond our control. If we are unable to realize revenue on our backlog, it could have a material adverse effect on our business, financial condition, and results of operations.
We may earn less revenue than projected, or no revenue, under certain of our contracts.
Many of our contracts with our customers are ID/IQ contracts, including GSA schedules and GWACs. ID/IQ contracts provide for the issuance by the customer of orders for services or products under the contract, and often contain multi-year terms and unfunded ceiling amounts, which allow but do not commit the U.S. government to purchase products and services from contractors. Our ability to generate revenue under each of
18
Table of Contents
these types of contracts depends upon our ability to be awarded task orders for specific services by the customer. ID/IQ contracts may be awarded to one contractor (single award) or several contractors (multiple award). Multiple contractors must compete under multiple award ID/IQ contracts for task orders to provide particular services, and contractors earn revenue only to the extent that they successfully compete and be awarded these task orders. During the first nine months of 2015, and in fiscal 2014 and fiscal 2013, our revenue under our GSA schedules and GWACs, including single-award ID/IQ contracts, accounted for 57%, 62%, and 66%, respectively, of our total revenue. A failure to be awarded task orders under such contracts could have a material adverse effect on our business, financial condition, and results of operations.
We have a recent history of losses, and we may not achieve or maintain profitability.
We incurred losses from continuing operations of $317.3 million, $24.2 million and $12.9 million in fiscal 2013, 2014 and the first nine months of fiscal 2015, respectively. In addition, we may incur additional losses from continuing operations in the future. Continued losses would reduce our cash available from operations to service our indebtedness, as well as limit our ability to finance our operations. Even if we do achieve profitability, we may not be able to sustain or increase profitability on a quarterly or annual basis, which may adversely affect our stock price and could require us to raise additional capital in the future to fund our operations, which may not be available on reasonable terms or at all.
Our business could be negatively impacted by cyber and other security threats, attacks and other disruptions.
Like others in our industry, we continue to face advanced and persistent attacks on our IT infrastructure where we manage and store various proprietary information and sensitive/confidential data relating to our operations. These attacks may include sophisticated malware (viruses, worms, and other malicious software programs) and phishing emails that attack our products or otherwise exploit any security vulnerabilities. These intrusions sometimes may be zero-day malware that are difficult to identify because they are not included in the signature set of commercially available antivirus scanning programs. Experienced computer programmers and hackers may be able to penetrate our network security and misappropriate or compromise our confidential information or that of our customers or other third parties, create system disruptions, or cause shutdowns that we are unable to thwart. Additionally, sophisticated software and applications that we produce or procure from third parties may contain defects in design or manufacture, including “bugs” and other problems that could unexpectedly interfere with the operation of the information infrastructure. Although we have implemented policies, procedures and controls to protect against, detect and mitigate these threats, attempts by others to gain unauthorized access to our IT systems are becoming increasingly sophisticated.
We are subject to laws, rules, and regulations relating to the collection, use, and security of user data and are subject to legislative and regulatory burdens that may require us to notify customers or employees of a data security breach. Persistent cybersecurity threats and attacks on our IT infrastructure require significant management attention and resources and may expose sensitive personally identifiable and other critical information of our customers, their employees or our own employees, and other parties with whom we conduct business and a loss or misuse of this information, could result in litigation and potential liability for us, damage our brand and reputation, or otherwise harm our business. Any remedial costs or other liabilities related to cyber or other security threats may not be fully insured or indemnified by other means. The costs to us to eliminate or address the foregoing security problems and security vulnerabilities before or after a cyber-attack could be significant. Our remediation efforts may not be successful and could result in interruptions, delays, or cessation of service and loss of existing or potential customers and may impede critical functions. Occurrence of any of these security threats could adversely affect our reputation, ability to work on sensitive U.S. government contracts, business operations and financial results. Given the nature of our work for the federal government, we have been subject to attempted cybersecurity incidents in the past and may again in the future.
The current competitive landscape and budget-constrained environment may make it more difficult to maintain our financial performance.
We operate in highly competitive markets and our competitors may be larger with greater financial resources and technical staffs or smaller with more specialized engineering, manufacturing and marketing
19
Table of Contents
capabilities that are able to concentrate their resources in particular areas. Additionally, we also compete with the U.S. government’s own internal capabilities. Our success depends on our ability to develop services and products that address the changing needs of the customer and provide people and technology needed to deliver these services and products. Additionally, our ability to implement solutions for our customers incorporating new developments and improvements in technology are important to our success. Multi-award contracts require that we make sustained efforts to obtain task orders under the contract.
The competitive bidding process entails substantial costs and managerial time to prepare bids and proposals for contracts that may not be awarded to us or may be split among competitors. Following an award, we may encounter significant expenses, delays, contract modifications, or even loss of the contract if our competitors protest or challenge contracts that are awarded to us.
If we are unable to win particular contracts that are awarded through the competitive bidding process, in addition to the risk that our business, financial condition and results of operations may be adversely affected, we may also be unable to operate in the market for services that are provided under those contracts for a number of years.
If the systems that we install fail or have significant delays or errors, or products or services we supply have defects, we may be liable, which could adversely affect our results of operations and harm our reputation.
Many of the systems we develop, install, and maintain involve managing and protecting information used in intelligence, national security, and other sensitive or classified government functions. Some of our contracts provide critical products and services related to aviation, other transportation systems, space communications and other important civil and government functions having potential for significant economic or personal liabilities. Damage to our reputation or limitations on our eligibility for additional work resulting from a security breach in one of these systems or other failure could materially reduce our revenue.
If our solutions, services, products or other applications have defects or errors, are subject to delivery delays or fail to meet our customers’ expectations, we may:
| • | Experience a loss of revenues due to adverse customer reaction or contract termination; |
| • | Be required to provide additional services to a customer at no charge or pay re-procurement costs; |
| • | Receive negative publicity that could damage our reputation and adversely affect our ability to attract or retain customers; |
| • | Suffer claims for substantial damages against us; and |
| • | Face material claims for damage to personal property and injuries including loss of life. |
In addition to any costs resulting from product warranties, contract performance or required corrective action, these failures may result in increased costs or loss of revenues if they result in customers postponing subsequently scheduled work, canceling contracts or failing to renew contracts. We may have agreed to indemnify our customers fully for damages and third-party claims, we may have failed to obtain adequate contractual limitations of liability, and we may be found liable for material direct, indirect, consequential, or punitive damages. If we are required to respond to such indemnification obligations, it may have a material adverse effect on our reputation and on our business, financial condition, and results of operations.
Internal or external system or service failures could disrupt our business and impair our ability to effectively provide our services and products to our customers.
A system or service disruption, including those caused by ongoing efforts to improve our IT systems and the delivery of services whether through us or through an outsourced service, if not anticipated and appropriately mitigated, could have a material adverse effect on our business. Customer system failures could damage our reputation and adversely affect our revenues and profitability. Many of the systems and networks that we develop, install and maintain for our customers involve managing and protecting personal information and
20
Table of Contents
information relating to national security and other sensitive government information. While we have programs designed to comply with relevant privacy and security laws and restrictions, if a system or network that we develop, install or maintain were to fail or experience a security breach or service interruption, whether caused by us, third-party service providers, unauthorized intruders, hackers, computer viruses or other cybersecurity threats, natural disasters, power shortages or terrorist attacks, or other events, we may experience loss of revenue, remediation costs or face claims for damages or contract termination. Any such event could cause serious harm to our reputation and prevent us from having access to or being eligible for further work on such systems and networks.
Our failure to comply with complex laws and regulations could cause us to lose business and subject us to a variety of penalties.
We must comply with laws and regulations relating to the formation, administration, and performance of government contracts, which affect how we do business with our government customers and may impose added costs on our business. These laws and regulations are related to, for example, procurement integrity, disclosure of cost and pricing data, allowability of costs, national security, and employment practices. Failure to comply with any of these regulations could result in civil and criminal penalties and administrative sanctions, including termination of contracts, loss of security clearances, forfeiture of profits, harm to our reputation, suspension of payments, fines, and suspension or debarment from doing business with the federal government. Among the most significant of these regulations are:
| • | the FAR and supplements, which regulate the formation, administration and performance of U.S. government contracts; |
| • | the Truth in Negotiations Act, which requires certification and disclosure of cost and pricing data in connection with certain contract negotiations, modifications, and task orders; |
| • | the Procurement Integrity Act, which regulates access to competitor bid and proposal information and government source selection information, and our ability to provide compensation to certain former government officials; |
| • | the False Claims Act and the False Statements Act, which provide for substantial civil and criminal penalties for violations, including for submission of a false or fraudulent claim to the U.S. government for payment or approval, and for making false statements to the U.S. government, respectively; |
| • | U.S. government Cost Accounting Standards, which impose accounting requirements that govern our right to reimbursement under certain cost-based U.S. government contracts, including allowable amounts for executive compensation reimbursement; |
| • | post-government employment laws and regulations, which restrict the ability of a contractor to recruit, hire, and deploy former employees of the U.S. government; and |
| • | laws, regulations, and executive orders restricting the use and dissemination of information classified for national security purposes and the export of certain products, services, and technical data, including requirements regarding any applicable licensing of our employees involved in such work. |
Our employees might engage in misconduct or other improper activities, which could harm our business. Misconduct by employees could include intentional failures to comply with federal government procurement regulations, engaging in unauthorized activities, seeking reimbursement for improper expenses or falsifying time records. Employee misconduct could also involve the improper use of our customers’ sensitive or classified information, which could result in regulatory sanctions against us and serious harm to our reputation. The precautions we take to prevent and detect employee misconduct may not be effective in controlling unknown or unmanaged risks or losses, which could harm our business.
21
Table of Contents
Unfavorable government audit results could force us to adjust previously reported operating results and could subject us to a variety of penalties and sanctions which may materially and adversely affect our business and profitability.
As a government contractor, we are subject to routine audits and investigations by U.S. government agencies such as the Defense Contract Audit Agency, the Defense Contract Management Agency and the Inspectors General for various agencies with which we contract in the ordinary course of business. These agencies review, among other things, a contractor’s performance under its contracts, cost structure, pricing practices, and compliance with applicable contracting and procurement laws, regulations and standards, including U.S. government Cost Accounting Standards. They also review the adequacy of, and a contractor’s compliance with, its internal control systems and policies, including the contractor’s purchasing, property, estimating, cost accounting, labor, billing, compensation, labor category qualifications, other management information systems and indirect rates and pricing practices. A finding of significant control deficiencies in our system audits or other reviews may result in reduced billing rates to our U.S. government customers and withholding of payments on receivables until the control deficiencies are corrected and our remediation is accepted by Defense Contract Management Agency, and could also impact the Company’s ability to receive future cost type contract awards. Both contractors and the U.S. government agencies conducting these audits and reviews have come under increased scrutiny. As a result, audits and reviews have become more rigorous and the standards to which the Company is held are being more strictly interpreted, increasing the likelihood of an audit or review resulting in an adverse outcome. If our accounting systems are deemed inadequate we may be prevented from performing on current contracts which require systems that comply with Cost Accounting Standards or might be limited in the type of contract we are eligible to bid and perform on until such time as our systems are deemed adequate, which could have a material adverse effect on our business, financial condition, and results of operations.
Our indirect cost audits by the Defense Contract Audit Agency have not been completed for fiscal 2009 and subsequent fiscal years. Any costs found to be improperly charged or allocated to a government contract or not properly supported with sufficient documentation will not be reimbursed or must be refunded if already reimbursed. We maintain reserves based on historical experience for incurred cost audits pending completion. If an audit uncovers improper or illegal activities, we may be subject to civil and criminal penalties and administrative sanctions, which may include termination of contracts, forfeiture of profits, unilateral reductions of our fees, suspension of payments, fines and suspension or prohibition from doing business with U.S. government agencies.
The Company’s income tax returns are subject to audit in various jurisdictions and its fiscal 2011 U.S. federal income tax returns are currently under audit.
Our income tax returns are subject to review and audit in the United States and other jurisdictions with varying statutes of limitation. We do not recognize the benefit of income tax positions it believes are more-likely-than-not to be disallowed upon challenge by a tax authority. If any tax authority successfully challenges our tax positions, our effective tax rate on our earnings could increase substantially, and our earnings and cash flows from operations could be materially adversely affected.
Periods for fiscal years ended after July 1, 2010 generally remain subject to examination by federal and state tax authorities. In foreign jurisdictions, tax years after 2010 may remain subject to examination by tax authorities. Our consolidated U.S. federal income tax return for the fiscal year ended June 30, 2011 is currently under audit by the IRS. We believe that our tax positions are appropriate and are prepared to vigorously defend any positions challenged. Nonetheless, if the IRS were to challenge our prior tax positions and we are unsuccessful in defending them, we may be required to pay taxes for prior periods, interest, fines or penalties, and/or be obligated to pay increased taxes in the future, any of which could have a material adverse effect on our business, financial condition, and results of operations.
22
Table of Contents
Under the Tax Receivable Agreement, we will be required to make payments to our existing stockholders for certain tax attributes, which payments are expected to be material.
We will enter into a Tax Receivable Agreement with our existing stockholders that will provide for our payment to them of 85% of the amount of federal, state and local income tax savings, if any, that we actually realize (or are deemed to realize in certain cases) as a result of our utilization of certain tax attributes that are attributable to taxable periods (or portions thereof) that end on or prior to the closing date of this offering. As a result, investors in this offering will not receive the economic benefit of 85% of these existing tax attributes.
The payment obligations are our obligations and not the obligations of any of our subsidiaries. We expect that the payments we will be required to make under the Tax Receivable Agreement will be material. Although the actual amounts and timing of the payments will vary depending upon a number of factors, we expect to make payments under the Tax Receivable Agreement aggregating approximately $ million to $ million.
The Tax Receivable Agreement will provide that upon certain early termination events, our obligations thereunder will become accelerated and we will be required to make a payment in an amount equal to the present value of future payments under the Tax Receivable Agreement, based on certain valuation assumptions, including the assumption that we will generate future taxable income in amounts sufficient to utilize the tax attributes fully.
We may be required to make payments under the Tax Receivable Agreement in excess of our actual cash tax savings, and our liquidity could be negatively affected. In addition, the acceleration of our payment obligations under the Tax Receivable Agreement could have the effect of delaying or preventing certain mergers, asset sales, other forms of business combinations or other changes of control.
In addition, we will generally have the right to terminate the Tax Receivable Agreement, in which case our obligations thereunder will also become accelerated. Any such payment could be substantial and exceed our actual tax savings from our use of the existing tax attributes and may negatively impact our liquidity.
See “Certain Relationships and Related Party Transactions—Tax Receivable Agreement.”
We have contracts with the U.S. government that are classified, which may limit investor insight into portions of our business.
We derive a portion of our revenues from programs with the U.S. government that are subject to security restrictions (classified programs), which preclude the dissemination of information. We are limited in our ability to provide information about these programs, any risks or any disputes or claims relating to such programs. As a result, investors have less insight into our classified programs than our other businesses and therefore less ability to fully evaluate the risks related to our classified business.
If we cannot collect our receivables or if payment is delayed, our business may be adversely affected by our inability to generate cash flow, provide working capital, or continue our business operations.
We depend on the timely collection of our receivables to generate cash flow, provide working capital, and continue our business operations. If the U.S. government or any prime contractor for whom we are a subcontractor fails to pay or delays the payment of invoices for any reason, our business and financial condition may be materially and adversely affected. The U.S. government may delay or fail to pay invoices for a number of reasons, including lack of appropriated funds, congressional failure to increase the federal government’s debt ceiling which permits federal government expenditures, lack of an approved budget, or as a result of audit findings by government regulatory agencies. Some prime contractors for whom we are a subcontractor have significantly fewer financial resources than we do, which may increase the risk that we may not be paid in full or that payment may be delayed. If we are not paid for a substantial portion of the services we provide in such subcontracting arrangements, it could have a material adverse effect on our business, financial condition, and results of operations.
23
Table of Contents
We use estimates in recognizing revenue and if we make changes to estimates used in recognizing revenue, our profitability may be adversely affected.
Revenue from our fixed-price contracts is primarily recognized using the percentage-of-completion method with progress toward completion of a particular contract based on actual costs incurred relative to total estimated costs to be incurred over the life of the contract. Revenue from our cost-reimbursable-plus-award-fee contracts are based on our estimation of award fees over the life of the contract. Estimating costs at completion and award fees on our long-term contracts is complex and involves significant judgment. Adjustments to original estimates are often required as work progresses, experience is gained, and additional information becomes known, even though the scope of the work required under the contract may not change. Any adjustment as a result of a change in estimate is recognized as events become known.
In the event updated estimates indicate that we will experience a loss on the contract, we recognize the estimated loss at the time it is determined. Additional information may subsequently indicate that the loss is more or less than initially recognized, which requires further adjustments in our audited consolidated financial statements. Changes in the underlying assumptions, circumstances, or estimates could result in adjustments that could have a material adverse effect on our future results of operations. Failure to timely meet contractual requirements under fixed-price contracts or that contain a fixed-price component may result in additional costs to satisfy obligations to our customers, reductions in profit, payment of damages or penalties, or termination of the contract, which could have a material adverse effect on our business, financial condition, and results of operations.
If we fail to establish and maintain important relationships with government entities and agencies, our ability to successfully bid for new business may be adversely affected.
To facilitate our ability to prepare bids for new business, we rely in part on establishing and maintaining relationships with officials of various government entities and agencies. These relationships enable us to provide industry input and suggestions to government entities and agencies prior to the development of a formal bid. We may be unable to successfully maintain our relationships with government entities and agencies, and any failure to do so may adversely affect our ability to bid successfully for new business and could cause our actual results to differ materially and adversely from those anticipated.
We depend on our teaming arrangements and relationships with other contractors and subcontractors. If we are not able to maintain these relationships, or if these parties fail to satisfy their obligations to us or the customer, our revenues, profitability and growth prospects could be adversely affected.
We rely on our teaming relationships with other prime contractors and subcontractors in order to submit bids for large procurements or other opportunities where we believe the combination of services and products provided by us and the other companies will help us to win and perform the contract. Our future revenues and growth prospects could be adversely affected if other contractors fail to perform, perform poorly or eliminate or reduce their contract relationships with us due to industry consolidations or otherwise, or if the U.S. government terminates or reduces these other contractors’ programs, does not award them new contracts or refuses to pay under a contract. Companies that do not have access to U.S. government contracts may perform services as our subcontractor and that exposure could enhance such companies’ prospect of securing a future position as a prime U.S. government contractor which could increase competition for future contracts and impair our ability to perform on contracts.
We may have disputes with our subcontractors arising from, among other things, the quality and timeliness of work performed by the subcontractor, customer concerns about the subcontractor, our failure to extend existing task orders or issue new task orders under a subcontract, our hiring of a subcontractor’s personnel or the subcontractor’s misconduct or failure to comply with applicable law. Similarly, in instances where we serve as a subcontractor to another prime contractor, we may have disputes regarding that contractor’s management of our
24
Table of Contents
subcontract, possible attempts to hire our personnel, or its failure to comply with applicable law. Uncertain economic conditions heighten the risk of financial stress of our subcontractors, which could adversely impact their ability to meet their contractual requirements to us. If any of our subcontractors fail to timely meet their contractual obligations or have regulatory compliance or other problems, our ability to fulfill our obligations as a prime contractor or higher tier subcontractor may be jeopardized. Significant losses could arise in future periods and subcontractor performance deficiencies could result in our termination for default. A termination for default could eliminate a revenue source, expose us to liability and have an adverse effect on our ability to compete for future contracts and task orders, especially if the customer is an agency of the U.S. government.
Our cost-plus, time-and-material and fixed-price type contracts present certain risks to our business.
Our business is transacted and revenue recognized through written revenue arrangements, or contracts, which are generally cost-plus, time-and-material, or fixed-price. Each of our contract types presents certain risks to our business as highlighted below.
On a cost-plus type contract (revenue arrangement), we are paid our allowable incurred costs plus a profit which can be fixed or variable depending on the contract’s fee arrangement up to predetermined funding levels determined by our customers. Cost-plus type contracts with award fee provisions are our primary variable contract fee arrangement. Award fees, which provide for a fee based on actual performance relative to contractually specified performance criteria, may result in risk to our business if we are unable to satisfy the relevant performance criteria.
On a time-and-material type contract (revenue arrangement), we are paid on the basis of direct labor hours expended at specified fixed-price hourly rates (that include wages, overhead, allowable general and administrative expenses and profit) and materials at cost. Time-and-material contracts may result in risk to our business if we fail to accurately estimate or otherwise recover expenses, including wages, overhead, allowable general and administrative expenses.
On a fixed-price type service contract (revenue arrangement), we agree to perform the contractual statement of work for a predetermined sales price. Although a fixed-price type contract generally permits us to retain profits if the total actual contract costs are less than the estimated contract costs, we bear the risk that increased costs may reduce our profit or cause us to sustain losses on the contract. This may result in greater risk to our business that we may not be reimbursed for services rendered than under a cost-plus type and time-and-material type contracts where we generally do not bear the risks of unexpected cost overruns, provided that we do not incur costs that exceed the predetermined funded amounts.
Our overall profit margins on our contracts may decrease and our results of operations could be adversely affected if materials and subcontract revenues grow at a faster rate than labor-related revenues.
Our revenues are generated both from the efforts of our employees (labor-related revenues) and from the receipt of payments for the cost of materials and subcontracts we use in connection with performing our services (materials and subcontract revenues). Generally, our materials and subcontract revenues have lower profit margins than our labor-related revenues. If our materials and subcontract revenues grow at a faster rate than labor-related revenues, our overall profit margins may decrease and our profitability could be adversely affected.
If we fail to attract and retain qualified employees, we might not be able to staff recently awarded contracts and sustain our profit margins and revenue growth.
As an advanced IT and technical services company, our business is labor intensive, and, therefore, our ability to attract and retain highly qualified individuals who work well with our customers in a government environment is an important factor in determining our success. Some of our government contracts require us to employ individuals who have particular security clearances issued by the DoD or other government agencies.
25
Table of Contents
Depending on the level of required clearance, security clearances can be difficult and time-consuming to obtain. These employees are in great demand and are likely to remain a limited resource for the foreseeable future. If we are unable to recruit and retain a sufficient number of these employees, our ability to staff recently awarded contracts and to maintain and grow our business could be limited. We are operating in a tight labor market for cleared personnel and, if it continues to tighten, we could be required to engage larger numbers of subcontractor personnel, which could cause our profit margins to suffer.
In addition to attracting and retaining qualified technical personnel, we believe that our success will depend on the continued employment of our senior management team and its ability to generate new business and execute projects successfully. Personal reputations and individual business relationships are critical elements of obtaining and maintaining customer engagements in our industry, particularly with agencies performing classified operations. The loss of any of our senior executives could cause us to lose customer relationships or new business opportunities.
If we fail to manage acquisitions successfully, our revenue and operating results may be impaired.
Part of our growth strategy includes pursuing acquisitions. Identification and valuation of acquisition targets and closing complicated transactions involve significant risks to our business. In pricing acquisitions, we may make overly optimistic assumptions of future business growth. Our due diligence reviews may not identify all of the material issues necessary to accurately estimate the cost and potential liabilities of a particular acquisition. We may encounter increased competition for acquisitions, which may increase the price of our acquisitions. Additionally, these transactions often require substantial management resources and may divert our attention away from day-to-day operations.
Integrating acquired operations of the acquisitions we choose to complete is a significant challenge and there is no assurance that we will be able to manage the integrations successfully. Failure to retain key employees and successfully integrate acquired operations may adversely affect our cost structure thereby reducing our margins and return on investment. Acquisitions may involve incurrence of additional indebtedness which may constrain further growth and include restrictive financial covenants that, if not complied with, may lead to default. We may have difficulty integrating accounting, information management, or other control systems and technologies, particularly with respect to those that are still in development when acquired. Additionally, we may fail to discover material liabilities during the due diligence process, including the failure of prior owners of any acquired businesses or their employees to comply with applicable laws or regulations or their failure to fulfill their contractual obligations to the federal government or other customers. Acquisitions may also increase organizational conflicts of interest, impacting current business and limiting further growth.
In addition, we periodically divest businesses or contracts, including those that are no longer part of our ongoing strategic plan. These divestitures similarly require significant investment of time and resources and may result in losses on the sale of the business. Additionally, as a part of a transaction, it is customary to agree to certain indemnification obligations related to the divestiture. The indemnification period generally expires one to two years after the transaction date; however fraud and tax indemnifications last longer. If claims or other costs are incurred related to the divestiture, our financial results may be adversely affected.
We have very limited ability to protect our intellectual property, which is important to our success. Our failure to adequately protect our proprietary information and intellectual property rights could adversely affect our competitive position. In conducting our business, we may infringe the rights of others.
We rely principally on trade secrets to protect much of our intellectual property where patent protection is not feasible and/or copyright protection is not appropriate. However, trade secrets are difficult to protect. Confidentiality agreements may be inadequate to deter or prevent misappropriation of our confidential information. In addition, we may be unable to detect unauthorized use of our intellectual property or otherwise
26
Table of Contents
take appropriate steps to enforce our rights. Failure to obtain or maintain trade secret protection could adversely affect our competitive business position. If we are unable to prevent third parties from infringing or misappropriating our copyrights, trademarks or other proprietary information, our competitive position could be adversely affected. Moreover, use of our trade secrets in performing contracts with the U.S. government can result in the government obtaining license rights in these trade secrets. We have a limited patent portfolio in the United States and Europe and in some cases our intellectual property rights may be limited to only the United States and certain other jurisdictions.
In the course of conducting our business, we might inadvertently infringe the intellectual property rights of others, resulting in claims against us or our customers. Our contracts generally indemnify our customers for third-party claims for intellectual property infringement by the services and products we provide. Defending these claims may be costly and could have a material adverse effect on our business, financial condition, and results of operations.
Our insurance coverage may be inadequate to cover all of our significant risks or our insurers may deny coverage of material losses we incur, which could have a material adverse effect on our business, financial condition, and results of operations.
We attempt to obtain adequate insurance to mitigate many of our significant risks and liabilities. Not every risk or liability can be protected against by insurance, and for insurable risks, the limits of coverage reasonably obtainable in the market may not be sufficient to cover all actual losses incurred. If any of our third-party insurers fail, cancel our coverage or otherwise are unable to provide us with adequate insurance coverage on terms acceptable to us, or at all, our overall risk exposure and our operational expenses would increase and the management of our business operations could be disrupted. Securing more coverage may impact profitability. Because of the limitations in overall available coverage or our business decisions regarding the amount of coverage that we choose to secure, we may have to bear substantial costs for uninsured losses that could have a material adverse effect on our business, financial condition, and results of operations.
We are a defendant in pending litigation and may be subject to future litigation which could have a material adverse effect on our business, financial condition, and results of operations.
We are subject to investigations, audits and reviews relating to compliance with various laws and regulations with respect to our role as a contractor to agencies and departments of the U.S. government, state, local and foreign governments, and otherwise in connection with performing services in countries outside of the United States. Such matters can lead to criminal, civil or administrative proceedings, can cause us to be faced with penalties, fines, repayments or compensatory damages, and can lead to suspension or debarment from future U.S. government contracting. Adverse findings could also have a material adverse effect on us because of our reliance on government contracts.
We are also involved in, and may in the future become a party to, various claims and lawsuits arising in the normal conduct of our business including but not limited to various employment litigation matters and investigations or charges before administrative agencies. We can give no assurance that the outcome of any such matter would not have a material adverse effect on our consolidated financial position, results of operations or cash flows. Any claims or litigation may be costly to defend. Even if we are successful or fully indemnified or insured, such claims and litigation could damage our reputation and make it more difficult for us to compete effectively or obtain adequate insurance in the future. We are not able to predict the ultimate outcome of these disputes or the actual impact of these matters on our profitability. If we agree to settle these matters or judgments are secured against us, we may incur charges which could have a material adverse effect on our business, financial condition, and results of operations.
27
Table of Contents
Changes in future economic or business conditions could cause recorded goodwill or other intangible assets to become impaired, resulting in material losses and write-downs that could have a material adverse effect on our business, financial condition, and results of operations.
Goodwill and other intangible assets accounted for approximately 75% of our recorded total assets in fiscal 2014. Goodwill is allocated to each of our business groups and each group is evaluated separately for impairment annually as of April 1, or more frequently when evidence of potential impairment exists. Trade names are also tested for impairment annually as of April 1, or more frequently when evidence of potential impairment exists. The annual impairment tests are based on many inputs requiring judgment. Given the current industry conditions and the uncertainties regarding the impact on our business, there can be no assurance that the estimates and assumptions used in our goodwill and trade names impairment analyses will prove to be accurate predictions of the future. If our assumptions regarding forecasted revenue or profitability are not achieved, or we experience adverse changes in market factors such as discount rates or valuation multiplies derived from comparable publicly traded companies, we may be required to recognize goodwill or trade names impairment charges in future periods.
For a discussion of the impairment analysis for fiscal 2014 and 2013, refer to Note 3 of our audited consolidated financial statements included in this prospectus.
Risks Related to Our Substantial Indebtedness
Our substantial indebtedness could adversely affect our financial health and operating flexibility.
We have a substantial amount of indebtedness. As of March 31, 2015, we had approximately $1,064.2 million of senior indebtedness comprised of $664.2 million on SRA International, Inc.’s senior secured Term Loan B Facility (as described herein) and $400.0 million of the Senior Notes (as described herein). In addition, SRA International, Inc. has available approximately $100.0 million of additional borrowing capacity under the Existing Revolver (as described herein). Together the Existing Revolver and the Term Loan B Facility are referred to as the Existing Senior Secured Credit Facilities.
Our substantial level of indebtedness and other financial obligations increase the possibility that we may be unable to generate cash sufficient to pay, when due, the principal of, interest on, or other amounts due, in respect of our indebtedness. Our substantial debt could also have other significant consequences. For example, it could:
| • | increase our vulnerability to general adverse economic, competitive and industry conditions; |
| • | limit our ability to obtain additional financing in the future for working capital, capital expenditures, debt service requirements, acquisitions, general corporate purposes or other purposes on satisfactory terms, or at all; |
| • | require us to utilize a substantial portion of our cash flow from operations to the payment of our indebtedness, thereby reducing the funds available to us for operations and any future business opportunities; |
| • | restrict us from making strategic acquisitions or cause us to make non-strategic divestitures; |
| • | limit our planning flexibility for, or ability to react to, changes in our business and the industries in which we operate; |
| • | limit our ability to adjust to changing market conditions, react to competitive pressures and adverse changes in government regulation; |
| • | limit our ability or increase the costs to refinance indebtedness; |
| • | limit our ability to enter into hedging transactions by reducing the number of counterparties with whom we can enter into such transactions, as well as the volume of those transactions; and |
| • | place us at a competitive disadvantage with competitors who may have less indebtedness and other obligations or greater access to financing. |
28
Table of Contents
Our ability to generate the significant amount of cash needed to pay interest and principal on our indebtedness and service our debt and financial obligations and our ability to refinance all or a portion of our indebtedness or obtain additional financing depends on many factors beyond our control.
Our ability to make payments on and refinance our debt and to fund our operations depends on our ability to generate substantial operating cash flow. Our cash flow generation depends on our future performance, which is subject to prevailing economic conditions and to financial, business and other factors, many of which are beyond our control.
If we cannot service our debt, we will have to take actions such as reducing or delaying capital investments, selling assets, restructuring or refinancing our debt and/or seeking additional equity capital. Any of these potential remedies may not be effected on commercially reasonable terms, or otherwise be available. In addition, the indenture governing the Senior Notes and the credit agreement governing the Existing Senior Secured Credit Facilities may limit the availability or effectiveness of certain remedies, including the use of proceeds from divested assets. In the absence of sufficient operating results and/or limitations on remedies available to us, we could face substantial liquidity problems.
Our variable rate indebtedness subjects us to interest rate risk, which could cause our debt service obligations to increase significantly.
Borrowings under the Existing Senior Secured Credit Facilities are at variable rates of interest and expose us to interest rate risk. Interest rates are currently at historically low levels. If interest rates increase, our debt service obligations on the variable rate indebtedness will increase even though the amount borrowed remains the same, and our net income and cash flows, including cash available for servicing our indebtedness, will correspondingly decrease. We manage our exposure to interest rate movements through the use of interest rate swap agreements. As of March 31, 2015, we had hedged the interest rate on $500.0 million of our outstanding Term Loan B Facility through the use of such interest rate swap agreements. The interest rate on the remaining $164.2 million of our outstanding Term Loan B Facility was unhedged. In the future, we may enter into similar interest rate swaps that involve the exchange of floating for fixed rate interest payments in order to reduce future interest rate volatility. However, due to risks for hedging gains and losses and cash settlement costs, we may not elect to maintain such interest rate swaps with respect to any of our variable rate indebtedness, and any swaps we enter into may not fully mitigate our interest rate risk. A hypothetical 1% increase in LIBOR over the 1.25% floor could increase our annual interest expense and related cash flows by approximately $1.6 million based on the unhedged portion of the Existing Senior Secured Credit Facilities outstanding as of March 31, 2015.
Restrictive covenants in the Existing Senior Secured Credit Facilities and the indenture governing our Senior Notes may restrict our ability to pursue our business strategies.
The Existing Senior Secured Credit Facilities and the indenture governing the Senior Notes contain a number of restrictive covenants that impose significant operating and financial restrictions on us and may limit SRA International, Inc.’s ability to engage in acts that may be in our long term best interests. These agreements governing our indebtedness include covenants restricting, among other things, our ability to:
| • | incur additional indebtedness; |
| • | create liens; |
| • | engage in mergers or consolidations; |
| • | sell or transfer assets, including capital stock of our subsidiaries; |
| • | pay dividends and distributions or repurchase our capital stock; |
| • | make investments, including acquisitions, loans, advances or guarantees; |
| • | prepay the Senior Notes and certain subordinated indebtedness; |
| • | engage in certain transactions with affiliates; |
29
Table of Contents
| • | create restrictions on the payment of dividends or other amounts to us from our restricted subsidiaries; and |
| • | amend material agreements governing the Senior Notes and certain subordinated indebtedness. |
In addition, our revolving credit facility requires us to maintain a maximum net senior secured leverage ratio.
A breach of any covenant contained in either the Existing Senior Secured Credit Facilities or the indenture governing the Senior Notes could result in a default under those agreements. If any such default occurs, the lenders under the Existing Senior Secured Credit Facilities or the holders of the Senior Notes, as the case may be, may elect (after the expiration of any applicable notice or grace periods) to declare all outstanding borrowings, together with accrued and unpaid interest and other amounts payable thereunder, to be immediately due and payable. In addition, a default under the indenture governing the Senior Notes would cause a default under the Existing Senior Secured Credit Facilities, and the acceleration of debt under the Existing Senior Secured Credit Facilities or the failure to pay that debt when due would cause a default under the indenture governing the Senior Notes (assuming the amount of that debt is in excess of $25.0 million). The lenders under the Existing Senior Secured Credit Facilities also have the right upon an event of default thereunder to terminate any commitments they have to provide further borrowings. Further, following an event of default under the Existing Senior Secured Credit Facilities, the lenders under these facilities will have the right to proceed against the collateral granted to them to secure that debt, which includes the available cash of our subsidiaries that guarantee the Existing Senior Secured Credit Facilities. If the debt under the Existing Senior Secured Credit Facilities or the Senior Notes becomes due and payable, our assets may not be sufficient to repay in full that debt or any other debt that may become due as a result of that acceleration.
Risks Related to Our Common Stock and This Offering
We are a holding company with no operations of our own, and we depend on our subsidiaries for cash to fund all of our operations and expenses, including to make future dividend payments, if any.
Our operations are conducted entirely through our subsidiaries, such as SRA International, Inc., and our ability to generate cash to fund operations and expenses, to pay dividends or to meet debt service obligations is highly dependent on the earnings and the receipt of funds from our subsidiaries through dividends or intercompany loans. Deterioration in the financial condition, earnings or cash flow of SRA International, Inc. and its subsidiaries for any reason could limit or impair their ability to pay such distributions. Additionally, to the extent that we need funds, and our subsidiaries are restricted from making such distributions under applicable law or regulation or under the terms of our financing arrangements, or are otherwise unable to provide such funds, it could materially adversely affect our business, financial condition, results of operations or prospects.
Further, the terms of the indenture governing the Senior Notes and the agreements governing the Existing Senior Secured Credit Facilities significantly restrict the ability of our subsidiaries to pay dividends, make loans or otherwise transfer assets to us. Furthermore, our subsidiaries are permitted under the terms of the Existing Senior Secured Credit Facilities and other indebtedness to incur additional indebtedness that may restrict or prohibit the making of distributions, the payment of dividends or the making of loans by such subsidiaries to us. In addition, Delaware law imposes requirements that may restrict our ability to pay dividends to holders of our common stock in the future.
Our common stock has no prior public market and the market price of our common stock may be volatile and could decline after this offering.
Prior to this offering, there has been no public market for our common stock, and an active market for our common stock may not develop or be sustained after this offering. We will negotiate the initial public offering price per share with the representatives of the underwriters and, therefore, that price may not be indicative of the
30
Table of Contents
market price of our common stock after this offering. In the absence of an active public trading market, you may not be able to liquidate your investment in our common stock. In addition, the market price of our common stock may fluctuate significantly. Among the factors that could affect our stock price are:
| • | Changes in government budget levels and procurement priorities; |
| • | industry or general market conditions; |
| • | domestic and international economic factors unrelated to our performance; |
| • | changes in our customers’ preferences; |
| • | new laws and regulatory pronouncements and changes in regulatory guidelines; |
| • | lawsuits, enforcement actions and other claims by third parties or governmental authorities; |
| • | actual or anticipated fluctuations in our quarterly operating results; |
| • | changes in securities analysts’ estimates of our financial performance or lack of research coverage and reports by industry analysts; |
| • | changes in accounting standards, policies, guidance, interpretations or principles; |
| • | action by institutional stockholders or other large stockholders (including the PEP Funds and Dr. Volgenau), including future sales of our common stock; |
| • | failure to meet any guidance given by us or any change in any guidance given by us, or changes by us in our guidance practices; |
| • | announcements by us of significant impairment charges; |
| • | speculation in the press or investment community; |
| • | investor perception of us and our industry; |
| • | changes in market valuations or earnings of similar companies; |
| • | announcements by us or our competitors of significant contracts, acquisitions, dispositions or strategic partnerships; |
| • | wins and losses on contract re-competitions and new business pursuits; |
| • | our ability to obtain financing as needed; |
| • | war, terrorist acts, natural disasters and epidemic disease; |
| • | any future sales of our common stock or other securities; and |
| • | additions or departures of key personnel, including key executives and other management. |
In particular, we cannot assure you that you will be able to resell your shares at or above the initial public offering price. The stock markets have experienced extreme volatility in recent years that has been unrelated to the operating performance of particular companies. These broad market fluctuations may adversely affect the trading price of our common stock. In the past, following periods of volatility in the market price of a company’s securities, class action litigation has often been instituted against the affected company. Any litigation of this type brought against us could result in substantial costs and a diversion of our management’s attention and resources, which would harm our business, financial condition, and results of operations.
Future sales of shares by existing stockholders could cause our stock price to decline.
Sales of substantial amounts of our common stock in the public market following this offering, or the perception that these sales could occur, could cause the market price of our common stock to decline. These sales, or the possibility that these sales may occur, also might make it more difficult for us to sell equity securities in the future at a time and at a price that we deem appropriate.
31
Table of Contents
Based on shares outstanding as of , 2015, upon completion of this offering, we will have outstanding shares of common stock (or outstanding shares of common stock, assuming exercise in full of the underwriters’ option to purchase additional shares). All of the shares sold pursuant to this offering will be immediately tradable without restriction under the Securities Act of 1933, as amended, or the “Securities Act,” except for any shares held by “affiliates,” as that term is defined in Rule 144 under the Securities Act, or “Rule 144.”
The remaining shares of common stock as of , 2015 will be restricted securities within the meaning of Rule 144 under the Securities Act, but will be eligible for resale subject to applicable volume, means of sale, holding period and other limitations of Rule 144 under the Securities Act or pursuant to an exception from registration under Rule 701 under the Securities Act, subject to the lock-up agreements entered into by us, our executive officers and directors, and stockholders currently representing substantially all of the outstanding shares of our common stock.
Upon completion of this offering, we intend to file one or more registration statements on Form S-8 under the Securities Act to register the shares of common stock to be issued under our equity compensation plans and, as a result, all shares of common stock acquired upon exercise of stock options granted under our plans will also be freely tradable under the Securities Act, subject to the terms of the lock-up agreements, unless purchased by our affiliates. As of June 30, 2015, there were stock options outstanding to purchase a total of shares of our common stock and there were restricted shares of our common stock. In addition, shares of our common stock are reserved for future issuances under our plan.
In connection with this offering, we, our executive officers and directors, and stockholders currently representing substantially all of the outstanding shares of our common stock will sign lock-up agreements under which, subject to certain exceptions, they will agree not to sell, transfer or dispose of or hedge, directly or indirectly, any shares of our common stock or any securities convertible into or exercisable or exchangeable for shares of our common stock for a period of 180 days after the date of this prospectus, subject to possible extension under certain circumstances, except with the prior written consent of . See “Underwriting.” Following the expiration of this 180-day lock-up period, the shares of our common stock outstanding on the date of this prospectus will be eligible for future sale, subject to the applicable volume, manner of sale, holding period and other limitations of Rule 144 under the Securities Act or pursuant to an exception from registration under Rule 701 under the Securities Act. See “Shares Available for Future Sale” for a discussion of the shares of common stock that may be sold into the public market in the future. In addition, our significant stockholders may distribute shares that they hold to their investors who themselves may then sell into the public market following the expiration of the lock-up period. Such sales may not be subject to the volume, manner of sale, holding period and other limitations of Rule 144 under the Securities Act. As resale restrictions end, the market price of our common stock could decline if the holders of those shares sell them or are perceived by the market as intending to sell them. Furthermore, stockholders currently representing substantially all of the outstanding shares of our common stock will have the right to require us to register shares of common stock for resale in some circumstances. See “Certain Relationships and Related Party Transactions—Stockholders Agreements.”
If securities or industry analysts do not publish research or publish misleading or unfavorable research about our business, our stock price and trading volume could decline.
The trading market for our common stock will depend in part on the research and reports that securities or industry analysts publish about us or our business. We do not currently have and may never obtain research coverage for our common stock. If there is no research coverage of our common stock, the trading price for our common stock may be negatively impacted. In the event we obtain research coverage for our common stock, if one or more of the analysts downgrades our stock or publishes misleading or unfavorable research about our business, our stock price would likely decline. If one or more of the analysts ceases coverage of our common stock or fails to publish reports on us regularly, demand for our common stock could decrease, which could cause our common stock price or trading volume to decline.
32
Table of Contents
A few significant stockholders will have significant influence over us and may not always exercise their influence in a way that benefits our public stockholders.
Following the completion of this offering, the PEP Funds and Dr. Volgenau will own approximately % and %, respectively, of the outstanding shares of our common stock assuming that the underwriters do not exercise their option to purchase additional shares. Prior to the completion of this offering, we, the PEP Funds, and Dr. Volgenau will enter into an amendment and restatement to our existing stockholders agreement, or the “amended stockholders agreement,” pursuant to which the PEP Funds and Dr. Volgenau will agree to vote in favor of one another’s designees to our board of directors, among other matters. As a result, the PEP Funds and Dr. Volgenau will exercise significant influence over all matters requiring stockholder approval for the foreseeable future, including approval of significant corporate transactions.
As long as the PEP Funds and Dr. Volgenau continue to own at least 50% of our outstanding common stock, the PEP Funds and Dr. Volgenau generally will be able to determine the outcome of corporate actions requiring stockholder approval, including the election of the members of our board of directors, the approval of significant corporate transactions such as mergers and the sale of substantially all of our assets. Even after the PEP Funds and Dr. Volgenau reduce their beneficial ownership below 50% of our outstanding common stock, they will likely still be able to assert significant influence over our board of directors and certain corporate actions. Following the consummation of this offering, the PEP Funds and Dr. Volgenau will have the right to designate for nomination for election a majority of our directors.
Because the PEP Funds’ and Dr. Volgenau’s interests may differ from your interests, actions the PEP Funds and Dr. Volgenau take as our controlling stockholders or as significant stockholders may not be favorable to you. For example, the concentration of ownership held by the PEP Funds and Dr. Volgenau could delay, defer or prevent a change of control of us or impede a merger, takeover or other business combination which another stockholder may otherwise view favorably. Other potential conflicts could arise, for example, over matters such as employee retention or recruiting, or our dividend policy.
Under our amended and restated certificate of incorporation, the PEP Funds and their respective affiliates and, in some circumstances, any of our directors and officers who is also a director, officer, employee, member or partner of the PEP Funds and their respective affiliates, have no obligation to offer us corporate opportunities.
The policies relating to corporate opportunities and transactions with the PEP Funds to be set forth in our second amended and restated certificate of incorporation, or “amended and restated certificate of incorporation,” address potential conflicts of interest between SRA, on the one hand and the PEP Funds and its officers, directors, employees, members or partners who are directors or officers of our company, on the other hand. In accordance with those policies, the PEP Funds may pursue corporate opportunities, including acquisition opportunities that may be complementary to our business, without offering those opportunities to us. By becoming a stockholder in SRA you will be deemed to have notice of and have consented to these provisions of our amended and restated certificate of incorporation. Although these provisions are designed to resolve conflicts between us and the PEP Funds and their respective affiliates fairly, conflicts may not be so resolved.
Future offerings of debt or equity securities which would rank senior to our common stock may adversely affect the market price of our common stock.
If, in the future, we decide to issue debt or equity securities that rank senior to our common stock, it is likely that such securities will be governed by an indenture or other instrument containing covenants restricting our operating flexibility. Additionally, any convertible or exchangeable securities that we issue in the future may have rights, preferences and privileges more favorable than those of our common stock and may result in dilution to owners of our common stock. We and, indirectly, our stockholders, will bear the cost of issuing and servicing such securities. Because our decision to issue debt or equity securities in any future offering will depend on market conditions and other factors beyond our control, we cannot predict or estimate the amount, timing or
33
Table of Contents
nature of our future offerings. Thus, holders of our common stock will bear the risk of our future offerings reducing the market price of our common stock and diluting the value of their stock holdings in us.
Fulfilling our obligations incident to being a public company, including with respect to the requirements of and related rules under the Sarbanes-Oxley Act of 2002, will be expensive and time-consuming, and any delays or difficulties in satisfying these obligations could have a material adverse effect on our future results of operations and our stock price.
Following this offering, we will be subject to the reporting and corporate governance requirements, under the listing standards of the and the Sarbanes-Oxley Act of 2002, that apply to issuers of listed equity, which will impose certain new compliance costs and obligations upon us. The changes necessitated by publicly listing our equity will require a significant commitment of additional resources and management oversight which will increase our operating costs. Other expenses associated with being a public company include increases in auditing, accounting and legal fees and expenses, investor relations expenses, increased directors’ fees and director and officer liability insurance costs, registrar and transfer agent fees and listing fees, as well as other expenses. As a public company, we will be required, among other things, to define and expand the roles and the duties of our board of directors and its committees and institute more comprehensive compliance and investor relations functions. Failure to comply with the Sarbanes-Oxley Act of 2002 could potentially subject us to sanctions or investigations by the SEC, the , or other regulatory authorities.
Anti-takeover provisions in our amended and restated certificate of incorporation and amended and restated by-laws could discourage, delay or prevent a change of control of our company and may affect the trading price of our common stock.
Our amended and restated certificate of incorporation and amended and restated by-laws include a number of provisions that may discourage, delay or prevent a change in our management or control over us that stockholders may consider favorable. For example, prior to the completion of this offering, our amended and restated certificate of incorporation and amended and restated by-laws will collectively:
| • | authorize the issuance of “blank check” preferred stock that could be issued by our board of directors to thwart a takeover attempt; |
| • | establish a classified board of directors, as a result of which our board of directors will be divided into three classes, with members of each class serving staggered three-year terms, which prevents stockholders from electing an entirely new board of directors at an annual meeting; |
| • | limit the ability of stockholders to remove directors if the PEP Funds cease to own at least % of the outstanding shares of our common stock; |
| • | provide that vacancies on our board of directors, including vacancies resulting from an enlargement of our board of directors, may be filled only by a majority vote of directors then in office; |
| • | prohibit stockholders from calling special meetings of stockholders if the PEP Funds cease to own at least % of the outstanding shares of our common stock; |
| • | prohibit stockholder action by written consent, thereby requiring all actions to be taken at a meeting of the stockholders, if the PEP Funds cease to own at least % of the outstanding shares of our common stock; |
| • | establish advance notice requirements for nominations of candidates for election as directors or to bring other business before an annual meeting of our stockholders; and |
| • | require the approval of holders of at least 75% of the outstanding shares of our common stock to amend our amended and restated by-laws and certain provisions of our amended and restated certificate of incorporation if the PEP Funds cease to own at least % of the outstanding shares of our common stock. |
34
Table of Contents
These provisions may prevent our stockholders from receiving the benefit from any premium to the market price of our common stock offered by a bidder in a takeover context. Even in the absence of a takeover attempt, the existence of these provisions may adversely affect the prevailing market price of our common stock if the provisions are viewed as discouraging takeover attempts in the future.
Our amended and restated certificate of incorporation and amended and restated by-laws may also make it difficult for stockholders to replace or remove our management. Furthermore, the existence of the foregoing provisions, as well as the significant amount of common stock that the PEP Funds and Dr. Volgenau will own following this offering, could limit the price that investors might be willing to pay in the future for shares of our common stock. These provisions may facilitate management entrenchment that may delay, deter, render more difficult or prevent a change in our control, which may not be in the best interests of our stockholders.
We do not intend to pay dividends on our common stock for the foreseeable future and, consequently, your ability to achieve a return on your investment will depend on appreciation in the price of our common stock.
We do not intend to declare and pay dividends on our common stock for the foreseeable future. We currently intend to use our future earnings, if any, to fund our growth, to develop our business, for working capital needs, to selectively pursue acquisitions, and for general corporate purposes. Therefore, you are not likely to receive any dividends on your common stock for the foreseeable future and the success of an investment in shares of our common stock will depend upon any future appreciation in their value. There is no guarantee that shares of our common stock will appreciate in value or even maintain the price at which our stockholders have purchased their shares. In addition, our operations are conducted almost entirely through our subsidiaries. As such, to the extent that we determine in the future to pay dividends on our common stock, none of our subsidiaries will be obligated to make funds available to us for the payment of dividends. Further, the indenture governing the Senior Notes and the agreements governing the Existing Senior Secured Credit Facilities significantly restrict the ability of our subsidiaries to pay dividends or otherwise transfer assets to us. In addition, Delaware law may impose requirements that may restrict our ability to pay dividends to holders of our common stock.
We expect to be a “controlled company” within the meaning of the rules and, as a result, we will qualify for, and currently intend to rely on, exemptions from certain corporate governance requirements. You will not have the same protections afforded to stockholders of companies that are subject to such requirements.
After completion of this offering, the PEP Funds and Dr. Volgenau will control a majority of the voting power of our outstanding common stock. Accordingly, we expect to qualify as a “controlled company” within the meaning of the corporate governance standards. Under the rules of , a company of which more than 50% of the voting power is held by an individual, group or another company is a “controlled company” and may elect not to comply with certain corporate governance standards, including:
| • | the requirement that a majority of the board of directors consist of independent directors; |
| • | the requirement that our nominating and corporate governance committee be composed entirely of independent directors with a written charter addressing the committee’s purpose and responsibilities; |
| • | the requirement that we have a compensation committee that is composed entirely of independent directors with a written charter addressing the committee’s purpose and responsibilities; and |
| • | the requirement for an annual performance evaluation of the nominating and corporate governance and compensation committees. |
Following this offering, we intend to utilize these exemptions. As a result, we will not have a majority of independent directors, our nominating and corporate governance committee and compensation committee will not consist entirely of independent directors and such committees may not be subject to annual performance evaluations. Consequently, you will not have the same protections afforded to stockholders of companies that are
35
Table of Contents
subject to all of the corporate governance rules and requirements. Our status as a controlled company could make our common stock less attractive to some investors or otherwise harm our stock price.
Our amended and restated certificate of incorporation will designate the Court of Chancery of the State of Delaware as the exclusive forum for certain litigation that may be initiated by our stockholders, which could limit our stockholders’ ability to obtain a favorable judicial forum for disputes with us.
Our amended and restated certificate of incorporation will provide that the Court of Chancery of the State of Delaware will be the sole and exclusive forum for (i) any derivative action or proceeding brought on our behalf, (ii) any action asserting a claim of breach of a fiduciary duty owed to us or our stockholders by any of our directors, officers, employees or agents, (iii) any action asserting a claim against us arising under the General Corporation Law of the State of Delaware, or the “DGCL,” or (iv) any action asserting a claim against us that is governed by the internal affairs doctrine. By becoming a stockholder in our company, you will be deemed to have notice of and have consented to the provisions of our amended and restated certificate of incorporation related to choice of forum. The choice of forum provision in our amended and restated certificate of incorporation may limit our stockholders’ ability to obtain a favorable judicial forum for disputes with us.
Investors purchasing common stock in this offering will experience immediate and substantial dilution as a result of this offering and any future equity issuances.
The initial public offering price per share will significantly exceed the net tangible book value per share of our common stock outstanding. As a result, investors purchasing common stock in this offering will experience immediate substantial dilution of $ a share, based on the initial public offering price of $ , which is the midpoint of the estimated offering price range set forth on the cover page of this prospectus. This dilution is due in large part to the fact that our earlier investors paid substantially less than the initial public offering price when they purchased their shares. Investors purchasing shares of common stock in this offering will contribute approximately % of the total amount of equity invested in our company, but will own only approximately % of our total common stock immediately following the completion of this offering. In addition, we have issued options to acquire common stock at prices significantly below the initial public offering price. To the extent outstanding options are ultimately exercised, there will be further dilution to investors in this offering. In addition, if the underwriters exercise their option to purchase additional shares, or if we issue additional equity securities in the future, investors purchasing common stock in this offering will experience additional dilution.
36
Table of Contents
We estimate that the net proceeds of this offering will be approximately $ , after deducting underwriting discounts and commissions and estimated offering expenses.
We intend to use the proceeds from this offering to repay a portion of SRA International, Inc.’s outstanding indebtedness.
A $1.00 increase (decrease) in the assumed initial public offering price of $ per share would increase (decrease) the net proceeds to us from this offering by $ , assuming the number of shares offered by us remains the same and after deducting estimated underwriting discounts and commission and estimated offering expenses payable by us. We may also increase or decrease the number of shares we are offering. Each increase (decrease) of shares in the number of shares offered by us, assuming the offering price remains the same, would increase (decrease) net proceeds to us from this offering by $ , after deducting estimated underwriting discounts and commission and estimated offering expenses payable by us. The information discussed above is illustrative only and will adjust based on the actual public offering price and other terms of this offering determined at pricing.
37
Table of Contents
We do not currently expect to declare or pay dividends on our common stock for the foreseeable future. Instead, we intend to retain future earnings, if any, to finance the growth and development of our business, service our debt, selectively pursue acquisitions, and for working capital and general corporate purposes. Our ability to pay dividends to holders of our common stock is limited by our ability to obtain cash or other assets from our subsidiaries. Further, the covenants in the agreements governing the Existing Senior Secured Credit Facilities and the indenture governing the Senior Notes significantly restricts the ability of SRA International, Inc. and its subsidiaries to pay dividends or otherwise transfer assets to us. Any future determination to pay dividends on our common stock is subject to the discretion of our board of directors and will depend upon various factors then existing, including our results of operations, financial condition, liquidity requirements, capital requirements, level of indebtedness, contractual restrictions with respect to payment of dividends, restrictions imposed by applicable law, general business conditions, and other factors that our board of directors may deem relevant.
38
Table of Contents
The following table sets forth our cash and cash equivalents and our consolidated capitalization as of March 31, 2015 on:
| • | an actual basis; and |
| • | an as-adjusted basis, after giving effect to our sale of shares of common stock in this offering at an assumed initial public offering price of $ per share, and the application of the net proceeds therefrom as described in “Use of Proceeds.” |
You should read the following table in conjunction with the sections entitled “Selected Historical Financial Data” and “Management’s Discussion and Analysis of Financial Condition and Results of Operations” and our consolidated financial statements and related notes appearing in this prospectus.
| As of March 31, 2015 | ||||||||
| Actual | As Adjusted(1) | |||||||
| (dollars in thousands) | ||||||||
| Cash and cash equivalents |
$ | 143,452 | $ | |||||
|
|
|
|
|
|||||
| Long-term debt: |
||||||||
| Term Loan B Facility |
$ | 664,167 | $ | |||||
| Revolving Credit Facility(2) |
— | |||||||
| Senior Notes |
400,000 | |||||||
| Other long-term debt |
— | |||||||
| Less current portion |
— | |||||||
|
|
|
|
|
|||||
| Total long-term debt |
$ | 1,064,167 | $ | |||||
| Total shareholders’ equity |
135,485 | |||||||
|
|
|
|
|
|||||
| Total capitalization |
$ | 1,199,652 | $ | |||||
|
|
|
|
|
|||||
| (1) | Each $1.00 increase or decrease in the assumed initial public offering price of $ per share would increase or decrease, as applicable, our long-term debt, additional paid-in capital and stockholders’ equity by approximately $ million, assuming that the number of shares offered by us as set forth on the cover page of this prospectus remains the same and after deducting estimated underwriting discounts and commissions and estimated offering expenses. |
The foregoing table does not reflect stock options or restricted stock outstanding under our equity plans or stock options or restricted stock to be granted after this offering. As of June 30, 2015, there were stock options outstanding with an average exercise price of $ per share and shares of restricted stock outstanding.
| (2) | As of March 31, 2015 we had $100 million of availability under our Existing Revolver, subject to a borrowing base. |
39
Table of Contents
If you invest in our common stock in this offering, your ownership interest in us will be immediately diluted to the extent of the difference between the initial public offering price per share of our common stock and the net tangible book value per share of our common stock immediately after this offering. Dilution results from the fact that the per share offering price of the common stock exceeds the book value per share attributable to the shares of common stock held by existing stockholders.
Our net tangible book value as of , 2015 was $ million. Net tangible book value per share before the offering has been determined by dividing net tangible book value (total book value of tangible assets less total liabilities) by the number of shares of common stock outstanding as of , 2015.
After giving effect to the sale of shares of our common stock sold by us in this offering at an assumed initial public offering price of $ per share (the mid-point of the price range set forth on the cover page of this prospectus) and after deducting the underwriting discounts and commissions and estimated offering expenses payable by us, our adjusted net tangible book value as of March 31, 2015 would have been $ million, or $ per share. This represents an immediate increase in net tangible book value per share of $ to the existing stockholders and an immediate and substantial dilution in net tangible book value per share of $ to new investors who purchase shares in this offering. The following table illustrates this per share dilution to new investors:
| Per Share | ||||||||
| Assumed initial public offering price per share |
$ | |||||||
| Net tangible book value per share as of , 2015 |
$ | |||||||
| Increase in net tangible book value per share attributable to new investors in this offering |
$ | |||||||
|
|
|
|||||||
| Adjusted net tangible book value per share after this offering |
$ | |||||||
|
|
|
|||||||
| Dilution of net tangible book value per share to new investors |
$ | |||||||
|
|
|
|||||||
If the underwriters exercise in full their option to purchase additional shares, the adjusted tangible book value per share after giving effect to the offering would be $ per share. This represents an immediate increase in adjusted net tangible book value (or a decrease in net tangible book value deficit) of $ per share to the existing stockholders and an immediate and substantial dilution in adjusted net tangible book value of $ per share to new investors.
A $1.00 increase or decrease in the assumed initial public offering price of $ per share (the mid-point of the price range set forth on the cover page of this prospectus) would increase or decrease total consideration paid by new investors and total consideration paid by all stockholders by $ million, assuming that the number of shares offered by us set forth on the front cover of this prospectus remains the same, and after deducting the underwriting discounts and commissions and estimated offering expenses payable by us. An increase or decrease of shares in the number of shares offered by us would increase or decrease the total consideration paid to us by new investors and total consideration paid to us by all stockholders by $ million, assuming an initial public offering price of $ per share (the mid-point of the price range set forth on the cover page of this prospectus) remains the same and after deducting the underwriting discounts and commissions and estimated offering expenses payable by us.
40
Table of Contents
The following table summarizes, as of , 2015, the total number of shares of common stock purchased from us, the total consideration paid to us and the average price per share paid by the existing stockholders and by new investors purchasing shares in this offering (amounts in thousands, except percentages and per share data):
| Shares Purchased | Total Consideration | Average Price Per Share |
||||||||||||||||
| Number | Percent | Amount | Percent | |||||||||||||||
| Existing stockholders |
% | $ | % | $ | ||||||||||||||
| New investors |
||||||||||||||||||
|
|
|
|
|
|
|
|
|
|
||||||||||
| Total |
100 | % | $ | 100 | % | $ | ||||||||||||
|
|
|
|
|
|
|
|
|
|
||||||||||
The foregoing table does not reflect options or restricted stock units outstanding under our equity plans or stock options or restricted stock units to be granted after this offering. As of June 30, 2015, there were options outstanding with an average exercise price of $ per share and restricted shares outstanding.
To the extent that any of these stock options are exercised or any of these restricted stock units are settled into actual shares of common stock, there may be further dilution to new investors. See “Executive Compensation” and Note 5 to our audited consolidated financial statements included elsewhere in this prospectus.
In addition, we may choose to raise additional capital due to market conditions or strategic considerations even if we believe we have sufficient funds for our current or future operating plans. To the extent that additional capital is raised through the sale of equity or convertible debt securities, the issuance of such securities could result in further dilution to our stockholders.
41
Table of Contents
SELECTED HISTORICAL FINANCIAL DATA
The following table sets forth selected historical consolidated financial data for our business. The selected consolidated financial data are presented for two periods: Predecessor and Successor, which relate to the period from July 1, 2011 to July 20, 2011 and all periods preceding July 1, 2011 (preceding the Providence Acquisition) and the period July 21, 2011 to June 30, 2012 and all periods subsequent to June 30, 2012 (succeeding the Providence Acquisition), respectively. The selected historical consolidated financial data as of March 31, 2015 and for the nine months ended March 31, 2015 and March 31, 2014 have been derived from our unaudited condensed consolidated financial statements and related notes included in this prospectus. The summary historical consolidated balance sheet data as of March 31, 2014 has been derived from our unaudited condensed consolidated financial statements and related notes not included in this prospectus. The selected historical consolidated financial data as of June 30, 2014 and 2013, for the fiscal years ended June 30, 2014 and 2013, and in the Predecessor period from July 1, 2011 to July 20, 2011 and the Successor period July 21, 2011 to June 30, 2012 have been derived from our audited consolidated financial statements and related notes included in this prospectus. The selected historical financial data as of June 30, 2012, 2011 and 2010 and as of July 20, 2011, and for the fiscal years ended June 30, 2011 and 2010 are derived from our audited consolidated financial statements and related notes not included in this prospectus.
We sold the AOS component of Era in the second quarter of fiscal 2011 and Era’s foreign air traffic management and military and security component in the second quarter of fiscal 2012. We also sold the GCD business in the first quarter of fiscal 2012. All financial data presented below are from continuing operations (unless otherwise noted) and reflect the presentation of Era and GCD as discontinued operations.
The selected financial data set forth below are not necessarily indicative of the results of future operations and are qualified in their entirety by, and should be read in conjunction with, our audited consolidated financial statements and related notes, our unaudited condensed consolidated financial statements and related notes, and “Management’s Discussion and Analysis of Financial Condition and Results of Operations” included elsewhere in this prospectus.
| Predecessor | Successor | |||||||||||||||||||||||||||||||||
| Fiscal Year Ended June 30, |
July 1, 2011 through July 20, 2011 |
July 21, 2011 through June 30, 2012 |
Fiscal Year Ended June 30, |
Nine Months Ended March 31, |
||||||||||||||||||||||||||||||
| 2010 | 2011 | 2013 | 2014 | 2014 | 2015 | |||||||||||||||||||||||||||||
| (dollars in thousands, except share and per share data) |
||||||||||||||||||||||||||||||||||
| Statement of Operations |
||||||||||||||||||||||||||||||||||
| Revenue |
$ | 1,614,532 | $ | 1,704,991 | $ | 99,308 | $ | 1,575,872 | $ | 1,507,722 | $ | 1,386,363 | $ | 1,039,465 | $ | 1,030,341 | ||||||||||||||||||
| Operating costs and expenses: |
||||||||||||||||||||||||||||||||||
| Cost of services |
1,224,768 | 1,283,878 | 78,550 | 1,191,256 | 1,140,014 | 1,060,407 | 800,506 | 786,725 | ||||||||||||||||||||||||||
| Selling, general and administrative |
223,385 | 242,976 | 13,721 | 215,369 | 198,338 | 181,937 | 135,751 | 132,646 | ||||||||||||||||||||||||||
| Depreciation and amortization of property and equipment |
16,712 | 15,432 | 837 | 14,186 | 12,199 | 9,184 | 7,156 | 6,170 | ||||||||||||||||||||||||||
| Amortization of intangible assets |
7,418 | 8,551 | 442 | 91,551 | 88,147 | 72,711 | 54,647 | 43,473 | ||||||||||||||||||||||||||
| Sale of Constella Futures Holding, LLC |
1,889 | — | — | — | — | — | — | — | ||||||||||||||||||||||||||
| Transaction costs(1) |
— | 8,373 | 68,069 | 699 | — | — | — | — | ||||||||||||||||||||||||||
| Impairment of goodwill and other assets |
— | — | — | — | 345,753 | — | — | — | ||||||||||||||||||||||||||
| Gain on the sale of a portion of the Health & Civil business |
— | — | — | — | — | (1,564 | ) | (1,564 | ) | — | ||||||||||||||||||||||||
|
|
|
|
|
|
|
|
|
|
|
|
|
|
|
|
|
|||||||||||||||||||
| Total operating costs and expenses |
1,474,172 | 1,559,210 | 161,619 | 1,513,061 | 1,784,451 | 1,322,685 | 996,496 | 969,014 | ||||||||||||||||||||||||||
|
|
|
|
|
|
|
|
|
|
|
|
|
|
|
|
|
|||||||||||||||||||
| Operating income (loss) |
140,360 | 145,781 | (62,311 | ) | 62,811 | (276,729 | ) | 63,678 | 42,969 | 61,327 | ||||||||||||||||||||||||
| Interest expense |
(1,202 | ) | (859 | ) | (19 | ) | (101,715 | ) | (100,777 | ) | (104,191 | ) | (78,241 | ) | (80,062 | ) | ||||||||||||||||||
| Interest income |
1,838 | 741 | 13 | 85 | 43 | 65 | 43 | 34 | ||||||||||||||||||||||||||
|
|
|
|
|
|
|
|
|
|
|
|
|
|
|
|
|
|||||||||||||||||||
| Income (loss) from continuing operations before income taxes |
140,996 | 145,663 | (62,317 | ) | (38,819 | ) | (377,463 | ) | (40,448 | ) | (35,229 | ) | (18,701 | ) | ||||||||||||||||||||
| Provision for (benefit from) income taxes |
52,075 | 53,991 | (18,462 | ) | (14,768 | ) | (60,169 | ) | (16,286 | ) | (14,233 | (5,841 | ) | |||||||||||||||||||||
|
|
|
|
|
|
|
|
|
|
|
|
|
|
|
|
|
|||||||||||||||||||
| Income (loss) from continuing operations |
$ | 88,921 | $ | 91,672 | $ | (43,855 | ) | $ | (24,051 | ) | $ | (317,294 | ) | $ | (24,162 | ) | $ | (20,996 | ) | $ | (12,860 | ) | ||||||||||||
|
|
|
|
|
|
|
|
|
|
|
|
|
|
|
|
|
|||||||||||||||||||
42
Table of Contents
| Predecessor | Successor | |||||||||||||||||||||||||||||||||
| Fiscal Year Ended June 30, |
July 1, 2011 through July 20, 2011 |
July 21, 2011 through June 30, 2012 |
Fiscal Year Ended June 30, |
Nine Months Ended March 31, |
||||||||||||||||||||||||||||||
| 2010 | 2011 | 2013 | 2014 | 2014 | 2015 | |||||||||||||||||||||||||||||
| (dollars in thousands, except share and per share data) |
||||||||||||||||||||||||||||||||||
| Weighted average shares outstanding |
||||||||||||||||||||||||||||||||||
| Basic |
||||||||||||||||||||||||||||||||||
| Diluted |
||||||||||||||||||||||||||||||||||
| Earnings per share |
||||||||||||||||||||||||||||||||||
| Basic |
||||||||||||||||||||||||||||||||||
| Diluted |
||||||||||||||||||||||||||||||||||
| Balance Sheet Data (as of period end): |
||||||||||||||||||||||||||||||||||
| Cash and cash equivalents |
$ | 98,113 | $ | 171,758 | $ | 213,545 | $ | 3,647 | $ | 5,050 | $ | 108,840 | $ | 53,848 | $ | 143,452 | ||||||||||||||||||
| Working capital(2) |
235,416 | 313,418 | 315,581 | 100,531 | 96,817 | 75,980 | 82,963 | 128,732 | ||||||||||||||||||||||||||
| Total assets(3) |
944,750 | 1,133,448 | 1,179,063 | 2,088,526 | 1,626,953 | 1,576,056 | 1,592,908 | 1,559,178 | ||||||||||||||||||||||||||
| Long-term debt |
— | — | — | 1,127,521 | 1,108,667 | 1,047,927 | 1,068,545 | 1,059,863 | ||||||||||||||||||||||||||
| Total stockholders’ equity |
771,563 | 861,043 | 846,039 | 475,848 | 161,169 | 140,648 | 142,965 | 135,485 | ||||||||||||||||||||||||||
| (1) | Transaction costs include legal, accounting and other expenses, including accelerated stock compensation expense, incurred in connection with the Providence Acquisition. |
| (2) | Working Capital is defined as total current assets (excluding current assets of discontinued operations) minus total current liabilities (excluding current liabilities of discontinued operations). |
| (3) | Total assets as of June 30, 2012 exclude current assets of discontinued operations. |
43
Table of Contents
MANAGEMENT’S DISCUSSION AND ANALYSIS OF FINANCIAL
CONDITION AND RESULTS OF OPERATIONS
The following information should be read in conjunction with “Supplemental Information,” “Prospectus Summary—Summary Historical Consolidated Financial and Other Operating Data,” “Selected Historical Financial Data,” and our consolidated financial statements and related notes included in this prospectus. The following discussion may contain forward-looking statements that reflect our plans, estimates, and beliefs. Our actual results could differ materially from those discussed in these forward-looking statements. Factors that could cause or contribute to these differences include those factors discussed below and elsewhere in this prospectus, particularly in “Special Note Regarding Forward-Looking Statements” and “Risk Factors.”
Overview
We are a leading provider of sophisticated IT and professional services to the U.S. federal government. Our services help our government customers address complex IT needs in order to achieve their missions more effectively, while also increasing efficiency and reducing expenses. Approximately 70% of our revenue is derived from IT service offerings, including software and systems development, network infrastructure and cloud services, and cybersecurity, with the remaining 30% derived from domain-specific professional services in areas such as intelligence analysis, bioinformatics and health sciences, energy and environmental consulting, and enterprise planning and resource management. Our business has an attractive operating model, characterized by recurring revenues, diverse multi-year contracts, and strong free cash flow conversion.
We believe that the large size of our addressable market and our focus on higher growth areas of the market provide us with ample opportunities to grow. We estimate, based in part on data from the FPDS, that the U.S. federal government spent approximately $125 billion in government fiscal year 2014 with third parties on the types of IT and professional services that we provide, which we refer to as our addressable market. Within our addressable market, we generated approximately 77% of our revenue in fiscal 2014 from the health, civil, intelligence, homeland security, and law enforcement end markets. Spending by the federal government in the health and civil IT markets is forecasted by IDC to grow at 5.1% annually from government fiscal year 2014 to 2019, which is approximately twice the rate of growth in the administration’s 2016 DoD budget request over the same period. In addition, we generated approximately 23% of our revenue in fiscal 2014 from the defense end market, where we focus on technically complex IT services with long-term demand drivers, such as cybersecurity, mobility, big data, data center optimization, common networking infrastructure, cloud and supporting applications. Less than 2% of our fiscal 2014 revenue was derived from the declining portion of the defense end market tied to OCO funding.
In addition to focusing on attractive and growing segments of our addressable market, we have invested in business development capabilities that we believe will enable us to continue to grow our market share. Since 2011, we have nearly doubled headcount in our business development functions, while also reorganizing our resources to more effectively pursue and win new business in our target markets. Through these efforts, we increased the volume of new contract opportunities for which we submitted bids from $2.2 billion in fiscal 2011 to $6.1 billion in fiscal 2015. We have also enhanced the quality of our business development process by identifying and pursuing new business opportunities earlier and focusing on contracts where our services are differentiated from our competitors. As a result, we have maintained stable new business win rates in both fiscal 2014 and during the first nine months of fiscal 2015 and increased new business contract wins from $334 million in fiscal 2012 to $559 million in the twelve months ended March 31, 2015.
Our revenue is diversified across more than 900 unique contracts, with no single government agency representing more than 10% of revenue and no single contract representing more than 5% of revenue for the nine months ended March 31, 2015. Moreover, we have an attractive mix of contract types with approximately 70% of our fiscal 2014 revenue generated from fixed-price or time-and-materials contracts, which typically generate higher margins than cost-plus-fee contracts.
44
Table of Contents
Our attractive business model consists of multi-year contracts with high revenue visibility, attractive margins, and strong free cash flow conversion. We typically serve our customers under long-term contracts that span three to seven years, and we have served many of our customers for more than 20 years. Our long-term contracts and relationships provide us with high revenue visibility, with average contract lengths of approximately five years as of March 31, 2015. Further, our $3.2 billion of total backlog as of March 31, 2015 represents approximately 2.3 times fiscal 2014 revenue, providing us with a base of future revenues supported by existing contracts. We achieved a 13.1% Adjusted EBITDA margin for the nine months ended March 31, 2015, which we believe is among the highest across our public company peers in our industry. We believe that our strong margin profile is due to the sophisticated nature of our work, our efficient operating structure, and our favorable mix of contract types. In addition, with capital expenditures of less than 1% of revenue and low working capital requirements, we have historically had strong free cash flow conversion, allowing us to generate approximately $387 million of cash available for debt reduction or acquisitions since the Providence Acquisition in July 2011.
We direct substantial resources towards recruiting, training and promoting our employees and foster a high-performance culture throughout our organization. Our culture is based on a set of core principles that have defined our business throughout our nearly 40-year history: integrity, quality work for our customers, employee satisfaction, and service to our country and communities. We believe that our emphasis on developing and maintaining a high performance team and culture based on our foundational ethic of Honesty and Service® is a key competitive strength, helping to ensure we efficiently deliver consistent, high-quality work for our customers.
Our revenue, Adjusted EBITDA, and net loss for the nine months ended March 31, 2015 were $1,030.3 million, $140.7 million, and $12.9 million, respectively. Our revenue, Adjusted EBITDA, and net loss for fiscal 2014 were approximately $1.4 billion, $178.8 million, and $24.2 million, respectively. See “—Summary Historical Consolidated Financial and Other Operating Data” for a discussion of Adjusted EBITDA and a reconciliation to net loss.
Business Environment and Outlook
We generated more than 97% of our revenue from services provided on engagements with various agencies of the U.S. federal government in each of fiscal 2014 and the first nine months of fiscal 2015. Accordingly, our business performance is affected by the overall level of federal spending.
Demand for IT and professional services is being driven by priorities of our customers to invest in areas such as cybersecurity, cloud infrastructure, improved communications systems, IT modernization, data privacy protection, data analytics, and intelligence. Over the past few years, critical investments in these areas have been deferred due to budget constraints, resulting in a growing backlog of government IT needs. To that end, the administration’s government fiscal year 2016 budget request for IT spending proposes an increase of $2 billion, or 2.3%, over the 2015 budget request level.
The sequester cuts enacted by the Budget Control Act of 2011 reduced spending levels in most federal agencies, and the government shutdown in October 2013 discontinued many federal functions and associated contractor support for approximately two weeks. In December 2013, the President signed the Bipartisan Budget Act of 2013, which revised the limits on discretionary appropriations for government fiscal years 2014 and 2015, providing for higher levels of funding in those years than were allowed under the prior caps and budget enforcement procedures. On October 1, 2014, the government’s fiscal year 2015 began under a continuing resolution. The government has since been funded by a December 2014 omnibus spending bill and subsequent bills. In certain of our markets, contract awards continue to face delays, pricing pressure and greater numbers of competitors. However, we have observed fewer instances of contract scope reductions and funding pressure has lessened in recent periods. We believe that the administration’s request for incremental spending in IT for government fiscal year 2016 reflects increased focus by the government on these services.
45
Table of Contents
Key Metrics
We manage and assess the performance of our business by evaluating a variety of metrics. Selected key metrics are discussed below.
Revenue and Organic Growth
Total revenue growth is a measure of how successful we are at growing our business, including the effect of acquisitions and divestitures. Our organic revenue growth rate is a metric used by management in an attempt to isolate how effectively we are growing our core business, adjusting for acquisitions and divestitures.
We calculate organic revenue growth by comparing actual reported revenue in the current period including revenue attributable to acquired companies, with adjusted revenue from the prior year period. In arriving at prior year adjusted revenue, we include the revenue of acquired companies for the prior year periods comparable to the current-year periods for which the companies are included in our actual reported revenue. Revenue from discontinued operations is not included in reported revenue, and therefore, is not considered in our calculation of organic revenue. The resulting rate is intended to represent our organic growth or decline year-over-year. We believe that this provides useful information because it allows investors to better assess the underlying growth rate of our business.
For fiscal 2013 and 2014, and the nine months ending March 31, 2015, there was no difference between total revenue growth and organic revenue growth.
Submittals, Awards, Book-to-Bill, and Backlog
Our future growth is dependent upon our ability to successfully bid and win new contracts in our target markets. Submittals include the total value of bids submitted for prime funded opportunities, including both new and re-compete contracts. The total value of proposals we submitted in fiscal 2015 was $7.2 billion, $6.1 billion of which was for new business opportunities. Submittals do not include values of bids submitted for ID/IQ contracts or bids submitted as a subcontractor. The total value of proposals we submitted in fiscal 2014, 2013 and 2012 was $4.4 billion, $6.9 billion and $3.6 billion, respectively.
Contract awards generally represent the amount of revenue expected to be earned in the future from funded and unfunded contract awards received during the period. Contract awards include both new and recompete contracts. Given that new contracts generate growth, we closely track the new awards component of contract awards each year. The total value of new awards we received in fiscal 2014, 2013, and 2012 was $0.7 billion, $0.3 billion, and $0.3 billion, respectively.
Another key measure of our business growth is the ratio of total contract awards to revenue recorded in the same period, or the book-to-bill ratio. In order to drive future revenue growth, our goal is for the level of contract awards in a given period to exceed the revenue booked, thus yielding a book-to-bill ratio greater than 1.0. Our book-to-bill ratio was 1.0 and 1.5 in fiscal 2013 and 2014, respectively, and 0.9 and 1.1 for the nine and twelve months ended March 31, 2015, respectively.
Backlog represents our estimate of the remaining future revenues from our existing contracts. More specifically, we define backlog as the funded and unfunded orders for services under existing signed contracts, assuming the exercise of all option years relating to those contracts, less the amount of revenue we have previously recognized under those contracts and de-obligations. Backlog includes all contract options that have been priced but not yet funded, and includes an estimate of the contract value under single award ID/IQ contracts against which we expect future task orders to be issued without competition. Backlog does not include any value for the ceiling of multiple award contracts, nor does it include any estimate of future potential delivery orders
46
Table of Contents
that might be awarded under multiple award ID/IQ vehicles, GWACs, or GSA schedule contracts. We define funded backlog to be the portion of backlog for which funding currently is appropriated and obligated to us under a contract or other authorization for payment signed by an authorized purchasing authority.
Congress often appropriates funds for our customers on a yearly basis, even though the corresponding contract with us may call for performance that is expected to take a number of years. As a result, contracts are typically only partially funded at any point during their term with further funding dependent on Congress making subsequent appropriations and the procuring agency allocating funding to the contract.
Ceiling increases result from upward contract adjustments under existing contracts and increases in scope. Backlog is decreased by de-obligations and removals, which is the removal of amounts previously awarded by a customer resulting from either (i) a formal contract modification issued by the customer reducing, or de-obligating, the remaining contract value, or (ii) the expiration of the period of performance without an extension issued by the customer which would be necessary for us to continue working under the contract. In the latter case we remove the remaining contract value from backlog even though the contract value is not formally de-obligated by the customer.
As a result of the increased volume of contract awards in fiscal 2014, our total backlog grew by 6% from $3.3 billion as of June 30, 2013 to $3.5 billion as of June 30, 2014. Our total backlog as of March 31, 2015 includes orders under contracts that, in some cases, extend for several years, with the latest expiring during calendar year 2023.
As of March 31, 2015, we expect to recognize approximately 29% of our backlog as revenue within the next twelve months.
| Fiscal Year Ended June 30, | Nine Months Ended March 31, |
|||||||||||
| 2013 | 2014 | 2015 | ||||||||||
| (dollars in millions) | ||||||||||||
| Funded |
$ | 704.1 | $ | 667.2 | $ | 604.0 | ||||||
| Unfunded |
2,580.4 | 2,811.2 | 2,636.0 | |||||||||
|
|
|
|
|
|
|
|||||||
| Total Backlog |
$ | 3,284.5 | $ | 3,478.4 | $ | 3,240.0 | ||||||
|
|
|
|
|
|
|
|||||||
Contract Mix
When contracting with our customers, we typically enter into one of three basic types of contracts: cost-plus-fee, time-and-materials, and fixed-price.
| • | Cost-plus-fee. Cost-plus-fee contracts provide for reimbursement of allowable costs and the payment of a fee, which is our profit. In addition, some cost-plus-fee contracts provide for an award fee or incentive fee for meeting the requirements of the contract. |
| • | Time-and-materials. Time-and-materials contracts provide a fixed hourly rate for each direct labor and subcontractor labor hour expended plus reimbursement of allowable material costs and out-of-pocket expenses. |
| • | Fixed-price. Fixed-price contracts provide a pre-determined fixed price for specified products and/or services. Fixed-price-level-of-effort contracts are similar to time-and-materials contracts except they require a specified level of effort over a stated period of time. To the extent our actual costs vary from the estimates upon which the price of the fixed-price contract was negotiated, we will generate more or less than the anticipated amount of profit or could incur a loss. |
Each of these contract types has unique characteristics. From time to time, contracts may be issued that are a combination or hybrid of contract types. Cost-plus-fee contracts generally subject us to lower risk. They also can
47
Table of Contents
include award fees or incentive fees under which the customer may make additional payments based on our performance. However, not all costs are reimbursed under these types of contracts, and our customers carefully reviews the costs we charge. In addition, negotiated base fees are generally lower than projected profits on fixed-price or time-and-materials contracts, consistent with our lower risk. Under time-and-materials contracts, including our fixed-price-level-of effort contracts, we are also generally subject to lower risk; however, our profit may vary if actual labor hour costs vary significantly from the negotiated rates. Fixed-price contracts typically involve the highest risk and, as a result, are typically more profitable. Fixed-price contracts require that we absorb cost overruns, should they occur.
The following table summarizes our historical contract mix, measured as a percentage of total revenue, for the periods indicated.
| Combined | Successor | |||||||||||||||||||
| Fiscal Year Ended June 30, 2012 |
Fiscal Year Ended June 30, |
Nine Months Ended March 31, |
||||||||||||||||||
| 2013 | 2014 | 2014 | 2015 | |||||||||||||||||
| Cost-plus-fee |
32 | % | 30 | % | 30 | % | 31 | % | 27 | % | ||||||||||
| Time-and-materials |
36 | % | 35 | % | 36 | % | 35 | % | 39 | % | ||||||||||
| Fixed-price(a) |
32 | % | 35 | % | 34 | % | 34 | % | 34 | % | ||||||||||
| (a) | Includes approximately 4% of revenue earned on fixed-price-level-of-effort contracts for fiscal 2012 and 2013, 3% of revenue earned on fixed-price-level-of-effort contracts for fiscal 2014 and 3% of the revenue earned on fixed-price-level-of-effort contracts for each of the nine-month periods ended March 31, 2014 and March 31, 2015. |
Days Sales Outstanding
Days sales outstanding is a measure of how effectively we manage the billing and collection of accounts receivable, our most significant working capital component. We utilize an accounts receivable factoring facility to accelerate cash flow, which reduces our DSO. We calculate DSO by dividing accounts receivable at the end of each quarter, net of billings in excess of revenue, by revenue per day for the period. Revenue per day for a quarter is determined by dividing total revenue by 90 days, adjusted for partial periods related to any acquisitions and divestitures. DSO was 53 days as of March 31, 2015, 63 days as of March 31, 2014, 54 days as of June 30, 2014, and 64 days as of June 30, 2013.
Adjusted EBITDA, Adjusted Net Income, Adjusted Working Capital and Free Cash Flow
We present Adjusted EBITDA, Adjusted Net Income, Adjusted Working Capital and Free Cash Flow as they are measures used by our management to evaluate our operating performance and make investment decisions. Adjusted EBITDA, Adjusted Net Income, Adjusted Working Capital and Free Cash Flow are not recognized terms under GAAP and do not purport to be alternatives to measures of our operating performance or cash flows as presented in accordance with GAAP. For further discussion on Adjusted EBITDA, Adjusted Net Income, Adjusted Working Capital and Free Cash Flow, including the definitions thereof, see “Prospectus Summary—Summary Historical Consolidated Financial and Other Operating Data.”
Seasonality
Certain aspects of our operations are influenced by the federal government’s October-to-September fiscal year. It is not uncommon to experience a higher level of contract awards, funding actions and overall government demand for services in the final months and weeks of the government fiscal year.
Additionally, our quarterly results are impacted by the number of working days in a given quarter. There are generally fewer working days for our employees to generate revenue in the first and second quarters of our fiscal
48
Table of Contents
year (which are the third and fourth calendar quarters) because our employees usually take relatively more leave for vacations and holidays, which leads to lower revenue and profitability in those quarters. Also, we typically give annual raises to our employees in the first half of our fiscal year, while the billing rates on our time-and-materials contracts typically escalate gradually, causing the profitability on these contracts to increase over the course of our fiscal year.
Description of Statement of Operations Items
The following is a description of certain line items of our statements of operations.
Revenue
Over 90% of our revenue is generated from labor services, including revenue earned from direct labor as well as subcontractors. The revenue we earn also includes third-party hardware and software that we purchase and integrate when requested by the customer as a part of the solutions that we provide, which accounted for less than 5% of revenue for each of fiscal 2014 and the nine months ended March 31, 2015. To a lesser degree, we have developed, licensed and sold software to customers, which accounted for less than 1% of our annual revenue for each of the last three fiscal years.
Cost of Services
Cost of services includes the direct costs to provide our services and business solutions to customers. The most significant of these costs are the salaries and wages plus associated fringe benefits and facility-related costs of our employees directly serving customers. Cost of services also includes the costs of subcontractors and outside consultants, third-party materials such as hardware or software that we purchase and provide to the customer as part of an integrated solution, and any other direct costs such as travel expenses incurred to support our services.
Selling, General and Administrative Expenses
Selling, General and Administrative expenses include the salaries and wages plus associated fringe benefits, stock-based compensation and facility-related costs of our employees not performing work directly for customers. Among the functions covered by these costs are business development, IT services, finance and accounting, growth, contracts, legal, executive management, facilities, human resources, and recruiting. Underutilized labor is also included in SG&A.
The changes necessitated by publicly listing our equity will require a significant commitment of additional resources and management oversight which will increase our operating costs. Other expenses associated with being a public company include increases in auditing, accounting and legal fees and expenses, investor relations expenses, increased directors’ fees and director and officer liability insurance costs, registrar and transfer agent fees and stock exchange listing fees, as well as other expenses.
Depreciation and Amortization of Property and Equipment
Depreciation and amortization of property and equipment includes depreciation of computers, other equipment and furniture, the amortization of software we use internally, and the amortization of leasehold improvements.
49
Table of Contents
Amortization of Intangible Assets
Amortization of intangible assets includes amortization of definite-lived intangible assets, including customer relationships, backlog, developed technology, and software development costs. We expect amortization of intangible assets to decrease in future periods as certain acquired intangible assets become fully amortized.
Transaction Costs
Transaction costs include legal, accounting and other expenses, including accelerated stock compensation expense in fiscal 2012, incurred in connection with the Providence Acquisition.
Impairment of Goodwill and Other Assets
Impairment of goodwill and other assets includes the impairment charges recorded in fiscal 2013 to reduce the carrying value of goodwill and trade names to fair value.
Gain on the sale of a portion of the Health & Civil business
Gain on the sale of a portion of the Health & Civil business includes the gain recognized on the sale of six contracts from the Health & Civil group during fiscal 2014.
Summary of Financial Results
| Predecessor | Successor | Combined | Successor | |||||||||||||||||||||||||
| July 1, 2011 through July 20, 2011 |
July 21, 2011 through June 30, 2012 |
Fiscal Year Ended June 30, | Nine Months Ended March 31, | |||||||||||||||||||||||||
| 2012 | 2013 | 2014 | 2014 | 2015 | ||||||||||||||||||||||||
| (dollars in thousands) |
||||||||||||||||||||||||||||
| Revenue |
$ | 99,308 | $ | 1,575,872 | $ | 1,675,180 | $ | 1,507,722 | $ | 1,386,363 | $ | 1,039,465 | $ | 1,030,341 | ||||||||||||||
| Operating costs and expenses: |
||||||||||||||||||||||||||||
| Cost of services |
78,550 | 1,191,256 | 1,269,806 | 1,140,014 | 1,060,407 | 800,506 | 786,725 | |||||||||||||||||||||
| Selling, general and administrative |
13,721 | 215,369 | 229,090 | 198,338 | 181,937 | 135,751 | 132,646 | |||||||||||||||||||||
| Depreciation and amortization of property and equipment |
837 | 14,186 | 15,023 | 12,199 | 9,194 | 7,156 | 6,170 | |||||||||||||||||||||
| Amortization of intangible assets |
442 | 91,551 | 91,993 | 88,147 | 72,711 | 54,647 | 43,473 | |||||||||||||||||||||
| Transaction costs |
68,069 | 699 | 68,768 | — | — | — | — | |||||||||||||||||||||
| Impairment of goodwill and other assets |
— | — | — | 345,753 | — | — | — | |||||||||||||||||||||
| Gain on the sale of a portion of the Health & Civil business |
— | — | — | — | (1,564 | ) | (1,564 | ) | — | |||||||||||||||||||
|
|
|
|
|
|
|
|
|
|
|
|
|
|
|
|||||||||||||||
| Total operating costs and expenses |
161,619 | 1,513,061 | 1,674,680 | 1,784,451 | 1,322,685 | 996,496 | 969,014 | |||||||||||||||||||||
|
|
|
|
|
|
|
|
|
|
|
|
|
|
|
|||||||||||||||
| Operating (loss) income |
(62,311 | ) | 62,811 | 500 | (276,729 | ) | 63,678 | 42,969 | 61,327 | |||||||||||||||||||
| Interest expense |
(19 | ) | (101,715 | ) | (101,734 | ) | (100,777 | ) | (104,191 | ) | (78,241 | ) | (80,062 | ) | ||||||||||||||
| Interest income |
13 | 85 | 98 | 43 | 65 | 43 | 34 | |||||||||||||||||||||
|
|
|
|
|
|
|
|
|
|
|
|
|
|
|
|||||||||||||||
| Loss from continuing operations before income taxes |
(62,317 | ) | (38,819 | ) | (101,136 | ) | (377,463 | ) | (40,448 | ) | (35,229 | ) | (18,701 | ) | ||||||||||||||
| Benefit from income taxes |
(18,462 | ) | (14,768 | ) | (33,230 | ) | (60,169 | ) | (16,286 | ) | (14,233 | ) | (5,841 | ) | ||||||||||||||
|
|
|
|
|
|
|
|
|
|
|
|
|
|
|
|||||||||||||||
| Loss from continuing operations |
(43,855 | ) | (24,051 | ) | (67,906 | ) | (317,294 | ) | (24,162 | ) | (20,996 | ) | (12,860 | ) | ||||||||||||||
| Loss from discontinuing operations, net of tax |
(1,126 | ) | (4,893 | ) | (6,019 | ) | — | — | — | — | ||||||||||||||||||
| Net loss |
$ | (44,981 | ) | $ | (28,944 | ) | $ | (73,925 | ) | $ | (317,294 | ) | $ | (24,162 | ) | $ | (20,996 | ) | $ | (12,860 | ) | |||||||
|
|
|
|
|
|
|
|
|
|
|
|
|
|
|
|||||||||||||||
50
Table of Contents
Results of Operations
Nine Months Ended March 31, 2015 and 2014
Revenue
Revenue decreased 0.9% to $1,030.3 million in the nine months ended March 31, 2015 from $1,039.5 million in the nine months ended March 31, 2014. This decrease was impacted by the completion of the FDIC contract in April 2014. Excluding this impact, revenue increased 5.0% in the nine months ended March 31, 2014 as compared to the nine months ended March 31, 2015. This increase was driven by an acceleration in new business wins and deceleration in contract erosion.
Operating Costs and Expenses
Operating costs and expenses consisted of the following for the periods presented (dollars in thousands):
| Nine months ended March 31, | ||||||||||||
| 2014 | 2015 | % Change | ||||||||||
| Cost of services |
$ | 800,506 | $ | 786,725 | (1.7 | )% | ||||||
| Selling, general and administrative |
135,751 | 132,646 | (2.3 | )% | ||||||||
| Depreciation and amortization of property and equipment |
7,156 | 6,170 | (13.8 | )% | ||||||||
| Amortization of intangible assets |
54,647 | 43,473 | (20.4 | )% | ||||||||
| Gain on the sale of a portion of the Health & Civil business |
(1,564 | ) | — | NMF | ||||||||
| (as a percentage of revenue) | ||||||||||||
| Cost of services |
77.0 | % | 76.4 | % | ||||||||
| Selling, general and administrative |
13.1 | % | 12.9 | % | ||||||||
| Depreciation and amortization of property and equipment |
0.7 | % | 0.6 | % | ||||||||
| Amortization of intangible assets |
5.3 | % | 4.2 | % | ||||||||
| Gain on the sale of a portion of the Health & Civil business |
(0.2 | )% | — | |||||||||
NMF = Not meaningful
Cost of services consisted of the following for the periods presented (dollars in thousands):
| Nine Months Ended March 31, 2014 |
% of total | Nine Months Ended March 31, 2015 |
% of total |
|||||||||||||
| Direct labor and related overhead |
$ | 399,689 | 49.9 | % | $ | 398,321 | 50.6 | % | ||||||||
| Subcontractor labor |
257,435 | 32.2 | % | 260,920 | 33.2 | % | ||||||||||
| Materials and other reimbursable costs |
143,382 | 17.9 | % | 127,484 | 16.2 | % | ||||||||||
|
|
|
|
|
|||||||||||||
| Total cost of services |
$ | 800,506 | $ | 786,725 | ||||||||||||
|
|
|
|
|
|||||||||||||
Cost of services decreased $13.8 million in the nine months ended March 31, 2015 compared to the same period of the prior year primarily due to lower materials and reimbursable costs as a result of the loss of the FDIC contract. As a percentage of revenue, cost of services improved slightly in the nine months ended March 31, 2015 compared to the nine months ended March 31, 2014 primarily due to a more profitable contract mix.
Cost of services as a percentage of revenue varies from period to period depending on the mix of direct labor, subcontractor labor, and materials and other reimbursable costs. In periods where we have more materials and other reimbursable content, our costs of services as a percentage of revenue will be higher. We seek to optimize our labor content in performance of our contracts since we typically generate greater gross margin from our labor services, particularly from services that our employees provide, compared with other reimbursable items.
51
Table of Contents
SG&A decreased $3.1 million in the nine months ended March 31, 2015 compared to the same period of the prior year. Excluding the impact of the facility exit charges, stock compensation expense, severance charges to reduce our indirect labor force, officer compensation and other non-recurring costs, SG&A decreased approximately $0.3 million in the nine months ended March 31, 2015 compared to the comparable period of the prior year as a result of cost saving efforts.
Depreciation and amortization of property and equipment decreased $1.0 million in the nine months ended March 31, 2015 compared to the same period of the prior year, primarily as a result of disposing of assets in darkened facilities and delaying replacement of certain fully depreciated assets.
Amortization of intangible assets decreased $11.2 million in the nine months ended March 31, 2015 compared to the same period of the prior year, primarily as a result of accelerated recognition of amortization due to the expected benefits of the assets.
We recorded a gain on the sale of a portion of the Health & Civil business of $1.6 million recognized on the sale of six contracts from the Health & Civil group during the first quarter of fiscal 2014. For additional details, see Note 1 to our unaudited condensed consolidated financial statements included in this prospectus.
Interest
Interest, net consisted of the following for the periods presented (dollars in thousands):
| Nine months ended March 31, |
||||||||
| 2014 | 2015 | |||||||
| Interest expense |
$ | (78,241 | ) | $ | (80,062 | ) | ||
| Interest income |
43 | 34 | ||||||
|
|
|
|
|
|||||
| Interest, net |
$ | (78,198 | ) | $ | (80,028 | ) | ||
|
|
|
|
|
|||||
Interest expense increased in the nine months ended March 31, 2015 by $1.8 million compared to the comparable prior year period primarily due to an increase of the fixed rates on our interest rate swaps. Interest expense for the nine months ended March 31, 2015 includes amortization of original issue discount and debt issuance costs of $5.3 million compared to $5.6 million in the comparable prior year period. We manage our exposure to interest rate movements through the use of interest rate swap agreements. As of March 31, 2015, we had fixed the interest rate on all but $164.2 million of our outstanding total debt of $1.1 billion.
Income Taxes
Our effective tax rate for the nine months ended March 31, 2014 and 2015 was a tax benefit of 40.4% and 31.2%, respectively. Our year to date fiscal 2014 effective tax rate was higher than the statutory income tax rate primarily due to federal tax credits. Our year to date fiscal 2015 tax rate was lower than the statutory income tax rate primarily as a result of adjusting tax benefits recognized previously in the financial statements and prior year tax returns.
Years Ended June 30, 2014, 2013 and 2012
Presentation
The discussion below presents the results of operations for the Predecessor and the Successor, which relate to the period from July 1 to July 20, 2011 (preceding the Providence Acquisition) and the period July 21, 2011 to June 30, 2012 and all periods subsequent to June 30, 2012 (succeeding the Providence Acquisition).
We have prepared our discussion of the results of operations by comparing the mathematical combination of the Successor and Predecessor periods in the fiscal year ended June 30, 2012 to the results of operations for the fiscal year ended June 30, 2013. Although the combination of the Predecessor income statement for the period
52
Table of Contents
July 1, 2011 to July 20, 2011 with the Successor income statement for the period of July 21, 2011 to June 30, 2012 does not comply with GAAP, we believe that it provides a meaningful method of comparison. We have also prepared our discussion of all operating metrics based on the combination of Successor and Predecessor results in the fiscal year ended June 30, 2012 compared to the Successor results in the fiscal year ended June 30, 2013. We believe this combination of results for the Predecessor entity and Successor entity periods facilitates an investor’s understanding of our results of operations and changes in our results of operations by making the two periods more comparable. This combination should not be used in isolation or substituted for the separate Predecessor entity and Successor entity results, nor do the combined results reflect our Predecessor results on a comparative or pro forma basis.
Revenue
Revenue decreased 8.0% to $1,386.4 million in fiscal 2014 from $1,507.7 million in fiscal 2013. The decline in revenue was due, in part, to lower materials and other reimbursable costs, which decreased approximately $22.8 million, with the remainder of the decrease due to a decline in labor services, the ending of our largest contract (with the FDIC), and the federal government shutdown. The decline in labor services was primarily due to the competitive market environment and the continued delay of contract awards. The FDIC contract ended during fiscal 2014 and contributed to the decrease in revenue by $36 million. Revenue for fiscal 2014 was negatively impacted by the government shutdown in October 2013 by approximately $12 million. Excluding the impact of the FDIC contract, revenue declined by 6.1% during fiscal 2014 as compared to fiscal 2013. This decrease was primarily driven by contract scope and other reductions resulting from funding pressures faced by our customers.
Revenue decreased 10.0% to $1,507.7 million in fiscal 2013 from $1,675.2 million in fiscal 2012. The decline in revenue was due, in part, to lower materials and other reimbursable costs, which decreased approximately $64.2 million, with the remainder of the decrease due to a decline in labor services. The decline in labor services was primarily due to funding reductions on some of our existing programs and the continued delay of contract awards.
Operating Costs and Expenses
Operating costs and expenses consisted of the following for the periods presented (dollars in thousands):
| Combined | Successor | |||||||||||||||||||
| Fiscal Year Ended June 30, 2012 |
Fiscal Year Ended June 30, | Fiscal Year Ended June 30, | ||||||||||||||||||
| 2013 | % Change | 2014 | % Change | |||||||||||||||||
| Cost of services |
$ | 1,269,806 | $ | 1,140,014 | (10.2 | )% | $ | 1,060,407 | (7.0 | )% | ||||||||||
| Selling, general and administrative |
229,090 | 198,338 | (13.4 | )% | 181,937 | (8.3 | )% | |||||||||||||
| Depreciation and amortization of property and equipment |
15,023 | 12,199 | (18.8 | )% | 9,194 | (24.6 | )% | |||||||||||||
| Amortization of intangible assets |
91,993 | 88,147 | (4.2 | )% | 72,711 | (17.5 | )% | |||||||||||||
| Transaction costs |
68,768 | — | NMF | — | NMF | |||||||||||||||
| Impairment of goodwill and other assets |
— | 345,753 | NMF | — | NMF | |||||||||||||||
| Gain on the sale of a portion of the Health & Civil business |
— | — | NMF | (1,564 | ) | NMF | ||||||||||||||
| (as a percentage of revenue) | ||||||||||||||||||||
| Cost of services |
78.8 | % | 75.6 | % | 75.5 | % | ||||||||||||||
| Selling, general and administrative |
13.7 | % | 13.2 | % | 13.1 | % | ||||||||||||||
| Depreciation and amortization of property and equipment |
0.9 | % | 0.8 | % | 0.7 | % | ||||||||||||||
| Amortization of intangible assets |
5.5 | % | 5.8 | % | 5.2 | % | ||||||||||||||
| Transaction costs |
4.1 | % | — | % | — | % | ||||||||||||||
| Impairment of goodwill and other assets |
— | % | 22.9 | % | — | % | ||||||||||||||
| Gain on the sale of a portion of the Health & Civil business |
— | % | — | % | (0.1 | )% | ||||||||||||||
NMF = Not meaningful
53
Table of Contents
Cost of services consisted of the following for the periods presented (dollars in thousands):
| Combined | Successor | |||||||||||||||||||||||
| Fiscal Year Ended June 30, | Fiscal Year Ended June 30, | Fiscal Year Ended June 30, | ||||||||||||||||||||||
| 2012 | % of total | 2013 | % of total | 2014 | % of total | |||||||||||||||||||
| Direct labor and related overhead |
$ | 621,885 | 49.0 | % | $ | 570,995 | 50.1 | % | $ | 530,705 | 50.0 | % | ||||||||||||
| Subcontractor labor |
377,657 | 29.7 | % | 362,955 | 31.8 | % | 346,402 | 32.7 | % | |||||||||||||||
| Materials and other reimbursable costs |
270,264 | 21.3 | % | 206,064 | 18.1 | % | 183,300 | 17.3 | % | |||||||||||||||
|
|
|
|
|
|
|
|||||||||||||||||||
| Total cost of services |
$ | 1,269,806 | $ | 1,140,014 | $ | 1,060,407 | ||||||||||||||||||
|
|
|
|
|
|
|
|||||||||||||||||||
Cost of services decreased since fiscal 2012 due to lower business volume resulting from federal budget pressures, contract award delays and the government shutdown. As a percentage of revenue, cost of services increased in fiscal 2014 compared to fiscal 2013 partially attributable to the loss of revenue due to the shutdown of the U.S. federal government in October 2013, which reduced labor services costs and revenue but did not reduce the fixed portions of overhead costs. The increase was also driven by ongoing heightened competition and pricing pressures, both for new business opportunities and re-competes of our existing programs. As a percentage of revenue, cost of services decreased in fiscal 2013 compared to fiscal 2012 due to lower materials and other reimbursable costs. Excluding materials and other reimbursable costs, cost of services as a percentage of revenue in fiscal 2013 increased due to reduced margins on direct and subcontracted labor services.
Cost of services as a percentage of revenue varies from period to period depending on the mix of direct labor, subcontractor labor, and materials and other reimbursable costs. In periods where we have more materials and other reimbursable content, our costs of services as a percentage of revenue will be higher. We seek to optimize our labor content in performance of our contracts since we typically generate greater gross margin from our labor services, particularly from services that our employees provide, compared with other reimbursable items.
SG&A expenses decreased $16.4 million in fiscal 2014 compared to fiscal 2013 and $30.8 million in fiscal 2013 compared to fiscal 2012. Excluding the impact of the facility exit charges, stock compensation expense, severance charges to reduce our indirect labor force, officer compensation and other costs, SG&A expenses decreased approximately $23 million in fiscal 2014 compared to fiscal 2013 and approximately $22 million in fiscal 2013 compared to fiscal 2012. The decrease is primarily a result of actions taken to align our indirect costs with our volume of business and maintain competitive cost position. Additionally, the impact of the federal government shutdown in October 2013 reduced SG&A costs during fiscal 2014 by approximately $1 million and fiscal 2013 SG&A expenses benefited from lower incentive compensation expense and changes to our leave policy.
Depreciation and amortization of property and equipment decreased since fiscal 2012 as certain enterprise software applications became fully amortized at the end of fiscal 2012.
Amortization of intangible assets decreased in fiscal 2014 as compared to fiscal 2013 and fiscal 2013 as compared to fiscal 2012 as amortization is recorded on an accelerated basis based on the expected benefits of the assets. For further discussion of the intangible assets, see Note 3 to our audited consolidated financial statements included in this prospectus.
Transaction costs were $68.8 million in fiscal 2012 and consisted of accounting, investment banking, legal, acceleration of stock compensation and other costs incurred in connection with the Providence Acquisition.
54
Table of Contents
We recorded a goodwill and trade names impairment charge of $345.8 million in fiscal 2013 as a result of the annual impairment analysis. For a discussion of the analysis, see Note 3 to our audited consolidated financial statements included in this prospectus.
We recorded a gain on the sale of a portion of the Health & Civil business of $1.6 million recognized on the sale of six contracts from the Health & Civil group during fiscal 2014. For details, see Note 2 to our audited consolidated financial statements included in this prospectus.
Interest
Interest, net consisted of the following for the periods presented (dollars in thousands):
| Combined | Successor | |||||||||||
| Fiscal Year Ended June 30, 2012 |
Fiscal Year Ended June 30, 2013 |
Fiscal Year Ended June 30, 2014 |
||||||||||
| Interest expense |
$ | (101,734 | ) | $ | (100,777 | ) | $ | (104,191 | ) | |||
| Interest income |
98 | 143 | 65 | |||||||||
|
|
|
|
|
|
|
|||||||
| Interest, net |
$ | (101,636 | ) | $ | (100,734 | ) | $ | (104,126 | ) | |||
|
|
|
|
|
|
|
|||||||
Interest expense increased in fiscal 2014 by $3.4 million compared to fiscal 2013 due to an increase of the fixed rates on our interest rate swaps. Interest expense decreased in fiscal 2013 by $1.0 million compared to fiscal 2012 due to lower outstanding debt as a result of the Term Loan B Facility payments. Interest expense for fiscal 2014 and 2013 includes amortization of original issue discount and debt issuance costs of $7.8 million and $7.1 million, respectively. We manage our exposure to interest rate movements through the use of interest rate swap agreements. As of June 30, 2014, we had fixed the interest rate on all but $110.0 million of our outstanding total debt.
Income Taxes
Our fiscal 2014 effective tax rate was a benefit of 40.3%, primarily due to federal tax credits. We expect our effective tax rate for future periods to be approximately 40%.
Our fiscal 2013 effective tax rate was a tax benefit of 15.9%, which was impacted by the goodwill and trade names impairment charge recognized in fiscal 2013. Excluding the goodwill and trade names impairment charge, our effective tax rate would have been 43.3%, primarily due to retroactive reinstatement of the federal research and development credit to January 1, 2012 and revisions to certain estimates of non-deductible costs in our fiscal 2012 income tax return.
The effective tax rate for the period from July 1, 2011 through July 20, 2011 was a tax benefit of 29.6% and was impacted by the non-deductible Providence Acquisition costs incurred in the period. The effective tax rate for the period from July 21, 2011 through June 30, 2012 was a tax benefit of 38.0%. Our fiscal 2012 effective tax rate was adversely impacted by the limits on deductible interest expense for state income tax purposes.
Liquidity and Capital Resources
Our primary capital needs are to finance the costs of operations, pending the billing and collection of accounts receivable, and to service our indebtedness, make acquisitions and fund capital expenditures. Our working capital (current assets minus current liabilities) as of March 31, 2015 was $128.7 million compared to $76.0 million as of June 30, 2014. Our Adjusted Working Capital as of March 31, 2015 was negative $11.2
55
Table of Contents
million compared to negative $7.1 million as of June 30, 2014. See “Prospectus Summary—Summary Historical Consolidated Financial and Other Operating Data” for a discussion of Adjusted Working Capital and a reconciliation to working capital. As of March 31, 2015, our total unrestricted cash and cash equivalents was $143.5 million and our total outstanding debt was approximately $1.1 billion, excluding unamortized discount.
The following table presents a summary of our cash flow activity for the periods presented (dollars in thousands):
| Combined | Successor | |||||||||||||||||||
| Fiscal Year Ended June 30, 2012 |
Fiscal Year Ended June 30, 2013 |
Fiscal Year Ended June 30, 2014 |
Nine Months Ended March 31, |
|||||||||||||||||
| 2014 | 2015 | |||||||||||||||||||
| Net cash provided by operating activities before changes in working capital(1) |
$ | 19,447 | $ | 79,411 | $ | 49,926 | $ | 33,675 | $ | 42,668 | ||||||||||
| Net cash provided by (used in) changes in working capital(1) |
77,904 | (12,586 | ) | 95,727 | 16,599 | 8,903 | ||||||||||||||
|
|
|
|
|
|
|
|
|
|
|
|||||||||||
| Net cash provided by operating activities(1) |
97,351 | 66,825 | 145,653 | 50,274 | 51,571 | |||||||||||||||
| Net cash used in investing activities(1) |
(1,738,178 | ) | (45,422 | ) | (1,863 | ) | (1,476 | ) | (6,126 | ) | ||||||||||
| Net cash provided by (used in) financing activities(1) |
1,472,885 | (20,000 | ) | (40,000 | ) | — | (10,833 | ) | ||||||||||||
| Effect of exchange rate changes on cash and cash equivalents(1) |
(169 | ) | — | — | — | — | ||||||||||||||
|
|
|
|
|
|
|
|
|
|
|
|||||||||||
| Net (decrease) increase in cash and cash equivalents |
$ | (168,111 | ) | $ | 1,403 | $ | 103,790 | $ | 48,798 | $ | 34,612 | |||||||||
|
|
|
|
|
|
|
|
|
|
|
|||||||||||
| (1) | Includes results of discontinued operations in fiscal 2012. |
Cash Flows from Operating Activities
Accounts receivable represent our largest working capital requirement. We bill the majority of our customers monthly after services are rendered. Our operating cash flow is primarily affected by the overall profitability of our contracts, our ability to invoice and collect from our customers in a timely manner, and the timing of vendor and tax payments.
Net cash provided by operating activities was $50.3 million and $51.6 million in the nine months ended March 31, 2014 and 2015, respectively. In the nine months ended March 31, 2015, the increase in cash provided by operating activities was primarily due to more favorable operating results and the timing of interest payments.
Net cash provided by operating activities was $97.4 million, $66.8 million and $145.7 million in fiscal 2012, 2013, and 2014, respectively. In fiscal 2014, the increase in cash provided by operating activities was due to higher cash from the billing and collections of our accounts receivable in addition to lower payments of accrued payroll and employee benefits and interest. In fiscal 2013, the decrease in cash provided by operating activities was due to timing of vendor payments and lower income tax refunds partially offset by improvements in billing and collections of our accounts receivable.
Cash Flows from Investing Activities
Net cash used in investing activities was $1.5 million and $6.1 million for the nine months ended March 31, 2014 and March 31, 2015, respectively. In the nine months ended March 31, 2015, net cash used in investing activities represented $6.1 million of capital expenditures. In the nine months ended March 31, 2014, net cash used in investing activities was driven by capital expenditures of $7.0 million partially offset by $5.5 million from the sale of a portion of the Health & Civil business.
56
Table of Contents
Net cash used in investing activities was $1.7 billion, $45.4 million, and $1.9 million in fiscal 2012, 2013, and 2014, respectively. Acquisitions of businesses and capital expenditures were the primary uses of cash in investing activities for each of the three years. In fiscal 2014, cash used in investing activities was $7.4 million for capital expenditures partially offset by proceeds from the sale of a portion of the Health & Civil business of $5.5 million. In fiscal 2013, cash used in investing activities to acquire the assets of MorganFranklin Corporation’s National Security Solutions was $33.6 million and $11.8 million for capital expenditures. In fiscal 2012, net cash used in investing activities in connection with the Providence Acquisition was $1.7 billion, partially offset by proceeds from the sale of Era.
Cash Flows from Financing Activities
Net cash used in financing activities was zero and $10.8 million in the nine months ended March 31, 2014 and 2015, respectively. Borrowings on our revolving credit facility during the same nine months ended March 31, 2014 of $100.0 million were repaid during the same nine months. Net cash used in financing activities in fiscal 2015 related to repayments on our Term Loan B Facility.
Net cash provided by financing activities was $1.5 billion in fiscal 2012. Net cash used in financing activities was $20.0 million and $40.0 million in fiscal 2013 and 2014, respectively, which relates to repayments on our Term Loan B Facility. The net cash provided by financing activities in fiscal 2012 relates to the Providence Acquisition including $1.3 billion of debt incurred and $394.0 million of equity contributions by the PEP Funds.
Indebtedness
In connection with the Providence Acquisition, we entered into senior secured credit facilities consisting of an $875.0 million term loan facility, which we refer to as the Term Loan B Facility, with a term of seven years. On the same date we also entered into a $100.0 million revolving credit facility with a term of five years, which we refer to as the Existing Revolver. We refer to the Existing Revolver and the Term Loan B Facility, together, as the Existing Senior Secured Credit Facilities. Additionally, we issued $400 million aggregate principal amount of senior notes due October 1, 2019, which we refer to as the Senior Notes.
Our Term Loan B Facility requires annual payments equal to 50% of excess cash flow, or ECF, based upon achievement of a net senior secured leverage ratio, or NSSLR, between 2.75x and 3.5x. The required annual payments adjust to 75% of ECF when NSSLR is greater than 3.5x, 25% of ECF when NSSLR is between 2x and 2.75x, and zero if NSSLR is less than 2x. Any required ECF payments are due in October each year, subject to acceptance by the lenders. We are required to meet the NSSLR covenant quarterly if any revolving loan, swing-line loan or letter of credit is outstanding on the last day of the quarter. As of March 31, 2015, we had no outstanding letters of credit or borrowings under our Existing Revolver. The ratio is calculated as the consolidated net secured indebtedness as of the last day of the quarter (defined as consolidated net secured debt less any cash and permitted investments) to the preceding four quarters’ consolidated EBITDA (as defined in the Credit Agreement). As of March 31, 2015, our net senior secured leverage ratio was 2.9x and we were in compliance with all of our covenants under the Existing Senior Secured Credit Facilities.
We repaid $140.0 million of our Term Loan B Facility in fiscal 2012, which satisfied all of the required quarterly principal payments for the term of the loan and satisfied our required ECF principal payments for fiscal 2012. We repaid $20.0 million of our Term Loan B Facility in fiscal 2013, which satisfied our required ECF principal payments for fiscal 2013. The fiscal 2014 ECF requirement was $61.5 million, of which we repaid $40.0 million during fiscal 2014. The remainder was tendered as payment in October 2014, of which $10.6 million was declined by the lenders and returned to the Company, as permitted by the facility.
The Senior Notes bear interest at a rate of 11% per annum and mature on October 1, 2019. Interest on the Senior Notes is payable semi-annually. The Senior Notes are redeemable, in whole or in part, at the redemption
57
Table of Contents
prices set forth in the indenture governing the Senior Notes, including a redemption price of 105.5% during the twelve-month period beginning on October 1, 2015, plus accrued and unpaid interest, if any, to the redemption date.
The Existing Senior Secured Credit Facilities and the Senior Notes are guaranteed by all of our wholly owned subsidiaries. The Existing Senior Secured Credit Facilities are also guaranteed by Sterling Parent LLC, the direct parent of SRA International, Inc. The guarantees are full and unconditional and joint and several. Each of our subsidiary guarantors are 100% owned and have no independent assets or operations.
Capital Requirements
We believe the capital resources available to us under the Existing Revolver portion of our Existing Senior Secured Credit Facilities and cash from our operations are adequate to fund our normal working capital needs as well as our capital expenditure requirements, which are expected to be less than 1.0% of revenue, for at least the next twelve months.
Income Taxes
The Providence Acquisition accelerated the recognition of expense for stock options and restricted stock, creating a tax deduction of approximately $80.0 million in fiscal 2012. As a result of net operating loss carryforwards resulting primarily from this stock compensation deduction, as well as Providence Acquisition costs, tax-deductible interest expense, and stepped-up basis in assets from recent acquisitions, we have certain tax attributes that we expect will create savings in income tax liability in future periods. The Tax Receivable Agreement will provide for payment to our existing stockholders of 85% of the amount of federal, state and local income tax savings, if any, that we actually realize as a result of our utilization of these tax attributes. See “Certain Relationships and Related Party Transactions—Tax Receivable Agreement.”
Accounts Receivable Factoring
During fiscal 2014, we entered into an accounts receivable purchase agreement under which we sell certain accounts receivable to a third party (the “Factor”), without recourse to the Company. The Factor initially pays the Company 90% of the receivable and the remaining price is deferred and based on the amount the Factor receives from our customer. The structure of the transaction provides for a true sale, on a revolving basis, of the receivables transferred. Accordingly, upon transfer of the receivable to the Factor, the receivable is removed from our consolidated balance sheet, a loss on the sale is recorded and the deferred price is an account receivable until it is collected. The balance of the sold receivables may not exceed $50 million at any time. During the nine months ended March 31, 2014, we sold $50.0 million of receivables and recognized a related loss of $0.2 million in SG&A. During the nine months ended March 31, 2015, we sold $292.1 million of receivables and recognized a related loss of $0.7 million in SG&A for the same period. As of March 31, 2015, the balance of the sold receivables was $29.5 million, and the related deferred price was $3.2 million. The factoring agreement results in accelerated cash flow to us, which enables us to pay down higher cost indebtedness and provides additional liquidity for acquisitions and other general corporate purposes.
Off-Balance Sheet Arrangements
As of March 31, 2015, we had no material off-balance sheet arrangements, including retained or contingent interests in assets transferred to unconsolidated entities; derivative instruments indexed to our stock and classified in stockholder’s equity on the condensed consolidated balance sheet; or variable interests in entities that provide us with financing, liquidity, market risk or credit risk support or engage with us in leasing, hedging or research and development services. We utilize interest rate derivatives to add stability to interest expense and to manage our exposure to interest rate movements.
58
Table of Contents
For further discussion of our derivative instruments and hedging activities see Note 9 to our audit consolidated financial statements as of and for the fiscal year ended June 30, 2014 and Note 6 to our unaudited condensed consolidated financial statements as of and for the nine months ended March 31, 2015 included in this prospectus.
Contractual Obligations
The following tables summarize our contractual obligations as of June 30, 2015 that require us to make future cash payments, including agreements governing our indebtedness, on an actual basis and on an as adjusted basis. For contractual obligations, we included payments that we have an unconditional obligation to make. The as adjusted contractual obligations presented below give effect to this offering and the use of proceeds therefrom as if these transactions occurred on June 30, 2015.
| Contractual Obligations | Payments due by period | |||||||||||||||||||
| Total | Less than 1 year |
1 to 3 years |
3 to 5 years |
More than 5 years |
||||||||||||||||
| (dollars in thousands) | ||||||||||||||||||||
| Senior Notes |
$ | $ | $ | $ | $ | |||||||||||||||
| Term Loan B Facility(a) |
||||||||||||||||||||
| Interest on debt |
||||||||||||||||||||
| Operating lease obligations(b) |
||||||||||||||||||||
|
|
|
|
|
|
|
|
|
|
|
|||||||||||
| Total contractual obligations |
$ | $ | $ | $ | $ | |||||||||||||||
|
|
|
|
|
|
|
|
|
|
|
|||||||||||
| As Adjusted Contractual Obligations | Payments due by period | |||||||||||||||||||
| Total | Less than 1 year |
1 to 3 years |
3 to 5 years |
More than 5 years |
||||||||||||||||
| (dollars in thousands) |
||||||||||||||||||||
| Senior Notes |
$ | $ | $ | $ | $ | |||||||||||||||
| Term Loan B Facility(a) |
||||||||||||||||||||
| Interest on debt |
||||||||||||||||||||
| Operating lease obligations(b) |
||||||||||||||||||||
|
|
|
|
|
|
|
|
|
|
|
|||||||||||
| Total contractual obligations |
$ | $ | $ | $ | $ | |||||||||||||||
|
|
|
|
|
|
|
|
|
|
|
|||||||||||
| (a) | Includes the required excess cash flow payments that are due under the credit agreement governing our Existing Senior Secured Credit Facilities on October 15 each year. This does not include voluntary prepayments of borrowings that we may expect to make as such voluntary prepayments are not required under the credit agreement. |
| (b) | Includes approximately $ million of future cash payments related to the underutilized space that we exited during fiscal 2013, 2014 and 2015. |
In the normal course of our business, we enter into agreements with subcontractors and vendors to provide products and services that we consume in our operations or that are delivered to our customers. These products and services are not considered unconditional obligations until the products and services are actually delivered, at which time we record a liability for our obligation.
The liability related to unrecognized tax benefits has been excluded from the contractual obligations table because a reasonable estimate of the timing and amount of cash out flows from future tax settlements cannot be determined. See Note 10 to our audited consolidated financial statements as of and for the fiscal year ended June 30, 2014 included in this prospectus for additional information regarding taxes and related matters.
59
Table of Contents
Description of Critical Accounting Policies and Estimates
The preparation of our financial statements in accordance with GAAP requires us to make estimates and judgments that affect the reported amounts of assets, liabilities, revenue and expenses, as well as the disclosure of contingent assets and liabilities. These estimates are based on our historical experience and various other factors that are deemed reasonable at the time the estimates are made. We re-evaluate these estimates at least quarterly. Actual results may differ significantly from these estimates under different assumptions or conditions. We believe the critical accounting policies requiring significant estimates and judgments are revenue recognition, accounting for acquisitions, including the identification of intangible assets and the ongoing impairment assessments of goodwill and intangible assets, accounting for stock compensation expense, and income taxes. If any of these estimates or judgments proves to be inaccurate, our results could be materially affected in the future.
Revenue Recognition
Although revenue on most of our contracts is recognized based on objective criteria, revenue on some of our fixed-price contracts is recognized using the percentage-of-completion method of contract accounting which requires significant estimates that may change over time. Fixed price contracts using the percentage-of-completion method were approximately 24% of our revenue in fiscal 2014. The percentage-of-completion method requires estimates of total contract costs, profit and ongoing estimates of progress towards completion. To estimate total contract cost, we must make assumptions related to the outcome of future events for periods which may extend several years. These assumptions include future labor productivity and availability, and the nature and complexity of the work to be performed. We estimate profit as the difference between total contract revenue and total estimated contract cost, and recognize profit over the life of the contract. Unless we determine that there is a more suitable objective measure, we estimate progress towards completion based on costs expended to date in relation to total estimated costs expected upon completion of the contract.
For our cost-plus-award-fee contracts, we recognize the expected fee to be awarded by the customer when there is a basis to reasonably estimate the amount. Estimates of award or incentive fees require estimates that may change over time and are based on prior award experience and communication with the customer regarding performance, including any interim performance evaluations rendered by the customer.
In certain situations, we recognize revenue associated with work performed prior to the completion and signing of contract documents when persuasive evidence of an arrangement exists. We have a standard internal process that we use to determine whether all required criteria for revenue recognition have been met. This revenue is recognized only when it can be reliably estimated and realization is probable. We typically only perform work prior to the completion and signing of contract documents when a relationship with the customer already exists and we base our estimates on previous experiences with the customer, communications with the customer regarding funding status, and our knowledge of available funding for the contract or program. As of June 30, 2014, we had approximately $5.2 million of accounts receivable related to revenue recognized on work performed prior to completion or signing of contract documents. We have not historically recognized significant losses related to work performed prior to signing a contract.
Accounting for Acquisitions
The purchase price that we pay to acquire a business is allocated to the net assets acquired based on the estimated fair value of those net assets. The excess of the purchase price over the estimated fair value of the net tangible and separately identified intangible assets acquired represents goodwill. We typically retain an independent third party valuation firm to assist us in our determination of the fair value of goodwill and the fair values and useful lives of identified intangible assets. The fair value determinations required in a purchase price allocation involve significant estimates and management judgments including estimates of future operating results and cash flows. Different estimates and assumptions could result in materially different values assigned to acquired net assets, including identified intangible assets and goodwill.
60
Table of Contents
Accounting for Asset Impairments
Trade names are evaluated for impairment annually during the fourth quarter as of April 1. We assess the potential impairment by comparing the carrying value of the trade names with their estimated fair value, utilizing the relief from royalty method. If the carrying value exceeds the fair value, we recognize a loss based on the excess carrying value over fair value.
Goodwill represents the excess of the cost of an acquired entity over the net amounts assigned to assets acquired and liabilities assumed. We test goodwill for impairment annually during the fourth quarter as of April 1, and between annual tests if events or changes in circumstances indicate the carrying value may not be recoverable. Such events could include, but are not limited to, loss of a key contract, significant underperformance relative to plan or long-term projections, or similar events. The goodwill impairment assessment is separately performed for each of our two reporting units, National Security and Health & Civil. The impairment model prescribes a two-step method for determining goodwill impairment. The first step compares the reporting unit’s estimated fair value to its carrying value. We utilize a discounted cash flow analysis as well as comparative market multiples to determine the fair value of our reporting units. If the carrying value exceeds the estimated fair value, a potential impairment is indicated and we must complete the second step of the impairment test. The second step allocates the fair value of the reporting unit determined in step one to the tangible and intangible assets and liabilities to derive an implied fair value for the reporting unit’s goodwill. If the carrying value of goodwill exceeds the implied fair value, an impairment charge is recorded to reduce the carrying value of the goodwill to the implied fair value.
Intangible assets with finite lives are only evaluated for impairment when events or circumstances indicate that the carrying amount of long-lived assets and intangible assets may not be fully recoverable. We determine whether the carrying value of the long-lived asset is recoverable by comparing the asset’s carrying value to its future undiscounted net cash flows, without interest charges. If impairment is indicated as a result of this review, we recognize an impairment charge for the amount by which the carrying amount exceeds the fair value, which is measured using estimated discounted future cash flows.
As of April 1, 2014, we evaluated the goodwill of each of our reporting units for impairment. There was no indication of impairment in the National Security reporting unit or the Health & Civil reporting unit as the fair values were more than 20% higher than the carrying values for each reporting unit. Additionally, the estimated fair value of the trade names exceeded their carrying value. Based on these analyses, we concluded that the goodwill and trade names were not impaired in fiscal 2014. The fair value of the reporting units was higher than the carrying value as a result of higher industry valuation multiples, an increase in backlog, and higher profit margins.
As of April 1, 2013, we evaluated trade names for impairment. We recognized a trade name impairment charge of $51.9 million in fiscal 2013 for the amount of book value in excess of fair value.
As of April 1, 2013, we also evaluated goodwill assigned to our previous four reporting units, which were later consolidated into two reporting units in fiscal 2014, utilizing a discounted cash flow analysis as well as comparative market multiples to determine the fair value of our reporting units. The carrying values of Civil, Defense and Intelligence, Homeland Security, and Law Enforcement reporting units exceeded their respective fair values, indicating a potential impairment. There was no indication of impairment in the Health reporting unit as its fair value was higher than carrying value. We performed the second step of the goodwill impairment analysis to measure the amount of the impairment charge in our Civil, Defense and Intelligence, Homeland Security, and Law Enforcement reporting units. Based on the results of the step two analysis, we recorded a $293.9 million goodwill impairment charge in fiscal 2013.
As a result of the goodwill impairment in fiscal 2013, we assessed the value of future undiscounted net cash flows related to the identified intangible assets with finite lives, without interest charges. We concluded that the
61
Table of Contents
carrying amount of the assets did not exceed the future undiscounted net cash flows, and therefore the identified intangible assets were not impaired. In fiscal 2014, there was no triggering event to assess whether identified intangible assets were impaired.
Given the current industry conditions and the uncertainties regarding the impact on our business, there can be no assurance that the estimates and assumptions used in our goodwill and trade names impairment analyses will prove to be accurate predictions of the future. If our estimates regarding forecasted revenue or profitability are not achieved, or we experience adverse changes in market factors such as discount rates or valuation multiples derived from comparable publicly traded companies, we may be required to recognize additional impairment charges in future periods.
These impairment charges and our reporting units are discussed in Note 3 of our audited consolidated financial statements included in this prospectus.
Accounting for Stock-Based Compensation
Compensation costs related to our stock-based compensation plans are recognized based on the grant-date fair value of the options and restricted stock granted. In calculating the compensation expense for options granted, we utilize the Black-Scholes-Merton option-pricing model to value the service options and the Monte Carlo or binomial lattice model to value the performance options. Both models are widely accepted methods to calculate the fair value of stock options; however, the results are dependent on the inputs, two of which, expected term and expected volatility, are dependent on management’s judgment.
For the performance options, the expected term is estimated based on management’s expected timing of a liquidity event or sale of the Company. The expected volatility is based upon the combination of the historical volatility of comparable, publicly traded companies’ stock prices and the implied volatility of comparable, publicly traded companies’ share prices determined from publicly trade call options.
Changes in management’s judgment of the expected term and the expected volatility could have a material effect on the grant-date fair value calculated and, in turn, on the amount of compensation cost recognized.
Additionally, we are required to estimate future stock option and restricted stock award forfeitures when determining the amount of stock-based compensation costs to record. We have concluded that our historical forfeiture experience since the Providence Acquisition is the best basis available to estimate future stock option forfeitures. However, actual forfeitures may differ from the estimates used, and could materially affect the compensation expense recognized.
Accounting for Income Taxes
We utilize the asset and liability method of accounting for income taxes. Under this method, deferred income taxes are recognized for the tax consequences of temporary differences between the financial statement carrying amounts and the tax bases of existing assets and liabilities less valuation allowances, if required. Enacted statutory tax rates are used to compute the tax consequences of these temporary differences. We recognize the financial statement benefit of a tax position only after determining that the relevant tax authority would more likely than not sustain our position following an audit. Significant judgments and estimates, including projection of future taxable income, are required in determining our income tax expense or benefit. To project future taxable income, we develop assumptions including the amount of future state, federal and foreign pretax operating income, the reversal of temporary differences, and the implementation of feasible and prudent tax planning strategies. These assumptions require significant judgment about the forecasts of future taxable income and are consistent with the plans and estimates we are using to manage the underlying businesses.
62
Table of Contents
We have a process to ensure that uncertain tax positions are identified, analyzed and properly reported in our financial statements in accordance with GAAP. We recognize accrued interest and penalties related to uncertain tax positions in the provision for income tax expense or benefit.
We believe we have adequately provided for any reasonably foreseeable outcome related to our income tax matters, however, our future results may include favorable or unfavorable adjustments to our estimated tax position. To the extent that the expected tax outcome changes, such changes in estimate will impact the income tax provision or benefit in the period in which such determination is made.
Recent Accounting Pronouncements
In May 2014, the Financial Accounting Standards Board issued Accounting Standard Update (“ASU”) 2014-09, Revenue from Contracts with Customers, which requires an entity to recognize the amount of revenue to which it expects to be entitled for the transfer of promised goods or services to customers. This ASU will replace most existing revenue recognition guidance in U.S. GAAP when it becomes effective. This ASU is effective for our fiscal 2017. Early application is not permitted. This ASU permits the use of either the retrospective or cumulative effect transition method. Our management is evaluating the methods of adoption allowed by this ASU and the effect that it is expected to have on our consolidated financial statements.
In April 2015, the Financial Accounting Standards Board issued ASU 2015-03, Interest–Imputation of Interest, which requires the debt issuance costs related to a recognized debt liability be presented in the balance sheet as a direct deduction from the carrying amount of that debt liability, consistent with the presentation of debt discounts. Adoption of this standard is not expected to have an impact on our consolidated financial position, results of operations, or cash flows.
Quantitative and Qualitative Disclosures about Market Risk
Interest Rate Risk
Borrowings under the Existing Senior Secured Credit Facilities are at variable interest rates and expose us to interest rate risk. However, we manage our exposure to interest rate movements through the use of interest rate swap agreements. The interest rate swap derivatives decrease over time to a notional value of $475.0 million upon maturity of the swaps in July 2016. As of March 31, 2015 we had fixed the interest rate on $500.0 million of our outstanding Term Loan B Facility. The interest rate on the remaining $164.2 million of our outstanding Term Loan B Facility was variable. Borrowings under our Term Loan B Facility bear interest at a rate equal to an applicable margin plus London Interbank Offered Rate, or LIBOR, with a 1.25% floor, or, at the Company’s option, an applicable margin plus an alternative base rate determined by reference to the higher of the prime rate or the federal funds rate plus 0.5%, with a 2.25% floor. The three-month LIBOR was 0.27% at March 31, 2015. A hypothetical 1% increase in LIBOR over the 1.25% floor could increase our annual interest expense and related cash flows by approximately $1.6 million based on the unhedged portion of the Existing Senior Secured Credit Facilities outstanding as of March 31, 2015.
63
Table of Contents
Our Company
We are a leading provider of sophisticated IT and professional services to the U.S. federal government. Our services help our government customers address complex IT needs in order to achieve their missions more effectively, while also increasing efficiency and reducing expenses. Approximately 70% of our revenue is derived from IT service offerings, including software and systems development, network infrastructure and cloud services, and cybersecurity, with the remaining 30% derived from domain-specific professional services in areas such as intelligence analysis, bioinformatics and health sciences, energy and environmental consulting, and enterprise planning and resource management. Our business has an attractive operating model, characterized by recurring revenues, diverse multi-year contracts, and strong free cash flow conversion.
We believe that the large size of our addressable market and our focus on higher growth areas of the market provide us with ample opportunities to grow. We estimate, based in part on data from the FPDS, that the U.S. federal government spent approximately $125 billion in government fiscal year 2014 with third parties on the types of IT and professional services that we provide, which we refer to as our addressable market. Within our addressable market, we generated approximately 77% of our revenue in fiscal 2014 from the health, civil, intelligence, homeland security, and law enforcement end markets. Spending by the federal government in the health and civil IT markets is forecasted by IDC to grow 5.1% annually from government fiscal year 2014 to 2019, which is approximately twice the rate of growth in the administration’s 2016 DoD budget request over the same period. In addition, we generated approximately 23% of our revenue in fiscal 2014 from the defense end market, where we focus on technically complex IT services with long-term demand drivers, such as cybersecurity, mobility, big data, data center optimization, common networking infrastructure, cloud and supporting applications. Less than 2% of our fiscal 2014 revenue was derived from the declining portion of the defense end market tied to OCO funding.
In addition to focusing on attractive and growing segments of our addressable market, we have invested in business development capabilities that we believe will enable us to continue to grow our market share. Since 2011, we have nearly doubled headcount in our business development functions, while also reorganizing our resources to more effectively pursue and win new business in our target markets. Through these efforts, we increased the volume of new contract opportunities for which we submitted bids from $2.2 billion in fiscal 2011 to $6.1 billion in fiscal 2015. We have also enhanced the quality of our business development process by identifying and pursuing new business opportunities earlier and focusing on contracts where our services are differentiated from our competitors. As a result, we have maintained stable new business win rates in both fiscal 2014 and during the first nine months of fiscal 2015 and increased new business contract wins from $334 million in fiscal 2012 to $559 million in the twelve months ended March 31, 2015.
Our revenue is diversified across more than 900 unique contracts, with no single government agency representing more than 10% of revenue and no single contract representing more than 5% of revenue for the nine months ended March 31, 2015. Moreover, we have an attractive mix of contract types with approximately 70% of our fiscal 2014 revenue generated from fixed-price or time-and-materials contracts, which typically generate higher margins than cost-plus-fee contracts.
Our attractive business model consists of multi-year contracts with high revenue visibility, attractive margins, and strong free cash flow conversion. We typically serve our customers under long-term contracts that span three to seven years, and we have served many of our customers for more than 20 years. Our long-term contracts and relationships provide us with high revenue visibility, with average contract lengths of approximately five years as of March 31, 2015. Further, our $3.2 billion of total backlog as of March 31, 2015 represents approximately 2.3 times fiscal 2014 revenue, providing us with a base of future revenues supported by existing contracts. We achieved a 13.1% Adjusted EBITDA margin for the nine months ended March 31, 2015,
64
Table of Contents
which we believe is among the highest across our public company peers in our industry. We believe that our strong margin profile is due to the sophisticated nature of our work, our efficient operating structure, and our favorable mix of contract types. In addition, with capital expenditures of less than 1% of revenue and low working capital requirements, we have historically had strong free cash flow conversion, allowing us to generate approximately $387 million of cash available for debt reduction or acquisitions since the Providence Acquisition in July 2011.
We direct substantial resources towards recruiting, training and promoting our employees and foster a high-performance culture throughout our organization. Our culture is based on a set of core principles that have defined our business throughout our nearly 40-year history: integrity, quality work for our customers, employee satisfaction, and service to our country and communities. We believe that our emphasis on developing and maintaining a high performance team and culture based on our foundational ethic of Honesty and Service® is a key competitive strength, helping to ensure we efficiently deliver consistent, high-quality work for our customers.
Our revenue, Adjusted EBITDA, and net loss for the nine months ended March 31, 2015 were $1,030.3 million, $140.7 million, and $12.9 million, respectively. Our revenue, Adjusted EBITDA, and net loss for fiscal 2014 were approximately $1.4 billion, $178.8 million, and $24.2 million, respectively.
Our Opportunity
We believe that we are well-positioned to take advantage of the growing needs of our customers for our sophisticated capabilities and services within the large government market for IT and professional services.
Large addressable market that provides ample opportunity for us to grow. We estimate that the U.S. federal government spent approximately $125 billion in government fiscal year 2014 with third parties on the types of IT and professional services that we provide. We believe that this overall addressable market is poised to grow, as the administration’s fiscal year 2016 budget request proposes to increase IT spending by $2 billion, or 2.3%, across substantially all of our end markets over the 2015 budget request level. Due to the large size of the market and our estimated market share of 1.1% based on fiscal 2014 revenues, we believe that there are ample new business opportunities to drive revenue growth and take market share by leveraging the sophisticated nature of our capabilities. We also believe that we have a differentiated position in our addressable market due to our broad footprint across more than 150 agencies in the health, civil, intelligence, homeland security, law enforcement and defense end markets, which allows us to be selective with the opportunities that we pursue and to focus on segments that are experiencing growth.
Increased government demand for IT and professional services. We believe the federal government is in the process of transforming its IT infrastructure and software systems in order to increase efficiency and reduce expenses. For example, guidance from the OMB mandates that federal agencies transform their IT infrastructures to realize cost savings through data center consolidation and utilization of innovative technologies, such as cloud computing. In order to rapidly address this transformation by the most efficient available means, the federal government frequently engages professional services providers, like us, who have expertise in and focus on IT and related professional services. The capabilities and expertise we provide address the priority areas of IT investment for the federal government, including cloud computing, cybersecurity, and Agile-based software development methodologies. The government’s investment and increased spending in cloud computing is generating new opportunities in areas such as cloud readiness assessments, cloud deployment strategies, and integrated security solutions, including privacy and protection of data stored in the cloud. As a result, Deltek predicts that the market for cloud computing services will increase from $2.4 billion in government fiscal year 2015 to $6.5 billion in government fiscal year 2019, a CAGR of approximately 28%. In addition, evolving cyber
65
Table of Contents
threats, the pace of technological change, and increasing reliance on mobile solutions make cybersecurity a global priority and an imperative for our government customers. Deltek estimates that the market for non-classified cybersecurity services will grow to $10 billion by government fiscal year 2019.
Focus on higher growth end markets. Many of our end markets are forecasted by IDC to grow faster than overall government IT spending. Of note, 77% of our fiscal 2014 revenue is derived from the health, civil, intelligence, homeland security, and law enforcement agencies of the U.S. federal government. Within this market, health and civil agencies formed the largest component of federal government spending on IT, at $44 billion for government fiscal year 2014. Overall, the health and civil IT markets are forecasted by IDC to increase spending at a CAGR of 5.1% from government fiscal year 2014 to 2019, which compares to a CAGR of 2.6% for the administration’s 2016 DoD budget request over the same period. In particular, many of the largest and most sophisticated customers of our Health and Civil group are expected to experience even stronger IT spending growth over the same period, including IDC-forecasted CAGRs of 6.5% at the DoS, 8.5% at the HHS, and 9.5% at the VA.
Our Business Groups
Our company is organized into two business groups: Health & Civil (54% of revenue for fiscal 2014) and National Security (46% of revenue for fiscal 2014).
Health & Civil Group
Health
Health, which was the fastest growing component of our business in fiscal 2014, represented approximately 22% of our revenue for fiscal 2014. We believe demand for federal health IT services will continue to expand due to demographic trends, data privacy concerns, and the increased infrastructure required to support the Patient Protection and Affordable Care Act of 2010. We believe that we are well-positioned to take advantage of these trends in the federal health landscape, due to our extensive domain knowledge across key areas of the health market, combined with our technical expertise. We provide these combined IT services and domain expertise to a broad base of health customers through key contract vehicles and contracts that are used by health agencies to procure such services. Our primary customers in the health market include the HHS operating divisions, such as the National Institutes of Health, Health Resources and Services Administration, the Centers for Disease Control and Prevention, the Centers for Medicare and Medicaid Services, and the Food and Drug Administration, as well as the VA and other military health customers.
Civil Agencies
Revenue earned from our civil government business represented approximately 32% of our revenue for fiscal 2014. We believe we have a differentiated position in the civilian market due to our broad footprint across civilian agencies, which allows us to be selective with the opportunities that we pursue and to focus on high growth areas. Our current work includes contracts supporting the Department of Agriculture, the DoS, the Department of Transportation, the Environmental Protection Agency, the Department of Energy, and the Government Accountability Office, among many others.
National Security Group
Intelligence, Homeland Security, and Law Enforcement
We derived approximately 23% of our revenue in fiscal 2014 from customers in the intelligence, homeland security, and law enforcement market. This market has an ongoing need for sophisticated solutions to help
66
Table of Contents
protect the nation from terrorist and other attacks and to carry out core functions, such as transportation security, cybersecurity, counter-terrorism, enforcement and administration of our immigration laws, intelligence analysis, disaster preparedness, and border security. We believe our differentiated expertise in this market lies in our ability to apply analytical, IT-enabled approaches to evaluate and counteract terrorist networks, criminal groups, and other organizations that represent a threat to national security. We believe that our experience addressing these challenges and our extensive team of experts with requisite security clearances have solidified our position as a leader in this market. Our primary customers in this market include agencies and organizations within the U.S. Intelligence Community, DHS, Department of Justice, and a limited number of state and local law enforcement agencies.
Defense
Our defense business represented approximately 23% of our revenue for fiscal 2014. Within the defense market, we are predominantly focused on technically complex and mission-critical services that have disproportionate government focus and spending, including special forces organizations and joint commands that support high-profile missions. As a result we believe we face fewer government award determinations based solely on price as compared to the broader defense market. In addition, we have limited exposure to areas that face pressure from the drawdown of troops overseas, including OCO spending, which accounted for less than 2% of our revenue in fiscal 2014. Our key customers in the defense market include the U.S. Air Force, U.S. Navy, U.S. Army, U.S. Marine Corps, U.S. European Command, U.S. Africa Command, U.S. Special Operations Command, and a number of other Unified Combatant Commands and joint operations, as well as independent defense agencies.
Our Core Capabilities
We strive to be a trusted partner to government agencies, supporting their most important IT programs on an outsourced basis, so that they can achieve their missions more effectively, while also increasing efficiency and reducing expenses. We maintain technical talent across all of our core capabilities, including software and systems development, infrastructure services, cloud computing and migration services, cybersecurity, business intelligence and big data, and mobile solutions. We also have in-house personnel that provide domain-specific expertise and professional services in key areas of focus for the federal government. In order to deliver the most effective solutions as quickly and efficiently as possible, we organize our technical talent into both customer-focused groups and capability-based groups, ensuring that all of our customers have access to our strongest talent and best technical solutions. We believe this organization enhances our ability to provide advanced and differentiated capabilities throughout our customer portfolio. Our Core Capabilities include:
| • | Software and Systems Development. We leverage advanced software practices, architectures, and technologies to deliver customized solutions for our customers that meet the challenges of expanding data sets, mobile work forces and domain-specific requirements. For example, SRA took over modernization efforts for DHS Customs and Border Protection’s, or CBP’s, automated cargo environment in 2014. This large, complex system manages the import and export processes for all cargo entering and exiting the United States. By employing Agile-based methodologies, including SRA’s Agile for Gov® solution, we helped CBP develop an electronic data interchange and improved CBP’s capabilities in message processing, account management, daily/monthly statements, and workflow for inspectors. |
| • | Infrastructure and Cloud Services. We help our customers transform and manage their IT infrastructure solutions to meet growing data storage and access needs by providing cloud computing services, mobile solution development, data center consolidation and management, and networks, server and storage engineering. For example, AcuITy Insightful Solutions®, or AcuITy, is our award-winning approach to IT strategic planning. AcuITy is a tool we have developed in order to save our customers time and effort in their IT investment decision making. To date, several of our customers, including the U.S. courts, the Army National Guard and the National Institutes of Health, have utilized AcuITy to incorporate their unique objectives, budget considerations, and mission priorities into a decision |
67
Table of Contents
| framework developed with our institutional knowledge, expertise, and proprietary empirical data. AcuITy generates a customer-specific roadmap, optimizing the efficiency and effectiveness with which our customers can deploy IT investment. |
| • | Cybersecurity. We meet the growing needs of our government customers to implement and improve cybersecurity capabilities by designing and implementing cybersecurity solutions. We have more than 14 years of computer network defense and operations experience and we currently operate some of the largest cybersecurity operations centers within the U.S. federal government, positioning us to assist our customers with evolving threats. For example, since 2008 we have provided a secure worldwide cyber environment for the DoS, Diplomatic Security. We provide comprehensive cyber protection services that focus on strengthening the overall DoS cyber capability through technical, engineering, management, operational, logistical, and administrative support. In doing so, we align cybersecurity activities and policies in a mission-integrated manner to enhance cyber intelligence and insider threat programs using a number of diverse tools and solutions, including security information and event management and portal security solutions. |
| • | Domain-Specific Services. We provide a broad array of differentiated domain-specific professional services including intelligence analysis, bioinformatics and health sciences, energy and environmental consulting, and enterprise planning and resource management. Our experts apply their extensive domain knowledge to help organizations better understand and address challenges and meet mission requirements. For example, our research scientists and public health specialists work collaboratively with HHS federal research and public health organizations providing bioinformatics, high throughput computing big data analytics, and disease surveillance and epidemiology services aimed at enhancing the pursuit of disease detection, prevention, treatment, and outbreak response. |
Our Strengths
We believe the following are our key strengths:
Strong presence in attractive end markets. We believe that our contract mix is focused on the most attractive end markets within our estimated $125 billion addressable market. In fiscal 2014, we generated approximately 77% of our revenue from the health, civil, intelligence, homeland security, and law enforcement end markets and approximately 23% of our revenue from the defense end market, where we focus on technically complex IT services with long-term demand drivers. The health and civil IT markets are forecasted by IDC to grow at a CAGR of 5.1% from government fiscal year 2014 to 2019, approximately twice the forecasted growth in the administration’s 2016 DoD budget request over the same period. In addition, less than 2% of our fiscal 2014 revenue was derived from the declining portion of the defense end market tied to OCO funding.
Diversified base of customers and contracts. Our revenue is diversified across more than 900 unique contracts, with no single government agency representing more than 10% of revenue and no single contract representing more than 5% of revenue for the nine months ended March 31, 2015. Our broad array of GWACs and ID/IQ contract vehicles allows us to pursue opportunities across the vast majority of the departments of the U.S. government we serve, which we believe positions us well to capture new business.
Trusted partner with longstanding relationships across broad customer base. During our nearly 40-year history, we have established deep and enduring relationships across our key customers, serving many of our over 150 customer agencies for more than 20 years. Our workforce is highly integrated with the operations of our customers, with a majority of our professionals working on-site alongside the customers they serve. These relationships afford us differentiated insight into the IT and domain-specific needs of our customers and allow us to engage with customers long before a formal RFP for a new procurement is ever released. Today, our approach to pursuing new business opportunities includes pre-RFP engagement of 12-18 months, during which time our customers may consider our input as they define the breadth and scope of their long-term IT plans, and the requirements to be solicited.
68
Table of Contents
Extensive business development capabilities. Since 2011, we have nearly doubled headcount in our business development functions, while also reorganizing our resources to more effectively pursue and win new business in our target markets. We believe this investment will continue to yield meaningful growth opportunities going forward. For example, we increased the volume of bids we submitted for new prime contract opportunities from approximately $2.2 billion in fiscal 2011 to approximately $6.1 billion in fiscal 2015. At the same time, we have made investments to increase the quality of our contract bids, and, as a result, new business wins have increased from $334 million in fiscal 2012 to $559 million in the twelve month period ended March 31, 2015.
Attractive business model with strong free cash flow conversion. Our business model is characterized by long-term revenue visibility, attractive margins, and strong free cash flow conversion. We operate our business through multi-year contracts that generally range from three to seven years. As a result, we have a $3.2 billion total backlog as of March 31, 2015, which represents approximately 2.3 times fiscal 2014 revenue. We achieved a 13.1% Adjusted EBITDA margin for the nine months ended March 31, 2015, among the highest among our public company peers in our industry, due to the sophisticated nature of our work, our attractive contract mix, and our efficient operating focus. We also have low capital needs, with capital expenditures representing less than 1% of revenue in each of the last three fiscal years and minimal working capital requirements. These factors have allowed us to generate approximately $387 million of cash available for debt reduction or acquisitions since the Providence Acquisition in July 2011.
High-performance culture and management team. Our enduring values of Honesty and Service® have been in place since our inception and represent our commitment to acting with integrity, delivering quality work and customer satisfaction, taking care of our employees, and serving our country and communities. We are inspired by our customers’ missions and provide who we believe are the best people, working together to generate the best ideas and deliver the best possible performance. We have built upon that foundational culture since 2011 by investing in leadership development programs that extend several layers into our organizational structure. In recent years, we have promoted many strong performers into new leadership roles, resulting in an average tenure of over 11 years among our senior management team. In the process, we have cultivated what we believe is a powerful culture focused on providing value to our customers, hard results, enterprise growth, and cost efficiency.
Our Strategy
The key elements of our growth strategy are to:
Invest in growth. We continue to invest in our business development capabilities and other drivers of growth in order to capitalize on opportunities to increase our market share within our large addressable market. We approach new business opportunities with a rigorous pursuit process, ensuring effective customer engagement and customer understanding of our sophisticated IT and professional services. We leverage the extensive customer knowledge and relationships of our business development professionals to position ourselves for new business opportunities well in advance of the release of an RFP, which we have found greatly improves our chances of success. Through these efforts, we increased the volume of new contract opportunities for which we submitted bids from $2.2 billion in fiscal 2011 to $6.1 billion in fiscal 2015. In addition, new business wins have increased from $334 million in fiscal 2012 to $559 million in the twelve month period ended March 31, 2015.
Maintain a rigorous opportunity selection process. We aim to identify the most attractive new business opportunities across all of our end markets. A strong team of business development professionals, combined with our nearly 40-year history in the industry and deep customer knowledge, enables us to evaluate whether an opportunity meets certain key criteria early in the pipeline qualification process. Our strategy is to identify new business pursuits which do not have an incumbent provider, or whose existing provider may be vulnerable to competition, or where we have a long history with the customer. We also look for opportunities to differentiate our proposals with technical merit, either in the form of an innovative technology solution or a unique deployment methodology that is particularly well-suited to the customer’s needs. We specifically avoid bidding on contract opportunities that have established low price as the primary award criterion.
69
Table of Contents
Focus on priority end markets. A key element of our opportunity selection process is the prioritization of investments in the fastest growing end markets for our services, including health, civil, intelligence, homeland security, and law enforcement agencies. We believe our past performance and customer relationships across a broad number of these agencies position us favorably in our pursuit of new business opportunities. We also leverage our broad footprint and our array of GWAC and ID/IQ contract vehicles, which give us access to what we consider the most attractive end markets while also generally narrowing the competition for task orders.
Invest in our core capabilities and technology. We continue to invest in our core capabilities and technology in order to deliver the most effective and efficient solutions to our customers and further differentiate ourselves. We have established capability centers across our organization, which are focused on institutionalizing best practices, methodologies, technology, and knowledge of the federal environment. Our capability centers allow us to develop sophisticated offerings that we can provide across large portions of our customer base, differentiating us from our competitors and enabling our project teams to utilize best practices and continually introduce innovation to our existing customers. Our capability centers encompass the following areas of expertise: infrastructure and cloud, cybersecurity and privacy, software development and Agile-based services, data analytics and business intelligence, user experience, and mobility and collaboration.
Execute with efficiency. We continue to seek operational improvements to maximize efficiency across both our customer-facing and back office operations, which is a critical component of our competitiveness and margin growth. In fiscal 2012 and 2013, we streamlined our selling, general and administrative costs in the areas of facilities, fringe benefits and indirect labor while increasing our investment in our growth capabilities. In fiscal 2014 and 2015, we continued those efforts and broadened our efficiency initiatives by instituting continuous improvement programs to better manage direct costs. These programs will be deployed on an ongoing and regular basis in order to drive continued operating efficiency.
Identify and pursue strategic acquisition opportunities. As a complement to our organic growth initiatives, we will continue to pursue selective acquisitions to enhance our offerings, expand our customer footprint, and increase our scale. Key selection criteria for potential acquisitions include customer relationships, capabilities and financial performance, as well as our ability to enhance these characteristics through our own business development capabilities and technical expertise as well as any cost efficiencies that come from the potential combination. Over the last four years, we completed two tuck-in acquisitions that allowed us to enhance our capabilities and expand our footprint with key government customers, including defense health agencies, DHS, and specialized portions of the U.S. Intelligence Community.
Employees
As of June 30, 2015, we had approximately 5,600 employees, up from approximately 5,200 as of June 30, 2014. Our success as an IT and strategic consulting services and solutions company is highly dependent on our ability to attract, develop and retain highly educated and skilled employees, who in many cases, hold security clearances. Our professional staff is highly educated, with approximately 33% of our employees holding advanced degrees. We currently have no employees represented by collective bargaining agreements.
Marketing & Sales
We market our services primarily to the U.S. federal government through a rigorous business development process, portions of which are driven by our centralized Marketing & Sales organization and others of which are owned by our business groups. Business groups are responsible for smaller bids and for the early phases of larger new business pursuits, during which time existing customer relationships and engagement are particularly beneficial. The centralized Marketing & Sales team, which includes a Proposal Service Center and Corporate Pricing organization, takes ownership of the later stages of the bid process for larger opportunities, in which proposal materials are drafted and produced. Throughout the new business and recompete pursuit process,
70
Table of Contents
experts in relevant technology and capabilities from both the business groups and the centralized Marketing & Sales team contribute ideas and best practices to enhance the solutions we intend to propose to our customer. This cooperative approach to business development leverages the critical customer understanding of the operating groups and the comprehensive process expertise of our centralized Marketing & Sales organization in order to develop solutions tailored to our customers’ requirements, and to qualify and position ourselves for new business opportunities with rigor and well in advance of the release of an RFP, improving our chances of success.
Over the past several years, we have invested significant resources in expanding and improving our marketing and sales capabilities. We have completed a number of new initiatives, including implementing a competitive market intelligence and pricing capability; increasing our bid and proposal budgets for early-phase new business pursuit activities; bolstering the business development teams in our business groups; significantly increasing our proposal submittal targets and capacity; and focusing more of our resources on large opportunities. We have also established new training programs to broaden and enhance the level of marketing and sales expertise in our operating groups and have created more technical connectivity and collaboration through the establishment of Communities of Practice, or CoPs. Our CoPs enable subject matter experts and technology practitioners to connect and collaborate in order to cultivate and exploit the best ideas, practices, and solutions from across our company and our technology partners. We believe that the expanded size and enhanced skillsets of our marketing and sales teams have increased the size, and improved the quality, of our opportunity pipeline, as well as our ability to address it.
Competition
We compete on the merits of our technical capabilities and mission understanding, our ability to recruit, build and lead strong teams, and our ability to deliver innovative solutions in an efficient and effective manner. Although we specifically avoid bidding on procurements that have established low price as a primary award criterion, we are cost competitive. Our ability to compete is dependent on our reputation with our customers, our past performance, and access to the appropriate GWACs and ID/IQ contracts. Our competitors include pure-play federal services firms, diversified service providers, divisions of large aerospace and defense, or A&D, firms, and other niche companies, including those receiving advantages under Small Business Administration programs. In an effort to remain competitive and to ensure that we are well postured for future growth, we routinely reassess our corporate strategy, our organizational structure and operating model, our pricing, our focus markets and capabilities, and our employee skills and certifications.
Examples of our competitors include:
| • | Federal services firms such as Booz Allen Hamilton Inc., CACI International Inc., Leidos, Inc., and Science Applications International Corporation |
| • | Diversified services providers such as Accenture Ltd., Deloitte Consulting, LLP, Computer Sciences Corporation, and International Business Machines Corporation |
| • | Divisions of large aerospace and defense contractors such as General Dynamics Corporation, L-3 Communications, Lockheed Martin Corporation, Northrop Grumman Corporation, and Raytheon Company |
Regulatory Matters
U.S. Government Contracts
The vast majority of our business consists of contracts with the U.S. government, which has a highly structured and regulated competitive procurement process. Our U.S. government contracts are funded by agency budgets that operate on an October-to-September fiscal year. In February or March of each year, the President of the United States presents to Congress the budget for the upcoming fiscal year. This budget proposes funding levels for every federal agency and is the result of months of policy and program reviews throughout the
71
Table of Contents
executive branch. From February or March through September of each year, the appropriations and authorization committees of Congress review the President’s budget proposals and establish the funding levels for the upcoming fiscal year. Once these levels are enacted into law, the Executive Office of the President administers the funds to the agencies. If Congress is unable to agree on budget priorities and is unable to pass the annual budget on a timely basis, a continuing resolution is typically enacted. A continuing resolution generally allows government agencies to operate at spending levels approved in the previous budget cycle; however, this may delay funding on some of our current programs and possible future contract awards. Further, in some instances, Congress may not enact a continuing resolution which could lead to significant non-reimbursable costs. Due to the structure of the federal budget process, our federal government contracts are typically not fully funded at inception even though these contracts may extend several years into the future. These longer term contracts may also include option years which may not be exercised. Additionally, federal government contracts, by their terms, generally can be terminated at any time by the federal government, without cause, for the convenience of the government. If such a contract is terminated for convenience, we would typically be entitled to receive compensation for the services provided and costs incurred through the time of termination, plus settlement expenses and a negotiated amount of profit. However, federal government budget pressures may constrain our ability to recover costs associated with terminations for convenience.
When working with U.S. government agencies and entities, we must comply with laws and regulations relating to the formation, administration, and performance of contracts. The FAR, which mandates uniform policies and procedures for U.S. government acquisitions and purchased services, governs the majority of our contracts. Individual agencies also have acquisition regulations that may provide implementing language for acquisitions or that supplement the FAR, with which we must also comply.
Other federal regulations (a) require certification and disclosure of cost or pricing data in connection with contract negotiations; (b) govern reimbursement rights under cost-based contracts; and (c) restrict the use, dissemination and exportation of products and information for national security purposes. In some cases, these regulations allow the government significant visibility into our financial data. While this is customary in federal government contracting, it may limit the overall profit margins in our business as compared to companies serving customers other than the federal government. However, compliance with these regulations may serve as a barrier to entry for firms that are not experienced in government contracting. Also, in comparison with commercial markets, the federal contracting business typically involves longer-term revenue visibility and higher certainty of revenue collection.
For more information on risks relating to U.S. government contracts, see “Risk Factors.”
Prime Contracts and Subcontracts
We were the prime contractor on contracts representing 91%, 90%, and 91% of our total revenue for the fiscal years ended June 30, 2012, 2013, and 2014, respectively. When we act as a prime contractor, we derive revenue primarily through our own direct labor services, but also through the efforts of our subcontractors. As part of the contract bidding process, we may enter into teaming agreements with subcontractors to enhance our ability to bid on large, complex contracts or to more completely address a particular customer’s requirements. When we are the prime contractor on a contract, we are ultimately responsible for the overall contract as well as the performance of our subcontractors. Operating as a prime contractor generally positions us to establish better customer relationships, exert more control and influence over results, have clearer visibility into future opportunities, and typically earn higher profit margins on our labor. Serving as the prime contractor also subjects us to additional risks and responsibilities. See “Risk Factors” for further discussion.
Single Award Contracts
Under single award contracts with defined statements of work, an agency solicits, qualifies, and then requests proposals from interested contractors. The agency then evaluates the bids and typically awards the
72
Table of Contents
contract to a single contractor for a specified service. Single award federal government contracts accounted for approximately 28%, 34%, and 38% of our total revenue for the fiscal years ended June 30, 2012, 2013, and 2014, respectively.
Multiple Award Contracts
Under ID/IQ contracts, a federal government agency can form preferred provider relationships with one or more contractors. This category includes agency-specific ID/IQ contracts, BPAs, GWACs, and GSA schedule contracts. These umbrella contracts, often referred to as vehicles, outline the basic terms and conditions under which federal government agencies may order services. ID/IQ contracts are typically managed by one sponsoring agency, and may be either for the use of a specific agency or available for use by any other agency of the federal government. ID/IQ contracts designated by the OMB for use by any agency of the federal government are referred to as GWACs.
Contractors within the industry compete to be pre-selected to perform work under an ID/IQ contract. An ordering agency then issues delivery orders, commonly known as task orders, for services to be performed under the contract. If the ID/IQ contract has a single prime contractor, only that contractor may be awarded delivery orders. If the contract has multiple prime contractors, the award of each delivery order typically will be competitively determined among the pre-selected contractors.
GSA schedule contracts contain listings of commercial services and products, along with their respective prices. The schedules are maintained by the GSA for use by any federal agency or other authorized entity, including state and local governments. When an agency selects services under a GSA schedule contract, the competitive process is limited to qualified GSA schedule contractors.
Due to the lower contract procurement costs, reduced procurement time, and increased flexibility associated with multiple award contracts, these vehicles have been utilized frequently in the last decade and are held by many contractors. Agency-specific ID/IQs have become increasingly prevalent, particularly in the Defense Department. Access to the relevant vehicles is critical for contractors intending to do business with a specific agency. Task orders under multiple award contracts, including ID/IQs, BPAs, and GSA schedule contracts, accounted for approximately 72%, 66%, and 62% of our total revenue for the fiscal years ended June 30, 2012, 2013, and 2014, respectively.
Contract Types
Contracts with our federal government customers generally have one of three types of price structures: cost-plus-fee, time-and-materials, and fixed-price.
| • | Cost-plus-fee contracts. Cost-plus-fee contracts provide for reimbursement of allowable costs and the payment of a fee, which is our profit. The fee may be fixed or it may vary and be awarded to the contractor based on performance. |
| • | Time-and-materials contracts. Time-and-materials contracts provide a fixed hourly rate for each direct labor hour expended plus reimbursement of allowable material costs and out-of-pocket expenses. |
| • | Fixed-price contracts. Fixed-price contracts provide a pre-determined fixed price for specified products and/or services. To the extent our actual costs vary from the estimates upon which the price was negotiated, we will generate more or less than the anticipated amount of profit or could incur a loss. |
Each of these contract types presents advantages and disadvantages. Cost-plus-fee contracts generally subject us to lower risk. However, not all costs are reimbursed under these types of contracts, and the government carefully reviews the costs we charge. In addition, negotiated base fees on cost-plus-fee contracts are generally
73
Table of Contents
lower than projected profits on fixed-price or time-and-materials contracts, consistent with our lower risk. Under time-and-materials contracts, we are also generally subject to lower risk compared to fixed-price contracts; however our profit may vary if actual labor hour costs vary significantly from the negotiated rates. Fixed-price contracts typically involve the highest risk and as a result have higher fee levels and offer us additional profits if we can complete the work for less than the contract amount. However, fixed-price contracts require that we absorb cost overruns, should they occur.
Contract profit margins are generally affected by the type of contract. An important part of growing our operating margin is to increase the amount of services delivered under fixed-price contracts, which present more risk to deliver, but may result in higher profit. The following table summarizes our historical contract mix, measured as a percentage of total revenue, for the periods indicated.
| Combined | Successor | |||||||||||||||
| Fiscal Year Ended June 30, 2012 |
Fiscal Year Ended June 30, 2013 |
Fiscal Year Ended June 30, 2014 |
Nine Months Ended March 31, 2015 |
|||||||||||||
| Cost-plus-fee |
32 | % | 30 | % | 30 | % | 27 | % | ||||||||
| Time-and-materials |
36 | % | 35 | % | 36 | % | 39 | % | ||||||||
| Fixed-price |
32 | % | 35 | % | 34 | % | 34 | % | ||||||||
Backlog
Backlog represents the estimated amount of future revenue to be recognized under existing contracts and includes funded and unfunded orders. For additional discussion of backlog, see “Management’s Discussion and Analysis of Financial Condition and Results of Operations—Key Metrics—Submittals, Awards, Book-to-Bill, and Backlog.”
Seasonality
See “Management’s Discussion and Analysis of Financial Condition and Results of Operations—Seasonality” for a discussion of the seasonality of our business.
Properties
We lease our office facilities. At June 30, 2014, we had approximately 1.2 million square feet of floor space at approximately 49 separate locations, primarily in the U.S., with facilities located in 16 states and the District of Columbia.
We have leased our corporate headquarters at 4300 Fair Lakes Court in Fairfax, Virginia since 1991. The lease for its headquarters expires on December 31, 2015. In May 2013, we entered into a ten year lease agreement to move from our Fairfax, Virginia corporate headquarters to a new location in Chantilly, Virginia at the end of calendar year 2015.
Environmental Matters
Our business is subject to various federal, foreign, state, and local environmental protection laws and regulations. Failure to comply with these laws could result in civil or criminal sanctions, including fines, penalties, suspension or debarment from contracting with the U.S. government. Some environmental laws hold current or previous owners or operators of businesses and real property liable for contamination, even if they did not know of and were not responsible for the contamination.
74
Table of Contents
Environmental laws may also impose liability on any person who disposes, transports, or arranges for the disposal or transportation of hazardous substances to any site. We do not currently anticipate that the costs of complying with, or the liabilities associated with, environmental laws will materially adversely affect us, but we cannot assure that we will not incur material costs or liabilities in the future.
Intellectual Property
The majority of our revenue is earned through our technical services, which we believe are generally not dependent upon patent protection. Our intellectual property portfolio is limited and includes trade secrets as well as trademarks, copyrights, and patents. We occasionally license software and other technology protected by license agreements and trade secret and copyright law. We do not typically license our patents to customers. Other than licenses to commercially available software, we do not believe that any of our licenses to third-party intellectual property are material to our business taken as a whole.
Legal Proceedings
We are subject to investigations, audits, and reviews relating to compliance with various laws and regulations with respect to our role as a contractor to agencies and departments of the U.S. Government, state, local, and foreign governments, and otherwise in connection with performing services in countries outside of the United States. Such matters can lead to criminal, civil, or administrative proceedings, and we could be faced with penalties, fines, payments, or compensatory damages. Adverse findings could also have a material adverse effect on us because of our reliance on government contracts. We are subject to periodic audits by state, local, and foreign governments for taxes. We are also involved in various claims, arbitrations, and lawsuits arising in the normal conduct of our business, including but not limited to bid protests, various employment litigation matters, contractual disputes, and charges before administrative agencies. Although we can give no assurance, based upon our evaluation and taking into account the advice of legal counsel, we do not believe that the outcome of any such matter would likely have a material adverse effect on our consolidated financial position, results of operations, or cash flows.
75
Table of Contents
Directors and Executive Officers
The following table sets forth certain information concerning our executive officers and board of directors. The age of each individual is as of June 30, 2015.
| Name | Present Positions |
Age | ||
| William L. Ballhaus |
President, Chief Executive Officer, Director | 47 | ||
| David F. Keffer |
Executive Vice President, Chief Financial Officer | 37 | ||
| Clyde T. Nixon |
Executive Vice President, Chief Growth Officer | 61 | ||
| Paul Nedzbala |
Executive Vice President, Health & Civil Group | 51 | ||
| George Batsakis |
Executive Vice President, National Security Group | 51 | ||
| Timothy J. Atkin |
Executive Vice President, Chief Administrative Officer, and Chief of Staff | 52 | ||
| Ernst Volgenau |
Chairman of the Board of Directors | 81 | ||
| Charles E. Gottdiener |
Director | 50 | ||
| Christopher C. Ragona |
Director | 43 |
Executive Officers
William L. Ballhaus joined us in July 2011 as our president and chief executive officer as well as a member of our board of directors. Previously, Dr. Ballhaus served as chief executive officer, president, and a director of DynCorp International from 2008 to 2010 and as president of BAE Systems Network Systems, National Security Solutions and Mission Solutions businesses from 2003 to 2008.
David F. Keffer has served as our executive vice president and chief financial officer since May 2014. Mr. Keffer joined the company’s Financial Planning & Analysis team in 2003. He served as Director of Investor Relations and Vice President from 2006 to 2009 before gaining experience as a Strategic Acquisition Executive in SRA’s Corporate Growth organization. From 2011 to 2013, he was the CFO of our National Security Sector. From 2013 to 2014 he was vice president and corporate controller. Mr. Keffer began his career at Navigant Consulting and Maden Tech Consulting.
Clyde T. Nixon was named our executive vice president and chief growth officer in December 2013. Prior to his current role, Mr. Nixon served as vice president of the Health Group’s Growth organization where he was responsible for expanding SRA’s footprint in the federal health market. Prior to joining SRA in 2012, Mr. Nixon served as vice president of Marketing and Business Development for SAIC’s Defense Solutions Group from October 2010 to April 2012. He also held several operations positions, including senior vice president and general manager of the Technology Systems Division of BTG.
Paul Nedzbala is executive vice president of our Health & Civil Group. Previously, Mr. Nedzbala was the senior vice president of our Civil group from June 2013 to December 2013 and prior to that was the senior vice president for the Health Group from July 2012 to June 2013. Mr. Nedzbala held multiple leadership roles in both SRA’s former Health and Civil Government groups, where he was responsible for generating significant growth in these markets. He joined SRA as part of our acquisition of Constella Group, LLC, in 2007 where he had served as Chief Operating Officer for the Constella Health Sciences business unit, providing solutions in support of U.S. domestic health agencies. Prior to Constella, Mr. Nedzbala served in various leadership roles with United Information Systems, including Vice President of IT Services. He also served as Program Manager for the Washington Consulting Group, where he led a team of software engineers in supporting IT initiatives for the National Institutes of Health.
George Batsakis is executive vice president of our National Security Group. Mr. Batsakis joined SRA in 2007 from Northrop Grumman, where he served as an operating unit vice president and led business development
76
Table of Contents
activities for a Defense and Intel C4ISR unit of Northrop Grumman Mission Systems. Prior to that, he held increasingly responsible positions in information technology; communications and networking; and logistics systems at Electronic Data Systems (EDS) and Teledyne Industries, Inc. Mr. Batsakis is a former U.S. Army Infantry officer who served in various command and staff positions through the field grade.
Timothy J. Atkin was named our executive vice president, chief administrative officer and chief of staff in December 2012. Previously, Mr. Atkin was an executive vice president and chief operating officer from December 2008 to December 2012. Previously, he managed our Global Health business from December 2007 to December 2008 and our Civil Government business from July 2004 to December 2007. Mr. Atkin also started our homeland security and critical infrastructure protection programs. Before joining SRA, Mr. Atkin was a member of the U.S. government Senior Executive Service and Chief of Staff to the Deputy Secretary of the Department of Labor. He was also a director at the National Security Council and served with the U.S. Coast Guard.
Board of Directors
Ernst Volgenau is our founder and has served as the chairman of our board of directors since October 2003. He served as our chief executive officer from October 2003 until December 2004. From 1978 to October 2003, he served as our president and as a director. From 1976 to 1978, he served as the director of inspection and enforcement for the U.S. Nuclear Regulatory Commission. Dr. Volgenau retired from active duty with the U.S. Air Force with the rank of Colonel in 1976. His military service included positions in the Office of the Secretary of Defense and as director of data automation for the Air Force Logistics Command.
Charles E. Gottdiener has served as one of our directors since February 2013 and is the Chief Operating Officer and a managing director of Providence. Mr. Gottdiener is currently a director of Altegrity. Altegrity filed a voluntary petition for relief under Chapter 11 of the Bankruptcy Code in February 2015. Prior to joining Providence in 2010, Mr. Gottdiener spent seven years at Dun & Bradstreet, where he served in a number of strategy and operating roles, including as president of the global risk, analytics and internet solutions business unit. Mr. Gottdiener received a Master of Business Administration from the Wharton School of the University of Pennsylvania and a Bachelor of Arts from Grinnell College.
Christopher C. Ragona has served as one of our directors since July 2011 and is a managing director of Providence. Mr. Ragona is currently also a director of Altegrity, EdgeConneX and Q9 Networks. Altegrity filed a voluntary petition for relief under Chapter 11 of the Bankruptcy Code in February 2015. Prior to joining Providence in 2007, Mr. Ragona was a vice president with GTCR. Mr. Ragona received a Master of Business Administration from the Stanford Graduate School of Business and a Bachelor of Arts from Duke University.
Board Composition and Director Independence
Our board of directors is composed of four directors. Prior to the completion of this offering, we expect to increase the size of our board and appoint additional directors, including one or more independent directors to comply with the requirements of . Our amended and restated certificate of incorporation will provide for a classified board of directors, with members of each class serving staggered three-year terms. We will have directors in Class I ( ), directors in Class II ( ) and directors in Class III ( ). Any additional directorships resulting from an increase in the number of directors will be distributed among the three classes so that, as nearly as possible, each class will consist of one-third of the directors. See “Description of Capital Stock—Anti-Takeover Effects of our Certificate of Incorporation and By-Laws—Classified Board of Directors.”
In addition, under the amended stockholders agreement, the PEP Funds will have the right to designate nominees for our board of directors, and Dr. Volgenau will have the right to designate one nominee for our board of directors, subject, in each case, to certain conditions. See “Certain Relationships and Related Party Transactions—Stockholders Agreements.”
77
Table of Contents
The number of members on our board of directors may be fixed by resolution adopted from time to time by the board of directors. Subject to our amended stockholders agreement, any vacancies or newly created directorships may be filled only by the affirmative vote of a majority of directors then in office, even if less than a quorum, or by a sole remaining director. Each director shall hold office until his or her successor has been duly elected and qualified, or until his or her earlier death, resignation, or removal.
With respect to any vacancy of a director designated by the PEP Funds, the PEP Funds will have the right to designate a new director for election by a majority of the remaining directors then in office.
Our board of directors has determined that are “independent” as defined under the rules of and the Exchange Act, and rules and regulations promulgated thereunder.
Legal Proceedings
Messrs. Ragona and Gottdiener served as directors of Altegrity, when on February 8, 2015 Altegrity and all of its direct and indirect domestic subsidiaries filed voluntary petitions under Chapter 11 of the United States Bankruptcy Code. Except as set forth above with respect to these Chapter 11 cases, no director, executive officer, significant employee or control person of the Company has been involved in any legal proceeding listed in Item 401(f) of Regulation S-K in the past ten years.
Controlled Company
After the completion of this offering, we anticipate that the PEP Funds and Dr. Volgenau will control a majority of the voting power of our outstanding common stock. The PEP Funds and Dr. Volgenau will collectively own approximately % of our common stock (or approximately % if the underwriters exercise in full their option to purchase additional shares) after the completion of this offering. Accordingly, we expect to qualify as a “controlled company” within the meaning of the corporate governance standards. Under the rules, a company of which more than 50% of the voting power is held by an individual, group, or another company is a “controlled company” and may elect not to comply with certain corporate governance standards, including:
| • | the requirement that a majority of the board of directors consist of independent directors; |
| • | the requirement that our nominating and corporate governance committee be composed entirely of independent directors with a written charter addressing the committee’s purpose and responsibilities; |
| • | the requirement that we have a compensation committee that is composed entirely of independent directors with a written charter addressing the committee’s purpose and responsibilities; and |
| • | the requirement for an annual performance evaluation of the nominating and corporate governance and compensation committees. |
Following this offering, we intend to utilize these exemptions. Accordingly, you may not have the same protections afforded to shareholders of companies that are subject to all of the corporate governance rules and requirements of . The “controlled company” exception does not modify audit committee independence requirements of Rule 10A-3 under the Exchange Act and the rules.
Board Committees
Our board of directors maintains an Audit and Finance Committee, a Compensation and Personnel Committee, and a Governance Committee. Under the rules, we will be required to have one independent director on our Audit Committee during the 90-day period beginning on the date of effectiveness of the registration statement filed with the SEC in connection with this offering. After such 90-day period and until one year from the date of effectiveness of the registration statement, we are required to have a majority of
78
Table of Contents
independent directors on our Audit Committee. Thereafter, our Audit Committee is required to be composed entirely of independent directors. As a “controlled company,” we are not required to have independent Compensation or Nominating and Corporate Governance Committees. The following is a brief description of our committees.
Audit and Finance Committee
Our Audit and Finance Committee is responsible, among its other duties and responsibilities, for overseeing our accounting and financial reporting processes, the audits of our financial statements, the qualifications and independence of our independent registered public accounting firm, the effectiveness of our internal control over financial reporting, and the performance of our internal audit function and independent registered public accounting firm. Our Audit and Finance Committee reviews and assesses the qualitative aspects of our financial reporting, our processes to manage business and financial risks, and our compliance with significant applicable legal, ethical, and regulatory requirements. Our Audit and Finance Committee is directly responsible for the appointment, compensation, retention, and oversight of our independent registered public accounting firm. The charter of our Audit and Finance Committee will be available without charge on the investor relations portion of our website upon completion of this offering.
Prior to the completion of this offering, the members of our Audit Committee are expected to be (chairperson), , and . Our board of directors has designated as an “audit committee financial expert,” and each of the members has been determined to be “financially literate” under the rules. Our board of directors has also determined that are “independent” as defined under the applicable rules and the Exchange Act and rules and regulations promulgated thereunder.
Compensation and Personnel Committee
Our Compensation and Personnel Committee is responsible, among its other duties and responsibilities, for reviewing and approving all forms of compensation to be provided to, and employment agreements with, the executive officers and directors of our company and its subsidiaries (including the chief executive officer), establishing the general compensation policies of our company and its subsidiaries and reviewing, approving and overseeing the administration of the employee benefits plans of the company and our subsidiaries. Our Compensation and Personnel Committee also periodically reviews management development and succession plans. The charter of our Compensation and Personnel Committee will be available without charge on the investor relations portion of our website upon completion of this offering.
Prior to the completion of this offering, the members of our Compensation and Personnel Committee are expected to be (chairperson), , and . In light of our status as a “controlled company” within the meaning of the corporate governance standards of the following this offering, we are exempt from the requirement that our Compensation and Personnel Committee be composed entirely of independent directors under listing standards applicable to membership on the Compensation and Personnel Committee, with a written charter addressing the committee’s purpose and responsibilities and the requirement that there be an annual performance evaluation of the Compensation and Personnel Committee. We intend to establish a sub-committee of our Compensation and Personnel Committee consisting of and for purposes of approving any compensation that may otherwise be subject to Section 162(m) of the Internal Revenue Code of 1986, as amended.
Governance Committee
Our Governance Committee is responsible, among its other duties and responsibilities, for identifying and recommending candidates to the board of directors for election to our board of directors, reviewing the composition of the board of directors and its committees, developing and recommending to the board of directors corporate governance guidelines that are applicable to us, and overseeing board of directors evaluations. The
79
Table of Contents
charter of our Governance Committee will be available without charge on the investor relations portion of our website upon completion of this offering.
Prior to the completion of this offering, the members of our Governance Committee are expected to be (chairperson), , and . In light of our status as a “controlled company” within the meaning of the corporate governance standards of the following this offering, we are exempt from the requirement that our Governance Committee be composed entirely of independent directors, with a written charter addressing the committee’s purpose and responsibilities and the requirement that there be an annual performance evaluation of the Governance Committee.
Code of Conduct and Financial Code of Ethics
We have a Financial Code of Ethics that applies to our CEO, CFO, and Controller, or persons performing similar functions, and other designated officers and employees. We also have a Code of Conduct that applies to all of our directors, officers and employees. The Financial Code of Ethics and Code of Conduct each address matters such as conflicts of interest, confidentiality, fair dealing, and compliance with laws and regulations. The Financial Code of Ethics and the Code of Conduct will be available without charge on the investor relations portion of our website upon completion of this offering.
80
Table of Contents
For purposes of this Compensation Discussion and Analysis and the tables that follow, all information presented is for our fiscal year ended June 30, 2015, which we refer to as fiscal 2015.
Compensation Discussion and Analysis
Introduction and Overview
This Compensation Discussion and Analysis, or CD&A, describes our compensation philosophy and policies and discusses the role of the Compensation and Personnel Committee (referred to below as the Committee) in establishing the compensation of our named executive officers and oversight of our compensation programs during fiscal 2015.
For purposes of our CD&A, the following individuals are our “named executive officers” for fiscal 2015:
| Officers |
Position | |
| William L. Ballhaus |
President and Chief Executive Officer | |
| David K. Keffer |
Executive Vice President, Chief Financial Officer | |
| Clyde T. Nixon |
Executive Vice President and Chief Growth Officer | |
| Paul Nedzbala |
Executive Vice President, Health and Civil Group | |
| Timothy J. Atkin |
Executive Vice President, Chief Administrative Officer and Chief of Staff |
Compensation Philosophy and Overall Approach to Executive Compensation
The goal of our compensation program is to compensate our executives commensurate with individual and company performance. During fiscal 2015, the specific objectives of our executive compensation program were as follows:
| • | Support the attainment of our short- and long-term financial and strategic objectives and reward executives for continuous improvement in earnings and growth; |
| • | Be performance-based, with variable pay constituting a significant portion of total compensation; |
| • | Provide differentiated pay based on executives’ skills, role in the company, and contributions to our performance; |
| • | Attract, retain, and motivate highly skilled executives by providing a competitive compensation opportunity relative to other companies in our industry with whom we compete for executive talent; |
| • | Maximize the financial efficiency of the overall program from tax, accounting, and cash flow perspectives; |
| • | Strengthen the link between our multi-year business plan and actual performance against the plan; |
| • | Reinforce a high-performance culture; and |
| • | Embrace best practice policies to the extent they are supportive of the above objectives. |
These objectives have guided and continue to guide the decisions made by management and the Committee with respect to the compensation of our named executive officers.
Role of the Committee
The Committee is responsible for reviewing and approving the compensation and benefits strategy for our employees, including the named executive officers, authorizing and ratifying equity grants and other incentive
81
Table of Contents
arrangements, and authorizing employment, change in control and other related agreements. To achieve our compensation program objectives, the Committee evaluates our executive compensation program with the goal of setting target compensation at levels that our Committee believes will allow us to attract and retain executive talent and that are consistent with peer practices. The Committee also administers our incentive compensation programs and, in that capacity, ensures that our compensation program is based on quantitative and qualitative performance metrics that serve these goals.
Role of Executive Officers
Although our Committee has the authority to make final decisions with respect to the executive compensation, our Chief Executive Officer, Dr. William L. Ballhaus, drives the design and implementation of executive compensation programs. Except for his own compensation, Dr. Ballhaus has final management-level review of any compensation program or individual element of compensation for the named executive officers before it is reviewed by the Committee. Dr. Ballhaus and our other named executive officers do not participate in discussions regarding their own compensation.
Market Comparisons
In the past we completed reviews of compensation practices of our internally developed peer group. In fiscal 2015 our market research was limited to ascertaining whether our projected salary increase budgets (also generally known as merit budgets) were consistent with industry wage growth generally. We evaluated the merit budget data using the following market surveys: IBM Kenexa Salary Budget Survey Report, WorldatWork Salary Budget Survey Report and Mercer US Compensation Executive Survey Report. We also reviewed the public filings of our internally-generated peer group for merit budget information. This review confirmed that our annual salary review process was consistent with available market data. In connection with this offering, we are in the process of developing a peer group and will be completing a comprehensive compensation review.
Components of our Executive Compensation Program
During fiscal 2015, the primary elements of our executive compensation program were:
| • | base salary; |
| • | short-term cash incentive compensation; |
| • | long-term incentive compensation in the form of stock options and/or awards under our restricted stock program; |
| • | in some cases, severance and change in control benefits; and |
| • | certain other benefits and perquisites. |
Set forth below is a discussion of each element of compensation, the rationale for each element, and how that element fits into our overall compensation philosophy. All of these elements are considered individually critical to our executive compensation packages.
Elements of Our Executive Compensation Program
Base Salary
We provide a base salary to our named executive officers to compensate them for their services rendered on a day-to-day basis during the year. Base salaries are set to attract and retain executives with qualities necessary to achieve our short-term and long-term financial goals. We strive to set base salaries at a level that permits us to attract talented peer group executives in similar positions with similar responsibilities at companies included in our peer market data, and we generally find that target salaries in the median range of our peer group permit us to
82
Table of Contents
do so. The determination of any particular named executive officer’s base salary is based on market compensation rates, as described above under “Market Comparisons”, and individual factors including individual performance, compensation history, scope of responsibility, internal equitable treatment, and experience level. The base salaries of our named executive officers are reviewed annually and adjusted when necessary to reflect market conditions as well as individual roles and performance.
2015 Base Salaries
Each of our named executive officers received the base salary in fiscal 2015 as set forth in the Summary Compensation Table under “Salary”. Dr. Ballhaus’ fiscal 2015 base salary was determined pursuant to the terms and conditions of his employment agreement.
In connection with our fiscal 2015 annual review of the named executive officers’ base salaries, Dr. Ballhaus recommended increases in base salaries for each of the named executive officers within a budget approved by the Committee. Dr. Ballhaus based these recommendations on each individual’s prior fiscal year salaries, our strategic, operating, and financial performance metrics (which were also applicable to Dr. Ballhaus’ compensation), and performance against individual annual performance objectives, compensation history, scope of responsibility, internal equitable treatment, external market data, nationally recognized compensation surveys, peer group analysis and experience level. Additionally, in connection with Mr. Keffer’s promotion from Acting Chief Financial Officer to our Chief Financial Officer on September 1, 2014, he received a promotion increase to bring his salary closer to that of our other named executive officers and other chief financial officers in our peer group. The base salaries of our CEO and other named executive officers for fiscal 2014 and 2015 are shown in the table below:
| Named of Executive |
Fiscal 2014 Salary |
Fiscal 2015 Salary |
Change from Fiscal 2014 |
|||||||||
| William L. Ballhaus |
$ | 882,000 | $ | 900,000 | 2.04 | % | ||||||
| David F. Keffer |
235,125 | 305,000 | 29.72 | % | ||||||||
| Clyde T. Nixon |
340,000 | 346,800 | 2.00 | % | ||||||||
| Paul Nedzbala |
340,890 | 347,708 | 2.00 | % | ||||||||
| Timothy J. Atkin |
396,977 | 404,917 | 2.00 | % | ||||||||
Short-Term Incentives
We pay annual cash incentives to our named executive officers pursuant to our Individual Incentive Compensation Plan, or IIC Plan. The IIC Plan is designed to align executive performance goals with organizational goals, encourage and reward stretch performance, deliver variable compensation payouts that reflect our performance and optimize operating results from year-to-year and against the strategic plan. The IIC Plan rewards named executive officers for achievement of strategic, operational and financial goals. Each year the Chief Executive Officer develops such goals at the beginning of the fiscal year. Our Committee then reviews and approves these goals. A minimum incentive may be earned at threshold goals, and no payment may be awarded if the threshold goals are not achieved; however, our Committee is empowered to grant exceptions at their discretion. Additional amounts can be earned when actual performance exceeds target goals.
2015 Fiscal IIC Plan
The IIC Plan for fiscal 2015 involves three steps: first, setting a target bonus payment as a percentage of base salary; second, establishing quantitative goals by which a “corporate score” multiplier is determined; and third, establishing qualitative goals by which a “personal score” multiplier is determined. The named executive officers’ bonus is the product of his base salary amount multiplied by his target percentage multiplied by the quantitative multiplier and the qualitative multiplier.
83
Table of Contents
In fiscal 2015, the quantitative metrics were fiscal 2015 Plan Adjusted EBITDA (as defined below), fiscal 2015 net orders, fiscal 2016 Plan Adjusted EBITDA and fiscal 2016 Revenue forecasts against our multi-year plan. For purposes of our incentive plan calculations, Plan Adjusted EBITDA is defined as GAAP net income (or loss) determined pursuant to generally accepted accounting principles plus (i) provision for (or benefit from) income taxes, (ii) net interest (or income) expense, (iii) depreciation and amortization of property and equipment, and (iv) amortization of intangible assets, and further adjusted to exclude certain items that do not relate directly to our ongoing operations or which are non-cash in nature. “Net orders” refers to the value of contract awards issued to us upon entry into such contracts, offset by de-obligations or removals from our backlog due to the expiration of the period of performance. Measurement of fiscal 2016 Plan Adjusted EBITDA and Revenue are determined based on a comparison of the forecast of these metrics for fiscal 2016 at the beginning of fiscal 2015 compared with the forecast for these metrics at the beginning of fiscal 2016. For its calculations, our Committee will review, among other things, the Company-wide strategic operational and financial performance metrics compared to the fiscal 2015 Company financial plan as approved by our Committee and qualitative performance measures as established and approved by our Committee at the beginning of fiscal 2015.
At the end of the fiscal year, the Committee evaluates performance against each of the plan’s quantitative measures and approves a company score. The company score represents the percentage of the target funding level earned. It is important to note that we must achieve a minimum threshold level of performance on Plan Adjusted EBITDA in order for the plan to be awarded any funding. The company score can range from zero to 2.0x the target funding levels. Once the funding levels are established by the corporate score, each individual participant is awarded a personal score multiplier that can increase or decrease the actual cash incentive earned by a participant. It is possible, although very rare, for an individual participant to earn a cash payment greater than 2.0x the participant’s individual target through his or her personal score.
Qualitative incentive targets for our named executive officers for fiscal 2015 were recommended by Dr. Ballhaus and were approved by the Committee by setting the overall fiscal 2015 targets. Dr. Ballhaus’ qualitative incentive target was established and approved by the Committee. The percentages reflected Dr. Ballhaus’ assessment of each executive’s individual performance, compensation history, scope of responsibility, experience level, internal equitable treatment, and relevant market data. The table below reflects the target IIC Plan bonus percentage for each of our named executive officers:
| Base Salary | Cash Incentive Target | Total Cash Target Compensation Mix |
||||||||||||||||||||||||||||||
| Name of Executive | Fiscal 2014 |
Fiscal 2015 |
Fiscal 2014 % |
Fiscal 2014 $ |
Fiscal 2015 % |
Fiscal 2015 $ |
Fiscal 2014 |
Fiscal 2015 |
||||||||||||||||||||||||
| William L. Ballhaus | $ | 882,000 | $ | 900,000 | 125 | % | $ | 1,102,500 | 125 | % | $ | 1,125,000 | $ | 1,984,500 | $ | 2,025,000 | ||||||||||||||||
| David F. Keffer | 235,125 | 305,000 | 50 | % | 117,563 | 80 | % | 244,000 | 352,688 | 549,000 | ||||||||||||||||||||||
| Clyde T. Nixon | 340,000 | 346,800 | 80 | % | 272,000 | 80 | % | 277,440 | 612,000 | 624,240 | ||||||||||||||||||||||
| Paul Nedzbala | 340,890 | 347,708 | 80 | % | 272,712 | 80 | % | 278,166 | 613,602 | 625,874 | ||||||||||||||||||||||
| Timothy J. Atkin | 396,977 | 404,917 | 80 | % | 317,582 | 80 | % | 323,933 | 714,559 | 728,850 | ||||||||||||||||||||||
Annual incentive payments for fiscal 2015 have not yet been determined. The fiscal 2015 bonuses for our executive officers are not yet calculable and are expected to be determined in August 2015 after completion of the financial statement audit and other individual performance figures are finalized and approved by the Committee.
84
Table of Contents
Long-Term Incentives
We believe that equity-based awards link annual compensation levels with long-term performance results and ensure sustained alignment with shareholders’ interests. Additionally, we believe equity awards provide an important retention tool for our named executive officers, as they are subject to multi-year vesting. In furtherance of these objectives, we adopted our Restricted Stock Plan in 2013 and our Stock Incentive Plan in 2011. The named executive officers have been granted restricted stock under the Restricted Stock Plan and stock options under the Stock Incentive Plan.
Restricted Stock Program
In fiscal 2014 we added a restricted stock program to our long-term incentive compensation program. This program was established in order to drive incremental executive retention given changes in the government contracting environment that we observed. The restricted stock program includes an initial grant of restricted stock that vests ratably over three years beginning on the first anniversary of the grant date (subject to continued employment of the recipient) and annual subsequent grants to award holders who remain employed through the date of such subsequent grants. Because continued employment is required for the grant recipient to be eligible for the subsequent grant, our Committee concluded that a vesting condition is not necessary for the incremental grants. These restricted shares are therefore intended to both retain our named executive officers (because they must remain employed through the grant date to be eligible to receive a grant) and motivate the named executive officers to increase the value of the Company, and therefore our share price, over time.
In fiscal 2014, the Committee allocated a total of 7,000 shares under the Restricted Stock Plan for this program, of which 50% of the shares were allocated to the initial grants in fiscal 2014, and 33% of the remaining pool was allocated to annual subsequent grants to award holders who remain employed through the date of such subsequent grants. In October 2014, we awarded our first subsequent grant of fully vested restricted shares under our Restricted Stock Plan to our named executive officers. The amount of restricted stock granted to the other named executive officers was recommended by Dr. Ballhaus and determined by our Committee. The amount of fully vested restricted shares granted to Dr. Ballhaus was determined by our Committee. The Committee’s determination was based on the number of shares available under the Restricted Stock Plan in comparison to the number of the shares that vest each year per the initial grants under the Restricted Stock Plan. The table below reflects the number of restricted stock granted to the named executive officers in fiscal 2015:
| Name |
Restricted Stock Shares (#) |
|||
| William L. Ballhaus |
375 | |||
| David F. Keffer |
100 | |||
| Clyde T. Nixon |
70 | |||
| Paul Nedzbala |
70 | |||
| Timothy J. Atkin |
50 | |||
Stock Option Award to our Chief Financial Officer
In fiscal 2015, we granted 1,000 stock options to purchase shares of our common stock to Mr. Keffer in connection with his promotion from Acting Chief Financial Officer to Executive Vice President, Chief Financial Officer. In determining the size and nature of the stock option grant to our Chief Financial Officer, the Committee considered our Company-wide performance, Mr. Keffer’s performance, external market data, and the expected stock compensation expense computed in accordance with generally accepted accounting principles.
85
Table of Contents
Pursuant to the Stock Incentive Plan, the stock option grant was comprised of 50% service stock options and 50% performance stock options. The service options vest ratably over a five year period beginning on the first anniversary of July 20, 2014, subject to continued employment of the named executive officer holding such awards. The performance stock options will vest, if at all, upon a “change in control” based on the cash return on investment received by the PEP Funds. For purposes of the Stock Incentive Plan, “change in control” is defined as (i) a sale by the PEP Funds of all or substantially all of the common stock owned by them for cash or (ii) a sale by the Company of all or substantially all of its assets for cash.
Employment Agreement with our Chief Executive Officer
We have entered into an employment agreement with Dr. Ballhaus, our Chief Executive Officer, which includes severance benefits and the specific terms described under “—Narrative Disclosure to Summary Compensation Table and Grants of Plan-Based Awards Table—Employment with William J. Ballhaus”. We believe that an employment agreement with our Chief Executive Officer is beneficial to us because it provides retentive value, subjects Dr. Ballhaus to key restrictive covenants, and generally gives us an advantage in the recruiting process over a company that does not offer employment agreements.
Enhanced Severance Eligibility Agreements
During fiscal 2014, SRA International, Inc. entered into enhanced severance eligibility agreements with Messrs. Nedzbala, Nixon and Atkin. In fiscal 2015, SRA International, Inc. entered into a similar agreement with Mr. Keffer. These agreements provide for certain benefits in the event of a termination without “cause” prior to a change in control or a termination without “cause” or for “good reason” following a change in control.
The change in control benefits under these agreements were structured as “double trigger” benefits, so that severance would be paid only if a change in control and a termination without “cause” or resignation with “good reason” (as such terms are defined in the enhanced severance eligibility agreements) occurred. In structuring these arrangements, the Company believes a “double trigger” benefit is appropriate to maximize stockholder value because it would prevent an unintended windfall in the event of continued employment following a change of control, while still providing the executive with appropriate protection in the event a change in control results in the loss of job or reduction in job responsibilities. We also believe severance benefits for our executives upon a termination without cause (absent a change in control) provide retentive value and give us an advantage in attracting key talent.
For more detailed information about these benefits, along with estimates of their value under various circumstances, see “—Potential Payments upon Termination or Change of Control”.
Benefits and Other Compensation
We maintain broad-based benefits that are provided to all employees, including medical, dental, vision, life and disability insurance and our 401(k) plan. Named executive officers are eligible to participate in all of our employee benefit plans on the same basis as other employees.
401(k) Plan
We presently match a portion of employee contributions into our 401(k) plan on an annual basis for each calendar year. The maximum matching contribution available for any employee during calendar year 2014 was $7,800. The maximum matching contribution available for any employee during calendar year 2015 is $7,950. All employees, including named executive officers, are eligible under the same matching formula.
86
Table of Contents
Tax and Accounting Considerations
With respect to taxes, Section 162(m) of the Internal Revenue Code imposes a $1 million limit on the deduction that a company may claim in any tax year with respect to compensation paid to each of its Chief Executive Officer and three other named executive officers (other than the Chief Financial Officer), unless certain conditions are satisfied. Certain types of performance-based compensation are generally exempted from the $1 million limit. Performance-based compensation can include income from stock options, performance-based restricted stock, and certain formula-driven compensation that meets the requirements of Section 162(m). One of the factors that we may consider in structuring the compensation for our named executive officers is the deductibility of such compensation under Section 162(m), to the extent applicable. However, this is not the driving or most influential factor. Our Committee may approve non-deductible compensation arrangements after taking into account several factors, including our ability to utilize deductions based on projected taxable income, and specifically reserves the right to do so.
Clawback Policy Effective For Fiscal 2015
During fiscal 2015, we maintained a clawback policy with respect to annual cash incentives and equity grants made to all of our employees, including the named executive officers. Specifically, under the policy, the Board, in all appropriate circumstances, would require reimbursement of any annual cash incentive payment or equity awards made to a plan participant if:
| • | the incentive payment or equity award was predicated upon achieving certain financial results that were subsequently the subject of a substantial restatement of our financial statements filed with the SEC; |
| • | the Board determined that the plan participant engaged in intentional misconduct that caused or substantially caused the need for the substantial restatement; or |
| • | a lower incentive payment or equity award would have been made to the participant based upon the restated financial results. |
Compensation Risk Assessment
The Committee believes that the design and mix of our compensation program during fiscal 2015 appropriately encouraged our named executive officers to focus on long-term growth while also serving to attract, retain, and motivate needed talent. The Committee believes its approach to setting Company and individual goals with target payouts at multiple levels of performance encouraged a level of appropriate risk-taking behavior consistent with our business. The Board also believes it allocated its compensation among base salary, annual cash incentives, and long-term equity compensation during fiscal 2015 in such a way as to not encourage excessive risk-taking.
In its discussions, the Committee noted the following attributes of our fiscal 2015 compensation program:
| • | There was a balance between short- and long-term financial and strategic objectives, which incentivized managers for continuous improvement in earnings and growth. |
| • | A significant portion of our management compensation was “at risk” and dependent upon the achievement of specific Company-wide strategic operational and financial goals, as well as individual goals and associated performance that was objectively determined with verifiable results. These corporate goals were pre-established minimum, target, and stretch performance-level goals, with individual metrics and overall maximums. |
| • | The Committee considered other qualitative measures in determining actual compensation payouts. |
| • | A significant portion of our executives’ total compensation consisted of fully vested restricted shares. The Committee believes the restricted shares were a necessary retention tool and further fostered stock ownership amongst our named executive officers. In addition, Mr. Keffer received a grant of stock |
87
Table of Contents
| options. The stock option award consisted of both service options and performance options. The service options vest ratably over a five year period beginning on the first anniversary of July 20, 2014, subject to Mr. Keffer’s ongoing employment. The performance options will vest at the time of a change in control, if at all. The Committee believes the vesting schedules encourage our executives and other key employees to focus on the Company’s long-term performance. |
| • | The Company had a clawback policy in place that entitled the Company to require reimbursement of any annual cash incentive payment or equity awards from named executive officers and other recipients if financial results determining incentive payments or equity awards were subsequently the subject of a substantial restatement of the Company’s financial statements filed with the SEC and upon the occurrence of other specified events. |
Based on this review and the currently known facts and circumstances, the Committee’s belief is that the Company’s compensation policies and practices during fiscal 2015, individually and in the aggregate, did not create known risks that were reasonably likely to have a material adverse effect on the Company.
Summary Compensation Table
The following table sets forth certain information with respect to compensation for the fiscal years ended June 30, 2015, 2014, and 2013 earned by our named executive officers.
Summary Compensation Table
| Name & Principal Position |
Fiscal Year |
Salary ($) |
Non-Equity Incentive Plan Compensation ($)(1) |
Other Bonus ($) |
Stock Awards ($)(2) |
Option Awards ($)(3) |
All Other Compensation ($)(4) |
Total($) | ||||||||||||||||||||||||
| William L. Ballhaus, |
2015 | 897,417 | TBD | — | 84,750 | — | 7,800 | TBD | ||||||||||||||||||||||||
| President, Chief |
2014 | 875,996 | 824,670 | — | 210,389 | — | 8,750 | 1,919,805 | ||||||||||||||||||||||||
| Executive Officer and Director |
2013 | 843,246 | — | — | 212,500 | — | 8,500 | 1,064,246 | ||||||||||||||||||||||||
| David F. Keffer, |
2015 | 293,834 | TBD | — | 22,600 | 123,200 | 5,428 | TBD | ||||||||||||||||||||||||
| Executive Vice President, Chief Financial Officer |
2014 | 233,538 | 95,931 | 16,831 | — | 8,750 | 355,050 | |||||||||||||||||||||||||
| 2013 | 208,416 | — | — | 25,000 | — | 8,500 | 241,916 | |||||||||||||||||||||||||
| Clyde T. Nixon, |
2015 | 348,578 | TBD | — | 15,820 | — | 7,800 | TBD | ||||||||||||||||||||||||
| Executive Vice President and Chief Growth Officer |
2014 | 324,601 | 205,123 | — | 47,888 | 108,360 | 8,750 | 694,722 | ||||||||||||||||||||||||
| 2013 | 254,718 | — | — | 50,000 | 456,633 | 6,250 | 767,601 | |||||||||||||||||||||||||
| Paul Nedzbala, |
2015 | 347,010 | TBD | — | 15,820 | — | 7,800 | TBD | ||||||||||||||||||||||||
| Executive Vice President, |
2014 | 340,178 | 231,805 | 100,000 | 39,673 | 75,512 | 8,750 | 795,918 | ||||||||||||||||||||||||
| Health and Civil Group |
2013 | 274,468 | — | 50,000 | 56,250 | — | 8,500 | 389,218 | ||||||||||||||||||||||||
| Timothy J. Atkin, |
2015 | 406,020 | TBD | — | 11,300 | — | 7,800 | TBD | ||||||||||||||||||||||||
| Executive Vice President, |
2014 | 400,602 | 237,551 | — | 23,243 | — | 8,750 | 670,146 | ||||||||||||||||||||||||
| Chief Administrative Officer and Chief of Staff |
2013 | 388,886 | — | — | 90,000 | — | 2,881 | 481,767 | ||||||||||||||||||||||||
| (1) | Annual bonuses under the IIC Plan for fiscal 2015 have not yet been determined. The fiscal 2015 bonuses for our executive officers are not yet calculable and are expected to be determined in August 2015 after completion of the financial statement audit and other individual performance figures are finalized and approved by the Committee. |
| (2) | The amounts in this column represent the aggregate grant date fair value computed in accordance with ASC 718. Assumptions used in the calculation of the grant date fair value of our stock awards are included in the “Management’s Discussion and Analysis of Financial Condition and Results of Operations—Description of Critical Accounting Policies and Estimates—Accounting for Stock-Based Compensation”. |
88
Table of Contents
| (3) | The amounts in this column represent the aggregate grant date fair value computed in accordance with ASC 718. Assumptions used in the calculation of the grant date fair value of our option awards are included in the “Management’s Discussion and Analysis of Financial Condition and Results of Operations—Description of Critical Accounting Policies and Estimates—Accounting for Stock-Based Compensation”. |
| (4) | The 401(k) plan is maintained and monitored on a calendar year basis; therefore, the Company matching contributions include the matching contributions for income earned from January 1 through December 31. |
Grants of Plan-Based Awards
The following table sets forth information regarding cash incentive awards, stock options and restricted stock granted to our named executive officers in fiscal 2015.
Grants of Plan-Based Awards
|
Estimated Possible Payouts |
All Other Stock Awards: Number of Shares of Stock or Units (#)(2) |
All Other Option Awards: Number of Securities Underlying Options (#)(3) |
Exercise of Base Price of Option Awards ($/Sh) |
Grant Date Fair Value of Stock and Option Awards ($)(4) |
||||||||||||||||||||||||||||
| Name of Executive |
Grant Date | Threshold ($) |
Target ($) |
Maximum ($) |
||||||||||||||||||||||||||||
| William L. Ballhaus | N/A | 0 | 1,125,000 | None | — | — | — | |||||||||||||||||||||||||
| 10/7/2014 | — | — | — | 375 | — | — | 84,750 | |||||||||||||||||||||||||
| David F. Keffer | N/A | 0 | 244,000 | None | — | — | — | — | ||||||||||||||||||||||||
| 11/4/2014 | — | — | — | — | 1,000 | 1,000 | 123,200 | |||||||||||||||||||||||||
| 10/7/2014 | — | — | — | 100 | — | — | 22,600 | |||||||||||||||||||||||||
| Clyde T. Nixon | N/A | 0 | 277,440 | None | — | — | — | — | ||||||||||||||||||||||||
| 10/7/2014 | — | — | — | 70 | — | — | 15,820 | |||||||||||||||||||||||||
| Paul Nedzbala | N/A | 0 | 278,166 | None | — | — | — | — | ||||||||||||||||||||||||
| 10/7/2014 | — | — | — | 70 | — | — | 15,820 | |||||||||||||||||||||||||
| Timothy J. Atkin | N/A | 0 | 323,933 | None | — | — | — | — | ||||||||||||||||||||||||
| 10/7/2014 | — | — | — | 50 | — | — | 11,300 | |||||||||||||||||||||||||
| (1) | A discussion of the IIC Plan for fiscal year 2015 can be found under “Compensation Discussion and Analysis—Elements of Our Executive Compensation Program—Short-Term Incentives”. |
| (2) | The restricted shares were fully vested on the grant date. |
| (3) | The stock options grants are composed of 50% “service options” and 50% “performance options”. Service options vest in five equal installments on each year of the first through fifth anniversaries of July 20, 2014, subject to the continued employment of Mr. Keffer. The performance options vest at the time of a change in control, if at all, based upon the cash return to the PEP Funds from its investment in the Company. |
| (4) | The amounts in these columns represent the aggregate grant date fair value computed in accordance with ASC 718. Assumptions used in the calculation of the grant date fair value of our stock awards are included in the “Management’s Discussion and Analysis of Financial Condition and Results of Operations—Description of Critical Accounting Policies and Estimates—Accounting for Stock-Based Compensation”. |
Narrative Disclosure to Summary Compensation Table and Grants of Plan-Based Awards Table
Employment Agreement with William L. Ballhaus
On July 20, 2011, the Company entered into an employment agreement with Dr. Ballhaus, which was amended on September 27, 2013. The employment agreement has an initial term commencing on July 25, 2011 and ending on the third anniversary, provided that the agreement will automatically renew each year for an additional one-year period unless either party provides prior written notice of non-renewal.
The employment agreement provides for a base salary of $840,000, which has been increased to $900,000 as of fiscal 2015. The agreement (as amended) also provides that Dr. Ballhaus is eligible for an annual target
89
Table of Contents
bonus opportunity in an amount equal to 125% of his base salary. Except upon certain qualified terminations (as described below), Dr. Ballhaus must be actively employed by the Company on the last day of the fiscal year in order to receive the annual bonus.
Pursuant to his employment agreement, Dr. Ballhaus was granted $1 million of restricted stock, which vests in five equal installments over five years on each of the first through fifth anniversaries of the grant date. In addition, he received a signing bonus of $5.5 million. He also was entitled to a $2 million retention bonus on August 31, 2012, based on his continuous employment with the Company through that date. By the terms of his employment agreement, Dr. Ballhaus is also entitled to participate in equity grants under the Stock Incentive and Restricted Stock Plans.
On any termination of employment, Dr. Ballhaus will receive base salary through the termination date, any accrued and unpaid benefits and reimbursement of reasonable and necessary business expenses incurred by Dr. Ballhaus in connection with his employment on behalf of the Company on or prior to his termination date.
If Dr. Ballhaus’ employment is terminated without “cause”, Dr. Ballhaus resigns for “good reason” or the Company provides Dr. Ballhaus notice of non-renewal of his employment term, Dr. Ballhaus will be entitled to: (i) any earned but unpaid compensation or benefits; (ii) cash severance equal to two times the sum of his base salary and target bonus opportunity as of his termination date (or three times the sum of his base salary and target bonus opportunity if he is terminated prior to a change of control of the Company and a change of control occurs within 6 months of his termination date or he is terminated within 2 years following a change in control of the Company); (iii) a pro rata bonus payment for year of termination; (iv) the retention and signing bonuses, if unpaid as of the termination date; and (v) continued medical, dental and vision coverage for 18 months following his termination of employment. The payment of any severance under the employment agreement is conditioned on Dr. Ballhaus executing and delivering a release of claims to the Company.
Under Dr. Ballhaus’ employment agreement, “cause” generally means: (i) commission or conviction of, or entry of a plea of guilty or nolo contendere to, any felony or any other crime (whether or not a felony) involving moral turpitude, deceit, dishonesty or fraud; (ii) continued failure or refusal to perform any material duty to the Company or its affiliates which is customarily attached to his position (other than by reason of his death or disability, and taking into account normal vacation periods or other approved leaves of absence), (iii) gross negligence or willful misconduct in the performance of his duties; or (iv) a material breach of any material agreement (including but not limited to his employment agreement) to which Dr. Ballhaus and the Company or any of its affiliates are now or hereafter parties.
“Good Reason” under Dr. Ballhaus’ employment agreement generally means one of the following events: (i) any material diminution in his authority, duties or responsibilities as Chief Executive Officer of the Company or SRA International, Inc., or the Company’s or SRA International, Inc.’s change in his title having similar effect, or the Company’s or SRA International, Inc.’s removal of Dr. Ballhaus from his position as Chief Executive Officer or member of the Board of Directors of the Company or SRA International, Inc.; (ii) the relocation of the Company’s or SRA International, Inc.’s principal offices out of the Washington D.C./Northern Virginia metropolitan area; (iii) a reduction in Dr. Ballhaus’ base salary; (iv) a material breach by the Company or SRA of any material agreement (including his employment agreement) between Dr. Ballhaus and the Company, SRA International, Inc., or their respective affiliates, including the failure to pay compensation hereunder when due; or (v) the failure of a successor to the Company or SRA International, Inc., as applicable, or the purchaser of all or substantially all of the assets of the Company or SRA International, Inc., as applicable, to expressly agree to assume his employment agreement within 5 days of becoming a successor or purchasing the assets and perform the obligations hereunder of the Company or SRA International, Inc., as applicable. In order for a termination by Dr. Ballhaus to constitute a termination for “good reason”, Dr. Ballhaus must notify the Company of the circumstances claimed to constitute good reason in writing not later than the 90th day after he knows of such circumstance and provides the Company with at least 30 days’ notice within which to cure such circumstances before terminating his employment, and, failing a cure, Dr. Ballhaus must terminate his employment within 30 days following the expiration of such cure period.
90
Table of Contents
In the event that Dr. Ballhaus’ employment with the Company terminates due to his death or disability, Dr. Ballhaus (or his estate or representative, as applicable) is entitled to an amount equal to the sum of (i) any earned but unpaid compensation or benefits; (ii) a pro rata bonus payment for the year of termination; and (iii) the retention and signing bonuses, to the extent unpaid on the date of termination.
The employment agreement also provides that in connection with an initial public offering of the Company or an affiliate of the Company, the Board will reasonably consider in good faith (in light of market trends, comparable companies or other data or information reasonably determined by the Board in good faith to be relevant to such consideration) an amendment to Dr. Ballhaus’ employment agreement or execution of a new agreement that provides him with an indemnification from the taxes imposed under Section 4999 of the Code with respect to a change in control.
The employment agreement also contains customary post-employment restrictive covenants, including a perpetual confidentiality obligation and two-year noncompetition and non-solicitation obligations.
Outstanding Equity Awards at Fiscal Year End
The following table sets forth information regarding outstanding stock options and restricted stock awards held by our named executive officers as of June 30, 2015.
Outstanding Equity Awards at Fiscal Year End
| Option Awards | Restricted Stock | |||||||||||||||||||||||||||
| Name of Executive |
Grant Date | Number of Shares Underlying Unexercised Options Exercisable (#) |
Number of Shares Underlying Unexercised Options Unexercisable (#) |
Option Exercise Price ($) |
Option Expiration Date |
Number of Shares that Have Not Vested (#) |
Market Value of Shares that Have Not Vested ($)(8) |
|||||||||||||||||||||
| William L. Ballhaus | 9/23/2013 | 700 | (5) | TBD | ||||||||||||||||||||||||
| 6/28/2013 | 850 | (6) | TBD | |||||||||||||||||||||||||
| 2/9/2012 | 4,318 | (1) | 10,074 | (1) | $ | 1,000 | 2/9/2022 | |||||||||||||||||||||
| 7/25/2011 | 400 | (7) | TBD | |||||||||||||||||||||||||
| David F. Keffer | 11/4/2014 | 1,000 | (2) | 1,000 | 11/4/2024 | TBD | ||||||||||||||||||||||
| 9/20/2013 | 56 | (5) | TBD | |||||||||||||||||||||||||
| 6/28/2013 | 100 | (6) | TBD | |||||||||||||||||||||||||
| 2/9/2012 | 233 | (1) | 545 | (1) | 1,000 | 2/9/2022 | ||||||||||||||||||||||
| Clyde T. Nixon | 12/19/2013 | 57 | (3) | 517 | (3) | 1,000 | 12/19/2023 | |||||||||||||||||||||
| 9/20/2013 | 159 | (5) | TBD | |||||||||||||||||||||||||
| 6/28/2013 | 216 | (4) | 866 | (4) | 1,000 | 6/28/2023 | ||||||||||||||||||||||
| 6/28/2013 | 200 | (6) | TBD | |||||||||||||||||||||||||
| 3/28/2013 | 98 | (4) | 392 | (4) | 1,000 | 3/28/2023 | ||||||||||||||||||||||
| 11/7/2012 | 31 | (4) | 125 | (4) | 1,000 | 11/7/2022 | ||||||||||||||||||||||
| Paul Nedzbala | 12/19/2013 | 40 | (3) | 360 | (3) | 1,000 | 12/19/2023 | |||||||||||||||||||||
| 9/20/2013 | 132 | (5) | TBD | |||||||||||||||||||||||||
| 6/28/2013 | 225 | (6) | TBD | |||||||||||||||||||||||||
| 2/9/2012 | 622 | (1) | 1,450 | (1) | 1,000 | 2/9/2022 | ||||||||||||||||||||||
| Timothy J. Atkin | 9/20/2013 | 77 | (5) | TBD | ||||||||||||||||||||||||
| 6/28/2013 | 360 | (6) | TBD | |||||||||||||||||||||||||
| 2/9/2012 | 691 | (1) | 1,611 | (1) | 1,000 | 2/9/2022 | ||||||||||||||||||||||
| (1) | The stock options grants are composed of 50% “service options” and 50% “performance options.” Service options vest in five equal installments on each of the first through fifth anniversaries of July 20, 2011, subject to the continued |
91
Table of Contents
| employment of the named executive officer holding such awards. The performance options vest at the time of a change in control, if at all, based upon the cash return to the PEP Funds from their investment in the Company. |
| (2) | The stock options grants are composed of 50% “service options” and 50% “performance options”. Service options vest in five equal installments on each of the first through fifth anniversaries of July 20, 2014, subject to the continued employment of the named executive officer holding such awards. The performance options vest at the time of a change in control, if at all, based upon the cash return to the PEP Funds from their investment in the Company. |
| (3) | The stock options grants are composed of 50% “service options” and 50% “performance options”. Service options vest in five equal installments on each of the first through fifth anniversaries of July 20, 2013, subject to the continued employment of the named executive officer holding such awards. The performance options vest at the time of a change in control, if at all, based upon the cash return to the PEP Funds from their investment in the Company. |
| (4) | The stock options grants are composed of 50% “service options” and 50% “performance options”. Service options vest in five equal installments on each of the first through fifth anniversaries of July 20, 2012, subject to the continued employment of the named executive officer holding such awards. The performance options vest at the time of a change in control, if at all, based upon the cash return to the PEP Funds from their investment in the Company. |
| (5) | The award vests in three equal installments on each of the first through third anniversaries of September 23, 2013, subject to the continued employment of the named executive officer holding such award and the achievement of a Company performance condition. |
| (6) | The award fully vests on the third anniversary of June 28, 2013, subject to the continued employment of the named executive officer holding such award. |
| (7) | The award vests in five equal installments on each of the first through fourth anniversaries of July 25, 2011, subject to the continued employment of Dr. Ballhaus. |
| (8) | Value will be based on the fair market value of our common stock on June 30, 2015. At the time of filing of this Registration Statement, the fair market value of our common stock on June 30, 2015 is not known, and amounts in this column will be reported in a subsequent amendment once this amount is known. |
Stock Option Exercises and Restricted Stock Vesting
The following table provides information on (1) stock option exercises by the named executive officers during fiscal 2015, including the number of shares acquired upon exercise and the value realized, and (2) the number of shares acquired upon the vesting of restricted stock awards held by the named executive officers in fiscal 2015 and the value realized. In fiscal 2015, there were no stock options exercised.
Option Exercises and Stock Vested—Fiscal 2015
| Option Awards | Stock Awards | |||||||||||||||
| Name of Executive |
Number of Shares Acquired on Exercise (#) |
Value Realized on Exercise ($) |
Number of Shares Acquired on Vesting (#) |
Value Realized on Vesting ($) |
||||||||||||
| William L. Ballhaus |
— | $ | — | 859 | 194,134 | |||||||||||
| David F. Keffer |
— | — | 128 | 28,928 | ||||||||||||
| Clyde T. Nixon |
— | — | 150 | 33,900 | ||||||||||||
| Paul Nedzbala |
— | — | 136 | 30,736 | ||||||||||||
| Timothy J. Atkin |
— | — | 89 | 20,114 | ||||||||||||
92
Table of Contents
Potential Payments upon Termination or Change in Control
The following discussion summarizes the potential payments upon a termination of employment or a change in control. The amounts discussed apply the assumptions that the named executive officer’s employment terminated on June 30, 2015 and the named executive officer does not become employed by a new employer or return to work for the Company. The Company also assumes that none of the payments to which the named executive officers would have become entitled would be reduced as a consequence of such payments being considered “parachute payments” under Section 280G of the Code and subject to the excise tax under Section 4999 of the Code.
Effect of Termination or Change in Control under the Ballhaus Employment Agreement
For a description of the potential payments upon a termination or change in control pursuant to the employment agreement with Dr. Ballhaus, see “Narrative Disclosure to Summary Compensation Table and Grants of Plan-Based Awards Table—Employment Agreements”. The following table sets forth an estimate of the benefits that Dr. Ballhaus would be entitled to if he had been terminated by us without “cause” or by Dr. Ballhaus for “good reason” or in the event of termination due to death or disability.
| Termination Due to Death or Disability ($) |
Termination Without Cause or for Good Reason ($) |
Termination Without Cause or for Good Reason within Two Years of a Change in Control $(1) |
||||||||||
| Severance (Salary) |
0 | 4,050,000 | (2) | 6,075,000 | (3) | |||||||
| Severance (Pro Rata Bonus)(4) |
1,125,000 | 1,125,000 | 1,125,000 | |||||||||
| Equity Vesting(5) |
TBD | TBD | TBD | |||||||||
| Other benefits(6) |
75,003 | 93,810 | 93,810 | |||||||||
|
|
|
|
|
|
|
|||||||
| Total potential payments |
1,200,003 | 5,268,810 | 7,293,810 | |||||||||
|
|
|
|
|
|
|
|||||||
| (1) | The amounts in this column represent the estimated benefits Dr. Ballhaus would receive (x) upon a termination without cause or for good reason prior to a change of control and a change of control occurs within 6 months of his termination date or (y) if he is terminated without cause or for good reason within 2 years following a change of control. |
| (2) | Reflects two times the sum of Dr. Ballhaus’ annual salary of $900,000 as of June 30, 2015 and his target annual bonus for fiscal 2015 of $1,125,000. |
| (3) | Reflects three times the sum of Dr. Ballhaus’ annual salary of $900,000 as of June 30, 2015 and his target annual bonus for fiscal 2015 of $1,125,000. |
| (4) | Based on his fiscal 2015 bonus target of $1,125,000. |
| (5) | For certain qualifying terminations and a change-in-control event, (i) the value of stock options is calculated by multiplying the number of vested options (including any unvested options that would accelerate on a qualifying termination or change-in-control event) by the excess of the fair market value of common stock on June 30, 2015 over the applicable exercise price per share and (ii) the value of the restricted stock is calculated based on the fair market value of our common stock on June 30, 2015. For more information on the treatment of Dr. Ballhaus’ equity awards upon a termination or a change-in-control event, see “Effect of Termination or Change in Control on Stock Options” and “Effect of Termination or Change in Control on Restricted Stock”. At the time of filing of this Registration Statement, the fair market value of our common stock on June 30, 2015 is not known, and amounts in this column will be reported in a subsequent amendment once this amount is known. |
| (6) | Represents the value of accrued vacation as of June 30, 2015 plus, in the case of termination without cause or for good reason, employer cost of 18 months of COBRA premiums in effect on June 30, 2015. |
93
Table of Contents
Effect of Termination or Change in Control under the Enhanced Severance Eligibility Agreements
During fiscal 2014, SRA International, Inc. entered into enhanced severance eligibility agreements with Messrs. Nedzbala, Nixon and Atkin. In September 2014, SRA International, Inc. entered into a similar agreement with Mr. Keffer. The agreements provide for certain benefits in the event of a termination without “cause” prior to a change in control or a termination without “cause” or for “good reason” following a change in control.
Termination of Employment. Upon a termination without “cause” (as defined in each enhanced severance eligibility agreement), each of Messrs. Keffer, Nixon and Nedzbala are entitled to receive (i) a cash severance payment equal to the named executive officer’s annual salary, (ii) an amount equal to a pro-rated portion of the target bonus under the IIC Plan, pro-rated to reflect the time period of the named executive officer’s service during the bonus performance period, (iii) six months of executive-level outplacement benefits and (iv) if the executive elects COBRA coverage, payments to the insurance provider equal to the amount due for the employer portion of the COBRA coverage for a period of up to 12 months. For Mr. Atkin, upon a termination of employment without “cause” (as defined in his enhanced severance eligibility agreement), he is entitled to (i) a cash severance payment equal to his annual salary, (ii) an amount equal to a pro-rated portion of the target bonus under the IIC Plan, pro-rated to reflect the time period of his service during the bonus performance period, (iii) an amount equal to the target amount of his bonus under the IIC Plan for the full fiscal year in which termination occurs at an individual metric of 1.0, (iv) six months of executive-level outplacement benefits, (v) if the executive elects COBRA coverage, payments to the insurance provider equal to the amount due for the employer portion of the COBRA coverage for a period of up to 12 months. The following table sets forth an estimate of the benefits that Messrs. Keffer, Nedzbala, Nixon and Atkin would be entitled to upon a termination without cause (absent a change of control):
| Name of Executive |
Salary (other than accrued amounts) ($) |
Prorated Bonus ($) |
Target Bonus ($) |
Equity Awards ($)(1) |
Other ($)(2) |
Total ($) |
||||||||||||||||||
| David F. Keffer |
305,000 | 244,000 | 0 | TBD | 142,437 | TBD | ||||||||||||||||||
| Clyde T. Nixon |
346,800 | 277,440 | 0 | TBD | 89,786 | TBD | ||||||||||||||||||
| Paul Nedzbala |
347,708 | 278,166 | 0 | TBD | 88,701 | TBD | ||||||||||||||||||
| Timothy J. Atkin |
404,917 | 323,933 | 323,933 | TBD | 146,497 | TBD | ||||||||||||||||||
| (1) | For certain qualifying terminations and a change-in-control event, (i) the value of stock options is calculated by multiplying the number of vested options (including any unvested options that would accelerate on a qualifying termination or change-in-control event) by the excess of the fair market value of common stock on June 30, 2015 over the applicable exercise price per share and (ii) the value of the restricted stock is calculated based on the fair market value of our common stock on June 30, 2015. For more information on the treatment of the named executive officers’ equity awards upon a termination or a change-in-control event, see “Effect of Termination or Change in Control on Stock Options” and “Effect of Termination or Change in Control on Restricted Stock”. At the time of filing of this Registration Statement, the fair market value of our common stock on June 30, 2015 is not known, and amounts in this column will be reported in a subsequent amendment once this amount is known. |
| (2) | Amounts in this column include the employer cost of 12 months of COBRA premiums in effect on June 30, 2015 and 6 months of outplacement costs and value of accrued vacation as of June 30, 2015. |
Change in Control. Upon a resignation for “good reason” following a “change in control” of the Company or SRA International, Inc. or a termination without “cause” within six months of a “change of control” of the Company or SRA International, Inc. (as such terms are defined in each enhanced severance eligibility agreement), each of Messrs. Keffer, Nixon or Nedzbala is entitled to the same benefits payable upon a termination without cause plus an amount equal to the target amount of the named executive officer’s bonus under the IIC Plan for the full fiscal year in which termination occurs at an individual metric of 1.0. For Mr. Atkin, upon a resignation for “good reason” following a “change in control” of the Company or SRA International, Inc. (as such terms are defined in his enhanced severance eligibility agreement), Mr. Atkin is entitled to the same benefits payable upon a termination of employment without “cause” (as such term is defined in his enhanced severance eligibility agreement). The following table sets forth an estimate of benefits that
94
Table of Contents
Messrs. Keffer, Nedzbala, Nixon and Atkin would be entitled to upon an involuntary termination following a change in control:
| Name of Executive |
Salary (other than accrued amounts) ($) |
Prorated Bonus ($) |
Target Bonus ($) |
Equity Awards ($)(1) |
Other ($)2) |
Total ($) |
||||||||||||||||||
| David F. Keffer |
305,000 | 244,000 | 244,000 | TBD | 142,437 | TBD | ||||||||||||||||||
| Clyde T. Nixon |
346,800 | 277,440 | 277,440 | TBD | 89,786 | TBD | ||||||||||||||||||
| Paul Nedzbala |
347,708 | 278,166 | 278,166 | TBD | 88,701 | TBD | ||||||||||||||||||
| Timothy J. Atkin |
404,917 | 323,933 | 323,933 | TBD | 146,497 | TBD | ||||||||||||||||||
| (1) | For certain qualifying terminations and a change-in-control event, (i) the value of stock options is calculated by multiplying the number of vested options (including any unvested options that would accelerate on a qualifying termination or change-in-control event) by the excess of the fair market value of common stock on June 30, 2015 over the applicable exercise price per share and (ii) the value of the restricted stock is calculated based on the fair market value of our common stock on June 30, 2015. For more information on the treatment of the named executive officers’ equity awards upon a termination or a change-in-control event, see “Effect of Termination or Change in Control on Stock Options” and “Effect of Termination or Change in Control on Restricted Stock”. At the time of filing of this Registration Statement, the fair market value of our common stock on June 30, 2015 is not known, and amounts in this column will be reported in a subsequent amendment once this amount is known. |
| (2) | Amounts in this column include the employer cost of 12 months of COBRA premiums in effect on June 30, 2015 and 6 months of outplacement costs and value of accrued vacation as of June 30, 2015. |
Effect of Termination or Change in Control on Stock Options
Termination of Employment. Upon a termination for any reason, all performance options and unvested service options will be immediately forfeited and cancelled.
Change in Control. In the event we experience a change of control, any outstanding service option will accelerate and be canceled in exchange for a cash payment equal to the change in control price minus the exercise price of the applicable option. In the case of the performance options, the vested performance options will be canceled in exchange for a cash payment equal to the change in control price minus the exercise price of the applicable option.
Effect of Termination or Change in Control on Restricted Stock
Termination of Employment. Upon a termination for any reason, all unvested restricted stock held by a named executive officer (other than Dr. Ballhaus) will be immediately forfeited and cancelled.
If Dr. Ballhaus’ employment is terminated by us for any other reason than “cause” or Dr. Ballhaus resigns for “good reason” (each as defined in his employment agreement), any unvested restricted stock that would vest on the next scheduled vesting date will become vested as of the date of termination and the remaining unvested restricted stock will be immediately forfeited and cancelled. Upon a termination for “cause” or by Dr. Ballhaus without “good reason”, any unvested restricted stock will be forfeited as of the termination date.
Change in Control. In the event of a change in control, any restricted shares will immediately vest.
95
Table of Contents
Director Compensation
Fiscal 2015 Director Compensation
Other than Dr. Volgenau, members of our Board were not compensated for their services in fiscal 2015.
Committee Interlocks and Insider Participation
For fiscal 2015, all members of the Board functioned as the Committee.
96
Table of Contents
CERTAIN RELATIONSHIPS AND RELATED PARTY TRANSACTIONS
Policies and Procedures for Related Person Transactions
Prior to the offering, our board of directors will approve policies and procedures with respect to the review and approval of certain transactions between us and a “Related Person,” or a “Related Person Transaction,” which we refer to as our “Related Person Transaction Policy.” Pursuant to the terms of the Related Person Transaction Policy, the board of directors must review and decide whether to approve or ratify any Related Person Transaction. Any potential Related Person Transaction is required to be reported to our legal department and the legal department will then determine whether it should be submitted to our Audit Committee for consideration.
For the purposes of the Related Person Transaction Policy, a “Related Person Transaction” is a transaction, arrangement, or relationship (or any series of similar transactions, arrangements, or relationships) in which we (including any of our subsidiaries) were, are or will be a participant and the amount involved exceeds $120,000, and in which any Related Person had, has, or will have a direct or indirect interest.
A “Related Person,” as defined in the Related Person Transaction Policy, means any person who is, or at any time since the beginning of our last fiscal year was, a director or executive officer of SRA, or a nominee to become a director of SRA; any person who is known to be the beneficial owner of more than five percent of our common stock; any immediate family member of any of the foregoing persons, including any child, stepchild, parent, stepparent, spouse, sibling, mother-in-law, father-in-law, son-in-law, daughter-in-law, brother-in-law, or sister-in-law of the director, executive officer, nominee, or more than five percent beneficial owner, and any person (other than a tenant or employee) sharing the household of such director, executive officer, nominee, or more than five percent beneficial owner; and any firm, corporation, or other entity in which any of the foregoing persons is a general partner or, for other ownership interests, a limited partner or other owner in which such person has a beneficial ownership interest of ten percent or more.
Stockholders Agreements
In connection with this offering, we expect to enter into an amendment to our stockholders agreement (the “Investor Stockholders Agreement”) among us, the PEP Funds, Dr. Volgenau, the Ernst Volgenau Revocable Trust and any other person who has become a party to the Investor Stockholder Agreement pursuant to the terms thereof, and to our stockholders agreement (the “Management Stockholders Agreement”) among us, the PEP Funds and our current and former employees (the “Management Stockholders”) who have acquired or are otherwise issued shares and have become parties to the Management Stockholders Agreement pursuant to the terms thereof.
The amended Investor Stockholders Agreement will contain, among other things, agreements with respect to the election of our directors. The PEP Funds shall have the right to designate nominees for our board of directors, and Dr. Volgenau will have the right to designate one nominee for our board of directors, subject, in each case, to certain conditions.
Our amended Investor Stockholders Agreement will provide the PEP Funds with certain registration rights. The amended Investor Stockholders Agreement will grant to the PEP Funds the right, at any time following this offering, to cause us, at our own expense, to use our best efforts to register shares held by the PEP Funds for public resale, including on a delayed or continuous basis, subject to certain limitations. In the event we were to file for the registration of any of our common stock following this offering, the PEP Funds also have the right to require us to use our best efforts to include in such registration statement shares of our common stock held by them, subject to certain limitations.
Our amended Investor Stockholders Agreement will also provide Dr. Volgenau with certain registration rights. The amended Investor Stockholders Agreement will grant to Dr. Volgenau the right, at least seven years
97
Table of Contents
following the closing date of the Providence Acquisition, to cause us, one time and at our own expense, to use our best efforts to register shares held by Dr. Volgenau, and entities affiliated with Dr. Volgenau, for public resale, subject to certain limitations. The amended Investor Stockholders Agreement will also grant to Dr. Volgenau the right, following the third anniversary of this offering, to cause us, two times and at our own expense, to use our best efforts to register shares held by him for public resale on a delayed or continuous basis, subject to certain limitations. In the event we were to file for the registration of any of our common stock following this offering, Dr. Volgenau, and entities affiliated with Dr. Volgenau, also have the right to require us to use our best efforts to include in such registration statement shares of our common stock held by them, subject to certain limitations.
Our amended Management Stockholders Agreement will provide the Management Stockholders with certain registration rights. In the event we were to file for the registration of any of our common stock following this offering, the Management Stockholders will have the right to require us to use our best efforts to include in such registration statement shares of our common stock held by them, subject to certain limitations, including as determined by the underwriters.
Tax Receivable Agreement
In connection with this offering, we will enter into a Tax Receivable Agreement, which will become effective upon the completion of this offering. The Tax Receivable Agreement will provide for our payment to our existing (i.e., pre-offering) stockholders of 85% of the amount of federal, state and local income tax savings, if any, that we actually realize (or are deemed to realize in certain cases) as a result of our utilization of a stepped-up tax basis in certain assets, capitalized research and development expenses, net operating losses, certain tax credits and certain other tax attributes (“Tax Attributes”), all of which are attributable to taxable periods (or portions thereof) that end on or prior to the closing of this offering.
For purposes of the Tax Receivable Agreement, savings in income tax will be computed by comparing our actual federal, state and local income tax liability to our hypothetical tax liability computed using the same methods, elections and conventions as used in computing our actual tax liability but without regard to the Tax Attributes. Our obligations under the Tax Receivable Agreement will continue until we have utilized all of the Tax Attributes (and have made payment in full in respect thereof) or the Tax Attributes have expired. Although the actual amounts and timing of the payments under the Tax Receivable Agreement will vary depending upon a number of factors, such payments are expected to be material. Assuming that, from the date of this offering, we generate taxable income each year in an amount sufficient to utilize the Tax Attributes fully and the applicable tax laws have not materially changed, we expect to make payments under the Tax Receivable Agreement aggregating approximately $ million to $ million.
The payment obligations under the Tax Receivable Agreement are ours alone and not the obligations of any of our subsidiaries or affiliates. Our existing stockholders will not be required to reimburse us for any payments that we make under the Tax Receivable Agreement with respect to any Tax Attributes, even if such Tax Attributes are subsequently disallowed or redetermined, or found to have not resulted in a savings in income tax. However, we will be permitted to offset any such overpayments against any future payments that we make under the Tax Receivable Agreement. In certain circumstances we could make payments under the Tax Receivable Agreement that would exceed our actual tax savings from the Tax Attributes.
Upon certain mergers, asset sales, other forms of business combinations or other changes in control, or if we breach any material obligations under the Tax Receivable Agreement, our obligations thereunder will become accelerated and we will be required to make a payment in an amount equal to the present value of future payments under the Tax Receivable Agreement, based on certain valuation assumptions, including the assumption that we will generate future taxable income in amounts sufficient to fully utilize the Tax Attributes. Additionally, we will generally have the right to terminate the Tax Receivable Agreement, in which case our
98
Table of Contents
obligations thereunder will also become accelerated, and we will be required to make a payment as described above. Any such payment could be substantial and could exceed our actual tax savings from the use of the Tax Attributes.
Because we are a holding company without operations of our own, our ability to make payments under the Tax Receivable Agreement is dependent on the ability of our subsidiaries to make distributions to us. Our subsidiaries may not be able to make distributions to us under the restrictions contained in the agreements governing our indebtedness, including the Existing Senior Secured Credit Facilities and the Senior Notes, in amounts sufficient to enable us to meet our payment obligations under the Tax Receivable Agreement. If we are unable to make a timely payment on account of such restrictions applicable to us or our subsidiaries or for any other reason, such payment will be deferred and will accrue interest at a rate of %.
Our existing stockholders will be permitted to assign or transfer their rights under the Tax Receivable Agreement, subject to certain limitations. The Tax Receivable Agreement will be binding on and inure to the benefit of any permitted assignee or transferee to the same extent as if such permitted assignee or transferee had been an original party to the Tax Receivable Agreement. The right of a person to the benefits of the Tax Receivable Agreement will not be contingent on such person’s ownership of an equity interest in us.
Financial Advisory Agreement
We and SRA International, Inc. are parties to a financial advisory agreement with Providence under which Providence provides us with ongoing consulting and management advisory services. The annual management fee payable under the financial advisory agreement with Providence is $1.75 million. Under this agreement, we incurred $1.8 million, $1.9 million, and $1.8 million in management fees and expenses for the period from July 21, 2011 through June 30, 2012, fiscal 2013, and fiscal 2014, respectively. The financial advisory agreement terminates by its terms on July 20, 2021, subject to automatic renewal for successive, one-year terms if Providence, together with one or more of its affiliates, continues to own any of our equity securities.
We expect to pay a termination fee of $ million to terminate the financial advisory agreement with Providence in connection with the consummation of this offering. No transaction fee will be payable to Providence as a result of this offering.
Indemnification Agreements
The financial advisory agreement described above includes an indemnification provision pursuant to which the Company and SRA International, Inc., subject to certain limitations, agreed to indemnify Providence and its officers, employees, agents, representatives, members and affiliates, from and against any and all costs, expenses, liabilities claims, damages, and losses relating to or arising out of the engagement of Providence pursuant to the financial advisory agreement, or the performance by Providence of the services pursuant thereto.
Our amended and restated certificate of incorporation and our amended and restated by-laws will require us to indemnify and advance expenses to our directors and officers to the fullest extent not prohibited by the DGCL and other applicable law, except in the case of a proceeding instituted by a director without the approval of our board of directors. See “Description of Capital Stock—Limitations on Liability and Indemnification.”
SRA International, Inc. Debt
As of June 30, 2012, Providence affiliates owned $11.7 million of SRA International, Inc.’s Term Loan B Facility. During fiscal 2012 and 2013, the Providence affiliates sold all of their interest in SRA International, Inc.’s Term Loan B Facility. Interest payments of approximately $1.0 million and $0.4 million were made for this portion of the Term Loan B Facility during the period from July 21, 2011 through June 30, 2012, and fiscal 2013, respectively.
99
Table of Contents
Transactions with Other Related Parties
In connection with financing the Providence Acquisition, Dr. Ernst Volgenau was issued a promissory note for a principal amount up to $30 million at an annual interest rate of 4.25%, repayable solely based on proceeds from planned divestitures. This note is expected to be settled for $17 million, based on the total net proceeds and tax benefits related to the disposal of the discontinued operations. As of March 31, 2015, approximately $12 million of this note was paid.
Kathleen Yoshida, the daughter of Joseph P. Burke, a former executive officer and current chief technology officer of the Company, is employed by the Company as a vice president. For fiscal 2013 and 2014, her salary and other compensation paid by the Company totaled $0.2 million. Ms. Yoshida participates in the Company’s 401(k) plan and is eligible to receive matching contributions in accordance with Company policy, and received an annual equity award in fiscal 2013 in an amount consistent with the fiscal 2013 equity award grants made to similarly situated employees.
From time to time, and in the ordinary course of business the Company purchases goods and services from other Providence portfolio companies. Costs associated with these related party transactions for the period from July 21, 2011 through June 30, 2012, fiscal 2013 and 2014 were $8.2 million, $7.6 million, and $5.3 million, respectively. Costs associated with these related party transactions for the nine months ended March 31, 2015 were $7.6 million.
As of June 30, 2014, there were no amounts due from related parties and $0.6 million due to related parties, which was included in accounts payable and accrued expenses in the accompanying condensed consolidated balance sheet. As of March 31, 2015, there were no amounts due from related parties and $0.2 million due to related parties, which was included in accounts payable and accrued expenses in the accompanying condensed consolidated balance sheet.
100
Table of Contents
DESCRIPTION OF CERTAIN INDEBTEDNESS
Existing Senior Secured Credit Facilities
On the closing date of the Providence Acquisition, SRA International, Inc., or the Borrower, entered into a credit agreement, dated as of July 20, 2011, which we refer to as the Existing Credit Agreement, by and among Sterling Parent LLC, Sterling Merger Inc. (subsequently merged into SRA International, Inc.), Citibank, N.A., as administrative agent, and the other financial institutions and lenders from time to time party thereto, providing for the Term Loan B Facility (as described herein) and the Existing Revolver (as described herein). The following is a description of the principal terms of the credit agreement and the related documents governing the Existing Senior Secured Credit Facilities.
Overview
On July 20, 2011, we entered into an $875.0 million term loan facility, which we refer to as the Term Loan B Facility, with a term of seven years. On the same date we also entered into a $100.0 million revolving credit facility with a term of five years, which we refer to as the Existing Revolver. We refer to the Existing Revolver and the Term Loan B Facility, together, as the Existing Senior Secured Credit Facilities. The terms and conditions of the Existing Revolver and the Term Loan B Facility are documented in a single credit agreement, the Existing Credit Agreement, and are subject to extension pursuant to the terms set forth in the Existing Credit Agreement. The Existing Revolver includes sub-facilities for letters of credit and swingline loans, which are subject to $40.0 million and $15.0 million sub-limits, respectively.
Subject to specified conditions, without the consent of the then existing lenders (but subject to the receipt of commitments), incremental term and revolving facilities may be added to the Existing Credit Agreement and revolving commitments may be increased by up to (i) $250.0 million plus (ii) an additional amount as will not cause the net senior secured leverage ratio on a pro forma basis to exceed 4.50 to 1.00 (calculated as if any additional revolving commitment being entered into was fully drawn). Incremental revolving facilities and revolving commitment increases are subject to an aggregate sub-limit of $100.0 million.
As of March 31, 2015, approximately $664.2 million of term loan borrowings were outstanding under the Term Loan B Facility and unused commitments under the Existing Revolver totaled $100.0 million.
Maturity; prepayments
The Term Loan B Facility has a maturity date of July 20, 2018, and the Existing Revolver has a maturity date of July 20, 2016. The Borrower is required to repay principal amounts under the Term Loan B Facility in equal quarterly installments in aggregate annual amounts equal to 1% of the original funded principal amount, with the balance being payable on the final maturity date.
The Term Loan B Facility is subject to mandatory prepayment and reduction, subject to certain exceptions, in an amount equal to (a) 75% (reduced to 50% when the net senior secured leverage ratio is less than or equal to 3.50 to 1.00 but greater than 2.75 to 1.00, to 25% when the net senior secured leverage ratio is less than or equal to 2.75:1.00 but greater than 2.00 to 1.00, and to 0% when the net senior secured leverage ratio is less than or equal to 2.00 to 1.00) of Excess Cash Flow (as defined in the Existing Credit Agreement), (b) 100% of the net cash proceeds received from the incurrence of indebtedness by Sterling Parent LLC, the Borrower or any restricted subsidiary of the Borrower (other than indebtedness permitted under the Existing Credit Agreement), and (c) 100% of the net cash proceeds of specified non-ordinary course asset sales or other dispositions of property received by or on behalf of Sterling Parent LLC, the Borrower or any restricted subsidiary of the Borrower (including insurance and condemnation proceeds), subject to customary exceptions and the right to reinvest such proceeds within a specified period of time.
101
Table of Contents
Voluntary prepayments of borrowings under the Term Loan B Facility and Existing Revolver are permitted at any time, subject to (a) reimbursement of the lenders’ redeployment costs actually incurred in the case of a prepayment of adjusted LIBOR borrowings other than on the last day of the relevant interest period and (b) for partial prepayments, minimum amounts. The Borrower may offer to lenders pro rata voluntary prepayments of borrowings under the Term Loan B Facility at discount to par, subject to customary conditions. The unutilized portion of commitments under the Existing Revolver may be reduced or terminated at any time in minimum amounts without penalty.
The interest and the amortization schedule of any incremental term loans, and interest on any incremental revolving loans, are determined by the borrower and the lenders of such incremental term loans and/or incremental revolving loans.
Guarantees; security
All obligations under the Existing Senior Secured Credit Facilities are unconditionally guaranteed by Sterling Parent LLC and each of the Borrower’s existing and subsequently acquired or organized direct or indirect wholly owned domestic subsidiaries, subject to customary exceptions.
In addition, all of the Borrower’s obligations and the obligations of each guarantor under the Existing Senior Secured Credit Facilities are secured by a perfected security interest in substantially all of our existing and after acquired tangible and intangible assets and such assets of each guarantor, including our capital stock, the capital stock of each of the Borrower’s U.S. subsidiaries, the capital stock of each guarantor and its domestic subsidiaries, and 65% of each series of capital stock of any non-U.S. subsidiary held directly by us or any guarantor, subject to agreed exceptions.
Interest Rate
The loans under the Existing Credit Agreement initially bear interest at a rate equal to (i) the British Bankers Association LIBOR (adjusted for maximum reserves and subject to a floor in the case of the Term Loan B Facility of 1.25%) plus 5.25% for each of the Term Loan B Facility and the Existing Revolver (subject in the case of the Existing Revolver to a 0.25% step-down based on the achievement of a net senior secured leverage ratio of less than 3.50 to 1.00), or (ii) the highest of (subject to a floor in respect of the Term Loan B Facility of 2.25%) (x) the prime commercial lending rate publicly announced by the administrative agent as the “prime rate,” (y) the federal funds effective rate plus 0.50%, and (z) the one-month LIBOR rate (adjusted for maximum reserves) plus 1.00%, plus, in each case, 4.25% for each of the Term Loan B Facility and the Existing Revolver (subject in the case of the Existing Revolver to a 0.25% step-down based on the achievement of a net senior secured leverage ratio of less than 3.50 to 1.00).
Fees
The Borrower is required to pay certain fees with respect to the Existing Senior Secured Credit Facilities, including (i) a commitment fee of 0.50% per annum on the average daily unused amount of the revolving credit facility, (ii) a participation fee of 5.25% per annum (subject to a 0.25% step-down based on the achievement of a net senior secured leverage ratio of less than 3.50 to 1.00) with respect to letters of credit, (iii) fronting fees of 0.125% per annum on the daily aggregate stated amount of letters of credit, and (iv) customary administrative fees.
Covenants; representations and warranties
The Existing Credit Agreement contains customary representations and warranties and customary affirmative and negative covenants. The negative covenants limit, among other things: the incurrence or guarantee of additional indebtedness, the incurrence of additional liens, mergers, consolidations, or transfers of
102
Table of Contents
all or substantially all assets, investments and acquisitions, asset sales, dividends, distributions and other restricted payments, the repurchase, prepayment or redemption of junior indebtedness, transactions with affiliates, further negative pledges or other restrictive agreements, lines of business and the activities of Sterling Parent LLC, the modification of certain debt instruments or organizational documents, and the release of guarantees under the Existing Credit Agreement and related documents, in each case subject to customary baskets and important exceptions.
In addition, at any time during which borrowings or letters of credit under the Existing Revolver are outstanding, the Sterling Parent LLC must maintain a maximum net senior secured leverage ratio, tested on a quarterly basis. The maximum level of net senior secured leverage ratio was set at 6.25 to 1.00 for the first quarter of fiscal 2012, and was subject to step-downs until reaching 4.50 to 1.00 for the third quarter of fiscal 2015 and thereafter.
Events of default
The Existing Credit Agreement provides for customary events of default, including: nonpayment of principal or premium (if any) when due, nonpayment of interest, fees or other amounts, inaccuracy of representations or warranties in any material respect, violation of other covenants, obligations or agreements, cross defaults to other material debt, certain bankruptcy or insolvency events, certain ERISA events, certain material judgments, actual or asserted invalidity of material guarantees or security interests or certain other loan document obligations, and changes of control, in each case subject to customary thresholds, notice and grace period provisions.
Senior Notes due 2019
On the closing date of the Providence Acquisition, SRA International, Inc. issued $400 million aggregate principal amount of senior notes, which we refer to as the Senior Notes, pursuant to the indenture, dated as of July 20, 2011, among SRA International, Inc., Sterling Merger Inc. (subsequently merged into SRA International, Inc.), the subsidiary guarantors party thereto, and Wilmington Trust, National Association, as trustee. The Senior Notes bear interest at a rate of 11% per annum.
Guarantees
The Senior Notes are jointly and severally irrevocably and unconditionally guaranteed, on an unsecured senior basis, by each of SRA International, Inc.’s existing and subsequently acquired or organized direct or indirect wholly owned domestic subsidiaries, subject to customary exceptions, that guarantees the Existing Senior Secured Credit Facilities.
Optional redemption
We may redeem the notes, in whole or in part, at any time prior to October 1, 2015 at a price equal to 100% of the aggregate principal amount of the notes redeemed plus accrued and unpaid interest, if any, to the redemption date plus the applicable “make whole” premium. We may redeem the notes, in whole or in part, at any time on or after October 1, 2015, at the redemption prices specified in the indenture governing the Senior Notes, plus accrued and unpaid interest, if any, to the redemption date.
Repurchases
If we experience specific kinds of changes of control, we must offer to repurchase all of the notes at 101% of their principal amount, plus accrued and unpaid interest, if any, to the repurchase date. If we engage in certain asset sales, and do not reinvest such proceeds in the business or otherwise use such proceeds as required by the
103
Table of Contents
indenture within 12 months, we may be required to use the net cash proceeds from such sales to make an offer to repurchase notes with such proceeds. The purchase price of each note so purchased will be 100% of its principal amount, plus accrued and unpaid interest and special interest, if any, to the date of purchase.
Covenants
The indenture governing the Senior Notes contains customary affirmative and negative covenants. The negative covenants limit, among other things: the incurrence or guarantee of additional indebtedness or issuance of certain disqualified stock or preferred stock, the incurrence of liens, dividends, distributions and other restricted payments, investments, mergers, consolidations, or transfers of all or substantially all assets, asset sales, and transactions with affiliates, in each case subject to customary baskets and exceptions.
104
Table of Contents
The following table sets forth information as of June 30, 2015 with respect to the ownership of our common stock by:
| • | each person known to own beneficially more than five percent of our common stock; |
| • | each of our directors; |
| • | each of our named executive officers; and |
| • | all of our current executive officers and directors as a group. |
The amounts and percentages of shares beneficially owned are reported on the basis of regulations of the SEC governing the determination of beneficial ownership of securities. Under SEC rules, a person is deemed to be a “beneficial owner” of a security if that person has or shares voting power or investment power, which includes the power to dispose of or to direct the disposition of such security. A person is also deemed to be a beneficial owner of any securities of which that person has a right to acquire beneficial ownership within 60 days. Securities that can be so acquired are deemed to be outstanding for purposes of computing such person’s ownership percentage, but not for purposes of computing any other person’s percentage. Under these rules, more than one person may be deemed to be a beneficial owner of the same securities, and a person may be deemed to be a beneficial owner of securities as to which such person has no economic interest.
Percentage computations are based on shares of our common stock outstanding as of , 2015, as adjusted to reflect a -for- stock split of our common stock to be effected on , 2015 and shares outstanding following this offering (or shares if the underwriters exercise in full their option to purchase additional shares).
Except as otherwise indicated in these footnotes, each of the beneficial owners listed has, to our knowledge, sole voting and investment power with respect to the indicated shares of common stock. Addresses for the beneficial owners are set forth in the footnotes to the table.
| Shares Beneficially Owned Before the Offering and After the Offering Assuming the Underwriters’ Option is Not Exercised(1) |
Shares Beneficially Owned After the Offering Assuming the Underwriters’ Option is Exercised in Full | |||||||||
| Name of Beneficial Owner |
Number of Shares Owned |
Percent of Class Before the Offering (%) |
Percent of Class After the Offering (%) |
Number | Percent | |||||
| Providence Equity Partners L.L.C. managed funds(2) |
||||||||||
| Ernst Volgenau(3) |
||||||||||
| William L. Ballhaus(4)(5) |
||||||||||
| David F. Keffer(4)(5) |
||||||||||
| Clyde T. Nixon(4)(5) |
||||||||||
| Paul Nedzbala(4)(5) |
||||||||||
| Timothy J. Atkin(4)(5) |
||||||||||
| Christopher C. Ragona(6) |
||||||||||
| Charles E. Gottdiener(6) |
||||||||||
| All current directors and executive officers as a group (9 persons)(4)(5) |
||||||||||
| * | Less than one percent. |
| (1) | We have granted the Underwriters an option to purchase up to an additional shares. |
105
Table of Contents
| (2) | Represents the following shares: (i) shares of common stock held by Providence Equity Partners VI L.P.; and (ii) shares of common stock held by Providence Equity Partners VI-A L.P. The general partner of each of Providence Equity Partners VI L.P. and Providence Equity Partners VI-A L.P. is Providence Equity GP VI L.P., whose general partner is Providence Equity Partners VI L.L.C. Providence Equity Partners VI L.L.C. is managed by its managing member, Providence Fund Holdco (Domestic ECI) L.P., whose general partner is Providence Managing Member L.L.C., which in turn is controlled by Jonathan M. Nelson, Glenn M. Creamer and Paul J. Salem. |
Investment and voting decisions with respect to shares held by each of Providence Equity Partners VI L.P. and Providence Equity Partners VI-A L.P. are made by their general partner, Providence Equity GP VI L.P.
Each of Jonathan M. Nelson, Glenn M. Creamer, and Paul J. Salem expressly disclaims beneficial ownership of the shares held by Providence Equity Partners VI L.P. and Providence Equity Partners VI-A L.P.
The address for each of Providence Equity Partners VI L.P., Providence Equity Partners VI-A L.P., Jonathan M. Nelson, Glenn M. Creamer, and Paul J. Salem is c/o Providence Equity Partners L.L.C., 50 Kennedy Plaza, 18th Floor, Providence, Rhode Island 02903.
| (3) | Represents the following shares: (i) shares of common stock held by entities affiliated with Ernst Volgenau; and (ii) shares of common stock held by The Volgenau Rollover Trust. Ernst Volgenau has sole voting and dispositive power over such shares. The address for Dr. Volgenau and The Volgenau Rollover Trust is c/o SRA Companies, Inc., 4350 Fair Lakes Court, Fairfax, Virginia 22033. |
| (4) | The business address for these persons is c/o SRA Companies, Inc., 4350 Fair Lakes Court, Fairfax, Virginia 22033. |
| (5) | Includes shares which the current executive officers have the right to acquire prior to , 2015 through the exercise of stock options: Dr. Ballhaus, shares, Mr. Keffer, shares, Mr. Nixon, shares, Mr. Nedzbala, shares, and Mr. Atkin, shares. All current executive officers as a group have the right to acquire shares prior to , 2015 through the exercise of stock options. |
| (6) | Does not include common stock held by the PEP Funds. Messrs. Ragona and Gottdiener are directors of SRA Companies, Inc. and managing directors of Providence Equity Partners L.L.C. They expressly disclaim beneficial ownership of the shares held by the PEP Funds. The address for Messrs. Ragona and Gottdiener is c/o Providence Equity Partners, L.L.C., 50 Kennedy Plaza, 18th Floor, Providence, Rhode Island 02903. |
106
Table of Contents
In connection with this offering, we will amend and restate our certificate of incorporation and by-laws. The following descriptions of our capital stock, amended and restated certificate of incorporation, and amended and restated by-laws are intended as summaries only and are qualified in their entirety by reference to our amended and restated certificate of incorporation and amended and restated by-laws, which will become effective upon the listing of our common stock on the and will be filed as exhibits to the registration statement of which this prospectus forms a part, and to the applicable provisions of the DGCL.
General
Upon the listing of our common stock, our authorized capital stock will consist of shares of common stock, par value $0.01 per share and shares of undesignated preferred stock, par value $0.01 per share. Upon the listing of our common stock, there will be shares of our common stock issued and outstanding (assuming that the underwriters do not exercise their option to purchase additional shares), not including shares of our common stock issuable upon the exercise of outstanding stock options.
Common Stock
Holders of common stock will be entitled:
| • | to cast one vote for each share held of record on all matters submitted to a vote of the stockholders; |
| • | to receive, on a pro rata basis, dividends and distributions, if any, that our board of directors may declare out of legally available funds, subject to preferences that may be applicable to preferred stock, if any, then outstanding; and |
| • | upon our liquidation, dissolution or winding up, to share equally and ratably in any assets remaining after the payment of all debt and other liabilities, subject to the prior rights, if any, of holders of any outstanding shares of preferred stock. |
Our ability to pay dividends on our common stock is subject to our subsidiaries’ ability to pay dividends to us, which is in turn subject to the restrictions set forth in the agreements governing our indebtedness. See “Dividend Policy.”
The holders of our common stock will not have any preemptive, cumulative voting, subscription, conversion, redemption, or sinking fund rights. The common stock will not be subject to future calls or assessments by us. The rights and privileges of holders of our common stock are subject to any series of preferred stock that we may issue in the future, as described below.
Before the date of this prospectus, there has been no public market for our common stock.
As of March 31, 2015, we had 516,923 shares of common stock outstanding and 23 holders of record of common stock. The number of shares has not yet been adjusted to reflect our anticipated stock split prior to the completion of this offering.
Preferred Stock
Under our amended and restated certificate of incorporation, our board of directors will have the authority, without further action by our stockholders, to issue up to shares of preferred stock in one or more series and to fix the voting powers, designations, preferences and the relative participating, optional, or other special rights and qualifications, limitations, and restrictions of each series, including dividend rights, dividend rates, conversion rights, voting rights, terms of redemption, liquidation preferences, and the number of shares
107
Table of Contents
constituting any series. Upon completion of this offering, no shares of our authorized preferred stock will be outstanding. Because the board of directors will have the power to establish the preferences and rights of the shares of any additional series of preferred stock, it may afford holders of any preferred stock preferences, powers and rights, including voting and dividend rights, senior to the rights of holders of our common stock, which could adversely affect the holders of the common stock and could delay, discourage or prevent a takeover of us even if a change of control of our company would be beneficial to the interests of our stockholders.
Annual Stockholders Meeting
Our amended and restated by-laws will provide that annual stockholder meetings will be held at a date, time and place, if any, as exclusively selected by our board of directors. To the extent permitted under applicable law, we may conduct meetings by remote communications, including by webcast.
Voting
The affirmative vote of a plurality of the shares of our common stock present, in person or by proxy, at the meeting and entitled to vote on the election of directors will decide the election of any directors, and the affirmative vote of a majority of the shares of our common stock present, in person or by proxy, at the meeting and entitled to vote at any annual or special meeting of stockholders will decide all other matters voted on by stockholders, unless the question is one upon which, by express provision of law, under our amended and restated certificate of incorporation, or under our amended and restated by-laws, a different vote is required, in which case such provision will control.
Anti-Takeover Effects of our Certificate of Incorporation and By-Laws
The provisions of our amended and restated certificate of incorporation and amended and restated by-laws summarized below may have an anti-takeover effect and may delay, defer or prevent a tender offer or takeover attempt that you might consider in your best interest, including an attempt that might result in your receipt of a premium over the market price for your shares. These provisions are also designed, in part, to encourage persons seeking to acquire control of us to first negotiate with our board of directors, which could result in an improvement of their terms.
Authorized but Unissued Shares of Common Stock. We are issuing shares of our authorized common stock in this offering ( if the underwriters exercise their option to purchase additional shares in full). The remaining shares of authorized and unissued common stock will be available for future issuance without additional stockholder approval. While the additional shares are not designed to deter or prevent a change of control, under some circumstances we could use the additional shares to create voting impediments or to frustrate persons seeking to effect a takeover or otherwise gain control by, for example, issuing those shares in private placements to purchasers who might side with our board of directors in opposing a hostile takeover bid.
Authorized but Unissued Shares of Preferred Stock. Under our amended and restated certificate of incorporation, our board of directors will have the authority, without further action by our stockholders, to issue up to shares of preferred stock in one or more series and to fix the voting powers, designations, preferences and the relative participating, optional or other special rights and qualifications, limitations and restrictions of each series, including dividend rights, dividend rates, conversion rights, voting rights, terms of redemption, liquidation preferences and the number of shares constituting any series. The existence of authorized but unissued preferred stock could reduce our attractiveness as a target for an unsolicited takeover bid since we could, for example, issue shares of preferred stock to parties who might oppose such a takeover bid or shares that contain terms the potential acquiror may find unattractive. This may have the effect of delaying or preventing a change of control, may discourage bids for the common stock at a premium over the market price of the common stock, and may adversely affect the market price of, and the voting and other rights of the holders of, our common stock.
108
Table of Contents
Classified Board of Directors. Upon the listing of our common stock, in accordance with the terms of our amended and restated certificate of incorporation, our board of directors will be divided into three classes, Class I, Class II and Class III, with members of each class serving staggered three-year terms. Under our amended and restated certificate of incorporation, our board of directors will consist of such number of directors as may be determined from time to time by resolution of the board of directors, but in no event may the number of directors be less than one. Any additional directorships resulting from an increase in the number of directors will be distributed among the three classes so that, as nearly as possible, each class will consist of one-third of the directors. Our amended and restated certificate of incorporation will also provide that any vacancy on our board of directors, including a vacancy resulting from an enlargement of our board of directors, may be filled only by the affirmative vote of a majority of our directors then in office, even if less than a quorum, or by a sole remaining director, subject to our amended stockholders agreement with respect to the director designation rights of the PEP Funds and Dr. Volgenau. Any director elected to fill a vacancy will hold office until such director’s successor shall have been duly elected and qualified or until such director’s earlier death, resignation or removal. Our classified board of directors could have the effect of delaying or discouraging an acquisition of us or a change in our management.
Removal of Directors. Our amended and restated certificate of incorporation will provide that directors may be removed with or without cause at any time upon the affirmative vote of holders of at least a majority of the outstanding shares of common stock then entitled to vote at an election of directors until the PEP Funds cease to own at least % of the outstanding shares of our common stock. Thereafter, our amended and restated certificate of incorporation will provide that directors may be removed only for cause upon the affirmative vote of holders of at least 75% of the outstanding shares of common stock then entitled to vote at an election of directors.
Special Meetings of Stockholders. Our amended and restated certificate of incorporation will provide that a special meeting of stockholders may be called only by the Chairman of our board of directors or by a resolution adopted by a majority of our board of directors. Special meetings may also be called by our corporate secretary at the request of the holders of at least a majority of the outstanding shares of our common stock until the PEP Funds cease to own at least % of the outstanding shares of our common stock. Thereafter, stockholders will not be permitted to call a special meeting of stockholders.
Stockholder Advance Notice Procedure. Our amended and restated by-laws will establish an advance notice procedure for stockholders to make nominations of candidates for election as directors or to bring other business before an annual meeting of our stockholders. The amended and restated by-laws will provide that any stockholder wishing to nominate persons for election as directors at, or bring other business before, an annual meeting must deliver to our corporate secretary a written notice of the stockholder’s intention to do so. These provisions may have the effect of precluding the conduct of certain business at a meeting if the proper procedures are not followed. We expect that these provisions may also discourage or deter a potential acquirer from conducting a solicitation of proxies to elect the acquirer’s own slate of directors or otherwise attempting to obtain control of our company. To be timely, the stockholder’s notice must be delivered to our corporate secretary at our principal executive offices not less than 90 days nor more than 120 days before the first anniversary date of the annual meeting for the preceding year; provided, however, that in the event that the annual meeting is set for a date that is more than 30 days before or more than 70 days after the first anniversary date of the preceding year’s annual meeting, a stockholder’s notice must be delivered to our corporate secretary (x) not less than 90 days nor more than 120 days prior to the meeting or (y) no later than the close of business on the 10th day following the day on which a public announcement of the date of the meeting is first made by us.
No Stockholder Action by Written Consent. Our amended and restated certificate of incorporation will provide that stockholder action may be taken only at an annual meeting or special meeting of stockholders, provided that stockholder action may be taken by written consent in lieu of a meeting until the PEP Funds cease to own at least % of the outstanding shares of our common stock.
109
Table of Contents
Amendments to Certificate of Incorporation and By-Laws. Our amended and restated certificate of incorporation will provide that our amended and restated certificate of incorporation may be amended by both the affirmative vote of a majority of our board of directors and the affirmative vote of the holders of a majority of the outstanding shares of our common stock then entitled to vote at any annual or special meeting of stockholders; provided that, at any time when the PEP Funds cease to own at least % of the outstanding shares of our common stock, specified provisions of our amended and restated certificate of incorporation may not be amended, altered or repealed unless the amendment is approved by the affirmative vote of the holders of at least 75% of the outstanding shares of our common stock then entitled to vote at any annual or special meeting of stockholders, including the provisions governing:
| • | liability and indemnification of directors; |
| • | corporate opportunities; |
| • | the ability of stockholders to act by written consent; |
| • | the ability of stockholders to call a special meeting; |
| • | removal of directors for cause; and |
| • | our classified board of directors. |
In addition, our amended and restated by-laws may be amended, altered or repealed, or new by-laws may be adopted, by the affirmative vote of a majority of the board of directors, or by the affirmative vote of the holders of (x) as long as the PEP Funds own at least % of the outstanding shares of our common stock, at least a majority, and (y) thereafter, at least 75%, of the outstanding shares of our common stock then entitled to vote at any annual or special meeting of stockholders.
These provisions make it more difficult for any person to remove or amend any provisions in our amended and restated certificate of incorporation and amended and restated by-laws that may have an anti-takeover effect.
Section 203 of the Delaware General Corporation Law. In our amended and restated certificate of incorporation, we will elect not to be governed by Section 203 of the DGCL, as permitted under and pursuant to subsection (b)(3) of Section 203, until the first date on which the PEP Funds cease to beneficially own (directly or indirectly) at least 15% of the outstanding shares of our common stock. Section 203 prohibits a publicly held Delaware corporation from engaging in a business combination, such as a merger, with a person or group owning 15% or more of the corporation’s outstanding voting stock for a period of three years following the date the person became an interested stockholder, unless (with certain exceptions) the business combination or the transaction in which the person became an interested stockholder is approved in a prescribed manner. Accordingly, we will not be subject to any anti-takeover effects of Section 203 until such time as the PEP Funds cease to beneficially own at least 15% of the outstanding shares of our common stock.
Limitations on Liability and Indemnification
Our amended and restated certificate of incorporation will contain provisions permitted under DGCL relating to the liability of directors. These provisions will eliminate a director’s personal liability for monetary damages resulting from a breach of fiduciary duty, except in circumstances involving:
| • | any breach of the director’s duty of loyalty; |
| • | acts or omissions not in good faith or which involve intentional misconduct or a knowing violation of the law; |
| • | Section 174 of the DGCL (unlawful dividends); or |
| • | any transaction from which the director derives an improper personal benefit. |
110
Table of Contents
The principal effect of the limitation on liability provision is that a stockholder will be unable to prosecute an action for monetary damages against a director unless the stockholder can demonstrate a basis for liability for which indemnification is not available under the DGCL. These provisions, however, should not limit or eliminate our rights or any stockholder’s rights to seek non-monetary relief, such as an injunction or rescission, in the event of a breach of director’s fiduciary duty. These provisions will not alter a director’s liability under federal securities laws. The inclusion of this provision in our amended and restated certificate of incorporation may discourage or deter stockholders or management from bringing a lawsuit against directors for a breach of their fiduciary duties, even though such an action, if successful, might otherwise have benefited us and our stockholders. In addition, your investment may be adversely affected to the extent we pay costs of settlement and damage awards against directors and officers pursuant to these indemnification provisions.
Our amended and restated certificate of incorporation and our amended and restated by-laws will require us to indemnify and advance expenses to our directors and officers to the fullest extent not prohibited by the DGCL and other applicable law, except in the case of a proceeding instituted by a director without the approval of our board of directors. Our amended and restated certificate of incorporation and our amended and restated by-laws will provide that we are required to indemnify our directors and executive officers, to the fullest extent permitted by law, for all judgments, fines, settlements, legal fees and other expenses incurred in connection with pending or threatened legal proceedings because of the director’s or officer’s positions with us or another entity that the director or officer serves at our request, subject to various conditions, and to advance funds to our directors and officers to enable them to defend against such proceedings. To receive indemnification, the director or officer must have been successful in the legal proceeding or have acted in good faith and in what was reasonably believed to be a lawful manner in our best interest and, with respect to any criminal proceeding, have had no reasonable cause to believe his or her conduct was unlawful.
Corporate Opportunities
Our amended and restated certificate of incorporation will provide that we, on our behalf and on behalf of our subsidiaries, renounce any interest or expectancy in, or in being offered an opportunity to participate in, corporate opportunities, that are from time to time presented to the PEP Funds or any of its officers, directors, employees, agents, stockholders, members, partners, affiliates, or subsidiaries (other than us and our subsidiaries), even if the opportunity is one that we or our subsidiaries might reasonably be deemed to have pursued or had the ability or desire to pursue if granted the opportunity to do so. Neither the PEP Funds nor any of their officers, directors, employees, agents, stockholders, members, partners, affiliates, or subsidiaries will generally be liable to us or any of our subsidiaries for breach of any fiduciary or other duty, as a director or otherwise, by reason of the fact that such person pursues or acquires such corporate opportunity, directs such corporate opportunity to another person, or fails to present such corporate opportunity, or information regarding such corporate opportunity, to us or our subsidiaries unless, in the case of any such person who is a director or officer of SRA, such corporate opportunity is expressly offered to such director or officer in writing solely in his or her capacity as a director or officer of SRA. Stockholders will be deemed to have notice of and consented to this provision of our amended and restated certificate of incorporation.
Choice of Forum
Our amended and restated certificate of incorporation will provide that the Court of Chancery of the State of Delaware will be the sole and exclusive forum for (i) any derivative action or proceeding brought on our behalf, (ii) any action asserting a claim of breach of a fiduciary duty owed to us or our stockholders by any of our directors, officers, employees, or agents, (iii) any action asserting a claim against us arising under the DGCL or (iv) any action asserting a claim against us that is governed by the internal affairs doctrine. We may consent in writing to alternative forums. By becoming a stockholder in our company, you will be deemed to have notice of and have consented to the provisions of our amended and restated certificate of incorporation related to choice of forum.
111
Table of Contents
Market Listing
We have applied to list the common stock on the under the symbol “ .”
Transfer Agent and Registrar
Upon the listing of our common stock, the transfer agent and registrar for our common stock will be .
112
Table of Contents
SHARES AVAILABLE FOR FUTURE SALE
Immediately prior to this offering, there was no public market for our common stock. Sales of substantial amounts of our common stock in the public market could adversely affect prevailing market prices of our common stock. Some shares of our common stock will not be available for sale for a certain period of time after this offering because they are subject to contractual and legal restrictions on resale some of which are described below. Sales of substantial amounts of common stock in the public market after these restrictions lapse, or the perception that these sales could occur, could adversely affect the prevailing market price and our ability to raise equity capital in the future.
Sales of Restricted Securities
After this offering, shares of our common stock will be outstanding, assuming that the underwriters do not exercise their option to purchase additional shares. Of these shares, all of the shares sold in this offering will be freely tradable without restriction under the Securities Act, unless purchased by our “affiliates,” as that term is defined in Rule 144 under the Securities Act. The remaining shares of our common stock that will be outstanding after this offering are “restricted securities” within the meaning of Rule 144 under the Securities Act. Restricted securities may be sold in the public market only if they are registered under the Securities Act or are sold pursuant to an exemption from registration under Rule 144 or Rule 701 under the Securities Act, which are summarized below. Subject to the lock-up agreements described below, shares held by our affiliates that are not restricted securities or that have been owned for more than one year may be sold subject to compliance with Rule 144 of the Securities Act without regard to the prescribed one-year holding period under Rule 144.
Stock Options
Upon completion of this offering, we intend to file one or more registration statements under the Securities Act to register the shares of common stock to be issued under our stock incentive plan and, as a result, all shares of common stock acquired upon the exercise of stock options and other equity-based awards granted under these plans will, subject to a 180-day lock-up period, also be freely tradable under the Securities Act unless purchased by our affiliates. A total of shares of common stock are subject to outstanding stock options previously granted under our stock incentive plan as of 2015, and an additional shares of common stock are available for grants of additional equity awards in the future under our stock incentive plan.
Lock-up Agreements
Upon completion of the offering, our directors and executive officers, and stockholders currently representing substantially all of the outstanding shares of our common stock will have signed lock-up agreements, under which they will agree not to sell, transfer or dispose of, directly or indirectly, any shares of our common stock or any securities convertible into or exercisable or exchangeable for shares of our common stock without the prior written consent of for a period of 180 days, subject to possible extension under certain circumstances, after the date of this prospectus. These agreements are described below under “Underwriting.”
Stockholders Agreements—Registration Rights
Stockholders currently representing substantially all of the outstanding shares of our common stock will have the right to require us to register shares of common stock for resale under certain circumstances. See “Certain Relationships and Related Party Transactions—Stockholders Agreements.”
Rule 144
In general, under Rule 144, as currently in effect, a person (or persons whose shares are aggregated) who is not deemed to be or have been one of our affiliates for purposes of the Securities Act at any time during 90 days
113
Table of Contents
preceding a sale and who has beneficially owned the shares proposed to be sold for at least six months, including the holding period of any prior owner other than an affiliate, is entitled to sell such shares without registration, subject to compliance with the public information requirements of Rule 144. If such a person has beneficially owned the shares proposed to be sold for at least one year, including the holding period of a prior owner other than an affiliate, then such person is entitled to sell such shares without complying with any of the requirements of Rule 144.
In general, under Rule 144, as currently in effect, our affiliates, or persons selling shares on behalf of our affiliates, who have met the six-month holding period for beneficial ownership of “restricted shares” of our common stock, are entitled to sell, within any three-month period, a number of shares that does not exceed the greater of:
| • | 1% of the number of shares of our common stock then outstanding, which will equal approximately shares immediately after this offering, assuming the underwriters do not exercise their option to purchase additional shares; and |
| • | the average reported weekly trading volume of our common stock on the during the four calendar weeks preceding the date of filing a Notice of Proposed Sale of Securities Pursuant to Rule 144 with respect to the sale. |
Sales under Rule 144 by our affiliates, or persons selling shares on behalf of our affiliates, are also subject to certain manner of sale provisions and notice requirements, and to the availability of current public information about us. The sale of these shares, or the perception that sales will be made, could adversely affect the price of our common stock after this offering because a great supply of shares would be, or would be perceived to be, available for sale in the public market.
Rule 701
Any of our employees, officers or directors who acquired shares under a written compensatory plan or contract may be entitled to sell them in reliance on Rule 701. Rule 701 permits affiliates to sell their Rule 701 shares under Rule 144 without complying with the holding period requirements of Rule 144. Rule 701 further provides that non-affiliates may sell these shares in reliance on Rule 144 without complying with the holding period, public information, volume limitation or notice provisions of Rule 144. However, substantially all shares issued under Rule 701 are subject to lock-up agreements and will only become eligible for sale when the 180-day lock-up agreements expire.
114
Table of Contents
U.S. FEDERAL TAX CONSIDERATIONS FOR NON-U.S. HOLDERS
The following is a discussion of certain material U.S. federal income tax considerations relating to the purchase, ownership and disposition of our common stock by Non-U.S. Holders (as defined below) that purchase our common stock pursuant to this offering and hold such common stock as a capital asset. This discussion is based on the Code, U.S. Treasury regulations promulgated or proposed thereunder, and administrative and judicial interpretations thereof, all as in effect on the date hereof and all of which are subject to change, possibly with retroactive effect, or to different interpretation. This discussion does not address all of the U.S. federal income tax considerations that may be relevant to specific Non-U.S. Holders in light of their particular circumstances or to Non-U.S. Holders subject to special treatment under U.S. federal income tax law (such as banks, insurance companies, dealers in securities, or other Non-U.S. Holders that generally mark their securities to market for U.S. federal income tax purposes, foreign governments, international organizations, tax-exempt entities, certain former citizens or residents of the United States, or Non-U.S. Holders that hold our common stock as part of a straddle, hedge, conversion, or other integrated transaction). This discussion does not address any U.S. state or local or non-U.S. tax considerations or any U.S. federal gift or alternative minimum tax considerations.
As used in this discussion, the term “Non-U.S. Holder” means a beneficial owner of our common stock that, for U.S. federal income tax purposes, is:
| • | an individual who is neither a citizen nor a resident of the United States; |
| • | a corporation that is not created or organized in or under the laws of the United States, any state thereof, or the District of Columbia; |
| • | an estate that is not subject to U.S. federal income tax on income from non-U.S. sources which is not effectively connected with the conduct of a trade or business in the United States; or |
| • | a trust unless (i) a court within the United States is able to exercise primary supervision over its administration and one or more U.S. persons have the authority to control all of its substantial decisions or (ii) it has in effect a valid election under applicable U.S. Treasury regulations to be treated as a U.S. person. |
If an entity treated as a partnership for U.S. federal income tax purposes invests in our common stock, the U.S. federal income tax considerations relating to such investment will depend in part upon the status and activities of such entity and the particular partner. Any such entity should consult its own tax advisor regarding the U.S. federal income tax considerations applicable to it and its partners relating to the purchase, ownership, and disposition of our common stock.
PERSONS CONSIDERING AN INVESTMENT IN OUR COMMON STOCK SHOULD CONSULT THEIR OWN TAX ADVISORS REGARDING THE U.S. FEDERAL, STATE AND LOCAL AND NON-U.S. INCOME, ESTATE AND OTHER TAX CONSIDERATIONS RELATING TO THE PURCHASE, OWNERSHIP AND DISPOSITION OF OUR COMMON STOCK IN LIGHT OF THEIR PARTICULAR CIRCUMSTANCES.
Distributions on Common Stock
As described in the section entitled “Dividend Policy,” we do not currently expect to declare or pay dividends on our common stock for the foreseeable future. However, if we make a distribution of cash or other property (other than certain pro rata distributions of our common stock or rights to acquire our common stock) in respect of a share of our common stock, the distribution generally will be treated as a dividend to the extent it is paid from our current or accumulated earnings and profits (as determined under U.S. federal income tax principles). If the amount of such distribution exceeds our current and accumulated earnings and profits, such excess generally will be treated first as a tax-free return of capital to the extent of the Non-U.S. Holder’s adjusted tax basis in such share of our common stock, and then as capital gain (which will be treated in the manner
115
Table of Contents
described below under “—Sale, Exchange or Other Disposition of Common Stock”). Distributions treated as dividends on our common stock that are paid to or for the account of a Non-U.S. Holder generally will be subject to U.S. federal withholding tax at a rate of 30%, or at a lower rate if provided by an applicable tax treaty and the Non-U.S. Holder provides the documentation (generally, IRS Form W-8BEN or W-8BEN-E) required to claim benefits under such tax treaty to the applicable withholding agent. Special documentation requirements apply to claim benefits under such a tax treaty when our common stock is held though certain foreign intermediaries or Non-U.S. entities that are pass-through entities.
If, however, a dividend is effectively connected with the conduct of a trade or business in the United States by a Non-U.S. Holder, such dividend generally will not be subject to the 30% U.S. federal withholding tax if such Non-U.S. Holder provides the appropriate documentation (generally, IRS Form W-8ECI) to the applicable withholding agent. Instead, such Non-U.S. Holder generally will be subject to U.S. federal income tax on such dividend in substantially the same manner as a U.S. person (except as provided by an applicable tax treaty). In addition, a Non-U.S. Holder that is treated as a corporation for U.S. federal income tax purposes may be subject to a branch profits tax at a rate of 30% (or a lower rate if provided by an applicable tax treaty) on its effectively connected income for the taxable year, subject to certain adjustments.
The foregoing discussion is subject to the discussion below under “—FATCA Withholding” and “—Information Reporting and Backup Withholding.”
Sale, Exchange or Other Disposition of Common Stock
A Non-U.S. Holder generally will not be subject to U.S. federal income tax on any gain recognized on the sale, exchange, or other disposition of our common stock unless:
| (i) | such gain is effectively connected with the conduct of a trade or business in the United States by such Non-U.S. Holder, in which event such Non-U.S. Holder generally will be subject to U.S. federal income tax on such gain in substantially the same manner as a U.S. person (except as provided by an applicable tax treaty) and, if it is treated as a corporation for U.S. federal income tax purposes, may also be subject to a branch profits tax at a rate of 30% (or a lower rate if provided by an applicable tax treaty); |
| (ii) | such Non-U.S. Holder is an individual who is present in the United States for 183 days or more during the taxable year of such sale, exchange, or other disposition and certain other conditions are met, in which event such gain (net of certain U.S. source losses) generally will be subject to U.S. federal income tax at a rate of 30% (except as provided by an applicable tax treaty); or |
| (iii) | we are or have been a “United States real property holding corporation” for U.S. federal income tax purposes at any time during the shorter of (x) the five-year period ending on the date of such sale, exchange, or other disposition and (y) such Non-U.S. Holder’s holding period with respect to such common stock, and certain other conditions are met. |
Generally, a corporation is a “United States real property holding corporation” if the fair market value of its United States real property interests equals or exceeds 50% of the sum of the fair market value of its worldwide real property interests and its other assets used or held for use in a trade or business (all as determined for U.S. federal income tax purposes). We believe that we presently are not, and we do not presently anticipate that we will become, a United States real property holding corporation. However, because this determination is made from time to time and is dependent upon a number of factors, some of which are beyond our control, including the value of our assets, there can be no assurance that we will not become a United States real property holding corporation. If we were a United States real property holding corporation during the period described in clause (iii) above, gain realized by a Non-U.S. Holder generally would be treated as income effectively connected with the conduct of a trade or business in the United States by such Non-U.S. Holder, with the consequences described in clause (i) above (except that the branch profits tax would not apply), unless such Non-U.S. Holder owned
116
Table of Contents
(directly and constructively) five percent or less of our common stock during such period and our common stock is treated as “regularly traded on an established securities market” at any time during the calendar year of such sale, exchange or other disposition.
The foregoing discussion is subject to the discussion below under “—FATCA Withholding” and “—Information Reporting and Backup Withholding.”
FATCA Withholding
Under the Foreign Account Tax Compliance Act provisions of the Code and related U.S. Treasury guidance (“FATCA”), a withholding tax of 30% will be imposed in certain circumstances on payments of (a) dividends on our common stock and (b) on or after January 1, 2017, gross proceeds from the sale or other disposition of our common stock. In the case of payments made to a “foreign financial institution” (such as a bank, a broker, an investment fund or, in certain cases, a holding company), as a beneficial owner or as an intermediary, this tax generally will be imposed, subject to certain exceptions, unless such institution (i) has agreed to comply, and does comply, with the requirements of an agreement with the United States (an “FFI Agreement”) or (ii) is required to comply, and does comply, with applicable foreign law enacted in connection with an intergovernmental agreement between the United States and a foreign jurisdiction (an “IGA”) to, among other things, collect and provide to the U.S. tax authorities or other relevant tax authorities certain information regarding U.S. account holders of such institution and, in either case, such institution provides the withholding agent with a certification as to its FATCA status. In the case of payments made to a foreign entity that is not a financial institution (as a beneficial owner), the tax generally will be imposed, subject to certain exceptions, unless such entity provides the withholding agent with a certification that it does not have any “substantial” U.S. owners (generally, any specified U.S. person that directly or indirectly owns more than a specified percentage of such entity) or such entity identifies its substantial U.S. owners. If our common stock is held through a foreign financial institution that has agreed to comply with the requirements of an FFI Agreement or is subject to similar requirements under applicable foreign law enacted in connection with an IGA, such foreign financial institution (or, in certain cases, a person paying amounts to such foreign financial institution) generally will be required, subject to certain exceptions, to withhold tax on payments of dividends and proceeds described above made to (x) a person (including an individual) that fails to provide any required information or documentation or (y) a foreign financial institution that has not agreed to comply with the requirements of an FFI Agreement and is not subject to similar requirements under applicable foreign law enacted in connection with an IGA. Each Non-U.S. Holder should consult its own tax advisor regarding the application of FATCA to the ownership and disposition of our common stock.
Information Reporting and Backup Withholding
Amounts treated as payments of dividends on our common stock paid to a Non-U.S. Holder and the amount of any U.S. federal tax withheld from such payments generally must be reported annually to the IRS and to such Non-U.S. Holder by the applicable withholding agent.
The information reporting and backup withholding rules that apply to payments of dividends to certain U.S. persons generally will not apply to payments of dividends on our common stock to a Non-U.S. Holder if such Non-U.S. Holder certifies under penalties of perjury that it is not a U.S. person (generally by providing an IRS Form W-8BEN or W-8BEN-E to the applicable withholding agent) or otherwise establishes an exemption.
Proceeds from the sale, exchange or other disposition of our common stock by a Non-U.S. Holder effected outside the United States through a non-U.S. office of a non-U.S. broker generally will not be subject to the information reporting and backup withholding rules that apply to payments to certain U.S. persons, provided that the proceeds are paid to the Non-U.S. Holder outside the United States. However, proceeds from the sale, exchange or other disposition of our common stock by a Non-U.S. Holder effected through a non-U.S. office of a non-U.S. broker with certain specified U.S. connections or a U.S. broker generally will be subject to these
117
Table of Contents
information reporting rules (but generally not to these backup withholding rules), even if the proceeds are paid to such Non-U.S. Holder outside the United States, unless such Non-U.S. Holder certifies under penalties of perjury that it is not a U.S. person (generally by providing an IRS Form W-8BEN or W-8BEN-E to the applicable withholding agent) or otherwise establishes an exemption. Proceeds from the sale, exchange, or other disposition of our common stock by a Non-U.S. Holder effected through a U.S. office of a broker generally will be subject to these information reporting and backup withholding rules unless such Non-U.S. Holder certifies under penalties of perjury that it is not a U.S. person (generally by providing an IRS Form W-8BEN or W-8BEN-E to the applicable withholding agent) or otherwise establishes an exemption.
Backup withholding is not an additional tax. Any amounts withheld under the backup withholding rules generally will be allowed as a refund or a credit against a Non-U.S. Holder’s U.S. federal income tax liability if the required information is furnished by such Non-U.S. Holder on a timely basis to the IRS.
U.S. Federal Estate Tax
Shares of our common stock owned or treated as owned by an individual Non-U.S. Holder at the time of such Non-U.S. Holder’s death will be included in such Non-U.S. Holder’s gross estate for U.S. federal estate tax purposes and may be subject to U.S. federal estate tax unless an applicable estate tax treaty provides otherwise.
118
Table of Contents
Merrill Lynch, Pierce, Fenner & Smith Incorporated and Citigroup Global Markets Inc. are acting as joint bookrunning managers of the offering and representatives of each of the underwriters named below. Subject to the terms and conditions set forth in an underwriting agreement between us and the underwriters, we have agreed to sell to the underwriters, and each of the underwriters has agreed, severally and not jointly, to purchase from us, the number of shares of common stock set forth opposite its name below.
| Underwriter |
Number of Shares | |
| Merrill Lynch, Pierce, Fenner & Smith Incorporated |
||
| Citigroup Global Markets Inc. |
||
|
| ||
|
Total |
||
|
|
Subject to the terms and conditions set forth in the underwriting agreement, the underwriters have agreed, severally and not jointly, to purchase all of the shares sold under the underwriting agreement if any of these shares are purchased. If an underwriter defaults, the underwriting agreement provides that the purchase commitments of the nondefaulting underwriters may be increased or the underwriting agreement may be terminated. Sales of shares made outside the United States may be made by affiliates of the underwriters.
We have agreed to indemnify the several underwriters against certain liabilities, including liabilities under the Securities Act, or to contribute to payments the underwriters may be required to make in respect of those liabilities.
The underwriters are offering the shares, subject to prior sale, when, as and if issued to and accepted by them, subject to approval of legal matters by their counsel, including the validity of the shares, and other conditions contained in the underwriting agreement, such as the receipt by the underwriters of officer’s certificates and legal opinions. The underwriters reserve the right to withdraw, cancel or modify offers to the public and to reject orders in whole or in part.
Commissions and Discounts
The representatives have advised us that the underwriters propose initially to offer the shares to the public at the public offering price set forth on the cover page of this prospectus and to dealers at that price less a concession not in excess of $ per share. After the initial offering, the public offering price, concession or any other term of the offering may be changed.
The following table shows the public offering price, underwriting discount and proceeds before expenses to us. The information assumes either no exercise or full exercise by the underwriters of their option to purchase additional shares.
| Per Share | Without Option |
With Option | ||||||||||
| Public offering price |
$ | $ | $ | |||||||||
| Underwriting discount |
$ | $ | $ | |||||||||
| Proceeds, before expenses, to us |
$ | $ | $ | |||||||||
The expenses of the offering, not including the underwriting discount, are estimated at $ and are payable by us. We have also agreed to reimburse the underwriters for certain of their expenses, in an amount equal to $ , incurred in connection with review by the Financial Industry Regulatory Authority, Inc. of the terms of this offering, as set forth in the underwriting agreement.
119
Table of Contents
Option to Purchase Additional Shares
We have granted an option to the underwriters, exercisable for 30 days after the date of this prospectus, to purchase up to additional shares at the public offering price, less the underwriting discount. If the underwriters exercise this option, each will be obligated, subject to conditions contained in the underwriting agreement, to purchase a number of additional shares proportionate to that underwriter’s initial amount reflected in the above table.
No Sales of Similar Securities
We and our executive officers and directors and our other existing security holders have agreed not to sell or transfer any common stock or securities convertible into, exchangeable for, exercisable for, or repayable with common stock, for 180 days after the date of this prospectus without first obtaining the written consent of Merrill Lynch, Pierce, Fenner & Smith Incorporated and Citigroup Global Markets Inc. Specifically, we and these other persons have agreed, with certain limited exceptions, not to directly or indirectly
| • | offer, pledge, sell or contract to sell any common stock, |
| • | sell any option or contract to purchase any common stock, |
| • | purchase any option or contract to sell any common stock, |
| • | grant any option, right or warrant for the sale of any common stock, |
| • | lend or otherwise dispose of or transfer any common stock, |
| • | request or demand that we file a registration statement related to the common stock, or |
| • | enter into any swap or other agreement that transfers, in whole or in part, the economic consequence of ownership of any common stock whether any such swap or transaction is to be settled by delivery of shares or other securities, in cash or otherwise. |
This lock-up provision applies to common stock and to securities convertible into or exchangeable or exercisable for or repayable with common stock. It also applies to common stock owned now or acquired later by the person executing the agreement or for which the person executing the agreement later acquires the power of disposition. In the event that either (x) during the last 17 days of the lock-up period referred to above, we issue an earnings release or material news or a material event relating to us occurs or (y) prior to the expiration of the lock-up period, we announce that we will release earnings results or become aware that material news or a material event will occur during the 16-day period beginning on the last day of the lock-up period, the restrictions described above shall continue to apply until the expiration of the 18-day period beginning on the issuance of the earnings release or the occurrence of the material news or material event.
Listing
We expect the shares to be approved for listing on the under the symbol “ .”
Before this offering, there has been no public market for our common stock. The initial public offering price will be determined through negotiations between us and the representatives. In addition to prevailing market conditions, the factors to be considered in determining the initial public offering price are
| • | the valuation multiples of publicly traded companies that the representatives believe to be comparable to us, |
| • | our financial information, |
| • | the history of, and the prospects for, our company and the industry in which we compete, |
| • | an assessment of our management, its past and present operations, and the prospects for, and timing of, our future revenues, |
120
Table of Contents
| • | the present state of our development, and |
| • | the above factors in relation to market values and various valuation measures of other companies engaged in activities similar to ours. |
An active trading market for the shares may not develop. It is also possible that after the offering the shares will not trade in the public market at or above the initial public offering price.
The underwriters do not expect to sell more than 5% of the shares in the aggregate to accounts over which they exercise discretionary authority.
Price Stabilization, Short Positions and Penalty Bids
Until the distribution of the shares is completed, SEC rules may limit underwriters and selling group members from bidding for and purchasing our common stock. However, the representatives may engage in transactions that stabilize the price of the common stock, such as bids or purchases to peg, fix or maintain that price.
In connection with the offering, the underwriters may purchase and sell our common stock in the open market. These transactions may include short sales, purchases on the open market to cover positions created by short sales and stabilizing transactions. Short sales involve the sale by the underwriters of a greater number of shares than they are required to purchase in the offering. “Covered” short sales are sales made in an amount not greater than the underwriters’ option to purchase additional shares described above. The underwriters may close out any covered short position by either exercising their option to purchase additional shares or purchasing shares in the open market. In determining the source of shares to close out the covered short position, the underwriters will consider, among other things, the price of shares available for purchase in the open market as compared to the price at which they may purchase shares through the option granted to them. “Naked” short sales are sales in excess of such option. The underwriters must close out any naked short position by purchasing shares in the open market. A naked short position is more likely to be created if the underwriters are concerned that there may be downward pressure on the price of our common stock in the open market after pricing that could adversely affect investors who purchase in the offering. Stabilizing transactions consist of various bids for or purchases of shares of common stock made by the underwriters in the open market prior to the completion of the offering.
The underwriters may also impose a penalty bid. This occurs when a particular underwriter repays to the underwriters a portion of the underwriting discount received by it because the representatives have repurchased shares sold by or for the account of such underwriter in stabilizing or short covering transactions.
Similar to other purchase transactions, the underwriters’ purchases to cover the syndicate short sales may have the effect of raising or maintaining the market price of our common stock or preventing or retarding a decline in the market price of our common stock. As a result, the price of our common stock may be higher than the price that might otherwise exist in the open market. The underwriters may conduct these transactions on the , in the over-the-counter market or otherwise.
Neither we nor any of the underwriters make any representation or prediction as to the direction or magnitude of any effect that the transactions described above may have on the price of our common stock. In addition, neither we nor any of the underwriters make any representation that the representatives will engage in these transactions or that these transactions, once commenced, will not be discontinued without notice.
Electronic Distribution
In connection with the offering, certain of the underwriters or securities dealers may distribute prospectuses by electronic means, such as e-mail.
121
Table of Contents
Other Relationships
The underwriters and their respective affiliates are full-service financial institutions engaged in various activities, which may include securities trading, commercial and investment banking, financial advisory, investment management, investment research, principal investment, hedging, financing, and brokerage activities. Certain of the underwriters and their affiliates have provided in the past to us and our affiliates and may provide from time to time in the future certain commercial banking, financial advisory, investment banking and other services for us and such affiliates in the ordinary course of their business, for which they have received and may continue to receive customary fees and commissions. In addition, from time to time, certain of the underwriters and their affiliates may effect transactions for their own account or the account of customers, and hold on behalf of themselves or their customers, long or short positions in our debt or equity securities or loans, and may do so in the future. Citibank, N.A., an affiliate of Citigroup Global Markets Inc., acts as the administrative agent under our Existing Senior Secured Credit Facilities. Bank of America N.A., an affiliate of Merrill Lynch, Pierce, Fenner & Smith Incorporated, and Citicorp North America, Inc., an affiliate of Citigroup Global Markets Inc., have commitments under the Existing Revolver.
Solebury Capital LLC (“Solebury”), a FINRA member, is acting as our financial advisor in connection with this offering. Solebury is not acting as an underwriter and will not sell or offer to sell any securities and will not identify, solicit or engage directly with potential investors. In addition, Solebury will not underwrite or purchase any of the offered securities or otherwise participate in any such undertaking.
Notice to Prospective Investors in the European Economic Area
In relation to each member state of the European Economic Area, no offer of shares which are the subject of the offering has been, or will be made to the public in that Member State, other than under the following exemptions under the Prospectus Directive:
| (a) | to any legal entity which is a qualified investor as defined in the Prospectus Directive; |
| (b) | to fewer than 150 natural or legal persons (other than qualified investors as defined in the Prospectus Directive), subject to obtaining the prior consent of the Representatives for any such offer; or |
| (c) | in any other circumstances falling within Article 3(2) of the Prospectus Directive, |
provided that no such offer of shares referred to in (a) to (c) above shall result in a requirement for the Company or any Representative to publish a prospectus pursuant to Article 3 of the Prospectus Directive, or supplement a prospectus pursuant to Article 16 of the Prospectus Directive.
Each person located in a Member State to whom any offer of shares is made or who receives any communication in respect of an offer of shares, or who initially acquires any shares will be deemed to have represented, warranted, acknowledged and agreed to and with each Representative and the Company that (1) it is a “qualified investor” within the meaning of the law in that Member State implementing Article 2(1)(e) of the Prospectus Directive; and (2) in the case of any shares acquired by it as a financial intermediary as that term is used in Article 3(2) of the Prospectus Directive, the shares acquired by it in the offer have not been acquired on behalf of, nor have they been acquired with a view to their offer or resale to, persons in any Member State other than qualified investors, as that term is defined in the Prospectus Directive, or in circumstances in which the prior consent of the Representatives has been given to the offer or resale; or where shares have been acquired by it on behalf of persons in any Member State other than qualified investors, the offer of those shares to it is not treated under the Prospectus Directive as having been made to such persons.
The Company, the Representatives and their respective affiliates will rely upon the truth and accuracy of the foregoing representations, acknowledgments and agreements.
This prospectus has been prepared on the basis that any offer of shares in any Member State will be made pursuant to an exemption under the Prospectus Directive from the requirement to publish a prospectus for offers
122
Table of Contents
of shares. Accordingly any person making or intending to make an offer in that Member State of shares which are the subject of the offering contemplated in this prospectus may only do so in circumstances in which no obligation arises for the Company or any of the Representatives to publish a prospectus pursuant to Article 3 of the Prospectus Directive in relation to such offer. Neither the Company nor the Representatives have authorized, nor do they authorize, the making of any offer of shares in circumstances in which an obligation arises for the Company or the Representatives to publish a prospectus for such offer.
For the purposes of this provision, the expression an “offer of ordinary shares to the public” in relation to any ordinary shares in any Member State means the communication in any form and by any means of sufficient information on the terms of the offer and the ordinary shares to be offered so as to enable an investor to decide to purchase or subscribe the ordinary shares, as the same may be varied in that Member State by any measure implementing the Prospectus Directive in that Member State, the expression “Prospectus Directive” means Directive 2003/71/EC (as amended) and includes any relevant implementing measure in each Member State.
The above selling restriction is in addition to any other selling restrictions set out below.
Notice to Prospective Investors in the United Kingdom
In addition, in the United Kingdom, this document is being distributed only to, and is directed only at, and any offer subsequently made may only be directed at persons who are “qualified investors” (as defined in the Prospectus Directive) (i) who have professional experience in matters relating to investments falling within Article 19 (5) of the Financial Services and Markets Act 2000 (Financial Promotion) Order 2005, as amended (the “Order”) and/or (ii) who are high net worth companies (or persons to whom it may otherwise be lawfully communicated) falling within Article 49(2)(a) to (d) of the Order (all such persons together being referred to as “relevant persons”). This document must not be acted on or relied on in the United Kingdom by persons who are not relevant persons. In the United Kingdom, any investment or investment activity to which this document relates is only available to, and will be engaged in with, relevant persons.
Notice to Prospective Investors in France
Neither this prospectus nor any other offering material relating to the shares described in this prospectus has been submitted to the clearance procedures of the Autorité des Marchés Financiers or of the competent authority of another member state of the European Economic Area and notified to the Autorité des Marchés Financiers. The shares have not been offered or sold and will not be offered or sold, directly or indirectly, to the public in France. Neither this prospectus nor any other offering material relating to the shares has been or will be:
| • | released, issued, distributed or caused to be released, issued or distributed to the public in France; or |
| • | used in connection with any offer for subscription or sale of the shares to the public in France. |
Such offers, sales and distributions will be made in France only:
| • | to qualified investors (investisseurs qualifiés) and/or to a restricted circle of investors (cercle restreint d’investisseurs), in each case investing for their own account, all as defined in, and in accordance with articles L.411-2, D.411-1, D.411-2, D.734-1, D.744-1, D.754-1 and D.764-1 of the French Code monétaire et financier; |
| • | to investment services providers authorized to engage in portfolio management on behalf of third parties; or |
| • | in a transaction that, in accordance with article L.411-2-II-1°-or-2°-or 3° of the French Code monétaire et financier and article 211-2 of the General Regulations (Règlement Général) of the Autorité des Marchés Financiers, does not constitute a public offer (appel public à l’épargne). |
The shares may be resold directly or indirectly, only in compliance with articles L.411-1, L.411-2, L.412-1 and L.621-8 through L.621-8-3 of the French Code monétaire et financier.
123
Table of Contents
Notice to Prospective Investors in Switzerland
The shares may not be publicly offered in Switzerland and will not be listed on the SIX Swiss Exchange, or SIX, or on any other stock exchange or regulated trading facility in Switzerland. This document has been prepared without regard to the disclosure standards for issuance prospectuses under art. 652a or art. 1156 of the Swiss Code of Obligations or the disclosure standards for listing prospectuses under art. 27 ff. of the SIX Listing Rules or the listing rules of any other stock exchange or regulated trading facility in Switzerland. Neither this document nor any other offering or marketing material relating to the shares or the offering may be publicly distributed or otherwise made publicly available in Switzerland.
Neither this document nor any other offering or marketing material relating to the offering, the Company or the shares have been or will be filed with or approved by any Swiss regulatory authority. In particular, this document will not be filed with, and the offer of shares will not be supervised by, the Swiss Financial Market Supervisory Authority FINMA (FINMA), and the offer of shares has not been and will not be authorized under the Swiss Federal Act on Collective Investment Schemes, or CISA. The investor protection afforded to acquirers of interests in collective investment schemes under the CISA does not extend to acquirers of shares.
Notice to Prospective Investors in the Dubai International Financial Centre
This prospectus relates to an Exempt Offer in accordance with the Offered Securities Rules of the Dubai Financial Services Authority, or DFSA. This prospectus is intended for distribution only to persons of a type specified in the Offered Securities Rules of the DFSA. It must not be delivered to, or relied on by, any other person. The DFSA has no responsibility for reviewing or verifying any documents in connection with Exempt Offers. The DFSA has not approved this prospectus nor taken steps to verify the information set forth herein and has no responsibility for the prospectus. The shares to which this prospectus relates may be illiquid and/or subject to restrictions on their resale. Prospective purchasers of the shares offered should conduct their own due diligence on the shares. If you do not understand the contents of this prospectus you should consult an authorized financial advisor.
Notice to Prospective Investors in Australia
No placement document, prospectus, product disclosure statement or other disclosure document has been lodged with the Australian Securities and Investments Commission, or ASIC, in relation to the offering. This prospectus does not constitute a prospectus, product disclosure statement or other disclosure document under the Corporations Act 2001 (the “Corporations Act”), and does not purport to include the information required for a prospectus, product disclosure statement or other disclosure document under the Corporations Act.
Any offer in Australia of the shares may only be made to persons (the “Exempt Investors”) who are “sophisticated investors” (within the meaning of section 708(8) of the Corporations Act), “professional investors” (within the meaning of section 708(11) of the Corporations Act) or otherwise pursuant to one or more exemptions contained in section 708 of the Corporations Act so that it is lawful to offer the shares without disclosure to investors under Chapter 6D of the Corporations Act.
The shares applied for by Exempt Investors in Australia must not be offered for sale in Australia in the period of 12 months after the date of allotment under the offering, except in circumstances where disclosure to investors under Chapter 6D of the Corporations Act would not be required pursuant to an exemption under section 708 of the Corporations Act or otherwise or where the offer is pursuant to a disclosure document which complies with Chapter 6D of the Corporations Act. Any person acquiring shares must observe such Australian on-sale restrictions.
This prospectus contains general information only and does not take account of the investment objectives, financial situation or particular needs of any particular person. It does not contain any securities
124
Table of Contents
recommendations or financial product advice. Before making an investment decision, investors need to consider whether the information in this prospectus is appropriate to their needs, objectives and circumstances, and, if necessary, seek expert advice on those matters.
Notice to Prospective Investors in Hong Kong
The shares have not been offered or sold and will not be offered or sold in Hong Kong, by means of any document, other than (a) to “professional investors” as defined in the Securities and Futures Ordinance (Cap. 571) of Hong Kong and any rules made under that Ordinance; or (b) in other circumstances which do not result in the document being a “prospectus” as defined in the Companies Ordinance (Cap. 32) of Hong Kong or which do not constitute an offer to the public within the meaning of that Ordinance. No advertisement, invitation or document relating to the shares has been or may be issued or has been or may be in the possession of any person for the purposes of issue, whether in Hong Kong or elsewhere, which is directed at, or the contents of which are likely to be accessed or read by, the public of Hong Kong (except if permitted to do so under the securities laws of Hong Kong) other than with respect to shares which are or are intended to be disposed of only to persons outside Hong Kong or only to “professional investors” as defined in the Securities and Futures Ordinance and any rules made under that Ordinance.
Notice to Prospective Investors in Japan
The shares have not been and will not be registered under the Financial Instruments and Exchange Law of Japan (Law No. 25 of 1948, as amended) and, accordingly, will not be offered or sold, directly or indirectly, in Japan, or for the benefit of any Japanese Person or to others for re-offering or resale, directly or indirectly, in Japan or to any Japanese Person, except in compliance with all applicable laws, regulations and ministerial guidelines promulgated by relevant Japanese governmental or regulatory authorities in effect at the relevant time. For the purposes of this paragraph, “Japanese Person” shall mean any person resident in Japan, including any corporation or other entity organized under the laws of Japan.
Notice to Prospective Investors in Singapore
This prospectus has not been registered as a prospectus with the Monetary Authority of Singapore. Accordingly, this prospectus and any other document or material in connection with the offer or sale, or invitation for subscription or purchase, of Non-CIS Securities may not be circulated or distributed, nor may the Non-CIS Securities be offered or sold, or be made the subject of an invitation for subscription or purchase, whether directly or indirectly, to persons in Singapore other than (i) to an institutional investor under Section 274 of the Securities and Futures Act, Chapter 289 of Singapore, or SFA, (ii) to a relevant person pursuant to Section 275(1), or any person pursuant to Section 275(1A), and in accordance with the conditions specified in Section 275, of the SFA, or (iii) otherwise pursuant to, and in accordance with the conditions of, any other applicable provision of the SFA.
Where the Non-CIS Securities are subscribed or purchased under Section 275 of the SFA by a relevant person which is:
| (a) | a corporation (which is not an accredited investor (as defined in Section 4A of the SFA)) the sole business of which is to hold investments and the entire share capital of which is owned by one or more individuals, each of whom is an accredited investor; or |
| (b) | a trust (where the trustee is not an accredited investor) whose sole purpose is to hold investments and each beneficiary of the trust is an individual who is an accredited investor, |
125
Table of Contents
securities (as defined in Section 239(1) of the SFA) of that corporation or the beneficiaries’ rights and interest (howsoever described) in that trust shall not be transferred within six months after that corporation or that trust has acquired the Non-CIS Securities pursuant to an offer made under Section 275 of the SFA except:
| (a) | to an institutional investor or to a relevant person defined in Section 275(2) of the SFA, or to any person arising from an offer referred to in Section 275(1A) or Section 276(4)(i)(B) of the SFA; |
| (b) | where no consideration is or will be given for the transfer; |
| (c) | where the transfer is by operation of law; |
| (d) | as specified in Section 276(7) of the SFA; or |
as specified in Regulation 32 of the Securities and Futures (Offers of Investments) (Shares and Debentures) Regulations 2005 of Singapore.
126
Table of Contents
The validity of the shares of our common stock offered hereby will be passed upon for us by Debevoise & Plimpton LLP, New York, New York. Various legal matters related to this offering will be passed upon for the underwriters by Weil, Gotshal & Manges LLP, New York, New York.
The consolidated financial statements of SRA Companies, Inc. and subsidiaries as of June 30, 2013 and 2014 and for the period from July 1, 2011 through July 20, 2011 (Predecessor), the period from July 21, 2011 through June 30, 2012, and the years ended June 30, 2013 and 2014 (Successor), have been included herein in reliance upon the report of KPMG LLP, independent registered public accounting firm, appearing elsewhere herein, and upon the authority of said firm as experts in accounting and auditing.
WHERE YOU CAN FIND MORE INFORMATION
We have filed with the Securities and Exchange Commission a registration statement on Form S-1 with respect to the shares of our common stock being sold in this offering. This prospectus does not contain all of the information set forth in the registration statement and the exhibits thereto because some parts have been omitted in accordance with the rules and regulations of the SEC. You will find additional information about us and the common stock being sold in this offering in the registration statement and the exhibits thereto. For further information with respect to our Company and the common stock being sold in this offering, reference is made to the registration statement and the exhibits filed therewith. Statements contained in this prospectus as to the contents of any contract or other document referred to are not necessarily complete, and in each instance, if such contract or document is filed as an exhibit, reference is made to the copy of such contract or other document filed as an exhibit to the registration statement, each statement being qualified in all respects by such reference. A copy of the registration statement, including the exhibits thereto, may be read and copied at the SEC’s Public Reference Room at 100 F Street, N.E., Room 1580, Washington, D.C. 20549. Information on the operation of the Public Reference Room may be obtained by calling the SEC at 1-800-SEC-0330. In addition, the SEC maintains an internet site at http://www.sec.gov, from which interested persons can electronically access the registration statement, including the exhibits and any schedules thereto. Copies of the registration statement, including the exhibits and schedules thereto, are also available at your request, without charge, from SRA Companies, Inc., 4300 Fair Lakes Court, Fairfax, Virginia 22033.
We will be subject to the informational requirements of the Exchange Act and, accordingly, will file annual reports containing financial statements audited by an independent registered public accounting firm, quarterly reports containing unaudited financial statements, current reports, proxy statements, and other information with the SEC. You will be able to inspect and copy these reports, proxy statements, and other information at the public reference facilities maintained by the SEC at the address noted above. You will also be able to obtain copies of this material from the Public Reference Room of the SEC as described above, or inspect them without charge at the SEC’s website. You will also be able to access, free of charge, our reports filed with the SEC (for example, our Annual Report on Form 10-K, our Quarterly Reports on Form 10-Q, and our Current Reports on Form 8-K and any amendments to those forms) through our website (www.sra.com). Reports filed with or furnished to the SEC will be available as soon as reasonably practicable after they are filed with or furnished to the SEC. None of the information contained on, or that may be accessed through our websites or any other website identified herein is part of, or incorporated into, this prospectus. All website addresses in this prospectus are intended to be inactive textual references only.
127
Table of Contents
| Audited Consolidated Financial Statements |
||||
| F-2 | ||||
| Consolidated Balance Sheets—June 30, 2014 and 2013 (Successor) |
F-3 | |||
| F-4 | ||||
| F-5 | ||||
| F-6 | ||||
| F-7 | ||||
| F-8 | ||||
| Unaudited Consolidated Financial Statements |
||||
| Condensed Consolidated Balance Sheets—June 30, 2014 and March 31, 2015 |
F-31 | |||
| Condensed Consolidated Statements of Operations—Three and nine months ended March 31, 2014 and 2015 |
F-32 | |||
| F-33 | ||||
| Condensed Consolidated Statements of Cash Flows—Nine months ended March 31, 2014 and 2015 |
F-34 | |||
| F-35 | ||||
F-1
Table of Contents
Report of Independent Registered Public Accounting Firm
The Board of Directors and Stockholders
SRA Companies, Inc.:
We have audited the accompanying consolidated balance sheets of SRA Companies, Inc. and subsidiaries (the Company) as of June 30, 2013 and 2014, and the related consolidated statements of operations, comprehensive income (loss), changes in stockholders’ equity, and cash flows for the period from July 1, 2011 through July 20, 2011 (Predecessor), the period from July 21, 2011 through June 30, 2012, and the years ended June 30, 2013 and 2014 (Successor). These consolidated financial statements are the responsibility of the Company’s management. Our responsibility is to express an opinion on these consolidated financial statements based on our audits.
We conducted our audits in accordance with the standards of the Public Company Accounting Oversight Board (United States). Those standards require that we plan and perform the audit to obtain reasonable assurance about whether the financial statements are free of material misstatement. An audit includes examining, on a test basis, evidence supporting the amounts and disclosures in the financial statements. An audit also includes assessing the accounting principles used and significant estimates made by management, as well as evaluating the overall financial statement presentation. We believe that our audits provide a reasonable basis for our opinion.
In our opinion, the consolidated financial statements referred to above present fairly, in all material respects, the financial position of the Company and subsidiaries as of June 30, 2013 and 2014, and the results of their operations and their cash flows for the period from July 1, 2011 through July 20, 2011 (Predecessor), the period from July 21, 2011 through June 30, 2012, and the years ended June 30, 2013 and 2014 (Successor), in conformity with U.S. generally accepted accounting principles.
/s/ KPMG LLP
McLean, Virginia
July 7, 2015
F-2
Table of Contents
SRA COMPANIES, INC. AND SUBSIDIARIES
(in thousands, except share and per share amounts)
| June 30, | ||||||||
| 2013 | 2014 | |||||||
| ASSETS |
||||||||
| Current assets: |
||||||||
| Cash and cash equivalents |
$ | 5,050 | $ | 108,840 | ||||
| Restricted cash |
1,389 | 1,619 | ||||||
| Accounts receivable, net |
267,476 | 217,677 | ||||||
| Prepaid expenses and other |
15,422 | 5,643 | ||||||
| Deferred income taxes |
4,371 | — | ||||||
|
|
|
|
|
|||||
| Total current assets |
293,708 | 333,779 | ||||||
| Property and equipment, net |
24,811 | 18,925 | ||||||
| Goodwill |
787,760 | 783,604 | ||||||
| Trade names |
150,200 | 150,200 | ||||||
| Identified intangibles, net |
327,922 | 253,916 | ||||||
| Other long-term assets |
42,552 | 35,632 | ||||||
|
|
|
|
|
|||||
| Total assets |
$ | 1,626,953 | $ | 1,576,056 | ||||
|
|
|
|
|
|||||
| LIABILITIES AND STOCKHOLDERS’ EQUITY |
||||||||
| Current liabilities: |
||||||||
| Current portion of long-term debt |
$ | — | $ | 22,000 | ||||
| Accounts payable and accrued expenses |
103,321 | 136,626 | ||||||
| Accrued payroll and employee benefits |
85,007 | 83,017 | ||||||
| Billings in excess of revenue recognized |
8,563 | 10,801 | ||||||
| Deferred income taxes |
— | 5,355 | ||||||
|
|
|
|
|
|||||
| Total current liabilities |
196,891 | 257,799 | ||||||
| Long-term debt |
1,108,667 | 1,047,927 | ||||||
| Deferred income taxes |
133,462 | 104,941 | ||||||
| Other long-term liabilities |
26,764 | 24,741 | ||||||
|
|
|
|
|
|||||
| Total liabilities |
1,465,784 | 1,435,408 | ||||||
| Commitments and contingencies |
||||||||
| Stockholders’ equity: |
||||||||
| Preferred stock, par value $0.01 per share; 352,820 shares authorized as of June 30, 2013 and 2014, none issued and outstanding as of June 30, 2013 and 2014 |
— | — | ||||||
| Common stock, par value $0.01 per share; 1,147,180 shares authorized, 514,135 shares issued and outstanding as of June 30, 2013; 1,147,180 shares authorized, 514,268 shares issued and outstanding as of June 30, 2014 |
5 | 5 | ||||||
| Additional paid-in capital |
519,585 | 522,914 | ||||||
| Accumulated other comprehensive loss, net of tax |
(12,183 | ) | (11,871 | ) | ||||
| Accumulated deficit |
(346,238 | ) | (370,400 | ) | ||||
|
|
|
|
|
|||||
| Total stockholders’ equity |
161,169 | 140,648 | ||||||
|
|
|
|
|
|||||
| Total liabilities and stockholders’ equity |
$ | 1,626,953 | $ | 1,576,056 | ||||
|
|
|
|
|
|||||
The accompanying notes are an integral part of these consolidated financial statements.
F-3
Table of Contents
SRA COMPANIES, INC. AND SUBSIDIARIES
CONSOLIDATED STATEMENTS OF OPERATIONS
(in thousands, except per share data)
| Predecessor | Successor | |||||||||||||||||
| July 1, 2011 through July 20, 2011 |
July 21, 2011 through June 30, 2012 |
Fiscal Year Ended June 30, 2013 |
Fiscal Year Ended June 30, 2014 |
|||||||||||||||
| Revenue |
$ | 99,308 | $ | 1,575,872 | $ | 1,507,722 | $ | 1,386,363 | ||||||||||
| Operating costs and expenses: |
||||||||||||||||||
| Cost of services |
78,550 | 1,191,256 | 1,140,014 | 1,060,407 | ||||||||||||||
| Selling, general and administrative |
13,721 | 215,369 | 198,338 | 181,937 | ||||||||||||||
| Depreciation and amortization of property and equipment |
837 | 14,186 | 12,199 | 9,194 | ||||||||||||||
| Amortization of intangible assets |
442 | 91,551 | 88,147 | 72,711 | ||||||||||||||
| Transaction costs |
68,069 | 699 | — | — | ||||||||||||||
| Impairment of goodwill and other assets |
— | — | 345,753 | — | ||||||||||||||
| Gain on the sale of a portion of the Health & Civil business |
— | — | — | (1,564 | ) | |||||||||||||
|
|
|
|
|
|
|
|
|
|||||||||||
| Total operating costs and expenses |
161,619 | 1,513,061 | 1,784,451 | 1,322,685 | ||||||||||||||
|
|
|
|
|
|
|
|
|
|||||||||||
| Operating (loss) income |
(62,311 | ) | 62,811 | (276,729 | ) | 63,678 | ||||||||||||
| Interest expense |
(19 | ) | (101,715 | ) | (100,777 | ) | (104,191 | ) | ||||||||||
| Interest income |
13 | 85 | 43 | 65 | ||||||||||||||
|
|
|
|
|
|
|
|
|
|||||||||||
| Loss from continuing operations before income taxes |
(62,317 | ) | (38,819 | ) | (377,463 | ) | (40,448 | ) | ||||||||||
| Benefit from income taxes |
(18,462 | ) | (14,768 | ) | (60,169 | ) | (16,286 | ) | ||||||||||
|
|
|
|
|
|
|
|
|
|||||||||||
| Loss from continuing operations |
(43,855 | ) | (24,051 | ) | (317,294 | ) | (24,162 | ) | ||||||||||
| Loss from discontinued operations, net of tax |
(1,126 | ) | (4,893 | ) | — | — | ||||||||||||
|
|
|
|
|
|
|
|
|
|||||||||||
| Net loss |
$ | (44,981 | ) | $ | (28,944 | ) | $ | (317,294 | ) | $ | (24,162 | ) | ||||||
|
|
|
|
|
|
|
|
|
|||||||||||
| Basic loss per share: |
||||||||||||||||||
| Continuing operations |
$ | (0.77 | ) | $ | (46.79 | ) | $ | (617.30 | ) | $ | (47.01 | ) | ||||||
| Discontinued operations |
(0.02 | ) | (9.52 | ) | — | — | ||||||||||||
|
|
|
|
|
|
|
|
|
|
||||||||||
| Net loss |
$ | (0.79 | ) | $ | (56.31 | ) | $ | (617.30 | ) | $ | (47.01 | ) | ||||||
| Diluted loss per share: |
||||||||||||||||||
| Continuing operations |
$ | (0.77 | ) | $ | (46.79 | ) | $ | (617.30 | ) | $ | (47.01 | ) | ||||||
| Discontinued operations |
(0.02 | ) | (9.52 | ) | — | — | ||||||||||||
|
|
|
|
|
|
|
|
|
|
||||||||||
| Net loss |
$ | (0.79 | ) | $ | (56.31 | ) | $ | (617.30 | ) | $ | (47.01 | ) | ||||||
| Shares used to compute net loss per share |
||||||||||||||||||
| Basic |
57,289 | 514 | 514 | 514 | ||||||||||||||
| Diluted |
57,289 | 514 | 514 | 514 | ||||||||||||||
The accompanying notes are an integral part of these consolidated financial statements.
F-4
Table of Contents
SRA COMPANIES, INC. AND SUBSIDIARIES
CONSOLIDATED STATEMENTS OF COMPREHENSIVE INCOME (LOSS)
(in thousands)
| Predecessor | Successor | |||||||||||||||||
| July 1, 2011 through July 20, 2011 |
July 21, 2011 through June 30, 2012 |
Fiscal Year Ended June 30, 2013 |
Fiscal Year Ended June 30, 2014 |
|||||||||||||||
| Net loss |
$ | (44,981 | ) | $ | (28,944 | ) | $ | (317,294 | ) | $ | (24,162 | ) | ||||||
| Unrealized (loss) gain on foreign currency translation |
(380 | ) | 954 | — | — | |||||||||||||
| Realized gain on cumulative foreign currency translation |
— | (954 | ) | — | — | |||||||||||||
| Unrealized (loss) gain on interest rate swaps, net of tax |
— | (12,027 | ) | (156 | ) | 312 | ||||||||||||
|
|
|
|
|
|
|
|
|
|||||||||||
| Comprehensive loss |
$ | (45,361 | ) | $ | (40,971 | ) | $ | (317,450 | ) | $ | (23,850 | ) | ||||||
|
|
|
|
|
|
|
|
|
|||||||||||
The accompanying notes are an integral part of these consolidated financial statements.
F-5
Table of Contents
SRA COMPANIES, INC. AND SUBSIDIARIES
CONSOLIDATED STATEMENTS OF CHANGES IN STOCKHOLDERS’ EQUITY
(in thousands)
| Class A Common Stock |
Class B Common Stock |
Common Stock | Additional Paid-In Capital |
Treasury Stock | Accumulated Other Comprehensive Loss |
Retained Earnings (Accumulated Deficit) |
Total Stockholders’ Equity |
|||||||||||||||||||||||||||||||||||||||||
| Shares | Amount | Shares | Amount | Shares | Amount | Shares | Amount | |||||||||||||||||||||||||||||||||||||||||
| Balance June 30, 2011 (Predecessor) |
49,450 | $ | 198 | 11,703 | $ | 47 | — | $ | — | $ | 385,770 | (3,350 | ) | $ | (65,640 | ) | $ | (2,965 | ) | $ | 543,633 | $ | 861,043 | |||||||||||||||||||||||||
| Net loss |
— | — | — | — | — | — | — | — | — | — | (44,981 | ) | (44,981 | ) | ||||||||||||||||||||||||||||||||||
| Proceeds from stock-based awards and related tax effects |
10 | — | — | — | — | — | 9,197 | — | — | — | — | 9,197 | ||||||||||||||||||||||||||||||||||||
| Repurchase of common stock |
— | — | — | — | — | — | — | (2 | ) | (64 | ) | — | — | (64 | ) | |||||||||||||||||||||||||||||||||
| Employee stock purchase plan |
14 | — | — | — | — | — | 404 | — | — | — | — | 404 | ||||||||||||||||||||||||||||||||||||
| Stock-based compensation |
— | — | — | — | — | — | 20,820 | — | — | — | — | 20,820 | ||||||||||||||||||||||||||||||||||||
| Foreign currency translation |
— | — | — | — | — | — | — | — | — | (380 | ) | — | (380 | ) | ||||||||||||||||||||||||||||||||||
|
|
|
|
|
|
|
|
|
|
|
|
|
|
|
|
|
|
|
|
|
|
|
|
|
|||||||||||||||||||||||||
| Balance July 20, 2011 (Predecessor) |
49,474 | $ | 198 | 11,703 | $ | 47 | — | $ | — | $ | 416,191 | (3,352 | ) | $ | (65,704 | ) | $ | (3,345 | ) | $ | 498,652 | $ | 846,039 | |||||||||||||||||||||||||
| Impact of the Transaction |
(49,474 | ) | (198 | ) | (11,703 | ) | (47 | ) | — | — | (416,191 | ) | 3,352 | 65,704 | 3,345 | (498,652 | ) | (846,039 | ) | |||||||||||||||||||||||||||||
|
|
|
|
|
|
|
|
|
|
|
|
|
|
|
|
|
|
|
|
|
|
|
|
|
|||||||||||||||||||||||||
|
Balance July 21, 2011 (Successor) |
— | $ | — | — | $ | — | — | $ | — | $ | — | — | $ | — | $ | — | $ | — | $ | — | ||||||||||||||||||||||||||||
| Capital contributions |
— | — | — | — | 514 | 5 | 515,007 | — | — | — | — | 515,012 | ||||||||||||||||||||||||||||||||||||
| Net loss |
— | — | — | — | — | — | — | — | — | — | (28,944 | ) | (28,944 | ) | ||||||||||||||||||||||||||||||||||
| Stock-based compensation |
— | — | — | — | — | — | 1,807 | — | — | — | — | 1,807 | ||||||||||||||||||||||||||||||||||||
| Unrealized gain on foreign currency translation |
— | — | — | — | — | — | — | — | — | 954 | — | 954 | ||||||||||||||||||||||||||||||||||||
| Realized gain on cumulative foreign currency translation |
— | — | — | — | — | — | — | — | — | (954 | ) | — | (954 | ) | ||||||||||||||||||||||||||||||||||
| Unrealized loss on interest rate swaps, net of tax |
— | — | — | — | — | — | — | — | — | (12,027 | ) | — | (12,027 | ) | ||||||||||||||||||||||||||||||||||
|
|
|
|
|
|
|
|
|
|
|
|
|
|
|
|
|
|
|
|
|
|
|
|
|
|||||||||||||||||||||||||
| Balance June 30, 2012 (Successor) |
— | $ | — | — | $ | — | 514 | $ | 5 | $ | 516,814 | — | $ | — | $ | (12,027 | ) | $ | (28,944 | ) | $ | 475,848 | ||||||||||||||||||||||||||
| Net loss |
— | — | — | — | — | — | — | — | — | — | (317,294 | ) | (317,294 | ) | ||||||||||||||||||||||||||||||||||
| Stock-based compensation |
— | — | — | — | — | — | 2,836 | — | — | — | — | 2,836 | ||||||||||||||||||||||||||||||||||||
| Other |
— | — | — | — | — | — | (65 | ) | — | — | — | — | (65 | ) | ||||||||||||||||||||||||||||||||||
| Unrealized loss on interest rate swaps, net of tax |
— | — | — | — | — | — | — | — | — | $ | (156 | ) | — | (156 | ) | |||||||||||||||||||||||||||||||||
|
|
|
|
|
|
|
|
|
|
|
|
|
|
|
|
|
|
|
|
|
|
|
|
|
|||||||||||||||||||||||||
| Balance June 30, 2013 (Successor) |
— | $ | — | — | $ | — | 514 | $ | 5 | $ | 519,585 | — | $ | — | $ | (12,183 | ) | $ | (346,238 | ) | $ | 161,169 | ||||||||||||||||||||||||||
| Net loss |
— | — | — | — | — | — | — | — | — | — | (24,162 | ) | (24,162 | ) | ||||||||||||||||||||||||||||||||||
| Stock-based compensation |
— | — | — | — | — | — | 3,346 | — | — | — | — | 3,346 | ||||||||||||||||||||||||||||||||||||
| Other |
— | — | — | — | — | — | (17 | ) | — | — | — | — | (17 | ) | ||||||||||||||||||||||||||||||||||
| Unrealized loss on interest rate swaps, net of tax |
— | — | — | — | — | — | — | — | — | 312 | — | 312 | ||||||||||||||||||||||||||||||||||||
|
|
|
|
|
|
|
|
|
|
|
|
|
|
|
|
|
|
|
|
|
|
|
|
|
|||||||||||||||||||||||||
| Balance June 30, 2014 (Successor) |
— | $ | — | — | $ | — | 514 | $ | 5 | $ | 522,914 | — | $ | — | $ | (11,871 | ) | $ | (370,400 | ) | $ | 140,648 | ||||||||||||||||||||||||||
|
|
|
|
|
|
|
|
|
|
|
|
|
|
|
|
|
|
|
|
|
|
|
|
|
|||||||||||||||||||||||||
The accompanying notes are an integral part of these consolidated financial statements.
F-6
Table of Contents
SRA COMPANIES, INC. AND SUBSIDIARIES
CONSOLIDATED STATEMENTS OF CASH FLOWS
(in thousands)
| Predecessor | Successor | |||||||||||||||||
| July 1, 2011 through July 20, 2011 |
July 21, 2011 through June 30, 2012 |
Fiscal Year Ended June 30, 2013 |
Fiscal Year Ended June 30, 2014 |
|||||||||||||||
| Cash flows from operating activities: |
||||||||||||||||||
| Net loss |
$ | (44,981 | ) | $ | (28,944 | ) | $ | (317,294 | ) | $ | (24,162 | ) | ||||||
| Adjustments to reconcile net loss to net cash provided by operating activities: |
||||||||||||||||||
| Depreciation of property and equipment |
940 | 15,869 | 13,484 | 10,725 | ||||||||||||||
| Amortization of intangible assets |
442 | 91,551 | 88,147 | 72,711 | ||||||||||||||
| Stock-based compensation |
20,820 | 1,807 | 2,836 | 3,346 | ||||||||||||||
| Deferred income taxes |
(18,832 | ) | (15,810 | ) | (60,646 | ) | (18,947 | ) | ||||||||||
| Amortization of original issue discount and debt issuance costs |
— | 7,370 | 7,131 | 7,817 | ||||||||||||||
| Loss realized from forward exchange contracts |
— | 94 | — | — | ||||||||||||||
| Impairment of goodwill and other assets |
— | — | 345,753 | — | ||||||||||||||
| Excess tax benefits of stock option exercises |
— | (14,337 | ) | — | — | |||||||||||||
| Gain on the sale of a portion of the Health & Civil business |
— | — | — | (1,564 | ) | |||||||||||||
| Other noncash items |
— | 3,458 | — | — | ||||||||||||||
| Changes in assets and liabilities, net of the effect of acquisitions and divestitures |
||||||||||||||||||
| Accounts receivable |
(294 | ) | 29,870 | 47,792 | 48,857 | |||||||||||||
| Prepaid expenses and other |
23,728 | 19,487 | (4,160 | ) | 9,730 | |||||||||||||
| Accounts payable and accrued expenses |
50,670 | (42,073 | ) | (25,853 | ) | 28,340 | ||||||||||||
| Accrued payroll and employee benefits |
14,814 | (10,515 | ) | (30,883 | ) | (1,604 | ) | |||||||||||
| Billings in excess of revenue recognized |
(1,220 | ) | (2,177 | ) | (40 | ) | 2,799 | |||||||||||
| Other |
(2,951 | ) | (1,435 | ) | 558 | 7,605 | ||||||||||||
|
|
|
|
|
|
|
|
|
|||||||||||
| Net cash provided by operating activities |
43,136 | 54,215 | 66,825 | 145,653 | ||||||||||||||
|
|
|
|
|
|
|
|
|
|||||||||||
| Cash flows from investing activities: |
||||||||||||||||||
| Capital expenditures |
(1,876 | ) | (10,741 | ) | (11,791 | ) | (7,355 | ) | ||||||||||
| Acquisition by Providence, net of cash |
— | (1,738,789 | ) | — | — | |||||||||||||
| Acquisitions, net of cash acquired |
— | — | (33,631 | ) | — | |||||||||||||
| Proceeds from the sale of Era businesses |
— | 13,322 | — | — | ||||||||||||||
| Payments for forward exchange contracts |
— | (94 | ) | — | — | |||||||||||||
| Proceeds from the sale of a portion of the Health & Civil business |
— | — | — | 5,492 | ||||||||||||||
|
|
|
|
|
|
|
|
|
|||||||||||
| Net cash used in investing activities |
(1,876 | ) | (1,736,302 | ) | (45,422 | ) | (1,863 | ) | ||||||||||
|
|
|
|
|
|
|
|
|
|||||||||||
| Cash flows from financing activities: |
||||||||||||||||||
| Proceeds from the exercise of options |
165 | — | — | — | ||||||||||||||
| Proceeds from employee stock purchase plan |
404 | — | — | — | ||||||||||||||
| Excess tax benefits of stock option exercises |
— | 14,337 | — | — | ||||||||||||||
| Purchase of treasury stock |
(64 | ) | — | — | — | |||||||||||||
| Proceeds from borrowings for the Transaction |
— | 1,266,250 | — | — | ||||||||||||||
| Investment by Providence |
— | 394,000 | — | — | ||||||||||||||
| Payment of debt issuance costs |
— | (50,207 | ) | — | — | |||||||||||||
| Borrowings under revolving credit facility |
— | 30,000 | 75,000 | 100,000 | ||||||||||||||
| Repayments under revolving credit facility |
— | (30,000 | ) | (75,000 | ) | (100,000 | ) | |||||||||||
| Repayments of Term Loan B Facility |
— | (140,000 | ) | (20,000 | ) | (40,000 | ) | |||||||||||
| Partial payment on Volgenau note |
— | (12,000 | ) | — | — | |||||||||||||
|
|
|
|
|
|
|
|
|
|||||||||||
| Net cash provided by (used in) financing activities |
505 | 1,472,380 | (20,000 | ) | (40,000 | ) | ||||||||||||
|
|
|
|
|
|
|
|
|
|||||||||||
| Effect of exchange rate changes on cash and cash equivalents |
22 | (191 | ) | — | — | |||||||||||||
| Net increase (decrease) in cash and cash equivalents |
41,787 | (209,898 | ) | 1,403 | 103,790 | |||||||||||||
| Cash and cash equivalents, beginning of period |
171,758 | 213,545 | 3,647 | 5,050 | ||||||||||||||
|
|
|
|
|
|
|
|
|
|||||||||||
| Cash and cash equivalents, end of period |
$ | 213,545 | $ | 3,647 | $ | 5,050 | $ | 108,840 | ||||||||||
|
|
|
|
|
|
|
|
|
|||||||||||
| Supplementary Cash Flow Information |
||||||||||||||||||
| Cash paid for interest |
19 | 83,536 | 93,345 | 84,210 | ||||||||||||||
| (Refunds received) cash paid for income taxes, net |
(23,067 | ) | (11,316 | ) | 1,435 | (1,003 | ) | |||||||||||
| Non-cash equity rollover investment |
— | 121,012 | — | — | ||||||||||||||
The accompanying notes are an integral part of these consolidated financial statements.
F-7
Table of Contents
SRA COMPANIES, INC. AND SUBSIDIARIES
NOTES TO CONSOLIDATED FINANCIAL STATEMENTS
1. Summary of Significant Accounting Policies:
Basis of Presentation
SRA Companies, Inc., a Delaware corporation, or SRA Companies, and its wholly-owned subsidiary, Sterling Parent LLC, or Sterling Parent, were formed by private equity investment funds, or the PEP Funds, sponsored by Providence Equity Partners L.L.C., or Providence, for the sole purpose of acquiring SRA International, Inc. and its subsidiaries, or SRA, a Virginia corporation. SRA was acquired on July 20, 2011, or the Transaction. SRA Companies and Sterling Parent do not have any independent assets or operations.
The accompanying consolidated financial statements include the accounts of SRA Companies, Inc. and its direct and indirect and wholly-owned subsidiaries, or collectively referred to as the Company, and have been prepared in accordance with accounting principles generally accepted in the United States of America, or GAAP. All intercompany transactions and balances have been eliminated.
Due to the change in control on July 20, 2011, SRA’s assets and liabilities were recorded at fair value. The accompanying consolidated financial statements are presented as Predecessor or Successor, to indicate whether they relate to the period preceding the Transaction or the period succeeding the Transaction, respectively. SRA Companies (f/k/a Sterling Holdco Inc.) was formed for the sole purpose of acquiring SRA; therefore, SRA is considered the Predecessor to SRA Companies.
In the opinion of management, the accompanying consolidated financial statements reflect all adjustments and reclassifications that are necessary for fair presentation of the periods presented.
Nature of Business
The Company is a leading provider of sophisticated information technology and strategic consulting services and solutions primarily to the U.S. federal government. The Company provides services and solutions that help our government customers address complex IT needs in order to achieve their missions more effectively, increase efficiency of operations, and reduce operating costs. In December 2013, the Company realigned its portfolio of customers from four business groups into two business groups: Health & Civil and National Security.
Operating segments are components of an enterprise about which separate financial information is available that is evaluated regularly by the chief operating decision maker in allocating resources and in assessing performance. Due to the similarities in the types of customers, services and overall economic characteristics of the Company’s two business groups, the Company aggregates all of its operations into one reportable segment.
The Company derives a substantial portion of its revenue from services provided as a prime contractor or subcontractor on engagements with various agencies of the U.S. government. These contracts represented approximately 98%, 98% and 97% of the Company’s revenue for fiscal 2012, 2013 and 2014, respectively. The Company considers individual agencies that may fall under a larger department as separate customers. No customer accounted for 10% or more of the Company’s revenue for any of the periods presented.
The Transaction
The Transaction was completed on July 20, 2011 for a total purchase price of approximately $1.9 billion. The Transaction and related fees were financed through equity contributions, together with borrowings under a senior secured term loan facility, proceeds from issuance of 11% senior notes, or the Senior Notes, issuance of a promissory note, and cash on hand. The PEP Funds invested cash of approximately $394 million and Dr. Ernst Volgenau, the founder of the Predecessor and the Chairman of the Board of the Successor, rolled over equity in
F-8
Table of Contents
the predecessor entity of $150 million in return for which he received $120 million in equity and a promissory note. The promissory note was issued for a principal amount up to $30 million, repayable solely based on proceeds from planned divestitures. The Company expects to pay $17 million for this note, based on the total net proceeds and tax benefits related to the disposal of the discontinued operations. As of June 30, 2014, $12 million of this note was paid. SRA entered into senior secured credit facilities consisting of an $875 million term loan B facility, or Term Loan B Facility, and a $100 million senior secured revolving credit facility, or the Revolver, collectively referred to as the Senior Secured Credit Facilities. Additionally, SRA International, Inc. issued $400 million aggregate principal amount of 11% Senior Notes due October 1, 2019. See Note 8 for a description of the Company’s indebtedness.
Accounting Estimates
The preparation of the Company’s financial statements in accordance with accounting principles generally accepted in the United States of America, or GAAP, requires that management make estimates and judgments that affect the reported amounts of assets, liabilities, revenue and expenses, as well as the disclosure of contingent assets and liabilities. These estimates are based on the Company’s historical experience and various other factors that are deemed reasonable at the time the estimates are made. The Company reevaluates its estimates at least quarterly. Actual results may differ significantly from these estimates under different assumptions or conditions. Management believes the critical accounting policies requiring significant estimates and judgments are revenue recognition, accounting for acquisitions, including the identification of intangible assets and the ongoing impairment assessments of goodwill and other long-lived assets, accounting for stock compensation expense and income taxes. If any of these estimates or judgments proves to be inaccurate, the Company’s results could be materially affected in the future.
Revenue Recognition
Revenue is recognized when persuasive evidence of an arrangement exists, services have been rendered or goods delivered, the contract price is fixed or determinable, and collectibility is reasonably assured. Revenue associated with work performed prior to the completion and signing of contract documents is recognized only when it can be reliably estimated and realization is probable. The Company typically only performs work prior to the completion and signing of contract documents when a relationship with the customer already exists and bases its estimates on previous experiences with the customer, communications with the customer regarding funding status, and its knowledge of available funding for the contract or program.
Revenue on cost-plus-fee contracts is recognized to the extent of costs incurred plus a proportionate amount of the fee earned. The Company considers fixed fees under cost-plus-fee contracts to be earned in proportion to the allowable costs incurred in performance of the contract. The Company considers performance-based fees, including award fees, under any contract type to be earned when it can demonstrate satisfaction of performance goals, based upon historical experience, or when the Company receives contractual notification from a customer that the fee has been earned. Revenue on time-and-materials contracts is recognized based on the hours incurred at the negotiated contract billing rates, plus the cost of any allowable material costs and out-of-pocket expenses. Revenue on fixed-price contracts where the Company performs systems design, development and integration is recognized using the percentage-of-completion method of contract accounting. Unless it is determined as part of the Company’s regular contract performance review that overall progress on a contract is not consistent with costs expended to date, the Company determines the percentage completed based on the percentage of costs incurred to date in relation to total estimated costs expected upon completion of the contract. Revenue on fixed-price outsourcing and managed services contracts is recognized ratably over the contract period. Revenue on fixed-price strategic consulting contracts is recognized based on costs incurred because these services are directed by the Company’s customers and are subject to their needs which fluctuate throughout the contract period.
Contract revenue recognition involves estimation. The Company records the cumulative effect of a revision in revenue or profit recorded in the period in which the facts requiring the revision become known. Anticipated contract losses are recognized in the period in which they become probable and can be reasonably estimated.
F-9
Table of Contents
Reserves for the collectibility of accounts receivable are recorded when the Company determines that it is less than probable that it will collect the amounts due and the reserve requirements can be reasonably estimated.
Impairment of Goodwill and Other Assets
Trade names are evaluated for impairment annually and between annual tests if events or changes in circumstances indicate the carrying value may not be recoverable. The Company assesses the potential impairment by comparing the carrying value of the trade names with their estimated fair value, utilizing the relief from royalty method. If the carrying value exceeds the fair value, the Company recognizes a loss based on the excess carrying value over fair value.
Goodwill represents the excess of the cost of an acquired entity over the net amounts assigned to assets acquired and liabilities assumed. The Company tests goodwill for impairment annually during the fourth quarter as of April 1, and between annual tests if events or changes in circumstances indicate the carrying value may not be recoverable. The goodwill impairment assessment is separately performed for each of the Company’s two reporting units, National Security and Health & Civil.
The impairment model prescribes a two-step method for determining goodwill impairment. The first step compares the reporting unit’s estimated fair value to its carrying value. The Company utilizes a discounted cash flow analysis as well as comparative market multiples to determine the fair value of its reporting units. If the carrying value exceeds the estimated fair value, a potential impairment is indicated and the Company must complete the second step of the impairment test. The second step allocates the fair value of the reporting unit determined in step one to the tangible and intangible assets and liabilities to derive an implied fair value for the reporting unit’s goodwill. If the carrying value of goodwill exceeds the implied fair value, an impairment charge is recorded to reduce the carrying value of the goodwill to the implied fair value.
Intangible assets with finite lives are only evaluated for impairment when events or circumstances indicate that the carrying amount of long-lived assets and intangible assets may not be fully recoverable. The Company determines whether the carrying value of the long-lived asset is recoverable by comparing the asset’s carrying value to its future undiscounted net cash flows, without interest charges. If impairment is indicated as a result of this review, the Company recognizes an impairment charge for the amount by which the carrying amount exceeds the fair value, which is measured using estimated discounted future cash flows.
Refer to Note 3 for a detailed discussion of the fiscal 2013 impairment analysis and resulting charges.
Income Taxes
The Company utilizes the asset and liability method of accounting for income taxes. Under this method, deferred income taxes are recognized for the tax consequences of temporary differences between the financial statement carrying amounts and the tax bases of existing assets and liabilities less valuation allowances, if required. Enacted statutory tax rates are used to compute the tax consequences of these temporary differences. The Company recognizes the financial statement benefit of a tax position only after determining that the relevant tax authority would more likely than not sustain the Company’s position following an audit.
The Company has a process to ensure that uncertain tax positions are identified, analyzed and properly reported in the Company’s financial statements in accordance with generally accepted accounting principles. The Company recognizes accrued interest and penalties related to uncertain tax positions in the provision for income tax expense, as well as interest earned related to income tax refunds.
The Company files income tax returns in the U.S. federal jurisdiction, and various state and foreign jurisdictions with varying statutes of limitation. Periods for fiscal years ended after July 1, 2010 generally remain subject to examination by federal and state tax authorities. In foreign jurisdictions, tax years after 2010 may remain subject to examination by tax authorities.
F-10
Table of Contents
Cash and Cash Equivalents
The Company considers all highly liquid investments with an original or purchased maturity of 90 days or less to be cash equivalents.
Restricted Cash
The Company’s restricted cash consists of cash collateral agreements primarily related to the Company’s corporate credit card program and the issuance of a letter of credit related to workers’ compensation insurance.
Accounts Receivable
Accounts receivable are typically billed and collected within 90 days of the balance sheet date. Consistent with industry practice certain receivables related to long-term contracts are classified as current although some of the retainages are not expected to be billed and collected within one year. The Company’s accounts receivable are primarily from federal government agencies or customers engaged in work for the federal government, and therefore, the Company believes there is no material credit risk associated with these receivables.
Property and Equipment
Property and equipment, including major additions or improvements thereto, are recorded at cost and depreciated over their estimated useful lives ranging from three to seven years using the straight-line method. Leasehold improvements are amortized over the lesser of the lease term or the asset’s estimated useful life, but typically not exceeding seven years, using the straight-line method. The carrying value of property, equipment and leasehold improvements did not change as a result of the Transaction as the assets approximated fair value. Depreciation and amortization expense related to property, equipment and leasehold improvements was $0.9 million, $15.9 million, $13.5 million and $10.7 million for the period from July 1, 2011 through July 20, 2011, the period from July 21, 2011 through June 30, 2012, fiscal 2013 and 2014, respectively.
Accounting for Stock-Based Compensation
Compensation costs related to the Company’s stock-based compensation plans are recognized based on the grant-date fair value of the options and restricted stock granted. In calculating the compensation expense for options granted, the Company utilized the Black-Scholes-Merton option-pricing model to value the service options and either the Monte Carlo or the binomial lattice model to value the performance options. These models are widely accepted methods to calculate the fair value of stock options; however, the results are dependent on the inputs, two of which, expected term and expected volatility, are dependent on management’s judgment. Changes in management’s judgment of the expected term and the expected volatility could have a material effect on the grant-date fair value calculated and, in turn, on the amount of compensation cost recognized. See Note 5 for details regarding the assumptions used in each of the models.
Given the absence of a public trading market, the Company utilized a discounted cash flow analysis as well as comparative market multiples to determine the fair market value of its common stock. The fair market value determination was discounted for lack of marketability for purposes of calculating the Company’s stock-based compensation expense.
The Company was required to estimate future stock option and restricted stock award forfeitures when determining the amount of stock-based compensation costs to record. The Company has concluded that its historical forfeiture experience since the Transaction is the best basis available to estimate future stock option forfeitures. However, actual forfeitures may differ from the estimates used, and could materially affect the compensation expense recognized.
F-11
Table of Contents
Facility Costs
The Company recognizes rent expense, including escalated rent and rent holidays, on a straight-line basis over the term of the lease. Incentives for tenant improvements are recorded as liabilities and amortized as reductions in rent expense over the term of the respective leases.
From time to time, the Company may vacate leased space before the expiration of the lease, which results in the Company recording a facility exit charge. The facility exit charge is calculated as the remaining lease commitment plus termination costs less estimated sublease income. If actual amounts differ from the Company’s estimates, the amount of the facility exit charge may change. See Note 12 for a description of the charges recorded.
Fair Value Measurements
Fair value is the price that would be received to sell an asset or paid to transfer a liability in the principal or most advantageous market in an orderly transaction between marketplace participants. Various valuation approaches can be used to determine fair value, each requiring different valuation inputs. The following hierarchy classifies the inputs used to determine fair value into three levels:
| • | Level 1—Quoted prices for identical instruments in active markets; |
| • | Level 2—Quoted prices for similar instruments in active markets, quoted prices for identical or similar instruments in markets that are not active, and model-derived valuations in which all significant inputs and significant value drivers are observable in active markets; and |
| • | Level 3—Valuations derived from valuation techniques in which one or more significant inputs or significant value drivers are unobservable. |
The Company did not have any significant non-financial assets or liabilities measured at fair value on June 30, 2013 or 2014, with the exception of trade names and goodwill, which were measured at fair value during the fiscal 2013 impairment assessment. As discussed in Note 3, the Company recorded a charge for the impairment of goodwill and trade names to adjust the carrying value of the assets down to fair value in fiscal 2013. The valuation models used in the impairment analysis are based, in part, on estimated future operating results and cash flows. Because these factors are derived from the Company’s estimates and internal market assumptions, they are considered unobservable inputs and the resulting fair value measurements are included in Level 3 of the fair value hierarchy.
The Company’s financial instruments include cash, trade and note receivables, vendor payables and debt, as well as derivative financial instruments to manage risk related to its debt. As of June 30, 2013 and 2014, the carrying value of cash, trade receivables, and vendor payables approximated their fair value. See Note 8 for a discussion of the fair value of the Company’s debt. See Note 9 for a discussion of the fair value of the Company’s derivative financial instruments.
Derivative Instruments and Hedging Activities
The Company utilizes derivative financial instruments to manage interest rate risk related to its senior secured term loan B facility. The Company’s objectives in using interest rate derivatives are to add stability to interest expense and to manage its exposure to interest rate movements. To accomplish this objective, the Company primarily uses interest rate swaps as part of its interest rate risk management strategy. The effective portion of changes in the fair value of derivatives designated and that qualify as cash flow hedges is recorded in Accumulated Other Comprehensive Income (Loss), or AOCI, net of taxes, and is subsequently reclassified into earnings in the period that the hedged forecasted transaction affects earnings. Any ineffective portion of the change in fair value of the derivatives is recognized directly in earnings.
F-12
Table of Contents
Preferred Stock
SRA Companies has 352,820 authorized shares of preferred stock as of June 30, 2013 and 2014. No preferred stock was issued by SRA Companies.
Common Stock
SRA Companies has 1,147,180 authorized shares of common stock as of June 30, 2013 and 2014. 514,135 and 514,268 shares were issued and outstanding as of June 30, 2013 and 2014, respectively.
Earnings per Share
The Company computes basic net income (loss) per share by dividing net income (loss) by the weighted-average number of shares of common stock outstanding during the period. Diluted net income (loss) per share gives effect to dilutive potential shares of common stock. In the periods presented the computation of dilutive earnings per share excludes stock options and restricted stock units, whose effect, if included, are antidilutive.
Research and Development Costs
Research and development, or R&D, costs are expensed as incurred. Total R&D costs, which are included in selling, general and administrative expenses, were $0.3 million, $3.4 million, $1.4 million and $1.4 million for the period from July 1, 2011 through July 20, 2011, the period from July 21, 2011 through June 30, 2012, fiscal 2013 and 2014, respectively.
Discontinued Operations
During fiscal 2011, the Company made the decision to divest its Era Systems, or Era, and Global Clinical Development, or GCD, businesses. The Company sold the airport operations solutions, or AOS, component of Era in the second quarter of fiscal 2011 and Era’s foreign air traffic management and military and security component in the second quarter of fiscal 2012. The Company also sold the GCD business in the first quarter of fiscal 2012. In connection with the sale transactions, the Company agreed to certain customary indemnification obligations. The general indemnification periods have expired; however, fraud and tax indemnifications last longer. The Era and GCD businesses are presented as discontinued operations.
The cash flows of discontinued operations for the periods presented were as follows (in thousands):
| Predecessor | Successor | |||||||||
| July 1, 2011 through July 20, 2011 |
July 21, 2011 through June 30, 2012 |
|||||||||
| Net cash used in operating activities of discontinued operations |
$ | (662 | ) | $ | (7,374 | ) | ||||
| Net cash (used in) provided by investing activities of discontinued operations |
(236 | ) | 13,197 | |||||||
| Net cash used in financing activities of discontinued operations |
— | — | ||||||||
| Effect of exchange rate changes on cash and cash equivalents |
22 | (191 | ) | |||||||
Recent Accounting Pronouncements
In July 2013, the Financial Accounting Standards Board, or FASB, issued Accounting Standards Update, or ASU, 2013-11, Presentation of an Unrecognized Tax Benefit When a Net Operating Loss Carryforward, a Similar Tax Loss, or a Tax Credit Carryforward Exists, which requires standard presentation of an unrecognized tax benefit when a carryforward related to net operating losses or tax credits exist. This update is effective for fiscal years and interim periods within those fiscal years beginning after December 15, 2013, or the Company’s fiscal 2015. The adoption of this ASU did not have an impact on the Company’s financial position, results of operations or cash flows.
F-13
Table of Contents
In May 2014, the FASB issued ASU 2014-09, Revenue from Contracts with Customers, which requires an entity to recognize the amount of revenue to which it expects to be entitled for the transfer of promised goods or services to customers. This ASU will replace most existing revenue recognition guidance in U.S. GAAP when it becomes effective. The new standard is effective for the Company’s fiscal 2017. Early application is not permitted. The standard permits the use of either the retrospective or cumulative effect transition method. The Company is evaluating the effect that ASU 2014-09 will have on its consolidated financial statements and related disclosures. The Company has not yet selected a transition method nor has it determined the effect of the standard on its ongoing financial reporting.
2. Acquisitions & Divestitures:
Acquisition of MorganFranklin Corporation’s National Security Solutions Division
On December 16, 2012, the Company completed an asset purchase of MorganFranklin Corporation’s National Security Solutions division, or NSS, for $33.6 million. The acquisition was financed with borrowings under the Company’s revolving credit facility and cash on hand. NSS specializes in providing high-end command, control, communications, computer, intelligence, surveillance and reconnaissance, or C4ISR, intelligence analysis and cyber security services and solutions.
The total consideration was allocated to net tangible and identifiable intangible assets based on their fair values as of December 16, 2012. The excess of the purchase price over the net tangible and identifiable intangible assets was recorded to goodwill. In its determination of estimated fair values, the Company considered, among other factors, its intention for future use of acquired assets, analysis of historical financial performance, and estimates of future performance of contracts.
The purchase price allocation is as follows (in thousands):
| Current assets |
$ | 6,033 | ||
| Current liabilities |
(2,219 | ) | ||
|
|
|
|||
| Acquired tangible assets |
3,814 | |||
| Definite-lived intangible assets |
10,000 | |||
| Goodwill |
19,817 | |||
|
|
|
|||
| Total purchase price |
$ | 33,631 | ||
|
|
|
The goodwill and identified intangible assets are deductible for income tax purposes. The identified intangible assets consist of customer relationships which will be amortized over estimated useful lives of ten years. Amortization is calculated on an accelerated basis based on the expected benefits of the assets.
Divestiture of a Portion of the Health & Civil business
On July 1, 2013, the Company sold a portion of its Health & Civil business, consisting of six contracts, for approximately $5.5 million. The Company recognized a gain of approximately $1.6 million during fiscal 2014 as a component of continuing operations. As a result of the divestiture, goodwill and intangible assets were reduced by approximately $4.2 million and $1.3 million, respectively.
3. Goodwill and Long-Lived Assets:
The Company tests trade names and goodwill for impairment at least annually during the fourth quarter as of April 1.
Trade names are assessed for impairment by comparing the carrying value to the estimated fair value calculated using the relief from royalty method. Under the relief from royalty method, a market royalty rate is
F-14
Table of Contents
applied to the Company’s future projected revenue. In fiscal 2014, the estimated fair value of the trade names was greater than the carrying value, therefore, no impairment was recognized. In fiscal 2013, the Company recognized a trade name impairment charge of $51.9 million for the amount of carrying value in excess of fair value.
In December 2013, the Company realigned its portfolio of customers from four business groups: Civil, Defense, Health, and Intelligence, Homeland Security and Law Enforcement, or IHL, into two business groups: National Security group and Health & Civil group. Goodwill assigned to the Company’s reporting units is assessed for impairment in a two-step process. In step one, the Company utilizes a discounted cash flow analysis as well as comparative market multiples to determine the fair value of its reporting units. In fiscal 2014, there was no indication of impairment in the National Security reporting unit or the Health & Civil reporting unit as the fair value was more than 20% higher than the carrying value. The fair value of the reporting units was higher than the carrying value as a result of higher industry valuation multiples, an increase in backlog and higher expected profit margins. In fiscal 2013, the carrying values of Defense, Civil and IHL reporting units exceeded their respective fair values, indicating a potential impairment. There was no indication of impairment in the Health reporting unit.
In fiscal 2013, the Company performed the second step of the goodwill impairment analysis to measure the amount of the impairment charge in its Civil, Defense and IHL reporting units. In step two, the fair value determined in step 1 is allocated to the tangible and intangible assets and liabilities of the reporting unit to derive an implied fair value of the reporting unit’s goodwill. Based on the results of the step two analyses, the Company recorded a $293.9 million goodwill impairment in fiscal 2013.
The fiscal 2013 impairment charge by reporting unit is as follows (in thousands):
| Goodwill Impairment |
||||
| Civil |
$ | 166,105 | ||
| Defense |
52,128 | |||
| IHL |
75,620 | |||
|
|
|
|||
| Total impairment |
$ | 293,853 | ||
|
|
|
|||
Given the current industry conditions and the uncertainties regarding the impact on the Company’s business, there can be no assurance that the estimates and assumptions used in the goodwill and trade names impairment analyses will prove to be accurate predictions of the future. If the assumptions regarding forecasted revenue or profitability are not achieved, or the Company experiences adverse changes in market factors such as discount rates or valuation multiples, the Company may be required to recognize additional impairment charges in future periods.
The changes in the carrying amount of goodwill were as follows (in thousands):
| Goodwill as of June 30, 2012 |
$ | 1,061,796 | ||
| Acquisition of MorganFranklin NSS |
19,817 | |||
| Impairment |
(293,853 | ) | ||
|
|
|
|||
| Goodwill as of June 30, 2013 |
$ | 787,760 | ||
| Sale of a portion of the Health & Civil business |
(4,156 | ) | ||
|
|
|
|||
| Goodwill as of June 30, 2014 |
$ | 783,604 | ||
|
|
|
F-15
Table of Contents
Given the goodwill impairment in fiscal 2013, the Company assessed the value of future undiscounted net cash flows related to the identified intangible assets with finite lives, without interest charges. The Company concluded that the carrying amount of the assets did not exceed the future undiscounted net cash flows, and therefore, the identified intangible assets were not impaired in fiscal 2013. In fiscal 2014, there was no triggering event to assess whether identified intangible assets were impaired. Identified intangible assets for the periods presented consisted of the following (in thousands):
| June 30, 2013 | ||||||||||||||||
| Weighted- Average Useful Life |
Gross Carrying Amount |
Accumulated Amortization |
Net Carrying Amount |
|||||||||||||
| Customer relationships |
20 years | $ | 289,400 | $ | (35,374 | ) | $ | 254,026 | ||||||||
| Order backlog and developed technology |
4 years | 215,290 | (144,219 | ) | 71,071 | |||||||||||
| Software development costs |
7 years | 2,930 | (105 | ) | 2,825 | |||||||||||
|
|
|
|
|
|
|
|||||||||||
| Total identified intangible assets |
13 years | $ | 507,620 | $ | (179,698 | ) | $ | 327,922 | ||||||||
|
|
|
|
|
|
|
|||||||||||
| June 30, 2014 | ||||||||||||||||
| Weighted- Average Useful Life |
Gross Carrying Amount |
Accumulated Amortization |
Net Carrying Amount |
|||||||||||||
| Customer relationships |
20 years | $ | 288,901 | $ | (62,556 | ) | $ | 226,345 | ||||||||
| Order backlog and developed technology |
4 years | 212,798 | (187,634 | ) | 25,164 | |||||||||||
| Software development costs |
7 years | 2,930 | (523 | ) | 2,407 | |||||||||||
|
|
|
|
|
|
|
|||||||||||
| Total identified intangible assets |
13 years | $ | 504,629 | $ | (250,713 | ) | $ | 253,916 | ||||||||
|
|
|
|
|
|
|
|||||||||||
Software development costs relate to the implementation and setup of a human capital management system during fiscal 2013.
Amortization expense of identified intangible assets was $0.4 million for the period from July 1, 2011 through July 20, 2011, $91.6 million for the period from July 21, 2011 through June 30, 2012, $88.1 million for fiscal 2013 and $72.7 million for fiscal 2014. Identified intangible assets are amortized based on the expected benefits of the assets over estimated useful lives ranging from 4 to 20 years. Estimated amortization expense is as follows for the periods indicated (in thousands):
| Fiscal year ending June 30, |
||||
| 2015 |
$ | 57,823 | ||
| 2016 |
38,327 | |||
| 2017 |
30,604 | |||
| 2018 |
24,754 | |||
| 2019 |
20,256 | |||
| Thereafter |
82,152 | |||
|
|
|
|||
| Total |
$ | 253,916 | ||
|
|
|
4. Benefit Plan:
The Company maintains a defined contribution plan, the SRA International, Inc. 401(k) Savings Plan, or the Plan. All regular and full-time employees are generally eligible to participate in the Plan. The Board of Directors can make changes to the matching contribution percentage at any time. The Company’s matching contribution expense was $0.5 million, $14.2 million, $15.6 million and $10.7 million in the period from July 1, 2011 through July 20, 2011, the period from July 21, 2011 through June 30, 2012, fiscal 2013 and 2014, respectively.
F-16
Table of Contents
5. Stock-Based Compensation:
Stock Options
The Board of Directors adopted a stock incentive plan in February 2012, amended in December 2012, or the 2012 Plan, that authorizes the issuance of up to 61,262 shares of common stock in the form of options. Under the 2012 Plan, key employees, non-employee directors and consultants of the Company may be granted a combination of service and performance options. The performance options are considered market-based for accounting purposes.
The service options generally vest in five equal installments subject to the option holder’s continued employment or service with the Company. The performance options vest at the time of a change in control based upon the cash return to the PEP Funds from its investment in the Company. The service and performance options expire 10 years from the date of grant.
Assumptions
In calculating the compensation expense for options granted, the Company utilizes the Black-Scholes-Merton model to value the service options and the Monte Carlo or binomial lattice model to value the performance options. The weighted average assumptions used to calculate fair market value of the stock options in the models for the periods presented were as follows:
| Fiscal Year Ended June 30, |
||||||||||||
| 2012 | 2013 | 2014 | ||||||||||
| Expected volatility |
42.0 | % | 42.0 | % | 142.5 | % | ||||||
| Expected term (in years) |
4.25 | 4.25 | 4.5 | |||||||||
| Risk-free interest rate |
0.42 | % | 0.42 | % | 0.63 | % | ||||||
| Dividend yield |
— | % | — | % | — | % | ||||||
The expected volatility is based upon the combination of SRA’s historical stock volatility as a public company before the announcement of the Transaction, the historical volatility of peer public companies’ stock prices and the implied volatility of comparable, publicly traded companies’ share prices determined from publicly traded call options, as applicable.
The expected term is estimated based on exit event scenarios. The risk-free rate is based on the forward U.S. Treasury note yields over the expected term. The Company used a dividend yield percentage of zero because the Company has not historically paid dividends.
The estimated forfeiture rate was 20%, 35% and 40% for fiscal 2012, 2013 and 2014, respectively, based on an analysis of the Company’s historical forfeiture rate averages since the Transaction.
F-17
Table of Contents
The following table summarizes stock option activity for fiscal 2014:
| Service Options: |
||||
| Shares under option at June 30, 2013 |
25,210 | |||
| Options granted |
5,362 | |||
| Options exercised |
— | |||
| Options forfeited or canceled |
(4,501 | ) | ||
|
|
|
|||
| Shares under option at June 30, 2014 |
26,071 | |||
|
|
|
|||
| Options exercisable at June 30, 2014 |
8,142 | |||
|
|
|
|||
| Performance Options: |
||||
| Shares under option at June 30, 2013 |
25,488 | |||
| Options granted |
5,362 | |||
| Options forfeited or canceled |
(4,893 | ) | ||
|
|
|
|||
| Shares under option at June 30, 2014 |
25,957 | |||
|
|
|
For the service options, the weighted-average exercise price is $1,000. The weighted-average fair value per option granted, calculated based on the Black-Scholes-Merton model, was $341, $341 and $192 for fiscal 2012, 2013 and 2014, respectively. For the performance options, the weighted-average exercise price is $1,000. The weighted-average fair value per option granted, calculated based on the binomial lattice model for 2012 and 2013 and the Monte Carlo model for 2014, was $188, $188 and $186 for fiscal 2012, 2013 and 2014, respectively.
As of June 30, 2014, the aggregate intrinsic value of the stock options is zero, as the per share exercise price of the Company’s stock options exceeded their per share fair value.
Restricted Common Stock
In fiscal 2012, pursuant to the Chief Executive Officer’s, or CEO’s, employment agreement, the CEO was granted 1,000 shares of restricted common stock at $1,000 per share. The restricted shares vest 20% per year on each of the first five anniversaries of the CEO’s date of employment with the Company.
In June 2013, the Board of Directors approved a restricted stock plan, or Restricted Stock Plan. The Board may award shares of restricted stock under the Restricted Stock Plan, at its discretion, to key employees. As of June 30, 2014, the number of authorized shares eligible for grant under the Restricted Stock Plan was 19,340 shares of common stock.
Vesting of restricted stock awarded under the Restricted Stock Plan is subject to the grantee’s continuous employment with the Company from the grant date to the vesting date. Restricted stock awarded prior to September 2013 vests 36 months from the grant date. The September 2013 restricted stock awards vest in three equal installments annually on the anniversary of the grant date and subject to an attainment of a Company performance condition. Vested restricted stock issued under the Restricted Stock Plan remains subject to certain sales and transfer restrictions.
The following table summarizes restricted stock activity for awards issued under the Restricted Stock Plan to Company employees and awards issued in fiscal 2012 pursuant to the Chief Executive Officer’s employment agreement for fiscal 2014:
| Nonvested restricted shares at June 30, 2013 |
12,165 | |||
| Restricted shares granted |
3,309 | |||
| Restricted shares vested |
(200 | ) | ||
| Restricted shares forfeited |
(3,198 | ) | ||
|
|
|
|||
| Nonvested restricted shares at June 30, 2014 |
12,076 | |||
|
|
|
F-18
Table of Contents
The weighted-average grant-date fair value of the restricted stock granted in fiscal 2012 and 2013 was $1,000 and $250 per share, respectively. The weighted-average grant-date fair value of the restricted stock granted in fiscal 2014 was $200 per share, which is restricted by a Company performance condition. The per share value calculated for purposes of recording stock-based compensation expense was determined using a discounted cash flow analysis as well as comparative market multiples, and was discounted for lack of marketability.
Stock Compensation Expense
The Company recognized stock-based compensation expense related to the stock options and restricted stock of $1.8 million, $2.8 million and $3.3 million for the period from July 21, 2011 through June 30, 2012, fiscal 2013 and 2014, respectively. The total amount of unrecognized compensation expense related to unvested stock-based compensation arrangements was $7.0 million as of June 30, 2014 and is expected to be recognized on a straight-line basis over a weighted average period of 2.5 years.
6. Accounts Receivable:
Accounts receivable, net as of June 30, 2013 and 2014 consisted of the following (in thousands):
| June 30, | ||||||||
| 2013 | 2014 | |||||||
| Billed and billable, net of allowance of $773 and $957 as of June 30, 2013 and 2014, respectively |
$ | 250,079 | $ | 201,427 | ||||
|
|
|
|
|
|||||
| Unbilled: |
||||||||
| Retainages |
3,465 | 4,031 | ||||||
| Revenue recorded in excess of milestone billings on fixed-price contracts |
16,947 | 12,595 | ||||||
| Revenue recorded in excess of contractual authorization, billable upon receipt of contractual documents |
2,208 | 5,184 | ||||||
| Allowance for unbillable amounts |
(5,223 | ) | (5,560 | ) | ||||
|
|
|
|
|
|||||
| Total unbilled |
17,397 | 16,250 | ||||||
|
|
|
|
|
|||||
| Total accounts receivable |
$ | 267,476 | $ | 217,677 | ||||
|
|
|
|
|
|||||
The billable receivables included in the billed and billable line item above represent primarily revenue earned in the final month of the reporting period. Consistent with industry practice, certain receivables related to long-term contracts are classified as current, although $2.2 million of retainages are not expected to be billed and collected within one year. The Company’s accounts receivable are primarily from federal government agencies or customers engaged in work for the federal government.
Changes in the Company’s allowance for doubtful accounts for the periods presented were as follows (in thousands):
| Predecessor | Successor | |||||||||||||||||
| July 1, 2011 through July 20, 2011 |
July 21, 2011 through June 30, 2012 |
Fiscal Year Ended June 30, 2013 |
Fiscal Year Ended June 30, 2014 |
|||||||||||||||
| Beginning balance |
$ | 601 | $ | 610 | $ | 532 | $ | 773 | ||||||||||
| Charged to costs and expenses |
9 | (78 | ) | 241 | 184 | |||||||||||||
|
|
|
|
|
|
|
|
|
|||||||||||
| Ending balance |
$ | 610 | $ | 532 | $ | 773 | $ | 957 | ||||||||||
|
|
|
|
|
|
|
|
|
|||||||||||
F-19
Table of Contents
Changes in the Company’s allowance for unbillable amounts for the periods presented were as follows (in thousands):
| Predecessor | Successor | |||||||||||||||||
| July 1, 2011 through July 20, 2011 |
July 21, 2011 through June 30, 2012 |
Fiscal Year Ended June 30, 2013 |
Fiscal Year Ended June 30, 2014 |
|||||||||||||||
| Beginning balance |
$ | 5,548 | $ | 5,501 | $ | 5,269 | $ | 5,223 | ||||||||||
| Charged to costs and expenses |
(47 | ) | (232 | ) | (46 | ) | 337 | |||||||||||
|
|
|
|
|
|
|
|
|
|||||||||||
| Ending balance |
$ | 5,501 | $ | 5,269 | $ | 5,223 | $ | 5,560 | ||||||||||
|
|
|
|
|
|
|
|
|
|||||||||||
Billings in excess of revenue totaled $8.6 million at June 30, 2013 and $10.8 million as of June 30, 2014. Billings in excess of the revenue recognized are classified as a current liability in the consolidated balance sheet.
Accounts Receivable Factoring
During fiscal 2014, the Company entered into an accounts receivable purchase agreement under which the Company sells certain accounts receivable to a third party, or the Factor, without recourse to the Company. The Factor initially pays the Company 90% of the receivable and the remaining price is deferred and based on the amount the Factor receives from our customer. The structure of the transaction provides for a true sale, on a revolving basis, of the receivables transferred. Accordingly, upon transfer of the receivable to the Factor, the receivable is removed from the Company’s consolidated balance sheet, a loss on the sale is recorded and the deferred price is an account receivable until it is collected. The balance of the sold receivables may not exceed $50 million at any time. For fiscal 2014, the Company sold approximately $142.2 million of receivables and recognized a related loss of $0.4 million in selling, general and administrative expenses. As of June 30, 2014, the balance of the sold receivables was approximately $25.4 million, and the related deferred price was approximately $2.5 million.
F-20
Table of Contents
7. Composition of Certain Financial Statement Captions:
Details of the composition of certain financial statement captions for the periods presented were as follows (in thousands):
| June 30, | ||||||||
| 2013 | 2014 | |||||||
| Prepaid expenses and other |
||||||||
| Taxes and taxes receivable |
$ | 3,353 | $ | — | ||||
| Maintenance and software |
2,447 | 1,575 | ||||||
| Rent |
2,634 | 237 | ||||||
| Other |
6,988 | 3,831 | ||||||
|
|
|
|
|
|||||
| Total prepaid expenses and other |
$ | 15,422 | $ | 5,643 | ||||
|
|
|
|
|
|||||
| Property and equipment |
||||||||
| Leasehold improvements |
$ | 22,491 | $ | 22,482 | ||||
| Furniture, equipment and software |
29,996 | 32,185 | ||||||
|
|
|
|
|
|||||
| Total property and equipment |
52,487 | 54,667 | ||||||
| Less: Accumulated depreciation and amortization |
(27,676 | ) | (35,742 | ) | ||||
|
|
|
|
|
|||||
| Total property and equipment, net |
$ | 24,811 | $ | 18,925 | ||||
|
|
|
|
|
|||||
| Other long-term assets |
||||||||
| Debt issuance costs, net |
$ | 38,123 | $ | 31,566 | ||||
| Other |
4,429 | 4,066 | ||||||
|
|
|
|
|
|||||
| Total other long-term assets |
$ | 42,552 | $ | 35,632 | ||||
|
|
|
|
|
|||||
| Accounts payable and accrued expenses |
||||||||
| Vendor obligations |
$ | 78,364 | $ | 86,658 | ||||
| Accrued interest |
11,059 | 23,215 | ||||||
| Interest rate derivative liability |
4,484 | 10,729 | ||||||
| Facility exit charge |
1,398 | 8,173 | ||||||
| Other |
8,016 | 7,851 | ||||||
|
|
|
|
|
|||||
| Total accounts payable and accrued expenses |
$ | 103,321 | $ | 136,626 | ||||
|
|
|
|
|
|||||
| Accrued payroll and employee benefits |
||||||||
| Accrued salaries and incentive compensation |
$ | 25,183 | $ | 35,195 | ||||
| Accrued leave |
49,928 | 33,694 | ||||||
| Accrued fringe benefits |
9,896 | 14,128 | ||||||
|
|
|
|
|
|||||
| Total accrued payroll and employee benefits |
$ | 85,007 | $ | 83,017 | ||||
|
|
|
|
|
|||||
| Other long-term liabilities |
||||||||
| Interest rate derivative liability |
$ | 15,563 | $ | 8,803 | ||||
| Deferred rent |
8,094 | 9,433 | ||||||
| Facility exit charge |
2,140 | 5,193 | ||||||
| Other |
967 | 1,312 | ||||||
|
|
|
|
|
|||||
| Total other long-term liabilities |
$ | 26,764 | $ | 24,741 | ||||
|
|
|
|
|
|||||
F-21
Table of Contents
8. Debt:
On July 20, 2011, in connection with the Transaction, SRA (i) entered into senior secured credit facilities, consisting of an $875.0 million Term Loan B Facility and a $100.0 million Revolver, or the Credit Agreement, and (ii) issued $400.0 million aggregate principal amount of 11% Senior Notes. The Term Loan B Facility was issued at a discount of $8.75 million.
At June 30, 2013 and 2014, debt consisted of the following (in thousands):
| June 30, | ||||||||
| 2013 | 2014 | |||||||
| Secured Term Loan B Facility |
$ | 715,000 | $ | 675,000 | ||||
| Less: Unamortized discount |
(6,333 | ) | (5,073 | ) | ||||
|
|
|
|
|
|||||
| Secured Term Loan B Facility, net |
708,667 | 669,927 | ||||||
| Senior Notes due 2019 at 11% |
400,000 | 400,000 | ||||||
|
|
|
|
|
|||||
| Total debt |
1,108,667 | 1,069,927 | ||||||
| Less: Current portion of long-term debt |
— | (22,000 | ) | |||||
|
|
|
|
|
|||||
| Long-term debt |
$ | 1,108,667 | $ | 1,047,927 | ||||
|
|
|
|
|
|||||
As of June 30, 2014, the fair value of SRA’s debt, based on recent trading activity, approximated carrying value.
The Credit Agreement and the indenture governing the Senior Notes issued in connection with the Transaction limit SRA’s ability to incur certain additional indebtedness, pay dividends or make other distributions or repurchase capital stock, make certain investments, enter into certain types of transactions with affiliates, use assets as security in other transactions, and sell certain assets.
SRA is required to meet a net senior secured leverage ratio, or NSSLR, covenant quarterly if any revolving loan, swing-line loan or letter of credit is outstanding on the last day of the quarter. SRA had no outstanding debt, letters of credit or borrowings under its Revolver as of June 30, 2013 and 2014. If SRA had any borrowings on its Revolver, it would have been required to maintain a NSSLR of less than or equal to 5.0x as of June 30, 2014. The NSSLR requirement decreases over time to 4.5x as of June 30, 2016. The ratio is calculated as the consolidated net secured indebtedness as of the last day of the quarter (defined as the consolidated net debt secured by any lien minus any cash and permitted investments) to the preceding four quarters’ consolidated EBITDA (as defined in the Credit Agreement). SRA’s NSSLR was 3.7x as of June 30, 2013 and 3.2x as of June 30, 2014. As of June 30, 2014, SRA was in compliance with all of its covenants.
Senior Secured Credit Facilities
Borrowings under the senior secured credit facilities bear interest at a rate equal to an applicable margin plus the London Interbank Offered Rate, or LIBOR, with a 1.25% floor, or, at SRA’s option, an applicable margin plus an alternative base rate determined by reference to the higher of the prime rate or the federal funds rate plus 0.5%, with a 2.25% floor. In addition to paying interest on outstanding principal under the senior secured credit facilities, SRA pays a per annum commitment fee on undrawn amounts under the revolving credit facility and customary administrative fees. The senior secured credit facilities are guaranteed by Sterling Parent and substantially all wholly-owned domestic subsidiaries of SRA. The Term Loan B Facility matures in July 2018 and the Revolver matures in July 2016.
In addition, the senior secured credit facilities require SRA to prepay outstanding term loans, subject to certain exceptions, in the case of excess cash flow, or ECF, and in the event of certain asset sales, condemnation
F-22
Table of Contents
events and issuances of debt. SRA is required to make annual payments equal to 75% of ECF, with a reduction to 50% based upon achievement of a net senior secured leverage ratio of less than 3.5x, 25% if less than 2.75x and zero if less than 2.0x. Any required ECF payments are due on October 15 each year. SRA repaid $140.0 million of its Term Loan B Facility in fiscal 2012, which satisfied all of SRA’s required quarterly principal payments and required ECF principal payments for fiscal 2012. SRA repaid $20.0 million of its Term Loan B Facility in fiscal 2013, which satisfied SRA’s required ECF principal payments for fiscal 2013. SRA’s fiscal 2014 ECF requirement is $62.0 million, of which SRA repaid $40.0 million during fiscal 2014. The remainder is included in current liabilities on the consolidated balance sheet and was tendered as payment in October 2014, of which $10.6 million was declined by the lenders and returned to SRA, as permitted by the facility.
The $8.75 million Term Loan B Facility original issue discount is being amortized to interest expense using the effective interest method and added to the recorded debt amount over the seven-year term of the loan. During the period from July 21, 2011 through June 30, 2012, fiscal 2013 and 2014, $1.3 million, $1.1 million and $1.3 million, respectively, of the original issue discount were amortized and reflected in interest expense in the consolidated statements of operations.
Costs incurred in connection with the issuance of the debt are amortized using the effective interest method over the life of the related debt and accelerated to the extent that any repayment is made. During the period from July 21, 2011 through June 30, 2012, fiscal 2013 and 2014, $6.1 million, $6.0 million and $6.6 million, respectively, of costs were amortized and reflected in interest expense in the consolidated statements of operations.
As of June 30, 2014, interest accrued at an average rate of 6.5% for the senior secured credit facilities. Interest payments of $52.6 million, $47.8 million and $36.7 million were made in the period from July 21, 2011 through June 30, 2012, for fiscal 2013 and 2014, respectively, including $0.4 million, $0.5 million and $0.6 million of commitment fees for the same periods.
Senior Notes due 2019
The Senior Notes due in 2019 are guaranteed by SRA’s wholly-owned domestic subsidiaries. Interest on the Senior Notes is payable semi-annually. The Senior Notes are redeemable in whole or in part, at the option of SRA, at varying redemption prices that generally include premiums.
As of June 30, 2013 and 2014, interest accrued at an average rate of 11.0% for the Senior Notes. SRA paid $30.7 million, $44.0 million and $44.0 million of interest related to the Senior Notes in the period from July 21, 2011 through June 30, 2012, fiscal 2013 and 2014, respectively.
9. Derivative Instruments and Hedging Activities:
Hedge of Interest Rate Risk
Risk Management Objective of Using Derivatives
The Company utilizes derivative financial instruments to manage interest rate risk related to its Term Loan B Facility.
Cash Flow Hedges of Interest Rate Risk
The Company’s objectives in using interest rate derivatives are to add stability to interest expense and to manage its exposure to interest rate movements. To accomplish this objective, the Company uses interest rate swaps as part of its interest rate risk management strategy. During the Successor periods, such derivatives were
F-23
Table of Contents
used to hedge the variable cash flows associated with existing variable-rate debt. As of June 30, 2013 and 2014, the Company had outstanding interest rate derivatives with an initial combined notional value of $650.0 million and $565.0 million, respectively, which were designated as cash flow hedges of interest rate risk. The interest rate swap derivatives decrease over time to a notional value of $475.0 million upon maturity in July 2016.
The effective portion of changes in the fair value of derivatives designated and that qualify as cash flow hedges is recorded in AOCI, net of taxes, and is subsequently reclassified into earnings in the period that the hedged forecasted transaction affects earnings. The ineffective portion of the change in fair value of the derivatives is recognized directly in earnings. Amounts reported in AOCI related to derivatives will be reclassified to interest expense as interest payments are made on the Company’s variable-rate debt. During the next twelve months, the Company estimates that approximately $10.7 million will be reclassified from AOCI into interest expense.
Fair Values of Derivative Instruments on the Consolidated Balance Sheets
The fair value of the Company’s derivative financial instruments, determined using Level 2 inputs (see Note 1), was $20.0 million and $19.5 million as of June 30, 2013 and 2014, respectively. The current portion is included in the accounts payable and accrued expenses and the long-term portion is included in other long-term liabilities in the consolidated balance sheets.
The Company utilizes a third-party pricing service to assist with determining the fair values for its interest rate swaps. The Company performs procedures to corroborate the values provided by the pricing service including regular discussions to understand the pricing service’s methodology and a review of the service provider’s Statement on Standards for Attestation Engagements No. 16, or SSAE 16, report.
The Effect of Derivative Instruments on the Consolidated Statements of Operations & Consolidated Statements of Comprehensive Loss
All amounts recorded in other comprehensive loss are related to the Company’s derivatives. The following table represents a rollforward of amounts recognized in accumulated other comprehensive loss, including the reclassifications out of the accumulated other comprehensive loss to the consolidated statements of operations (in thousands):
| Predecessor | Successor | |||||||||||||||||
| July 1, 2011 through July 20, 2011 |
July 21, 2011 through June 30, 2012 |
Fiscal Year Ended June 30, 2013 |
Fiscal Year Ended June 30, 2014 |
|||||||||||||||
| Beginning of period |
$ | — | $ | — | $ | (12,027 | ) | $ | (12,183 | ) | ||||||||
| Other comprehensive loss before reclassifications |
||||||||||||||||||
| Total before tax |
— | (19,997 | ) | (1,798 | ) | (4,064 | ) | |||||||||||
| Tax effect |
— | 7,844 | 705 | 1,594 | ||||||||||||||
|
|
|
|
|
|
|
|
|
|||||||||||
| Net of tax |
— | (12,153 | ) | (1,093 | ) | (2,470 | ) | |||||||||||
| Amounts reclassified from accumulated other comprehensive income (loss) |
||||||||||||||||||
| Total before tax |
— | 208 | 1,542 | 4,578 | ||||||||||||||
| Tax effect |
— | (82 | ) | (605 | ) | (1,796 | ) | |||||||||||
|
|
|
|
|
|
|
|
|
|||||||||||
| Net of tax |
— | 126 | 937 | 2,782 | ||||||||||||||
|
|
|
|
|
|
|
|
|
|||||||||||
| Net other comprehensive (loss) income |
— | (12,027 | ) | (156 | ) | 312 | ||||||||||||
|
|
|
|
|
|
|
|
|
|||||||||||
| End of period |
$ | — | $ | (12,027 | ) | $ | (12,183 | ) | $ | (11,871 | ) | |||||||
|
|
|
|
|
|
|
|
|
|||||||||||
The Company amortized $0.2 million, $1.5 million and $4.6 million of the interest rate derivatives from AOCI into interest expense in the consolidated statements of operations for the period from July 21, 2011 through June 30, 2012, fiscal 2013 and 2014, respectively.
F-24
Table of Contents
Credit Risk-Related Contingent Features
The Company has agreements with each of its interest rate swap counterparties that contain a provision providing that the Company could be declared in default on its derivative obligations if repayment of the underlying indebtedness is accelerated by the lender due to the Company’s default on the indebtedness.
If the Company had breached any of the provisions of the agreements at June 30, 2014, it could have been required to settle its obligations under the agreements at an estimated termination value. As of June 30, 2014, the termination value of the interest rate swaps in a net liability position, which includes accrued interest but excludes any adjustment for nonperformance risk related to these agreements, was $21.6 million. As of June 30, 2014, the Company had not breached any of the provisions or posted any collateral related to these agreements.
10. Income Taxes:
The benefit for income taxes for the periods presented was comprised of the following (in thousands):
| Predecessor | Successor | |||||||||||||||||||
| July 1, 2011 through July 20, 2011 |
July 21, 2011 Through June 30, 2012 |
Fiscal Year Ended June 30, 2013 |
Fiscal Year Ended June 30, 2014 |
|||||||||||||||||
| Current provision (benefit) |
||||||||||||||||||||
| Federal |
$ | (15 | ) | $ | 164 | $ | 986 | $ | 1,605 | |||||||||||
| State |
385 | 878 | (509 | ) | 905 | |||||||||||||||
| Deferred provision (benefit) |
||||||||||||||||||||
| Federal |
(16,775 | ) | (13,228 | ) | (52,115 | ) | (15,379 | ) | ||||||||||||
| State |
(2,057 | ) | (2,582 | ) | (8,531 | ) | (3,417 | ) | ||||||||||||
|
|
|
|
|
|
|
|
|
|||||||||||||
| Provision for (benefit from) income taxes |
$ | (18,462 | ) | $ | (14,768 | ) | $ | (60,169 | ) | $ | (16,286 | ) | ||||||||
|
|
|
|
|
|
|
|
|
|||||||||||||
A reconciliation of the Company’s statutory federal income tax rate to the effective tax rate for the periods presented is shown below:
| Predecessor | Successor | |||||||||||||||||||
| July 1, 2011 through July 20, 2011 |
July 21, 2011 through June 30, 2012 |
Fiscal Year Ended June 30, 2013 |
Fiscal Year Ended June 30, 2014 |
|||||||||||||||||
| Statutory federal income tax rate |
35.0 | % | 35.0 | % | 35.0 | % | 35.0 | % | ||||||||||||
| State income taxes, net of federal income tax benefit |
4.2 | 4.2 | 4.2 | 4.2 | ||||||||||||||||
| Reduction of state income tax benefit related to interest expense |
— | (1.6 | ) | — | — | |||||||||||||||
| Federal tax credits |
0.1 | 0.9 | 0.1 | 1.1 | ||||||||||||||||
| Non-deductible Transaction costs |
(7.8 | ) | (0.2 | ) | — | — | ||||||||||||||
| Non-deductible goodwill impairment |
— | — | (23.6 | ) | — | |||||||||||||||
| Other |
(1.9 | ) | (0.3 | ) | 0.2 | — | ||||||||||||||
|
|
|
|
|
|
|
|
|
|||||||||||||
| Effective tax rate |
29.6 | % | 38.0 | % | 15.9 | % | 40.3 | % | ||||||||||||
|
|
|
|
|
|
|
|
|
|||||||||||||
The Company’s fiscal 2014 effective tax rate is higher than the statutory income tax rate primarily due to federal tax credits.
F-25
Table of Contents
The components of the Company’s deferred tax (liabilities) assets as of June 30, 2013 and 2014 were as follows (in thousands):
| June 30, | ||||||||
| 2013 | 2014 | |||||||
| Deferred tax assets |
||||||||
| Compensated absences and other accruals not yet deductible for tax purposes |
$ | 25,194 | $ | 31,503 | ||||
| Financial statement depreciation in excess of tax depreciation |
285 | 16,497 | ||||||
| Nonqualified stock awards |
2,024 | 3,108 | ||||||
| Net operating loss carryforwards of acquired companies |
29,041 | 6,274 | ||||||
| Other |
14,163 | 15,310 | ||||||
|
|
|
|
|
|||||
| Total deferred tax asset |
$ | 70,707 | $ | 72,692 | ||||
|
|
|
|
|
|||||
| Deferred tax liabilities |
||||||||
| Identified intangible assets |
$ | (160,295 | ) | $ | (146,289 | ) | ||
| Prepaid expenses |
(1,004 | ) | (769 | ) | ||||
| Unbilled contract revenue |
(38,499 | ) | (35,930 | ) | ||||
|
|
|
|
|
|||||
| Total deferred tax liabilities |
(199,798 | ) | (182,988 | ) | ||||
|
|
|
|
|
|||||
| Net deferred tax liability |
$ | (129,091 | ) | $ | (110,296 | ) | ||
|
|
|
|
|
|||||
As of June 30, 2014, the Company had approximately $17.9 million of net federal operating loss, or NOL, carryforwards. The NOL carryforwards expire between fiscal 2031 through fiscal 2032.
Uncertain Tax Positions
The change in the Company’s unrecognized tax benefits for the periods presented is as follows (in thousands):
| Predecessor | Successor | |||||||||||||||||||
| July 1, 2011 through July 20, 2011 |
July 21, 2011 through June 30, 2012 |
Fiscal Year Ended June 30, 2013 |
Fiscal Year Ended June 30, 2014 |
|||||||||||||||||
| Beginning balance |
$ | 666 | $ | 550 | $ | 581 | $ | 967 | ||||||||||||
| Gross increases related to prior year tax positions |
— | — | 376 | 251 | ||||||||||||||||
| Gross increase related to current year tax positions |
10 | 60 | 157 | 93 | ||||||||||||||||
| Lapse of applicable statute of limitations |
(126 | ) | (29 | ) | (147 | ) | — | |||||||||||||
|
|
|
|
|
|
|
|
|
|||||||||||||
| Ending balance |
$ | 550 | $ | 581 | $ | 967 | $ | 1,311 | ||||||||||||
|
|
|
|
|
|
|
|
|
|||||||||||||
The Company’s unrecognized tax benefits as of June 30, 2014 primarily relate to federal research and development tax credits and deductions for qualified domestic production activities taken on the Company’s fiscal 2010 through fiscal 2014 tax returns. The Company’s unrecognized tax benefits as of June 30, 2014, if recognized, would reduce the effective tax rate. The Company does not anticipate any material changes in this position in the next 12 months.
The Internal Revenue Service, or IRS, is currently examining the Company’s federal income tax return for fiscal 2011. The Company does not anticipate any changes to its tax positions as a result of this examination.
11. Commitments and Contingencies:
Government Contracting
The Company is subject to investigations and reviews relating to compliance with various laws and regulations. U.S. government agencies, including the Defense Contract Audit Agency, or DCAA, and the
F-26
Table of Contents
Defense Contract Management Agency, or DCMA, routinely audit and review a contractor’s performance on government contracts; accounting, estimating, and other management internal control systems; indirect rates and pricing practices; and compliance with applicable contracting and procurement laws, regulations and standards, including U.S. Government Cost Accounting Standards.
In November 2013, DCMA issued a report that deemed the Company’s accounting system acceptable. Any future adverse audit findings or failure to obtain an “adequate” determination of the Company’s various accounting, estimating, and other management internal control systems from the responsible U.S. government agency could significantly and adversely affect its business, including its ability to bid on new contracts and its competitive position in the bidding process. The government also may decrement billings until cited deficiencies are corrected and a follow-up review has been performed by DCAA confirming corrective actions are adequate.
The DCAA has not completed audits of the Company’s incurred cost submissions for fiscal 2009 and subsequent fiscal years. The Company has recorded financial results subsequent to fiscal 2008 based upon costs that the Company believes will be approved upon final audit or review. If incurred cost audits result in adverse findings that exceed the Company’s estimates, it may have a material adverse effect on the Company’s financial position, results of operations or cash flows.
Leases
Net rent expense for the periods presented was as follows (in thousands):
| Predecessor | Successor | |||||||||||||||||||
| July 1, 2011 through July 20, 2011 |
July 21, 2011 through June 30, 2012 |
Fiscal Year Ended June 30, 2013 |
Fiscal Year Ended June 30, 2014 |
|||||||||||||||||
| Office space |
$ | 2,227 | $ | 34,539 | $ | 37,424 | $ | 32,203 | ||||||||||||
| Sublease income |
(169 | ) | (3,098 | ) | (4,158 | ) | (4,161 | ) | ||||||||||||
| Furniture and equipment |
65 | 675 | 556 | 504 | ||||||||||||||||
|
|
|
|
|
|
|
|
|
|||||||||||||
| Total |
$ | 2,123 | $ | 32,116 | $ | 33,822 | $ | 28,546 | ||||||||||||
|
|
|
|
|
|
|
|
|
|||||||||||||
The following table summarizes the Company’s future minimum rental commitments under noncancelable operating leases, primarily for office space, as of June 30, 2014 (in thousands):
| Rental Commitments (a) |
Sublease Income |
Net Commitment |
||||||||||
| Fiscal Year Ending June 30, |
||||||||||||
| 2015 |
$ | 28,716 | $ | (293 | ) | $ | 28,423 | |||||
| 2016 |
25,600 | (83 | ) | 25,517 | ||||||||
| 2017 |
20,415 | — | 20,415 | |||||||||
| 2018 |
17,474 | — | 17,474 | |||||||||
| 2019 |
15,192 | — | 15,192 | |||||||||
| Thereafter |
116,388 | — | 116,388 | |||||||||
|
|
|
|
|
|
|
|||||||
| Total future minimum lease payments |
$ | 223,785 | $ | (376 | ) | $ | 223,409 | |||||
|
|
|
|
|
|
|
|||||||
| (a) | Includes approximately $6.9 million, $2.7 million, $1.2 million, $0.7 million, $0.6 million and $3.6 million of future cash payments for fiscal 2015, 2016, 2017, 2018, 2019 and thereafter, respectively, related to the underutilized space that the Company exited during fiscal 2012, 2013 and 2014 (see Note 12). |
The Company leases all of its office facilities. Some of these leases include tenant improvement incentives, rent holidays, or rent escalation clauses. Certain lease commitments are subject to adjustment based on changes in the Consumer Price Index.
F-27
Table of Contents
Litigation
The Company is subject to investigations, audits, and reviews relating to compliance with various laws and regulations with respect to its role as a contractor to agencies and departments of the U.S. government, state, local, and foreign governments, and otherwise in connection with performing services in countries outside of the United States. Such matters can lead to criminal, civil, or administrative proceedings and the Company could be faced with penalties, fines, repayments or compensatory damages and can lead to suspension or debarment from future U.S. government contracting. Adverse findings could also have a material adverse effect on the Company because of its reliance on government contracts. The Company is subject to periodic audits by state, local, and foreign governments for taxes. The Company is also involved in various claims, arbitrations and lawsuits arising in the normal conduct of its business, including but not limited to bid protests, various employment litigation matters, contractual disputes and charges before administrative agencies. Although the Company can give no assurance, based upon its evaluation and taking into account the advice of legal counsel, the Company does not believe that the outcome of any such matter would likely have a material adverse effect on the Company’s consolidated financial position, results of operations, or cash flows.
As previously reported, on April 7, 2011, the Southeastern Pennsylvania Transportation Authority, or SEPTA, filed a lawsuit in the Court of Chancery of Delaware (captioned S.E. Pa. Trans. Auth. v. Volgenau, et. al, Case No. 6354 (Del. Ch.)). On April 29, 2011, SEPTA filed an amended complaint and filed a second amended complaint on June 23, 2011. The second amended complaint alleges, among other things, that the Predecessor Board and Dr. Ernst Volgenau breached various fiduciary duties in connection with the structuring, review and approval of the Transaction. On August 5, 2013, the Delaware Court of Chancery granted defendants’ motions for summary judgment on all counts and issued an implementing order dismissing the lawsuit with prejudice. On October 14, 2013, the plaintiff appealed the decision of the Court of Chancery to the Delaware Supreme Court. On May 13, 2014, Delaware Supreme Court upheld the ruling of the Delaware Chancellor Court issued on August 5, 2013 and dismissed the appeal.
On April 25, 2011, Andrei Sinioukov filed a lawsuit in the U.S. District Court for the Eastern District of Virginia (captioned Sinioukov v. SRA Int’l, Inc., et al, Civil Action No. 1:11-cv-447 (E.D. Va. filed Apr. 25, 2011)). On June 4, 2014, the suit was dismissed with prejudice.
12. Facility Exit Costs:
Periodically the Company initiates activities to consolidate and exit certain underutilized leased facilities as well as sublease excess space. The Company exited underutilized office space in several of its leased facilities and recognized a total facility exit charge of $4.4 million, $3.8 million and $12.8 million during fiscal 2012, 2013 and 2014, respectively, which was included in selling, general and administrative expenses on the consolidated statement of operations. Future lease payments will continue to be made through the end of the lease terms, with the latest expiring in fiscal 2026.
In determining the fair value of the facility exit charge, the Company made estimates related to potential sublease income and future exit costs. If the actual amounts differ from the Company’s estimates, the amount of the facility exit charge could be impacted.
F-28
Table of Contents
The following is a summary of the accrued facility exit charge (in thousands). The current portion is included in accounts payable and accrued expenses and the long-term portion is included in other long-term liabilities in the consolidated balance sheets.
| Balance as of June 30, 2012 |
$ | 3,979 | ||
| Facility exit costs accrued |
3,811 | |||
| Cash payments |
(3,979 | ) | ||
| Non-cash settlement |
(273 | ) | ||
|
|
|
|||
| Balance as of June 30, 2013 |
3,538 | |||
| Facility exit costs accrued |
12,810 | |||
| Cash payments |
(2,202 | ) | ||
| Non-cash settlement |
(780 | ) | ||
|
|
|
|||
| Balance as of June 30, 2014 |
13,366 | |||
| Current portion of facility exit charge liability |
(8,173 | ) | ||
|
|
|
|||
| Long-term facility exit charge liability |
$ | 5,193 | ||
|
|
|
13. Related Party Transactions:
In accordance with the Transaction, Providence provides the Company with ongoing advisory, consulting, and other services for which the Company pays Providence an annual management fee. In addition to the management fee, the Company is responsible for expenses incurred by Providence in connection with its performance of oversight services. The Company incurred $1.8 million, $1.9 million and $1.8 million in management fees and expenses for the period from July 21, 2011 through June 30, 2012, fiscal 2013 and 2014, respectively.
As of June 30, 2012, Providence affiliates owned $11.7 million of the Company’s Term Loan B Facility. During fiscal 2012 and 2013, the Providence affiliates sold all of their interest in the Company’s Term Loan B Facility. Interest payments of approximately $1.0 million and $0.4 million were made for this portion of the Term Loan B Facility during the period from July 21, 2011 through June 30, 2012 and fiscal 2013, respectively.
Kathleen Yoshida, the daughter of Joseph P. Burke, a former executive officer and current chief technology officer of SRA, is employed by SRA as a vice president. For fiscal 2013 and 2014, her salary and other compensation paid by the Company totaled $0.2 million. Ms. Yoshida participates in the Company’s 401(k) plan and is eligible to receive matching contributions in accordance with Company policy, and received an annual equity award in fiscal 2013 in an amount consistent with the fiscal 2013 equity award grants made to similarly situated employees.
From time to time, and in the ordinary course of business the Company purchases goods and services from other Providence portfolio companies. Costs associated with these related party transactions for the period from July 21, 2011 through June 30, 2012, fiscal 2013 and 2014 were $8.2 million, $7.6 million and $5.3 million, respectively.
As of June 30, 2013, there were no amounts due from related parties and $0.1 million due to related parties, which was included in the accompanying consolidated balance sheet. As of June 30, 2014, there were no amounts due from related parties and $0.6 million due to related parties, which was included in the accompanying consolidated balance sheet.
14. Guarantor Financial Statements
Sterling Parent and all of SRA’s subsidiaries fully and unconditionally guarantee the debt of SRA. No separate financial statements of SRA Companies, Inc. are presented herein since SRA Companies, Inc. has no independent assets or operations.
F-29
Table of Contents
15. Unaudited Quarterly Financial Data:
| Fiscal Year Ended June 30, 2013 | 1st Quarter | 2nd Quarter | 3rd Quarter | 4th Quarter | ||||||||||||
| (unaudited, in thousands, except per share data) | ||||||||||||||||
| Revenue |
$ | 389,849 | $ | 376,699 | $ | 376,297 | $ | 364,877 | ||||||||
| Cost of services |
296,981 | 285,421 | 283,154 | 274,458 | ||||||||||||
| Operating income (loss)(a) |
14,190 | 16,336 | 19,476 | (326,731 | ) | |||||||||||
| Net loss |
$ | (7,383 | ) | $ | (5,551 | ) | $ | (1,194 | ) | $ | (303,166 | ) | ||||
| Basic and diluted net loss per share |
$ | (14.36 | ) | $ | (10.80 | ) | $ | (2.32 | ) | $ | (589.82 | ) | ||||
| Fiscal Year Ended June 30, 2014 | 1st Quarter | 2nd Quarter | 3rd Quarter | 4th Quarter | ||||||||||||
| (unaudited, in thousands, except per share data) | ||||||||||||||||
| Revenue |
$ | 349,823 | $ | 333,713 | $ | 355,930 | $ | 346,897 | ||||||||
| Cost of services |
264,137 | 260,050 | 276,319 | 259,901 | ||||||||||||
| Operating income |
20,604 | 13,069 | 9,295 | 20,710 | ||||||||||||
| Net loss |
$ | (3,541 | ) | $ | (8,168 | ) | $ | (9,288 | ) | $ | (3,165 | ) | ||||
| Basic and diluted net loss per share |
$ | (6.89 | ) | $ | (15.89 | ) | $ | (18.07 | ) | $ | (6.16 | ) | ||||
| (a) | In the fourth quarter of fiscal 2013, the Company recorded a $345.8 million impairment charge related to goodwill and trade names. See Note 3 for further discussion. |
16. Subsequent Events:
We have evaluated subsequent events through the date the financial statements were issued.
F-30
Table of Contents
SRA COMPANIES, INC. AND SUBSIDIARIES
CONDENSED CONSOLIDATED BALANCE SHEETS
(in thousands, except share and per share data)
| June 30, 2014 |
March 31, 2015 |
|||||||
| (unaudited) | ||||||||
| ASSETS |
||||||||
| Current assets: |
||||||||
| Cash and cash equivalents |
$ | 108,840 | $ | 143,452 | ||||
| Restricted cash |
1,619 | 681 | ||||||
| Accounts receivable, net |
217,677 | 212,659 | ||||||
| Prepaid expenses and other |
5,643 | 9,794 | ||||||
|
|
|
|
|
|||||
| Total current assets |
333,779 | 366,586 | ||||||
| Property and equipment, net |
18,925 | 17,399 | ||||||
| Goodwill |
783,604 | 783,604 | ||||||
| Trade names |
150,200 | 150,200 | ||||||
| Identified intangibles, net |
253,916 | 210,680 | ||||||
| Other long-term assets |
35,632 | 30,709 | ||||||
|
|
|
|
|
|||||
| Total assets |
$ | 1,576,056 | $ | 1,559,178 | ||||
|
|
|
|
|
|||||
| LIABILITIES AND STOCKHOLDERS’ EQUITY |
||||||||
| Current liabilities: |
||||||||
| Current portion of long-term debt |
$ | 22,000 | $ | — | ||||
| Accounts payable and accrued expenses |
136,626 | 148,845 | ||||||
| Accrued payroll and employee benefits |
83,017 | 76,428 | ||||||
| Billings in excess of revenue recognized |
10,801 | 8,353 | ||||||
| Deferred income taxes |
5,355 | 4,228 | ||||||
|
|
|
|
|
|||||
| Total current liabilities |
257,799 | 237,854 | ||||||
| Long-term debt |
1,047,927 | 1,059,863 | ||||||
| Deferred income taxes |
104,941 | 105,255 | ||||||
| Other long-term liabilities |
24,741 | 20,721 | ||||||
|
|
|
|
|
|||||
| Total liabilities |
1,435,408 | 1,423,693 | ||||||
| Commitments and contingencies |
||||||||
| Stockholders’ equity: |
||||||||
| Preferred stock, par value $0.01 per share; 352,820 shares authorized as of June 30, 2014 and March 31, 2015, none issued and outstanding as of June 30, 2014 and March 31, 2015 |
— | — | ||||||
| Common stock, par value $0.01 per share; 1,147,180 shares authorized, 514,268 shares issued and outstanding as of June 30, 2014; 1,147,180 shares authorized, 516,924 shares issued and outstanding as of March 31, 2015 |
5 | 5 | ||||||
| Additional paid-in capital |
522,914 | 526,287 | ||||||
| Accumulated other comprehensive loss, net of tax |
(11,871 | ) | (7,547 | ) | ||||
| Accumulated deficit |
(370,400 | ) | (383,260 | ) | ||||
|
|
|
|
|
|||||
| Total stockholders’ equity |
140,648 | 135,485 | ||||||
|
|
|
|
|
|||||
| Total liabilities and stockholders’ equity |
$ | 1,576,056 | $ | 1,559,178 | ||||
|
|
|
|
|
|||||
The accompanying notes are an integral part of these condensed consolidated financial statements.
F-31
Table of Contents
SRA COMPANIES, INC. AND SUBSIDIARIES
CONDENSED CONSOLIDATED STATEMENTS OF OPERATIONS (UNAUDITED)
(in thousands, except per share data)
| Three months ended March 31, | Nine months ended March 31, | |||||||||||||||
| 2014 | 2015 | 2014 | 2015 | |||||||||||||
| Revenue |
$ | 355,930 | $ | 349,708 | $ | 1,039,465 | $ | 1,030,341 | ||||||||
| Operating costs and expenses: |
||||||||||||||||
| Cost of services |
276,319 | 266,861 | 800,506 | 786,725 | ||||||||||||
| Selling, general and administrative |
50,004 | 46,364 | 135,751 | 132,646 | ||||||||||||
| Depreciation and amortization of property and equipment |
2,248 | 2,096 | 7,156 | 6,170 | ||||||||||||
| Amortization of intangible assets |
18,064 | 14,351 | 54,647 | 43,473 | ||||||||||||
| Gain on the sale of a portion of the Health & Civil business |
— | — | (1,564 | ) | — | |||||||||||
|
|
|
|
|
|
|
|
|
|||||||||
| Total operating costs and expenses |
346,635 | 329,672 | 996,496 | 969,014 | ||||||||||||
|
|
|
|
|
|
|
|
|
|||||||||
| Operating income |
9,295 | 20,036 | 42,969 | 61,327 | ||||||||||||
| Interest expense |
(25,714 | ) | (26,222 | ) | (78,241 | ) | (80,062 | ) | ||||||||
| Interest income |
9 | 11 | 43 | 34 | ||||||||||||
|
|
|
|
|
|
|
|
|
|||||||||
| Loss before income taxes |
(16,410 | ) | (6,175 | ) | (35,229 | ) | (18,701 | ) | ||||||||
| Benefit from income taxes |
(7,122 | ) | (3,516 | ) | (14,233 | ) | (5,841 | ) | ||||||||
|
|
|
|
|
|
|
|
|
|||||||||
| Net loss |
$ | (9,288 | ) | $ | (2,659 | ) | $ | (20,996 | ) | $ | (12,860 | ) | ||||
|
|
|
|
|
|
|
|
|
|||||||||
| Earnings Per Share: |
||||||||||||||||
| Basic |
$ | (18.07 | ) | $ | (5.14 | ) | $ | (40.85 | ) | $ | (24.92 | ) | ||||
| Dilutive |
$ | (18.07 | ) | $ | (5.14 | ) | $ | (40.85 | ) | $ | (24.92 | ) | ||||
| Shares used to compute earnings per share |
||||||||||||||||
| Basic |
514 | 517 | 514 | 516 | ||||||||||||
| Dilutive |
514 | 517 | 514 | 516 | ||||||||||||
The accompanying notes are an integral part of these condensed consolidated financial statements.
F-32
Table of Contents
SRA COMPANIES, INC. AND SUBSIDIARIES
CONDENSED CONSOLIDATED STATEMENTS OF COMPREHENSIVE LOSS (UNAUDITED)
(in thousands)
| Three months ended March 31, | Nine months ended March 31, | |||||||||||||||
| 2014 | 2015 | 2014 | 2015 | |||||||||||||
| Net loss |
$ | (9,288 | ) | $ | (2,659 | ) | $ | (20,996 | ) | $ | (12,860 | ) | ||||
| Unrealized gain on interest rate swaps, net of tax |
292 | 1,238 | 244 | 4,324 | ||||||||||||
|
|
|
|
|
|
|
|
|
|||||||||
| Comprehensive loss |
$ | (8,996 | ) | $ | (1,421 | ) | $ | (20,752 | ) | $ | (8,536 | ) | ||||
|
|
|
|
|
|
|
|
|
|||||||||
The accompanying notes are an integral part of these condensed consolidated financial statements.
F-33
Table of Contents
SRA COMPANIES, INC. AND SUBSIDIARIES
CONDENSED CONSOLIDATED STATEMENTS OF CASH FLOWS (UNAUDITED)
(in thousands)
| Nine months ended March 31, | ||||||||
| 2014 | 2015 | |||||||
| Cash flows from operating activities: |
||||||||
| Net loss |
$ | (20,996 | ) | $ | (12,860 | ) | ||
| Adjustments to reconcile net loss to net cash provided by operating activities: |
||||||||
| Depreciation and amortization of property and equipment |
8,279 | 6,964 | ||||||
| Amortization of intangible assets |
54,647 | 43,473 | ||||||
| Stock-based compensation |
2,565 | 3,419 | ||||||
| Deferred income taxes |
(14,819 | ) | (3,604 | ) | ||||
| Amortization of original issue discount and debt issuance costs |
5,563 | 5,276 | ||||||
| Gain on the sale of a portion of the Health & Civil business |
(1,564 | ) | — | |||||
| Changes in assets and liabilities, net of the effect of acquisitions and divestitures |
||||||||
| Accounts receivable |
7,458 | 3,450 | ||||||
| Prepaid expenses and other |
3,351 | (4,151 | ) | |||||
| Accounts payable and accrued expenses |
2,046 | 15,019 | ||||||
| Accrued payroll and employee benefits |
(5,758 | ) | (6,589 | ) | ||||
| Billings in excess of revenue recognized |
1,712 | (2,448 | ) | |||||
| Other |
7,790 | 3,622 | ||||||
|
|
|
|
|
|||||
| Net cash provided by operating activities |
50,274 | 51,571 | ||||||
|
|
|
|
|
|||||
| Cash flows from investing activities: |
||||||||
| Capital expenditures |
(6,968 | ) | (6,126 | ) | ||||
| Proceeds from the sale of a portion of the Health & Civil business |
5,492 | — | ||||||
|
|
|
|
|
|||||
| Net cash used in investing activities |
(1,476 | ) | (6,126 | ) | ||||
|
|
|
|
|
|||||
| Cash flows from financing activities: |
||||||||
| Borrowings under revolving credit facility |
100,000 | — | ||||||
| Repayments under revolving credit facility |
(100,000 | ) | — | |||||
| Repayments of Term Loan B Facility |
— | (10,833 | ) | |||||
|
|
|
|
|
|||||
| Net cash used in financing activities |
— | (10,833 | ) | |||||
|
|
|
|
|
|||||
| Net increase in cash and cash equivalents |
48,798 | 34,612 | ||||||
| Cash and cash equivalents, beginning of period |
5,050 | 108,840 | ||||||
|
|
|
|
|
|||||
| Cash and cash equivalents, end of period |
$ | 53,848 | $ | 143,452 | ||||
|
|
|
|
|
|||||
| Supplementary Cash Flow Information |
||||||||
| Cash paid for interest |
83,867 | 62,698 | ||||||
| (Refunds received) cash paid for income taxes |
(1,304 | ) | 1,575 | |||||
The accompanying notes are an integral part of these condensed consolidated financial statements.
F-34
Table of Contents
SRA COMPANIES, INC. AND SUBSIDIARIES
NOTES TO CONDENSED CONSOLIDATED FINANCIAL STATEMENTS (UNAUDITED)
1. Basis of Presentation:
SRA Companies, Inc., a Delaware corporation, or SRA Companies, and its wholly-owned subsidiary, Sterling Parent LLC, or Sterling Parent, were formed by private equity investment funds, or the PEP Funds, sponsored by Providence Equity Partners L.L.C., or Providence, for the sole purpose of acquiring SRA International, Inc. and its subsidiaries, or SRA, a Virginia corporation. SRA was acquired on July 20, 2011, or the Transaction. SRA Companies and Sterling Parent do not have any independent assets or operations.
The accompanying unaudited condensed consolidated financial statements include the accounts of SRA Companies, Inc. and its direct and indirect wholly-owned subsidiaries, or collectively referred to as the Company, and have been prepared in accordance with accounting principles generally accepted in the United States of America, or GAAP. All intercompany transactions and balances have been eliminated. Certain information and note disclosures normally included in the annual financial statements, which are also prepared in accordance with GAAP, have been omitted pursuant to those rules and regulations. The Company believes that the disclosures made are adequate to make the information presented not misleading.
In the opinion of management, the accompanying unaudited condensed consolidated financial statements reflect all adjustments and reclassifications that are necessary for fair presentation of the periods presented. The results for the three and nine months ended March 31, 2015 are not necessarily indicative of the results to be expected for the full fiscal year. These unaudited condensed consolidated financial statements should be read in conjunction with the Company’s audited consolidated financial statements and the notes thereto for the fiscal year ended June 30, 2014.
Nature of Business
SRA is a provider of sophisticated information technology and strategic consulting services and solutions primarily to the U.S. federal government. The Company provides services and solutions that help our government customers address complex IT needs in order to achieve their missions more effectively, increase efficiency of operations, and reduce operating costs. The Company’s portfolio of customers spans a broad variety of federal agencies and is organized around them into two business groups: Health & Civil and National Security.
Operating segments are components of an enterprise for which separate financial information is available that is evaluated regularly by the chief operating decision maker in allocating resources and in assessing performance. Due to the similarities in the types of customers, services and overall economic characteristics of the Company’s two business groups, the Company aggregates all of its operations into one reportable segment.
The Company derives a substantial portion of its revenue from services provided as a prime contractor or subcontractor on engagements with various agencies of the U.S. government. These contracts represented greater than 97% of the Company’s revenue for all periods presented. The Company considers individual agencies that may fall under a larger department as separate customers. No customer accounted for 10% or more of the Company’s revenue for any of the periods presented.
Fair Value Measurements
Fair value is the price that would be received to sell an asset or paid to transfer a liability in the principal or most advantageous market in an orderly transaction between marketplace participants. Various valuation approaches can be used to determine fair value, each requiring different valuation inputs. The following hierarchy classifies the inputs used to determine fair value into three levels:
| • | Level 1—Quoted prices for identical instruments in active markets; |
| • | Level 2—Quoted prices for similar instruments in active markets, quoted prices for identical or similar instruments in markets that are not active, and model-derived valuations in which all significant inputs and significant value drivers are observable in active markets; and |
F-35
Table of Contents
| • | Level 3—Valuations derived from valuation techniques in which one or more significant inputs or significant value drivers are unobservable. |
The Company did not have any significant non-financial assets or liabilities measured at fair value on June 30, 2014 or March 31, 2015. However, the fair value measurement concepts are applied in determining the fair value of goodwill and intangible assets for the purposes of assessing impairment. The valuation models used in the impairment analysis are based in part on estimated future operating results and cash flows. Because these factors are derived from the Company’s estimates and internal market assumptions, they are considered unobservable inputs and the resulting fair value measurements are included in Level 3 of the fair value hierarchy.
The Company’s financial instruments include cash, trade receivables, vendor payables, debt, and derivative financial instruments. As of June 30, 2014 and March 31, 2015, the carrying value of cash, trade receivables and vendor payables approximated their fair value. See Note 5 for a discussion of the fair value of the Company’s debt. See Note 6 for a discussion of the fair value of the Company’s derivative financial instruments.
Divestiture
On July 1, 2013, the Company sold a portion of its Health & Civil business, consisting of six contracts, for approximately $5.5 million. The Company recognized a gain of approximately $1.6 million during the nine months ended March 31, 2014 as a component of continuing operations. As a result of the divestiture, goodwill and intangible assets were reduced by approximately $4.2 million and $1.3 million, respectively.
Income Taxes
The Company’s effective tax rate for the nine months ended March 31, 2014 and 2015 was a tax benefit of 40.4% and 31.2%, respectively. The Company’s year to date fiscal 2014 effective tax rate was higher than the statutory income tax rate primarily due to federal tax credits. The Company’s year to date fiscal 2015 tax rate was lower than the statutory income tax rate as a result of adjusting tax benefits recognized previously in the financial statements and prior year tax returns.
Earnings per Share
The Company computes basic net income (loss) per share by dividing net income (loss) by the weighted-average number of shares of common stock outstanding during the period. Diluted net income (loss) per share gives effect to dilutive potential shares of common stock. In the periods presented, the computation of dilutive earning per share excludes stock options and restricted stock units, whose effect, if included, are antidilutive.
Recent Accounting Pronouncements
In May 2014, the Financial Accounting Standards Board issued Accounting Standard Update, or ASU, 2014-09, Revenue from Contracts with Customers, which requires an entity to recognize the amount of revenue to which it expects to be entitled for the transfer of promised goods or services to customers. This ASU will replace most existing revenue recognition guidance in U.S. GAAP when it becomes effective. This ASU is effective for the Company’s fiscal 2018. Early application is not permitted. This ASU permits the use of either the retrospective or cumulative effect transition method. Management is evaluating the methods of adoption allowed by this ASU and the effect that it is expected to have on the Company’s consolidated financial statements.
In April 2015, the Financial Accounting Standards Board issued ASU 2015-03, Interest—Imputation of Interest, which requires the debt issuance costs related to a recognized debt liability be presented in the balance sheet as a direct deduction from the carrying amount of that debt liability, consistent with the presentation of debt discounts. Adoption of this standard is not expected to have an impact on the Company’s consolidated financial position, results of operations, or cash flows.
F-36
Table of Contents
2. Stock-Based Compensation:
Stock Options
The Board of Directors adopted a stock incentive plan in February 2012, amended in December 2012, or 2012 Plan, that authorizes the issuance of up to 61,262 shares of common stock in the form of options. Under the 2012 Plan, key employees, non-employee directors and consultants of the Company may be granted a combination of service and performance options. The performance options are considered market-based for accounting purposes. The Company utilizes the Black-Scholes-Merton model to value the service options and the Monte Carlo or binomial lattice model to value the performance options.
The service options generally vest in five equal installments subject to the option holder’s continued employment or service with the Company. The performance options vest at the time of a change in control based upon a specified level of cash return to the PEP Funds from its investment in the Company. The service and performance options expire 10 years from the date of grant.
The following table summarizes stock option activity for the nine months ended March 31, 2015:
| Service Options: |
||||
| Shares under option at June 30, 2014 |
26,071 | |||
| Options granted |
1,294 | |||
| Options forfeited or cancelled |
(1,331 | ) | ||
|
|
|
|||
| Shares under option at March 31, 2015 |
26,034 | |||
|
|
|
|||
| Options exercisable at March 31, 2015 |
12,341 | |||
|
|
|
|||
| Performance Options: |
||||
| Shares under option at June 30, 2014 |
25,957 | |||
| Options granted |
1,294 | |||
| Options forfeited or cancelled |
(617 | ) | ||
|
|
|
|||
| Shares under option at March 31, 2015 |
26,634 | |||
|
|
|
Restricted Common Stock
In fiscal 2012, pursuant to the Chief Executive Officer’s, or CEO’s, employment agreement, the CEO was granted 1,000 shares of restricted common stock at $1,000 per share. The restricted shares vest 20% per year on each of the first five anniversaries of the CEO’s date of employment with the Company.
In June 2013, the Board of Directors approved a restricted stock plan, or Restricted Stock Plan. The Board may award shares of restricted stock under the Restricted Stock Plan, at its discretion, to key employees. As of March 31, 2015, the number of authorized shares eligible for grant under the Restricted Stock Plan was 19,340 shares of common stock.
Vesting of restricted stock awarded under the Restricted Stock Plan is subject to the grantee’s continuous employment with the Company from the grant date to the vesting date. Awards vest over various time periods ranging from zero to 36 months. Vested restricted stock issued under the Restricted Stock Plan remains subject to certain sales and transfer restrictions.
The following table summarizes restricted stock activity for the nine months ended March 31, 2015:
| Nonvested restricted shares of SRA Companies at June 30, 2014 |
12,076 | |||
| Restricted shares granted |
1,300 | |||
| Restricted shares vested |
(2,517 | ) | ||
| Restricted shares forfeited |
(395 | ) | ||
|
|
|
|||
| Nonvested restricted shares of SRA Companies at March 31, 2015 |
10,464 | |||
|
|
|
F-37
Table of Contents
Stock Compensation Expense
The Company recognized stock-based compensation expense related to the stock options and restricted stock of $0.4 million and $0.6 million for the three months ended March 31, 2014 and 2015, respectively, and $2.6 million and $3.4 million for the nine months ended March 31, 2014 and 2015, respectively.
3. Accounts Receivable:
Accounts receivable, net as of June 30, 2014 and March 31, 2015 consisted of the following (in thousands):
| June 30, 2014 |
March 31, 2015 |
|||||||
| Billed and billable, net of allowance of $957 and $969 as of June 30, 2014 and March 31, 2015, respectively |
$ | 201,427 | $ | 189,969 | ||||
|
|
|
|
|
|||||
| Unbilled: |
||||||||
| Retainages |
4,031 | 4,517 | ||||||
| Revenue recorded in excess of milestone billings on fixed-price contracts |
12,595 | 11,964 | ||||||
| Revenue recorded in excess of contractual authorization, billable upon receipt of contractual documents |
5,184 | 12,611 | ||||||
| Allowance for unbillable amounts |
(5,560 | ) | (6,402 | ) | ||||
|
|
|
|
|
|||||
| Total unbilled |
16,250 | 22,690 | ||||||
|
|
|
|
|
|||||
| Accounts receivable, net |
$ | 217,677 | $ | 212,659 | ||||
|
|
|
|
|
|||||
The billable receivables included in the billed and billable line item above represent primarily revenue earned in the final month of the reporting period. Consistent with industry practice, certain receivables related to long-term contracts are classified as current, although $2.6 million of retainages are not expected to be billed and collected within one year. The Company’s accounts receivable are primarily from federal government agencies or customers engaged in work for the federal government. The Company believes there is no material credit risk associated with these receivables.
Billings in excess of revenue recognized totaled $10.8 million and $8.4 million at June 30, 2014 and March 31, 2015, respectively. Billings in excess of the revenue recognized are included in current liabilities in the condensed consolidated balance sheets.
During fiscal 2014, the Company entered into an accounts receivable purchase agreement under which the Company sells certain accounts receivable to a third party, or the Factor, without recourse to the Company. The Factor initially pays the Company 90% of the receivable and the remaining price is deferred and based on the amount the Factor receives from the Company’s customer. The structure of the transaction provides for a true sale, on a revolving basis, of the receivables transferred. Accordingly, upon transfer of the receivable to the Factor, the receivable is removed from the Company’s condensed consolidated balance sheet, a loss on the sale is recorded and the deferred price is an account receivable until it is collected. The balance of the sold receivables may not exceed $50 million at any time. During the three and nine months ended March 31, 2014, the Company sold $50.0 million of receivables and recognized a related loss of $0.2 million in selling, general and administrative expenses. During the three and nine months ended March 31, 2015, the Company sold $103.4 million and $292.1 million of receivables, respectively, and recognized a related loss of $0.2 million and $0.7 million in selling, general and administrative expenses for the same periods, respectively. As of March 31, 2015, the balance of the sold receivables was $29.5 million, and the related deferred price was $3.2 million.
F-38
Table of Contents
4. Composition of Certain Financial Statement Captions:
Details of the composition of certain financial statement captions for the periods presented were as follows (in thousands):
| June 30, 2014 |
March 31, 2015 |
|||||||
| Prepaid expenses and other |
||||||||
| Taxes and taxes receivable |
$ | — | $ | 2,393 | ||||
| Maintenance and software |
1,575 | 1,884 | ||||||
| Rent |
237 | 269 | ||||||
| Other |
3,831 | 5,248 | ||||||
|
|
|
|
|
|||||
| Total prepaid expenses and other |
$ | 5,643 | $ | 9,794 | ||||
|
|
|
|
|
|||||
| Property and equipment |
||||||||
| Leasehold improvements |
$ | 22,482 | $ | 23,315 | ||||
| Furniture, equipment and software |
32,185 | 34,657 | ||||||
|
|
|
|
|
|||||
| Total property and equipment |
54,667 | 57,972 | ||||||
| Less: Accumulated depreciation and amortization |
(35,742 | ) | (40,573 | ) | ||||
|
|
|
|
|
|||||
| Total property and equipment, net |
$ | 18,925 | $ | 17,399 | ||||
|
|
|
|
|
|||||
| Identified intangibles |
||||||||
| Acquired intangible assets |
$ | 501,699 | $ | 501,699 | ||||
| Software development costs |
2,930 | 3,167 | ||||||
|
|
|
|
|
|||||
| Total identified intangibles |
504,629 | 504,866 | ||||||
| Less: Accumulated amortization |
(250,713 | ) | (294,186 | ) | ||||
|
|
|
|
|
|||||
| Total identified intangibles, net |
$ | 253,916 | $ | 210,680 | ||||
|
|
|
|
|
|||||
| Other long-term assets |
||||||||
| Debt issuance costs, net |
$ | 31,566 | $ | 27,059 | ||||
| Other |
4,066 | 3,650 | ||||||
|
|
|
|
|
|||||
| Total other long-term assets |
$ | 35,632 | $ | 30,709 | ||||
|
|
|
|
|
|||||
| Accounts payable and accrued expenses |
||||||||
| Vendor obligations |
$ | 86,658 | $ | 88,465 | ||||
| Accrued interest |
23,215 | 35,273 | ||||||
| Interest rate derivative liability |
10,729 | 7,848 | ||||||
| Facility exit charge |
8,173 | 5,405 | ||||||
| Other |
7,851 | 11,854 | ||||||
|
|
|
|
|
|||||
| Total accounts payable and accrued expenses |
$ | 136,626 | $ | 148,845 | ||||
|
|
|
|
|
|||||
| Accrued payroll and employee benefits |
||||||||
| Accrued salaries and incentive compensation |
$ | 35,195 | $ | 37,979 | ||||
| Accrued leave |
33,694 | 30,399 | ||||||
| Other |
14,128 | 8,050 | ||||||
|
|
|
|
|
|||||
| Total accrued payroll and employee benefits |
$ | 83,017 | $ | 76,428 | ||||
|
|
|
|
|
|||||
| Other long-term liabilities |
||||||||
| Interest rate derivative liability |
$ | 8,803 | $ | 4,571 | ||||
| Deferred rent |
9,433 | 11,233 | ||||||
| Facility exit charge |
5,193 | 4,917 | ||||||
| Other |
1,312 | — | ||||||
|
|
|
|
|
|||||
| Total other long-term liabilities |
$ | 24,741 | $ | 20,721 | ||||
|
|
|
|
|
|||||
F-39
Table of Contents
5. Debt:
On July 20, 2011, in connection with the Transaction, SRA (i) entered into senior secured credit facilities, consisting of an $875.0 million Term Loan B Facility and a $100.0 million Revolver, or the Credit Agreement, and (ii) issued $400.0 million aggregate principal amount of 11% Senior Notes. The Term Loan B Facility was issued at a discount of $8.75 million.
At June 30, 2014 and March 31, 2015, debt consisted of the following (in thousands):
| June 30, 2014 |
March 31, 2015 |
|||||||
| Secured Term Loan B Facility |
$ | 675,000 | $ | 664,167 | ||||
| Less: Unamortized discount |
(5,073 | ) | (4,304 | ) | ||||
|
|
|
|
|
|||||
| Secured Term Loan B Facility, net |
669,927 | 659,863 | ||||||
| Senior Notes due 2019 at 11% |
400,000 | 400,000 | ||||||
|
|
|
|
|
|||||
| Total debt |
1,069,927 | 1,059,863 | ||||||
| Current portion of long-term debt |
(22,000 | ) | — | |||||
|
|
|
|
|
|||||
| Long-term debt |
$ | 1,047,927 | $ | 1,059,863 | ||||
|
|
|
|
|
|||||
As of March 31, 2015, the estimated fair value of SRA’s outstanding debt was approximately $1,092.3 million. The estimated fair value of this outstanding debt was determined based on quoted prices for similar instruments in active markets (Level 2 inputs).
The Credit Agreement and the indenture governing the Senior Notes issued in connection with the Transaction limit the SRA’s ability to incur certain additional indebtedness, pay dividends or make other distributions or repurchase capital stock, make certain investments, enter into certain types of transactions with affiliates, use assets as security in other transactions, and sell certain assets.
SRA is required to meet a net senior secured leverage ratio, or NSSLR, covenant quarterly if any revolving loan, swing-line loan or letter of credit is outstanding on the last day of the quarter. SRA had no outstanding debt, letters of credit or borrowings on its Revolver as of June 30, 2014 and March 31, 2015. If SRA had any borrowings on its Revolver, it would have been required to maintain a NSSLR of less than or equal to 4.5x as of March 31, 2015. The ratio is calculated as the consolidated net secured indebtedness as of the last day of the quarter (defined as the consolidated net debt secured by any lien minus any cash and permitted investments) to the preceding four quarters’ consolidated EBITDA, excluding the impact of acquisition made subsequent to the reporting period (as defined in the Credit Agreement). See Note 11 for the discussion of the acquisition. SRA’s NSSLR was 3.2x as of June 30, 2014 and 2.9x as of March 31, 2015. As of March 31, 2015, SRA was in compliance with all of its covenants.
Senior Secured Credit Facilities
Borrowings under the senior secured credit facilities bear interest at a rate equal to an applicable margin plus the London Interbank Offered Rate, or LIBOR, with a 1.25% floor, or, at SRA’s option, an applicable margin plus an alternative base rate determined by reference to the higher of the prime rate or the federal funds rate plus 0.5%, with a 2.25% floor. In addition to paying interest on outstanding principal under the senior secured credit facilities, SRA pays a per annum commitment fee on undrawn amounts under the revolving credit facility and customary administrative fees. The senior secured credit facilities are guaranteed by Sterling Parent and substantially all wholly-owned domestic subsidiaries of SRA. The Term Loan B Facility matures in July 2018 and the Revolver matures in July 2016.
In addition, the senior secured credit facilities require SRA to prepay outstanding term loans, subject to certain exceptions, in the case of excess cash flow, or ECF, and in the event of certain asset sales, condemnation
F-40
Table of Contents
events and issuances of debt. SRA is required to make annual payments equal to 50% of ECF based upon achievement of a net senior secured leverage ratio, or NSSLR, between 2.75x and 3.5x. The required annual payments adjust to 75% of ECF when NSSLR is greater than 3.5x, 25% of ECF when NSSLR is between 2x and 2.75x, and zero if NSSLR is less than 2x. Any required ECF payments are due in October each year, subject to acceptance by the lenders. SRA repaid $140.0 million of its Term Loan B Facility in fiscal 2012, which satisfied all of SRA’s required quarterly principal payments and required ECF principal payments for fiscal 2012. SRA repaid $20.0 million of its Term Loan B Facility in fiscal 2013, which satisfied SRA’s required ECF principal payments for fiscal 2013. SRA’s fiscal 2014 ECF requirement was $61.5 million, of which SRA repaid $40.0 million during fiscal 2014. The remainder was tendered as payment in October 2014, of which $10.6 million was declined by the lenders and returned to SRA, as permitted by the facility.
The $8.75 million Term Loan B Facility original issue discount is being amortized to interest expense using the effective interest method and added to the recorded debt amount over the seven-year term of the loan. During the three months ended March 31, 2014 and 2015 and the nine months ended March 31, 2014 and 2015, $0.3 million, $0.2 million, $0.9 million and $0.8 million of the original issue discount were amortized and reflected in interest expense in the condensed consolidated statements of operations, respectively.
Costs incurred in connection with the issuance of the debt are amortized using the effective interest method over the life of the related debt and accelerated to the extent that any repayment is made. During the three months ended March 31, 2014 and 2015 and the nine months ended March 31, 2014 and 2015, $1.5 million, $1.4 million, $4.7 million and $4.5 million of costs were amortized and reflected in interest expense in the condensed consolidated statements of operations, respectively.
As of March 31, 2015, interest accrued at a rate of 6.5% for the senior secured credit facilities. Interest payments of $11.6 million and $3.8 million were made in the three months ended March 31, 2014 and 2015, respectively, including $0.2 million and $0.2 million of commitment fees for the same periods. Interest payments of $36.4 million and $34.0 million were made in the nine months ended March 31, 2014 and 2015, respectively, including $0.6 million and $0.5 million of commitment fees for the same periods.
Senior Notes due 2019
The Senior Notes due 2019 are guaranteed by SRA’s wholly-owned domestic subsidiaries. Interest on the Senior Notes is payable semi-annually. The Senior Notes are redeemable in whole or in part, at the option of SRA, at varying redemption prices that generally include premiums.
As of March 31, 2015, interest accrued at 11.0% for the Senior Notes. SRA paid $22.0 million and $44.0 million of interest related to the Senior Notes in the three and nine months ended March 31, 2014. SRA paid zero and $22.0 million of interest related to the Senior Notes in the three and nine months ended March 31, 2015.
6. Derivative Instruments and Hedging Activities:
Hedge of Interest Rate Risk
Risk Management Objective of Using Derivatives
The Company utilizes derivative financial instruments to manage interest rate risk related to its Term Loan B Facility.
Cash Flow Hedges of Interest Rate Risk
The Company’s objectives in using interest rate derivatives are to add stability to interest expense and to manage its exposure to interest rate movements. To accomplish this objective, the Company uses interest rate swaps as part of its interest rate risk management strategy. Such derivatives were used to hedge the variable cash
F-41
Table of Contents
flows associated with existing variable-rate debt. As of June 30, 2014 and March 31, 2015, the Company had outstanding interest rate derivatives with a combined notional value of $565.0 million and $500.0 million, respectively, which were designated as cash flow hedges of interest rate risk. The interest rate swap derivatives decrease over time to a notional value of $475.0 million upon maturity in July 2016.
The effective portion of changes in the fair value of derivatives designated and that qualify as cash flow hedges is recorded in Accumulated Other Comprehensive Income, or AOCI, net of taxes, and is subsequently reclassified into earnings in the period that the hedged forecasted transaction affects earnings. The ineffective portion of the change in fair value of the derivatives is recognized directly in earnings. Amounts reported in AOCI related to derivatives will be reclassified to interest expense as interest payments are made on the Company’s variable-rate debt. During the next twelve months, the Company estimates that approximately $6.3 million will be reclassified from AOCI into earnings.
Fair Values of Derivative Instruments on the Condensed Consolidated Balance Sheets
The fair value of the Company’s derivative financial instruments, determined using Level 2 inputs (see Note 1), was $19.5 million and $12.4 million as of June 30, 2014 and March 31, 2015, respectively. The current portion is included in the accounts payable and accrued expenses and the long-term portion is included in other long-term liabilities in the condensed consolidated balance sheets.
The Company utilizes a third-party pricing service to assist with determining the fair values for its interest rate swaps. The Company performs procedures to corroborate the values provided by the pricing service including regular discussions to understand the pricing service’s methodology and a review of the service provider’s Statement on Standards for Attestation Engagements No. 16, or SSAE 16, report.
The Effect of Derivative Instruments on the Condensed Consolidated Statements of Operations & Condensed Consolidated Statements of Comprehensive Loss
All amounts recorded in other comprehensive loss are related to the Company’s derivatives. The following table represents a rollforward of amounts recognized in accumulated other comprehensive loss, including the reclassifications out of the accumulated other comprehensive loss to the condensed consolidated statements of operations (in thousands):
| Three months ended March 31, |
Nine months ended March 31, |
|||||||||||||||
| 2014 | 2015 | 2014 | 2015 | |||||||||||||
| Beginning of period |
$ | (12,231 | ) | $ | (8,785 | ) | $ | (12,183 | ) | $ | (11,871 | ) | ||||
| Other comprehensive loss before reclassifications |
||||||||||||||||
| Total before tax |
(635 | ) | (619 | ) | (3,047 | ) | (1,108 | ) | ||||||||
| Tax effect |
249 | 243 | 1,195 | 435 | ||||||||||||
|
|
|
|
|
|
|
|
|
|||||||||
| Net of tax |
(386 | ) | (376 | ) | (1,852 | ) | (673 | ) | ||||||||
| Amounts reclassified from accumulated other comprehensive loss |
||||||||||||||||
| Total before tax |
1,116 | 2,656 | 3,449 | 8,222 | ||||||||||||
| Tax effect |
(438 | ) | (1,042 | ) | (1,353 | ) | (3,225 | ) | ||||||||
|
|
|
|
|
|
|
|
|
|||||||||
| Net of tax |
678 | 1,614 | 2,096 | 4,997 | ||||||||||||
|
|
|
|
|
|
|
|
|
|||||||||
| Net other comprehensive income |
292 | 1,238 | 244 | 4,324 | ||||||||||||
|
|
|
|
|
|
|
|
|
|||||||||
| End of period |
$ | (11,939 | ) | $ | (7,547 | ) | $ | (11,939 | ) | $ | (7,547 | ) | ||||
|
|
|
|
|
|
|
|
|
|||||||||
F-42
Table of Contents
Credit Risk-Related Contingent Features
The Company has agreements with each of its interest rate swap counterparties that contain a provision providing that the Company could be declared in default on its derivative obligations if repayment of the underlying indebtedness is accelerated by the lender due to the Company’s default on the indebtedness.
If the Company had breached any of the provisions of the agreements at March 31, 2015, it could have been required to settle its obligations under the agreements at an estimated termination value. As of March 31, 2015, the termination value of the interest rate swaps in a net liability position, which includes accrued interest but excludes any adjustment for nonperformance risk related to these agreements, was $15.5 million. As of March 31, 2015, the Company was not in breach of any of the provisions nor posted any collateral related to these agreements.
7. Commitments and Contingencies:
Government Contracting
The Company is subject to investigations and reviews relating to compliance with various laws and regulations. U.S. government agencies, including the Defense Contract Audit Agency, or DCAA, and the Defense Contract Management Agency, or DCMA, routinely audit and review a contractor’s performance on government contracts; accounting, estimating, and other management internal control systems; indirect rates and pricing practices; and compliance with applicable contracting and procurement laws, regulations and standards, including U.S. Government Cost Accounting Standards.
In November 2013, DCMA issued a report that deemed the Company’s accounting system acceptable. Any future adverse audit findings or failure to obtain an “adequate” determination of the Company’s various accounting, estimating, and other management internal control systems from the responsible U.S. government agency could significantly and adversely affect its business, including its ability to bid on new contracts and its competitive position in the bidding process. The government may also decrement billings until cited deficiencies are corrected and a follow-up review has been performed by DCAA confirming corrective actions are adequate.
The DCAA has not completed audits of the Company’s incurred cost submissions for fiscal 2009 and subsequent fiscal years. The Company has recorded financial results subsequent to fiscal 2008 based upon costs that the Company believes will be approved upon final audit or review. If incurred cost audits result in adverse findings that exceed the Company’s estimates, it may have a material adverse effect on the Company’s consolidated financial position, results of operations or cash flows.
Litigation
The Company is subject to investigations, audits, and reviews relating to compliance with various laws and regulations with respect to its role as a contractor to agencies and departments of the U.S. Government, state, local, and foreign governments, and otherwise in connection with performing services in countries outside of the United States. Such matters can lead to criminal, civil or administrative proceedings and the Company could be faced with penalties, fines, repayments or compensatory damages and can lead to suspension or debarment from future U.S. government contracting. Adverse findings could also have a material adverse effect on the Company because of its reliance on government contracts. The Company is subject to periodic audits by state, local, and foreign governments for taxes. The Company is also involved in various claims, arbitrations and lawsuits arising in the normal conduct of its business, including but not limited to bid protests, various employment litigation matters, contractual disputes and charges before administrative agencies. Although the Company can give no assurance, based upon its evaluation and taking into account the advice of legal counsel, the Company does not believe that the outcome of any such matter would likely have a material adverse effect on the Company’s consolidated financial position, results of operations, or cash flows.
F-43
Table of Contents
8. Facility Exit Costs:
Periodically the Company initiates activities to consolidate and exit certain underutilized leased facilities as well as sublease excess space. The Company exited underutilized office space in several of its leased facilities and recognized total facility exit charges of $8.1 million and $8.6 million during the three and nine months ended March 31, 2014, respectively. During the three months ended March 31, 2015, the Company recognized facility exit charges of $3.9 million, including $0.9 million related to less favorable sublease assumptions. During the nine months ended March 31, 2015, the Company recognized facility exit charges of $4.8 million, offset by a reduction in the facility exit charge of $1.5 million due to negotiating more favorable sublease terms than were previously estimated. Future lease payments will continue to be made through the end of the lease terms, with the latest expiring in fiscal 2026.
In determining the fair value of the facility exit charges, the Company made estimates related to potential sublease income and future exit costs. If the actual amounts differ from the Company’s estimates, the amount of the facility exit charges could be impacted.
The following is a summary of the accrued facility exit charge (in thousands). The current portion is included in accounts payable and accrued expenses and the long-term portion is included in other long-term liabilities in the condensed consolidated balance sheets.
| Balance as of June 30, 2014 |
$ | 13,366 | ||
| Facility exit costs accrued, net |
3,304 | |||
| Cash payments |
(5,931 | ) | ||
| Other |
(417 | ) | ||
|
|
|
|||
| Balance as of March 31, 2015 |
10,322 | |||
| Current portion of facility exit charge liability |
(5,405 | ) | ||
|
|
|
|||
| Long-term facility exit charge liability |
$ | 4,917 | ||
|
|
|
9. Related Party Transactions:
In accordance with the Transaction, Providence provides the Company with ongoing advisory, consulting, and other services for which the Company pays Providence an annual management fee under the financial advisory agreement. In addition to the management fee, the Company is responsible for expenses incurred by Providence in connection with its performance of oversight services. The Company incurred $0.4 million and $0.5 million in management fees and expenses for the three months ended March 31, 2014 and 2015, respectively, and $1.3 million and $1.4 million for the nine months ended March 31, 2014 and 2015, respectively.
From time to time, and in the ordinary course of business, the Company purchases goods and services from other Providence portfolio companies. Costs associated with these related party transactions for the three months ended March 31, 2014 and 2015 were $2.4 million and $4.0 million, respectively, and $4.7 million and $7.6 million for the nine months ended March 31, 2014 and 2015, respectively.
As of June 30, 2014, there were no amounts due from related parties and $0.6 million due to related parties, which was included in accounts payable and accrued expenses in the accompanying condensed consolidated balance sheet. As of March 31, 2015, there were no amounts due from related parties and $0.2 million due to related parties, which was included in accounts payable and accrued expenses in the accompanying condensed consolidated balance sheet.
10. Guarantor Financial Statements:
Sterling Parent and all of SRA’s subsidiaries fully and unconditionally guarantee the debt of SRA. No separate financial statements of SRA Companies, Inc. are presented herein, since SRA Companies, Inc. has no independent assets or operations.
F-44
Table of Contents
11. Subsequent Events:
On April 15, 2015, the Company completed an asset purchase of substantially all of the Government Services business from Qbase LLC for $72.0 million. The acquired Qbase Government Services business delivers IT support solutions and professional services to help enable the U.S. government’s missions focused on health, IT, homeland security and law enforcement. The acquisition was financed with cash on hand. The asset purchase agreement contains customary representations and warranties and requires Qbase and certain controlling stockholders to indemnify the Company for certain contingent liabilities for which an escrow fund of $5.4 million was established. The Company expects to complete the purchase price allocation in the fourth quarter of fiscal 2015.
F-45
Table of Contents
Shares
SRA Companies, Inc.
Common Stock
PROSPECTUS
| BofA Merrill Lynch |
Citigroup |
Through and including , 2015 (25 days after the date of this prospectus), all dealers that buy, sell or trade our common stock, whether or not participating in this offering, may be required to deliver a prospectus. This delivery requirement is in addition to the obligation of dealers to deliver a prospectus when acting as underwriters and with respect to their unsold allotments or subscriptions.
, 2015
Table of Contents
PART II
INFORMATION NOT REQUIRED IN PROSPECTUS
| Item 13. | Other Expenses of Issuance and Distribution. |
The following table sets forth the estimated expenses payable by us in connection with the sale and distribution of the securities registered hereby, other than underwriting discounts or commissions. All amounts are estimates except for the SEC registration fee and the Financial Industry Regulatory Authority filing fee.
| SEC Registration Fee |
$ | 11,620 | ||
| FINRA Filing Fee |
$ | 15,500 | ||
| Stock Exchange Listing Fee |
* | |||
| Printing Fees and Expenses |
* | |||
| Accounting Fees and Expenses |
* | |||
| Legal Fees and Expenses |
* | |||
| Blue Sky Fees and Expenses |
* | |||
| Transfer Agent Fees and Expenses |
* | |||
| Miscellaneous |
* | |||
|
|
|
|||
| Total: |
$ | * | ||
|
|
|
| * | To be filed by amendment. |
| Item 14. | Indemnification of Directors and Officers. |
SRA Companies, Inc. is incorporated under the laws of the State of Delaware.
Section 145(a) of the DGCL provides that a corporation may indemnify any person who was or is a party or is threatened to be made a party to any threatened, pending or completed action, suit or proceeding, whether civil, criminal, administrative or investigative (other than an action by or in the right of the corporation) by reason of the fact that the person is or was a director, officer, employee or agent of the corporation, or is or was serving at the request of the corporation as a director, officer, employee or agent of another corporation, partnership, joint venture, trust or other enterprise, against expenses (including attorneys’ fees), judgments, fines and amounts paid in settlement actually and reasonably incurred by the person in connection with such action, suit or proceeding if the person acted in good faith and in a manner the person reasonably believed to be in or not opposed to the best interests of the corporation, and, with respect to any criminal action or proceeding, had no reasonable cause to believe the person’s conduct was unlawful.
Section 145(b) of the DGCL provides that a corporation may indemnify any person who was or is a party or is threatened to be made a party to any threatened, pending or completed action or suit by or in the right of the corporation to procure a judgment in its favor by reason of the fact that the person is or was a director, officer, employee or agent of the corporation, or is or was serving at the request of the corporation as a director, officer, employee or agent of another corporation, partnership, joint venture, trust or other enterprise, against expenses (including attorneys’ fees) actually and reasonably incurred by the person in connection with the defense or settlement of such action or suit if the person acted in good faith and in a manner the person reasonably believed to be in or not opposed to the best interests of the corporation and except that no indemnification shall be made in respect of any claim, issue or matter as to which such person shall have been adjudged to be liable to the corporation unless and only to the extent that the Delaware Court of Chancery or the court in which such action or suit was brought shall determine upon application that, despite the adjudication of liability but in view of all of the circumstances of the case, such person is fairly and reasonably entitled to indemnity for such expenses which the Delaware Court of Chancery or such other court shall deem proper.
Section 145(c) of the DGCL provides that to the extent that a present or former director or officer of a corporation has been successful on the merits or otherwise in defense of any action, suit or proceeding referred to
II-1
Table of Contents
in subsections (a) and (b) of Section 145 of the DGCL, or in defense of any claim, issue or matter therein, such person shall be indemnified against expenses (including attorneys’ fees) actually and reasonably incurred by such person in connection therewith.
Section 145(e) of the DGCL provides that expenses (including attorneys’ fees) incurred by an officer or director of the corporation in defending any civil, criminal, administrative or investigative action, suit or proceeding may be paid by the corporation in advance of the final disposition of such action, suit or proceeding upon receipt of an undertaking by or on behalf of such director or officer to repay such amount if it shall ultimately be determined that such person is not entitled to be indemnified by the corporation as authorized in Section 145 of the DGCL. Such expenses, including attorneys’ fees, incurred by former directors and officers or other employees and agents of the corporation or by persons serving at the request of the corporation as directors, officers, employees or agents of another corporation, partnership, joint venture, trust or other enterprise may be so paid upon such terms and conditions, if any, as the corporation deems appropriate.
Section 145(g) of the DGCL specifically allows a Delaware corporation to purchase liability insurance on behalf of its directors and officers and to insure against potential liability of such directors and officers regardless of whether the corporation would have the power to indemnify such directors and officers under Section 145 of the DGCL.
Section 102(b)(7) of the DGCL permits a Delaware corporation to include a provision in its certificate of incorporation eliminating or limiting the personal liability of directors to the corporation or its stockholders for monetary damages for breach of fiduciary duty as a director. This provision, however, may not eliminate or limit a director’s liability (1) for breach of the director’s duty of loyalty to the corporation or its stockholders, (2) for acts or omissions not in good faith or involving intentional misconduct or a knowing violation of law, (3) under Section 174 of the DGCL, which provides for liability of directors for unlawful payments of dividends or unlawful stock purchases or redemptions, or (4) for any transaction from which the director derived an improper personal benefit.
Our Second Amended and Restated Certificate of Incorporation will contain provisions permitted under the DGCL relating to the liability of directors. These provisions will eliminate a director’s personal liability for monetary damages resulting from a breach of fiduciary duty, except in circumstances involving:
| • | any breach of the director’s duty of loyalty; |
| • | acts or omissions not in good faith or which involve intentional misconduct or a knowing violation of the law; |
| • | under Section 174 of the DGCL (unlawful dividends); or |
| • | any transaction from which the director derives an improper personal benefit. |
Our Second Amended and Restated Certificate of Incorporation and our Second Amended and Restated By-Laws will require us to indemnify and advance expenses to our directors and officers to the fullest extent not prohibited by the DGCL and other applicable law, except in the case of a proceeding instituted by the director without the approval of our board of directors. Our Second Amended and Restated Certificate of Incorporation and our Second Amended and Restated By-laws will provide that we are required to indemnify our directors and officers, to the fullest extent permitted by law, for all judgments, fines, settlements, legal fees and other expenses incurred in connection with pending or threatened legal proceedings because of the director’s or officer’s positions with us or another entity that the director or officer serves at our request, subject to various conditions, and to advance funds to our directors and officers to enable them to defend against such proceedings. To receive indemnification, the director or officer must have been successful in the legal proceeding or have acted in good faith and in what was reasonably believed to be a lawful manner in our best interest and, with respect to any criminal proceeding, had no reasonable cause to believe his or her conduct was unlawful.
II-2
Table of Contents
Indemnification Agreements
The financial advisory agreement described above under “Certain Relationships and Related Party Transactions—Financial Advisory Agreement” includes an indemnification provision pursuant to which the Company and SRA International, Inc., subject to certain limitations, agreed to indemnify Providence and its officers, employees, agents, representatives, members and affiliates, from and against any and all costs, expenses, liabilities claims, damages and losses relating to or arising out of the engagement of Providence pursuant to the financial advisory agreement, or the performance by Providence of the services pursuant thereto.
Our executive employment agreement with Dr. Ballhaus includes an indemnification provision. This agreement provides Dr. Ballhaus with contractual rights to the indemnification and expense advancement rights provided under our amended and restated by-laws, policies and agreements, and under the by-laws, policies and agreements of SRA International, Inc., on the same terms as indemnification is generally provided to our officers and directors and the officers and directors of SRA International, Inc.
Our amended and restated certificate of incorporation and our amended and restated by-laws will require us to indemnify and advance expenses to our directors and officers to the fullest extent not prohibited by the DGCL and other applicable law, except in the case of a proceeding instituted by a director without the approval of our board of directors. See “Description of Capital Stock—Limitations on Liability and Indemnification.”
Directors’ and Officers’ Liability Insurance
Prior to the completion of this offering, we will have obtained directors’ and officers’ liability insurance which insures against certain liabilities that our directors and officers and the directors and officers of our subsidiaries may, in such capacities, incur.
| Item 15. | Recent Sales of Unregistered Securities. |
None.
| Item 16. | Exhibits and Financial Statement Schedules. |
(a) Exhibits
The Exhibits to this Registration Statement on Form S-1 are listed in the Exhibit Index which follows the signature pages to this Registration Statement and is herein incorporated by reference.
(b) Financial Statement Schedules:
None.
| Item 17. | Undertakings. |
(a) The undersigned registrant hereby undertakes to provide to the underwriters at the closing specified in the underwriting agreements certificates in such denominations and registered in such names as required by the underwriters to permit prompt delivery to each purchaser.
(b) Insofar as indemnification for liabilities arising under the Securities Act of 1933 may be permitted to directors, officers and controlling persons of the registrant pursuant to the foregoing provisions, or otherwise, the registrant has been advised that in the opinion of the Securities and Exchange Commission such indemnification is against public policy as expressed in the Act and is, therefore, unenforceable. In the event that a claim for
II-3
Table of Contents
indemnification against such liabilities (other than the payment by the registrant of expenses incurred or paid by a director, officer or controlling person of the registrant in the successful defense of any action, suit or proceeding) is asserted by such director, officer or controlling person in connection with the securities being registered, the registrant will, unless in the opinion of its counsel the matter has been settled by controlling precedent, submit to a court of appropriate jurisdiction the question whether such indemnification by it is against public policy as expressed in the Act and will be governed by the final adjudication of such issue.
(c) The undersigned registrant hereby undertakes that:
(1) For purposes of determining any liability under the Securities Act of 1933, the information omitted from the form of prospectus filed as part of this registration statement in reliance upon Rule 430A and contained in a form of prospectus filed by the registrant pursuant to Rule 424(b)(1) or (4) or 497(h) under the Securities Act shall be deemed to be part of this registration statement as of the time it was declared effective.
(2) For the purpose of determining any liability under the Securities Act of 1933, each post-effective amendment that contains a form of prospectus shall be deemed to be a new registration statement relating to the securities offered therein, and the offering of such securities at that time shall be deemed to be the initial bona fide offering thereof.
II-4
Table of Contents
SIGNATURES
Pursuant to the requirements of the Securities Act of 1933, SRA Companies, Inc. has duly caused this registration statement to be signed on its behalf by the undersigned, thereunto duly authorized, in the City of Fairfax, State of Virginia, on July 7, 2015.
| SRA COMPANIES, INC. | ||
| By: | /s/ Ernst Volgenau | |
| Name: Ernst Volgenau | ||
| Title: Chairman of the Board | ||
POWER OF ATTORNEY
KNOW ALL MEN BY THESE PRESENTS, that each person whose signature appears below constitutes and appoints William L. Ballhaus, David Keffer, and Anne M. Donohue, and each of them, his or her true and lawful attorney-in-fact and agent, acting alone, with full power of substitution and resubstitution, for him or her and in his or her name, place and stead, in any and all capacities, to sign any or all amendments to this Registration Statement, including post-effective amendments and registration statements filed pursuant to Rule 462(b) and otherwise, and to file the same, with all exhibits thereto, and other documents in connection therewith, with the U.S. Securities and Exchange Commission, granting unto said attorney-in-fact full power and authority to do and perform each and every act and thing requisite or necessary to be done in and about the premises, as such person, hereby ratifying and confirming all that said attorney-in-fact and agent, or his or her substitute or substitutes, may lawfully do or cause to be done by virtue hereof.
Pursuant to the requirements of the Securities Act of 1933, this registration statement has been signed on July 7, 2015 by the following persons in the capacities indicated.
| Signature | Title | |
| /s/ Ernst Volgenau Ernst Volgenau |
Director, Chairman of the Board | |
| /s/ William L. Ballhaus William L. Ballhaus |
President, Chief Executive Officer and Director (Principal Executive Officer) | |
| /s/ David F. Keffer David F. Keffer |
Executive Vice President, Chief Financial Officer (Principal Financial Officer) | |
|
/s/ Theresa D. Golinvaux Theresa D. Golinvaux |
Vice President, Corporate Controller (Principal Accounting Officer)
| |
| /s/ Charles E. Gottdiener Charles E. Gottdiener |
Director | |
| /s/ Christopher C. Ragona Christopher C. Ragona |
Director | |
II-5
Table of Contents
EXHIBIT INDEX
Note Regarding Reliance on Statements in Our Contracts: In reviewing the agreements included as exhibits to this Registration Statement on Form S-1, please remember that they are included to provide you with information regarding their terms and are not intended to provide any other factual or disclosure information about SRA Companies, Inc., its subsidiaries or affiliates, or the other parties to the agreements. The agreements contain representations and warranties by each of the parties to the applicable agreement. These representations and warranties have been made solely for the benefit of the other parties to the applicable agreement and (i) should not in all instances be treated as categorical statements of fact, but rather as a way of allocating the risk to one of the parties if those statements prove to be inaccurate; (ii) have been qualified by disclosures that were made to the other party in connection with the negotiation of the applicable agreement, which disclosures are not necessarily reflected in the agreement; (iii) may apply standards of materiality in a way that is different from what may be viewed as material to investors; and (iv) were made only as of the date of the applicable agreement or such other date or dates as may be specified in the agreement and are subject to more recent developments. Accordingly, these representations and warranties may not describe the actual state of affairs as of the date they were made or at any other time. Additional information about SRA Companies, Inc., its subsidiaries and affiliates may be found elsewhere in this Registration Statement on Form S-1.
| Exhibit |
Description | |
| 1.1** | Form of Underwriting Agreement. | |
| 2.1 | Agreement and Plan of Merger, dated as of March 31, 2011, by and among SRA International, Inc., Sterling Parent LLC, and Sterling Merger Inc. (incorporated by reference to SRA International, Inc.’s Current Report on Form 8-K filed with the SEC on April 5, 2011). | |
| 3.1** | Certificate of Amendment to Certificate of Incorporation of SRA Companies, Inc. | |
| 3.2** | Form of Second Amended and Restated Certificate of Incorporation of SRA Companies, Inc. | |
| 3.3** | Form of Second Amended and Restated By-Laws of SRA Companies, Inc. | |
| 4.1 | Indenture, dated July 20, 2011, by and between Sterling Merger Inc. and Wilmington Trust, National Association (incorporated by reference to SRA International, Inc.’s Current Report on Form 8-K filed on July 26, 2011). | |
| 4.2 | Supplemental Indenture, dated July 20, 2011, by and among SRA International, Inc., the Subsidiary Guarantors named therein and Wilmington Trust, National Association (incorporated by reference to SRA International, Inc.’s Current Report on Form 8-K filed on July 26, 2011). | |
| 4.3 | Second Supplemental Indenture, dated February 3, 2012, by and among SRA International, Inc. and Wilmington Trust, National Association (incorporated by reference to SRA International, Inc.’s Registration Statement on Form S-4 filed on March 30, 2012). | |
| 4.4 | Form of SRA International, Inc.’s 11% Senior Notes due 2019 (included in the Indenture filed as Exhibit 4.1) (incorporated by reference to SRA International, Inc.’s Current Report on Form 8-K filed on July 26, 2011). | |
| 4.5** | Form of Common Stock Certificate. | |
| 5.1** | Opinion of Debevoise & Plimpton LLP. | |
| 10.1# | Form of Senior Executive Retention Agreement (incorporated by reference to SRA International, Inc.’s Current Report on Form 8-K filed with the SEC on March 29, 2011). | |
| 10.2 | Credit Agreement, dated July 20, 2011, by and among Sterling Merger Inc., Sterling Parent LLC, Citibank, N.A., as administrative agent, and several lenders from time to time party thereto (incorporated by reference to SRA International, Inc.’s Current Report on Form 8-K filed on July 26, 2011). | |
II-6
Table of Contents
| Exhibit |
Description | |
| 10.3# | Employment Agreement, dated July 20, 2011, by and among SRA Companies, Inc. (f/k/a Sterling Holdco Inc.) and William L. Ballhaus (incorporated by reference to SRA International, Inc.’s Registration Statement on Form S-4 filed on March 30, 2012). | |
| 10.4# | Amendment No. 1 to the employment agreement dated July 20, 2011, by and among SRA Companies, Inc. (f/k/a Sterling Holdco Inc.) and William L. Ballhaus (incorporated by reference to SRA International, Inc.’s Current Report on Form 8-K filed on September 27, 2013). | |
| 10.5 | Credit Agreement Assumption Agreement and Affirmation of Guarantees and Security Interests, dated February 1, 2012, and effective as of February 3, 2012, by and among SRA International, Inc. (Delaware), Systems Research and Applications Corporation (Virginia), and consented to be the other loan parties and Citibank, N.A., as Administrative Agent (incorporated by reference to SRA International, Inc.’s Registration Statement on Form S-4 filed on March 30, 2012). | |
| 10.6 | Master Guarantee Agreement, dated July 20, 2011, by and among Sterling Parent LLC, SRA International, Inc., certain Subsidiaries named therein and Citibank, N.A., as administrative agent (incorporated by reference to SRA International, Inc.’s Current Report on Form 8-K filed on July 26, 2011). | |
| 10.7 | Collateral Agreement, dated July 20, 2011, by and among Sterling Parent LLC, Sterling Merger Inc., SRA International, Inc., certain Subsidiaries named therein and Citibank, N.A., as administrative agent (incorporated by reference to SRA International, Inc.’s Current Report on Form 8-K filed on July 26, 2011). | |
| 10.8 | Financial Advisory Agreement, dated July 20, 2011, by and among SRA Companies, Inc. (f/k/a Sterling Holdco Inc.), SRA International, Inc. and Providence Equity Partners, L.L.C. (incorporated by reference to SRA International, Inc.’s Current Report on Form 8-K filed on July 26, 2011). | |
| 10.9# | SRA Companies, Inc. (f/k/a Sterling Holdco Inc.) Stock Incentive Plan (incorporated by reference to SRA International, Inc.’s Registration Statement on Form S-4 filed on March 30, 2012). | |
| 10.10# | SRA Companies, Inc. (f/k/a Sterling Holdco Inc.) Nonqualified Stock Option Agreement (incorporated by reference to SRA International, Inc.’s Registration Statement on Form S-4 filed on March 30, 2012). | |
| 10.11# | Form of Management Stockholders Agreement (incorporated by reference to SRA International, Inc.’s Registration Statement on Form S-4/A filed on May 10, 2012). | |
| 10.12# | SRA Companies, Inc. (f/k/a Sterling Holdco Inc.) Restricted Stock Plan (incorporated by reference to SRA International, Inc.’s Current Report on Form 8-K filed on June 28, 2013). | |
| 10.13# | SRA Companies, Inc. (f/k/a Sterling Holdco Inc.) Restricted Stock Agreement (incorporated by reference to SRA International, Inc.’s Current Report on Form 8-K filed on June 28, 2013). | |
| 10.14# | Enhanced Severance Eligibility Agreement dated July 1, 2013 by and between SRA International, Inc. and Timothy J. Atkin (incorporated by reference to SRA International, Inc.’s Annual Report on Form 10-K filed on August 9, 2013). | |
| 10.15** | Amended and Restated Stockholders Agreement, dated as of October 17, 2011, among SRA Companies, Inc. (f/k/a Sterling Holdco Inc.) and the stockholders party thereto. | |
| 10.16** | Form of Second Amended and Restated Stockholders Agreement among SRA Companies, Inc. and the stockholders party thereto. | |
| 10.17** | Form of Tax Receivable Agreement. | |
| 10.18#* | Enhanced Severance Eligibility Agreement, dated September 17, 2014, by and between SRA International, Inc. and David K. Keffer. | |
II-7
Table of Contents
| Exhibit |
Description | |
| 10.19#* | Enhanced Severance Eligibility Agreement, dated January 7, 2014, by and between SRA International, Inc. and Clyde T. Nixon. | |
| 10.20#* | Enhanced Severance Eligibility Agreement, dated January 23, 2013, by and between SRA International, Inc. and Paul Nedzbala. | |
| 10.21#* | SRA Companies, Inc. (f/k/a Sterling Holdco Inc.) Form of Restricted Stock Agreement. | |
| 10.22#** | SRA International, Inc. Individual Incentive Compensation Plan. | |
| 21.1** | List of Subsidiaries. | |
| 23.1* | Consent of KPMG LLP. | |
| 23.2** | Consent of Debevoise & Plimpton LLP (included in Exhibit 5.1 hereto). | |
| 24.1* | Powers of Attorney (contained on signature pages to the Registration Statement on Form S-1). | |
| # | Denotes management contract or compensatory plan or arrangement. |
| * | Filed herewith. |
| ** | To be filed by amendment. |
II-8