Attached files
| file | filename |
|---|---|
| 8-K - FORM 8-K - Gramercy Property Trust | d88373d8k.htm |
| EX-2.1 - EX-2.1 - Gramercy Property Trust | d88373dex21.htm |
| EX-3.2 - EX-3.2 - Gramercy Property Trust | d88373dex32.htm |
| EX-99.2 - EX-99.2 - Gramercy Property Trust | d88373dex992.htm |
 MERGER
OF EQUALS TO CREATE A BEST-IN-CLASS NET LEASE REIT Investor
Presentation, July 1, 2015 1
Exhibit 99.1 |
 Forward-Looking Information and Disclaimers
Important Information For Investors And Shareholders This communication does not constitute an offer to sell or the solicitation of an offer to buy any securities or a solicitation of any vote or approval. In connection with the transactions referred to in this communication, Chambers Street Properties (“Chambers Street”) expects to file a registration statement on Form S-4 with the Securities and Exchange Commission (“SEC”) containing a preliminary joint proxy statement of Chambers Street and Gramercy Property Trust Inc. (“Gramercy”) that also constitutes a preliminary prospectus of Chambers Street. After the registration statement is declared effective, Chambers Street and Gramercy will mail a definitive proxy statement/prospectus to stockholders of Gramercy and shareholders of Chambers Street. This communication is not a substitute for the joint proxy statement/prospectus or registration statement or for any other document that Chambers Street or Gramercy may file with the SEC and send to Chambers Street’s and/or Gramercy’s stockholders in connection with the proposed transactions. INVESTORS AND SECURITY HOLDERS OF CHAMBERS STREET AND GRAMERCY ARE URGED TO READ THE PROXY STATEMENT/PROSPECTUS AND OTHER DOCUMENTS FILED WITH THE SEC CAREFULLY AND IN THEIR ENTIRETY WHEN THEY BECOME AVAILABLE BECAUSE THEY WILL CONTAIN IMPORTANT INFORMATION. Investors and security holders will be able to obtain free copies of the proxy statement/prospectus (when available) and other documents filed by Chambers Street and Gramercy with the SEC through the website maintained by the SEC at http://www.sec.gov. Copies of the documents filed by Gramercy with the SEC will be available free of charge on Gramercy’s website at www.gptreit.com, or by contacting Gramercy’s Investor Relations Department at (212) 297-1000. Copies of the documents filed by Chambers Street with the SEC will be available free of charge on Chambers Street’s website at www.chamberstreet.com or by contacting Chambers Street’s Investor Relations Department at 609-806-2682. Chambers Street and Gramercy and their respective trustees/directors and certain of their respective executive officers may be considered participants in the solicitation of proxies with respect to the proposed transactions under the rules of the SEC. Information about the trustees and executive officers of Chambers Street is set forth in its Annual Report on Form 10-K for the year ended December 31, 2014, which was filed with the SEC on March 2, 2015, and the amendments thereto on Form 10-K/A, which were filed with the SEC on March 30, 2015 and April 30, 2015. These documents can be obtained free of charge from the sources indicated above. Information about the directors and executive officers of Gramercy is set forth in its Annual Report on Form 10-K for the year ended December 31, 2014, which was filed with the SEC on March 9, 2015, its proxy statement for its 2015 annual meeting of stockholders, which was filed with the SEC on May 11, 2015 and other filings filed with the SEC. Additional information regarding the participants in the proxy solicitations and a description of their direct and indirect interests, by security holdings or otherwise, will also be included in any proxy statement and other relevant materials to be filed with the SEC when they become available. Cautionary Statement Regarding Forward-Looking Statements Certain statements in this communication regarding the proposed transaction between Chambers Street and Gramercy, including any statements regarding the expected timetable for completing the transaction, benefits and synergies of the transaction, future opportunities for the respective companies and products, and any other statements regarding Chambers Street and Gramercy’s future expectations, beliefs, plans, objectives, financial conditions, assumptions or future events or performance that are not historical facts are “forward-looking” statements made within the meaning of Section 27A of the Securities Act of 1933, as amended, and Section 21E of the Securities Exchange Act of 1934, as amended. These statements are often, but not always, made through the use of words or phrases such as “believe,” “expect,” “anticipate,” “should,” “planned,” “will,” “may,” “intend,” “estimated,” “aim,” “on track,” “target,” “opportunity,” “tentative,” “positioning,” “designed,” “create,” “predict,” “project,” “seek,” “would,” “could”, “potential,” “continue,” “ongoing,” “upside,” “increases,” and “potential,” and similar expressions. All such forward-looking statements involve estimates and assumptions that are subject to risks, uncertainties and other factors that could cause actual results to differ materially from the results expressed in the statements. Although we believe the expectations reflected in any forward-looking statements are based on reasonable assumptions, we can give no assurance that our expectations will be attained and therefore, actual outcomes and results may differ materially from what is expressed or forecasted in such forward-looking statements. Some of the factors that may affect outcomes and results include, but are not limited to: (i) risks associated with the parties’ ability to obtain the required shareholder approval or other third-party approvals required to consummate the merger and the timing of the closing of the merger, including the risks that a condition to closing would not be satisfied or that the closing of the merger will not occur, (ii) the outcome of any legal proceedings that may be instituted against the parties' and others related to the merger agreement, (iii) changes in financial markets, interest rates and foreign currency exchange rates, (iv) increased or unanticipated competition for our properties, (v) risks associated with acquisitions, (vi) maintenance of real estate investment trust (“REIT”) status, (vii) availability of financing and capital, (viii) changes in demand for developed properties, (ix) risks associated with achieving expected revenue synergies or cost savings, (x) national, international, regional and local economic climates, and (xi) those additional risks and factors discussed in reports filed with the SEC by Chambers Street and Gramercy from time to time, including those discussed under the heading “Risk Factors” in their respective most recently filed reports on Form 10-K and 10-Q. Non-GAAP Financial Measures CSG and GPT have used non-GAAP financial measures as defined by SEC Regulation G in this presentation. Fund from operations (“FFO”): The revised White Paper on FFO approved by the Board of Governors of the National Association of Real Estate Investment Trusts, or NAREIT, defines FFO as net income (loss) (determined in accordance with GAAP), excluding impairment write-downs of investments in depreciable real estate and investments in in-substance real estate investments, gains or losses from debt restructurings and sales of depreciable operating properties, plus real estate-related depreciation and amortization (excluding amortization of deferred financing costs), less distributions to non-controlling interests and gains/losses from discontinued operations and after adjustments for unconsolidated partnerships and joint ventures. Core FFO and adjusted funds from operations (“AFFO”): Core FFO and AFFO are non-GAAP financial measures that are presented excluding property acquisition costs, discontinued operations, other-than-temporary impairments on retained bonds, and other one-time charges. AFFO of CSG and GPT also excludes non-cash stock-based compensation expense, amortization of above and below market leases, amortization of deferred financing costs, amortization of lease inducement costs, non-real estate depreciation and amortization, amortization of free rent received at property acquisition, and straight-line rent. CSG and GPT believes that Core FFO and AFFO are useful supplemental measures regarding CSG and GPT’s operating performances as they provide a more meaningful and consistent comparison of CSG and GPT’s operating performance and allows investors to more easily compare CSG and GPT’s operating results. Net operating income (“NOI”) is a non-GAAP financial measure that represents property revenues on a straight-line basis minus property expenses before interest and capital reserves/expenditures. Capitalization rate (“Cap Rate”) is a rate of return on a real estate investment property based on the expected, straight-lined income that the property will generate. Cap rate is used to estimate CSG and GPT’s potential return on its investment. This is done by dividing the income the property is expected to generate (before debt service and depreciation and after fixed costs and variable costs) by the acquisition price of the property. The Core FFO, AFFO, Run-Rate FFO, NOI and Cap Rate assumptions included in this presentation reflects CSG and GPT's assumptions and expectations and are not guarantees of its future performance. CSG and GPT's actual results may vary materially from the assumptions presented in this presentation. The results that an investor in CSG and GPT will actually receive will depend, to a significant degree, on the actual performance of CSG and GPT's assets, which may be impacted by material economic and market risk factors. 2 |
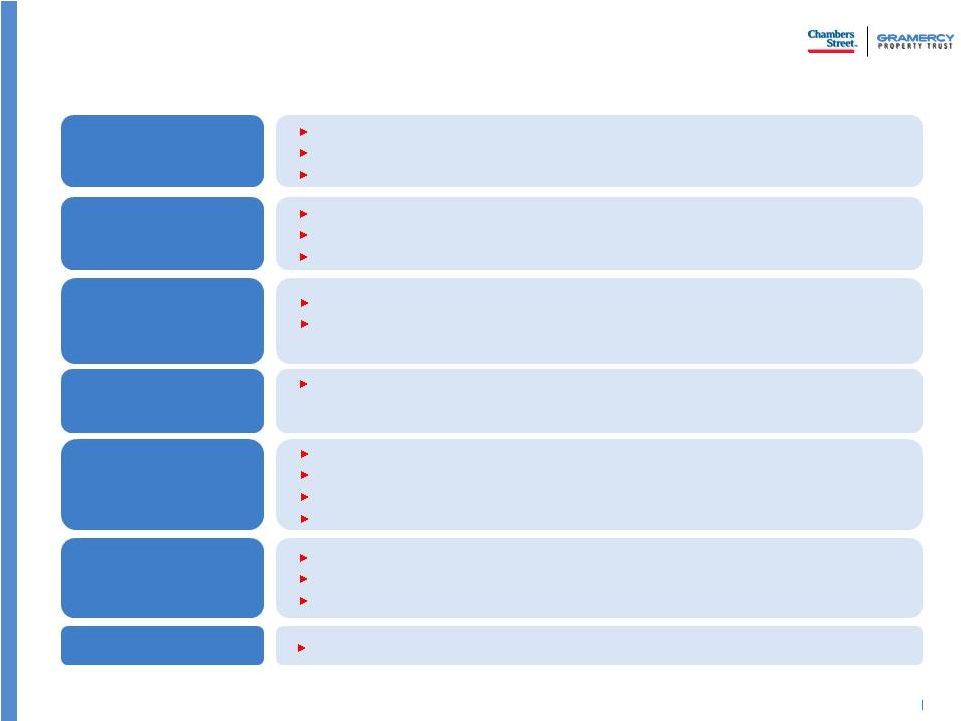 Transaction Highlights for Creation of a Best-In-Class REIT
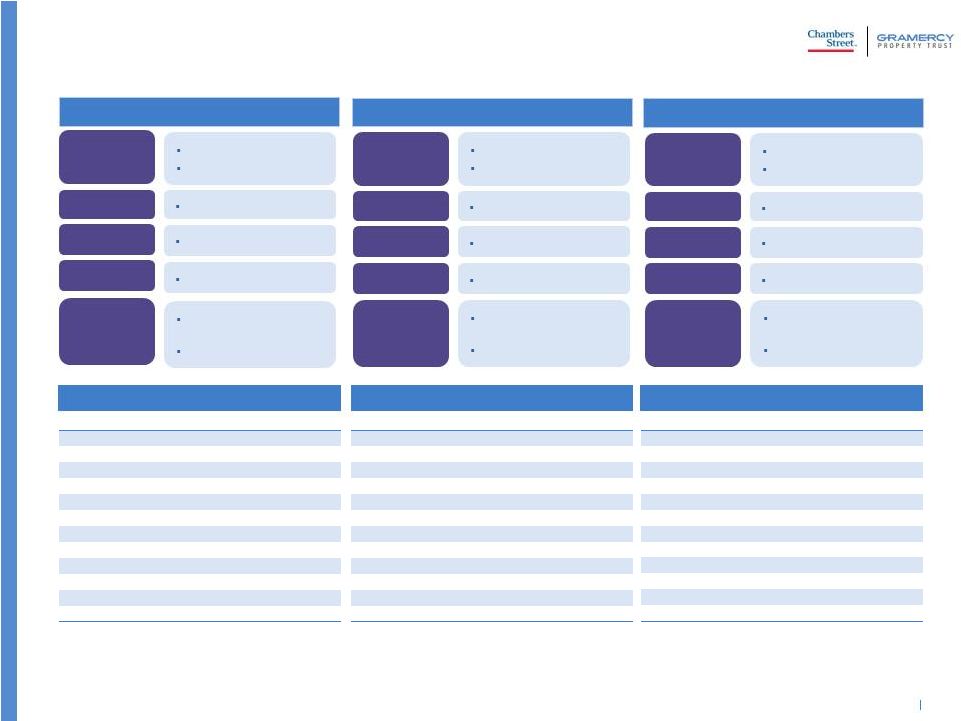
Scale Scale Improved predictability of earnings Ability to pursue larger opportunities Larger asset base affords flexibility in capital recycling Diversity Diversity Significantly improves portfolio diversification Broader geographic footprint Greater tenant and asset diversification Significantly improves portfolio diversification Broader geographic footprint Greater tenant and asset diversification Efficiency Efficiency ~$15 million of run rate annual cost synergies expected NewCo G&A after synergies is 0.47% on asset value as compared to 0.76% and 0.74% for GPT and CSG pre transaction, respectively ~$15 million of run rate annual cost synergies expected NewCo G&A after synergies is 0.47% on asset value as compared to 0.76% and 0.74% for GPT and CSG pre transaction, respectively Growth Growth Management will have a mandate to create value from internal and external opportunities (e.g. blend and extend leases, recycle assets, optimize portfolio) Management will have a mandate to create value from internal and external opportunities (e.g. blend and extend leases, recycle assets, optimize portfolio) Cost of Capital / Flexibility Cost of Capital / Flexibility Enhanced access to capital Larger company better able to absorb market cycles Expected to be immediately credit neutral and near-term credit enhancing Low levels of secured debt allows for cost-efficient repositioning Enhanced access to capital Larger company better able to absorb market cycles Expected to be immediately credit neutral and near-term credit enhancing Low levels of secured debt allows for cost-efficient repositioning Structure Structure Merger of equals and shared goals for value creation Shared board and adoption of governance best practices 100% stock deal allows continuing shareholders to participate in upside Merger of equals and shared goals for value creation Shared board and adoption of governance best practices 100% stock deal allows continuing shareholders to participate in upside Europe Europe Goodman assets accelerate growth of Gramercy Europe Goodman assets accelerate growth of Gramercy Europe 3 |
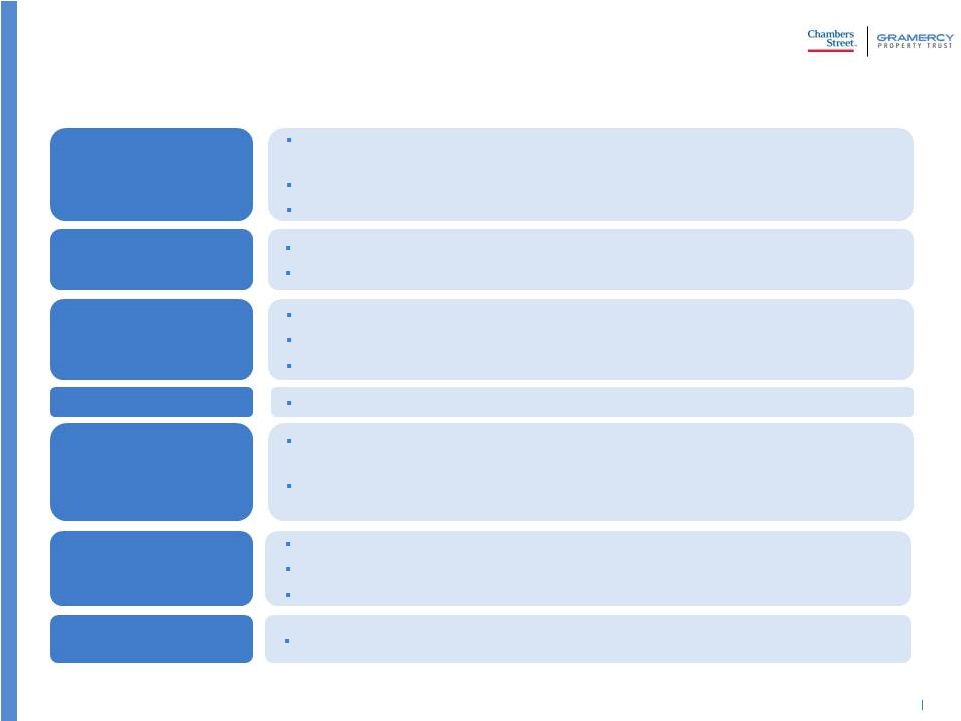 Transaction Summary Structure Structure 100% stock merger of equals between Chambers Street Properties (“CSG”) and
Gramercy Property Trust (“GPT”)
GPT shareholders will receive 3.1898 shares of CSG at closing Expected to be tax-free to both sets of shareholders 100% stock merger of equals between Chambers Street Properties (“CSG”) and
Gramercy Property Trust (“GPT”)
GPT shareholders will receive 3.1898 shares of CSG at closing Expected to be tax-free to both sets of shareholders Company Name, Headquarters & Ticker Company Name, Headquarters & Ticker Merged company will be renamed Gramercy Property Trust Ticker symbol expected to be changed to (NYSE: GPT) To be headquartered in New York City Merged company will be renamed Gramercy Property Trust Ticker symbol expected to be changed to (NYSE: GPT) To be headquartered in New York City Pro Forma Ownership Pro Forma Ownership ~56% former Chambers Street shareholders ~44% former Gramercy shareholders ~56% former Chambers Street shareholders ~44% former Gramercy shareholders Board Composition & Leadership Board Composition & Leadership Each of CSG and GPT to appoint five appointees Charles Black to be non-executive Chairman Gordon DuGan to be CEO Each of CSG and GPT to appoint five appointees Charles Black to be non-executive Chairman Gordon DuGan to be CEO Expected Synergies Expected Synergies ~$15 million annual run rate ~$15 million annual run rate Closing Closing Expected to be in 4Q 2015 Expected to be in 4Q 2015 Expected Dividend Expected Dividend The combined company will maintain a dividend policy that optimizes long term total
return to shareholders
Post closing, dividend payout
ratio level will be in between CSG’s
and GPT’s current levels The combined company will maintain a dividend policy that optimizes long term total
return to shareholders
Post closing, dividend payout
ratio level will be in between CSG’s
and GPT’s current levels 4 |
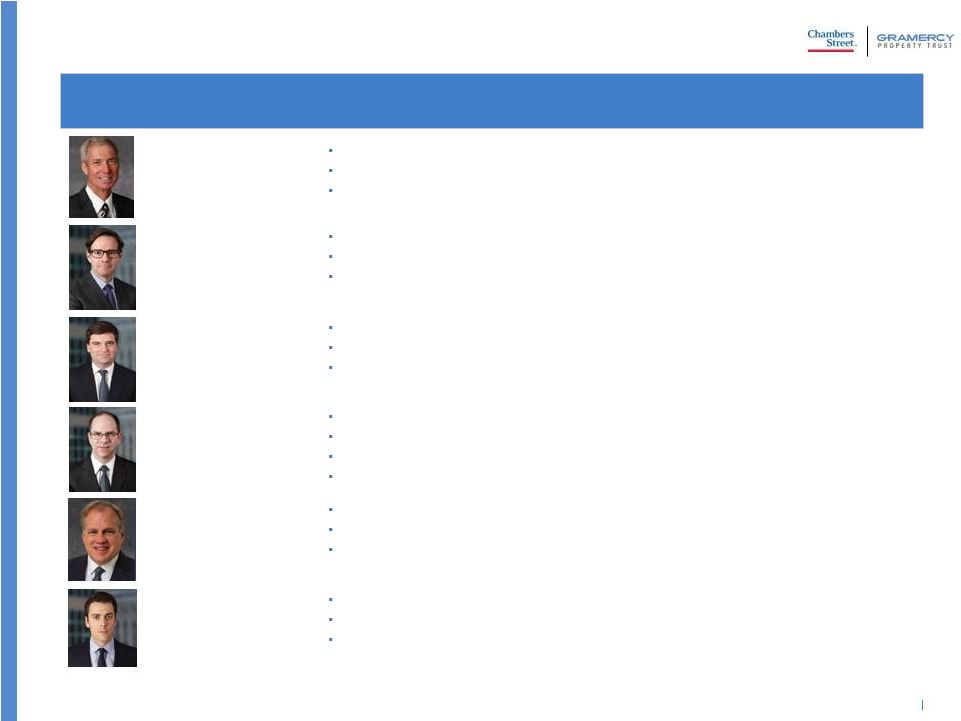 Seasoned and proven management team – Gramercy executives are waiving change of control provisions under 2012 Outperformance Plan and leaving the Plan in place Mr. DuGan joined Gramercy in July 2012 Former CEO of WP Carey B.S. in Economics from the Wharton School at the University of Pennsylvania Mr. Harris joined Gramercy in July 2012 Former Head of US Investments at W.P. Carey Joint B.S. in Economics from University of Kings College and Dalhousie University in Canada
Gordon F. DuGan Chief Executive Officer Benjamin P. Harris, CFA President Mr. Pell joined Gramercy in July 2012 Former Director of Investments at WP Carey B.A. in Economics from Duke and an MBA from Harvard Business School Nicholas L. Pell Head of Investments Strengthened Leadership Jon Clark, CPA Chief Financial Officer Mr. Clark joined Gramercy in April 2007 Former VP and Controller of Gramercy Property Trust Former Director at Blackrock in Real Estate B.B.A in Accountancy from Western Michigan University Martin A. Reid Head of Transition Mr. Reid is currently interim CEO former CFO of Chambers Street Properties Former Executive Vice President of Development & Acquisitions at Interstate Hotels & Resorts
B.S. in Accounting from State University of New York at Albany and MBA in Financial
Management from Pace University
Mr. Black is currently the Chairman of the Board of Trustees of Chambers Street
Properties CEO of CB Urban Development
B.S. from the United States Air Force Academy and a J.D. from the University of
California at Davis
Charles E. Black Non-Executive Chairman 5 |
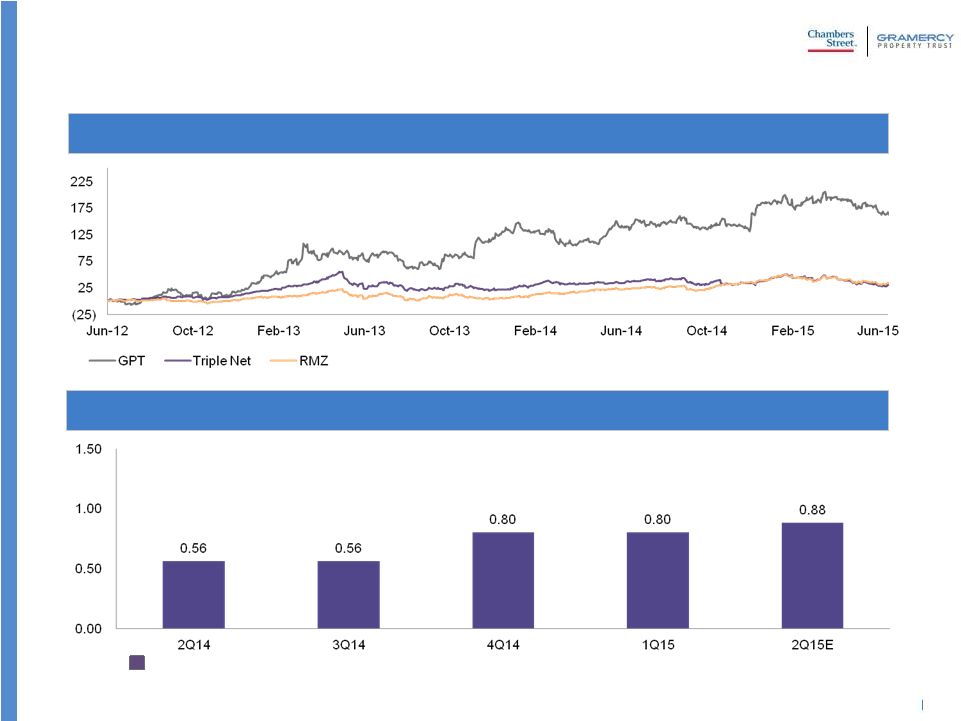 GPT Management Team has Delivered Outstanding Shareholder Returns… …and Reinstated a Growing Dividend 144% 24% 28% Track Record Under Current Leadership Annualized Dividend Source: SNL Financial and Company Filings 6 |
 High
Quality Combined Portfolio Enterprise value ~ $5.7 billion
85% of combined portfolio located in target markets 1 52 million square feet across 288 properties » 99% occupancy rate Top tenant exposure is less than 7.5%, top 10 tenants are less than 30% Pro Forma combined Company weighted average lease term will be greater than 7 years 2 » Lease term to be extended through asset sales and lease restructurings Combined entity has IG tenancy of 43% Combined asset management platform and enhanced scale allows for asset recycling to reduce
office exposure while continuing to grow
Low levels of secured debt gives flexibility to sell assets and reposition portions of
the portfolio with minimal prepayment expense
1. GPT defines target markets as NY/NJ, Dallas, Baltimore/Washington, Los Angeles, South Florida, Phoenix, Chicago, Jacksonville, Minneapolis,
Central PA, Indianapolis, San
Francisco, Cincinnati, Tampa/Orlando, Houston, Philadelphia, Kansas City, Denver, Nashville, Atlanta, Charlotte, Memphis, Las Vegas, Seattle, Columbus, Savannah, Austin and the Inland Empire. 2. Average lease term weighted by contractual base rent. 7 |
 High
Quality Net Leased Portfolio Properties
% of Contractual Base Rent Occupancy Total Square Feet Industrial 66 42% 100.0% 13.5 million Office/Banking Centers 84 35% 98.5% 5.0 million Specialty Industrial 14 8% 100.0% 0.7 million Specialty Retail 10 12% 100.0% 1.3 million Data Centers 2 3% 100.0% 0.2 million Total 176 100% 99.6% 20.7 million Gramercy Property Trust Owned Portfolio 1 Industrial 65 40% 99.0% 23.8 million Office 47 60% 98.8% 7.3 million Total 112 100% 99.0% 31.2 million Chambers Street Owned Portfolio 2 Properties % of Contractual Base Rent Occupancy Total Square Feet Industrial 131 41% 99.4% 37.3 million Office/Banking Centers 131 50% 98.7% 12.3 million Specialty Industrial 14 3% 100.0% 0.7 million Specialty Retail 10 5% 100.0% 1.3 million Data Centers 2 1% 100.0% 0.2 million Total 288 100% 99.2% 51.9 million Pro Forma Combined Portfolio 8 1. Based on contractual base rent for each property in Gramercy’s portfolio as of June 24, 2015. Pro Forma for two Gramercy pipeline
transactions under contract and expected to close in July 2015. 2. Chambers Street contractual base rent as of March 31, 2015. Excludes European JV, 70 Hudson, Jersey City, NJ, 300 Constitution Drive, Boston, MA
and 225 Summit Avenue, Montvale, NJ. |
 Rank Markets % of Total ABR 1 Los
Angeles 13% 2 Dallas 9% 3 Jacksonville 7% 4 Chicago 6% 5 South Florida 6% 6 New York / New Jersey 4% 7 Philadelphia 4% 8 Phoenix 3% 9 Indianapolis 3% 10 Houston 3% Other Target Markets 26% Other Non-Target Markets 16% Rank Markets % of Total ABR 1 New York / New Jersey 11% 2 Baltimore / Washington 9% 3 Phoenix 7% 4 Minneapolis 7% 5 Dallas 6% 6 Central PA 6% 7 South Florida 6% 8 Indianapolis 4% 9 Chicago 4% 10 Columbus 4% Other Target Markets 22% Other Non-Target Markets 15% GPT Key Portfolio Statistics Size 176 assets 21 million square feet Tenants 32% Investment Grade Lease Term 9.9 Years Geographic 84% of assets in Target Markets Largest market: LA Occupancy 99.6% CSG Key Portfolio Statistics Size 112 assets 31 million square feet Tenants 51% Investment Grade Lease Term 5.8 Years Geographic 85% of assets in Target Markets Largest market: NY/NJ Occupancy 99.0% Pro Forma Combined Portfolio Statistics Size 288 assets 52 million square feet Tenants 43% Investment Grade Lease Term 7.4 Years Geographic 85% of assets in Target Markets Largest market: NY/NJ Occupancy 99.2% GPT Portfolio Breakdown by Geography PF Portfolio Breakdown by Geography Rank Markets % of Total ABR 1 New York / New Jersey 9% 2 Dallas 8% 3 Baltimore / Washington 6% 4 Los Angeles 6% 5 South Florida 6% 6 Phoenix 5% 7 Chicago 5% 8 Jacksonville 5% 9 Minneapolis 4% 10 Central PA 4% Other Target Markets 27% Other Non-Target Markets 15% High Quality Net Leased Portfolio (continued) 1. Based on contractual base rent for each property in Gramercy’s portfolio as of June 24, 2015. Pro Forma for two Gramercy pipeline transactions under contract and expected to close in July 2015. 2. Chambers Street contractual base rent as of March 31, 2015. Excludes 70 Hudson, Jersey City, NJ, 300 Constitution Drive, Boston, MA, 225 Summit Avenue, Montvale, NJ. Also excludes CSG’s European JV assets. 3. Includes Indianapolis, San Francisco, Cincinnati, Tampa/Orlando, Houston, Philadelphia, Kansas City, Denver, Nashville, Atlanta, Charlotte, Memphis, Las Vegas, Seattle, Columbus, Savannah, Austin and the Inland Empire. 4. Includes Waco, TX; Ames, IA; Cleveland, OH; Yuma, AZ; St. Louis, MO; Northern CA; Central FL; Central IL and other markets.
9 4 4 4 3 3 2 1 CSG Portfolio Breakdown by Geography 2 2 |
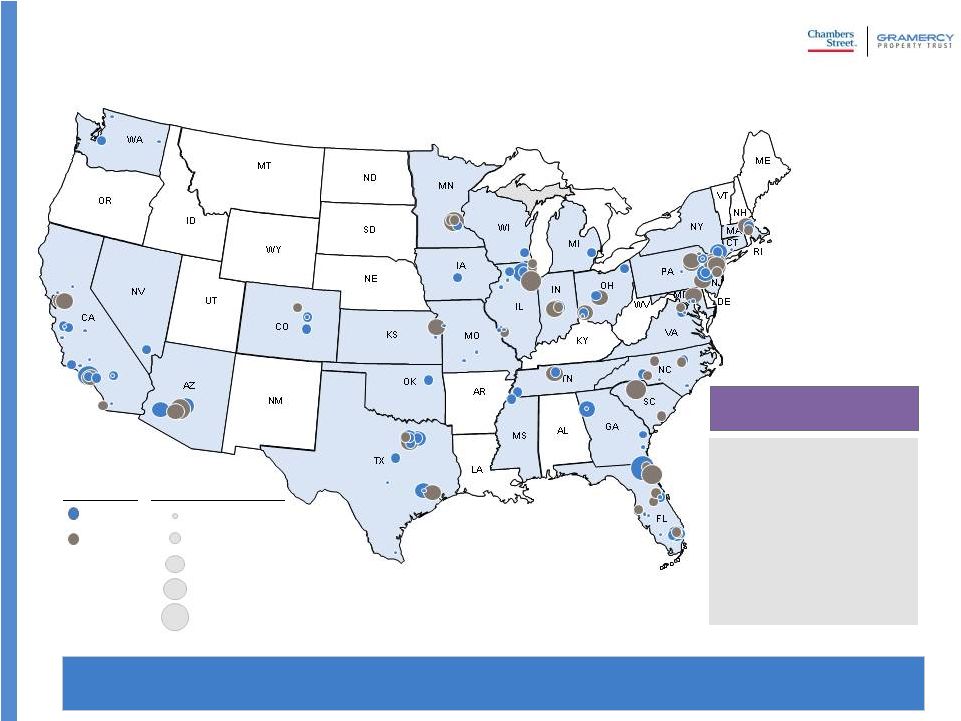 Top 10
Markets By % of Contractual Base Rent
1. New York/New Jersey 2. Dallas 3. Baltimore/Washington 4. Los Angeles 5. South Florida 6. Phoenix 7. Chicago 8. Jacksonville 9. Minneapolis 10. Central PA 1. New York/New Jersey 2. Dallas 3. Baltimore/Washington 4. Los Angeles 5. South Florida 6. Phoenix 7. Chicago 8. Jacksonville 9. Minneapolis 10. Central PA By Contractual Base Rent Gramercy Chambers < $1MM $1MM -$3MM $4MM-$6MM $7MM-$9MM $10MM-$12MM Property Type Geographic Footprint in Attractive Markets Pro forma portfolio continues to be focused on industrial and office assets in major
commercial real estate markets |
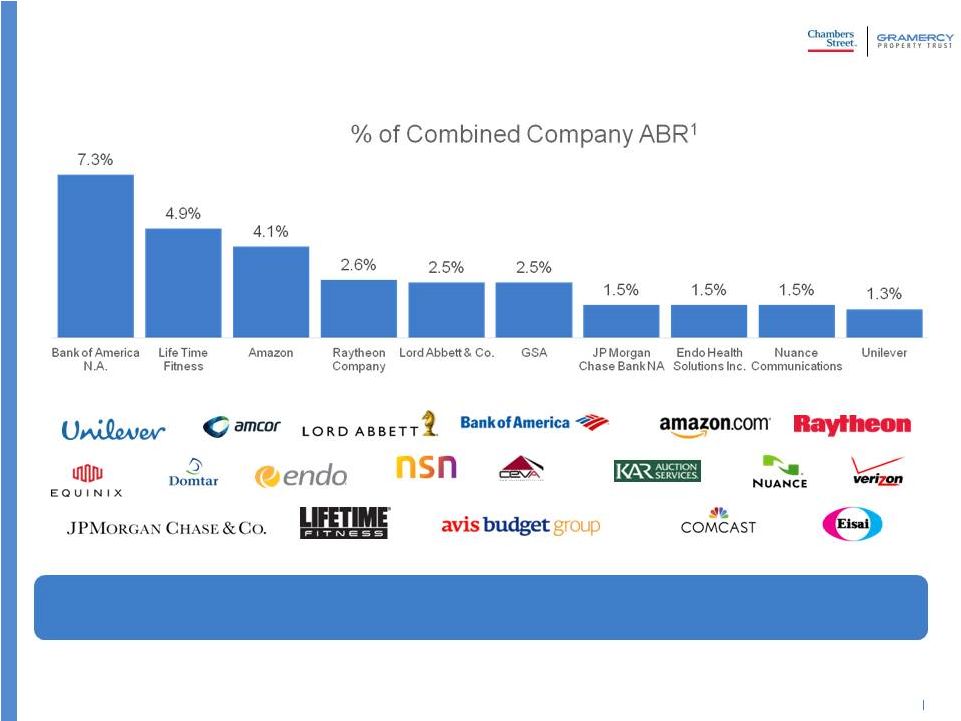 Diverse
Pro Forma Tenant Base 1.
Based on contractual base rent for each property in Gramercy’s portfolio as of June 24, 2015. Pro Forma for two Gramercy pipeline transactions under contract and expected to close in July 2015. Chambers Street contractual base rent as of March 31, 2015. Excludes European JV properties as well as 70 Hudson, Jersey City, NJ, 300 Constitution Drive, Boston, MA and 225 Summit Avenue, Montvale, NJ. Largest single tenant represents approx. 7% of estimated combined ABR. Top 10 tenants represent approx. 30% of estimated combined ABR. A1/A A1/A B2/B B2/B Baa1/AA- Baa1/AA- A3/A A3/A NR/NR NR/NR Aa1/AA+ Aa1/AA+ A3/A A3/A NR/NR NR/NR Ba3/BB- Ba3/BB- A1/A+ A1/A+ 11 |
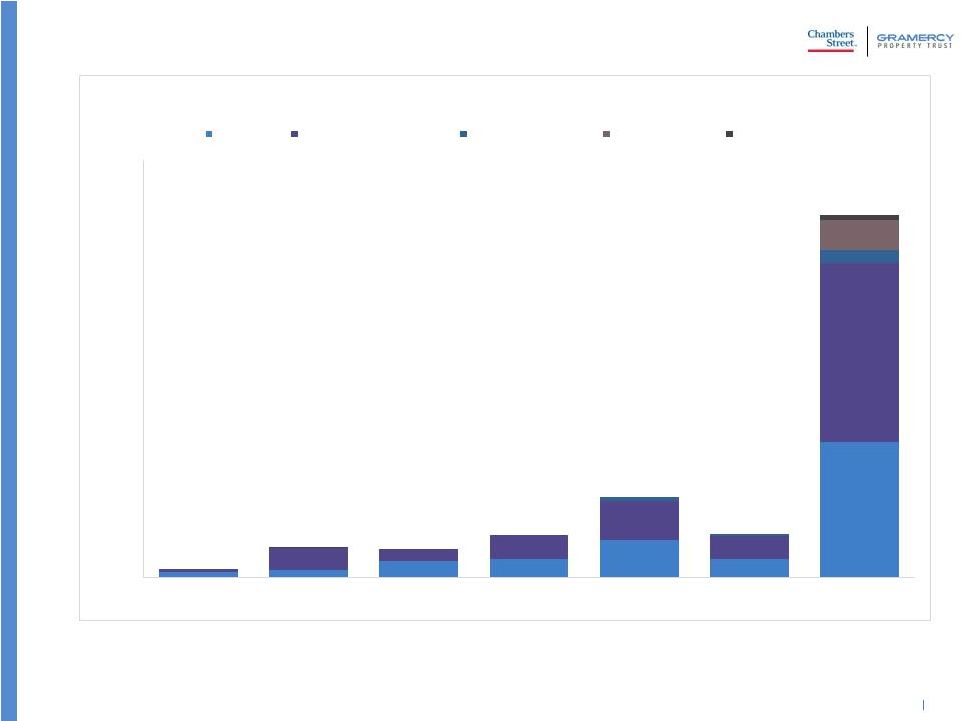 Pro
Forma Lease Expirations Note: Specialty Industrial properties include
assets such as truck terminals and covered land industrial uses. Specialty Retail properties include 10 health and wellness facilities. Excludes 70 Hudson Street in Jersey City, NJ from CSG’s portfolio as well as 300 Constitution Drive, Boston, MA, 225 Summit Avenue in Montvale, NJ. 1. Based on percentage of contractual base rent for each property in Gramercy’s portfolio as of June 24, 2015 as well as Chambers Street
contractual base rent as of March 31, 2015. Excludes European JV
properties. 1.4%
5.1% 4.8% 7.1% 13.4% 7.3% 60.8% 0.0% 10.0% 20.0% 30.0% 40.0% 50.0% 60.0% 70.0% 2015 2016 2017 2018 2019 2020 Thereafter Industrial Office / Banking Center Specialty Industrial Specialty Retail Data Center Lease Expiration by Property Type (1) 12 |
 Significant Asset Management Capabilities
CSG has had steady leasing experience across its portfolio with 7.7 million
square feet leased across its portfolio on a cumulative basis. In
addition, CSG has continued to execute dispositions of assets on a
selective basis at attractive prices
Gramercy has an extensive asset management team with deep experience
with single tenant office assets from its management of the former AFR
assets Since 2012, Gramercy’s asset management team has executed significant leasing and disposition activity in its owned and managed portfolios » Approximately 100 leases signed for 1.1MM square feet » Approximately 200 lease renewals/extensions for 1.2MM square feet » Approximately 400 individual property sales totaling $1.4 billion at an average cap rate of 7.3% – Asset sales of less than $500k to more than $100MM 13 |
 1. Capitalization shown pro forma for activity subsequent to first quarter. 2. Assumes 70 Hudson is sold for the current loan balance. 3. Equity market capitalization as of June 30, 2015. ($ millions) GPT 1 CSG 1 70 Hudson Pro Forma Total Unsecured Debt 665 805 1,470 Mortgages 307 710 (114) 903 Total debt 972 1,515 (114) 2,373 Preferred 88 0 88 Cash 40 65 105 Total Net Debt + Preferred 1,020 1,450 (114) 2,356 Equity Market Capitalization 3 1,372 1,886 3,258 Total Enterprise Value 2,392 3,336 (114) 5,614 Net Debt / Enterprise Value 39% 43% 40% Credit Rating (S&P / Moody’s) - / Baa3 BBB- / Baa3 Transaction is structured as a stock for stock merger of equals – transaction improves combined company’s credit metrics and significantly increases the enterprise Enhanced Investment Grade Company with Best-In-Class Financial Strength and Flexibility 14 Adjustments 2 |
 Estimated G&A Synergies
($ in millions) Estimated Annual G&A Savings Personnel $10 Non Personnel $5 Total Synergies ($) $15 Per Combined Company Share ($) $0.04 per NewCo share ~60% run rate expected by mid-2016 100% expected by year end-2016 15 |
 Near
Term Action Plan Upon Closing Reduce G&A expenses
1 Improve quality of earnings 5 Grow European portfolio through Gramercy Europe 3 Maintain low leverage unsecured balance sheet 4 Reduce office exposure • Sell $500 million - $700 million in first year and recycle capital • Long term goal of 25% or less office exposure 2 6 Grow the dividend 16 |
 Q&A |