Attached files
| file | filename |
|---|---|
| EX-31.2 - EX-31.2 - OMNIVISION TECHNOLOGIES INC | a2225024zex-31_2.htm |
| EX-32 - EX-32 - OMNIVISION TECHNOLOGIES INC | a2225024zex-32.htm |
| EX-31.1 - EX-31.1 - OMNIVISION TECHNOLOGIES INC | a2225024zex-31_1.htm |
| EX-21.1 - EX-21.1 - OMNIVISION TECHNOLOGIES INC | a2225024zex-21_1.htm |
| EX-99.1 - EX-99.1 - OMNIVISION TECHNOLOGIES INC | a2225024zex-99_1.htm |
| EX-23.2 - EX-23.2 - OMNIVISION TECHNOLOGIES INC | a2225024zex-23_2.htm |
| EX-23.1 - EX-23.1 - OMNIVISION TECHNOLOGIES INC | a2225024zex-23_1.htm |
Use these links to rapidly review the document
TABLE OF CONTENTS
INDEX TO CONSOLIDATED FINANCIAL STATEMENTS
UNITED STATES
SECURITIES AND EXCHANGE COMMISSION
Washington, D.C. 20549
FORM 10-K
| (Mark One) | ||
ý |
ANNUAL REPORT PURSUANT TO SECTION 13 OR 15(d) OF THE SECURITIES EXCHANGE ACT OF 1934 |
|
For the fiscal year ended April 30, 2015 |
||
o |
TRANSITION REPORT PURSUANT TO SECTION 13 OR 15(d) OF THE SECURITIES EXCHANGE ACT OF 1934 |
|
For the transition period from to |
||
Commission file number: 0-29939 |
||
OMNIVISION TECHNOLOGIES, INC.
(Exact name of registrant as specified in its charter)
| Delaware | 77-0401990 | |
| (State or other jurisdiction of incorporation or organization) |
(I.R.S. Employer Identification Number) |
|
4275 Burton Drive, Santa Clara, California 95054 (Address of principal executive offices) (Zip Code) |
||
Registrant's telephone number, including area code: (408) 567-3000 |
||
Securities registered pursuant to Section 12(b) of the Act:
| Title of each class | Name of each exchange on which registered | |
|---|---|---|
| Common Stock, $0.001 par value (Including associated Preferred Stock Purchase Rights) |
The Nasdaq Stock Market LLC (Nasdaq Global Market) |
Securities registered pursuant to Section 12(g) of the Act: None
Indicate by check mark if the registrant is a well-known seasoned issuer, as defined in Rule 405 of the Securities Act. Yes ý No o
Indicate by check mark if the registrant is not required to file reports pursuant to Section 13 or Section 15(d) of the Act. Yes o No ý
Indicate by check mark whether the registrant (1) has filed all reports required to be filed by Section 13 or 15(d) of the Securities Exchange Act of 1934 during the preceding 12 months (or for such shorter period that the Registrant was required to file such reports), and (2) has been subject to such filing requirements for the past 90 days. Yes ý No o
Indicate by check mark whether the registrant has submitted electronically and posted on its corporate Web site, if any, every Interactive Data File required to be submitted and posted pursuant to Rule 405 of Regulation S-T (§232.405 of this chapter) during the preceding 12 months (or for such shorter period that the registrant was required to submit and post such files). Yes ý No o
Indicate by check mark if disclosure of delinquent filers pursuant to Item 405 of Regulation S-K (§ 229.405 of this chapter) is not contained herein, and will not be contained, to the best of the Registrant's knowledge, in definitive proxy or information statements incorporated by reference in Part III of this Form 10-K or any amendment to this Form 10-K. ý
Indicate by check mark whether the registrant is a large accelerated filer, an accelerated filer, a non-accelerated filer, or a smaller reporting company. See the definitions of "large accelerated filer," "accelerated filer" and "smaller reporting company" in Rule 12b-2 of the Exchange Act.
| Large accelerated filer ý | Accelerated filer o | Non-accelerated filer o (Do not check if a smaller reporting company) |
Smaller reporting company o |
Indicate by check mark whether the registrant is a shell company (as defined in Rule 12b-2 of the Exchange Act). Yes o No ý
As of October 31, 2014, the last business day of the Registrant's most recently completed second fiscal quarter, there were 57,661,991 shares of the Registrant's common stock outstanding, and the aggregate market value of such shares held by non-affiliates (based upon the closing sale price of such shares on the NASDAQ Global Market on October 31, 2014) was approximately $1.544 billion. Shares of the Registrant's common stock held by the Registrant's executive officers and directors and by each entity that owns five percent or more of the Registrant's outstanding common stock have been excluded in that such persons may be deemed to be affiliates. This determination of affiliate status is not necessarily a conclusive determination for other purposes.
As of June 22, 2015, 58,449,548 shares of common stock of the Registrant were outstanding, exclusive of 20,599,187 shares of treasury stock.
DOCUMENTS INCORPORATED BY REFERENCE
The Registrant has incorporated by reference into Part III of this Annual Report on Form 10-K portions of its Proxy Statement for the 2015 Annual Meeting of Stockholders.
OMNIVISION TECHNOLOGIES, INC.
INDEX TO
ANNUAL REPORT ON FORM 10-K
FOR YEAR ENDED APRIL 30, 2015
2
The following information should be read in conjunction with our audited consolidated financial statements and the notes thereto included in Item 8 of this Annual Report on Form 10-K. This Annual Report on Form 10-K contains forward-looking statements, within the meaning of Section 27A of the Securities Act of 1933 and Section 21E of the Securities Exchange Act of 1934, which involve risks and uncertainties. Forward-looking statements generally include words such as "anticipates," "believes," "expects," "intends," "may," "outlook," "plans," "seeks," "will" and words of similar import as well as the negative of those terms. In addition, any statements that refer to expectations, projections or other characterizations of future events or circumstances, including any underlying assumptions, are forward-looking statements. All forward-looking statements included in this Annual Report on Form 10-K, including, but not limited to, statements regarding our proposed acquisition by the Consortium, our projected results of operations for future reporting periods, the continuing shift of our sales towards our OmniBSI-2 and the increase in the shipment of units for PureCel devices, the extent of future sales through original equipment manufacturers, or OEMs, and distributors, future growth trends and opportunities in certain markets, the capabilities of new products, our expectations regarding our customers' future actions, the timing of the production of our products, the continuing capabilities of our production system, the increasing competition in our industry, the effect of supply constraints, the ability of our suppliers to cost effectively expand to meet supply needs, the continued importance of the mobile phone market to our business, our expectations regarding market preferences with respect to image sensor technologies, the continued concentration of manufacturers in the mobile phone market, the further expansion of the smartphone segment within the mobile phone market, anticipated future sales trends in China, India or other non-U.S. jurisdictions and our ability to benefit from such sales trends, continued price competition and the consequent reduction in the average selling prices of our products, anticipated benefits of our joint ventures and alliances, the ability of our new products to mitigate declines in our average selling prices, the development of our business and manufacturing capacity, future expenses we expect to incur, our future investments, our future working capital requirements, the effect of a change in foreign currency exchange and market interest rates, the geographic distribution of our sales and end users of our products, the continued improvement of general global and domestic economic conditions, our ability to improve our inventory turnover and to generate positive cash flow, the effects of adjustments to our tax positions and the sufficiency of our available cash, cash equivalents and short-term investments are based on current expectations and are subject to important factors that could cause actual results to differ materially from those projected in the forward-looking statements. Such important factors include, but are not limited to, those set forth in Part I under the caption "Item 1A. Risk Factors," beginning on page 19 of this Annual Report and elsewhere in this Annual Report and in other documents we file with the U.S. Securities and Exchange Commission, or SEC. All subsequent written and oral forward-looking statements by or attributable to us or persons acting on our behalf are expressly qualified in their entirety by such factors.
OmniVision, the OmniVision logo, OmniPixel and TrueFocus are registered trademarks of OmniVision Technologies, Inc., CameraChip, CameraCubeChip, OmniBSI, OmniBSI+, OmniBSI-2, OmniGlass, OmniHDR, OmniPixel2, OmniPixel3, OmniPixel3-HS, OmniPixel3-GS, OmniQSP, PureCel, PureCel-S, SquareGA and ViV are trademarks of OmniVision Technologies, Inc. Wavefront Coded and Wavefront Coding are registered trademarks of OmniVision CDM Optics, Inc., a wholly-owned subsidiary of OmniVision Technologies, Inc.
Corporate Information
OmniVision Technologies, Inc., a Delaware corporation, was incorporated in May 1995 in California, and reincorporated in Delaware in March 2000. Our executive offices are located at 4275 Burton Drive, Santa Clara, California 95054 and our telephone number is (408) 567-3000. Copies of our Annual Reports on Form 10-K, Quarterly Reports on Form 10-Q, Proxy Statement for our
3
annual stockholders' meeting and Current Reports on Form 8-K, as well as any amendments to these reports, are available through our website as soon as reasonably practicable after we electronically file such documents with, or furnish them to, the SEC. Information about our company is available on the Internet at www.ovt.com. The information in, or that can be accessed through, our website is not part of this report.
Overview
We design, develop and market high-performance, highly integrated and cost-efficient semiconductor image-sensor devices. Our main products, image-sensing devices which we refer to as CameraChip™ image sensors, capture an image electronically and are used in a number of consumer and commercial mass-market applications. Our CameraChip image sensors are manufactured using the complementary metal oxide semiconductor, or CMOS, fabrication process and are predominantly single-chip solutions that integrate several distinct functions including image capture, image processing, color processing, signal conversion and output of a fully processed image or video stream. We have also integrated our CameraChip image sensors with wafer-level optics, which we refer to as CameraCubeChip™ imaging devices. Our CameraCubeChip imaging device is a small footprint, total camera solution that we believe will enable the further miniaturization of camera products. We believe that our highly integrated image sensors and imaging devices enable camera device manufacturers to build high quality camera products that are smaller, less complex, more reliable, more cost-effective and more power-efficient than cameras using traditional charge-coupled devices, or CCDs.
Proposed Acquisition by Hua Capital Management, CITIC Capital and GoldStone Investment
On April 30, 2015, we entered into a definitive agreement, or Merger Agreement, to be acquired by a consortium composed of Hua Capital Management Co., Ltd., or Hua Capital Management, CITIC Capital Holdings Limited, or CITIC Capital, and GoldStone Investment Co., Ltd., or GoldStone Investment, or collectively, the Consortium. Under the terms of the Merger Agreement, OmniVision stockholders will receive $29.75 per share in cash, or a total of approximately $1.9 billion. The agreement was unanimously approved by our Board of Directors. The transaction, which is expected to close in the third or fourth quarter of fiscal 2016, is subject to approval by OmniVision stockholders, regulatory approvals, including antitrust review in the U.S. and the People's Republic of China, review and clearance by the Committee on Foreign Investment in the U.S., clearance or approval under applicable Taiwan law, and other customary closing conditions.
During the year ended April 30, 2015, we incurred approximately $6.1 million of transaction related costs, which was recorded as part of selling, general and administrative expenses in our Consolidated Statements of Income.
Current Economic Environment
We operate in a challenging economic environment that has undergone significant changes in technology and in patterns of global trade. We remain a leader in the development and marketing of image sensing devices based on the CMOS fabrication process and have benefited from the growing market demand for and acceptance of this technology.
A significant amount of our revenues is derived from markets outside of the United States, in particular from the Asian markets. These markets are extremely competitive and we continue to see entrance of new competitors. Due to our reliance on sales in these markets, a slowdown in demand in these markets could have an adverse effect on our financial results. For example, in the third quarter of fiscal 2015, demand for our products slowed down in the China market, possibly attributable to the competitive environment faced by our customers and a protracted upgrade cycle for the local wireless infrastructure. This demand slowdown in the region had negatively impacted our revenues. Given our
4
long-term relationships and established ecosystem in China, we believe that demand for our products in the region will resume. Indeed, for the first quarter of fiscal 2016, business seems to be recovering. However, due to our limited visibility and the intense competition in the market, we expect that volatility in the China market, as well as other Asian markets, will continue, at least in the near future.
In the past, we have experienced fluctuations in our financial results due in part to changing macroeconomic conditions. As macroeconomic conditions have improved, our sales have generally also tended to improve and when macroeconomic uncertainties have returned, our sales have generally tended to be negatively impacted, although that has not always been the case. For example, in fiscal 2014, macroeconomic conditions appeared to continue to improve, and our annual sales increased slightly when compared to fiscal 2013. However, for the second half of fiscal 2014, we actually experienced a decline in sales when compared to the similar period in fiscal 2013. Given the continuing uncertainties in the current economic environment and the volatility in our business, we remain cautious and we expect our customers to be cautious as well, which could affect our future results.
Market Environment
We sell our products worldwide directly to OEMs, which include branded customers and contract manufacturers, and value added resellers, or VARs, and indirectly through distributors. In order to ensure that we address all available markets for our image sensors, we organize our marketing efforts into end-use market groups, each of which concentrates on a particular product or, in some cases, customers within a product group. Thus, we have marketing teams that address the mobile phone market, the entertainment market, the notebook and webcam market, the digital still camera, or DSC, market, the security and surveillance market, and the automotive and medical markets.
In the mobile phone market in particular, future revenues depend to a large extent on an extensive design win process where a particular mobile phone maker determines which image sensor to design into one or more specific models. The time lag between design win and volume shipments varies from as little as three months to as much as 12 months, which could cause an unexpected delay in generating revenues, especially during periods of product transitions. Design wins are also an important driver in the many other markets that we address. In some markets, such as automotive or medical applications, the time lag between a particular design win and revenue generation can be longer than one year.
The overwhelming majority of our sales depend on decisions by the engineering designers for manufacturers of products that incorporate image sensors to specify one of our products rather than one made by a competitor. In most cases, the decision to specify a particular image sensor requires conforming other specifications of the product to the chosen image sensor and makes subsequent changes both difficult and expensive. Accordingly, the ability to produce and deliver reliable products in large quantities and in a timely manner is a key competitive differentiator. Since our inception, we have shipped more than 5.7 billion image sensors, including approximately 872 million in fiscal 2015. We believe that these quantities demonstrate the capabilities of our production system, including our sources of offshore fabrication.
We outsource the wafer fabrication and packaging of our image-sensor products to third parties and our investee companies. We outsource the color filter and micro-lens phases of production to VisEra Technologies Company, Ltd., or VisEra, our joint venture with Taiwan Semiconductor Manufacturing Company Limited, or TSMC. This approach allows us to focus our resources on the design, development, marketing and testing of our products and to significantly reduce our capital requirements.
To increase and enhance our production capabilities, we work closely with TSMC, our principal wafer supplier and one of the largest wafer fabrication companies in the world, to increase, as necessary, the number of its fabrication facilities at which our products can be produced. In addition, we outsource some of our wafer fabrication needs to Powerchip Technology Corporation, or PTC. Since
5
the first quarter of fiscal 2015, we have also started to ship products that were fabricated by Shanghai Huali Microelectronics Corporation, or Huali, and Wuhan Xinxin Semiconductor Manufacturing Corporation, or XMC. Huali and XMC are the newest additions to our list of qualified wafer fabrication suppliers. Our investments in VisEra and two other key back-end packaging suppliers are part of a broad strategy to ensure that we have sufficient back-end capacity for the processing of our image sensors. To enhance our CameraCubeChip production capabilities, we acquired from VisEra in October 2011 its CameraCubeChip production and assembly operations, which we had previously outsourced to them.
We currently perform the final testing of our packaged products at our own facility in China. As necessary, we will make further investments to expand our testing and production capacity, as well as our overall capability to design additional custom products for our customers.
Since our customers' end-user customers market and sell their products worldwide, our revenues by geographic location are not necessarily indicative of the geographic distribution of end-user sales, but rather indicate where the products and/or their components are manufactured or sourced. The revenues we report by geography are based on the country or region in which our customers issue their purchase orders to us. Recently, our sales mix for products that are used in devices made by end-user customers located in the China market has increased. We anticipate that this market will continue to be a substantial source of our future revenues. In addition, we expect that the India market will become a more significant source of future revenues for us over the next few years.
Many of the products using our image sensors, such as mobile phones, entertainment applications such as tablets and wearable devices, notebooks and webcams, and DSCs are consumer electronics goods. These mass-market camera devices generally have seasonal cycles which historically have caused the sales of our customers to fluctuate quarter-to-quarter. In addition, since a very large number of the manufacturers who use our products are located in China and Taiwan, the pattern of demand for our image sensors has been increasingly influenced by the timing of the extended lunar or Chinese New Year holiday, a period in which the factories which use our image sensors generally close. Consequently, demand for our image sensors has historically been stronger in the second and third quarters of our fiscal year and weaker in the first and fourth quarters of our fiscal year. However, due to macroeconomic uncertainties and changes in our end-user customer demands in the past several years, the seasonal cycle of our business has been less predictable. For example, in fiscal 2014, we experienced a decline in sales of products that were used in mobile phones made by end-user customers located in North America, which was partially offset by an increase in the sale of products that were used in mobile phones made by end-user customers located in China. This change in end-user demand mix altered our quarterly sales pattern in fiscal 2014. Then, in the third quarter of fiscal 2015, when demand for our products slowed down in the China market, our quarterly sales pattern was altered again. Given the current economic environment and continued changes in our end-user demands, we remain cautious toward our near-term business prospects and the return of the historical seasonal cycle of our business. While we believe that the market opportunities represented by mobile phones and entertainment applications such as tablets and wearable devices remain very large, the opportunities presented could be deferred because of the uncertainty surrounding the sustainability of the current global economic recovery.
We believe that, like the DSC market, mobile phone, tablet, notebook and webcam demand will not only continue to shift toward higher resolutions, but also will increasingly fragment into multiple market segments with differing product attributes. For example, we see the further expansion of the smartphone segment within the mobile phone market. In addition, there is increased demand for customization, and several different interface standards are coming to maturity. All of these trends will require the development of a broader variety of products.
6
As the markets for image sensors have grown, we have experienced competition from manufacturers of CMOS and CCD image sensors. Our principal competitors in the market for CMOS image sensors include ON Semiconductor, Samsung, Sharp, Sony, STMicroelectronics and Toshiba. We expect to see continued price competition in the image-sensor market for mobile phones, entertainment devices, notebooks and webcams, security and surveillance systems, digital still and video cameras, automotive and medical imaging systems as those markets continue to grow. Although we believe that we currently compete effectively in those markets, our competitive position could be impaired by companies that have greater financial, technical, marketing, manufacturing and distribution resources, broader product lines, better access to large customer bases, greater name recognition, longer operating histories and more established strategic and financial relationships than we do. Such companies may be able to adapt more quickly to new or emerging technologies and customer requirements or devote greater resources to the promotion and sale of their products. Many of these competitors own and operate their own fabrication facilities, which in certain circumstances may give them the ability to price their products more aggressively than we can or may allow them to respond more rapidly than we can to changing market opportunities.
In addition, from time to time, other companies enter the CMOS image-sensor market by using obsolete and available manufacturing equipment. While these efforts have rarely had any long-term success, the new entrants do sometimes manage to gain market share in the short-term by pricing their products significantly below current market levels which may put additional downward pressure on the prices that we can obtain for our products.
In common with many other semiconductor products and as a response to competitive pressures, the average selling prices, or ASPs, of image-sensor products have declined steadily since their introduction, and we expect ASPs to continue to decline in the future, especially if sales of mobile phones that use our products continue to shift from those made by end-user customers located in North America to those made by end-user customers located in Asia where we continue to experience strong pricing pressure. Some of this ASP decline may be offset by the adoption of some of our newer and higher resolution products such as our CameraCubeChip products, which carry a higher ASP because of the added value from the attachment of wafer-level optics to our image sensors. Depending on the adoption rate and unit volume, we believe these products could help to mitigate the rate of ASP decline. In order to maintain or grow our revenues, we need to increase the number of units we sell by a large enough amount to offset the effect of declining ASPs.
Separately, in order to maintain our gross margins, we and our suppliers must work continuously to lower our manufacturing costs and increase our production yields. In fiscal 2013, we requested our suppliers to invest in additional equipment in connection with the production of our OmniBSI-2™ products. Such investment resulted in higher product costs for these products. Because we experienced increased sales of our OmniBSI-2 products since fiscal 2013, and expect these products to continue to constitute a significant percentage of our total sales in fiscal 2016, we anticipate that our gross margins will remain at lower levels than we have experienced historically, before our introduction of OmniBSI-2. Partially offsetting this is our recent introduction of our PureCel products, which products have higher gross margins than our OmniBSI-2 products and whose shipping volumes have continued to increase. If we are unable to spread the added cost of our OmniBSI-2 products over larger unit sales, successfully negotiate lower prices for these products with our suppliers, or increase sales of higher gross margin products such as our PureCel products, our gross margin may continue to stay at these lower levels for future periods as well. In addition, if we are unable to timely develop and introduce new products that can take advantage of smaller process geometries or new products that incorporate more advanced technology and include more advanced features that can be sold at higher ASPs, our gross margin may decline.
Having the ability to forecast customer demand correctly and to prepare the appropriate level of inventory to meet this demand is also important in the semiconductor industry. At times, the
7
semiconductor industry may experience supply constraints, and if we were unable to manage our products appropriately to meet our customers' product demands, our relations with our customers and their end-user customers may be harmed and we may be unable to achieve future sales growth, which could result in our revenues, gross margins and other financial results being materially and adversely affected. Conversely, an excess in inventory supply can also adversely affect our performance. For example, during the second quarter of fiscal 2012, certain of our key customers unexpectedly cut back their orders. In addition to reducing our unit sales of our OmniBSI™ and OmniPixel3-HS™ based products and adversely affecting our revenues for the second and third quarters of fiscal 2012, the cutback also resulted in our inventories at the end of the second and third quarters of fiscal 2012 being higher than we intended them to be. During the fourth quarter of fiscal 2012 and during fiscal 2013, we also increased significantly our OmniBSI-2 inventories as we prepared for anticipated increases in the sales of these products. However, since customer demand can be volatile, we may be unable to sell inventories that were built in excess of demand, or we may have to sell at lower prices to eliminate excess inventories. Under such circumstances, we may be required to record significant provisions for excess and obsolete inventories. This could materially and adversely affect our results of operations and financial condition. We expect the business environment to remain volatile in fiscal 2016, especially in the consumer-oriented product markets, which could continue to affect our ability to accurately forecast customer demand.
Given the rapidly changing nature of our technology, there can be no assurance that we will not encounter delays or other unexpected production yield issues with future products. In general, during the early stages of production, production yields and gross margins for new products are typically lower than those of established products. During production, we can also encounter unexpected manufacturing issues, such as unexpected back-end yield problems.
In addition, in preparation for new product introductions, we gradually decrease production of established products. Due to our 12-14 week production cycle, it is extremely difficult to predict precisely how many units of established products we will need. It is also difficult to accurately predict the speed of the ramp of new products. Given the current economic uncertainty, the visibility of our business outlook is extremely limited and forecasting is even more difficult than under normal market conditions. As a result, it is possible that we could suffer from shortages of certain products and build inventories in excess of demand for other products. We carefully consider the risk that our inventories may be in excess of expected future demand and record appropriate reserves. If, as sometimes happens, we are subsequently able to sell these reserved products, the sales have little or no associated cost and consequently, they have a favorable impact on gross margins.
Technology and Product Lines
CameraChip image sensors
All traditionally designed CMOS image sensors capture light on the front side of the chip, so the photo-sensitive portion has to share the surface of the image sensor with the metal wiring of the transistors in the imaging pixel and the metal wiring acts to limit the amount of image light that reaches the photo-sensitive portion of the image sensor. This type of pixel architecture is referred to as the front side illumination, or FSI, architecture. Our FSI products that are currently in production are based primarily on the OmniPixel3-HS pixel architecture, which we introduced in February 2008. In April 2014, we introduced a new FSI pixel architecture, the OmniPixel3-GS™, which is a global shutter pixel architecture capable of capturing smear-free images.
In May 2008, we announced a new approach to CMOS image sensor design we call OmniBSI technology. OmniBSI technology is based on an idea called back side illumination, or BSI. With our OmniBSI architecture, the image sensor receives light through the back side of the chip. As a result, there is no metal wiring to block the image light, and the entire backside of the image sensor can be
8
photo-sensitive. Not only does this enable us to produce a superior image, it also permits the front of the chip surface area to be devoted entirely to processing, and permits an increase in the number of metal layers, both of which result in greater functionality. Capturing light on the back side of the image sensor also allows us to reduce the distance the light has to travel to the imaging pixels, and thus provide a wider angle of light acceptance. Widening the angle of light acceptance in turn makes it possible to reduce the height of the camera module, and thus the height of the device which incorporates the camera module.
Since 2008, we have continued to refine our BSI technology. In February 2010, we announced our OmniBSI-2 architecture which represents our second-generation BSI technology and enables us to design imaging pixels as small as 1.1 µm in dimension. In January 2012, we introduced new image sensors based on OmniBSI+™, our improved 1.4 µm OmniBSI architecture.
In November 2013, we launched our PureCel™ image-sensor product line. Our PureCel sensors are based on advanced technology platforms and updated pixel array architectures and designs. Compared to our OmniBSI-2 based products, our PureCel products have increased unit area light sensitivity and lower power consumption.
In October 2014, we extended our PureCel product family with PureCel-S™. PureCel-S products are based on a stacked-die concept to further improve the performance of the image sensor. With this stacked-die structure, image processing is handled by a logic chip stacked beneath the image sensor, allowing for additional functionality to be implemented. This arrangement also allows for improvements in image-capturing quality and processing speeds, as well as thinner form factors for consumer products.
CameraCubeChip Technology
In February 2009, we announced the introduction of our CameraCubeChip technology. This is a three-dimensional, reflowable, total camera solution that combines the full functionality of our CameraChip image sensors and wafer-level optics in one compact, small-footprint package. Our CameraCubeChip devices can be soldered directly to printed circuit boards, with no socket or insertion requirements. We believe our CameraCubeChip solution can streamline the mobile phone manufacturing process, thus resulting in lower cost and faster time-to-market for our customers. Currently the market for CameraCubeChip devices is still nascent, but going forward we see significant opportunities in the mobile phones and entertainment applications, such as tablets and wearable devices.
Other
In March 2010, we acquired Aurora Systems, Inc., or Aurora, a privately-held company incorporated in California. Aurora is a supplier of liquid crystal on silicon, or LCOS, devices for use in mobile projection applications and high definition home theater projection systems. With the acquisition of Aurora, we acquired advanced image projection technology to capitalize on trends in the emerging video-projection consumer market.
In January 2013, we introduced a dual-camera video sharing technology that we call Video-in-Video, or ViV™. ViV allows for the combination of video feeds from both the front- and rear-facing cameras into a single video stream.
9
Product Design
Mixed Analog/Digital Circuit and CMOS Image Sensor Design
We have the in-house expertise to design complex analog and digital semiconductor circuits. This in-house expertise enables us to process video data in both analog and digital domains, which has allowed us to optimize each aspect of analog and digital chip design. We have also developed in-house expertise in the mixing of analog and digital signals in the same semiconductor design without suffering the common problems of interference from noise caused by heat or cross-talk. Our in-house semiconductor design engineers are skilled in the design of high speed, low power, and mixed analog/digital image sensors with advanced pixel cell structures. We use advanced design techniques to develop high-speed, highly integrated semiconductors which can be fabricated using standard CMOS processes. The result has been a combination of improved image quality coupled with a reduction in unwanted electrical noise.
Advanced Image Processing
We have developed a broad range of proprietary technologies for image processing. For example, we developed algorithms to produce high dynamic range images and to enable gesture-cognitive applications. We also put significant emphasis on low power consumption and high efficiency in our image signal processing.
Integrated Camera Solutions
We have also developed a significant level of in-house expertise in applied optical science with proprietary technologies to integrate our image sensors with wafer-level optics. We now offer total camera solutions which we market as CameraCubeChips, and are tailored to our customers' specific imaging requirements.
Products
Our main products, CameraChip image-sensing devices, are used to capture images electronically and are used in a number of consumer and commercial mass-market applications. Our image-sensor products have a variety of features, including:
| CMOS CameraChip image sensors | Color or black and white | |
Illumination Technique |
Front side illumination or back side illumination |
|
Resolutions |
CIF (352 × 288 pixels) to 23-megapixels (5,632 × 4,224 pixels) |
|
Output signal |
Analog and digital |
|
Operating voltage |
5 volt to 1.2 volt |
|
Optical lens/array size |
1/18 to 1/2.3 inch formats |
|
In addition, we design and develop another category of products which we refer to as CameraCubeChip imaging devices. They are image sensors with integrated wafer-level optics. We also supply companion chips used to connect our image sensors to various interfaces, including the universal serial bus, or USB, a connection which allows add-on devices to be connected to notebook and webcams and other industry standard interfaces such as the Mobile Industry Processor Interface, or
10
MIPI, and low-voltage differential signaling, or LVDS. In addition, we provide companion digital signal processors, or DSP, that perform compression in standardized still photo and digital video formats.
We also design and develop standard software drivers for Linux, Mac OSX and Microsoft Windows, as well as for embedded operating systems such as Android, Blackberry OS, Symbian, Windows CE, Windows Embedded and Windows Mobile. These software drivers accept the image data being received from the USB, provide data decompression, if required, and manage interface protocols with the camera. We have designed these drivers for speed and flexibility and to allow easy customization of the user interface. We do not record any revenue from this software, which we provide to our customers as an element of customer support.
In fiscal 2014, we incorporated our first display solution into our product portfolio, in the form of a LCOS chipset. It is based on continued development of technologies that we acquired from Aurora.
New Products
In May 2014, we introduced the OV5670, our first 5-megapixel PureCel image sensor with 1.12-µm pixels. The 1/5-inch OV5670 is designed for both front- and rear-facing camera applications in smartphones and tablets. It is capable of capturing full resolution 5-megapixel images at 30 frames per second, or FPS, quad high definition, or HD, video at 30 FPS, cropped 1080p HD at 60 FPS, or 720p HD at 60 FPS.
In May 2014, we also introduced the OV10640, our first automotive image sensor built on OmniBSI technology, and the OV490, a companion chip that enables high-quality image and video processing. The 1.3-megapixel OV10640 can reproduce high dynamic range, or HDR, scenery with up to 120 dB, and is capable of recording full-resolution 1.3-megapixel video at 60 FPS. The OV490 is a companion processor that enables simultaneous output of fully processed YUV or RGB data for display-based applications and RAW data for machine-vision downstream processing.
In June 2014, we introduced the OV2740, a full high-definition PureCel image sensor with 1.4-µm backside illuminated pixels. Designed for front-facing cameras in smartphones, tablets, and notebooks, the OV2740 can record 1080p HD video at 60 FPS and 720p HD video at 90 FPS. It also has a light-sensing mode and a ultra-low power mode, allowing it to be used in motion detection or gesture control applications. Additionally, the OV2740 is stereo ready with frame synchronization, making it capable of supporting depth perception applications.
In August 2014, we introduced the OV7676, a 1/7.5-inch VGA image sensor based on our 3-µm OmniPixel3-HS pixel technology. The OV7676 can be used in a wide range of applications, including mobile phones, tablets, wearables, notebooks, and IP network cameras. It is also equipped with ViV.
In September 2014, we introduced the OVM6211 CameraCubeChip, a CameraCubeChip imaging device based on our OmniPixel-3GS global shutter pixel architecture. The OVM6211 is capable of capturing 400 × 400 video at 120 FPS, and has an ultra-low power mode for machine and computer vision applications.
In October 2014, we introduced the OV13860, our first 13-megapixel PureCel-S image sensor with 1.3-µm pixels. The 1/2.6-inch OV13860 leverages our stacked-die technology, which separates the imaging array from the image sensor processing pipeline into a stacked-die structure. The OV13860 is designed for premium smartphones, and is capable of capturing full resolution 13-megapixel still images at 30 FPS, or record ultra-high resolution 4k2K video at 30 FPS, 1080p full HD at 60 FPS, or 720p HD at 120 FPS.
In October 2014, we also introduced the OV16850, a 16-megapixel PureCel-S image sensor in a native 16:9 format, designed for premium smartphones. The 1/2.6-inch OV16850 is based on our 1.12-µm pixel architecture, and leverages our stacked-die technology. It is capable of capturing
11
full-resolution 16-megapixel images at 30 FPS, 4K2K video at 30 FPS, quad HD video at 60 FPS, and 720p video at 120 FPS.
In October 2014, we introduced two additional sensors designed specifically for automotive applications, the 1.3-megapixel OV10642 and the WVGA OV10625. These OmniHDR™ automotive high dynamic range sensors use a special red-clear filter that is required for many forward-looking automotive applications. The 1/2.6-inch OV10642 supports an active array of 1280 × 1080 pixels and the 1/3.2-inch OV10625 supports an active array of 752 × 548 pixels.
In October 2014, lastly, we introduced the OV9750, a 1/3-inch image sensor based on our 3.75-µm OmniPixel3-HS pixel technology. The OV9750 is designed for the security market and can capture both visible and near-infrared video in HD format. It is capable of operating in a 1280 × 960 resolution at 60 FPS with 10-bit output, or at 45 FPS with 12-bit output.
In November 2014, we introduced the OV23850 and OV21840, a family of PureCel-S image sensors designed for premium smartphones, with resolutions of 23.8 megapixels and 21.4 megapixels, respectively. The OV23850 and OV21840 PureCel-S sensors leverage our stacked-die technology, which separates the imaging array from the image sensor processing pipeline into a stacked-die structure. This enables additional sensor functionalities, such as phase detection autofocus, two-dimensional contrast fast autofocus and HDR video, while maintaining a small footprint. The 1/2.3-inch OV23850 supports an active array of 5632 × 4224 pixels, operating at 24 FPS. The 1/2.4-inch OV21840 supports an active array of 5344 × 4016 pixels, operating at 27 FPS. Both the OV23850 and OV21840 are also capable of recording quad HD video at 30 FPS in HDR mode, 720p HD video at 120 FPS, and 1080p HD video at 90 FPS.
In March 2015, we introduced the OV16880, our first image sensor with 1-µm pixels. The 1/3-inch OV16880 is a 16-megapixel PureCel-S image sensor with advanced features such as phase detection autofocus and fast contrast autofocus. It also uses buried color filter array technology to reduce pixel crosstalk and improve signal-to-noise ratio performance. The OV16880 is capable of capturing 16-megapixel images at 30 FPS, 4K video at 30 FPS, 1080p video at 90 FPS, and 720p video at 120 FPS.
Strategic Investments and Acquisitions
Joint Venture with TSMC
In October 2003, we entered into an agreement with TSMC, to form VisEra, a joint venture in Taiwan, for the purposes of providing certain manufacturing and automated final testing services related to CMOS image sensors. In August 2005, we and TSMC formed VisEra Holding Company, or VisEra Cayman, a company incorporated in the Cayman Islands, and VisEra became a subsidiary of VisEra Cayman. We and TSMC have equal interests in VisEra Cayman.
In June 2011, we entered into an agreement with VisEra to acquire from VisEra its CameraCubeChip production operations. We introduced the CameraCubeChip imaging devices near the end of fiscal 2009, and we had been outsourcing the production to VisEra. With the acquisition, we enhanced our CameraCubeChip production capabilities. See Note 5—"Long-Term Investments," and Note 16—"Related Party Transactions" to our consolidated financial statements.
Acquisition of Aurora
In March 2010, we acquired Aurora. Aurora designed, marketed and sold LCOS-based microdisplay panels. These microdisplay panels are used for projection applications in consumer electronics, industrial, aerospace and mobile viewing platforms. We believe there is an emerging trend for video-projection applications in the consumer market. The advanced image projection technology we acquired through Aurora is intended to enable us to capitalize on this trend.
12
Acquisition of Kodak Patents
In March 2011, we acquired certain image-sensor related patents and patent applications from Eastman Kodak Company, or Kodak. In connection with the acquisition, we granted to Kodak world-wide, non-exclusive royalty-free licenses, without the right to sublicense, to use the purchased patents to manufacture and sell current image-sensor products and other Kodak products incorporating image sensors.
Industry Background
Image Sensor Technologies
Digital imaging enables the capture of still or moving images without the use of photographic or chemical-based films. The two most common electronic image sensors, both developed in the late 1960s, are CCD and CMOS image sensors. Both image sensors are silicon-based semiconductor devices that convert light to an electric charge for display or storage.
CMOS image sensors are typically less expensive to produce and consume significantly less power than CCDs. When originally introduced, the quality of CMOS image sensors lagged behind that of CCDs, but in recent years, advances in semiconductor manufacturing processes and design techniques have led to significant improvements in CMOS image sensor performance and image quality. Smaller circuits and better current control made it possible to design CMOS image sensors that provide image quality comparable to that of CCDs of comparable resolution. As a result, CMOS image sensors are now widely used in camera-equipped mobile phones, entertainment applications such as tablets, notebooks and webcams, DSCs, security and surveillance systems, and increasingly in automotive and medical applications, all areas where high image quality, low power consumption, small size and low cost are important considerations.
Most conventional CMOS image sensors operate on FSI technology, in which the image sensor captures light on the front side of the chip, so the photo-sensitive portion has to share the surface of the image sensor with the metal wiring of the transistors in the pixel. Currently, the most advanced CMOS image sensors operate on the BSI technology in which, as its name implies, the image sensor captures light on the back side of the chip. The advantages of BSI technology over conventional FSI technology are discussed in more detail under the sub-heading "Technology and Product Lines" on page 8 above.
CMOS Image Sensors versus CCD Image Sensors
One of the critical differences between CCD and CMOS image sensors is the way in which each processes an electrical charge, or a signal. Cameras employing CCDs require an additional integrated circuit called an analog-to-digital converter to convert a signal from analog to digital format. In contrast, image sensors based on the CMOS manufacturing process are able to integrate a number of functions on one device, enabling all of the conversion circuitry to be incorporated in a single image sensor chip. This high level of integration reduces the overall number of components and system complexity, and reduces the space required for them. We have seen multiple markets, such as security, automotive, as well as DSCs, transitioning away from CCDs, a process that we expect to continue.
Market Opportunity
Demand for CMOS image sensors for use in mobile phones continued to account for a substantial portion of our revenue in fiscal 2015. Other applications and markets that we are currently serving or that are developing include embedded applications for entertainment devices such as tablets and wearable devices, notebooks and webcams, security and surveillance, DSCs, and automotive and medical applications. As device manufacturers become increasingly aware of the numerous advantages
13
associated with single chip CMOS image sensor solutions, such as high image quality, accelerated time to market, efficient design and manufacturability, smaller size, lower power consumption and reduced cost, we believe these markets offer significant additional opportunities for mass-market applications for CMOS image sensors.
Customers
We sell directly to OEMs and VARs and indirectly through distributors. OEMs include branded camera device manufacturers and contract manufacturers. Often times, contract manufacturers and distributors serve multiple end-user customers in the consumer device markets, and end-user customers also engage multiple contract manufacturers and distributors. During fiscal 2015, we shipped approximately 872 million image sensors, an increase of 1.3% from approximately 861 million image sensors in fiscal 2014.
In fiscal 2015, we derived approximately 75.3% of our revenues from sales to OEMs and VARs and approximately 24.7% of our revenues from sales through distributors. The two OEM customers that accounted for 10% or more of our revenues in fiscal 2015 were Foxconn Technology Group and Ningbo Sunny Opotech Co., Ltd., which accounted for approximately 13.8% and 11.5% of our revenues, respectively. The one distributor that accounted for 10% or more of our revenues in fiscal 2015 was World Peace Industrial Group, which accounted for approximately 13.3% of our revenues. No other OEM, VAR or distributor accounted for 10.0% or more of our fiscal 2015 revenues.
Sales and Marketing
We sell our products through a direct sales force and indirectly through distributors. As of April 30, 2015, our sales and marketing organization had a total of 218 full-time employees. We also had 13 independent distributors, 11 of which are located outside the United States.
Sales outside of the United States represented approximately 99.7%, 99.7% and 99.1% of our revenues in fiscal 2013, 2014 and 2015, respectively. We expect that sales outside of the United States will continue to account for a very large proportion of our revenues. We use distributors outside the United States principally to facilitate the logistics of the transactions in question and provide credit to end-user customers. These distributors also assume responsibility for collections, product returns and customer support. In addition to our standard product marketing, we also participate in tradeshows and other industry events to promote our imaging solutions.
Research and Development
We have designed the internal structure of our CMOS CameraChip and CameraCubeChip image sensors in a modular fashion. The major functions, such as image capture, image sensor control logic, color processing, analog output, digital output and programming control, are stand-alone circuits that we can rapidly modify for use in new product developments. We design circuit improvements so that we can transfer them readily to other CameraChip image sensor products to help reduce total development time and cost for new products. Our CameraCubeChip imaging devices also include integrated wafer-level optics. We developed our wafer-level optical technology with scalability and manufacturability in mind, enabling us to introduce a larger portfolio of CameraCubeChip products in the future. As of April 30, 2015, we had a total of 756 full-time employees engaged in research and development. Research, development and related expenses for fiscal 2013, 2014 and 2015 were approximately $113.2 million, $119.2 million and $135.6 million, respectively.
Intellectual Property
Our success and future revenue growth will depend, in part, on our ability to protect our intellectual property. We rely on a combination of patents, copyrights, trademarks and trade secrets, as
14
well as nondisclosure agreements and other methods, to protect various aspects of our CameraChip and CameraCubeChip image sensors. As of April 30, 2015, we have been issued 746 United States patents which expire between October 2015 and April 2034. We have also received 1,242 foreign patents which expire between April 2016 and September 2033. As of April 30, 2015, we have 249 additional United States patent applications pending, of which 10 have been allowed, and we have 898 foreign patent applications pending, of which 40 have been allowed.
We have in the past been, currently are and may in the future be, subject to legal proceedings and claims with respect to our intellectual property, including such matters as trade secrets, patents, product liabilities and other actions arising out of the normal course of business. These claims may increase as our intellectual property portfolio becomes larger or more valuable. Intellectual property claims against us, and any resulting lawsuit, may cause us to incur significant expenses, subject us to liability for damages and invalidate our proprietary rights. Any potential intellectual property litigation against us would likely be time-consuming and expensive to resolve and would divert management's time and attention.
Manufacturing
Wafer Fabrication
Our semiconductor products are fabricated using standard CMOS processes, which permit us to engage independent wafer foundries to manufacture our semiconductors. We primarily outsource our wafer manufacturing for image sensors to TSMC. We also outsource to PTC, Huali and XMC.
Color Filter Application
The majority of our fiscal 2015 image sensor sales were color image sensors, which, in addition to a micro-lens, require a color filter to be applied to the wafer before packaging. The color filter application uses a series of masks to place red, green and blue dyes on the individual pixels in an industry-standard Bayer pattern. In the final step, a micro lens is applied to each pixel. We outsource these manufacturing steps primarily to VisEra.
Wafer Probe Testing
After wafer fabrication, color filter application, if required, and micro-lens application, wafers are designated for either unpackaged or packaged deliveries. For unpackaged deliveries, referred to as chip-on-board, or COB, the wafers are tested using a process called wafer probe testing. The process identifies the good die on each wafer. We outsource wafer probe testing primarily to King Yuan Electronics Co., Ltd. and Tong Hsing Electronic Industries, Ltd., or Tong Hsing. We then rely on Tong Hsing to prepare the good die as identified during the wafer probe testing for final delivery in a format referred to as reconstructed wafers.
Packaging
We support various packaging methods that are widely used for optical image sensor chips. In the case of chip scale packaged, or CSP, products, the wafers are packaged and then diced into chips. These packages have a glass lid to allow light to pass through to the image sensor array. We rely primarily on XinTec, Inc., or XinTec, an investee company, for our CSP products. We also use China WLCSP Limited, or WLCSP, another investee company, for certain of our CSP products. For other plastic and ceramic packaged products, the wafers are diced first and then packaged. We rely primarily on Lingsen Precision Industries Co., Ltd., or Lingsen, and Tong Hsing for such packaging services.
See Note 5—"Long-Term Investments" to our consolidated financial statements for a further description of our relationships with XinTec and WLCSP.
15
CameraCubeChip Assembly
We introduced our CameraCubeChip imaging devices near the end of fiscal 2009. To enhance our CameraCubeChip production capabilities, we acquired from VisEra in October 2011 its CameraCubeChip production operations, which we had previously outsourced to them.
Final Testing
High volume final product testing is a critical element in the production of our image sensors. Having this capability is a substantial barrier to entry for potential competitors. Production final testing instruments designed for conventional CMOS devices are not sufficient for testing image sensors, because an optical image must be captured and checked in addition to checking the standard logic and electrical functions. For our packaged products and CameraCubeChip imaging devices, we have installed high-throughput automated final test equipment built to our specifications at our testing facility in Shanghai, China. The final test equipment have automated handling capability, a lighting and lens system, a changeable image source and automated output sorting by functionality. The system is programmable so that testing criteria and methodology can be changed easily to accommodate new products or special testing requirements.
Product Quality Assurance
We focus on product quality through all stages of the design and manufacturing process. We submit all our designs to in-depth circuit simulation before we commit them to silicon. Before we commit a new product to production, we fabricate test wafers, package test chips and test the final product. We keep initial production runs to a minimum until sufficient products have completed the entire manufacturing and testing process and met the product specifications. It is only then that we will commit the product to full production runs.
We qualify each of our subcontractors through a series of industry standard environmental product stress tests, as well as through an audit and an analysis of the subcontractor's quality system and manufacturing capability. We also participate in quality and reliability monitoring through each stage of the production cycle by reviewing electrical parametric data from our foundries and other subcontractors.
Competition
We operate in an industry characterized by intense competition, rapid technological changes, evolving industry standards, declining ASPs and rapid product obsolescence. Our competition comes both from CMOS and CCD image sensor manufacturers:
- •
- CMOS Image Sensor Manufacturers. Image sensor
manufacturers using CMOS technology include a number of well established companies such as ON Semiconductor, Samsung, Sharp, Sony, STMicroelectronics and Toshiba.
- •
- CCD Image Sensor Manufacturers. Image sensor manufacturers using CCD technology include a number of well-established companies, particularly vertically integrated camcorder and high-resolution DSC manufacturers. Our main competition from CCD manufacturers comes from Panasonic, Sharp and Sony.
Our competitors include many large domestic and international companies that have greater presence in key markets, greater access to advanced wafer foundry capacity, substantially greater financial, technical, marketing, manufacturing, distribution and other resources, better access to large customer bases, greater name recognition, longer operating histories and more established strategic and financial relationships than we do. As a result, they may be able to adapt more quickly to new or emerging technologies and customer requirements or devote greater resources to the promotion and sale of their products.
16
We believe that the principal factors affecting our competition in our markets include relationships with key OEMs that incorporate image sensors into mass-market applications, relationships with key distributors, relationships with semiconductor foundries and other participants in the semiconductor manufacturing chain, time to market, quality, total system design cost, product performance, customer support and supplier reputation. We believe that we compete effectively with respect to these factors.
Backlog
Sales are generally made pursuant to standard purchase orders. Our backlog includes only accepted customer orders with assigned shipment dates within the upcoming 12 months. As of April 30, 2014 and 2015, our backlog was approximately $343.2 million and $271.4 million, respectively. The decrease in our backlog reflects, in part, a decrease in product demand. Our current backlog is subject to cancellation or changes in delivery schedules, and may not necessarily be an indication of future revenue.
Employees
As of April 30, 2015, we had a total of 2,176 full-time employees, 458 located in the United States, and 1,718 in China, Germany, India, Japan, Norway, Singapore, South Korea, Taiwan and the United Kingdom. Our future success will depend, in part, on our ability to continue to attract, retain and motivate highly qualified technical and management personnel. None of our employees is represented by a collective bargaining agreement, and we have never experienced any material work stoppage. We believe that our employee relations are good.
Financial Information About Geographic Areas
Our long-lived assets, including our property, plant and equipment, net, long-term investments, land-use rights and other long-term assets are located in the following countries as of the dates indicated (in thousands):
| |
April 30, | |||||||||
|---|---|---|---|---|---|---|---|---|---|---|
| |
2013 | 2014 | 2015 | |||||||
China |
$ | 139,482 | $ | 162,207 | $ | 154,573 | ||||
Taiwan |
137,359 | 126,820 | 157,722 | |||||||
United States |
50,903 | 50,552 | 47,785 | |||||||
All other |
811 | 623 | 706 | |||||||
| | | | | | | | | | | |
Total |
$ | 328,555 | $ | 340,202 | $ | 360,786 | ||||
| | | | | | | | | | | |
| | | | | | | | | | | |
| | | | | | | | | | | |
For additional information about revenues and long-lived assets by geographic region/country, see Note 14—"Segment and Geographic Information" in Part II, Item 8 of this Form 10-K and "Management's Discussion and Analysis of Financial Condition and Results of Operations" in Part II, Item 7 of this Form 10-K. For a discussion about the risks associated with our foreign operations, see "Risk Factors" in Part I, Item 1A of this Form 10-K.
17
Executive Officers of the Registrant
The following persons are our executive officers as of the filing date of this report:
Name
|
Age | Position | |||
|---|---|---|---|---|---|
Shaw Hong |
77 | Chief Executive Officer and Director | |||
Raymond Wu |
60 | President | |||
Anson Chan |
46 | Vice President of Finance and Chief Financial Officer | |||
Y. Vicky Chou |
52 | Senior Vice President of Global Management and General Counsel | |||
Ray Cisneros |
52 | Senior Vice President of Worldwide Sales and Sales Operations | |||
John Li |
47 | Vice President of System Technologies | |||
Howard Rhodes |
66 | Chief Technical Officer | |||
Henry Yang |
50 | Chief Operating Officer and Director | |||
Zille Hasnain |
60 | Vice President of Quality and Reliability | |||
Shaw Hong, one of our cofounders, has served as one of our directors and as our Chief Executive Officer since May 1995, and as our President from May 1995 to December 2012. Mr. Hong holds a B.S. degree in electrical engineering from Jiao Tong University in China and an M.S. degree in electrical engineering from Oregon State University.
Raymond Wu, one of our cofounders, has served as our President since December 2012. From 2006 to 2012, Mr. Wu served as President of EU3C USA, Inc., a consumer electronics company. Prior to August 2006, Mr. Wu served as one of our directors since May 1995, and as our Executive Vice President since October 1999. Prior to October 1999, Mr. Wu was the head of our sales department and our engineering department. Mr. Wu received a B.S. degree in electrical engineering from Chung-Yuan University in Taiwan and an M.S. degree in electrical engineering from Wayne State University.
Anson Chan has served as our Vice President of Finance and Chief Financial Officer since October 2008 at which time he assumed the additional position of Chief Financial Officer. From February 2007 to present, Mr. Chan has served as our Vice President of Finance. From July 2006 to February 2007, Mr. Chan served as our Vice President of Business Strategy. From September 1997 to July 2006, Mr. Chan served in various positions with PricewaterhouseCoopers, LLP, a public accounting firm, most recently as a Senior Manager. Mr. Chan holds a B.S. degree in economics and a B.S. degree in engineering from the University of Pennsylvania and an M.B.A. degree in business strategy and operations management from the University of Chicago. Mr. Chan is also a Certified Public Accountant licensed in the State of California.
Y. Vicky Chou has served as our Senior Vice President of Global Management and General Counsel since February 2012. From August 2009 to February 2012, Ms. Chou served as our Vice President of Global Management and General Counsel. From June 2003 to August 2009, Ms. Chou served as our Vice President of Legal and General Counsel. From February 2003 to June 2003, Ms. Chou served as our Corporate Counsel. From August 1999 to January 2003, Ms. Chou was an attorney at Heller Ehrman White & McAuliffe LLP. From June 1997 to July 1999, Ms. Chou was an attorney/corporate specialist at Coudert Brothers LLP. Ms. Chou received a B.S. degree in anthropology from Temple University, an M.B.A. degree from St. Joseph's University and a J.D. degree from Santa Clara University.
Ray Cisneros has served as our Senior Vice President of Worldwide Sales and Sales Operations since February 2012. From August 2009 to February 20012, Mr. Cisneros served as our Vice President of Worldwide Sales. From September 2006 to August 2009, Mr. Cisneros served as our Vice President of Sales. From December 2004 to September 2006, Mr. Cisneros served as our Director of Sales and Marketing for North American Sales. Prior to December 2004, Mr. Cisneros held various sales positions since joining our company in October 2002 including key account management, regional
18
management and sales operations roles. Prior to joining our company, Mr. Cisneros held various senior management positions in the area of sales and marketing for companies in the fiber optics and semiconductor industries, including Sagitta, Inc., a provider of manufacturing equipment solutions for the fiber-optics industry, UMC, a semiconductor foundry, and Novellus Systems, Inc., a provider of manufacturing equipment for the semiconductor industry. Mr. Cisneros holds a B.S. in Metallurgical Engineering from Illinois Institute of Technology and an M.B.A. from Golden Gate University.
John Li has served as our Vice President of System Technologies since August 2009. From November 2004 to August 2009, Mr. Li served as our Senior Director of Applications Engineering. Prior to November 2004, Mr. Li held various senior engineering positions subsequent to joining our company in February 1997. Prior to joining our company, Mr. Li held various electrical engineering positions with companies in the semiconductor and electronics industries, including HuaKo Electronics Co. Ltd in Hong Kong, a manufacturer of semiconductor devices, and Fudan University in China. Mr. Li specialized in electrical engineering while attending Fudan University.
Dr. Howard Rhodes has served as our Chief Technical Officer since February 2012. From August 2005 to February 2012, Dr. Rhodes served as our Vice President of Process Engineering. Dr. Rhodes served as our Senior Director of Process Engineering from September 2004 to August 2005. Prior to joining OmniVision, Dr. Rhodes worked at Micron Technology, Inc., a provider of semiconductor solutions, from 1988 to 2004 as Director of Imager Engineering, and at Kodak Research Labs, a division of Eastman Kodak Company, an imaging company, from 1980 to 1988 as Process Integration Engineer where he was in charge of process development and process integration for high speed visible and IR sensitive CCD products. Dr. Rhodes earned his B.S., M.S, and Ph.D. degrees in Solid State Physics from the University of Illinois.
Dr. Henry Yang has served as our Chief Operating Officer since February 2012. In addition, Dr. Yang has served as one of our directors since his appointment in February 2010. From February 2007 to February 2012, Dr. Yang served as our Vice President of Engineering. From February 2003 to January 2007, Dr. Yang served as our Director of Engineering. Prior to February 2003, Dr. Yang held various engineering positions since joining our company in April 1996. Dr. Yang holds B.E., M.E. and Ph.D. degrees in Electrical Engineering from the Tsinghua University in China.
Zille Hasnain has served as our Vice President of Quality and Reliability since February 2012. Prior to joining OmniVision, Mr. Hasnain served as Senior Director of Quality Assurance and Customer Support from 1983 to January 2012 at Micron Technology, Inc., a provider of semiconductor solutions, where he worked to ensure all Micron DRAM, Flash and CMOS image sensor products met quality and reliability expectations when entering high volume shipments. Mr. Hasnain holds an M.B.A. in Business Administration with an emphasis on Quantitative Analysis from Washington State University.
This Annual Report on Form 10-K, including Management's Discussion and Analysis of Financial Condition and Results of Operations, contains forward-looking statements. These forward-looking statements are subject to substantial risks and uncertainties that could cause our future business, financial condition or results of operations to differ materially from our historical results or currently anticipated results, including those set forth below.
Risks Related to Our Pending Acquisition
Our pending acquisition is subject to various uncertainties, including closing conditions that are outside of our control, and there can be no assurances as to whether and when it may be completed.
On April 30, 2015, we entered into a Merger Agreement with entities that were formed on behalf of affiliates of the Consortium pursuant to which the Consortium will acquire us. The consummation of
19
the merger is subject to customary closing conditions and a number of the conditions are not within our control, and may prevent, delay or otherwise materially adversely affect the completion of the transaction. These conditions include, among other things:
- •
- the adoption of the Merger Agreement by the requisite affirmative vote of our stockholders;
- •
- the receipt of applicable approvals from regulatory bodies in the United States and the People's Republic of China;
- •
- the absence of any legal restraints or prohibitions on the consummation of the merger; and
- •
- our divestiture of certain of our investments in Taiwan.
In addition, it is possible that a change, event, fact, effect or circumstance could occur that could lead to a material adverse effect to us, which may give the Consortium the ability to not complete the merger. We cannot predict with certainty whether and when any of the required closing conditions will be satisfied or if another uncertainty may arise.
The Merger Agreement may also be terminated under specified circumstances, including by the Consortium if, among other things, an alternative proposal to acquire us is publicly commenced by a third party and we have not taken certain actions within a specified period of time.
If the merger does not receive, or timely receive, the required regulatory approvals and clearance, or if the Merger Agreement is terminated or another event occurs delaying or preventing the merger, such delay or failure to complete the merger may cause uncertainty or other negative consequences that may materially and adversely affect our sales, financial performance and operating results, and the price per share for our common stock and perceived acquisition value.
Additionally, if the merger is not completed for any reason, to the extent that the current market price of our common stock reflects an increase resulting from a market assumption that the transaction will be completed, the market price of our common stock may decline by the value attributed to this assumption, or could decline even more. Furthermore, we will be required to pay certain costs relating to the merger, whether or not it is completed, such as significant fees and expenses relating to legal, accounting and other services. In addition, we could be subject to litigation related to any failure to complete the merger. If the merger is not completed, these risks may materially and adversely affect our stock price, operating results and ongoing business.
Our obligation to pay a termination fee to the Consortium under certain circumstances could require us to use available cash that would have otherwise been available for general corporate purposes and may discourage other companies from trying to acquire us.
If the Merger Agreement is terminated, in certain circumstances, we would be required to pay the Consortium a termination fee of $28.0 million, which may require us to use available cash that would have otherwise been available for general corporate purposes. Furthermore, until the merger is completed or the Merger Agreement is terminated, with limited exceptions, we are prohibited from entering into or soliciting any acquisition proposals, and these provisions coupled with a potential termination fee, if any, could discourage other companies from trying to acquire us for a higher price. For these and other reasons, a failed merger could materially and adversely affect our business, operating results or financial condition, which in turn would materially and adversely affect our business or financial condition, the price per share of our common stock or our perceived acquisition value.
20
While the merger is pending, we are subject to business uncertainties and contractual restrictions that could materially adversely affect our business relationships with our customers, vendors, suppliers and other third parties.
The Merger Agreement includes restrictions on the conduct of our business prior to the completion of the merger, generally requiring us to conduct our business in the regular and ordinary course, consistent with past practice and policies, and subjecting us to a variety of specified limitations absent the Consortium's prior written consent. We may find that these and other contractual arrangements in the Merger Agreement may delay or prevent us from or limit our ability to respond effectively to competitive pressures, industry developments and future business opportunities that may arise during such period, even if our management and board of directors think they may be advisable. The pendency of the merger may also divert management's attention and our resources from ongoing business and operations. Our employees, customers, vendors and suppliers may have uncertainties about the effects of the merger. In connection with the pending merger, it is possible that our business relationships with our customers, vendors, suppliers and others may be subject to disruption as these parties may elect to delay or defer certain business decisions, including purchase or design-win decisions, or might decide to seek to terminate, change or renegotiate their relationship with us as a result of the merger. If any of these effects were to occur, it could materially and adversely impact our business, operating results and financial condition, as well as the market price of our common stock and our perceived acquisition value, regardless of whether the merger is completed. The adverse effect of any such disruptions could be exacerbated by a delay in the completion of the acquisition for any reason, including delays associated with obtaining regulatory approvals, or termination of the merger agreement. In addition, whether or not the merger is completed, while it is pending we will continue to incur costs, fees, expenses and charges related to the proposed merger, which may materially and adversely affect our business results and financial condition.
We may have difficulty motivating and retaining executives and other key employees due to the pending acquisition.
Current and prospective employees may experience uncertainty about their future roles with us following completion of the merger, which may materially adversely affect our ability to attract and retain key employees and have an adverse effect on us while the acquisition is pending. This uncertainty may impair our ability to retain and motivate key personnel in the months leading up to the completion of the acquisition. If key employees depart because of this uncertainty or other issues related to the merger, we may incur significant costs in identifying, hiring, and retaining replacements for departing employees, which could have a material adverse effect on our business, operating results, and financial condition.
If the proposed acquisition is not completed, we will have incurred substantial costs that may adversely affect our operating results and financial condition as well as the market price of our common stock.
If the merger is not completed, the price of our common stock may decline to the extent that such market price reflects a market assumption that the merger will be completed. In addition, we have incurred and will incur substantial costs in connection with the proposed merger. These costs are primarily associated with the fees of our financial advisors, accountants, and legal counsel and will be payable regardless of whether the merger is completed. In addition, as part of preparing for the closing of the merger, we have taken actions necessary to divest certain of our investments in Taiwan. If the merger is not completed, we may not be able to unwind these actions or the divestiture of such investments.
We have also diverted significant management resources in an effort to complete the merger. If the acquisition is not completed, we will have received little or no benefit in respect of such costs incurred. Furthermore, if the merger is not completed, we may experience negative reactions from the financial markets and our vendors, suppliers, customers, customer prospects, and employees. Any of these factors could have an adverse effect on our business, operating results, and financial condition or on the trading price of our common stock.
21
In connection with the Merger Agreement, a number of lawsuits have been filed against us challenging the merger, and an unfavorable judgment or ruling in one or more of these lawsuits could prevent or delay the consummation of the merger, result in substantial costs, or have an adverse effect on our business, financial condition and operating results.
Beginning on May 4, 2015, a number of putative class action lawsuits have been filed in the Superior Court of the State of California, County of Santa Clara. In general, the lawsuits assert that, among other things, the members of our board of directors breached their fiduciary duties to stockholders by initiating a process that undervalues our company, by agreeing to a transaction that does not adequately reflect our true value, and that we and the Consortium aided and abetted the board of directors' alleged breaches of fiduciary duties. The lawsuits generally seek to enjoin the merger as contemplated by the Merger Agreement, or, alternatively, seek rescission of a consummated merger. No trial date has been set. We currently are unable to predict the outcome of this action and therefore cannot determine the likelihood of loss nor estimate the loss or a range of possible loss.
Litigation is inherently uncertain, and there can be no assurances that the defense of these stockholder lawsuits will be successful. In addition, we have obligations, under certain circumstances, to hold harmless and indemnify each of the defendant directors against judgments, fines, settlements and expenses related to claims against such directors and otherwise to the fullest extent permitted under Delaware law and our bylaws and certificate of incorporation. Such obligations may apply to these lawsuits. An unfavorable outcome in these lawsuits could prevent or delay the consummation of the merger, result in substantial costs to us, or have an adverse effect on our business, financial condition and operating results.
Risks Related to Our Business
For the majority of our revenues, we depend on a few key customers and, the loss of one or more of our key customers, or their key end-user customers, could significantly reduce our revenues.
A relatively small number of OEMs, VARs and distributors account for a significant portion of our revenues. Some of these OEMs and VARs are major producers of mobile phones, including smartphones, for some of the largest companies in the mobile phone industry and may rely upon one or more key end-user customers for a significant portion of their revenue. Any material delay, alteration, cancellation or reduction of purchase orders from or change in the purchasing patterns of one or more of our major customers or distributors, or their key end-user customers, could result in our failure to achieve our revenue forecast for a particular period. For example, in our second quarter of fiscal 2012, we experienced an unexpected cutback in orders from certain of our key customers. This reduced the unit sales of our OmniBSI and OmniPixel3-HS based products and adversely affected our revenue for that quarter.
If we are unable to retain one or more of our largest OEM, VAR or distributor customers, if we are unable to maintain our current level of revenues from one or more of these significant customers, if our OEM, VAR or distributor customers are unable to retain one or more of their key end-user customers, or if we are unable to attract new customers to replace the revenue lost from such customers, our business and results of operation would be impaired, and our stock price could decrease, potentially significantly. Such a delay, alteration, cancellation or reduction of purchase orders, a change in purchasing patterns or our inability to retain a key customer or several of our smaller customers could be caused by, among other things, failure to meet our customers', including their key end-user customers', demand for our products or to timely develop and introduce new products that meet the needs of our customers, including their key end-user customers, and that are efficiently and successfully integrated into their products. In addition, on April 30, 2015, we entered into a definitive agreement to be acquired by the Consortium. This pending transaction may create uncertainty for our
22
current and potential customers, which could cause them to terminate, or not to renew or enter into, agreements with us.
In fiscal 2014 and 2015, approximately 55.1% and 53.0%, respectively, of our revenues came from sales to our top five customers. In addition, in fiscal 2015, two OEM customers accounted for approximately 25.3% of our revenues, and one distributor customer accounted for approximately 13.3% of our revenues. Our business, financial condition, results of operations and cash flows will continue to depend significantly on our ability to retain our current key customers and to attract new customers, as well as on the financial condition and success of our OEMs, VARs and distributors, including their ability to retain their key end-user customers and attract new customers.
We face foreign business, political and economic risks, because a majority of our products and those of our customers are manufactured and sold outside of the United States.
We face difficulties in managing our third party foundries, color filter application service providers, packaging and other manufacturing service providers and our foreign distributors, most of whom are located in Asia. In addition, our presence in Asia presents the challenge of managing foreign operations and maintaining good relations with our employees located there. Any political and economic instability in Asia might have an adverse impact on foreign exchange rates and could cause service disruptions for our vendors and distributors and adversely affect our customers.
Sales outside of the United States accounted for a significant portion of our revenues for fiscal 2014 and 2015. In addition, since the third quarter of fiscal 2014, we experienced a decline in sales of products that were used in mobile phones made by end-user customers located in North America, which was partially offset by an increase in the sale of products that were used in mobile phones made by end-user customers located in China. We anticipate that sales outside of the United States, in particular in China and the emerging market in India, will account for a substantial portion of our revenues in future periods. We continue to invest resources in China and India in anticipation of continued revenues from these markets. Dependence on sales to foreign customers, in particular in China and India, involves certain risks, including:
- •
- increased price competition, in particular in the China market;
- •
- longer payment cycles;
- •
- the adverse effects of tariffs, duties, price controls or other restrictions that impair trade;
- •
- decreased visibility as to future demand;
- •
- difficulties in accounts receivable collections; and
- •
- burdens of complying with a wide variety of foreign laws and labor practices.
Although we believe that our long standing relationships with OEMs in Asia, especially China, could assist us in sales trends favoring the Asian markets, sales driven by end-user customers in these markets could also create additional risks and challenges such as increased unpredictability of our sales because we tend to experience greater fluctuations in demand, often at a rapid pace, from end-user customers in Asia as compared to end-user customers in North America. Since a significant amount of our revenues is derived from markets outside of the United States, a slowdown in demand in these markets could have an adverse effect on our financial results. For example, in the third quarter of fiscal 2015, demand for our products slowed down in the China market, possibly attributable to the competitive environment faced by our customers and a protracted upgrade cycle for the local wireless infrastructure. This demand slowdown in the region had negatively impacted our revenues. If this slowdown in the China market continues, our future results of operation could be adversely affected as well.
23
Sales of our products have to date been denominated principally in U.S. dollars. Over the last several years, the value of the U.S. dollar has fluctuated when compared with other currencies. Future increases in the value of the U.S. dollar, if any, would increase the price of our products in the currency of the countries in which our customers are located. This may result in our customers seeking lower-priced suppliers, which could adversely impact our operating results. If a larger portion of our international revenues were to be denominated in foreign currencies in the future, we would be subject to increased risks associated with fluctuations in foreign currency exchange rates.
We face intense competition in our markets from CMOS and CCD image-sensor manufacturers, and if we are unable to compete successfully we may not be able to maintain or grow our business.
The image-sensor market is intensely competitive, and we expect competition in this industry to continue to increase. This competition has resulted in rapid technological change, evolving standards, reductions in product selling prices and rapid product obsolescence. If we are unable to successfully meet these competitive challenges, we may be unable to maintain and grow our business. Any inability on our part to compete successfully would also adversely affect our results of operations and impair our financial condition.
Our image-sensor products face competition from other companies that sell CMOS image sensors and from companies that sell CCD image sensors. Many of our competitors have longer operating histories, greater presence in key markets, greater name recognition, larger customer bases, more established strategic and financial relationships and significantly greater financial, sales and marketing, distribution, technical and other resources than we do. Many of them also have their own manufacturing facilities, which may give them a competitive advantage. As a result, they may be able to adapt more quickly to new or emerging technologies and customer requirements or devote greater resources to the promotion and sale of their products. Our competitors include established CMOS image-sensor manufacturers such as ON Semiconductor, Samsung, Sharp, Sony, STMicroelectronics and Toshiba as well as CCD image-sensor manufacturers such as Panasonic, Sharp and Sony. Many of these competitors own and operate their own fabrication facilities, which in certain circumstances may give them the ability to price their products more aggressively than we can, respond more rapidly than we can to changing market opportunities or more easily meet increased demands for their products. In addition, we compete with a large number of smaller CMOS manufacturers that has required, and in the future may require, us to reduce our prices. For instance, we have seen increased competition in the markets for VGA image-sensor products with resulting pressures on product pricing. Downward pressure on pricing could result both in decreased revenues and lower gross margins, which would adversely affect our profitability. From time to time, other companies enter the CMOS image-sensor market by using obsolete and available manufacturing equipment. These new entrants gain market share in the short-term by pricing their products significantly below current market levels, which puts additional downward pressure on the prices we can obtain for our products.
Our competitors may acquire or enter into strategic or commercial agreements or arrangements with foundries or providers of color filter application, wafer probe testing, assembly or packaging services. These strategic arrangements between our competitors and third party service providers could involve preferential or exclusive arrangements for our competitors. Such strategic alliances could impair our ability to secure sufficient capacity from foundries and service providers to meet our demand for wafer manufacturing, color filter application, wafer probe testing, assembly or packaging services, adversely affecting our ability to meet customer demand for our products. In addition, competitors may enter into exclusive relationships with distributors, which could reduce available distribution channels for our products and impair our ability to sell our products and grow our business. Further, some of our customers could also become developers of image sensors, and this could potentially adversely affect our results of operations, business and prospects.
24
The development of new and more complex products can increase our cost of revenue and adversely affect our gross margins.
A key component of our future success is the continued development of new and innovative products and technologies. These new products and technologies are often times very complex and may require additional equipment and resources to develop and manufacture. In addition, for these new products, we may initially experience lower production yields than our other more established products. These new products and technologies also often have a higher cost structure than our existing products and technologies because we must devote more time and effort to developing the products and technologies and our suppliers and manufacturers may incur additional costs by acquiring new equipment or components in order to meet our design specification and capacity requirements. As our product mix shifts to include a higher volume of these new products and technologies, our gross margins may be lower than in comparable historical periods. For example, our OmniBSI-2 products have very different production requirements when compared to our previous generation products and we had to request our suppliers to install new equipment and tooling, which increased the production costs for these new products. Because we experienced increased sales of our OmniBSI-2 products since fiscal 2013, and expect these products to continue to constitute a significant percentage of our total sales in fiscal 2016, we anticipate that our gross margins will remain at lower levels than we have experienced historically, before our introduction of OmniBSI-2. If we are unable to sufficiently increase our ASPs to offset these higher production costs, increase our yields or lower the costs associated with the development and manufacture of these new products and technologies, our gross margins could continue to be negatively affected.
Reductions in our average selling prices may lower our revenues and, as a result, may reduce our gross margins.
We have experienced and expect to continue to experience pressure to reduce the selling prices of our products, and our ASPs have generally declined over time as a result. Competition in our product markets is intense and as competition continues to intensify, we anticipate that these pricing pressures will increase. Consequently, we expect that the ASPs for many of our products will continue to decline over time. If sales of mobile phones that use our products continue to shift from those made by end-user customers located in North America to those made by end-user customers located in Asia, we anticipate that this trend will place additional pressure on the pricing of our products due to the strong pricing pressure that we continue to experience in Asia. Unless we can increase unit sales sufficiently to offset these declines in our ASPs, our revenues will decline. Reductions in our ASPs have adversely affected our gross margins, and unless we can reduce manufacturing costs to compensate, additional reductions in our ASPs will continue to adversely affect our gross margins and could materially and adversely affect our operating results and impair our financial condition. Historically, we have increased and are likely to continue to increase our research, development and related expenses in the long-term to continue the development of new image-sensor products that can be sold at higher selling prices and/or manufactured at lower cost. If we are unable to timely introduce new products that incorporate more advanced technology and include more advanced features that can be sold at higher ASPs, or if we are unable to successfully develop more cost-effective technologies, our financial results could be adversely affected.
Sales of our image-sensor products for mobile phones, including smartphones, account for a large portion of our revenues, and any decline in sales to the mobile phone market or failure of this market and other emerging markets to continue to grow as expected could adversely affect our results of operations.
Sales to the mobile phone market, including smartphones, account for a large portion of our revenues. Although we can only estimate the percentages of our products that are used in the mobile phone market due to the significant number of our image-sensor products that are sold to module
25
makers or through distributors and VARs, we believe that the mobile phone market accounted for approximately 61% and 68% of our revenues in fiscal 2014 and 2015, respectively. We expect that revenues from sales of our image-sensor products to the mobile phone market will continue to account for a significant portion of our revenues during fiscal 2016 and beyond. Any factors adversely affecting the demand for our image sensors in this market could cause our business to suffer and adversely affect our financial condition, operating results and cash flows. The digital image-sensor market for mobile phones is extremely competitive, and we expect to face increased competition in this market in the future. In addition, we continue to believe the market for mobile phones is also relatively concentrated and the top five producers account for approximately 50% of the annual unit sales of these products. If we do not continue to achieve design wins with key mobile phone manufacturers or if we experience a cutback in orders from our key customers, such as the cutback we experienced in our second quarter of fiscal 2012, our market share or revenues could decrease. The mobile phone image-sensor market is also subject to rapid technological change. In order to compete successfully in this market, we will have to correctly forecast customer demand for technological improvements and be able to deliver such products on a timely basis at competitive prices. If we fail to correctly forecast customer demand in our target markets and timely deliver products at competitive prices, our results of operations, business and prospects would be materially and adversely affected. In addition, current domestic and global economic conditions could negatively affect the mobile phone market if consumers and/or businesses defer purchases in response to tighter credit, negative financial news, and/or decreased corporate or consumer spending.
We also expect that image sensors will continue to be incorporated into products for and become more important in the notebook and webcam, entertainment, security, medical and automotive industries. As image sensors begin to fill a greater role in these other markets, the challenges and risks that we face in these other markets could increase and could be similar to some of the challenges and risks that we face in the mobile phone market. If our sales to the mobile phone market and other emerging markets do not increase and/or the mobile phone market and other emerging markets do not grow as expected, our results of operations, business and prospects would be materially adversely affected.
If we do not forecast customer demand correctly, our business could be impaired and our stock price may decline.
Our sales are generally made on the basis of purchase orders rather than long-term purchase commitments; however, we manufacture products and build inventory based on our estimates of customer demand. Accordingly, we must rely on multiple assumptions to forecast customer demand. Various external factors that are outside of our control can make it difficult to accurately make such forecasts. For example, the domestic and global economic conditions that have existed since fiscal 2009 have made it extremely challenging to accurately predict customer demand, which has demonstrated increased volatility. There is no guarantee that customer demand will increase or will remain at current levels. If customer demand continues to be volatile, historical models for predicting customer demand may no longer be reliable. In addition, our customers may cancel or defer orders at any time by mutual written consent. If we overestimate customer demand, we may manufacture products that we may be unable to sell, or we may have to sell at lower prices. For example, we experienced unexpected cutbacks in orders from certain of our key customers, and as a result our inventories at the end of the second and third quarters of fiscal 2012 were higher than we intended them to be. Under such circumstances, we may be required to record significant provisions for excess and obsolete inventories. This could materially and adversely affect our results of operations and financial condition. We need to accurately predict customer demand because we must often place noncancelable orders with our manufacturers to have products manufactured before we receive firm purchase orders from our customers. Conversely, if we underestimate customer demand, we may be unable to manufacture sufficient products quickly enough to meet actual demand, which could damage our reputation, impair
26
our relationships with our customers, cause us to lose one or more customers and impair our ability to grow our business. In preparation for new product introductions, we gradually ramp down production of established products. With our 12-14 week production cycle, it is extremely difficult to predict precisely how many units of established products we will need. It is also difficult to accurately predict the speed of the ramp of our new products and the impact on inventory levels presented by the shorter life cycles of end-user customers' products. The shorter product life cycle is a result of an increase in competition and the growth of various consumer-product applications for image sensors. Under these circumstances, it is possible that we could underestimate market demand, suffer from shortages of certain products, and face the risk of being unable to fulfill customer orders.
We also face the risk of excess inventory and product obsolescence if we overestimate market demand for our products and build inventories in excess of demand, especially if our customer demand were to become volatile. We may be unable to sell inventories that were built in excess of demand, or we may have to sell at lower prices to eliminate excess inventories. Under such circumstances, we may be required to record significant provisions for excess and obsolete inventories. This could materially and adversely affect our results of operations and financial condition. We expect the business environment to remain volatile in fiscal 2016, especially in the consumer-oriented product markets, which can continue to affect our ability to accurately forecast customer demand. Our ability to accurately forecast sales is also a critical factor in our ability to meet analyst expectations for our quarterly and annual operating results. Any failure to meet these expectations would likely lead to a substantial decline in our stock price.
Our future success depends on the timely development, introduction, marketing and selling of new products, which we might not be able to achieve.
Our failure to successfully develop new products that achieve market acceptance in a timely fashion and that can be efficiently and successfully integrated with our customers', including their key end-user customers', products could adversely affect our ability to grow our business and improve our operating results. The development, introduction and market acceptance of new products is critical to our ability to sustain and grow our business. Any failure to successfully develop, introduce, market and sell new products could materially adversely affect our business and operating results. The development of new products is highly complex, and we have experienced delays in completing the development and introduction of new products. For example, during the first half of fiscal 2012, we experienced an unanticipated extension in the product development cycle of our OV8830 product. This delayed the production ramp up of this new sensor. By the end of our second quarter of fiscal 2012, we only shipped this product in very limited quantities, which had an adverse effect on our revenues. From time to time, we have also encountered unexpected manufacturing problems as we increase the production of new products. Consumers continue to expect the sophistication of image sensors in consumer products to increase, and the number of consumer products that use image sensors has continued to grow. This results in a requirement for us to continue to build and develop image sensors with advanced technologies that can be used in a variety of consumer products. As our products integrate new and more advanced technologies and functions, they become more complex and increasingly difficult to design, debug and produce. Successful product development and introduction depends on a number of factors, including:
- •
- accurate prediction of market requirements and evolving standards, including imaging pixel resolution, output interface standards,
power requirements, optical lens size, input standards and operating systems for webcams and other platforms;
- •
- development of advanced technologies and capabilities, including our CameraCubeChip, OmniBSI, OmniBSI+ and OmniBSI-2 technologies;
27
- •
- timely development completion and introduction of new CMOS image sensors that satisfy our customers', including their key end
customers', requirements and specifications;
- •
- development of products that maintain technological advantages over the products of our competitors, including advantages with respect
to the functionality and imaging pixel capability of our image-sensor products and our proprietary testing processes; and
- •
- market acceptance of the new products, including our PureCel and PureCel-S sensors.
Accomplishing all of these steps is difficult, time consuming and expensive. We may be unable to develop new products or product enhancements in time to capture market opportunities, satisfy the requirements and specifications of our customers, including their key end customers, or achieve significant or sustainable acceptance in new and existing markets. If our competitors develop new products or technologies on a more expedited basis than us or are successful in developing products that are accepted more rapidly and broadly by the market than our products, we could lose market share. Matching or surpassing technological advances that may be developed by our competitors could require an extended period of time. In addition, our products could become obsolete sooner than anticipated because of a rapid change in one or more of the technologies related to our products or the reduced life cycles of consumer products.
Design wins are a key determinant of future revenues, and failure to obtain design wins adversely affects our revenues and impairs our ability to grow our business.
Our success has been, and will continue to be, dependent upon manufacturers and their customers designing our image-sensor products into their products. To achieve design wins, which are decisions by manufacturers and their customers to design our products into their systems, we must define and deliver cost effective and innovative image-sensor solutions on a timely basis that satisfy the manufacturers' and their customers' requirements and specifications. Our ability to achieve design wins is subject to numerous risks including competitive pressures, the compatibility of our products with newly developed technologies or designs used in our customers' products, as well as delays in our product development cycle. Even if our products meet the manufacturers' and their customers' requirements and specifications, we may not succeed in achieving a particular design win due to factors out of our control, such as customers' preferences or other business decisions that determine the components to be used in a product. If we do not achieve a design win with a prospective customer, it may be difficult to sell our image-sensor products to such prospective customer in the future because once a manufacturer has designed a supplier's products into its systems, the manufacturer may be reluctant to change its source of components due to the significant costs, time, efforts and risks associated with qualifying a new supplier and modifying its design platforms. In addition, there is no guarantee that we will be able to continue to achieve design wins with manufacturers with which we have achieved design wins in the past. As manufacturers take on new projects for their customers, there is no obligation on their part to continue to design our products into their customers' new products. Accordingly, if we fail to achieve design wins with key device manufacturers that embed image sensors in their products, our market share or revenues could decrease. Furthermore, to the extent that our competitors secure design wins, our ability to grow our business in the future will be impaired.
We depend on a limited number of third party wafer foundries, which reduces our ability to control our manufacturing process.
Unlike some of our larger competitors, we do not own or operate a semiconductor fabrication facility. Instead, we rely on TSMC, PTC, Huali and XMC to produce all of our wafers. Historically, we have relied on TSMC to provide us with a substantial majority of our wafers. As a part of our joint venture agreement with TSMC, TSMC has agreed to commit substantial wafer manufacturing capacity
28
to us in exchange for our commitment to purchase a substantial portion of our wafers from TSMC, subject to pricing and technology requirements.
We secure manufacturing capacity in any particular period on a purchase order basis. The foundries have no obligation to supply products to us for any specific period, in any specific quantity or at any specific price, except as set forth in a particular purchase order. In general, our reliance on third party foundries involves a number of significant risks, including:
- •
- reduced control over delivery schedules, quality assurance, manufacturing yields and production costs;
- •
- lack of guaranteed production capacity or product supply;
- •
- unavailability of, or delayed access to, next generation or key process technologies; and
- •
- financial difficulties or disruptions in the operations of third party foundries due to causes beyond our control.
The size of the orders we place with our foundries depends on actual or anticipated sales volumes of our products. Because our foundries provide services to a number of companies, in the event they receive increased orders from us or one or more of the other companies that they service, they may be unable to provide us with the requested quantity of products, may subordinate our request to the requests of other larger companies or may increase the prices they charge us. In fiscal 2011, the entire semiconductor industry, including us, experienced supply constraints. Due to the lack of availability of products, supply constraints forced companies in the industry to be unable to meet customers' product demands and to take certain actions such as allocating available products among their customers or, in some cases, increasing the prices of their products. This resulted in harm to customer relations, the loss of sales to customers and, in some cases, the loss of future business with those customers. We faced these same challenges then as we sought to meet our customers' demand for our products. If constraints in supply were to happen again or if for any reason our foundries are unable to provide a sufficient number of products to us on a timely basis and at acceptable yields and cost, we may be unable to achieve future growth, which could result in our revenues, gross margins and other financial results being materially and adversely affected.
The current global economic conditions could materially affect our foundries and cause them to be unable to provide necessary services to us. In addition, the pending acquisition by the Consortium may create uncertainty for our foundries, which could cause them to terminate, or not to renew or enter into, agreements with us, or to otherwise change the way in which they have historically provided services to us. If TSMC, PTC, or any of our other foundries were unable to continue manufacturing our wafers in the required quantities, at acceptable quality, yields and costs, or in a timely manner, we would have to identify and qualify substitute foundries, which would be time consuming and difficult, and could increase our costs or result in unforeseen manufacturing problems. In addition, if competition for foundry capacity increases, we may be required to pay increased amounts for manufacturing services. We are also exposed to additional risks if we transfer our production of semiconductors from one foundry to another, as such transfer could interrupt our manufacturing process. Further, some of our foundries may also develop their own image-sensor products and we would have to identify and qualify other sources for these products.
We rely on a joint venture company for color filter application and on third party service providers for packaging and other back-end services, which reduces our control over delivery schedules, product quality and cost, and could adversely affect our ability to deliver products to customers.
We rely on VisEra for the color filter application of our completed wafers. In addition, we rely on Lingsen and Tong Hsing for substantially all of our ceramic chip packages. We rely on XinTec and WLCSP, both being investee companies, for CSP packaging, which are generally used in our products
29
designed for the smallest form factor applications. We rely on several specialized service providers, one of which is Tong Hsing, to perform the necessary wafer probe tests and prepare good die for use in COB packaging, a delivery format referred to as reconstructed wafer. If the current global economic conditions do not continue to improve or remain stable, these service providers' ability to continue to fulfill our packaging, color filter processing and related requirements could be adversely affected. If for any reason one or more of these service providers were to become unable or unwilling to continue to provide services of acceptable quality, at acceptable costs or in a timely manner, our ability to deliver our products to our customers could be severely impaired. We would have to identify and qualify substitute service providers, which could be time consuming and difficult and could result in unforeseen operational problems. Substitute service providers might not be available or, if available, might be unwilling or unable to offer services on acceptable terms.
In addition, if competition for color filter application, packaging, or other back-end services increases, we may be required to pay or invest significant amounts to secure access to these services, which could adversely impact our operating results. The number of companies that provide these services is limited and some of them have limited operating histories and financial resources. In the event our current providers refuse or are unable to continue to provide these services to us, we may be unable to procure services from alternate service providers. Furthermore, if customer demand for our products increases, we may be unable to secure sufficient additional capacity from our current service providers on commercially reasonable terms, if at all. These factors may cause unforeseen product shortages or may increase our costs of manufacturing, which would adversely affect our operating results and cash flows.
Recent domestic and worldwide economic conditions adversely affected and could have future adverse effects on our business, results of operations, financial condition and cash flows.
Since the latter part of fiscal 2009, we have experienced fluctuations in our financial results due in part to changing macroeconomic conditions. As macroeconomic conditions have improved, our sales have also generally tended to improve and when macroeconomic uncertainties have returned, our sales have generally tended to be negatively impacted, although that has not always been the case. For example, in fiscal 2014, macroeconomic conditions appeared to continue to improve, and our annual sales increased slightly when compared to fiscal 2013. However, for the second half of fiscal 2014, we actually experienced a decline in sales when compared to the similar period in fiscal 2013. Given the continuing uncertainties in current economic environment and the volatility in our business, we remain cautious and we expect our customers to be cautious as well, which could affect our future results. If the economic recovery slows down or even dissipates, our business, financial condition, results of operations and cash flows could be materially and adversely affected.
Fluctuations in our quarterly operating results have caused volatility in the market price of our common stock and also make it difficult to predict our future operating results.
Our quarterly operating results have varied significantly from quarter to quarter in the past and are likely to vary significantly in the future based on a number of factors, many of which are beyond our control. These factors and other industry risks, many of which are more fully discussed in our other risk factors, include, but are not limited to:
- •
- our gain or loss of a large customer, or cutbacks in orders from such customers;
- •
- the timing and size of orders from our customers;
- •
- the volume and mix of our product sales;
- •
- competitive pricing pressures and ASPs, in particular in the China market;
30
- •
- volatility and lack of visibility in the markets in which we sell our products, in particular in the China market;
- •
- production costs for our products;
- •
- our ability to accurately forecast demand for our products;
- •
- our ability to achieve acceptable wafer manufacturing or back-end processing yields;
- •
- our ability to achieve design wins;
- •
- our ability to manage our product transitions;
- •
- the availability of production capacity at the suppliers that manufacture our products or process our products;
- •
- the growth of the market for products and applications using CMOS image sensors;
- •
- the volume of our product returns;
- •
- the seasonal nature of customer demand for our products;
- •
- the deferral of customer orders in anticipation of new products, product designs or enhancements;
- •
- the announcement and introduction of products and technologies by our competitors;
- •
- adverse changes in domestic or global economic conditions;
- •
- the fair value of our interest rate swaps;
- •
- the impairment of our intangible assets or other long-lived assets;
- •
- the level of our operating expenses; and
- •
- fluctuations in our effective tax rate from quarter to quarter.
Our introduction of new products and our product mix have affected, and may continue to affect, our quarterly operating results. Changes in our product mix could adversely affect our operating results, because some products provide higher margins than others. We typically experience lower yields when manufacturing new products through the initial production phase, and consequently our gross margins on new products have historically been lower than our gross margins on our more established products. We also anticipate that the rate of orders from our customers may vary significantly from quarter to quarter. Our operating expenses are relatively fixed in the short-term, and our inventory levels are based on our expectations of future revenues. Consequently, if we do not achieve the revenues we expect in any quarter, expenses and inventory levels could be disproportionately high, adversely impacting our operating results and cash flows for that quarter, and potentially in future quarters.
All of these factors are difficult to forecast and could result in fluctuations in our quarterly operating results. Our operating results in any given quarter could be substantially less than anticipated, and, if we fail to meet market analysts' expectations, a substantial decline in our stock price could result. Fluctuations in our quarterly operating results could adversely affect the price of our common stock in a manner unrelated to our long-term operating performance.
Litigation regarding intellectual property could divert management attention, be costly to defend and prevent us from using or selling the challenged technology.
In recent years, there has been significant litigation in the United States involving intellectual property rights, including the semiconductor industry. We have in the past been, currently are and may in the future be, subject to legal proceedings and claims with respect to our intellectual property,
31
including such matters as trade secrets, patents, product liabilities and other actions arising out of the normal course of business. These claims may increase as our intellectual property portfolio becomes larger and/or more valuable. Intellectual property claims against us, and any resulting lawsuit, may cause us to incur significant expenses, subject us to liability for damages and invalidate our proprietary rights. Any potential intellectual property litigation against us would likely be time-consuming and expensive to resolve and would divert management's time and attention and could also force us to take actions such as:
- •
- ceasing the sale or use of products or services that incorporate the infringed intellectual property;
- •
- obtaining from the holder of the infringed intellectual property a license to sell or use the relevant technology, which license may
not be available on acceptable terms, if at all; or
- •
- redesigning those products or services that incorporate the disputed intellectual property, which could result in substantial unanticipated development expenses and delay and prevent us from selling the products until the redesign is completed, if at all.
If we are subject to a successful claim of infringement and we fail to develop non-infringing intellectual property or license the infringed intellectual property on acceptable terms and on a timely basis, we may be unable to sell some or all of our products, and our operating results could be adversely affected. We may in the future initiate claims or litigation against third parties for infringement of our intellectual property rights or to determine the scope and validity of our proprietary rights or the proprietary rights of competitors. These claims could also result in significant expense and the diversion of technical and management attention.
In addition, third parties may assert claims of infringement and misappropriation of proprietary rights based on the use or resale of our products against our suppliers or the OEMs, VARs or distributors with whom we do business. In addition, the end-user customers of these OEMs, VARs or distributors may also be named as parties in these claims. Under our agreements with these parties, we may be required to defend protracted and costly litigation on their behalf, regardless of the merits of these claims, or to indemnify these parties for such claims. Because our suppliers and our customers and their end-user customers are often times much larger than we are and have much greater resources than we do, they may be more likely to be the target of an infringement or misappropriation of proprietary rights claim by third parties than we would be, which could increase our chances of becoming involved in a future lawsuit or of being required to indemnify these parties. We could also voluntarily agree to defend or indemnify third parties in instances where we are not obligated to do so if we determine it would be important to our business relationships. Recently, infringement claims relating to our image sensors were brought against some of the end-user customers of our customers. These customers or their applicable end-user customers have requested indemnification from us for this matter. Although we are unable at this time to estimate any possible loss and it is uncertain whether this matter will result in any material expense to us, if we are ultimately required to make indemnification payments to these customers or their end-user customers, it could result in us being forced to pay significant damages on behalf of our customers or their end-user customers that could increase our expenses, disrupt our ability to sell our products and reduce our revenue. A party making an infringement or misappropriation of proprietary rights claim against our customers or their end-user customers, if successful, could also secure an injunction or other court order that could prevent our customers or their end-user customers from selling their products that incorporate our image sensors. If we are required or agree to defend or indemnify any of our suppliers, customers or their end-user customers in connection with any claims of infringement or misappropriation of proprietary rights or injunctions are secured by third parties that prevent the sale of products that incorporate our image sensors, we could incur significant costs and expenses and experience a significant decrease in our revenue that could adversely affect our business, operating results or financial condition.
32
We may be unable to adequately protect our intellectual property, and therefore we may lose some of our competitive advantage.
We rely on a combination of patent, copyright, trademark and trade secret laws as well as nondisclosure agreements and other methods to protect our proprietary technologies. We have been issued patents and have a number of pending United States and foreign patent applications. However, we cannot provide assurance that any patent will be issued as a result of any applications or, if issued, that any claims allowed will be sufficiently broad to protect our technology. It is possible that existing or future patents may be challenged, invalidated or circumvented. We have experienced the cancellation of a patent in the past and although we do not believe this cancellation had a material adverse effect on our business or prospects, there may be other situations where our inability to adequately protect our intellectual property rights could materially and adversely affect our competitive position and operating results. If a third party can copy or otherwise obtain and use our products or technology without authorization, develop corresponding technology independently or design around our patents, this could materially adversely affect our business and prospects. Effective patent, copyright, trademark and trade secret protection may be unavailable or limited in foreign countries. Any disputes over our intellectual property rights, whatever the ultimate resolution of such disputes, may result in costly and time-consuming litigation or require the license of additional elements of intellectual property for a fee.
Our use of derivative financial instruments to reduce interest rate risk may result in added volatility in our quarterly operating results
We do not hold or issue derivative financial instruments for trading purposes. However, we do utilize derivative financial instruments to reduce interest rate risk. We have a variable rate mortgage loan that totaled $23.1 million as of April 30, 2015. To manage the related interest rate risk, we entered into an interest rate swap agreement, effectively converting our mortgage loan into a fixed rate loan. Under generally accepted accounting principles, the fair values of the swap contract, which will either be amounts receivable from or payable to counterparties, are reflected as either assets or liabilities on our Consolidated Balance Sheets. We record its fair value change in our Consolidated Statements of Income, in "Other income, net." The associated impact on our quarterly operating results is directly related to changes in prevailing interest rates. If interest rates increase, we would have a non-cash gain on the swap, and vice versa. Consequently, this swap contract will introduce volatility to our operating results.
We are also exposed to credit loss in the event of non-performance by the counterparty to the interest rate swap agreement. However, we do not anticipate non-performance by the counterparty.
Our business is subject to seasonal fluctuations which may in turn cause fluctuations in our results of operations and cash flows from period to period.
Many of the products using our image sensors, such as mobile phones, cameras for entertainment applications, such as tablets and wearable devices, notebooks and webcams, and DSCs are consumer electronics goods. These mass-market camera devices generally have seasonal cycles which historically have caused the sales of our customers to fluctuate quarter-to-quarter. In addition, since a very large number of the manufacturers who use our products are located in China and Taiwan, the pattern of demand for our image sensors has been influenced by the timing of the extended lunar or Chinese New Year holiday, a period in which the factories which use our image sensors generally close. Consequently, demand for our image sensors has historically been stronger in the second and third quarters of our fiscal year and weaker in the first and fourth quarters of our fiscal year. However, due to macroeconomic uncertainties and changes in our end-user customer demands in the past several years, the seasonal cycle of our business has been less predictable. Given the current economic environment and continued changes in our end-user demands, we remain cautious towards the return of the historical seasonal cycle of our business. If our historical cycle resumes and continues in future
33
years, it could result in the fluctuation of our results of operations and cash flows from period to period. Alternatively, if we experience future events, such as the recent macroeconomic uncertainties or other events outside of our control, our historical seasonal cycle could be disrupted and our results of operations and cash flows could differ from our historical seasonal cycles.
There are risks associated with our operations in China.
In December 2000, we established OmniVision Semiconductor (Shanghai) Co. Ltd., or OSC, primarily for the testing of our image-sensor products. In October 2008, we formed Shanghai OmniVision Semiconductor Technology Co. Ltd., or OST, for the purpose of expanding our testing capabilities. In October 2010, through our wholly-owned subsidiary OmniVision Technologies (Shanghai) Co. Ltd., or OTC, we constructed research facilities in Shanghai. In April 2011, we also formed OmniVision Optoelectronics Technologies (Shanghai) Co. Ltd. for the purpose of expanding our manufacturing capabilities for CameraCubeChip production. Then in July 2013, we formed Omni Vision Technologies (Wuhan) Co, Ltd, or OV-Wuhan, to support our growing research and development efforts. There are certain administrative, legal and governmental risks to operating in China that could result in increased operating expenses or could hamper us in the development of our operations in China. The risks from operating in China that could increase our operating expenses and adversely affect our operating results, financial condition and ability to deliver our products and grow our business include, without limitation:
- •
- difficulties in staffing and managing foreign operations, particularly in attracting and retaining personnel qualified to design,
sell, test and support our products;
- •
- difficulties in managing employee relations;
- •
- implications of the ongoing general labor disputes in China;
- •
- increases in the value of the Chinese Yuan, or CNY;
- •
- difficulties in coordinating our operations in China with those in California;
- •
- difficulties in enforcing contracts in China;
- •
- difficulties in protecting intellectual property;
- •
- diversion of management attention;
- •
- imposition of burdensome governmental regulations;
- •
- difficulties in maintaining uniform standards, controls, procedures and policies across our global operations, including inventory
management and financial consolidation;
- •
- political and economic instability, which could have an adverse impact on foreign exchange rates in Asia and could impair our ability
to conduct our business in China; and
- •
- inadequacy of the local infrastructure to support our operations.
Problems with wafer manufacturing and/or back-end processing yields could result in higher product costs and could impair our ability to meet customer demand for our products.
If the foundries manufacturing the wafers used in our products cannot achieve the yields we expect, we could incur higher unit costs and reduced product availability. Foundries that supply our wafers have experienced problems in the past achieving acceptable wafer manufacturing yields. Wafer yields are a function of both our design technology and the particular foundry's manufacturing process technology. These risks increase with our introduction of more advanced and novel products and technology, as well as with increased customer demand that requires these new products to be produced more quickly and in greater quantities than our historical volume. Certain risks are inherent
34
in the introduction of new products and technology. Low yields may result from design errors or manufacturing failures in new or existing products. During the early stages of production, production yields for new products are typically lower than those of established products. Unlike many other semiconductor products, optical products can be effectively tested only when they are complete. Accordingly, we perform final testing of our products only after they are assembled. As a result, yield problems may not be identified until our products are well into the production process. The risks associated with low yields could be increased because we rely on third party offshore foundries for our wafers, which can increase the effort and time required to identify, communicate and resolve manufacturing yield problems. In addition to wafer manufacturing yields, our products are subject to yield loss in subsequent manufacturing steps, often referred to as back-end processing, such as the application of color filters and micro-lenses, dicing (cutting the wafer into individual devices, or die) and packaging. Any of these potential problems with wafer manufacturing and/or back-end processing yields could result in a reduction in our gross margins and/or our ability to timely deliver products to customers, which could adversely affect our customer relations and make it more difficult to sustain and grow our business.
We depend on the increased acceptance of mass-market image-sensor applications to grow our business and increase our revenues.
Our business strategy depends in large part on the continued growth of the various markets into which we sell our image-sensor products, including the markets for mobile phones, entertainment devices such as tablets and wearable devices, notebook and webcams, digital still and video cameras, commercial and security and surveillance applications, automotive and medical applications. If these markets do not grow and develop as we anticipate, we may be unable to sustain or grow the sales of our products. Each of these markets has already been, and may continue to be, adversely impacted by current global economic conditions where consumers and businesses have deferred purchases of products in these markets as a result of tighter credit, negative financial news, and decreased corporate or consumer spending. Such conditions have negatively affected, and may continue to negatively affect our business.
In addition, the market price of our common stock may be adversely affected if certain of these new markets do not emerge or develop as expected. Securities analysts may already factor revenue from such new markets into their future estimates of our financial performance and should such markets not develop as expected by such securities analysts the trading price of our common stock could be adversely affected.
Our lengthy manufacturing, packaging and assembly cycle, in addition to our customers' design cycle, may result in uncertainty and delays in generating revenues.
The production of our image sensors requires a lengthy manufacturing, packaging and assembly process, typically lasting approximately 12-14 weeks. Additional time may pass before a customer commences taking volume shipments of products that incorporate our image sensors. Even when a manufacturer decides to design our image sensors into its products, the manufacturer may never ship final products incorporating our image sensors. Given this lengthy cycle, we experience a delay between the time we incur expenditures for research and development and sales and marketing efforts and the time we generate revenue, if any, from these expenditures. This delay makes it more difficult to forecast customer demand, which adds uncertainty to the manufacturing planning process and could adversely affect our operating results. In addition, the product life cycle for certain of our image-sensor products designed for use in certain applications can be relatively short. If we fail to appropriately manage the manufacturing, packaging and assembly process, our products may become obsolete before they can be incorporated into our customers' products and we may never realize a return on investment for the expenditures we incur in developing and producing these products.
35
Our ability to deliver products that meet customer demand is dependent upon our ability to meet new and changing requirements for color filter application and image-sensor packaging.
We expect that as we develop new products to meet technological advances and new and changing industry and customer demands, our color filter application and ceramic, plastic and chip scale packaging requirements will also evolve. Our ability to continue to profitably deliver products that meet customer demand is dependent upon our ability to obtain third party services that meet these new requirements on a cost-effective basis. There can be no assurances that any of these parties will be able to develop enhancements to the services they provide to us to meet these new and changing industry and customer requirements. Furthermore, even if these service providers are able to develop their services to meet new and evolving requirements, these services may not be available at a cost that enables us to sustain our profitability.
The high level of complexity and integration of our products increases the risk of latent defects, which could damage customer relationships and increase our costs.
Our products are based upon evolving technology, and because we integrate many functions on a single chip, are highly complex. The integration of additional functions into already complex products could result in a greater risk that customers or end-users could discover latent defects or subtle faults after we have already shipped significant quantities of a product. Although we test our products, we have in the past and may in the future encounter defects or errors. Delivery of products with defects or reliability, quality or compatibility problems may damage our reputation and ability to retain existing customers and attract new customers. In addition, product defects and errors could result in additional development costs, diversion of technical resources, delayed product shipments, increased product returns, product warranty costs for recall and replacement and product liability claims against us which may not be fully covered by insurance.
We may be required to record a significant charge to earnings if our goodwill, intangible assets or long-term investments become impaired.
Under generally accepted accounting principles, we are required to review our intangible assets for impairment when events or changes in circumstances indicate the carrying value may not be recoverable. Factors that may be considered a change in circumstances indicating that the carrying value of our intangible assets may not be recoverable include a decline in stock price and market capitalization, and slower growth rates in our industry.
We may be required to record a significant charge to earnings in our financial statements during the period in which we determine that our intangible assets or long-term investments have been impaired. Any such charge would adversely impact our results of operations. As of April 30, 2015, our goodwill totaled approximately $10.2 million, our intangible assets totaled approximately $52.3 million and our long-term investments totaled approximately $192.0 million.
If we need additional capital in the future, it may not be available to us on favorable terms, or at all.
Our cash, cash equivalents and short-term investments, in total, has increased in fiscal 2015 primarily from cash provided by operating activities. Although we currently expect our available cash, cash equivalents and short-term investments, together with cash we anticipate generating from operating activities, will be sufficient to satisfy our capital requirements over approximately the next twelve months and foreseeable future, if we are unable to sell our inventories or collect on our accounts receivable as anticipated, we may be required to raise additional capital through equity or debt financing. Such additional financing may not be available on acceptable terms, or at all, and could have a material adverse effect on our business, financial condition, operating results and cash flows. If we raise additional funds through issuances of equity, convertible debt securities or other securities
36
convertible into equity, our existing stockholders could suffer significant dilution in their percentage ownership and any new securities we issue could have rights, preferences and privileges senior to those of holders of our common stock.
We maintain a backlog of customer orders that is subject to cancellation or delay in delivery schedules, and any cancellation or delay may result in lower than anticipated revenues.
Our sales are generally made pursuant to standard purchase orders. We include in our backlog only those customer orders for which we have accepted purchase orders and assigned shipment dates within the upcoming 12 months. Orders constituting our current backlog are subject to cancellation or changes in delivery schedules, and backlog may not necessarily be an indication of future revenue. Any cancellation or delay in orders which constitute our current or future backlog may result in lower than expected revenues.
If we are unable to maintain processes and procedures to sustain effective internal control over our financial reporting, our ability to provide reliable and timely financial reports could be harmed and this could have a material adverse effect on our stock price.
We are required to comply with the rules promulgated under Section 404 of the Sarbanes-Oxley Act of 2002, or Sarbanes-Oxley Act. Section 404 requires that we prepare an annual management report assessing the effectiveness of our internal control over financial reporting, and requires a report by our independent registered public accounting firm addressing the effectiveness of our internal control over financial reporting.
We have in the past discovered, and may in the future discover, areas of our internal control that need improvement. If issues were to arise with respect to our internal controls in future periods, they could impair our ability to produce accurate and timely financial reports.
As our business changes, ongoing compliance with the provisions of Section 404 of the Sarbanes-Oxley Act and maintenance of effective internal control over financial reporting may require that we hire additional qualified finance and accounting personnel. Because other businesses face similar challenges, there is significant competition for such personnel, and there can be no assurance that we will be able to attract and/or retain suitably qualified employees.
Corporate governance regulations have increased our compliance costs and could further increase our expenses if changes occur within our business.
We are subject to corporate governance laws and regulations affecting public companies, including the provisions of the Sarbanes-Oxley Act and the Dodd-Frank Act of 2010 that impose certain requirements on us and on our officers, directors, attorneys and independent registered public accounting firm. In order to comply with these rules, we added internal resources and have utilized additional outside legal, accounting and advisory services, which increased our operating expenses. We expect to incur ongoing operating expenses as we maintain compliance with Section 404. In addition, if we undergo significant modifications to our structure through personnel or system changes, acquisitions, or otherwise, it may be increasingly difficult to maintain compliance with the existing and evolving corporate governance regulations.
We hold a significant amount of marketable securities which are subject to general market risks over which we have no control.
As of April 30, 2015, we held cash and cash equivalents totaling $318.9 million, and short-term investments totaling $205.3 million. These assets are managed on our behalf by unrelated third parties in accordance with a cash management policy that has been approved by our board of directors and restricts our investments to a maximum maturity of 18 months and to investment-grade instruments. As
37
of April 30, 2015, we did not hold any illiquid investments and we have not realized any losses. In the past, uncertainties in global capital markets associated with a repricing of risk had caused disruptions in the orderly function of markets which are ordinarily characterized by virtually unlimited liquidity. If we were to make a future investment in certain illiquid securities that are dependent on the orderly functioning of the capital markets, and if we were required to liquidate these types of securities at short notice, such liquidation could result in losses of principal, which would have a negative impact on our results of operations and cash flows.
We may experience integration or other problems with potential future acquisitions, which could have an adverse effect on our business or results of operations. New acquisitions could dilute the interests of existing stockholders, and the announcement of new acquisitions could result in a decline in the price of our common stock.
We may acquire, or invest in, businesses that offer products, services and technologies that we believe would complement our products, including CMOS image-sensor manufacturers. We may also make acquisitions of, or investments in, businesses that we believe could expand our distribution channels. Even if we were to announce an acquisition, we may not be able to complete it. In addition, any future acquisition or substantial investment could present numerous risks, including:
- •
- difficulty in realizing the potential technological benefits of the transaction;
- •
- difficulty in integrating the technology, operations or work force of the acquired business with our existing business;
- •
- unanticipated expenses related to technology integration;
- •
- disruption of our ongoing business;
- •
- difficulty in realizing the potential financial or strategic benefits of the transaction;
- •
- difficulty in maintaining uniform standards, controls, procedures and policies;
- •
- possible impairment of relationships with employees, customers, suppliers and strategic partners as a result of integration of new
businesses and management personnel;
- •
- reductions in our future operating results from amortization of intangible assets;
- •
- impairment of resulting goodwill; and
- •
- potential unknown or unexpected liabilities associated with acquired businesses.
We expect that any future acquisitions could include consideration to be paid in cash, shares of our common stock or a combination of cash and our common stock. If and when consideration for a transaction is paid in common stock, it will result in dilution to our existing stockholders.
We may not achieve continued benefits from our joint venture with TSMC.
In October 2003, together with TSMC, we formed VisEra, a joint venture in Taiwan, for the purposes of providing manufacturing services. Since its formation, TSMC and we have expanded the scope of VisEra's activities through the provision of additional funding.
In January 2006, VisEra acquired certain color filter application equipment from TSMC and assumed direct responsibility for providing the color filter application services that had previously been provided to us by TSMC. We expect that VisEra will be able to provide us with a committed supply of high quality manufacturing services at competitive prices. However, there are significant legal, governmental and relationship risks to managing the business scope of VisEra, and we cannot ensure that we will continue to receive the expected benefits from the joint venture. For example, VisEra may not be able to provide manufacturing services that have competitive technology or prices, which could
38
adversely affect our product offerings and our ability to meet customer requirements for our products. In addition, the existence of VisEra may also make it more difficult for us to secure dependable services from competing merchant vendors who provide similar manufacturing services.
We may not achieve all of the anticipated benefits of our alliances with, and strategic investments in, third parties.
We expect to develop our business partly through forming alliances or joint ventures with and making strategic investments in other companies, some of which may be companies at a relatively early stage of development. For example, we have made an investment in XinTec, a company that provides CSP packaging services, and WLCSP, a company that also provides chip scale packaging services.
Our investments in these and other companies may negatively impact our operating results, because, under certain circumstances, we are required to recognize our portion of any loss recorded by each of these companies or to consolidate them into our operating results. We expect to continue to utilize partnerships, strategic alliances and investments, particularly those that enhance our manufacturing capacity and those that provide manufacturing services and testing capability. These investments and partnering arrangements are crucial to our ability to grow our business and meet the increasing demands of our customers. However, we cannot ensure that we will achieve the benefits we expect from these alliances. For example, we may not be able to obtain acceptable quality and/or wafer manufacturing yields from these companies, which could result in higher operating costs and could impair our ability to meet customer demand for our products. In addition, certain of these investments or partnering relationships may place restrictions on the scope of our business, the geographic areas in which we can sell our products and the types of products that we can manufacture and sell. For example, our agreement with TSMC provides that we may not engage in business that will directly compete with the business of VisEra. This type of non-competition provision may impact our ability to grow our business and to meet the demands of our customers.
Changes in our relationships with our joint venture and/or companies in which we hold less than a majority interest could change the way we account for such interests in the future.
As part of our strategy, we have formed a joint venture with one of our foundry partners, and we hold equity interests in other companies from which we purchase certain manufacturing services. For the investments that we account for under the equity method, we record as part of income or expense our share of the increase or decrease in the equity of the companies in which we have invested. It is possible that, in the future, our relationships and/or our interests in or with our joint venture or other investees could change. Such changes have resulted in the past, and could result in the future, in deconsolidation or consolidation of such entities, as the case may be, which could result in changes in our reported results.
The use of our image sensors in end-user products in the medical and automotive industries could result in us being named as a defendant in product liability claims, which could adversely affect our business and reputation.
Our image sensors have been incorporated into certain end-user products in the medical and automotive industries, and we expect that they will continue to increase as a percentage of our overall business. The use of the medical and automotive industry products into which our image sensors are designed could result in an unsafe condition, injury, or even death as a result of, among other factors, component failures, manufacturing flaws, design defects or inadequate disclosure of product-related risks or product-related information. These factors could result in product liability claims seeking damages for personal injury, and we could be named as a defendant in such claims. Because the outcome of product liability claims is not predictable and is difficult to assess or quantify, we cannot
39
provide assurance that such claims will not materially adversely affect our business or damage the reputation of our products or our company.
If we do not effectively manage our growth, our ability to increase our revenues and improve our earnings could be adversely affected.
Our growth has placed, and will continue to place, a significant strain on our management and other resources. To manage our growth effectively, we must, among other things:
- •
- continuously improve our operational, financial and accounting systems;
- •
- train, manage and maintain good relations with our existing employee base in both our U.S. and international locations;
- •
- attract and retain qualified personnel with relevant experience; and
- •
- effectively manage accounts receivable and inventory.
For example, our failure to effectively manage our inventory levels could result either in excess inventories, which could adversely affect our gross margins and operating results, or lead to an inability to fill customer orders, which would result in lower sales and could harm our relationships with existing and potential customers.
We must also manage multiple relationships with customers, business partners and other third parties, such as our foundries and process and assembly vendors. Moreover, future growth could significantly overburden our management and financial systems and other resources. We may not make adequate allowances for the costs and risks associated with our expansion. In addition, our systems, procedures or controls may not be adequate to support our operations, and we may not be able to expand quickly enough to capitalize on potential market opportunities. Our future operating results will also depend, in part, on our ability to expand sales and marketing, research and development, accounting, finance and administrative support.
Our future tax rates and tax payments could be higher than we anticipate and may harm our results of operations.
As a multinational corporation, we conduct our business in many countries and are subject to taxation in many jurisdictions. The taxation of our business is subject to the application of multiple and sometimes conflicting tax laws and regulations as well as multinational tax conventions. The application of tax law is subject to legal and factual interpretation, judgment and uncertainty. For example, we were under tax examination in a foreign jurisdiction starting from the fiscal year ended April 30, 2004. This tax examination was concluded in November 2014. We may be involved in similar tax examinations in the future that could result in additional expense and time spent cooperating with such examinations, and may have a negative effect on our financial results depending on the outcome of such examinations.
Furthermore, tax laws themselves are subject to change. For example, the U.S Congress may introduce tax reform proposals that will affect the taxation of foreign earnings. The Group of Twenty Finance Ministers and Central Bank Governors, or G-20, has also approved an action plan from the Organization for Economic Co-operation and Development to address perceived problems of corporate income tax avoidance through aggressive tax planning. Consequently, taxing authorities may impose tax assessments or judgments against us that could result in a significant charge to our earnings or otherwise negatively impact our financial results.
A number of other factors will also affect our future tax rate, and some of these factors could increase our effective tax rate in future periods, which could adversely impact our operating results. These factors include changes in non-deductible stock-based compensation, changes in tax laws or the
40
interpretation of tax laws, changes in the proportion and geographic mix of our revenue or earnings, changes in the valuation of our deferred tax assets and liabilities, changes in available tax credits, the resolution of issues arising from tax audits, and the repatriation of non-U.S. earnings for which we have not previously provided U.S. taxes.
We continually review our tax positions and provide for, or reverse, unrecognized tax benefits as issues arise.
Tax benefits that we receive may be terminated or revoked in the future and, as a result, may harm our results of operations.
In fiscal 2013, we obtained a partial tax holiday from the Singapore Economic Development Board, an agency of the Government of Singapore. This partial tax holiday allows for reduced rates of Singapore income tax on certain classes of income generated from our business operations in Singapore from September 1, 2012 through August 31, 2022. As a result, we anticipate that a significant portion of the income we earn in Singapore during this period will be taxed at the reduced rates of Singapore income tax. For fiscal 2015, the effect of the Singapore partial tax holiday, in the aggregate, was increasing the overall benefit from income taxes from what it otherwise would have been by $25.0 million, thus increasing diluted net income per share by $0.42.
In order to retain these tax benefits in Singapore, we must meet several requirements as to capital and business spending, headcount and activities. If we fail to meet these requirements or if the Singapore government enacts changes to existing tax laws or regulations, the tax benefits that we have received may be terminated, revoked, or reduced, which could adversely affect our results of operations.
Our sales through distributors increase the complexity of our business and may reduce our ability to forecast revenues.
During fiscal 2014 and fiscal 2015, approximately 18.8% and 24.7%, respectively, of our revenues came from sales through distributors. We expect that revenues from sales through distributors will vary from year to year, but will continue to represent a significant proportion of our total revenues. Selling through distributors reduces our ability to accurately forecast sales and increases the complexity of our business, requiring us to, among other matters:
- •
- manage a more complex supply chain;
- •
- manage the level of inventory at each distributor;
- •
- provide for credits, return rights and price protection;
- •
- estimate the impact of credits, return rights, price protection and unsold inventory at distributors; and
- •
- monitor the financial condition and creditworthiness of our distributors.
Any failure to manage these challenges could cause us to inaccurately forecast sales and carry excess or insufficient inventory, thereby adversely affecting our operating results and cash flows.
Our business could be harmed if we lose the services of one or more members of our senior management team, or if we are unable to attract and retain qualified personnel.
The loss of the services of one or more of our executive officers or key employees, which has occurred from time to time, or the decision of one or more of these individuals to join a competitor, could adversely affect our business and harm our operating results and financial condition. Our success depends to a significant extent on the continued service of our senior management and certain other
41
key technical personnel. None of our senior management is bound by an employment or non-competition agreement. We do not maintain key man life insurance on any of our employees.
Our success also depends on our ability to identify, attract and retain qualified sales, marketing, finance, management and technical personnel. We have experienced, and may continue to experience, difficulty in hiring and retaining candidates with appropriate qualifications. The pending acquisition by the Consortium may create uncertainty for our employees, which could adversely affect our ability to retain key employees and hire new talents. If we do not succeed in hiring and retaining candidates with appropriate qualifications, our revenues, operations and product development efforts could be harmed.
We substantially completed the implementation of a new enterprise resource planning system, a process which presents a number of significant operational risks.
As our business grows and becomes more complex, it is necessary that we expand and upgrade our enterprise resource planning system, or ERP, and other management information systems which are critical to the operational, accounting and financial functions of our company. We evaluated alternative solutions, both short-term and long-term, to meet the operating, administrative and financial reporting requirements of our business. We have made and will continue to make further enhancements and upgrades to the ERP, as necessary. Significant management attention and resources have been used and extensive planning has occurred to support effective implementation of the new ERP system. However, such implementation, as well as enhancements or upgrades to the system carries certain risks, including the risk of significant design errors that could materially and adversely affect our operating results and impact our ability to manage our business. As a result, there is a risk that deficiencies may exist in the future and that they could constitute significant deficiencies, or, in the aggregate, a material weakness in internal control over financial reporting.
Our operations may be impaired as a result of disasters, business interruptions or similar events.
Disasters and business interruptions such as earthquakes, water, fire, electrical failure, accidents and epidemics affecting our operating activities, major facilities, and employees' and customers' health could materially and adversely affect our operating results and financial condition. In particular, our Asian operations and most of our third party service providers involved in the manufacturing of our products are located within relative close proximity. Therefore, any disaster that strikes within or close to that geographic area, such as the earthquake and flooding that occurred in China, could be extremely disruptive to our business and could materially and adversely affect our operating results and financial condition. We are currently developing and implementing a disaster recovery plan.
Acts of war and terrorist acts may seriously harm our business and revenue, costs and expenses and financial condition.
Acts of war or terrorist acts, wherever they occur around the world, may cause damage or disruption to our business, employees, facilities, suppliers, distributors or customers, which could significantly impact our revenue, costs, expenses and financial condition. In addition, as a company with significant operations and major distributors and customers located in Asia, we may be adversely impacted by heightened tensions and acts of war that occur in locations such as the Korean Peninsula, Taiwan and China. The potential for future terrorist attacks, the national and international responses to terrorist attacks or perceived threats to national security, and other acts of war or hostility have created many economic and political uncertainties that could adversely affect our business and results of operations in ways that cannot presently be predicted. We are uninsured for losses and interruptions caused by terrorist acts and acts of war.
42
New regulations related to conflict minerals may cause us to incur additional expenses and could limit the supply and increase the cost of certain metals used in the manufacturing of our products.
As a public company, we are subject to new requirements under the Dodd-Frank Act of 2010 that require us to exercise due diligence, disclose and report whether or not our products contain conflict minerals The implementation of these new requirements could adversely affect the sourcing, availability and pricing of the minerals used in the manufacture of our products. In addition, we will incur additional costs to comply with the disclosure requirements, including costs related to conducting diligence procedures to determine the sources of conflict minerals that may be used or necessary to the production of our products and, if applicable, potential changes to products, processes or sources of supply as a consequence of such verification activities. It is also possible that we may face reputational harm if we determine that certain of our products contain minerals not determined to be conflict free or if we are unable to alter our products, processes or sources of supply to avoid such materials.
Risks Related to the Securities Markets and Ownership of Our Common Stock
Our stock has been and will likely continue to be subject to substantial price and volume fluctuations due to a number of factors, many of which are beyond our control that may prevent our stockholders from selling our common stock at a profit.
The market price of our common stock has fluctuated substantially, and there can be no assurance that such volatility will not continue. Since the beginning of fiscal 2002 through June 22, 2015, the closing sales price of our common stock has ranged from a high of $36.42 per share to a low of $1.18 per share. The closing sales price of our common stock on June 22, 2015 was $26.67 per share. The securities markets have experienced significant price and volume fluctuations in the past, and the market prices of the securities of semiconductor companies have been especially volatile. This market volatility, as well as the outcome of the pending acquisition by the Consortium, and general economic, market or political conditions, including the current global economic situation, could reduce the market price of our common stock in spite of our operating performance. The market price of our common stock may fluctuate significantly in response to a number of factors, including:
- •
- developments with respect to the pending acquisition by the Consortium;
- •
- actual or anticipated fluctuations in our operating results;
- •
- changes in expectations as to our future financial performance;
- •
- changes in financial estimates of securities analysts;
- •
- release of lock-up or other transfer restrictions on our outstanding shares of common stock or sales of additional shares of common
stock;
- •
- sales or the perception in the market of possible sales of shares of our common stock by our directors, officers, employees or
principal stockholders;
- •
- changes in market valuations of other technology companies; and
- •
- announcements by us or our competitors of significant technical innovations, design wins, contracts, standards or acquisitions.
Due to these factors, the price of our stock may decline and investors may be unable to resell their shares of our stock for a profit. In addition, the stock market experiences extreme volatility that often is unrelated to the performance of particular companies. These market fluctuations may cause our stock price to decline regardless of our performance.
43
Provisions in our charter documents and Delaware law could prevent or delay a change in control of our company and may reduce the market price of our common stock.
Provisions of our certificate of incorporation and bylaws may discourage, delay or prevent a merger or acquisition that a stockholder may consider favorable. These provisions include:
- •
- adjusting the price, rights, preferences, privileges and restrictions of preferred stock without stockholder approval;
- •
- providing for a classified board of directors with staggered, three-year terms;
- •
- requiring supermajority voting to amend some provisions in our certificate of incorporation and bylaws;
- •
- limiting the persons who may call special meetings of stockholders; and
- •
- prohibiting stockholder actions by written consent.
Provisions of Delaware law also may discourage, delay or prevent another company from acquiring or merging with us. Our board of directors could adopt a preferred stock rights agreement. If adopted, the exercise of rights under the rights agreement could have the effect of delaying, deferring or preventing a change of control of our company, including, without limitation, discouraging a proxy contest or making more difficult the acquisition of a substantial block of our common stock. The rights agreement could also limit the price that investors might be willing to pay in the future for our common stock.
44
ITEM 1B. UNRESOLVED STAFF COMMENTS
None.
Our principal offices are located in a complex of four buildings in Santa Clara County, California, or our Santa Clara Property, totaling approximately 207,000 square feet, which we purchased for an aggregate price of approximately $37.5 million in March 2007. In connection with the purchase of our Santa Clara Property, we have also obtained a mortgage loan from a domestic bank, in the principal amount of approximately $27.9 million. (See Note 7—"Borrowing Arrangements and Related Derivative Instruments".)
In January 2007, we entered into a land-use-right agreement with the Construction and Transportation Commission of the Pudong New District, Shanghai through OTC. Under the terms of the agreement, we paid an aggregate amount of approximately $0.6 million in exchange for the right to use approximately 323,000 square feet of land located in Shanghai for a period of 50 years, starting from December 31, 2006. We also obtained a fixed asset loan in the principal amount of approximately $20.5 million, based on the exchange rate in effect at the time of the loan origination, to finance the construction of a research facility on site. (See Note 7—"Borrowing Arrangements and Related Derivative Instruments".)
In December 2000, we entered into a land-use-right agreement with the Shanghai SongJiang Housing and Land Administration Bureau through OSC. Under the terms of the agreement, we paid an aggregate amount of approximately $0.8 million in exchange for the right to use approximately 447,400 square feet of land located in Shanghai, China. Since then, we have built facilities on site for the testing and fabrication of our various products. The land-use right will expire in December 2051.
In July 2011, we entered into a land-use-right agreement with the Shanghai Song Jiang District Zoning and Land Administration Bureau through OST. Under the terms of the agreement, we paid an aggregate amount of approximately $1.0 million in exchange for the right to use approximately 113,175 square feet of land located in Shanghai for a period of 50 years, starting from August 19, 2011.
We believe that our existing or readily available facilities are suitable and adequate for our present purposes.
From time to time, we have been subject to legal proceedings and claims with respect to such matters as patents, product liabilities and other actions arising out of the normal course of business.
Ziptronix, Inc. v. OmniVision Technologies, Inc., Taiwan Semiconductor Manufacturing Company Ltd., and TSMC North America Corp.
On December 6, 2010, Ziptronix, Inc., or Ziptronix, filed a complaint alleging patent infringement against us in the District Court for the Northern District of California. The case is entitled Ziptronix, Inc. v. OmniVision Technologies, Inc., Taiwan Semiconductor Manufacturing Company Ltd., and TSMC North America Corp., Case No. CV10-05525. In its complaint, Ziptronix asserts that we have made, used, offered to sell, sold and/or imported into the United States image sensors that infringe the following six patents: U.S. Patent Nos. 7,387,944 ("Method for Low Temperature Bonding and Bonded Structure"), 7,335,572 ("Method for Low Temperature Bonding and Bonded Structure"), 7,553,744 ("Method for Low Temperature Bonding and Bonded Structure"), 7,037,755 ("Three Dimensional Device Integration Method and Integrated Device"), 6,864,585 ("Three Dimensional Device Integration Method and Integrated Device"), and 7,807,549 ("Method for Low Temperature Bonding and Bonded Structure"). The complaint seeks unspecified monetary damages, enhanced damages, interest, fees,
45
expenses, costs, and injunctive relief against us. We answered the complaint on May 4, 2011 and denied each of Ziptronix's infringement claims against us.
On November 22, 2011, Defendants Taiwan Semiconductor Manufacturing Company Ltd., and TSMC North America Corp. (collectively "TSMC") filed amended counterclaims asserting that Ziptronix has infringed, actively induced infringement of, and/or induced contributory infringement of the following five patents: U.S. Patent Nos. 6,682,981 ("Stress Controlled Dielectric Integrated Circuit Fabrication"), 7,307,020 ("Membrane 3D IC Fabrication"), 6,765,279 ("Membrane 3D IC Fabrication"), 7,385,835 ("Membrane 3D IC Fabrication"), and 6,350,694 ("Reducing CMP Scratch, Dishing and Erosion by Post CMP Etch Back Method for Low-K Materials"). Ziptronix answered the amended counterclaims on December 9, 2011 and denied each of TSMC's infringement claims against it.
On August 9, 2012, Ziptronix filed a second amended complaint adding claims that the defendants infringe the following three patents: U.S. Patent Nos. 8,153,505 ("Method for Low Temperature Bonding and Bonded Structure"), 8,043,329 ("Method for Low Temperature Bonding and Bonded Structure"), and 7,871,898 ("Method for Low Temperature Bonding and Bonded Structure"). We answered the second amended complaint on August 27, 2012, and denied each of Ziptronix's infringement claims against us.
Claim construction briefing has been submitted, but there is no claim construction hearing currently scheduled. On September 30, 2014, the court granted TSMC's motion for summary judgment of noninfringement based on extraterritoriality issues. On March 2, 2015, the court granted our motion for summary judgment of noninfringement of our non-U.S. sales. The court's summary judgment motion addresses most of Ziptronix's infringement claims asserted in the case and we expect to vigorously defend ourselves against Ziptronix's remaining allegations of infringement. We are currently unable to predict the ultimate outcome of this case and therefore cannot determine the likelihood of loss nor estimate the loss or a range of possible loss.
Securities Litigation
On October 26, 2011, the first of several putative class action complaints was filed in the United States District Court for the Northern District of California against us and three of our executives, one of whom is a director. All of the complaints alleged that the defendants violated the federal securities laws by making misleading statements or omissions regarding our business and financial results, in particular regarding the use of our imaging sensors in Apple Inc.'s iPhone. These actions have been consolidated as In re OmniVision Technologies, Inc. Litigation, Case No. 11-CV-5235 (RMW) (the "Securities Case"). On April 23, 2012, plaintiffs filed a consolidated complaint on behalf of a purported class of purchasers of our common stock between August 27, 2010 and November 6, 2011, seeking unspecified damages. On March 29, 2013, the court denied the defendants' motion to dismiss. On December 30, 2014, the parties entered into a stipulation and agreement of settlement to resolve the litigation, which was then submitted to the court for preliminary approval. The stipulation and agreement of settlement provides for a payment of $12.5 million to the plaintiff class, which is funded solely by our insurance carriers. We also entered into a mutual release agreement with one of our insurance carriers. In March 2015, the court entered an order granting preliminary approval of the settlement and ordering notice to the putative plaintiff class. On June 5, 2015, the court granted final approval of the settlement and entered a final judgment and order dismissing the action.
As of April 30, 2015, prior to the court granting final approval of the settlement, we reported on our Consolidated Balance Sheet $12.5 million as Recoverable insurance proceeds within Total current assets, and $12.5 million as Litigation settlement accrual within Total current liabilities.
Derivative Litigation
On November 15, 2011, the first of three shareholder derivative complaints was filed in the Superior Court of California, County of Santa Clara, against several of our current and former officers
46
and directors. These three state court actions were consolidated under the caption In re OmniVision Technologies, Inc. Derivative Litigation, Case No. 1-12-CV-216875. On March 21, 2012, a fourth similar shareholder derivative complaint captioned Carpenters Pension Fund of West Virginia v. Shaw Hong, et al., Case No. 12-CV-1423, was filed in the United States District Court for the Northern District of California. On May 10, 2012, a fifth similar shareholder derivative complaint captioned Edker Pope v. Shaw Hong, et. al., Case No. 7514, was filed in the Court of Chancery of the State of Delaware. These complaints make allegations similar to those presented in the Securities Case, but they assert various state law causes of action, including claims of breach of fiduciary duty and unjust enrichment. All of these derivative complaints seek unspecified damages on behalf of us. We are named solely as a nominal defendant against whom no recovery is sought. The proceedings in these derivative actions have been stayed by agreement. We are currently unable to predict the outcome of these actions and therefore cannot determine the likelihood of loss nor estimate the loss or a range of possible loss.
Raytheon Company v. Sony Corporation, OmniVision Technologies, Inc., and Apple, Inc.
On March 6, 2015, Raytheon Company ("Raytheon") filed a complaint alleging patent infringement against us in the District Court for the Eastern District of Texas. The case is entitled Raytheon Co. v. Sony Corp. et al., Case No. 2:15-CV-00342-JRG-RSP. In its complaint, Raytheon asserts that we have made, used, offered to sell, sold and/or imported into the United States image sensors that infringe U.S. Patent No. 5,591,678 (the "'678 Patent"). The complaint seeks unspecified monetary damages, interest, fees, expenses, costs and other equitable relief against us. We answered the complaint on May 1, 2015 and denied each of Raytheon's infringement claims against us. In addition, the '678 Patent expired in January 2014. We are currently unable to predict the ultimate outcome of this case and therefore cannot determine the likelihood of loss nor estimate the loss or a range of possible loss.
Merger Litigation
In connection with the Merger Agreement and the transactions contemplated thereby, a number of putative class action lawsuits have been filed in the Superior Court of the State of California, County of Santa Clara. The actions filed Pope v. OmniVision Technologies, Inc., et al., No. 15-CV-280161 (filed May 4, 2015); Francisco v. Xiaoying, et al., No. 15-CV-280270 (filed May 6, 2015); Agee v. OmniVision Technologies, Inc., No. 15-CV-280311 (filed May 7, 2015); Levine v. OmniVision Technologies, Inc., No. 15-CV-280344 (filed May 7, 2015); O'Donnell v. OmniVision Technologies, Inc., No. 15-CV-280411 (filed May 8, 2015); Smith v. Hong, et al., No. 15-CV-280863 (filed May 19, 2015); and Nido v. OmniVision Technologies, Inc., No. 15-CV-281031 (filed May 22, 2015). In general, the various complaints assert that, among other things, the members of the Board of Directors breached their fiduciary duties to OmniVision's stockholders by engaging in a process that was not designed to, and did not, maximize the stockholders' value, and that OmniVision and the proposed acquiring entities aided and abetted the Board of Directors' alleged breaches of fiduciary duties. The complaints generally seek to enjoin the merger, rescission of the merger to the extent it is implemented, or alternatively, rescissionary damages. On June 2, 2015, the actions were consolidated under the caption In re OmniVision Technologies, Inc. Shareholder Litigation, No. 15-CV-280161. On June 8, 2015, a consolidated amended complaint was filed. The amended complaint adds allegations that the Board of Directors breached their fiduciary duties by issuing a false and misleading preliminary proxy statement. The amended complaint also adds allegations that J.P. Morgan aided and abetted the directors' alleged breaches of fiduciary duty. We currently are unable to predict the outcome of this action and therefore cannot determine the likelihood of loss nor estimate the loss or a range of possible loss.
ITEM 4. MINE SAFETY DISCLOSURES
Not applicable.
47
ITEM 5. MARKET FOR REGISTRANT'S COMMON EQUITY, RELATED STOCKHOLDER MATTERS AND ISSUER PURCHASES OF EQUITY SECURITIES
Price Range of Common Stock
Our common stock has been quoted on the NASDAQ Global Market under the symbol "OVTI" since our initial public offering in July 2000. Prior to that time, there was no public market for our common stock. The following table sets forth for the periods indicated the high and low sale prices per share of our common stock as reported on the NASDAQ Global Market.
| |
High | Low | |||||
|---|---|---|---|---|---|---|---|
Fiscal 2015: |
|||||||
First quarter |
$ | 24.04 | $ | 18.68 | |||
Second quarter |
28.29 | 22.79 | |||||
Third quarter |
28.91 | 25.18 | |||||
Fourth quarter |
27.90 | 25.19 | |||||
Fiscal 2014: |
|||||||
First quarter |
$ | 20.22 | $ | 13.05 | |||
Second quarter |
18.41 | 13.75 | |||||
Third quarter |
17.20 | 13.75 | |||||
Fourth quarter |
19.91 | 14.22 | |||||
On June 22, 2015, the reported last sale price of our common stock on the NASDAQ Global Market was $26.67 per share. As of June 22, 2015, there were 39 holders of record of our common stock. This number does not include stockholders whose shares are held in trust by other entities. The actual number of stockholders is greater than this number of holders of record. We estimate that the number of beneficial stockholders of the shares of our common stock as of June 22, 2015 was approximately 15,000.
Dividend Policy
We have never declared or paid cash dividends on our capital stock. We currently expect to retain our future earnings, if any, for use in the operation and expansion of our business and do not anticipate paying any cash dividends in the next 12 months.
Purchases of Equity Securities by the Issuer and Affiliated Purchasers
We did not repurchase any shares of our common stock in the fourth quarter of fiscal 2015.
Performance Graph
Notwithstanding any statement to the contrary in any of our previous or future filings with the SEC, the following information relating to the price performance of our common stock shall not be deemed "filed" with the SEC or "Soliciting Material" under the Securities Exchange Act of 1934, as amended, or subject to Regulation 14A or 14C, or to liabilities of Section 18 of the Exchange Act except to the extent we specifically request that such information be treated as soliciting material or to the extent we specifically incorporate this information by reference.
The following is a line graph comparing the cumulative total return to stockholders of our common stock at April 30, 2015 since April 30, 2010, to the cumulative total return over such period of (i) The NASDAQ Composite Index and (ii) the S&P Semiconductors Index.
48
COMPARISON OF 5 YEAR CUMULATIVE TOTAL RETURN*
Among OmniVision Technologies, Inc., the NASDAQ Composite Index
and the S&P Semiconductors Index
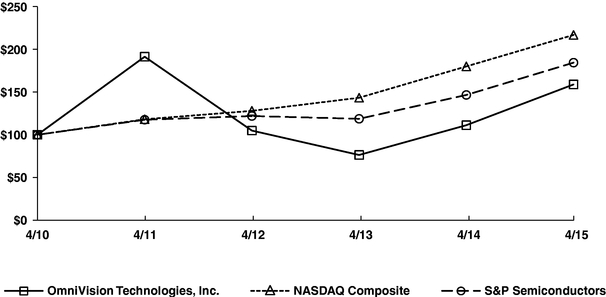
*$100 invested on 4/30/10 in stock or index, including reinvestment of dividends. Fiscal year ending April 30.
| |
4/10 | 4/11 | 4/12 | 4/13 | 4/14 | 4/15 | |||||||||||||
|---|---|---|---|---|---|---|---|---|---|---|---|---|---|---|---|---|---|---|---|
OmniVision Technologies, Inc. |
100.00 | 191.31 | 104.91 | 76.38 | 111.23 | 158.88 | |||||||||||||
NASDAQ Composite |
100.00 | 118.14 | 127.98 | 143.35 | 179.99 | 216.80 | |||||||||||||
S&P Semiconductors |
100.00 | 117.61 | 121.94 | 118.70 | 148.60 | 184.37 | |||||||||||||
- *
- Assumes that $100.00 was invested on April 30, 2010 in our common stock and in the NASDAQ Composite Index and the S&P Semiconductor Index, and that all dividends were reinvested. No dividends have been declared on our common stock. Stockholder returns over the indicated period should not be considered indicative of future stockholder returns.
49
ITEM 6. SELECTED FINANCIAL DATA
The following selected consolidated financial data should be read in conjunction with Item 7 "Management's Discussion and Analysis of Financial Condition and Results of Operations" and our consolidated financial statements and the related notes appearing in Item 8 "Financial Statements and Supplementary Data" of this Form 10-K.
The consolidated statements of income data for the years ended April 30, 2013, 2014, and 2015 and the consolidated balance sheet data as of April 30, 2014 and 2015 are derived from our audited consolidated financial statements appearing in Item 8 of this Form 10-K. The consolidated statements of income data for the years ended April 30, 2011 and 2012, and the consolidated balance sheet data as of April 30, 2011, 2012, and 2013, are derived from our audited consolidated financial statements that are not included in this Form 10-K. The historical results are not necessarily indicative of the results to be expected in any future period.
| |
Year Ended April 30, | |||||||||||||||
|---|---|---|---|---|---|---|---|---|---|---|---|---|---|---|---|---|
| |
2015 | 2014 | 2013 | 2012 | 2011 | |||||||||||
| |
(in thousands, except per share data) |
|||||||||||||||
Consolidated Statements of Income data: |
||||||||||||||||
Revenues |
$ | 1,378,775 | $ | 1,453,929 | $ | 1,407,929 | $ | 897,730 | $ | 956,476 | ||||||
Cost of revenues |
1,075,326 | 1,178,207 | 1,163,815 | 649,719 | 678,459 | |||||||||||
| | | | | | | | | | | | | | | | | |
Gross profit |
303,449 | 275,722 | 244,114 | 248,011 | 278,017 | |||||||||||
| | | | | | | | | | | | | | | | | |
Operating expenses: |
||||||||||||||||
Research, development and related |
135,575 | 119,248 | 113,194 | 110,730 | 88,519 | |||||||||||
Selling, general and administrative |
82,462 | 73,292 | 72,958 | 63,883 | 62,817 | |||||||||||
Amortization of acquired patent portfolio |
9,286 | 9,286 | 9,286 | 9,286 | 774 | |||||||||||
| | | | | | | | | | | | | | | | | |
Total operating expenses |
227,323 | 201,826 | 195,438 | 183,899 | 152,110 | |||||||||||
| | | | | | | | | | | | | | | | | |
Income from operations |
76,126 | 73,896 | 48,676 | 64,112 | 125,907 | |||||||||||
Benefit from acquisition of production operations from VisEra(1) |
— | 3,057 | — | 8,626 | — | |||||||||||
Equity in earnings of investee |
4,270 | 4,009 | 3,832 | 3,066 | 2,836 | |||||||||||
Interest expense, net |
(1,523 | ) | (2,029 | ) | (2,700 | ) | (2,106 | ) | (1,150 | ) | ||||||
Other income (expense), net(2) |
3,024 | 25,996 | 356 | (1,050 | ) | 1,114 | ||||||||||
| | | | | | | | | | | | | | | | | |
Income before income taxes |
81,897 | 104,929 | 50,164 | 72,648 | 128,707 | |||||||||||
Provision for (benefit from) income taxes |
(11,493 | ) | 9,932 | 7,262 | 6,799 | 4,225 | ||||||||||
| | | | | | | | | | | | | | | | | |
Net income |
$ | 93,390 | $ | 94,997 | $ | 42,902 | $ | 65,849 | $ | 124,482 | ||||||
| | | | | | | | | | | | | | | | | |
| | | | | | | | | | | | | | | | | |
| | | | | | | | | | | | | | | | | |
Net income per share: |
||||||||||||||||
Basic |
$ | 1.62 | $ | 1.71 | $ | 0.80 | $ | 1.16 | $ | 2.25 | ||||||
| | | | | | | | | | | | | | | | | |
| | | | | | | | | | | | | | | | | |
| | | | | | | | | | | | | | | | | |
Diluted |
$ | 1.57 | $ | 1.70 | $ | 0.80 | $ | 1.13 | $ | 2.11 | ||||||
| | | | | | | | | | | | | | | | | |
| | | | | | | | | | | | | | | | | |
| | | | | | | | | | | | | | | | | |
Shares used in computing net income per share: |
||||||||||||||||
Basic |
57,563 | 55,537 | 53,529 | 56,666 | 55,324 | |||||||||||
| | | | | | | | | | | | | | | | | |
| | | | | | | | | | | | | | | | | |
| | | | | | | | | | | | | | | | | |
Diluted |
59,516 | 56,043 | 53,671 | 58,233 | 59,106 | |||||||||||
| | | | | | | | | | | | | | | | | |
| | | | | | | | | | | | | | | | | |
| | | | | | | | | | | | | | | | | |
50
| |
April 30, | |||||||||||||||
|---|---|---|---|---|---|---|---|---|---|---|---|---|---|---|---|---|
| |
2015 | 2014 | 2013 | 2012 | 2011 | |||||||||||
| |
(in thousands) |
|||||||||||||||
Consolidated Balance Sheet data: |
||||||||||||||||
Cash and cash equivalents |
$ | 318,892 | $ | 297,952 | $ | 190,171 | $ | 290,492 | $ | 379,379 | ||||||
Working capital |
842,923 | 700,029 | 574,476 | 533,241 | 582,052 | |||||||||||
Total assets |
1,468,396 | 1,323,075 | 1,227,014 | 1,102,957 | 1,034,158 | |||||||||||
Total current liabilities |
201,569 | 205,872 | 250,701 | 209,524 | 148,919 | |||||||||||
Long-term income taxes payable(3) |
55,150 | 86,498 | 90,777 | 88,159 | 87,526 | |||||||||||
Non-current portion of long-term debt |
24,999 | 32,030 | 35,709 | 39,337 | 41,916 | |||||||||||
Retained earnings |
691,873 | 598,483 | 503,486 | 460,584 | 394,735 | |||||||||||
Total stockholders' equity |
$ | 1,162,780 | $ | 986,857 | $ | 845,209 | $ | 760,879 | $ | 751,325 | ||||||
- (1)
- In
October 2011, we acquired from VisEra its CameraCubeChip production operations. The purchase consideration was $42.9 million in cash. VisEra
recorded the difference between the cash consideration and the carrying values of the machinery and equipment sold to us as a gain from the sale of the CameraCubeChip production operations'
controlling interest. As we account for our investment in VisEra under the equity method, we recorded in October 2011 a one-time benefit of $8.6 million in "Benefit from acquisition of
production operations from VisEra," representing our portion of the net amount of gain recorded by VisEra. In April 2014, we agreed with VisEra to reduce the final $9.0 million of cash
consideration to $4.5 million. Consequently, we recorded a $3.1 million post-acquisition gain in "Benefit from acquisition of production operations from VisEra."
- (2)
- In
January 2014, the China Securities Regulatory Commission approved the initial public offering ("IPO") of WLCSP. As part of the IPO, WLCSP issued
37.2 million new shares at a per share price of $3.14. The issuance price of $3.14 for the new shares was higher than our average per share carrying value for WLCSP. Consequently, we recognized
a non-cash change-in-interest gain of approximately $14.1 million. We also participated in the IPO as selling shareholder and sold 5.1 million shares, realizing a gain of approximately
$9.7 million. The change-in interest gain and the realized gain from share sale, totaling approximately $23.8 million, was recorded in "Other income (expense), net."
- (3)
- In May 2014, we adopted the accounting guidance regarding the presentation of certain unrecognized tax benefits in the financial statements. Under the guidance, a liability related to an unrecognized tax benefit would be offset against a deferred tax asset for a net operating loss carryforward, a similar tax loss or a tax credit carryforward if such settlement is required or expected in the event the uncertain tax position is disallowed.
51
ITEM 7. MANAGEMENT'S DISCUSSION AND ANALYSIS OF FINANCIAL CONDITION AND
RESULTS OF OPERATIONS
The following information should be read in conjunction with our audited consolidated financial statements and the notes thereto included in Item 8 of this Annual Report on Form 10-K.
Overview
We design, develop and market high performance, highly integrated and cost-efficient semiconductor image-sensor devices. Our main products, image-sensing devices which we refer to as CameraChip™ image sensors, capture an image electronically and are used in a number of consumer and commercial mass-market applications. Our CameraChip image sensors are manufactured using the complementary metal oxide semiconductor, or CMOS fabrication process and are predominantly single-chip solutions that integrate several distinct functions including image capture, image processing, color processing, signal conversion and output of a fully processed image or video stream. We have also integrated our CameraChip image sensors with wafer-level optics, which we refer to as CameraCubeChip imaging devices. Our CameraCubeChip™ imaging device is a small footprint, total camera solution that we believe will enable the further miniaturization of camera products. We believe that our highly integrated image sensors and imaging devices enable camera device manufacturers to build high quality camera products that are smaller, less complex, more reliable, more cost-effective and more power-efficient than cameras using traditional charge-coupled devices, or CCDs.
Proposed Acquisition by Hua Capital Management, CITIC Capital and GoldStone Investment
On April 30, 2015, we entered into a Merger Agreement to be acquired by a consortium composed of Hua Capital Management, CITIC Capital, and GoldStone Investment. Under the terms of the Merger Agreement, OmniVision stockholders will receive $29.75 per share in cash, or a total of approximately $1.9 billion. The agreement was unanimously approved by our Board of Directors. The transaction, which is expected to close in the third or fourth quarter of fiscal 2016, is subject to approval by OmniVision stockholders, regulatory approvals, including antitrust review in the U.S. and the People's Republic of China, review and clearance by the Committee on Foreign Investment in the U.S., clearance or approval under applicable Taiwan law, and other customary closing conditions.
During the year ended April 30, 2015, we incurred approximately $6.1 million of transaction related costs, which was recorded as part of selling, general and administrative expenses in our Consolidated Statements of Income.
Current Economic Environment
We operate in a challenging economic environment that has undergone significant changes in technology and in patterns of global trade. We remain a leader in the development and marketing of image sensing devices based on the CMOS fabrication process and have benefited from the growing market demand for and acceptance of this technology.
A significant amount of our revenues is derived from markets outside of the United States, in particular from the Asian markets. These markets are extremely competitive and we continue to see entrance of new competitors. Due to our reliance on sales in these markets, a slowdown in demand in these markets could have an adverse effect on our financial results. For example, in the third quarter of fiscal 2015, demand for our products slowed down in the China market, possibly attributable to the competitive environment faced by our customers and a protracted upgrade cycle for the local wireless infrastructure. This demand slowdown in the region had negatively impacted our revenues. Given our long-term relationships and established ecosystem in China, we believe that demand for our products in the region will resume. Indeed, for the first quarter of fiscal 2016, business seems to be recovering.
52
ITEM 7. MANAGEMENT'S DISCUSSION AND ANALYSIS OF FINANCIAL CONDITION AND
RESULTS OF OPERATIONS—(Continued)
However, due to our limited visibility and the intense competition in the market, we expect that volatility in the China market, as well as other Asian markets, will continue, at least in the near future.
In the past, we have experienced fluctuations in our financial results due in part to changing macroeconomic conditions. As macroeconomic conditions have improved, our sales have generally also tended to improve and when macroeconomic uncertainties have returned, our sales have generally tended to be negatively impacted, although that has not always been the case. For example, in fiscal 2014, macroeconomic conditions appeared to continue to improve, and our annual sales increased slightly when compared to fiscal 2013. However, for the second half of fiscal 2014, we actually experienced a decline in sales when compared to the similar period in fiscal 2013. Given the continuing uncertainties in the current economic environment and the volatility in our business, we remain cautious and we expect our customers to be cautious as well, which could affect our future results.
Market Environment
We sell our products worldwide directly to OEMs which include branded customers and contract manufacturers, and VARs and indirectly through distributors. In order to ensure that we address all available markets for our image sensors, we organize our marketing efforts into end-use market groups, each of which concentrates on a particular product or, in some cases, customers within a product group. Thus, we have marketing teams that address the mobile phone market, the entertainment market, the notebook and webcam market, the DSC market, the security and surveillance market, and the automotive and medical markets.
In the mobile phone market in particular, future revenues depend to a large extent on an extensive design win process where a particular mobile phone maker determines which image sensor to design into one or more specific models. The time lag between design win and volume shipments varies from as little as three months to as much as 12 months, which could cause an unexpected delay in generating revenues, especially during periods of product transitions. Design wins are also an important driver in the many other markets that we address. In some markets, such as automotive or medical applications, the time lag between a particular design win and revenue generation can be longer than one year.
The overwhelming majority of our sales depend on decisions by the engineering designers for manufacturers of products that incorporate image sensors to specify one of our products rather than one made by a competitor. In most cases, the decision to specify a particular image sensor requires conforming other specifications of the product to the chosen image sensor and makes subsequent changes both difficult and expensive. Accordingly, the ability to produce and deliver reliable products in large quantities and in a timely manner is a key competitive differentiator. Since our inception, we have shipped more than 5.7 billion image sensors, including approximately 872 million in fiscal 2015. We believe that these quantities demonstrate the capabilities of our production system, including our sources of offshore fabrication.
We outsource the wafer fabrication and packaging of our image-sensor products to third parties and our investee companies. We outsource the color filter and micro-lens phases of production to VisEra, our joint venture with the TSMC. This approach allows us to focus our resources on the design, development, marketing and testing of our products and to significantly reduce our capital requirements.
To increase and enhance our production capabilities, we work closely with TSMC, our principal wafer supplier and one of the largest wafer fabrication companies in the world, to increase, as necessary, the number of its fabrication facilities at which our products can be produced. In addition,
53
ITEM 7. MANAGEMENT'S DISCUSSION AND ANALYSIS OF FINANCIAL CONDITION AND
RESULTS OF OPERATIONS—(Continued)
we outsource some of our wafer fabrication needs to PTC. Since the first quarter of fiscal 2015, we have also started to ship products that were fabricated by Huali and XMC. Huali and XMC are the newest additions to our list of qualified wafer fabrication suppliers. Our investments in VisEra and two other key back-end packaging suppliers are part of a broad strategy to ensure that we have sufficient back-end capacity for the processing of our image sensors. To enhance our CameraCubeChip production capabilities, we acquired from VisEra in October 2011 its CameraCubeChip production and assembly operations, which we had previously outsourced to them.
We currently perform the final testing of our packaged products at our own facility in China. As necessary, we will make further investments to expand our testing and production capacity, as well as our overall capability to design additional custom products for our customers.
Since our customers' end-user customers market and sell their products worldwide, our revenues by geographic location are not necessarily indicative of the geographic distribution of end-user sales, but rather indicate where the products and/or their components are manufactured or sourced. The revenues we report by geography are based on the country or region in which our customers issue their purchase orders to us. Recently, our sales mix for products that are used in devices made by end-user customers located in the China market has increased. We anticipate that this market will continue to be a substantial source of our future revenues. In addition, we expect that the India market will become a more significant source of future revenues for us over the next few years.
Many of the products using our image sensors, such as mobile phones, entertainment applications such as tablets and wearable devices, notebooks and webcams, and DSCs are consumer electronics goods. These mass-market camera devices generally have seasonal cycles which historically have caused the sales of our customers to fluctuate quarter-to-quarter. In addition, since a very large number of the manufacturers who use our products are located in China and Taiwan, the pattern of demand for our image sensors has been increasingly influenced by the timing of the extended lunar or Chinese New Year holiday, a period in which the factories which use our image sensors generally close. Consequently, demand for our image sensors has historically been stronger in the second and third quarters of our fiscal year and weaker in the first and fourth quarters of our fiscal year. However, due to macroeconomic uncertainties and changes in our end-user customer demands in the past several years, the seasonal cycle of our business has been less predictable. For example, in fiscal 2014, we experienced a decline in sales of products that were used in mobile phones made by end-user customers located in North America, which was partially offset by an increase in the sale of products that were used in mobile phones made by end-user customers located in China. This change in end-user demand mix altered our quarterly sales pattern in fiscal 2014. Then, in the third quarter of fiscal 2015, when demand for our products slowed down in the China market, our quarterly sales pattern was altered again. Given the current economic environment and continued changes in our end-user demands, we remain cautious toward our near-term business prospects and the return of the historical seasonal cycle of our business. While we believe that the market opportunities represented by mobile phones and entertainment applications such as tablets and wearable devices remain very large, the opportunities presented could be deferred because of the uncertainty surrounding the sustainability of the current global economic recovery.
We believe that, like the DSC market, mobile phone, tablet, notebook and webcam demand will not only continue to shift toward higher resolutions, but also will increasingly fragment into multiple market segments with differing product attributes. For example, we see the further expansion of the smartphone segment within the mobile phone market. In addition, there is increased demand for
54
ITEM 7. MANAGEMENT'S DISCUSSION AND ANALYSIS OF FINANCIAL CONDITION AND
RESULTS OF OPERATIONS—(Continued)
customization, and several different interface standards are coming to maturity. All of these trends will require the development of a broader variety of products.
As the markets for image sensors have grown, we have experienced competition from manufacturers of CMOS and CCD image sensors. Our principal competitors in the market for CMOS image sensors include ON Semiconductor, Samsung, Sharp, Sony, STMicroelectronics and Toshiba. We expect to see continued price competition in the image-sensor market for mobile phones, entertainment devices, notebooks and webcams, security and surveillance systems, digital still and video cameras, automotive and medical imaging systems as those markets continue to grow. Although we believe that we currently compete effectively in those markets, our competitive position could be impaired by companies that have greater financial, technical, marketing, manufacturing and distribution resources, broader product lines, better access to large customer bases, greater name recognition, longer operating histories and more established strategic and financial relationships than we do. Such companies may be able to adapt more quickly to new or emerging technologies and customer requirements or devote greater resources to the promotion and sale of their products. Many of these competitors own and operate their own fabrication facilities, which in certain circumstances may give them the ability to price their products more aggressively than we can or may allow them to respond more rapidly than we can to changing market opportunities.
In addition, from time to time, other companies enter the CMOS image-sensor market by using obsolete and available manufacturing equipment. While these efforts have rarely had any long-term success, the new entrants do sometimes manage to gain market share in the short-term by pricing their products significantly below current market levels which may put additional downward pressure on the prices that we can obtain for our products.
In common with many other semiconductor products and as a response to competitive pressures, the ASPs of image-sensor products have declined steadily since their introduction, and we expect ASPs to continue to decline in the future, especially if sales of mobile phones that use our products continue to shift from those made by end-user customers located in North America to those made by end-user customers located in Asia where we continue to experience strong pricing pressure. Some of this ASP decline may be offset by the adoption of some of our newer and higher resolution products such as our CameraCubeChip products, which carry a higher ASP because of the added value from the attachment of wafer-level optics to our image sensors. Depending on the adoption rate and unit volume, we believe these products could help to mitigate the rate of ASP decline. In order to maintain or grow our revenues, we need to increase the number of units we sell by a large enough amount to offset the effect of declining ASPs.
Separately, in order to maintain our gross margins, we and our suppliers must work continuously to lower our manufacturing costs and increase our production yields. In fiscal 2013, we requested our suppliers to invest in additional equipment in connection with the production of our OmniBSI-2 products. Such investment resulted in higher product costs for these products. Because we experienced increased sales of our OmniBSI-2 products since fiscal 2013, and expect these products to continue to constitute a significant percentage of our total sales in fiscal 2016, we anticipate that our gross margins will remain at lower levels than we have experienced historically, before our introduction of OmniBSI-2. Partially offsetting this is our recent introduction of our PureCel products, which products have higher gross margins than our OmniBSI-2 products and whose shipping volumes have continued to increase. If we are unable to spread the added cost of our OmniBSI-2 products over larger unit sales, successfully negotiate lower prices for these products with our suppliers, or increase sales of higher gross margin products, such as our PureCel products, our gross margin may continue to stay at
55
ITEM 7. MANAGEMENT'S DISCUSSION AND ANALYSIS OF FINANCIAL CONDITION AND
RESULTS OF OPERATIONS—(Continued)
these lower levels for future periods as well. In addition, if we are unable to timely develop and introduce new products that can take advantage of smaller process geometries or new products that incorporate more advanced technology and include more advanced features that can be sold at higher ASPs, our gross margin may decline.
Having the ability to forecast customer demand correctly and to prepare the appropriate level of inventory to meet this demand is also important in the semiconductor industry. At times, the semiconductor industry may experience supply constraints, and if we were unable to manage our products appropriately to meet our customers' product demands, our relations with our customers and their end-user customers may be harmed and we may be unable to achieve future sales growth, which could result in our revenues, gross margins and other financial results being materially and adversely affected. Conversely, an excess in inventory supply can also adversely affect our performance. For example, during the second quarter of fiscal 2012, certain of our key customers unexpectedly cut back their orders. In addition to reducing our unit sales of our OmniBSI and OmniPixel3-HS based products and adversely affecting our revenues for the second and third quarters of fiscal 2012, the cutback also resulted in our inventories at the end of the second and third quarters of fiscal 2012 being higher than we intended them to be. During the fourth quarter of fiscal 2012 and during fiscal 2013, we also increased significantly our OmniBSI-2 inventories as we prepared for anticipated increases in the sales of these products. However, since customer demand can be volatile, we may be unable to sell inventories that were built in excess of demand, or we may have to sell at lower prices to eliminate excess inventories. Under such circumstances, we may be required to record significant provisions for excess and obsolete inventories. This could materially and adversely affect our results of operations and financial condition. We expect the business environment to remain volatile in fiscal 2016, especially in the consumer-oriented product markets, which could continue to affect our ability to accurately forecast customer demand.
Given the rapidly changing nature of our technology, there can be no assurance that we will not encounter delays or other unexpected production yield issues with future products. In general, during the early stages of production, production yields and gross margins for new products are typically lower than those of established products. During production, we can also encounter unexpected manufacturing issues, such as unexpected back-end yield problems.
In addition, in preparation for new product introductions, we gradually decrease production of established products. Due to our 12-14 week production cycle, it is extremely difficult to predict precisely how many units of established products we will need. It is also difficult to accurately predict the speed of the ramp of new products. Given the current economic uncertainty, the visibility of our business outlook is extremely limited and forecasting is even more difficult than under normal market conditions. As a result, it is possible that we could suffer from shortages of certain products and build inventories in excess of demand for other products. We carefully consider the risk that our inventories may be in excess of expected future demand and record appropriate reserves. If, as sometimes happens, we are subsequently able to sell these reserved products, the sales have little or no associated cost and consequently, they have a favorable impact on gross margins.
56
ITEM 7. MANAGEMENT'S DISCUSSION AND ANALYSIS OF FINANCIAL CONDITION AND
RESULTS OF OPERATIONS—(Continued)
Strategy
Our strategic goal is to provide and deliver improved image-centric technologies and solutions to our customers, and to develop and make available a full range of innovative and cross-functional imaging products to all the markets. The most important elements of our strategy are the following:
Maintain Technology Leadership. We intend to maintain our position as a leader in CMOS image-sensor technology by continuing to develop our expertise in mixed-signal implementation, advanced pixel design, feature integration, and manufacturing processes and controls, including automated testing. Our image sensor integrates both the image sensor and the signal processor into a single chip, often eliminating the requirement for a separate DSP. As a result, our CameraChip image sensors offer camera device manufacturers advantages in terms of size, power consumption, cost and ease of design.
For example, in May 2008, we announced our OmniBSI architecture, which is the enabling technology behind our current 1.4 µm pixel. In February 2010, we announced our OmniBSI-2 architecture, which forms the basis of our even smaller and more advanced 1.1 µm pixel. In November 2013, we launched our PureCel sensors, which, when compared to our OmniBSI-2 products, offer increased unit area light sensitivity and lower power consumption. In fact, ever since the announcement of our first BSI technology in May 2008, our BSI-based product portfolio has grown tremendously. We believe our continued effort in the development of BSI technology has given us the ability to design image sensors with better sensitivity and greater functionality. Our BSI products also contribute to the reduction of camera module heights, facilitating the miniaturization of camera modules in many consumer applications.
We are continuing to develop products using still narrower geometries. We have successfully developed image sensor technology from 100,000 pixels to 23 megapixels, underscoring our ability to deliver a wide range of solutions to address changing market demands. We are committed to improving image quality and to reducing the overall size of the image sensor's array.
Our introduction of wafer-level optics to our product offerings is another example of our intention to continue to develop new and innovative technologies. Our CameraCubeChip technology is a three-dimensional, reflowable, total camera solution that combines the full functionality of our image sensors with wafer-level optics in one compact, small-footprint package.
Our commitment to maintaining our technology leadership is also reflected in our acquisition of a CMOS sensor patent portfolio from Kodak in March 2011. We effectively doubled the size of our patent portfolio from 842 in fiscal 2010 to 1,861 in fiscal 2011. Since then, our patent portfolio has continued to increase in size. As of April 30, 2015, we have been issued 746 United States patents and 1,242 foreign patents. As of April 30, 2015, we have 249 additional United States patent applications pending, of which 10 have been allowed, and we have 898 foreign patent applications pending, of which 40 have been allowed.
Leverage Expertise Across Multiple Mass-Market Applications. We intend to continue to focus on developing our image sensors for multiple mass-market applications. To date we have shipped more than 5.7 billion image sensors. As the demand for camera functionality increases in our principal markets and becomes a standard feature in a wider variety of consumer, commercial and industrial applications, we expect that additional markets will emerge. In the past, we have leveraged our expertise in certain of our target markets to expand into emerging mass-market applications for our image sensors. For example, we used the expertise we developed in mobile phone markets to develop image sensors for notebook computers. Other markets and applications we are focusing on include
57
ITEM 7. MANAGEMENT'S DISCUSSION AND ANALYSIS OF FINANCIAL CONDITION AND
RESULTS OF OPERATIONS—(Continued)
security and surveillance, entertainment devices, and the multiple opportunities in automotive and medical applications.
Increase Our Market Presence. We intend to increase our visibility and penetration into new product designs by collaborating with OEMs, VARs and distributors and by entering into partnerships with other companies that offer complementary and supporting technologies. In certain instances we will provide design services to our contract manufacturing partners, enabling them to increase their overall value added through the production of highly tailored end products, which we believe will increase the likelihood that they will recommend the use of our products to branded manufacturers. In addition, we will partner with companies that offer complementary and supporting technologies to integrate our products with theirs for use in the reference designs that they promote to manufacturers. As a result, we believe that we are able to provide our customers with valuable design and marketing references. We also see a developing trend for video-centric applications in the consumer markets. Consequently, we acquired Aurora and its advanced image projection technology, which we believe we can leverage to offer innovative and comprehensive imaging solutions to OEMs as they design their next generation products.
Further Develop Close Customer Relationships. We intend to enhance our customer relationships by continuing to collaborate with our customers on the design and specification of their products. We work with customers during various stages of their product development cycles, including strategic decision-making, new product design and replacement design to help them develop a logical technology migration path and to ensure that our products meet their future design needs. By working closely with our customers, we believe we can better anticipate their future design needs and increase the likelihood that they will incorporate our image sensors into their products.
Our Solution
We specifically design our highly integrated image sensors to be cost-effective and to provide high image quality. By integrating a number of distinct functions onto a single CMOS chip, including image capture, image processing, color processing, signal conversion and output of images for either digital or analog equipment, our image sensors offer camera device manufacturers a number of benefits, including:
High Image Quality and Resolution. We have developed a number of proprietary methods for enhancing image quality by increasing our image sensors' sensitivity to light and significantly improving their signal to noise ratio. These methods allow us to reduce the size of each individual pixel and thereby increase the number of pixels in an image sensor of a given size. The result is a current portfolio of several high resolution image sensors ranging up to a 23-megapixel product. In addition, we are able to produce image sensors at lower resolutions with smaller pixel arrays, which serve to reduce the overall cost of the image sensor and its supporting components, such as lenses.
Lower Cost. The highly integrated design of our image sensors enables us to deliver image sensors to our customers at a cost which makes the cameras that they are part of increasingly less expensive. This cost saving is driven, in large part, by our ability to achieve a high level of functionality in a single chip while continually reducing the overall size of the device. Similarly, we believe our CameraCubeChip imaging devices, as compact total camera solutions that can be reflowed onto circuit boards directly, can streamline the camera device manufacturers process, yielding further cost savings to our customers.
58
ITEM 7. MANAGEMENT'S DISCUSSION AND ANALYSIS OF FINANCIAL CONDITION AND
RESULTS OF OPERATIONS—(Continued)
Accelerated Time to Market. The highly integrated nature of our image sensors simplifies the design of cameras and allows our customers to shorten their product design cycles. We believe our CameraCubeChip devices further shorten the design cycle by offering a complete imaging solution from the very beginning. These factors provide our mobile phone and consumer electronics customers with critical competitive advantages, as time to market is typically a major determinant of product success and longevity. We also work closely with our customers to accelerate product development cycles by providing camera reference designs, engineering design review services and customer product evaluation, testing and debugging services. In addition, we have designed our manufacturing and production processes to allow us to quickly ramp production volumes to meet increased customer demand, which is particularly important in the high volume markets in which we participate.
Streamlined Manufacturing and Production. Our image sensors are well suited for production using the relatively simple, low cost and large-scale wafer fabrication processes developed for other semiconductor products that use the CMOS process. We work closely with our foundry partners and with all the other providers of the manufacturing services we require to produce our final products to refine their processes in order to optimize our image-sensor performance and yields.
Ease of Use. Our single-chip CMOS design generates video outputs in industry standard formats directly from the chip. These formats include the National Television System Committee, or NTSC, format and/or the Phase Alternating Line, or PAL, format for analog video. For digital video, our sensors generate unprocessed data called RGB and/or a standard signal color encoding system known as YUV. As a result, our image sensors can be quickly and easily integrated into products targeted at numerous markets.
Capital Resources
As of April 30, 2015, we held approximately $318.9 million in cash and cash equivalents and approximately $205.3 million in short-term investments. To mitigate market risk related to short-term investments, we have an investment policy designed to preserve the value of capital and to generate interest income from these investments without material exposure to market fluctuations. Market risk is the potential loss due to the change in value of a financial instrument as a result of changes in interest rates or bond prices, and changes in market liquidity and in the pricing of risk. Our policy is to invest in financial instruments with short maturities, limiting interest rate exposure, and to measure performance against comparable benchmarks. We maintain our portfolio of cash equivalents and short-term investments in a variety of securities, including both government and corporate obligations with ratings of "A" or better and money market funds. We do not believe that the value of our cash, cash equivalents and short-term investments will be significantly affected by current instability in the global financial markets.
Sources of Revenues
We generate almost all our revenues by selling our products directly to OEMs and VARs and indirectly through distributors. For accounting purposes, we treat sales to OEMs and VARs as one source of revenue, and sales to distributors as another and our revenue recognition policies for the two groups are different. See "Critical Accounting Policies and Estimates—Revenue Recognition" below for additional information regarding recognition of revenue.
59
ITEM 7. MANAGEMENT'S DISCUSSION AND ANALYSIS OF FINANCIAL CONDITION AND
RESULTS OF OPERATIONS—(Continued)
Critical Accounting Policies and Estimates
The preparation of financial statements in conformity with accounting principles generally accepted in the United States requires management to make estimates and assumptions that affect the reported amounts of assets and liabilities and disclosure of contingent assets and liabilities at the date of the financial statements and the reported amounts of revenues and expenses during the reporting period. By their nature, these estimates and judgments are subject to an inherent degree of uncertainty. On an ongoing basis we re-evaluate our judgments and estimates including those related to product returns, bad debts, inventories, long-lived assets, income taxes, stock-based compensation, litigation and contingencies. We base our estimates and judgments on our historical experience, knowledge of current conditions and our beliefs of what could occur in the future considering available information. Actual results could differ from those estimates, and material effects on our operating results and financial position may result. Our significant accounting policies are more fully described in Note 2—"Summary of Significant Accounting Policies" to the consolidated financial statements included in this Annual Report on Form 10-K. Our estimates reflect the following critical accounting policies:
Revenue Recognition
For shipments to customers without agreements that allow for returns or credits, principally OEMs and VARs, we recognize revenue using the "sell-in" method. Under this method, we recognize revenue when title passes to the customer provided that we have received a signed purchase order, the price is fixed or determinable, title and risk of loss has transferred to the customer, collection of resulting receivables is considered reasonably assured, product returns are reasonably estimable, there are no customer acceptance requirements and there are no remaining material obligations. We provide for future returns of potentially defective products based on historical experience at the time we recognize revenue. For cash consideration given to customers that is primarily in the form of rebates, and for which we do not receive a separately identifiable benefit or cannot reasonably estimate fair value, we record the amounts as reductions of revenue.
For shipment of products sold to distributors under agreements allowing for returns or credits, title and the risk of ownership to the products transfer to the distributor upon shipment, and the distributor is obligated to pay for the products whether or not the distributor has sold them at the time payment is due. Under the terms of our agreements with such distributors and subject to our prior approval, distributors are entitled to reclaim from us as price adjustments the difference, if any, between the prices at which we sold the product to the distributors and the prices at which the product is subsequently sold by the distributor. In addition, distributors have limited rights to return inventory that they determine is in excess of their requirements, and accordingly, in determining the appropriate level of provision for excess and obsolete inventory, we take into account the inventories held by our distributors. For these reasons, prices and revenues are not fixed or determinable until the distributor resells the products to our end-user customers and the distributor notifies us in writing of the details of such sales transactions. Accordingly, we recognize revenue using the "sell-through" method. Under the "sell-through" method, we defer the revenue, adjustments to revenue and the related costs of revenue until the final resale of such products to end customers. The amounts billed to these distributors and adjustments to revenue and the cost of inventory shipped to, but not yet sold by, the distributors are shown net on the Consolidated Balance Sheets as "Deferred revenues, less cost of revenues."
In order to determine whether collection is probable, we assess a number of factors, including our past transaction history with the customer and the creditworthiness of the customer. If we determine
60
ITEM 7. MANAGEMENT'S DISCUSSION AND ANALYSIS OF FINANCIAL CONDITION AND
RESULTS OF OPERATIONS—(Continued)
that collection is not reasonably assured, we defer the recognition of revenue until collection becomes reasonably assured or upon receipt of payment.
Allowance for Doubtful Accounts
We undertake credit evaluations for all major sale transactions before we release product for shipment. Normal payment terms apply upon transfer of risk of loss. On an ongoing basis, we analyze the payment history of customer accounts, including recent customer purchases. We evaluate aged items in accounts receivable and provide allowances for doubtful accounts. Customer creditworthiness and economic conditions may change and increase the risk of collectability and may require additional allowances, which would negatively impact our operating results. Our allowance for doubtful accounts represented approximately 0.6% of total accounts receivable as of April 30, 2015 and 2014.
Allowance for Sales Returns and Warranties
Based on historical sales returns and other known factors, we provide for estimated sales returns in the same period we record the related revenues. To estimate our allowance for sales returns, we analyze potential customer-specific product application issues, potential quality and reliability issues and historical returns. We evaluate quarterly the adequacy of the allowance for sales returns. This allowance is reflected as a reduction to accounts receivable in our Consolidated Balance Sheets. Increases to the allowance are recorded as a reduction to net revenues. Because the allowance for sales returns is based on our judgments and estimates, particularly as to product application, quality and reliability issues, our allowances may not be adequate to cover actual sales returns and other allowances. If our allowances are not adequate, our net revenues could be adversely affected. We warrant to our customers that our products will work in accordance with each product's specifications. Due to the cost and other complexities associated with rectifying any product defects, we do not repair any defective products. If a product is defective, the customer notifies us and, with our approval, returns the defective product. We then send replacement products to the customer. Accordingly, we account for any exposure related to defective products as a portion of our allowance for sales returns. The net change in our allowance for sales returns balance was approximately 0.1% of revenues in fiscal 2015, and the allowance was approximately 1.3% of total accounts receivable at April 30, 2015.
Excess and Obsolete Inventory and Effect on Gross Margin
We regularly monitor inventory quantities on hand and record provisions for excess and obsolete inventories based primarily on historical usage rates and our forecast of future demand for our products. We record provisions for the cost of inventories when the number of units on hand exceeds the number of units that we forecast will be sold over a certain period of time, generally 12 months. When we recognize the provisions, a new, lower-cost basis for that inventory is established, and subsequent changes in facts and circumstances do not result in the restoration of or increase in that newly established cost basis.
We may subsequently sell some of these excess and obsolete inventories. Even though we may sell these products at a price that was less than our original cost, sales of these products improve our current period gross margins because the inventory was previously written down.
61
ITEM 7. MANAGEMENT'S DISCUSSION AND ANALYSIS OF FINANCIAL CONDITION AND
RESULTS OF OPERATIONS—(Continued)
We attempt to control our inventory levels so that we do not hold inventories in excess of demand at the end of each of fiscal quarter. However, because we need to place non-cancelable orders with significant lead time and because it is difficult to estimate product demand, it is possible that we will build inventories in excess of demand for future periods. If we have inventories in excess of estimated product demand, we will record a provision, which could have a material adverse effect on our reported results of operations and financial position. In preparation for new product introductions, we gradually decrease production of established products, while preparing for production of newer products. Given our 12-14 week production cycle, it is extremely difficult to predict precisely how many units of established products we need. It is also difficult to accurately predict the speed of the ramp of new products or the projected life cycles of new products which have continued to shorten in duration. Under these circumstances, it is possible that we could suffer from shortages of certain products and also build inventories in excess of demand for other products.
Stock-Based Compensation Expense
The authoritative guidance for stock-based compensation requires all share-based payments to employees, including grants of employee stock options and employee stock purchases under our employee stock purchase plan, to be recognized in our financial statements based on their respective measurement date fair values. We use the Black-Scholes option pricing model to estimate the fair value of our share-based payment awards. The Black-Scholes option pricing model requires the use of highly subjective and complex assumptions, including our stock price, expected volatility, expected term, risk-free interest rate and expected dividend yield. For expected volatility, we use an average between the historical volatility of our common stock, and the implied volatility of traded options on our common stock. The expected term of the awards is based on historical data regarding our employees' option exercise behaviors. The risk-free interest rate assumption is based on observed interest rates appropriate for the terms of our awards. The dividend yield assumption is based on our history and expectation of dividend payouts. In addition to the requirement for fair value estimates, authoritative guidance for stock-based compensation also requires the recording of expense that is net of an anticipated forfeiture rate. Only expenses associated with awards that are ultimately expected to vest are included in our financial statements. Our forfeiture rate is determined based on our historical option cancellation experience.
We evaluate the Black-Scholes assumptions that we use to value our awards on a quarterly basis. With respect to the forfeiture rate, we will revise the rate, if necessary, in subsequent periods if actual forfeitures differ from our estimates. If factors change and we employ different assumptions, stock-based compensation expense related to future stock-based payments may differ significantly from estimates recorded in prior periods.
We elected to use the long-form method to establish the beginning balance of, and to determine the subsequent impact on, the additional paid-in capital pool. For the tax effects of share-based payment awards, we use the "with and without" approach in determining the order in which tax attributes are utilized. As a result, we will recognize a tax benefit from stock-based awards in additional paid-in capital only if an incremental tax benefit is realized after all other tax attributes currently available to us have been utilized. In addition, we account for the indirect effects of stock-based awards on other tax attributes, such as research and development tax credits, through the Consolidated Statements of Income.
In September 2007, our stockholders approved the 2007 Equity Incentive Plan, or the 2007 Plan. See Note 12—"Employee Stock Purchase, Equity Incentive and Stock Option Plans" to our consolidated
62
ITEM 7. MANAGEMENT'S DISCUSSION AND ANALYSIS OF FINANCIAL CONDITION AND
RESULTS OF OPERATIONS—(Continued)
financial statements. The 2007 Plan, as amended, allows the grant of, among other things, performance share awards to employees. Under the authoritative guidance for stock-based compensation, when we record the stock-based compensation expense for such awards that carry performance contingencies, we have to estimate the probable outcome at the end of the performance period. Furthermore, we have to adjust the cumulative compensation expense recorded when probable outcome for the performance-based shares is subsequently updated for changes in facts and circumstances.
Valuation of Long-Lived Assets
Whenever events or changes in circumstances indicate that the carrying value of identifiable intangibles and long-lived assets, including property, plant and equipment and prepaid wafer credits, may not be recoverable, we assess whether the value of such asset or asset group has been impaired. Impairment evaluations involve management estimates of assets' useful lives and future cash flows. If such events occur, we would estimate the undiscounted future cash flows expected to result from the use of the asset and its eventual disposition. If the undiscounted expected future cash flows were less than the carrying amount of the asset, we would recognize an impairment loss. Actual useful lives and cash flows could be different from those estimated by our management. This could have a material effect on our operating results and financial position. Factors we consider important that could trigger an impairment review include the following:
- •
- operating losses;
- •
- significant negative industry trends;
- •
- significant underutilization of the assets; and
- •
- significant changes in how we use the assets or our plans for their use.
Valuation of Financial Instruments
The authoritative guidance for fair value measurements specifies a hierarchy of valuation techniques based upon whether the inputs to those valuation techniques reflect assumptions other market participants would use based upon market data obtained from independent sources (observable inputs) or reflect our own assumption of market participant valuation (unobservable inputs).
We use inputs such as quoted prices in active markets, broker/dealer quotes and other similar data from independent sources to determine the fair value of our financial assets and liabilities. For quoted prices from active markets, we do not make any material adjustments. For quoted prices in markets that are not active, or other observable and market-corroborated inputs, we review the inputs for reasonableness, and may further adjust the fair value based on market indices or other information that management deems material to the fair value estimates.
As of April 30, 2015, the fair value of our financial instruments measured at fair value on a recurring basis included $300.8 million of assets, and $2.1 million of liabilities. Of the $300.8 million of assets, $34.8 million were classified as Level 1, which included investments in money market funds and our equity investment in XinTec. The remaining $266.0 million of investments were classified as Level 2, representing investments in debt securities issued by the U.S. government and its agencies, and other corporate securities. The $2.1 million of liabilities were classified as Level 2, and consisted of an interest rate swap that we entered into in conjunction with a mortgage loan. The fair value of the interest rate swap included the effect of our credit risk. We did not classify any financial instruments as Level 3 under the fair value hierarchy.
63
ITEM 7. MANAGEMENT'S DISCUSSION AND ANALYSIS OF FINANCIAL CONDITION AND
RESULTS OF OPERATIONS—(Continued)
Accounting for Income Taxes
In accordance with the authoritative guidance for income taxes, we make certain estimates and judgments in determining the income tax expense for financial statement purposes. These estimates and judgments occur in the calculation of tax credits, benefits, and deductions, and in the calculation of certain tax assets and liabilities, which arise from differences in the timing of recognition of revenue and expense for tax and financial statement purposes, as well as the interest and penalties relating to these uncertain tax positions. Significant changes to these estimates may increase or decrease our tax provision in a subsequent period. Similarly, for tax liabilities denominated in a currency other than the U.S. dollar, changes in the value of the denominated currency will increase or decrease our tax provision in a subsequent period.
In addition, the calculation of our tax liabilities involves the assessment of uncertainties in the application of complex tax regulations. We recognize liabilities for uncertain tax positions based on a two-step process. In the first step, recognition, we determine whether it is more-likely-than-not that a tax position will be sustained upon examination, including resolution of any related appeals or litigation processes, based on the technical merits of the position. The second step addresses measurement of a tax position that meets the more-likely-than-not criterion. The tax position is measured at the largest amount of benefit that has a greater than 50 percent likelihood of being realized upon ultimate settlement. Because we are required to determine the probability of various possible outcomes, such estimates are inherently difficult and subjective. We reevaluate these uncertain tax positions on a quarterly basis. This re-evaluation is based on factors including, but not limited to, changes in facts or circumstances, and changes in tax law. A change in recognition or measurement would result either in the recognition of a tax benefit or in an additional charge to the tax provision for the period.
We also have to assess the likelihood that we will be able to realize our deferred tax assets. If realization is not likely, we are required to increase our provision for taxes by recording a valuation allowance against the deferred tax assets that we estimate we will not ultimately realize. We believe that we will ultimately realize a majority of the deferred tax assets recorded on our Consolidated Balance Sheets. However, should there be a change in our ability to realize our deferred tax assets, our tax provision would increase in the period in which we determined that it is more-likely-than-not that the benefit of our deferred tax assets will not be realized.
As of April 30, 2015, we have recorded a valuation allowance of $14.9 million primarily to offset California research and development tax credit carryovers. We believe that it is more-likely-than-not that we will not realize these carryovers. In the future, if the credit is utilized and the valuation allowance is released, the release of valuation allowance will be accounted for as a reduction of the income tax expense in the period such event occurs.
For fiscal 2015, 2014 and 2013, our income tax provision reflected effective tax rates of (14.0)%, 9.5% and 14.5%, respectively. These rates are less than the combined U.S. federal and state statutory rate of approximately 40% principally because we earn a significant portion of our profits in jurisdictions where tax rates are lower than the combined U.S. federal and state statutory rate.
Litigation and Contingencies
From time to time, we have been subject to legal proceedings and claims with respect to such matters as patents and other actions arising out of the normal course of business, as well as other matters identified in "Legal Proceedings" in Part I, Item 3 of this Annual Report.
64
ITEM 7. MANAGEMENT'S DISCUSSION AND ANALYSIS OF FINANCIAL CONDITION AND
RESULTS OF OPERATIONS—(Continued)
It is possible that other companies might pursue litigation with respect to any claims such companies purport to have against us. The results of any litigation are inherently uncertain. In the event of an adverse result in any litigation with respect to intellectual property rights relevant to our products that could arise in the future, we could be required to obtain licenses to the infringed technology, pay substantial damages under applicable law, including treble damages if we are held to have willfully infringed, cease the manufacture, use and sale of infringing products or to expend significant resources to develop non-infringing technology. Litigation frequently involves substantial expenditures and can require significant management attention, even if we ultimately prevail.
Given the uncertainties associated with litigation, if our assessments prove to be wrong, or if additional information becomes available such that we estimate that there is a probable loss or probable range of loss associated with these contingencies, then we would record the minimum estimated liability, which could materially impact our results of operations, financial position or cash flows.
Results of Operations
The following table sets forth the results of our operations as a percentage of revenues for the periods indicated. Our historical operating results are not necessarily indicative of the results we can expect for any future period.
| |
Year Ended April 30, | |||||||||
|---|---|---|---|---|---|---|---|---|---|---|
| |
2015 | 2014 | 2013 | |||||||
Revenues |
100.0 | % | 100.0 | % | 100.0 | % | ||||
Cost of revenues |
78.0 | 81.0 | 82.7 | |||||||
| | | | | | | | | | | |
Gross margin |
22.0 | 19.0 | 17.3 | |||||||
| | | | | | | | | | | |
Operating expenses: |
||||||||||
Research, development and related |
9.8 | 8.2 | 8.0 | |||||||
Selling, general and administrative |
6.0 | 5.0 | 5.2 | |||||||
Amortization of acquired patent portfolio |
0.7 | 0.7 | 0.6 | |||||||
| | | | | | | | | | | |
Total operating expenses |
16.5 | 13.9 | 13.8 | |||||||
| | | | | | | | | | | |
Income from operations |
5.5 | 5.1 | 3.5 | |||||||
Benefit from acquisition of production operations from VisEra |
— | 0.2 | — | |||||||
Equity in earnings of investee |
0.3 | 0.3 | 0.3 | |||||||
Interest expense, net |
(0.1 | ) | (0.2 | ) | (0.2 | ) | ||||
Other income, net |
0.2 | 1.8 | — | |||||||
| | | | | | | | | | | |
Income before income taxes |
5.9 | 7.2 | 3.6 | |||||||
Provision for (benefit from) income taxes |
(0.9 | ) | 0.7 | 0.5 | ||||||
| | | | | | | | | | | |
Net income |
6.8 | % | 6.5 | % | 3.1 | % | ||||
| | | | | | | | | | | |
| | | | | | | | | | | |
| | | | | | | | | | | |
Revenues
We derive substantially all of our revenues from the sale of our image-sensor products that are used in a wide variety of consumer and commercial mass-market applications including mobile phones, entertainment devices, notebooks and webcams, security and surveillance cameras, DSCs, automotive
65
ITEM 7. MANAGEMENT'S DISCUSSION AND ANALYSIS OF FINANCIAL CONDITION AND
RESULTS OF OPERATIONS—(Continued)
and medical products. Revenues decreased by 5.2% to $1.4 billion in fiscal 2015 from $1.5 billion in fiscal 2014. Revenues increased by 3.3% to $1.5 billion in fiscal 2014 from $1.4 billion in fiscal 2013.
Comparison of Fiscal 2015 and Fiscal 2014
The decrease in revenues in fiscal 2015 when compared to fiscal 2014 was primarily due to a 6.5% decrease in ASPs, reflecting general price erosions and the introduction of newer and lower priced products into our shipment mix. The decrease in ASPs was partially offset by a 1.3% increase in unit sales of our image-sensor products, reflecting increased unit shipments into the mobile phone, security and surveillance, and automotive markets. These increases in unit shipments were partially offset by decreased shipments into the entertainment and notebook and webcam markets. The increase in unit shipment in fiscal 2015, as compared to fiscal 2014, was principally attributable to an increase in shipment of our 3 to 5-megapixel and 8-megapixel and above products, partially offset by a decrease in shipment of our 2-megapixel and below products.
Comparison of Fiscal 2014 and Fiscal 2013
The increase in revenues in fiscal 2014 when compared to fiscal 2013 was primarily due to a 0.7% increase in unit sales of our image-sensor products, reflecting increased unit shipments into the mobile phone, entertainment, security and surveillance, and automotive markets. These increases were partially offset by decreased shipment into the notebook and webcam market. The increase in unit shipment in fiscal 2014, as compared to fiscal 2013, was principally attributable to an increase in shipment of our 2-megapixel and above products as more and more consumer applications migrate to higher resolution cameras. Related to this migration was a continued conversion of cameras from VGA to HD resolution, which caused an increase in our shipment of HD sensors and a corresponding decrease in our shipment of VGA sensors. The industry trend for camera resolution increases in consumer applications caused a favorable mix shift in our unit sales, which increased our ASPs by 3.0% in fiscal 2014 when compared to fiscal 2013.
Revenues from Sales to OEMs and VARs as Compared to Distributors
We sell our image-sensor products either directly to OEMs and VARs or indirectly through distributors. The decrease in percentage of revenue from sales to OEMs and VARs in fiscal 2015, as compared to fiscal 2014, was attributable to variations in our customer list. The percentage of revenues from sales to OEMs and VARs in fiscal 2014 remained the same as in fiscal 2013. We expect that the percentage of revenues from sales through OEMs and VARs will vary from year to year in response to changes in the composition of our customer list, and that it may continue to represent a majority of our revenues. The gross margins that we earn on sales to OEMs and VARs or through distributors are not significantly different.
The following table shows the percentages of revenues from sales to OEMs and VARs and distributors for the periods indicated:
| |
Year Ended April 30, | |||||||||
|---|---|---|---|---|---|---|---|---|---|---|
| |
2015 | 2014 | 2013 | |||||||
OEMs and VARs |
75.3 | % | 81.2 | % | 81.2 | % | ||||
Distributors |
24.7 | 18.8 | 18.8 | |||||||
| | | | | | | | | | | |
Total |
100.0 | % | 100.0 | % | 100.0 | % | ||||
| | | | | | | | | | | |
| | | | | | | | | | | |
| | | | | | | | | | | |
66
ITEM 7. MANAGEMENT'S DISCUSSION AND ANALYSIS OF FINANCIAL CONDITION AND
RESULTS OF OPERATIONS—(Continued)
OEMs and VARs. The two OEM customers that accounted for 10% or more of our revenues in fiscal 2015 were Foxconn Technology Group and Ningbo Sunny Opotech Co., Ltd., which accounted for approximately 13.8% and 11.5% of our revenues, respectively. The two OEM customers that accounted for 10% or more of our revenues in fiscal 2014 were Foxconn Technology Group and Cowell Electronics Co., Ltd., which accounted for approximately 13.8% and 12.5% of our revenues, respectively. The three OEM customers that accounted for 10% or more of our revenues in fiscal 2013 were LG Innotek Co., Ltd, or LG Innotek, Foxconn Technology Group, and Cowell Electronics Co., Ltd., which accounted for approximately 18.0%, 10.7%, and 10.3% of our revenues, respectively. For fiscal 2015, 2014 and 2013, no other OEM or VAR customer accounted for 10% or more of our revenues.
Distributors. The one distributor that accounted for 10% or more of our revenues in fiscal 2015, 2014 and 2013 was World Peace Industrial Co., Ltd., which accounted for approximately 13.3%, 11.0% and 11.7% of our revenues, respectively. For fiscal 2015, 2014 and 2013, no other distributor accounted for 10% or more of our revenues.
Revenues from Domestic Sales as Compared to Foreign Sales
The following table shows the percentages of our revenues derived from sales of our image-sensor products to domestic and foreign customers for the periods indicated:
| |
Year Ended April 30, | |||||||||
|---|---|---|---|---|---|---|---|---|---|---|
| |
2015 | 2014 | 2013 | |||||||
Domestic sales |
0.9 | % | 0.3 | % | 0.3 | % | ||||
Foreign sales |
99.1 | 99.7 | 99.7 | |||||||
| | | | | | | | | | | |
Total |
100.0 | % | 100.0 | % | 100.0 | % | ||||
| | | | | | | | | | | |
| | | | | | | | | | | |
| | | | | | | | | | | |
The revenues we report by geography are based on the country or region in which our customers issue their purchase orders to us. We derive the majority of our foreign sales from customers in Asia and, to a lesser extent, in Europe. Our sales to Asia-Pacific customers remain significant primarily due to the continuing trend of outsourcing the production of consumer electronics products to Asia-Pacific manufacturers and facilities and as a result of the increasing markets in Asia for consumer products. Because of the preponderance of Asia-Pacific manufacturers and the fact that virtually all products incorporating our image-sensor products are sold globally, we believe that the geographic distribution of our sales does not accurately reflect the geographic distribution of sales into end-user markets of products which incorporate our image sensors. Over time, our domestic and foreign sales mix may fluctuate as a result of changes in the composition of our customer list that we experience in our business.
Gross Profit
Comparison of Fiscal 2015 and Fiscal 2014
Our gross margin in fiscal 2015 increased to 22.0% from 19.0% for fiscal 2014. The year-over-year increase in gross margin reflected the introduction of PureCel products into our shipment mix in fiscal 2015, and a reduction in our overall production costs. These favorable factors were partially offset by a decrease in ASPs and a more unfavorable net effect on gross margin from the sale of previously written-down products and write-down of inventories. The decrease in ASPs was the result of general price erosions and an increase in shipment mix for some of our newer and lower priced products. As to
67
ITEM 7. MANAGEMENT'S DISCUSSION AND ANALYSIS OF FINANCIAL CONDITION AND
RESULTS OF OPERATIONS—(Continued)
the net effects on gross margin from the sale of previously written-down products and write-down of inventories, we had an increase in the write-down of inventories, which totaled approximately $41.2 million in fiscal 2015, as compared to $33.2 million in fiscal 2014. The increase in the write-down of inventories in fiscal 2015 reflected the phasing out of certain products that had reached the end of their respective product life cycles. The negative impact on gross margin from the increase in inventories write-down was partially offset by an increase in sale of previously written down products, which totaled approximately $14.5 million in fiscal 2015, as compared to $8.2 million in fiscal 2014. We recorded approximately $4.4 million in stock-based compensation expense to cost of revenues during fiscal 2015, as compared to $4.0 million in fiscal 2014.
Comparison of Fiscal 2014 and Fiscal 2013
Our gross margin in fiscal 2014 increased to 19.0% from 17.3% for fiscal 2013. The year-over-year increase in gross margin reflected a reduction in the production cost of our OmniBSI-2 products, which constitute a significant percentage of our total product shipments. The incremental improvement in OmniBSI-2 production cost was partially offset by unfavorable net effects from the sale of previously written-down products and write-down of inventories. We had an increase in the write-down of inventories, which totaled approximately $33.2 million in fiscal 2014, as compared to $23.1 million in fiscal 2013. The increase in the write-down of inventories in fiscal 2014 reflected a reduction in demand for certain products that we had designed specifically for the mobile phone market. Partially offsetting the increase in write-down of inventories was an increase in the amount of sales from previously written down products, which totaled $8.2 million in fiscal 2014, as compared to $6.3 million in the prior fiscal year. We recorded approximately $4.0 million in stock-based compensation expense to cost of revenues during fiscal 2014, as compared to $3.8 million in the prior fiscal year.
Research, Development and Related
Research, development and related expenses consist primarily of compensation and personnel-related expenses, non-recurring engineering costs related principally to the costs of the masks we buy when we release new product designs to the manufacturing foundries, costs for purchased materials, designs, tooling, depreciation of computers and workstations, and amortization of acquired intangible intellectual property and computer aided design software. Research, development and related expenses may fluctuate significantly as the number of new designs we release to the foundries can fluctuate from period to period. Research, development and related expenses for fiscal 2015, 2014 and 2013 were approximately $135.6 million, $119.2 million and $113.2 million, respectively. As a percentage of revenues, research, development and related expenses for fiscal 2015, 2014 and 2013 represented 9.8%, 8.2% and 8.0%, respectively.
Comparison of Fiscal 2015 and Fiscal 2014
The increase in research, development and related expenses of approximately $16.4 million, or 13.7%, in fiscal 2015, as compared to fiscal 2014 resulted primarily from: a $8.6 million increase in non-recurring engineering expenses related to new product development; and a $6.4 million increase in salary and payroll-related expenses resulting primarily from a headcount increase. We anticipate that research, development and related expenses will increase for our first quarter of fiscal 2016, reflecting anticipated increases in non-recurring engineering expenses and in stock-based compensation.
68
ITEM 7. MANAGEMENT'S DISCUSSION AND ANALYSIS OF FINANCIAL CONDITION AND
RESULTS OF OPERATIONS—(Continued)
Comparison of Fiscal 2014 and Fiscal 2013
The increase in research, development and related expenses of approximately $6.1 million, or 5.3%, in fiscal 2014, as compared to fiscal 2013 resulted primarily from: a $8.5 million increase in salary and payroll-related expenses resulting primarily from a headcount increase; a $0.9 million increase in legal expenses primarily related to patent registration activities; a $0.8 million increase in expenditures for design software tools; a $419,000 increase in office and facility expenses; and a $292,000 increase in stock-based compensation expense. These increases were partially offset by: a $3.9 million decrease in non-recurring engineering expenses related to new product development and a $1.5 million decrease in amortization and depreciation expenses.
Selling, General and Administrative
Selling, general and administrative expenses consist primarily of compensation and personnel related expenses, commissions paid to distributors and manufacturers' representatives and insurance and legal expenses. Commission payments, in particular, can vary from period to period as our overall revenues change. Selling, general and administrative expenses for fiscal 2015, 2014 and 2013 were approximately $82.5 million, $73.3 million and $73.0 million, respectively. As a percentage of revenues, selling, general and administrative expenses for fiscal 2015, 2014 and 2013 represented 6.0%, 5.0% and 5.2%, respectively.
Comparison of Fiscal 2015 and Fiscal 2014
The increase in selling, general and administrative expenses of approximately $9.2 million, or 12.5%, for fiscal 2015 from fiscal 2014 resulted primarily from: a $6.1 million increase in transaction costs related to the proposed acquisition by the Consortium; a $2.1 million increase in salary and payroll-related expenses resulting primarily from a headcount increase; and a $1.3 million increase in commission expenses paid primarily to distributors and sales representatives. These increases were partially offset by a $1.4 million decrease in stock-based compensation expense. We anticipate that our selling, general and administrative expenses will decrease for the first quarter of fiscal 2016, due to a reduction in expenditure related to the proposed acquisition.
Comparison of Fiscal 2014 and Fiscal 2013
The increase in selling, general and administrative expenses of approximately $334,000, or 0.5%, for fiscal 2014 from fiscal 2013 resulted primarily from: a $3.8 million increase in salary and payroll-related expenses resulting primarily from a headcount increase; and a $1.1 million increase in stock-based compensation expense. These increases were partially offset by: a $1.8 million decrease in legal expenses primarily related to patent defense; a $1.6 million decrease in commission expenses paid primarily to distributors and sales representatives; a $0.5 million decrease in outsourcing and other expenses; a $382,000 decrease in bad debt expense; and a $261,000 decrease in depreciation expenses. We anticipate that our selling, general and administrative expenses will increase for the first quarter of fiscal 2015, due to an anticipated increase in commission payments.
Amortization of Acquired Patent Portfolio
In March 2011, we purchased certain image sensor-related patents and patent applications from Kodak in a cash transaction. As a result, we recorded $65.0 million in additions to intangible assets, which we began amortizing during the three months ended April 30, 2011. Consequently, amortization of acquired patent portfolio totaled approximately $9.3 million for fiscal 2015, 2014 and 2013, respectively.
69
ITEM 7. MANAGEMENT'S DISCUSSION AND ANALYSIS OF FINANCIAL CONDITION AND
RESULTS OF OPERATIONS—(Continued)
Benefit from Acquisition of Production Operations from VisEra
In October 2011, we acquired the CameraCubeChip production operations from VisEra, for a total consideration of $42.9 million, to be paid in fiscal 2012 and 2013. We recorded a one-time benefit of $8.6 million in "Benefit from acquisition of production operations from VisEra," representing the difference between the acquisition-date fair value and the original carrying value of our previously held investment in the production operations.
Subsequently, in April 2014, due to the lack of commercial viability for certain milestone deliverables, we agreed with VisEra to reduce our final installment of cash consideration for the acquisition from $9.0 million to $4.5 million. This resulted in a net post-acquisition gain of approximately $3.1 million, representing the $4.5 million reduction in the final installment payment, net of a $1.4 million equity method elimination for the corresponding write-off recorded by VisEra.
Equity in Earnings of Investee
Equity in earnings of investee for fiscal 2015, 2014 and 2013 was approximately $4.3 million, $4.0 million and $3.8 million, respectively. Equity in earnings of investee represented our portion of the net income recorded by WLCSP, and equity method investment adjustments.
Interest Expense, Net
We invest our cash, cash equivalents and short-term investments in interest-bearing accounts consisting primarily of money market funds, commercial paper, certificates of deposit, high-grade corporate securities and government bonds. Additionally, we have obtained funds under certain long-term borrowing facilities comprised of a variable rate mortgage and a construction loan. Interest expense, net, for fiscal 2015, 2014 and 2013 was approximately $1.5 million, $2.0 million and $2.7 million, respectively. Between fiscal 2015 and 2014, the $0.5 million decrease in interest expense, net, resulted from: a $0.6 million increase in interest income that resulted from balance increases on interest-bearing accounts; and a $199,000 decrease in interest expense associated with a fixed asset loan agreement that we entered into for the construction of a research center at OTC. These decreases to interest expense, net were partially offset by a $312,000 increase in interest expense attributable to the accretion of interest associated with a license agreement that we entered into with the California Institute of Technology in January 2014, or the Caltech License. Between fiscal 2014 and 2013, the $0.7 million decrease in interest expense, net, resulted from: a $0.6 million decrease in interest expense, primarily associated with the accretion of interest during the prior year period, on the purchase consideration payable to VisEra that we acquired in October 2011; and a $156,000 decrease in interest expense associated with the fixed asset loan agreement at OTC. These decreases to interest expense, net were partially offset by a $119,000 increase in interest expense associated with the payment schedule of our Caltech License.
Other Income, Net
Other income, net for fiscal 2015, 2014 and 2013 was approximately $3.0 million, $26.0 million and $356,000, respectively. Other income, net for fiscal 2015 included: $1.5 million of income associated with the leasing out of our office space in Shanghai, China, a $0.9 million gain on the interest rate swap agreement related to the mortgage on our Santa Clara Property, a $0.6 million gain from the sale of XinTec shares during its IPO in April 2015, which was composed of a $195,000 gain from the sale of 224,000 XinTec shares that we held, and $380,000 as our portion of the gain as realized by VisEra
70
ITEM 7. MANAGEMENT'S DISCUSSION AND ANALYSIS OF FINANCIAL CONDITION AND
RESULTS OF OPERATIONS—(Continued)
when they sold 0.9 million XinTec shares that they held, and a $183,000 net loss from foreign transactions.
Other income, net, for fiscal 2014 included: $14.1 million of change-in-interest gain associated with WLCSP's initial public offering, when it issued 37.2 million new shares at a per share price that was higher than our per share carrying value; a $9.7 million gain from the sale of 5.1 million shares of WLCSP's common stock that we owned; a $2.0 million gain from the sale of our investment in Tong Hsing; $1.4 million of income associated with the leasing out of our office space; a $1.2 million gain on the interest rate swap agreement related to the mortgage on our Santa Clara Property; offset by a $2.0 million impairment charge for our investment in Phostek, Inc., or Phostek; and a $0.7 million loss from foreign exchange.
Other income, net, for fiscal 2013 included: a $0.6 million gain on the interest rate swap agreement related to the mortgage on our Santa Clara Property; $342,000 of income associated with the leasing out of our office space; partially offset by a $0.6 million loss from foreign exchange
Provision for (Benefit from) Income Taxes
We generated approximately $81.9 million, $104.9 million and $50.2 million in income before income taxes for fiscal 2015, 2014 and 2013, respectively. We recorded benefit from income taxes of approximately $11.5 million for fiscal 2015 and provision for income taxes of approximately $9.9 million and $7.3 million for fiscal 2014 and 2013, respectively. For fiscal 2015, 2014 and 2013, our effective tax rates were (14.0)%, 9.5% and 14.5%, respectively. These rates were less than the combined U.S. federal and state statutory rate of approximately 40.0% because we earn a significant portion of our income in jurisdictions where tax rates are lower than the combined U.S. federal and state statutory rate. We expect that our consolidated effective tax rate in fiscal 2016 will continue to be less than the combined U.S. federal and state statutory rate. The extent of the difference is principally contingent upon the amount of non-deductible stock-based compensation expenses and the proportion and geographic mix of our total pre-tax income. See Note 8—"Income Taxes" of the Notes to our consolidated financial statements for the reconciliation of how our provision for (benefit from) income taxes differs from the amount computed by applying the U.S. federal income tax rate of 35.0% to income before income taxes.
Liquidity and Capital Resources
Our principal sources of liquidity at April 30, 2015 consisted of cash, cash equivalents and short-term investments of $524.2 million.
Liquidity
Our working capital increased by $142.9 million to $842.9 million as of April 30, 2015, as compared to $700.0 million as of April 30, 2014. Our working capital increased as a result of: a $73.2 million increase in cash, cash equivalents and short term investments, primarily due to cash provided by operating activities; a $73.0 million increase in inventories due to a slow-down in demand for our products in the China market during the third quarter of fiscal 2015; a $23.2 million decrease in accounts payable, resulting from a reduction in inventory purchases as we corrected for the inventory build-up; a $3.2 million decrease in deferred revenues, less cost of revenues; and a $2.2 million increase in prepaid and deferred income taxes. These increases in working capital were partially offset by: a $21.4 million decrease in accounts receivable, net, corresponding to a 13.6% decrease in revenues in the fourth quarter of fiscal 2015 when compared with the similar prior year period; a $5.2 million
71
ITEM 7. MANAGEMENT'S DISCUSSION AND ANALYSIS OF FINANCIAL CONDITION AND
RESULTS OF OPERATIONS—(Continued)
increase in accrued expenses and other current liabilities; a $3.3 million increase in current portion of long-term debt; a $1.1 million increase in income taxes payable; and a $0.9 million decrease in prepaid expenses and other current assets.
Cash balances are held by our U.S. headquarters and our subsidiaries throughout the world, with the majority of cash and cash equivalents being held in the U.S., Cayman Islands, and Singapore. As of April 30, 2015, the amount of cash, cash equivalents and short-term investments held by foreign subsidiaries totaled approximately $225.1 million. In the event these funds from foreign subsidiaries are needed to fund operations in the U.S., and if U.S. tax has not already been previously provided, we would be required to accrue and pay additional U.S. taxes in order to repatriate these funds. However, our intent is to indefinitely reinvest these funds outside the U.S. and our current plans do not demonstrate a need to repatriate them to fund our U.S. operations.
In March 2007, we purchased our Santa Clara Property. In connection with the purchase, we obtained from a domestic bank a mortgage loan with a principal amount of $27.9 million, or the Mortgage Loan, and a term loan with a principal amount of $12.0 million, or the Term Loan. The Term Loan was paid off in full in July 2012. As of April 30, 2015, the principal amount outstanding under the Mortgage Loan was $23.1 million.
In August 2009, in order to finance costs associated with the construction of a research center for OTC, our wholly-owned subsidiary in Shanghai, we entered into a fixed asset loan agreement with a bank in China, or the Construction Loan. We completed the construction of the research center during the three months ended October 31, 2010. As of April 30, 2015, the principal amount outstanding under the Construction Loan was $9.0 million. See Note 7—"Borrowing Arrangements and Related Derivative Instruments" of the Notes to our consolidated financial statements.
Cash Flows from Operating Activities
For fiscal 2015, net cash provided by operating activities totaled approximately $75.2 million, as compared to cash provided by operating activities of approximately $237.9 million for fiscal 2014. The principal components of the current year amount were: net income of approximately $93.4 million for fiscal 2015; $41.2 million in write-down of inventories, $34.7 million in depreciation and amortization, adjustments for non-cash charges of $34.1 million in stock-based compensation, a $12.1 million in gain on equity investments; a $21.4 million decrease in accounts receivable, net; a $13.5 million decrease in prepaid expenses and other assets; a $9.0 million increase in accrued expenses and other liabilities. These increases were partially offset by: a $111.6 million increase in inventories; a $21.7 million decrease in accounts payable; a $17.0 million decrease in income taxes payable; a $5.8 million increase in prepaid and deferred income taxes; and a $3.0 million decrease in deferred revenues, less cost of revenues. The $111.6 million increase in inventories resulted from a slow-down in demand for our products in the China market during the third quarter of fiscal 2015. The increase in inventories resulted in a decrease in annualized inventory turns to 2.6 as of April 30, 2015 from 4.0 as of April 30, 2014. The $21.7 million decrease in accounts payable reflected a reduction in inventory purchases as we corrected for the inventory build-up. The $21.4 million decrease in accounts receivable, net, reflects the lower level of revenues during the fourth quarter of fiscal 2015 when compared with the fourth quarter of fiscal 2014.
For fiscal 2014, net cash provided by operating activities totaled approximately $237.9 million, as compared to cash used in operating activities of approximately $60.6 million for fiscal 2013. The principal components of the current year amount were: net income of approximately $95.0 million for fiscal 2014; adjustments for non-cash charges of $35.0 million in stock-based compensation,
72
ITEM 7. MANAGEMENT'S DISCUSSION AND ANALYSIS OF FINANCIAL CONDITION AND
RESULTS OF OPERATIONS—(Continued)
$33.2 million in write-down of inventories, $32.7 million in depreciation and amortization, a $23.8 million gain associated with WLCSP's IPO, a $19.5 million in gain on equity investments, a $3.1 million post-acquisition gain in "Benefit from acquisition of production operations from VisEra," and a $2.0 million gain from the sale of our investment in Tong Hsing; a $128.8 million decrease in inventories; a $10.5 million increase in deferred revenues, less cost of revenues; a $8.3 million decrease in prepaid and deferred income taxes; and a $2.8 million decrease in prepaid expenses and other assets. These increases were partially offset by: a $47.2 million decrease in accounts payable; a $6.0 million increase in accounts receivable, net; a $4.9 million decrease in income taxes payable; and a $1.1 million decrease in accrued expenses and other liabilities. The $128.8 million decrease in inventories resulted from a reduction in inventory purchases during fiscal 2014. The decrease in inventories relative to fourth quarter cost of revenues resulted in an increase in annualized inventory turns to 4.0 as of April 30, 2014 from 2.6 as of April 30, 2013. The $47.2 million decrease in accounts payable reflected the decrease in inventory purchases.
Cash Flows from Investing Activities
For fiscal 2015, our cash used in investing activities totaled $65.8 million, as compared to cash used in investing activities of approximately $138.0 million for fiscal 2014, due primarily to: $356.5 million in purchases of short-term investments; $11.3 million in purchases of property, plant and equipment; offset by $301.7 million in net proceeds from sales or maturities of short-term investments.
For fiscal 2014, our cash used in investing activities totaled $138.0 million, as compared to cash used in investing activities of approximately $47.1 million for fiscal 2013, due primarily to: $228.2 million in purchases of short-term investments, $14.8 million in purchases of property, plant and equipment; $12.3 million in purchases of intangible and other assets; partially offset by $96.2 million in net proceeds from sales or maturities of short-term investments $14.9 million in net proceeds from sales of investment in WLCSP and $6.2 million in proceeds from the sale of investment in Tong Hsing in fiscal 2014.
Cash Flows from Financing Activities
For fiscal 2015, net cash provided by financing activities totaled $11.6 million, as compared to net cash provided by financing activities of $7.9 million during fiscal 2014. This change was due primarily to: $13.4 million in proceeds from the exercise of stock options and employee purchases through our employee stock purchase plan; and $2.0 million in excess tax benefits from stock-based compensation; partially offset by $3.8 million in payments of long-term borrowings.
For fiscal 2014, net cash provided by financing activities totaled $7.9 million, as compared to net cash provided by financing activities of $7.4 million during fiscal 2013. This change was due primarily to: $13.7 million in proceeds from the exercise of stock options and employee purchases through our employee stock purchase plan; and $2.5 million in excess tax benefits from stock-based compensation; partially offset by a $4.5 million final installment payment to VisEra and $3.8 million in payments of long-term borrowings.
Capital Commitments and Resources
During the three months ended July 31, 2014, we entered into a development and supply agreement with PTC pursuant to which we would deposit up to $1.0 million with PTC as prepaid wafer credit. As of April 30, 2015 we have not made any deposits under this agreement.
73
ITEM 7. MANAGEMENT'S DISCUSSION AND ANALYSIS OF FINANCIAL CONDITION AND
RESULTS OF OPERATIONS—(Continued)
We currently expect our available cash, cash equivalents and short-term investments, together with cash that we anticipate generating from operating activities, will be sufficient to satisfy our capital requirements over approximately the next twelve months and the foreseeable future. Other than normal working capital requirements, we expect our capital requirements totaling approximately $45.0 million over approximately the next 12 months will consist primarily of funding capital investments in our wholly-owned subsidiaries.
Our ability to generate cash from operations is subject to substantial risks described above under the caption Part I Item 1A. "Risk Factors." We encourage you to review these risks carefully.
Contractual Obligations and Commercial Commitments
The following summarizes our contractual obligations and commercial commitments as of April 30, 2015 and the effect such obligations and commitments are expected to have on our liquidity and cash flows in future periods (in thousands):
| |
Payments Due by Period | |||||||||||||||
|---|---|---|---|---|---|---|---|---|---|---|---|---|---|---|---|---|
| |
Total | Less than 1 Year |
1 - 3 Years | 4 - 5 Years | More than 5 Years |
|||||||||||
Contractual Obligations and Commercial Commitments: |
||||||||||||||||
Operating leases |
$ | 12,061 | $ | 5,909 | $ | 3,730 | $ | 1,657 | $ | 765 | ||||||
Debt obligations(1) |
32,095 | 7,096 | 24,999 | — | — | |||||||||||
Purchase obligations(2) |
147,887 | 147,887 | — | — | — | |||||||||||
| | | | | | | | | | | | | | | | | |
Total contractual obligations |
192,043 | 160,892 | 28,729 | 1,657 | 765 | |||||||||||
| | | | | | | | | | | | | | | | | |
Other Commercial Commitments: |
||||||||||||||||
Prepaid wafer credit(3) |
1,000 | 1,000 | — | — | — | |||||||||||
| | | | | | | | | | | | | | | | | |
Total commercial commitments |
1,000 | 1,000 | — | — | — | |||||||||||
| | | | | | | | | | | | | | | | | |
Total contractual obligations and commercial commitments |
$ | 193,043 | $ | 161,892 | $ | 28,729 | $ | 1,657 | $ | 765 | ||||||
| | | | | | | | | | | | | | | | | |
| | | | | | | | | | | | | | | | | |
| | | | | | | | | | | | | | | | | |
- (1)
- In
March 2007, we entered into the Mortgage Loan with a domestic bank in the amount of $27.9 million. In August 2009, we entered into the
Construction Loan with a bank in China to finance costs associated with the construction of a research center for OTC. As of April 30, 2015, our balances outstanding under the Mortgage Loan and
Construction Loan were approximately $23.1 million and $9.0 million, respectively. See Note 7—"Borrowing Arrangements and Related Derivative
Instruments" to our consolidated financial statements. The amounts as disclosed in the table above do not include any associated interest payments as the loans have variable
interest rates and interests will vary accordingly.
- (2)
- Purchase
obligations represent outstanding purchase orders that we have placed with our suppliers at period-ends. The lead time for delivery is long,
typically 12 to 14 weeks, and suppliers must prepare unique materials for us at the beginning of the fabrication process. Accordingly, we are precluded from cancelling our orders once placed
and the production process has begun.
- (3)
- During the three months ended July 31, 2014, we entered into a development and supply agreement with PTC pursuant to which we would deposit up to $1.0 million with PTC as prepaid
74
ITEM 7. MANAGEMENT'S DISCUSSION AND ANALYSIS OF FINANCIAL CONDITION AND
RESULTS OF OPERATIONS—(Continued)
wafer credit. As of April 30, 2015, we have not made any deposits under this agreement. See Note 15—"Commitments and Contingencies" to our consolidated financial statements.
As of April 30, 2015, the long-term income taxes payable, including estimated interest and penalties, was $55.2 million. We are unable to make a reasonably reliable estimate of the timing of payments in individual years due to uncertainties in the timing of tax audits, if any, or their outcomes. Also, in connection with the proposed acquisition by Hua Capital Management, CITIC Capital and GoldStone Investment, we may be obligated to pay additional transaction related expenses, depending on the outcome of the proposed transaction. We are unable to make any estimates of such additional expenses as the outcome remains uncertain. Accordingly, we have excluded these obligations from the schedule summarizing our significant obligations to make future payments under contractual obligations as of April 30, 2015 presented above.
Off-Balance Sheet Arrangements
We did not have any material off-balance sheet arrangements during the periods covered by this Annual Report on Form 10-K.
Recent Accounting Pronouncements
In April 2014, the Financial Accounting Standards Board, or FASB, revised the authoritative guidance on reporting discontinued operations. The revised guidance specifies that a disposal of a component of an entity or a group of components of an entity is required to be reported in a discontinued operation if the disposal represents a strategic shift that has, or will have a major effect on an entity's operations and financial results. The guidance also changes the requirements for reporting discontinued operations which requires additional disclosures for discontinued operations and new disclosures for individually material disposal transactions that do not meet the definition of a discontinued operation. The guidance is effective for us beginning in the first quarter of fiscal 2016. We are currently evaluating the impact this guidance may have on our financial position, results of operations and cash flows.
In May 2014, the FASB issued new authoritative guidance for revenue recognition. The new revenue recognition guidance provides a comprehensive framework to address revenue recognition issues for all contracts with customers, and supersedes most previously-issued industry-specific guidance. The core principle of the guidance is that an entity should recognize revenue to depict the transfer of promised goods or services to customers in an amount that reflects the consideration to which the entity expects to be entitled in exchange for those goods or services. To achieve that core principle and apply the new guidance, entities will follow a five-step approach: Step 1) identify the contracts with the customer; Step 2) identify the separate performance obligations in the contract; Step 3) determine the transaction price; Step 4) allocate the transaction price to separate performance obligations; and Step 5) recognize revenue when, or as, each performance obligation is satisfied. The new guidance is required to be applied retrospectively to each prior reporting period presented, or retrospectively with the cumulative effect of initially applying it recognized at the date of initial application. The guidance is effective for us beginning in the first quarter of fiscal 2018. In April 2015, the FASB proposed a one-year deferral of the effective date of the guidance, with an option that would permit companies to adopt the standard as early as the original effective date. Thus far, this proposed deferral has not been finalized. We have not yet selected the transition method, and are currently evaluating the impact this guidance may have on our financial position, results of operations and cash flows.
75
ITEM 7. MANAGEMENT'S DISCUSSION AND ANALYSIS OF FINANCIAL CONDITION AND
RESULTS OF OPERATIONS—(Continued)
In August 2014, the FASB issued new authoritative guidance related to the disclosures around going concern. The new guidance specifies management's responsibility to evaluate whether there is substantial doubt about an entity's ability to continue as a going concern and to provide related footnote disclosures, if applicable. The new guidance is effective for us beginning in the first quarter of fiscal 2018. Early adoption is permitted. We do not expect the adoption of this guidance to have any material effect on our financial position, results of operations and cash flows.
In January 2015, the FASB revised the authoritative guidance on reporting extraordinary items by eliminating such concept from accounting principles generally accepted in the United States of America ("GAAP"). Previously, if an event or transaction meets the criteria for extraordinary classification, an entity is required to segregate the extraordinary item from the results of ordinary operations and show the item separately in the income statement, net of tax. The guidance is effective for us beginning in the first quarter of fiscal 2017. We do not expect the adoption of this guidance to have any material effect on our financial position, results of operations and cash flows.
In February 2015, the FASB revised the authoritative guidance for consolidation. The revised guidance affects reporting entities that are required to evaluate whether they should consolidate certain legal entities, and all legal entities are subject to reevaluation under the revised consolidation model. Other than modifying the evaluation guidance for limited partnerships and similar legal entities, the revised guidance also affects the consolidation analysis of reporting entities that are involved with variable-interest-entities. The guidance is effective for us beginning in the first quarter of fiscal 2017. We are currently evaluating the impact this guidance may have on our financial position, results of operations and cash flows.
76
ITEM 7A. QUANTITATIVE AND QUALITATIVE DISCLOSURES ABOUT MARKET RISK
Foreign Currency Exchange Risk
We sell our products globally, in particular to OEMs, VARs and distributors in China, Japan, Korea and Taiwan.
The great majority of our transactions with our customers and vendors are denominated in U.S. dollars. The expenses we incur in currencies other than U.S. dollars affect gross profit, research, development and related expenses, selling, general and administrative expenses and income taxes, and are primarily incurred in China, where the Chinese Yuan, or CNY, is the local currency and in Taiwan, where the New Taiwan dollar is the local currency.
As of April 30, 2015, the functional currency of all of our wholly-owned subsidiaries is the U.S. dollar. Transaction gains and losses resulting from transactions denominated in currencies other than the respective functional currencies are included in "Other income, net" for the periods presented. The amounts of transaction gains and losses for fiscal 2015, 2014 and 2013 were not material.
Given that the operating expenses which we incur in currencies other than U.S. dollars have not been a significant percentage of our revenues, we do not believe that our foreign currency exchange rate fluctuation risk is significant. Consequently, we do not believe that a 10% change in foreign currency exchange rates would have a significant effect on our future net income or cash flows.
In August 2009, in order to finance costs associated with the construction of a research center for OTC, we entered into the Construction Loan with a bank in China. The Construction Loan is denominated in CNY. As of April 30, 2015, the principal amount outstanding under the Construction Loan was $9.0 million. As of April 30, 2015, a hypothetical 10% weakening of the U.S. dollar against CNY would result in approximately $0.9 million of additional remeasurement losses. As of April 30, 2015, a hypothetical 10% strengthening of the U.S. dollar against CNY would result in approximately $0.9 million of additional remeasurement gains.
We have not hedged exposures denominated in foreign currencies or used any other derivative financial instruments. Although we transact the overwhelming majority of our business in U.S. dollars, future fluctuations in the value of the U.S. dollar may affect the competitiveness of our products and thus may impact our results of operations.
Market Interest Rate Risk
Our cash equivalents and short-term investments are exposed to financial market risk due to fluctuation in interest rates, which may affect our interest income and, from time to time, the fair market value of our investments. We manage our exposure to financial market risk by performing ongoing evaluations of our investment portfolio. We presently invest in money market funds, certificates of deposit issued by banks, commercial paper, high-grade corporate securities and government bonds maturing approximately 18 months or less from the date of purchase.
Due to the short maturities of our investments, the carrying value should approximate the fair market value. In addition, we do not use our investments for trading or other speculative purposes. Due to the short duration of our investment portfolio, we do not expect that an immediate 10% change in interest rates would have a material effect on the fair market value of our portfolio. Therefore, we would not expect our operating results or cash flows to be affected to any significant degree by the effect of a sudden change in market interest rates. We do not believe that the recent instability in global financial markets has significantly affected the value of our cash and short-term investments.
During fiscal 2007, we financed the purchase of the Santa Clara Property with a $27.9 million mortgage loan. The mortgage loan is a variable rate loan which bears interest at LIBOR plus 90 basis
77
ITEM 7A. QUANTITATIVE AND QUALITATIVE DISCLOSURES ABOUT MARKET RISK—(Continued)
points and changes in the interest rate affect our interest payments. However, concurrent with the mortgage loan, we also entered into an interest rate swap with a notional amount that approximates the principal outstanding under the mortgage loan. We are the fixed rate payer under the swap with a fixed rate of 5.3%. Consequently, although we are required to mark the value of the swap to market at each balance sheet date and record the associated non-cash cost or benefit as part of "Other income, net," a hypothetical 10% change in LIBOR would not have a material effect on our interest expense for fiscal 2015.
As to the Construction Loan, the interest rate is based on an indicative rate as published by the Chinese government, and will be adjusted only at the anniversary of each drawdown. Interest rate under the Construction Loan was 5.6% at April 30, 2015. We do not hedge against the risk of interest rate changes for the Construction Loan. However, since the current interest rate is published by the Chinese government and will not be adjusted until the next anniversary of the earliest drawdown, which will be November 2015, any hypothetical 10% shifts in yield will not cause a significant adverse impact to our results of operations, cash flows or to our financial position for fiscal 2015.
78
ITEM 8. FINANCIAL STATEMENTS AND SUPPLEMENTARY DATA
OMNIVISION TECHNOLOGIES, INC.
INDEX TO CONSOLIDATED FINANCIAL STATEMENTS
79
REPORT OF INDEPENDENT REGISTERED PUBLIC ACCOUNTING FIRM
To the Board of Directors and Stockholders of OmniVision Technologies, Inc.:
In our opinion, the consolidated financial statements listed in the accompanying index present fairly, in all material respects, the financial position of OmniVision Technologies, Inc. and its subsidiaries at April 30, 2015 and April 30, 2014, and the results of their operations and their cash flows for each of the three years in the period ended April 30, 2015 in conformity with accounting principles generally accepted in the United States of America. In addition, in our opinion, the financial statement schedule listed in the index appearing under Item 15(a)(2) presents fairly, in all material respects, the information set forth therein when read in conjunction with the related consolidated financial statements. Also in our opinion, the Company maintained, in all material respects, effective internal control over financial reporting as of April 30, 2015, based on criteria established in Internal Control—Integrated Framework (2013) issued by the Committee of Sponsoring Organizations of the Treadway Commission (COSO). The Company's management is responsible for these financial statements and financial statement schedule, for maintaining effective internal control over financial reporting and for its assessment of the effectiveness of internal control over financial reporting, included in Management's Annual Report on Internal Control over Financial Reporting appearing under Item 9A. Our responsibility is to express opinions on these financial statements, on the financial statement schedule, and on the Company's internal control over financial reporting based on our integrated audits. We conducted our audits in accordance with the standards of the Public Company Accounting Oversight Board (United States). Those standards require that we plan and perform the audits to obtain reasonable assurance about whether the financial statements are free of material misstatement and whether effective internal control over financial reporting was maintained in all material respects. Our audits of the financial statements included examining, on a test basis, evidence supporting the amounts and disclosures in the financial statements, assessing the accounting principles used and significant estimates made by management, and evaluating the overall financial statement presentation. Our audit of internal control over financial reporting included obtaining an understanding of internal control over financial reporting, assessing the risk that a material weakness exists, and testing and evaluating the design and operating effectiveness of internal control based on the assessed risk. Our audits also included performing such other procedures as we considered necessary in the circumstances. We believe that our audits provide a reasonable basis for our opinions.
A company's internal control over financial reporting is a process designed to provide reasonable assurance regarding the reliability of financial reporting and the preparation of financial statements for external purposes in accordance with generally accepted accounting principles. A company's internal control over financial reporting includes those policies and procedures that (i) pertain to the maintenance of records that, in reasonable detail, accurately and fairly reflect the transactions and dispositions of the assets of the company; (ii) provide reasonable assurance that transactions are recorded as necessary to permit preparation of financial statements in accordance with generally accepted accounting principles, and that receipts and expenditures of the company are being made only in accordance with authorizations of management and directors of the company; and (iii) provide reasonable assurance regarding prevention or timely detection of unauthorized acquisition, use, or disposition of the company's assets that could have a material effect on the financial statements.
Because of its inherent limitations, internal control over financial reporting may not prevent or detect misstatements. Also, projections of any evaluation of effectiveness to future periods are subject to the risk that controls may become inadequate because of changes in conditions, or that the degree of compliance with the policies or procedures may deteriorate.
/s/ PRICEWATERHOUSECOOPERS LLP
San
Jose, California
June 29, 2015
80
OMNIVISION TECHNOLOGIES, INC.
CONSOLIDATED BALANCE SHEETS
(In thousands, except share and per share data)
| |
April 30, | ||||||
|---|---|---|---|---|---|---|---|
| |
2015 | 2014 | |||||
ASSETS |
|||||||
Current assets: |
|||||||
Cash and cash equivalents |
$ | 318,892 | $ | 297,952 | |||
Short-term investments |
205,271 | 152,993 | |||||
Accounts receivable, net |
151,086 | 172,472 | |||||
Inventories |
343,966 | 270,935 | |||||
Prepaid and deferred income taxes |
7,149 | 4,973 | |||||
Prepaid expenses and other current assets |
5,628 | 6,576 | |||||
Recoverable insurance proceeds |
12,500 | — | |||||
| | | | | | | | |
Total current assets |
1,044,492 | 905,901 | |||||
Property, plant and equipment, net |
145,214 | 153,792 | |||||
Long-term investments |
192,021 | 154,409 | |||||
Goodwill |
10,227 | 10,227 | |||||
Intangibles, net |
52,287 | 66,217 | |||||
Other long-term assets |
24,155 | 32,529 | |||||
| | | | | | | | |
Total assets |
$ | 1,468,396 | $ | 1,323,075 | |||
| | | | | | | | |
| | | | | | | | |
| | | | | | | | |
LIABILITIES AND STOCKHOLDERS' EQUITY |
|||||||
Current liabilities: |
|||||||
Accounts payable |
$ | 118,796 | $ | 142,012 | |||
Accrued expenses and other current liabilities |
37,112 | 31,959 | |||||
Litigation settlement accrual |
12,500 | — | |||||
Income taxes payable |
3,444 | 2,316 | |||||
Deferred revenues, less cost of revenues |
22,621 | 25,783 | |||||
Current portion of long-term debt |
7,096 | 3,802 | |||||
| | | | | | | | |
Total current liabilities |
201,569 | 205,872 | |||||
| | | | | | | | |
Long-term liabilities: |
|||||||
Long-term income taxes payable |
55,150 | 86,498 | |||||
Non-current portion of long-term debt |
24,999 | 32,030 | |||||
Other long-term liabilities |
23,898 | 11,818 | |||||
| | | | | | | | |
Total long-term liabilities |
104,047 | 130,346 | |||||
| | | | | | | | |
Total liabilities |
305,616 | 336,218 | |||||
| | | | | | | | |
Commitments and contingencies (Note 15) |
|||||||
Stockholders' equity: |
|||||||
Common stock, $0.001 par value; 100,000,000 shares authorized; 78,734,217 shares issued and 58,135,030 outstanding at April 30, 2015 and 76,680,773 shares issued and 56,081,586 outstanding at April 30, 2014, respectively |
79 | 77 | |||||
Additional paid-in capital |
709,442 | 664,602 | |||||
Accumulated other comprehensive income |
40,069 | 2,378 | |||||
Treasury stock, 20,599,187 shares at April 30, 2015 and April 30, 2014 |
(278,683 | ) | (278,683 | ) | |||
Retained earnings |
691,873 | 598,483 | |||||
| | | | | | | | |
Total stockholders' equity |
1,162,780 | 986,857 | |||||
| | | | | | | | |
Total liabilities and stockholders' equity |
$ | 1,468,396 | $ | 1,323,075 | |||
| | | | | | | | |
| | | | | | | | |
| | | | | | | | |
The accompanying notes are an integral part of these consolidated financial statements.
81
OMNIVISION TECHNOLOGIES, INC.
CONSOLIDATED STATEMENTS OF INCOME
(in thousands, except per share amounts)
| |
Year Ended April 30, | |||||||||
|---|---|---|---|---|---|---|---|---|---|---|
| |
2015 | 2014 | 2013 | |||||||
Revenues |
$ | 1,378,775 | $ | 1,453,929 | $ | 1,407,929 | ||||
Cost of revenues |
1,075,326 | 1,178,207 | 1,163,815 | |||||||
| | | | | | | | | | | |
Gross profit |
303,449 | 275,722 | 244,114 | |||||||
| | | | | | | | | | | |
Operating expenses: |
||||||||||
Research, development and related |
135,575 | 119,248 | 113,194 | |||||||
Selling, general and administrative |
82,462 | 73,292 | 72,958 | |||||||
Amortization of acquired patent portfolio |
9,286 | 9,286 | 9,286 | |||||||
| | | | | | | | | | | |
Total operating expenses |
227,323 | 201,826 | 195,438 | |||||||
| | | | | | | | | | | |
Income from operations |
76,126 | 73,896 | 48,676 | |||||||
Benefit from acquisition of production operations from VisEra |
— | 3,057 | — | |||||||
Equity in earnings of investee |
4,270 | 4,009 | 3,832 | |||||||
Interest expense, net |
(1,523 | ) | (2,029 | ) | (2,700 | ) | ||||
Other income, net |
3,024 | 25,996 | 356 | |||||||
| | | | | | | | | | | |
Income before income taxes |
81,897 | 104,929 | 50,164 | |||||||
Provision for (benefit from) income taxes |
(11,493 | ) | 9,932 | 7,262 | ||||||
| | | | | | | | | | | |
Net income |
$ | 93,390 | $ | 94,997 | $ | 42,902 | ||||
| | | | | | | | | | | |
| | | | | | | | | | | |
| | | | | | | | | | | |
Net income per share: |
||||||||||
Basic |
$ | 1.62 | $ | 1.71 | $ | 0.80 | ||||
| | | | | | | | | | | |
| | | | | | | | | | | |
| | | | | | | | | | | |
Diluted |
$ | 1.57 | $ | 1.70 | $ | 0.80 | ||||
| | | | | | | | | | | |
| | | | | | | | | | | |
| | | | | | | | | | | |
Shares used in computing net income per share: |
||||||||||
Basic |
57,563 | 55,537 | 53,529 | |||||||
| | | | | | | | | | | |
| | | | | | | | | | | |
| | | | | | | | | | | |
Diluted |
59,516 | 56,043 | 53,671 | |||||||
| | | | | | | | | | | |
| | | | | | | | | | | |
| | | | | | | | | | | |
The accompanying notes are an integral part of these consolidated financial statements.
82
OMNIVISION TECHNOLOGIES, INC.
CONSOLIDATED STATEMENTS OF COMPREHENSIVE INCOME
(in thousands)
| |
Year Ended April 30, | |||||||||
|---|---|---|---|---|---|---|---|---|---|---|
| |
2015 | 2014 | 2013 | |||||||
Net income |
$ | 93,390 | $ | 94,997 | $ | 42,902 | ||||
Other comprehensive income (loss), net of tax: |
||||||||||
Translation gains |
14 | 35 | 280 | |||||||
Reclassification adjustments for gains on sale of WLCSP included in net income, net of tax |
— | (665 | ) | — | ||||||
| | | | | | | | | | | |
Translation gains (losses) |
14 | (630 | ) | 280 | ||||||
Unrealized gains on available-for-sale securities |
38,254 | 343 | 691 | |||||||
Reclassification adjustments for (gains) losses on available-for-sale securities included in net income, net of tax |
(577 | ) | (1,287 | ) | 11 | |||||
| | | | | | | | | | | |
Unrealized gains (losses) on available-for-sale securities |
37,677 | (944 | ) | 702 | ||||||
Other comprehensive income (loss) |
37,691 | (1,574 | ) | 982 | ||||||
| | | | | | | | | | | |
Comprehensive income |
$ | 131,081 | $ | 93,423 | $ | 43,884 | ||||
| | | | | | | | | | | |
| | | | | | | | | | | |
| | | | | | | | | | | |
The accompanying notes are an integral part of these consolidated financial statements.
83
OMNIVISION TECHNOLOGIES, INC.
CONSOLIDATED STATEMENTS OF STOCKHOLDERS' EQUITY
(in thousands, except share data)
| |
Common Stock | |
Accumulated Other Comprehensive Income |
|
|
|
||||||||||||||||
|---|---|---|---|---|---|---|---|---|---|---|---|---|---|---|---|---|---|---|---|---|---|---|
| |
Additional Paid-in Capital |
Treasury Stock |
Retained Earnings |
Total Stockholders' Equity |
||||||||||||||||||
| |
Shares | Amount | ||||||||||||||||||||
Balance at April 30, 2012 |
52,364,648 | $ | 73 | $ | 575,935 | $ | 2,970 | $ | (278,683 | ) | $ | 460,584 | $ | 760,879 | ||||||||
Exercise of common stock options |
136,563 | — | 1,085 | — | — | — | 1,085 | |||||||||||||||
Employee stock purchase plan |
687,566 | 1 | 6,720 | — | — | — | 6,721 | |||||||||||||||
Restricted stock units |
786,418 | 1 | — | — | — | — | 1 | |||||||||||||||
Withholding tax deduction on restricted stock units |
— | — | (1,561 | ) | — | — | — | (1,561 | ) | |||||||||||||
Employee stock-based compensation. |
— | — | 33,511 | — | — | — | 33,511 | |||||||||||||||
Tax effect from stock-based compensation |
— | — | 3,696 | — | — | — | 3,696 | |||||||||||||||
Write-off of employee stock-based compensation related deferred tax assets |
— | — | (1,637 | ) | — | — | — | (1,637 | ) | |||||||||||||
Tax payable adjustment |
— | — | (1,370 | ) | — | — | — | (1,370 | ) | |||||||||||||
Translation gains |
— | — | — | 280 | — | — | 280 | |||||||||||||||
Unrealized gains on available-for-sale securities, net |
— | — | — | 702 | — | — | 702 | |||||||||||||||
Net income |
— | — | — | — | — | 42,902 | 42,902 | |||||||||||||||
| | | | | | | | | | | | | | | | | | | | | | | |
Balance at April 30, 2013 |
53,975,195 | 75 | 616,379 | 3,952 | (278,683 | ) | 503,486 | 845,209 | ||||||||||||||
Exercise of common stock options |
465,468 | — | 6,825 | — | — | — | 6,825 | |||||||||||||||
Employee stock purchase plan |
683,405 | 1 | 6,847 | — | — | — | 6,848 | |||||||||||||||
Restricted stock units |
957,518 | 1 | — | — | — | — | 1 | |||||||||||||||
Withholding tax deduction on restricted stock units |
— | — | (2,803 | ) | — | — | — | (2,803 | ) | |||||||||||||
Employee stock-based compensation. |
— | — | 35,043 | — | — | — | 35,043 | |||||||||||||||
Tax effect from stock-based compensation |
— | — | 3,042 | — | — | — | 3,042 | |||||||||||||||
Write-off of employee stock-based compensation related deferred tax assets |
— | — | (731 | ) | — | — | — | (731 | ) | |||||||||||||
Translation losses |
— | — | — | (630 | ) | — | — | (630 | ) | |||||||||||||
Unrealized losses on available-for-sale securities, net |
— | — | — | (944 | ) | — | — | (944 | ) | |||||||||||||
Net income |
— | — | — | — | — | 94,997 | 94,997 | |||||||||||||||
| | | | | | | | | | | | | | | | | | | | | | | |
Balance at April 30, 2014 |
56,081,586 | 77 | 664,602 | 2,378 | (278,683 | ) | 598,483 | 986,857 | ||||||||||||||
Exercise of common stock options |
407,983 | — | 5,633 | — | — | — | 5,633 | |||||||||||||||
Employee stock purchase plan |
563,076 | 1 | 7,718 | — | — | — | 7,719 | |||||||||||||||
Restricted stock units |
1,082,385 | 1 | — | — | — | — | 1 | |||||||||||||||
Withholding tax deduction on restricted stock units |
— | — | (4,307 | ) | — | — | — | (4,307 | ) | |||||||||||||
Employee stock-based compensation. |
— | — | 34,144 | — | — | — | 34,144 | |||||||||||||||
Tax effect from stock-based compensation |
— | — | 2,626 | — | — | — | 2,626 | |||||||||||||||
Write-off of employee stock-based compensation related deferred tax assets |
— | — | (974 | ) | — | — | — | (974 | ) | |||||||||||||
Translation gains |
— | — | — | 14 | — | — | 14 | |||||||||||||||
Unrealized gains on available-for-sale securities, net |
— | — | — | 37,677 | — | — | 37,677 | |||||||||||||||
Net income |
— | — | — | — | — | 93,390 | 93,390 | |||||||||||||||
| | | | | | | | | | | | | | | | | | | | | | | |
Balance at April 30, 2015 |
58,135,030 | $ | 79 | $ | 709,442 | $ | 40,069 | $ | (278,683 | ) | $ | 691,873 | $ | 1,162,780 | ||||||||
| | | | | | | | | | | | | | | | | | | | | | | |
| | | | | | | | | | | | | | | | | | | | | | | |
| | | | | | | | | | | | | | | | | | | | | | | |
The accompanying notes are an integral part of these consolidated financial statements.
84
OMNIVISION TECHNOLOGIES, INC.
CONSOLIDATED STATEMENTS OF CASH FLOWS
(In thousands)
| |
Year Ended April 30, | |||||||||
|---|---|---|---|---|---|---|---|---|---|---|
| |
2015 | 2014 | 2013 | |||||||
Cash flows from operating activities: |
||||||||||
Net income |
$ | 93,390 | $ | 94,997 | $ | 42,902 | ||||
Adjustments to reconcile net income to net cash provided by (used in) operating activities: |
||||||||||
Depreciation and amortization |
34,686 | 32,726 | 32,524 | |||||||
Change in fair value of interest rate swap |
(907 | ) | (1,204 | ) | (625 | ) | ||||
Stock-based compensation |
34,144 | 35,043 | 33,511 | |||||||
Tax effect from stock-based compensation |
2,626 | 3,042 | 3,696 | |||||||
Gain on equity investments, net |
(12,058 | ) | (19,459 | ) | (20,014 | ) | ||||
Write-down of inventories |
41,158 | 33,172 | 23,122 | |||||||
Excess tax benefits from stock-based compensation |
(2,010 | ) | (2,538 | ) | (2,696 | ) | ||||
Benefit from acquisition of production operations from VisEra |
— | (3,057 | ) | — | ||||||
Gain on sale of investment in XinTec |
(576 | ) | — | — | ||||||
Gain associated with WLCSP IPO |
— | (23,802 | ) | — | ||||||
Gain on sale of investment in Tong Hsing |
— | (1,990 | ) | — | ||||||
(Gain) loss on disposal of property, plant and equipment |
(15 | ) | (154 | ) | 152 | |||||
Changes in assets and liabilities: |
||||||||||
Accounts receivable, net |
21,386 | (5,956 | ) | (58,724 | ) | |||||
Inventories |
(111,630 | ) | 128,773 | (163,513 | ) | |||||
Prepaid and deferred income taxes |
(5,842 | ) | 8,272 | (4,361 | ) | |||||
Prepaid expenses and other assets |
13,539 | 2,772 | 10,203 | |||||||
Accounts payable |
(21,717 | ) | (47,236 | ) | 29,902 | |||||
Accrued expenses and other liabilities |
9,029 | (1,137 | ) | 5,251 | ||||||
Income taxes payable |
(16,963 | ) | (4,867 | ) | 3,248 | |||||
Deferred revenues, less cost of revenues |
(3,035 | ) | 10,496 | 4,798 | ||||||
| | | | | | | | | | | |
Net cash provided by (used in) operating activities |
75,205 | 237,893 | (60,624 | ) | ||||||
| | | | | | | | | | | |
Cash flows from investing activities: |
||||||||||
Purchases of short-term investments |
(356,531 | ) | (228,244 | ) | (309,345 | ) | ||||
Proceeds from sales or maturities of short-term investments |
301,742 | 96,211 | 327,161 | |||||||
Purchases of property, plant and equipment, net of sales |
(11,311 | ) | (14,849 | ) | (35,323 | ) | ||||
Purchase and deposits for intangible and other assets |
— | (12,302 | ) | (20,557 | ) | |||||
Proceeds from sale of investment in XinTec |
302 | — | — | |||||||
Proceeds from sale of investment in WLCSP |
— | 14,936 | — | |||||||
Proceeds from sale of investment in Tong Hsing |
— | 6,224 | — | |||||||
Payments for the acquisition of production operations from VisEra |
— | — | (9,000 | ) | ||||||
| | | | | | | | | | | |
Net cash used in investing activities |
(65,798 | ) | (138,024 | ) | (47,064 | ) | ||||
| | | | | | | | | | | |
Cash flows from financing activities: |
||||||||||
Repayment of long-term borrowings |
(3,812 | ) | (3,830 | ) | (3,144 | ) | ||||
Excess tax benefits from stock-based compensation |
2,010 | 2,538 | 2,696 | |||||||
Proceeds from exercise of stock options and employee stock purchase plan |
13,352 | 13,673 | 7,807 | |||||||
Final payment for acquisition of production operation from VisEra |
— | (4,500 | ) | — | ||||||
| | | | | | | | | | | |
Net cash provided by financing activities |
11,550 | 7,881 | 7,359 | |||||||
| | | | | | | | | | | |
Effect of exchange rate changes on cash and cash equivalents |
(17 | ) | 31 | 8 | ||||||
| | | | | | | | | | | |
Net increase (decrease) in cash and cash equivalents |
20,940 | 107,781 | (100,321 | ) | ||||||
Cash and cash equivalents at beginning of period |
297,952 | 190,171 | 290,492 | |||||||
| | | | | | | | | | | |
Cash and cash equivalents at end of period |
$ | 318,892 | $ | 297,952 | $ | 190,171 | ||||
| | | | | | | | | | | |
| | | | | | | | | | | |
| | | | | | | | | | | |
Supplemental cash flow information: |
||||||||||
Taxes paid |
$ | 8,719 | $ | 3,425 | $ | 4,611 | ||||
| | | | | | | | | | | |
| | | | | | | | | | | |
| | | | | | | | | | | |
Interest paid |
$ | 2,142 | $ | 2,373 | $ | 2,570 | ||||
| | | | | | | | | | | |
| | | | | | | | | | | |
| | | | | | | | | | | |
Supplemental schedule of non-cash investing and financing activities: |
||||||||||
Additions to intangible assets included in accruals |
$ | — | $ | 9,604 | $ | — | ||||
| | | | | | | | | | | |
| | | | | | | | | | | |
| | | | | | | | | | | |
Additions to property, plant and equipment included in accounts payable and accrued expenses and other current liabilities |
$ | 2,731 | $ | 3,877 | $ | 2,500 | ||||
| | | | | | | | | | | |
| | | | | | | | | | | |
| | | | | | | | | | | |
Write-off of employee stock-based compensation-related deferred tax assets |
$ | 974 | $ | 731 | $ | 1,637 | ||||
| | | | | | | | | | | |
| | | | | | | | | | | |
| | | | | | | | | | | |
The accompanying notes are an integral part of these consolidated financial statements.
85
OMNIVISION TECHNOLOGIES, INC.
NOTES TO CONSOLIDATED FINANCIAL STATEMENTS
For the Years Ended April 30, 2015, 2014 and 2013
Note 1—Basis of Presentation
The Company
OmniVision Technologies, Inc. and its subsidiaries ("OmniVision" or the "Company") design, develop, manufacture and market image-sensor devices. The Company's main product, a semiconductor image-sensing device called the CameraChip™, is used to capture images electronically and is used in a number of consumer and commercial mass-market applications. The Company's CameraChip image sensor is manufactured using the complementary metal oxide semiconductor ("CMOS") fabrication process. The Company has also integrated its CameraChip image sensor with wafer-level optics, and marketed the integrated device as a CameraCubeChip™ imaging device. The Company was incorporated in California in May 1995 and reincorporated in Delaware in March 2000.
The results of operations for the fiscal year ended April 30, 2015 are not necessarily indicative of the results that may be expected for the fiscal year ending April 30, 2016 or any other future period.
Proposed Acquisition by Hua Capital Management, CITIC Capital and GoldStone Investment
On April 30, 2015, the Company entered into a definitive agreement ("Merger Agreement") to be acquired by a consortium composed of Hua Capital Management Co., Ltd. ("Hua Capital Management"), CITIC Capital Holdings Limited ("CITIC Capital"), and GoldStone Investment Co., Ltd. ("GoldStone Investment") (collectively, the "Consortium"). Under the terms of the Merger Agreement, OmniVision stockholders will receive $29.75 per share in cash, or a total of approximately $1.9 billion. The agreement was unanimously approved by the Company's Board of Directors. The transaction, which is expected to close in the third or fourth quarter of fiscal 2016, is subject to approval by OmniVision stockholders, regulatory approvals, including antitrust review in the U.S. and the People's Republic of China, review and clearance by the Committee on Foreign Investment in the U.S., clearance or approval under applicable Taiwan law, and other customary closing conditions.
Use of Estimates
The preparation of financial statements in conformity with accounting principles generally accepted in the United States of America ("GAAP") requires management to make estimates and assumptions that affect the reported amounts of assets and liabilities, the disclosure of contingent assets and liabilities at the date of the financial statements and the reported amounts of revenues and expenses during the reporting period. The Company bases its estimates and judgments on its historical experience, knowledge of current conditions and beliefs of what could occur in the future considering available information. Actual results could differ from these estimates.
Note 2—Summary of Significant Accounting Policies
Principles of Consolidation
The consolidated financial statements include the accounts of the Company and its wholly-owned subsidiaries. All significant inter-company accounts and transactions have been eliminated.
86
OMNIVISION TECHNOLOGIES, INC.
NOTES TO CONSOLIDATED FINANCIAL STATEMENTS—(Continued)
For the Years Ended April 30, 2015, 2014 and 2013
Note 2—Summary of Significant Accounting Policies—(Continued)
Foreign Currency Translation
All of the Company's wholly-owned subsidiaries use the U.S. dollar as their respective functional currency. For these subsidiaries with assets or liabilities denominated in currencies other than the U.S. dollar, non-monetary assets are remeasured into U.S. dollars using historical rates of exchange. Monetary assets and liabilities are remeasured into U.S. dollars using exchange rates prevailing on the balance sheet date. The remeasurement gains or losses are included in "Other income, net." For fiscal 2015, 2014 and 2013, the Company recorded remeasurement losses of $333,000, $1.5 million and $405,000 in "Other income, net," respectively.
Cash and Cash Equivalents
The Company considers all highly liquid investments purchased with a maturity at the date of purchase of three months or less to be cash equivalents. Cash equivalents consist principally of money market funds. (See Note 4.)
The Company maintains the majority of its cash and cash equivalent balances with major financial institutions in the United States, Cayman Islands and Singapore. These balances are subject to a concentration of credit risk and only a small proportion of these balances are covered by Federal Deposit Insurance Corporation ("FDIC") insurance. The Company places its cash investments in instruments that meet high credit quality standards, as specified in the Company's investment policy guidelines.
Short-Term Investments
The Company's short-term investments, which are classified as available-for-sale securities, are invested in high-grade corporate debt securities, municipal bonds and notes and U.S. government debt and agencies securities with a final maturity of eighteen months or less from the date of purchase.
Short-term investments are reported at fair value at April 30, 2015 and 2014. Unrealized gains or losses are recorded in stockholders' equity and included in "Accumulated other comprehensive income." Short-term investments with declines in value which are judged to be other than temporary, of which there were none in the periods presented, would be written down to their fair values, at the time such judgment is made.
Accounts Receivable
Accounts receivable are recorded at invoiced amounts and do not bear interest. The Company performs ongoing credit evaluations of its customers' financial condition and, generally, requires no collateral from its customers. Allowances for doubtful accounts and sales returns are established based on various factors including credit profiles of the Company's customers, contractual terms and conditions, historical payments, returns and discounts experience, and current economic trends. The Company reviews its allowance for doubtful accounts quarterly by assessing individual accounts receivable over a specific aging and amount, and all other balances on a pooled basis based on historical collection experience and economic risk assessment. Accounts receivable are written off on a case-by-case basis, net of any amounts that may be collected. The Company determines its allowance for sales returns through evaluation of historical sales returns and other known factors and provides for
87
OMNIVISION TECHNOLOGIES, INC.
NOTES TO CONSOLIDATED FINANCIAL STATEMENTS—(Continued)
For the Years Ended April 30, 2015, 2014 and 2013
Note 2—Summary of Significant Accounting Policies—(Continued)
estimated sales returns in the same period it records the related revenues. To estimate the allowance for sales returns, the Company analyzes potential customer specific product application issues, potential quality and reliability issues and historical returns. The Company evaluates the adequacy of the allowance for sales returns on a quarterly basis. This allowance is reflected as a reduction to accounts receivable in the Company's Consolidated Balance Sheets. Increases to the allowance are recorded as a reduction to revenues.
Fair Value of Financial Instruments
Due to their short maturities, the reported amounts of the Company's financial instruments, including cash equivalents, short-term investments, accounts receivable, accounts payable and other current liabilities approximate fair value.
The Company records its mortgage loan and construction loan at cost, which approximates their respective fair values as the underlying interest rates are based on risk-adjusted market rates. (See Note 7.)
Related to the mortgage loan, the Company has an outstanding interest rate swap arrangement as of April 30, 2015. The Company recognizes this derivative instrument at the reporting date as either an asset or liability in its Consolidated Balance Sheets, measured at fair value. The accounting for changes in fair value of a derivative depends on the intended use of the derivative and the associated hedging designation. The Company has designated the swap as an economic hedge and records the changes in fair value in "Other income, net." (See Note 7.)
Property, Plant and Equipment
Property, plant and equipment is stated at cost less accumulated depreciation and amortization. Depreciation is computed using the straight-line method over the estimated useful lives of the assets as follows:
Buildings |
40 years | |
Building/leasehold improvements |
Shorter of 20 years or life of lease | |
Machinery and equipment |
2 - 10 years | |
Furniture and fixtures |
3 - 7 years |
Construction in progress includes project costs paid to third parties that are clearly associated with the acquisition, development, and construction of an asset and are capitalized as a cost of that project prior to the use of the asset. Such costs include the costs of materials, interest, legal, and escrow services. These capitalized project costs are not subject to depreciation until the assets to which they are related are placed into production.
Land-Use Rights
The net book value of the Company's land-use rights comprises three separate arrangements. One of the Company's wholly-owned subsidiaries, OmniVision Semiconductor (Shanghai) Co. Ltd. ("OSC"), formerly Hua Wei Semiconductor (Shanghai) Co. Ltd., holds a land-use right that was acquired from
88
OMNIVISION TECHNOLOGIES, INC.
NOTES TO CONSOLIDATED FINANCIAL STATEMENTS—(Continued)
For the Years Ended April 30, 2015, 2014 and 2013
Note 2—Summary of Significant Accounting Policies—(Continued)
the Shanghai SongJiang Housing and Land Administration Bureau in December 2000 for approximately $0.8 million. The cost of the land-use right is being amortized over 40 years, the useful life of the right.
In January 2007, the Company, through its wholly-owned subsidiary, OmniVision Technologies (Shanghai) Co. Ltd. ("OTC"), formerly Shanghai OmniVision IC Design Co. Ltd., entered into a land-use-right agreement with the Construction and Transportation Commission of the Pudong New District, Shanghai. The agreement has an effective date of December 31, 2006. Under the terms of the agreement, the Company paid an aggregate amount of approximately $0.6 million in exchange for the right to use approximately 323,000 square feet of land located in Shanghai, China. The cost of the land-use right is being amortized over 50 years, the useful life of the right.
In addition, in July 2011, the Company, through its wholly-owned subsidiary, Shanghai OmniVision Semiconductor Technology Co. Ltd. ("OST"), entered into a land-use-right agreement with the Shanghai SongJiang District Zoning and Land Administration Bureau. Under the terms of the agreement, the Company paid an aggregate amount of approximately $1.0 million in exchange for the right to use approximately 113,175 square feet of land located in Shanghai for a period of 50 years, starting from August 19, 2011. The cost of the land-use right is being amortized over 50 years, the useful life of the right.
Long-Lived Assets
The Company reviews its long-lived assets, including intangible assets, for impairment whenever events or changes in circumstances indicate that the carrying amount of an asset might not be recoverable. When such an event occurs, the Company estimates the undiscounted future cash flows expected to result from the use of the asset and its eventual disposition. If the undiscounted expected future cash flows are less than the carrying amount of the asset, an impairment loss is recognized in order to write-down the carrying value of the asset to its estimated fair market value. To date, the Company has not recognized any impairment losses.
Inventories
Inventories are stated at the lower of cost, determined on a first-in, first-out ("FIFO") basis, or market.
The Company records a provision to reduce the carrying value of inventories to their net realizable value when the Company believes that the net realizable value is less than cost. The Company also records a provision for the cost of inventories when the number of units on hand exceeds the number of units that the Company forecasts will be sold over a certain period of time, generally 12 months. Where necessary, these provisions take into account the inventories owned and not yet sold by certain of the Company's distributors. The recording of these provisions establishes a new and lower cost basis for each specifically identified inventory item, and the Company does not restore the cost basis to its original level regardless of any subsequent changes in facts or circumstances. Recoveries are only recognized upon the sale of previously written-down inventories.
89
OMNIVISION TECHNOLOGIES, INC.
NOTES TO CONSOLIDATED FINANCIAL STATEMENTS—(Continued)
For the Years Ended April 30, 2015, 2014 and 2013
Note 2—Summary of Significant Accounting Policies—(Continued)
Goodwill
The Company records goodwill when the consideration paid for an acquisition exceeds the fair value of net tangible and intangible assets acquired, including related tax effects. Goodwill is not amortized; instead goodwill is tested for impairment on an annual basis, or more frequently if the Company believes indicators of impairment exist. The Company first assesses qualitative factors to determine whether it is more-likely-than-not that the fair value of a reporting unit is less than its carrying value. If the Company determines that the fair value is less than the carrying value, the Company will use a two-step process to determine the amount of goodwill impairment. The first step requires comparing the fair value of the reporting unit to its net book value, including goodwill. A potential impairment exists if the fair value of the reporting unit is lower than its net book value. The second step of the process, which is performed only if a potential impairment exists, involves determining the difference between the fair value of the reporting unit's net assets other than goodwill and the fair value of the reporting unit. If this difference is less than the net book value of goodwill, an impairment exists and is recorded.
Warranty for Defective Products
The Company warrants to its customers that its products will work in accordance with each product's specifications. Due to the cost and other complexities associated with rectifying any product defects, the Company does not repair any defective products. If a product is defective, the customer notifies the Company and, with the Company's approval, returns the defective product. The Company then sends replacement products to the customer. Accordingly, the Company accounts for any exposure related to defective products as a portion of its allowance for sales returns.
Treasury Stock
The Company accounts for treasury stock under the cost method and includes treasury stock as a component of stockholders' equity.
Revenue Recognition
For shipments to customers without agreements that allow for returns or credits, principally original equipment manufacturers ("OEMs") and value added resellers ("VARs"), the Company recognizes revenue using the "sell-in" method. Under this method, the Company recognizes revenue upon the shipment of products to the customer provided that the Company has received a signed purchase order, the price is fixed or determinable, title and risk of loss has transferred to the customer, collection of resulting receivables is considered reasonably assured, product returns are reasonably estimable, there are no customer acceptance requirements and there are no remaining material obligations. At the time revenue is recognized, the Company provides for future returns of potentially defective product based on historical experience. For cash consideration given to customers, that is primarily in the form of rebates and for which the Company does not receive a separately identifiable benefit or cannot reasonably estimate fair value, the Company records the amounts as reductions of revenue.
For shipment of products sold to distributors under agreements allowing for returns or credits, title and the risk of ownership to the products transfer to the distributor upon shipment, and the distributor
90
OMNIVISION TECHNOLOGIES, INC.
NOTES TO CONSOLIDATED FINANCIAL STATEMENTS—(Continued)
For the Years Ended April 30, 2015, 2014 and 2013
Note 2—Summary of Significant Accounting Policies—(Continued)
is obligated to pay for the products whether or not the distributor has sold them at the time payment is due. Under the terms of the Company's agreements with such distributors and subject to the Company's prior approval, distributors are entitled to reclaim from the Company as price adjustments the difference, if any, between the prices at which the Company sold the product to the distributors and the prices at which the product is subsequently sold by the distributor. In addition, distributors have limited rights to return inventory that they determine is in excess of their requirements, and accordingly, in determining the appropriate level of provision for excess and obsolete inventory, the Company takes into account the inventories held by its distributors. For these reasons, the price is not considered fixed or determinable until the distributor resells the products to the Company's end-user customers and the distributor notifies the Company in writing of the details of such sales transactions. Accordingly, the Company recognizes revenue using the "sell-through" method. Under the "sell-through" method, the Company defers the revenue, adjustments to revenue and the related costs of revenue until the final resale of such products to end customers. The amounts billed to these distributors and adjustments to revenue and the cost of inventory shipped to, but not yet sold by, the distributors are shown net on the Consolidated Balance Sheets as "Deferred revenues, less cost of revenues."
Research, Development and Related
The Company recognizes the costs associated with the internal development of intellectual property rights as expense when incurred. Also included in "Research, Development and Related" are expenses associated with patent, copyright, trademark and trade secrets. The Company recorded the following research and development expenses for the periods presented (in thousands):
| |
Year Ended April 30, | |||||||||
|---|---|---|---|---|---|---|---|---|---|---|
| |
2015 | 2014 | 2013 | |||||||
Research and development expenses |
$ | 131,187 | $ | 114,224 | $ | 109,026 | ||||
| | | | | | | | | | | |
| | | | | | | | | | | |
| | | | | | | | | | | |
Amortization of Acquired Patent Portfolio
The Company recognizes amortization expense associated with the patent portfolio acquired from Eastman Kodak Company ("Kodak") in March 2011 as "Amortization of acquired patent portfolio."
Advertising
All of the Company's advertising costs are expensed as incurred.
Income Taxes
The Company accounts for deferred income taxes using the liability method, under which it recognizes as deferred tax assets and liabilities the expected future tax consequences of timing differences between the book and tax basis of assets and liabilities. The Company establishes valuation allowances to reduce deferred tax assets as necessary when management estimates, based on available objective evidence, that it is more-likely-than-not that the Company will not realize the benefit of its deferred tax assets.
91
OMNIVISION TECHNOLOGIES, INC.
NOTES TO CONSOLIDATED FINANCIAL STATEMENTS—(Continued)
For the Years Ended April 30, 2015, 2014 and 2013
Note 2—Summary of Significant Accounting Policies—(Continued)
The Company recognizes in its consolidated financial statements the impact of a tax position that, based on the technical merits of the position, is more-likely-than-not to be sustained upon examination. The evaluation of a tax position in accordance with this interpretation is a two-step process. In the first step, recognition, the Company determines whether it is more-likely-than-not that a tax position will be sustained upon examination, including resolution of any related appeals or litigation processes, based on the technical merits of the position. The second step addresses measurement of a tax position that meets the more-likely-than-not criterion. The tax position is measured at the largest amount of benefit that has a greater than 50 percent likelihood of being realized upon ultimate settlement. Tax positions that previously failed to meet the more-likely-than-not recognition threshold will be recognized in the first subsequent financial reporting period in which that threshold is met. Previously recognized tax positions that no longer meet the more-likely-than-not recognition threshold will be de-recognized in the first subsequent financial reporting period in which that threshold is no longer met.
Stock-Based Compensation
The Company recognizes in its consolidated financial statements all share-based payments to employees, including grants of employee stock options and of other stock-based compensation under the 2007 Equity Incentive Plan and the 2000 Stock Plan, and employee stock purchases under the 2009 Employee Stock Purchase Plan, based on their respective measurement date fair values.
Stock-based compensation is measured at the measurement date, based on the fair value of the award. For stock options, fair value is measured using the Black-Scholes option pricing model ("Black-Scholes"), and for restricted stock units, fair value is based on the market price of the Company's common stock. The expenses are recognized over the requisite service period of the award. The Company has chosen to recognize stock-based compensation expense using the straight-line attribution method. Black-Scholes requires the use of highly subjective, complex assumptions, including the expected term and the price volatility of the Company's stock. The Company is required to estimate forfeiture rates at the time of grant and revise such estimates, if necessary, in subsequent periods if actual forfeitures differ from initial estimates. Stock-based compensation expense was recorded net of estimated forfeitures such that expense was recorded only for those stock-based awards that are expected to vest.
The Company elected to use the long-form method to establish the beginning balance of, and to determine the subsequent impact on, the additional paid-in capital pool. The Company has also elected to use the "with and without" approach in determining the order in which tax attributes are utilized. As a result, the Company will recognize a tax benefit from stock-based awards in additional paid-in capital only if an incremental tax benefit is realized after all other tax attributes currently available to the Company have been utilized. In addition, the Company has elected to account for the indirect effects of stock-based awards on other tax attributes, such as research and development tax credits, through the Consolidated Statements of Income.
Basic and Diluted Net Income Per Share
Basic net income per share is computed by dividing the income available to holders of common stock for the period by the weighted average number of shares of common stock outstanding during the period. Diluted net income per share, which is calculated using the treasury stock method, reflects the
92
OMNIVISION TECHNOLOGIES, INC.
NOTES TO CONSOLIDATED FINANCIAL STATEMENTS—(Continued)
For the Years Ended April 30, 2015, 2014 and 2013
Note 2—Summary of Significant Accounting Policies—(Continued)
additional dilution from potential issuance of common stock. Potential common stock consists of incremental common shares issuable upon the exercise of stock options, purchases via employee stock purchase plans, and vesting of restricted stock units. The calculation of diluted net income per share excludes potential common stock if the effect of such stock is antidilutive.
Recent Accounting Pronouncements
In April 2014, the Financial Accounting Standards Board ("FASB") revised the authoritative guidance on reporting discontinued operations. The revised guidance specifies that a disposal of a component of an entity or a group of components of an entity is required to be reported in a discontinued operation if the disposal represents a strategic shift that has, or will have a major effect on an entity's operations and financial results. The guidance also changes the requirements for reporting discontinued operations which requires additional disclosures for discontinued operations and new disclosures for individually material disposal transactions that do not meet the definition of a discontinued operation. The guidance is effective for the Company beginning in the first quarter of fiscal 2016. The Company is currently evaluating the impact this guidance may have on its financial position, results of operations and cash flows.
In May 2014, the FASB issued new authoritative guidance for revenue recognition. The new revenue recognition guidance provides a comprehensive framework to address revenue recognition issues for all contracts with customers, and supersedes most previously-issued industry-specific guidance. The core principle of the guidance is that an entity should recognize revenue to depict the transfer of promised goods or services to customers in an amount that reflects the consideration to which the entity expects to be entitled in exchange for those goods or services. To achieve that core principle and apply the new guidance, entities will follow a five-step approach: Step 1) identify the contracts with the customer; Step 2) identify the separate performance obligations in the contract; Step 3) determine the transaction price; Step 4) allocate the transaction price to separate performance obligations; and Step 5) recognize revenue when, or as, each performance obligation is satisfied. The new guidance is required to be applied retrospectively to each prior reporting period presented, or retrospectively with the cumulative effect of initially applying it recognized at the date of initial application. The guidance is effective for the Company beginning in the first quarter of fiscal 2018. In April 2015, the FASB proposed a one-year deferral of the effective date of the guidance, with an option that would permit companies to adopt the standard as early as the original effective date. Thus far, this proposed deferral has not been finalized. The Company has not yet selected the transition method, and is currently evaluating the impact this guidance may have on its financial position, results of operations and cash flows.
In August 2014, the FASB issued new authoritative guidance related to the disclosures around going concern. The new guidance specifies management's responsibility to evaluate whether there is substantial doubt about an entity's ability to continue as a going concern and to provide related footnote disclosures, if applicable. The new guidance is effective for the Company beginning in the first quarter of fiscal 2018. Early adoption is permitted. The Company does not expect the adoption of this guidance to have any material effect on its financial position, results of operations and cash flows.
In January 2015, the FASB revised the authoritative guidance on reporting extraordinary items by eliminating such concept from GAAP. Previously, if an event or transaction meets the criteria for
93
OMNIVISION TECHNOLOGIES, INC.
NOTES TO CONSOLIDATED FINANCIAL STATEMENTS—(Continued)
For the Years Ended April 30, 2015, 2014 and 2013
Note 2—Summary of Significant Accounting Policies—(Continued)
extraordinary classification, an entity is required to segregate the extraordinary item from the results of ordinary operations and show the item separately in the income statement, net of tax. The guidance is effective for the Company beginning in the first quarter of fiscal 2017. The Company does not expect the adoption of this guidance to have any material effect on its financial position, results of operations and cash flows.
In February 2015, the FASB revised the authoritative guidance for consolidation. The revised guidance affects reporting entities that are required to evaluate whether they should consolidate certain legal entities, and all legal entities are subject to reevaluation under the revised consolidation model. Other than modifying the evaluation guidance for limited partnerships and similar legal entities, the revised guidance also affects the consolidation analysis of reporting entities that are involved with variable-interest-entities. The guidance is effective for the Company beginning in the first quarter of fiscal 2017. The Company is currently evaluating the impact this guidance may have on its financial position, results of operations and cash flows.
Note 3—Short-Term Investments
Available-for-sale securities as of the dates presented were as follows (in thousands):
| |
As of April 30, 2015 | ||||||||||||
|---|---|---|---|---|---|---|---|---|---|---|---|---|---|
| |
Amortized Cost |
Gross Unrealized Gains |
Gross Unrealized Losses |
Fair Value |
|||||||||
Municipal bonds |
$ | 20,584 | $ | 2 | $ | (6 | ) | $ | 20,580 | ||||
U.S. government debt securities with maturities less than one year |
25,041 | 2 | (1 | ) | 25,042 | ||||||||
Corporate debt securities/commercial paper |
159,713 | 13 | (77 | ) | 159,649 | ||||||||
| | | | | | | | | | | | | | |
|
$ | 205,338 | $ | 17 | $ | (84 | ) | $ | 205,271 | ||||
| | | | | | | | | | | | | | |
| | | | | | | | | | | | | | |
| | | | | | | | | | | | | | |
Contractual maturity dates, less than one year |
$ | 204,770 | |||||||||||
Contractual maturity dates, one to two years |
501 | ||||||||||||
| | | | | | | | | | | | | | |
|
$ | 205,271 | |||||||||||
| | | | | | | | | | | | | | |
| | | | | | | | | | | | | | |
| | | | | | | | | | | | | | |
| |
As of April 30, 2014 | ||||||||||||
|---|---|---|---|---|---|---|---|---|---|---|---|---|---|
| |
Amortized Cost |
Gross Unrealized Gains |
Gross Unrealized Losses |
Fair Value |
|||||||||
Municipal bonds |
$ | 6,168 | $ | 1 | $ | (2 | ) | $ | 6,167 | ||||
Corporate debt securities/commercial paper |
146,866 | 6 | (46 | ) | 146,826 | ||||||||
| | | | | | | | | | | | | | |
|
$ | 153,034 | $ | 7 | $ | (48 | ) | $ | 152,993 | ||||
| | | | | | | | | | | | | | |
| | | | | | | | | | | | | | |
| | | | | | | | | | | | | | |
Contractual maturity dates, less than one year |
$ | 142,758 | |||||||||||
Contractual maturity dates, one to two years |
10,235 | ||||||||||||
| | | | | | | | | | | | | | |
|
$ | 152,993 | |||||||||||
| | | | | | | | | | | | | | |
| | | | | | | | | | | | | | |
| | | | | | | | | | | | | | |
94
OMNIVISION TECHNOLOGIES, INC.
NOTES TO CONSOLIDATED FINANCIAL STATEMENTS—(Continued)
For the Years Ended April 30, 2015, 2014 and 2013
Note 3—Short-Term Investments—(Continued)
The Company sold available-for-sale investments, primarily marketable debt instruments, for proceeds of approximately $32.0 million, $35.5 million and $275.3 million in fiscal 2015, 2014 and 2013, respectively. The Company employs the specific-identification method in the determination of any applicable gain or loss on the sale of the investment.
95
OMNIVISION TECHNOLOGIES, INC.
NOTES TO CONSOLIDATED FINANCIAL STATEMENTS—(Continued)
For the Years Ended April 30, 2015, 2014 and 2013
Note 4—Supplemental Balance Sheet Account Information (in thousands)
| |
April 30, | ||||||
|---|---|---|---|---|---|---|---|
| |
2015 | 2014 | |||||
Cash and cash equivalents: |
|||||||
Cash |
$ | 242,884 | $ | 195,141 | |||
Money market funds, commercial paper and U.S. government bonds |
76,008 | 102,811 | |||||
| | | | | | | | |
|
$ | 318,892 | $ | 297,952 | |||
| | | | | | | | |
| | | | | | | | |
| | | | | | | | |
Accounts receivable, net: |
|||||||
Accounts receivable |
$ | 153,965 | $ | 176,576 | |||
Less: Allowance for doubtful accounts |
(924 | ) | (998 | ) | |||
Allowance for sales returns |
(1,955 | ) | (3,106 | ) | |||
| | | | | | | | |
|
$ | 151,086 | $ | 172,472 | |||
| | | | | | | | |
| | | | | | | | |
| | | | | | | | |
Inventories: |
|||||||
Work in progress |
$ | 147,586 | $ | 107,621 | |||
Finished goods |
196,380 | 163,314 | |||||
| | | | | | | | |
|
$ | 343,966 | $ | 270,935 | |||
| | | | | | | | |
| | | | | | | | |
| | | | | | | | |
Prepaid expenses and other current assets: |
|||||||
Prepaid expenses |
$ | 4,250 | $ | 4,285 | |||
Deposits and other |
377 | 1,284 | |||||
Interest receivable |
1,001 | 1,007 | |||||
| | | | | | | | |
|
$ | 5,628 | $ | 6,576 | |||
| | | | | | | | |
| | | | | | | | |
| | | | | | | | |
Property, plant and equipment, net: |
|||||||
Land |
$ | 13,000 | $ | 13,000 | |||
Buildings |
82,624 | 82,547 | |||||
Buildings/leasehold improvements |
29,452 | 29,123 | |||||
Machinery and equipment |
121,270 | 119,762 | |||||
Furniture and fixtures |
5,034 | 5,002 | |||||
Software |
8,918 | 8,774 | |||||
Construction in progress |
1,636 | 2,894 | |||||
| | | | | | | | |
|
261,934 | 261,102 | |||||
Less: Accumulated depreciation and amortization |
(116,720 | ) | (107,310 | ) | |||
| | | | | | | | |
|
$ | 145,214 | $ | 153,792 | |||
| | | | | | | | |
| | | | | | | | |
| | | | | | | | |
Other long-term assets: |
|||||||
Deferred tax assets—non-current |
$ | 604 | $ | 528 | |||
Land-use rights |
2,124 | 2,180 | |||||
Other long-term assets |
21,427 | 29,821 | |||||
| | | | | | | | |
|
$ | 24,155 | $ | 32,529 | |||
| | | | | | | | |
| | | | | | | | |
| | | | | | | | |
Accrued expenses and other current liabilities: |
|||||||
Deferred tax liabilities—current |
86 | 144 | |||||
Employee compensation |
15,268 | 15,176 | |||||
Third party commissions |
389 | 380 | |||||
Professional services |
2,961 | 2,270 | |||||
Noncancelable purchase commitments |
1,788 | 647 | |||||
Rebates |
2,802 | 1,511 | |||||
Other |
13,818 | 11,831 | |||||
| | | | | | | | |
|
$ | 37,112 | $ | 31,959 | |||
| | | | | | | | |
| | | | | | | | |
| | | | | | | | |
Other long-term liabilities: |
|||||||
Interest rate swap |
$ | 2,073 | $ | 2,980 | |||
Deferred tax liabilities—non-current |
20,232 | 3,731 | |||||
Other |
1,593 | 5,107 | |||||
| | | | | | | | |
|
$ | 23,898 | $ | 11,818 | |||
| | | | | | | | |
| | | | | | | | |
| | | | | | | | |
96
OMNIVISION TECHNOLOGIES, INC.
NOTES TO CONSOLIDATED FINANCIAL STATEMENTS—(Continued)
For the Years Ended April 30, 2015, 2014 and 2013
Note 5—Long-Term Investments
Long-term investments as of the dates indicated consisted of the following (in thousands):
| |
April 30, | ||||||
|---|---|---|---|---|---|---|---|
| |
2015 | 2014 | |||||
VisEra |
$ | 134,392 | $ | 115,943 | |||
WLCSP |
38,127 | 33,805 | |||||
XinTec |
19,502 | 4,661 | |||||
| | | | | | | | |
Total |
$ | 192,021 | $ | 154,409 | |||
| | | | | | | | |
| | | | | | | | |
| | | | | | | | |
VisEra Technologies Company, Ltd.
In October 2003, the Company and Taiwan Semiconductor Manufacturing Company Limited ("TSMC") entered into an agreement to form VisEra Technologies Company, Ltd. ("VisEra"), a joint venture in Taiwan, for the purposes of providing certain manufacturing and automated final testing services related to complementary metal oxide semiconductor ("CMOS") image sensors. In August 2005, under an amendment to the original 2003 joint-venture agreement, the Company and TSMC formed VisEra Holding Company ("VisEra Cayman"), a company incorporated in the Cayman Islands, and VisEra became a subsidiary of VisEra Cayman. The Company and TSMC have equal interests in VisEra Cayman. As of April 30, 2015, the Company owned 49.1% of VisEra Cayman.
In June 2011, the Company entered into an agreement with VisEra to acquire from VisEra its CameraCubeChip production operations. The acquisition of the production operations was completed in October 2011, and the Company accounted for the transaction as a business combination. Under the terms of the agreement, the closing consideration was $42.9 million in cash. In April 2014, due to the lack of commercial viability for certain milestone deliverables, the Company agreed with VisEra to reduce the final installment of cash consideration from $9.0 million to $4.5 million. Consequently, the Company recorded a $3.1 million post-acquisition gain in "Benefit from acquisition of production operations from VisEra," representing the $4.5 million reduction in the final installment payment, net of a $1.4 million equity method elimination for the corresponding receivable write-off recorded by VisEra. The Company paid the final $4.5 million to VisEra in April 2014.
The Company received the following dividend payments from VisEra during the periods presented (in thousands):
| |
Year Ended April 30, | |||||||||
|---|---|---|---|---|---|---|---|---|---|---|
| |
2015 | 2014 | 2013 | |||||||
Dividend payments received from VisEra |
$ | 17,101 | $ | — | $ | 13,760 | ||||
| | | | | | | | | | | |
| | | | | | | | | | | |
| | | | | | | | | | | |
The Company accounts for its investment in VisEra under the equity method. The following table presents equity income before elimination of unrealized intercompany profits and the equity income recorded by the Company for the periods indicated in "Cost of revenues," consisting of its portion of
97
OMNIVISION TECHNOLOGIES, INC.
NOTES TO CONSOLIDATED FINANCIAL STATEMENTS—(Continued)
For the Years Ended April 30, 2015, 2014 and 2013
Note 5—Long-Term Investments—(Continued)
the net income recorded by VisEra during the periods presented after the elimination of unrealized intercompany profits (in thousands).
| |
Year Ended April 30, | |||||||||
|---|---|---|---|---|---|---|---|---|---|---|
| |
2015 | 2014 | 2013 | |||||||
Equity income |
$ | 6,951 | $ | 10,710 | $ | 20,274 | ||||
| | | | | | | | | | | |
| | | | | | | | | | | |
| | | | | | | | | | | |
Net effect on Cost of revenues, after the elimination of unrealized intercompany profits |
$ | 7,788 | $ | 17,228 | $ | 15,752 | ||||
| | | | | | | | | | | |
| | | | | | | | | | | |
| | | | | | | | | | | |
China WLCSP Limited
China WLCSP Limited ("WLCSP") is in the business of designing, manufacturing, packaging and selling certain wafer level chip scale packaging related services. In May 2007, the Company acquired 4,500,000 units of WLCSP's equity interests, or 20.0% of WLCSP's registered capital on a fully-diluted basis, for an aggregate purchase amount of $9.0 million. In April 2010, WLCSP raised additional capital and reduced the Company's ownership percentage to 19.7%. In May 2010, WLCSP converted all of its owners' equity into share capital. The pro rata interests of all shareholders remained the same after the conversion and no income was distributed. After the conversion, WLCSP had 180.0 million shares outstanding, and the Company owned 35.4 million shares. In September 2010, WLCSP issued an additional 9.5 million shares to other parties and reduced the Company's ownership percentage to 18.7%.
The Company has a seat on the WLCSP Board of Directors. With the determination that the Company has maintained significant influence over the operations of WLCSP, the Company accounts for its investment in WLCSP under the equity method.
In December 2013, WLCSP filed with the China Securities Regulatory Commission ("CSRC") a registration statement for an initial public offering ("IPO"). The registration statement was approved by the CSRC in January 2014, and the IPO price was approximately $3.14 per share. As part of the IPO, WLCSP issued 37.2 million new shares and increased the total shares outstanding to 226.7 million shares. The Company also participated in the IPO as selling shareholder and sold 5.1 million shares, reducing the total number of shares owned by the Company to 30.3 million shares.
The issuance price of $3.14 for the 37.2 million new shares was higher than the Company's average per share carrying value for WLCSP. Consequently, the Company recognized a non-cash change-in-interest gain of approximately $14.1 million. In addition, with the sale of 5.1 million shares during the IPO, the Company received net cash proceeds of approximately $15.1 million, and recognized approximately $9.7 million as gain on the sale. The change-in-interest gain and the realized gain from the share sale, totaling approximately $23.8 million, were recorded in "Other income, net" for the three months ended January 31, 2014.
The foreign exchange effects on WLCSP's net assets are recorded as part of the Company's cumulative translation adjustment in "Accumulated other comprehensive income." The total gain of $23.8 million from WLCSP's IPO included a pro rata release of approximately $1.0 million of the cumulative translation adjustment from "Accumulated other comprehensive income."
98
OMNIVISION TECHNOLOGIES, INC.
NOTES TO CONSOLIDATED FINANCIAL STATEMENTS—(Continued)
For the Years Ended April 30, 2015, 2014 and 2013
Note 5—Long-Term Investments—(Continued)
As of April 30, 2015, the 30.3 million WLCSP shares owned by the Company represented an ownership percentage of 13.3%. The Company received the following dividend payments from WLCSP during the periods presented (in thousands):
| |
Year Ended April 30, | |||||||||
|---|---|---|---|---|---|---|---|---|---|---|
| |
2015 | 2014 | 2013 | |||||||
Dividend payments received from WLCSP |
$ | 726 | $ | 830 | $ | 890 | ||||
| | | | | | | | | | | |
| | | | | | | | | | | |
| | | | | | | | | | | |
The Company accounts for its investment in WLCSP under the equity method. The following table presents equity income recorded by the Company for the periods indicated in "Equity in earnings of investee," consisting of its portion of the net income recorded by WLCSP during the periods presented, and equity method investment adjustments (in thousands). In the fourth quarter of fiscal 2014, to comply with China's securities laws after WLCSP's IPO, the Company introduced a one-month lag in its equity method of accounting for WLCSP. As such, for fiscal 2015, the Company included its share of WLCSP's earnings from April 1, 2014 to March 31, 2015.
| |
Year Ended April 30, | |||||||||
|---|---|---|---|---|---|---|---|---|---|---|
| |
2015 | 2014 | 2013 | |||||||
Equity income |
$ | 4,270 | $ | 4,009 | $ | 3,832 | ||||
| | | | | | | | | | | |
| | | | | | | | | | | |
| | | | | | | | | | | |
XinTec, Inc.
XinTec, Inc. ("XinTec") is a Taiwan-based supplier of chip scale packaging services. The Company first made investments in XinTec in April 2003, for $2.8 million. Through January 31, 2015, the Company directly owned 9.8 million shares in XinTec, representing an ownership percentage of 4.1%. Separately, VisEra Cayman owned 37.2 million shares in XinTec, representing another 15.6% ownership. Consequently, the Company's beneficial ownership percentage in XinTec was approximately 11.8%. The Company accounted for XinTec as a cost method investment then.
In March 2015, XinTec successfully completed its IPO and became a listed company on the Taiwan Stock Exchange. As part of the IPO, XinTec issued 30.0 million new shares and increased the total shares outstanding to 268.2 million shares. The Company also participated in the IPO as selling shareholder and sold 224,357 shares at approximately $1.35 per share, realizing a gain of approximately $195,000. As of April 30, 2015, the remaining 9.6 million XinTec shares owned by the Company represented an ownership percentage of 3.6%. The lock-up period for 4.8 million shares will expire in September 2015, and the lock-up period for the remainder will expire in March 2016. VisEra Cayman also participated in the IPO as selling shareholder and sold 0.9 million shares. VisEra Cayman's remaining 36.4 million shares in XinTec represented a 13.6% ownership. Consequently, as of April 30, 2015, the Company's beneficial ownership percentage in XinTec totaled approximately 10.2%.
As XinTec's share price became readily determinable, the Company started to record its investment in XinTec on a mark-to-market basis, net of deferred taxes. In the fourth quarter of fiscal 2015, the Company recorded an unrealized gain of approximately $9.1 million in "Accumulated other comprehensive income," representing the difference between the fair value of the XinTec shares owned by the Company as of April 30, 2015 and the original carrying value of those shares under the cost
99
OMNIVISION TECHNOLOGIES, INC.
NOTES TO CONSOLIDATED FINANCIAL STATEMENTS—(Continued)
For the Years Ended April 30, 2015, 2014 and 2013
Note 5—Long-Term Investments—(Continued)
method, net of deferred taxes. Concurrently, VisEra Cayman also started to report its ownership in XinTec on a mark-to-market basis, and the Company recorded $28.6 million in "Accumulated other comprehensive income," representing its share of VisEra Cayman's unrealized gain on XinTec.
Tong Hsing Electronic Industries, Limited
Tong Hsing Electronic Industries, Limited ("Tong Hsing") is a Taiwan-based public company principally engaged in the development and production of microelectronic packaging technologies. In December 2009, the Company obtained 0.8% of the outstanding shares of common stock of Tong Hsing, or 996,250 shares, when Tong Hsing acquired ImPac Technology Co., Ltd. ("ImPac") in a stock-for-stock exchange. Prior to the exchange, the Company owned 25.7% of ImPac. In June 2010 and June 2011 the Company participated in Tong Hsing's secondary offering and purchased 95,570 and 115,481 shares, respectively, for corresponding amounts of approximately $282,000 and $421,000. In October 2013, the Company sold its entire investment in Tong Hsing, which amounted to an ownership percentage in Tong Hsing of approximately 0.7%. With the sale, the Company recorded a gain of approximately $2.0 million in "Other income, net" for the three months ended October 31, 2013.
Prior to stock sale in October 2013, the Company reported its investment in Tong Hsing on a mark-to-market basis, net of deferred taxes, since the shares of Tong Hsing are traded on the Taiwan Stock Exchange and the share price is readily determinable. For the periods indicated, the Company recorded the following unrealized holding gains in "Accumulated other comprehensive income" (in thousands):
| |
Year Ended April 30, | |||||||||
|---|---|---|---|---|---|---|---|---|---|---|
| |
2015 | 2014 | 2013 | |||||||
Unrealized holding gains |
$ | — | $ | 566 | $ | 859 | ||||
| | | | | | | | | | | |
| | | | | | | | | | | |
| | | | | | | | | | | |
Phostek, Inc.
Phostek, Inc. ("Phostek") is a privately held company that develops and manufactures light emitting diodes in Taiwan. The Company made an investment in Phostek in February 2012, for a total of $2.0 million in cash, and accounted for this investment using the cost method. In July 2013, based on a combination of factors, including Phostek's accumulated losses and its decision to not pursue any additional fundings to support its original business plans, the Company concluded that the investment in Phostek should be impaired in its entirety. Consequently, the Company recorded an impairment charge of $2.0 million in "Other income, net" during the three months ended July 31, 2013.
The following table presents the summary financial information of VisEra and WLCSP, as derived from their respective financial statements for the periods indicated. As mentioned above, the Company introduced a one-month lag in its equity method of accounting for WLCSP in the fourth quarter of fiscal 2014. The summary financial information of WLCSP reflects this change and the resulting
100
OMNIVISION TECHNOLOGIES, INC.
NOTES TO CONSOLIDATED FINANCIAL STATEMENTS—(Continued)
For the Years Ended April 30, 2015, 2014 and 2013
Note 5—Long-Term Investments—(Continued)
information as used by the Company for its equity method of accounting for WLCSP in fiscal 2015 and 2014. Each investee's financial information was prepared under GAAP (in thousands):
VisEra Holding Company
| |
Year Ended April 30, | |||||||||
|---|---|---|---|---|---|---|---|---|---|---|
| |
2015 | 2014 | 2013 | |||||||
Operating data: |
||||||||||
Revenues |
$ | 109,403 | $ | 131,850 | $ | 169,969 | ||||
Gross profit |
28,060 | 50,426 | 58,531 | |||||||
Income from operations |
19,146 | 40,312 | 47,512 | |||||||
Net income |
$ | 16,622 | $ | 32,121 | $ | 31,921 | ||||
| |
April 30, | ||||||
|---|---|---|---|---|---|---|---|
| |
2015 | 2014 | |||||
Balance sheet data: |
|||||||
Current assets |
$ | 169,759 | $ | 189,399 | |||
Long-term assets |
161,328 | 112,956 | |||||
Current liabilities |
27,616 | 38,086 | |||||
Long-term liabilities |
$ | — | $ | — | |||
China WLCSP Limited
| |
12 Months Ended March 31, 2015 |
11 Months Ended March 31, 2014 |
12 Months Ended April 30, 2013 |
|||||||
|---|---|---|---|---|---|---|---|---|---|---|
Operating data: |
||||||||||
Revenues |
$ | 105,887 | $ | 75,480 | $ | 57,340 | ||||
Gross profit |
55,114 | 40,909 | 31,348 | |||||||
Income from operations |
27,799 | 26,428 | 23,742 | |||||||
Net income |
$ | 31,986 | $ | 23,055 | $ | 20,520 | ||||
| |
March 31, 2015 |
March 31, 2014 |
|||||
|---|---|---|---|---|---|---|---|
Balance sheet data: |
|||||||
Current assets |
$ | 121,325 | $ | 221,547 | |||
Long-term assets |
222,534 | 134,482 | |||||
Current liabilities |
38,357 | 96,570 | |||||
Long-term liabilities |
$ | 19,121 | $ | 3 | |||
101
OMNIVISION TECHNOLOGIES, INC.
NOTES TO CONSOLIDATED FINANCIAL STATEMENTS—(Continued)
For the Years Ended April 30, 2015, 2014 and 2013
Note 5—Long-Term Investments—(Continued)
The Company's share of undistributed earnings of investees accounted for by the equity method as of the dates indicated were as follows (in thousands):
| |
April 30, | ||||||
|---|---|---|---|---|---|---|---|
| |
2015 | 2014 | |||||
Undistributed earnings of investees |
$ | 61,408 | $ | 66,772 | |||
| | | | | | | | |
| | | | | | | | |
| | | | | | | | |
Note 6—Goodwill and Intangible Assets
Goodwill
There was no change to the carrying value of the Company's goodwill during fiscal 2015 and 2014 as noted below (in thousands):
| |
Year Ended April 30, | ||||||
|---|---|---|---|---|---|---|---|
| |
2015 | 2014 | |||||
Beginning balance, May 1 |
$ | 10,227 | $ | 10,227 | |||
Changes to carrying value |
— | — | |||||
| | | | | | | | |
Ending balance, April 30 |
$ | 10,227 | $ | 10,227 | |||
| | | | | | | | |
| | | | | | | | |
| | | | | | | | |
Intangible Assets
In January 2014, the Company entered into a license agreement with the California Institute of Technology ("Caltech") pursuant to which the Company acquired a license to various image sensor patents held by Caltech in a cash transaction that totaled approximately $25.4 million, and the payment schedule of which has a net present value of approximately $24.6 million. As part of the license agreement, the parties agreed to settle and dismiss the outstanding claims between them. As a result, during the three months ended January 31, 2014, the Company recorded $2.7 million to "Cost of revenues," representing the cumulative cost related to prior years under the relief-from-royalty method. In addition, the Company recorded the remaining $21.9 million as addition to "Patents and licenses," which the Company will amortize over a period of nine years, and the amortization expenses will be recorded in "Cost of revenues."
Intangible assets as of the dates indicated consisted of the following (in thousands):
| |
April 30, 2015 | |||||||||
|---|---|---|---|---|---|---|---|---|---|---|
| |
Cost | Accumulated Amortization |
Net Book Value |
|||||||
Acquired patent portfolio |
$ | 65,000 | $ | 37,917 | $ | 27,083 | ||||
Core technology |
36,100 | 29,923 | 6,177 | |||||||
Patents and licenses |
36,066 | 17,105 | 18,961 | |||||||
Trademarks and tradenames |
1,400 | 1,400 | — | |||||||
Customer relationships |
340 | 274 | 66 | |||||||
| | | | | | | | | | | |
Intangible assets, net |
$ | 138,906 | $ | 86,619 | $ | 52,287 | ||||
| | | | | | | | | | | |
| | | | | | | | | | | |
| | | | | | | | | | | |
102
OMNIVISION TECHNOLOGIES, INC.
NOTES TO CONSOLIDATED FINANCIAL STATEMENTS—(Continued)
For the Years Ended April 30, 2015, 2014 and 2013
Note 6—Goodwill and Intangible Assets—(Continued)
| |
April 30, 2014 | |||||||||
|---|---|---|---|---|---|---|---|---|---|---|
| |
Cost | Accumulated Amortization |
Net Book Value |
|||||||
Acquired patent portfolio |
$ | 65,000 | $ | 28,631 | $ | 36,369 | ||||
Core technology |
36,100 | 27,980 | 8,120 | |||||||
Patents and licenses |
36,066 | 14,438 | 21,628 | |||||||
Trademarks and tradenames |
1,400 | 1,400 | — | |||||||
Customer relationships |
340 | 240 | 100 | |||||||
| | | | | | | | | | | |
Intangible assets, net |
$ | 138,906 | $ | 72,689 | $ | 66,217 | ||||
| | | | | | | | | | | |
| | | | | | | | | | | |
| | | | | | | | | | | |
The following table presents the amortization of intangibles recorded by the Company for the periods indicated (in thousands):
| |
Year Ended April 30, | |||||||||
|---|---|---|---|---|---|---|---|---|---|---|
| |
2015 | 2014 | 2013 | |||||||
Amortization of intangible assets |
$ | 4,644 | $ | 3,207 | $ | 3,638 | ||||
| | | | | | | | | | | |
| | | | | | | | | | | |
| | | | | | | | | | | |
Amortization of acquired patent portfolio |
$ | 9,286 | $ | 9,286 | $ | 9,286 | ||||
| | | | | | | | | | | |
| | | | | | | | | | | |
| | | | | | | | | | | |
The total expected future annual amortization of these intangible assets is as follows (in thousands):
Years Ending April 30,
|
|
|||
|---|---|---|---|---|
2016 |
$ | 13,753 | ||
2017 |
13,627 | |||
2018 |
12,546 | |||
2019 |
3,234 | |||
2020 |
2,434 | |||
Thereafter |
6,693 | |||
| | | | | |
Total |
$ | 52,287 | ||
| | | | | |
| | | | | |
| | | | | |
Note 7—Borrowing Arrangements and Related Derivative Instruments
The following table sets forth the Company's debt as of the dates indicated (in thousands):
| |
April 30, | ||||||
|---|---|---|---|---|---|---|---|
| |
2015 | 2014 | |||||
Mortgage loan |
$ | 23,099 | $ | 23,653 | |||
Construction loan |
8,996 | 12,179 | |||||
| | | | | | | | |
|
32,095 | 35,832 | |||||
Less: amount due within one year |
(7,096 | ) | (3,802 | ) | |||
| | | | | | | | |
Non-current portion of long-term debt |
$ | 24,999 | $ | 32,030 | |||
| | | | | | | | |
| | | | | | | | |
| | | | | | | | |
103
OMNIVISION TECHNOLOGIES, INC.
NOTES TO CONSOLIDATED FINANCIAL STATEMENTS—(Continued)
For the Years Ended April 30, 2015, 2014 and 2013
Note 7—Borrowing Arrangements and Related Derivative Instruments—(Continued)
As of April 30, 2015, aggregate debt maturities were as follows (in thousands):
Years Ending April 30,
|
Mortgage Loan |
Construction Loan |
Total | |||||||
|---|---|---|---|---|---|---|---|---|---|---|
2016 |
$ | 554 | $ | 6,542 | $ | 7,096 | ||||
2017 |
22,545 | 2,454 | 24,999 | |||||||
| | | | | | | | | | | |
Total |
$ | 23,099 | $ | 8,996 | $ | 32,095 | ||||
| | | | | | | | | | | |
| | | | | | | | | | | |
| | | | | | | | | | | |
Mortgage Loan and Term Loan
On March 16, 2007, the Company entered into a Loan and Security Agreement with a domestic bank for the purchase of a complex of four buildings located in Santa Clara, California (the "Santa Clara Property"). The Loan and Security Agreement provides for a mortgage loan in the principal amount of $27.9 million (the "Mortgage Loan") and a secured line of credit with an aggregate maximum principal amount of up to $12.0 million (the "Term Loan").The Company drew down the entire $12.0 million under the Term Loan by July 2008, and paid it off by July 31, 2012.
The Mortgage Loan matures on March 31, 2017, and borrowings under the Mortgage Loan accrue interest at the London Interbank Borrowing Rate ("LIBOR") plus 90 basis points. The Company was in compliance with the financial covenants of the Loan and Security Agreement as of April 30, 2015.
Interest rates under the Mortgage Loan for the dates indicated are set forth below:
| |
April 30, | ||||||
|---|---|---|---|---|---|---|---|
| |
2015 | 2014 | |||||
Mortgage Loan |
1.1 | % | 1.1 | % | |||
In conjunction with the Mortgage Loan, the Company entered into an interest rate swap with the same bank to effectively convert the variable interest rate described above to a fixed rate. The swap is for a period of ten years, and the notional amount of the swap approximates the principal outstanding under the Mortgage Loan. The Company is the fixed rate payer under the swap and the rate is fixed at 5.3% per annum and the effective rate on the Mortgage Loan is fixed at approximately 6.2%. The Company had a second interest rate swap associated with the Term Loan that fixed the Term Loan's interest rate at 4.3% per annum and fixed the effective rate at approximately 5.5%. The second swap expired in July 2012 when the Term Loan matured and was paid off.
Construction Loan
On August 3, 2009, OmniVision Technologies (Shanghai) Co., Ltd., a wholly-owned subsidiary of the Company, entered into a Fixed Assets Loan Agreement with a bank in China (the "Construction Loan"). The purpose of the Construction Loan was to construct a research center for the Company in Pudong Development Zone, the Zhang Jiang Science Park in Shanghai, China. During the second quarter of fiscal 2011, the Company completed the construction of the research center. As of April 30, 2015, the total amount outstanding under the Construction Loan was Chinese Yuan 55.0 million, or approximately $9.0 million. The Construction Loan matures on June 30, 2016.
104
OMNIVISION TECHNOLOGIES, INC.
NOTES TO CONSOLIDATED FINANCIAL STATEMENTS—(Continued)
For the Years Ended April 30, 2015, 2014 and 2013
Note 7—Borrowing Arrangements and Related Derivative Instruments—(Continued)
The interest rate under the Construction Loan is based on an indicative rate as published by the Chinese government, and will be adjusted only at the anniversary of each drawdown. The interest rate under the Construction Loan was 5.6% and 5.9% at April 30, 2015 and 2014, respectively. The Company was in compliance with the financial covenants of the Fixed Assets Loan Agreement as of April 30, 2015.
Derivative Instruments and Hedging Activities
As indicated above, the Company entered into two separate interest rate swaps in connection with the Mortgage Loan and the Term Loan. The interest rate swap related to the Mortgage Loan is scheduled to expire in March 2017, while the interest rate swap related to the Term Loan expired on July 31, 2012. The swaps were set up to reduce the effect of interest rate variability on the two loans' interest payments. During the setup, the Company did not designate the two interest rate swaps as hedging instruments. Consequently, the Company had to remeasure the two interest rate swaps at fair value at each subsequent balance sheet date, and immediately recognize any changes to the fair values in earnings. On the Consolidated Balance Sheet, the Company records the swaps as either assets or liabilities, depending on whether the fair value represents net gains or net losses. (See Note 11.)
The table below presents the location of the swaps on the Consolidated Statements of Income and Consolidated Balance Sheets, and the related effects on the Company's results of operations and financial positions for the periods indicated (in thousands):
| |
Year Ended April 30, | |||||||||
|---|---|---|---|---|---|---|---|---|---|---|
| |
2015 | 2014 | 2013 | |||||||
Location of amounts recognized in Consolidated Statements of Income and amount of gains: |
||||||||||
Other income, net |
$ | 907 | $ | 1,204 | $ | 625 | ||||
| | | | | | | | | | | |
| | | | | | | | | | | |
| | | | | | | | | | | |
| |
April 30, | ||||||
|---|---|---|---|---|---|---|---|
| |
2015 | 2014 | |||||
Location of amounts on Consolidated Balance Sheets and fair values: |
|||||||
Other long-term liabilities |
$ | 2,073 | $ | 2,980 | |||
| | | | | | | | |
| | | | | | | | |
| | | | | | | | |
105
OMNIVISION TECHNOLOGIES, INC.
NOTES TO CONSOLIDATED FINANCIAL STATEMENTS—(Continued)
For the Years Ended April 30, 2015, 2014 and 2013
Note 8—Income Taxes
The provision for (benefit from) income taxes consists of the following (in thousands):
| |
Year Ended April 30, | |||||||||
|---|---|---|---|---|---|---|---|---|---|---|
| |
2015 | 2014 | 2013 | |||||||
Current: |
||||||||||
Federal |
$ | 5,891 | $ | 5,802 | $ | 7,746 | ||||
State |
14 | 17 | 16 | |||||||
Foreign |
(10,824 | ) | (4,315 | ) | 3,863 | |||||
| | | | | | | | | | | |
Total current |
(4,919 | ) | 1,504 | 11,625 | ||||||
| | | | | | | | | | | |
Deferred: |
||||||||||
Federal |
(3,910 | ) | 6,066 | (2,261 | ) | |||||
State |
22 | 1,832 | (837 | ) | ||||||
Foreign |
(2,686 | ) | 530 | (1,265 | ) | |||||
| | | | | | | | | | | |
Total deferred |
(6,574 | ) | 8,428 | (4,363 | ) | |||||
| | | | | | | | | | | |
Total provision (benefit) |
$ | (11,493 | ) | $ | 9,932 | $ | 7,262 | |||
| | | | | | | | | | | |
| | | | | | | | | | | |
| | | | | | | | | | | |
Income (loss) before income taxes consisted of (in thousands):
| |
Year Ended April 30, | |||||||||
|---|---|---|---|---|---|---|---|---|---|---|
| |
2015 | 2014 | 2013 | |||||||
United States |
$ | (16,332 | ) | $ | (16,581 | ) | $ | (20,996 | ) | |
International |
98,229 | 121,510 | 71,160 | |||||||
| | | | | | | | | | | |
Total |
$ | 81,897 | $ | 104,929 | $ | 50,164 | ||||
| | | | | | | | | | | |
| | | | | | | | | | | |
| | | | | | | | | | | |
The provision for (benefit from) income taxes differs from the amount computed by applying the U.S. federal income tax rate of 35.0% to "Income before income taxes" as a result of the following (in thousands):
| |
Year Ended April 30, | |||||||||
|---|---|---|---|---|---|---|---|---|---|---|
| |
2015 | 2014 | 2013 | |||||||
Provision based on statutory federal income tax rate |
$ | 28,663 | $ | 36,725 | $ | 17,557 | ||||
State income tax expense (benefit), net of federal tax benefit |
36 | 1,849 | (868 | ) | ||||||
Foreign rate differential |
(45,613 | ) | (32,481 | ) | (14,843 | ) | ||||
Non-deductible stock-based compensation |
6,458 | 6,678 | 7,412 | |||||||
Tax credits |
(3,683 | ) | (3,691 | ) | (3,409 | ) | ||||
Prior year adjustment |
— | — | 1,184 | |||||||
Non-deductible executive compensation |
1,278 | 554 | 175 | |||||||
Non-deductible transaction costs |
1,143 | — | — | |||||||
Other |
225 | 298 | 54 | |||||||
| | | | | | | | | | | |
Tax provision (benefit) |
$ | (11,493 | ) | $ | 9,932 | $ | 7,262 | |||
| | | | | | | | | | | |
| | | | | | | | | | | |
| | | | | | | | | | | |
The effective tax rates for fiscal 2015, 2014 and 2013 are less than the combined U.S. federal and state statutory rate of approximately 40%, principally because the Company earns a significant portion of its profits in jurisdictions where tax rates are lower than the combined U.S. federal and state
106
OMNIVISION TECHNOLOGIES, INC.
NOTES TO CONSOLIDATED FINANCIAL STATEMENTS—(Continued)
For the Years Ended April 30, 2015, 2014 and 2013
Note 8—Income Taxes—(Continued)
statutory rate. In fiscal 2015, the Company included in the amount of foreign rate differential a $21.6 million reduction of unrecognized tax benefits, including the related interest and penalties, due to the conclusion of a tax examination in a foreign jurisdiction and lapses of applicable statute of limitations.
On May 1, 2014, the Company adopted the accounting guidance issued by the FASB regarding the presentation of certain unrecognized tax benefits in the financial statements. Under the guidance, a liability related to an unrecognized tax benefit would be offset against a deferred tax asset for a net operating loss ("NOL") carryforward, a similar tax loss or a tax credit carryforward if such settlement is required or expected in the event the uncertain tax position is disallowed. The guidance should be applied prospectively to all unrecognized tax benefits, and retrospective application is optional. The Company adopted this guidance prospectively. As a result of, the adoption, the Company decreased "Long-term income taxes payable" by approximately $13.3 million, and correspondingly increased "Deferred tax liabilities—non-current" by the same amount.
The Tax Increase Prevention Act, which was signed into law on December 19, 2014, retroactively extended the U.S. Federal research and development tax credit ("Federal R&D Credit") from January 1, 2014 to December 31, 2014. The American Taxpayer Relief Act, which was signed into law on January 2, 2013, retroactively extended the Federal R&D Credit from January 1, 2012 to December 31, 2013. Both enacted tax law changes resulted in respective incremental tax benefits in fiscal 2015 and 2013, from the retroactively extended Federal R&D Credit.
The components of net deferred tax assets (liabilities) included in the Consolidated Balance Sheets for the fiscal years indicated were (in thousands):
| |
April 30, | ||||||
|---|---|---|---|---|---|---|---|
| |
2015 | 2014 | |||||
Deferred tax assets: |
|||||||
Tax credits |
$ | 14,863 | $ | 28,589 | |||
Net operating losses |
1,476 | 3,099 | |||||
Stock-based compensation expenses |
8,046 | 7,406 | |||||
Unrealized loss on interest rate swap |
726 | 1,044 | |||||
Fixed assets |
794 | 533 | |||||
Accruals, reserves and other |
6,132 | 6,174 | |||||
| | | | | | | | |
Gross deferred tax assets |
32,037 | 46,845 | |||||
Valuation allowance |
(14,928 | ) | (17,326 | ) | |||
| | | | | | | | |
Deferred tax assets |
17,109 | 29,519 | |||||
| | | | | | | | |
Deferred tax liabilities: |
|||||||
Undistributed earnings of non-US equity investees not permanently reinvested |
(24,111 | ) | (25,771 | ) | |||
Unrealized gain on available-for-sale securities |
(5,852 | ) | — | ||||
Other |
(1,916 | ) | (2,122 | ) | |||
| | | | | | | | |
Deferred tax liabilities |
(31,879 | ) | (27,893 | ) | |||
| | | | | | | | |
Net deferred tax assets (liabilities) |
$ | (14,770 | ) | $ | 1,626 | ||
| | | | | | | | |
| | | | | | | | |
| | | | | | | | |
107
OMNIVISION TECHNOLOGIES, INC.
NOTES TO CONSOLIDATED FINANCIAL STATEMENTS—(Continued)
For the Years Ended April 30, 2015, 2014 and 2013
Note 8—Income Taxes—(Continued)
The deferred tax assets related to tax credits and NOL as of April 30, 2015 are presented net of unrecognized tax benefits, pursuant to the May 2014 adoption of the accounting guidance mentioned above.
The Company has elected to derecognize both the gross deferred tax assets and the offsetting valuation allowance pertaining to NOL and tax credit carryforwards that represent excess tax benefits from stock-based awards. Recognition of a deferred tax asset for excess tax benefits due to stock-based compensation deductions that have not yet been realized through a reduction in income taxes payable is prohibited. Such unrecognized deferred tax benefits totaled $17.9 million and $18.7 million as of April 30, 2015 and 2014, respectively, and, if and when realized through a reduction in income taxes payable, will be accounted for as a credit to additional paid-in capital.
Management regularly assesses the realizability of deferred tax assets recorded based upon the weight of available evidence, including such factors as recent earnings history and expected future taxable income on a jurisdiction by jurisdiction basis. Deferred tax assets in the amount of $14.9 million and $17.3 million at April 30, 2015 and 2014, respectively, primarily pertain to California R&D tax credit carryovers that the Company believes it is not more-likely-than-not that the Company will realize; therefore, a valuation allowance has been established against such deferred tax assets. In the future, if the credit is utilized and the valuation allowance is released, the release of valuation allowance will be accounted for as a reduction of the income tax expense in the year such event occurs.
As of April 30, 2015, the Company has U.S. federal and California NOL carryforwards for income tax return purposes of $3.1 million and $31.4 million, respectively. If not utilized, the U.S. federal NOL will begin to expire in fiscal 2029 and the California NOL will begin to expire in fiscal 2032. The Company has U.S. federal and California R&D tax credits for income tax return purposes of $33.6 million and $40.5 million, respectively. If not utilized, the U.S. federal R&D tax credits will begin to expire in fiscal 2026 and the California R&D tax credits will be carried over indefinitely.
The Company has not provided U.S. federal and state income taxes, as well as foreign withholding taxes, on approximately $565.2 million of undistributed earnings for certain non-U.S. subsidiaries, because such earnings are intended to be indefinitely reinvested. Determination of the amount of unrecognized deferred tax liability for temporary differences related to investment in these non-U.S. subsidiaries that are essentially permanent in duration is not practicable.
The Company is subject to income taxes in the U.S. and numerous foreign jurisdictions. Significant judgment is required in evaluating the tax positions and determining the provision for (benefit from) income taxes. During the ordinary course of business, there are many transactions and calculations for which the ultimate tax determination is uncertain. The Company establishes reserves for tax-related uncertainties based on estimates of whether, and the extent to which, additional taxes will be due. These reserves are established when the Company believes that certain positions might be challenged despite the Company's belief that the tax return positions are fully supportable. The Company adjusts these reserves in light of changing facts and circumstances, such as lapses of the relevant statute of limitations. The provision for (benefit from) income taxes includes the impact of reserve provisions and changes to reserves that are considered appropriate.
108
OMNIVISION TECHNOLOGIES, INC.
NOTES TO CONSOLIDATED FINANCIAL STATEMENTS—(Continued)
For the Years Ended April 30, 2015, 2014 and 2013
Note 8—Income Taxes—(Continued)
A reconciliation of the beginning balance and the ending balance of gross unrecognized tax benefits, excluding interest and penalties, is as follows (in thousands):
| |
April 30, | |||||||||
|---|---|---|---|---|---|---|---|---|---|---|
| |
2015 | 2014 | 2013 | |||||||
Balance at beginning of fiscal year |
$ | 84,231 | $ | 90,561 | $ | 87,433 | ||||
Increases in balances related to tax positions taken during current year |
5,493 | 4,345 | 6,288 | |||||||
Decreases as a result of lapses of the applicable statute of limitations |
(15,288 | ) | (8,507 | ) | (3,123 | ) | ||||
Decrease in balance relating to settlement with taxing authorities |
(4,631 | ) | — | — | ||||||
Increases in balances related to tax positions taken during prior years |
6,675 | 1,363 | 422 | |||||||
Decreases in balances related to tax positions taken during prior years |
— | (3,531 | ) | (459 | ) | |||||
| | | | | | | | | | | |
Balance at end of fiscal year |
$ | 76,480 | $ | 84,231 | $ | 90,561 | ||||
| | | | | | | | | | | |
| | | | | | | | | | | |
| | | | | | | | | | | |
A reconciliation of the gross unrecognized tax benefits, including interest and penalties, as presented on the Consolidated Balance Sheets is as follows (in thousands):
| |
April 30, | ||||||
|---|---|---|---|---|---|---|---|
| |
2015 | 2014 | |||||
Recorded as an increase in deferred tax liabilities—non-current |
$ | 35,260 | $ | 14,424 | |||
Recorded as a decrease in deferred tax assets—non-current |
2,226 | — | |||||
Long-term income taxes payable |
55,150 | 86,498 | |||||
| | | | | | | | |
Balance at end of fiscal year |
$ | 92,636 | $ | 100,922 | |||
| | | | | | | | |
| | | | | | | | |
| | | | | | | | |
The Company includes interest, penalties and foreign exchange gain or loss related to unrecognized tax benefits within the provision for (benefit from) income taxes in the Consolidated Statements of Income. The Company recognized the following net amounts of interest and penalties and the related foreign exchange gain or loss for the periods presented (in thousands):
| |
Year Ended April 30, | |||||||||
|---|---|---|---|---|---|---|---|---|---|---|
| |
2015 | 2014 | 2013 | |||||||
Recognized interest and penalties, net |
$ | (535 | ) | $ | 502 | $ | 1,449 | |||
| | | | | | | | | | | |
| | | | | | | | | | | |
| | | | | | | | | | | |
Included in the fiscal 2015 and 2014 net amounts of interest and penalties are benefits of $1.9 million and $394,000, respectively, primarily due to the reversal of accrued interest and penalties related to the reductions to unrecognized tax benefits as a result of the conclusion of a tax examination in a foreign jurisdiction and lapses of the statute of limitations.
109
OMNIVISION TECHNOLOGIES, INC.
NOTES TO CONSOLIDATED FINANCIAL STATEMENTS—(Continued)
For the Years Ended April 30, 2015, 2014 and 2013
Note 8—Income Taxes—(Continued)
The Company had cumulatively accrued the following amounts for potential interest and penalties as of the dates indicated (in thousands):
| |
April 30, | ||||||
|---|---|---|---|---|---|---|---|
| |
2015 | 2014 | |||||
Balance at end of fiscal year |
$ | 16,156 | $ | 16,691 | |||
| | | | | | | | |
| | | | | | | | |
| | | | | | | | |
The total amount of unrecognized tax benefits, net of federal benefit for the deduction of such items as interest that, if recognized, would affect the effective tax rate is $84.8 million as of April 30, 2015. One or more of these unrecognized tax benefits could be subject to a valuation allowance if and when recognized in a future period, which could impact the timing of any related effective tax rate benefit.
The Company files U.S. federal and state, as well as foreign, tax returns. For such returns, the Company is generally no longer subject to tax examinations for years prior to fiscal 2004. The Company was under tax examination in a foreign jurisdiction, starting from the fiscal year ended April 30, 2004. This tax examination was concluded in November 2014, with the Company reaching a settlement agreement with the foreign jurisdiction taxing authority that covered from fiscal year ended April 30, 2004 to fiscal year ended April 30, 2013. As of April 30, 2015, the Company anticipates that the balance of gross unrecognized tax benefits will decrease by $5.3 million due to lapses of the applicable statutes of limitations in certain jurisdictions over the next 12 months.
In fiscal 2013, the Company obtained a partial tax holiday from the Singapore Economic Development Board, an agency of the Government of Singapore. This partial tax holiday allows for reduced rates of Singapore income tax on certain classes of income generated from the Company's business operations in Singapore, from September 1, 2012 through August 31, 2022. In order to retain these tax benefits in Singapore, the Company must meet several requirements as to capital and business spending, headcount and activities. For fiscal 2015, the effect of the Singapore partial tax holiday, in the aggregate, was increasing the overall benefit from income taxes from what it otherwise would have been by $25.0 million, thus increasing diluted net income per share by $0.42.
Note 9—Net Income Per Share
Basic net income per share is computed by dividing net income attributable to OmniVision by the weighted average number of common shares outstanding during the period. Diluted net income per share is computed according to the treasury stock method using the weighted average number of common and potentially dilutive common shares outstanding during the period. Potentially dilutive common shares represent the effect of stock options, purchases via employee stock purchase plans and restricted stock units. The calculation of diluted net income per share excludes potential common stock if the effect of such stock is antidilutive.
110
OMNIVISION TECHNOLOGIES, INC.
NOTES TO CONSOLIDATED FINANCIAL STATEMENTS—(Continued)
For the Years Ended April 30, 2015, 2014 and 2013
Note 9—Net Income Per Share—(Continued)
The following table sets forth the computation of basic and diluted earnings per share for the periods indicated (in thousands, except per share data):
| |
Year Ended April 30, | |||||||||
|---|---|---|---|---|---|---|---|---|---|---|
| |
2015 | 2014 | 2013 | |||||||
Basic: |
||||||||||
Numerator: |
||||||||||
Net income |
$ | 93,390 | $ | 94,997 | $ | 42,902 | ||||
| | | | | | | | | | | |
| | | | | | | | | | | |
| | | | | | | | | | | |
Denominator: |
||||||||||
Weighted average common shares for net income per share |
57,563 | 55,537 | 53,529 | |||||||
| | | | | | | | | | | |
| | | | | | | | | | | |
| | | | | | | | | | | |
Basic net income per share |
$ | 1.62 | $ | 1.71 | $ | 0.80 | ||||
| | | | | | | | | | | |
| | | | | | | | | | | |
| | | | | | | | | | | |
Diluted: |
||||||||||
Numerator: |
||||||||||
Net income |
$ | 93,390 | $ | 94,997 | $ | 42,902 | ||||
| | | | | | | | | | | |
| | | | | | | | | | | |
| | | | | | | | | | | |
Denominator: |
||||||||||
Denominator for basic net income per share |
57,563 | 55,537 | 53,529 | |||||||
Weighted average effect of dilutive securities: |
||||||||||
Stock options, restricted stock units and employee stock purchase plan shares |
1,953 | 506 | 142 | |||||||
| | | | | | | | | | | |
Weighted average common shares for diluted net income per share |
59,516 | 56,043 | 53,671 | |||||||
| | | | | | | | | | | |
| | | | | | | | | | | |
| | | | | | | | | | | |
Diluted net income per share |
$ | 1.57 | $ | 1.70 | $ | 0.80 | ||||
| | | | | | | | | | | |
| | | | | | | | | | | |
| | | | | | | | | | | |
Antidilutive common stock subject to outstanding options (excluded from the calculation of diluted net income per share) |
661 | 2,510 | 2,957 | |||||||
| | | | | | | | | | | |
| | | | | | | | | | | |
| | | | | | | | | | | |
111
OMNIVISION TECHNOLOGIES, INC.
NOTES TO CONSOLIDATED FINANCIAL STATEMENTS—(Continued)
For the Years Ended April 30, 2015, 2014 and 2013
Note 10—Comprehensive Income
The following table presents the components of other comprehensive income (loss) and related tax effects for the periods indicated (in thousands):
| |
Year Ended April 30, 2015 | Year Ended April 30, 2014 | Year Ended April 30, 2013 | |||||||||||||||||||||||||
|---|---|---|---|---|---|---|---|---|---|---|---|---|---|---|---|---|---|---|---|---|---|---|---|---|---|---|---|---|
| |
Before Tax |
Tax | Net of Tax |
Before Tax |
Tax | Net of Tax |
Before Tax |
Tax | Net of Tax |
|||||||||||||||||||
Translation gains |
$ | 22 | $ | (8 | ) | $ | 14 | $ | 53 | $ | (18 | ) | $ | 35 | $ | 431 | $ | (151 | ) | $ | 280 | |||||||
Reclassification adjustments for gains on sale of WLCSP |
— | — | — | (1,023 | ) | 358 | (665 | ) | — | — | — | |||||||||||||||||
Unrealized gains on available-for-sale securities |
44,097 | (5,843 | ) | 38,254 | 528 | (185 | ) | 343 | 839 | (148 | ) | 691 | ||||||||||||||||
Reclassification adjustments for (gains) losses on available-for-sale securities |
(577 | ) | — | (577 | ) | (1,641 | ) | 354 | (1,287 | ) | 18 | (7 | ) | 11 | ||||||||||||||
| | | | | | | | | | | | | | | | | | | | | | | | | | | | | |
Total other comprehensive income (loss) |
$ | 43,542 | $ | (5,851 | ) | $ | 37,691 | $ | (2,083 | ) | $ | 509 | $ | (1,574 | ) | $ | 1,288 | $ | (306 | ) | $ | 982 | ||||||
| | | | | | | | | | | | | | | | | | | | | | | | | | | | | |
| | | | | | | | | | | | | | | | | | | | | | | | | | | | | |
| | | | | | | | | | | | | | | | | | | | | | | | | | | | | |
The following table presents the components of, and the changes in, accumulated other comprehensive income for the periods indicated (in thousands):
| |
Balance at May 1, 2013 |
Other Comprehensive Income (Loss), Before Tax |
Amounts Reclassified out of Accumulated Other Comprehensive Income |
Related Tax Effects |
Balance at April 30, 2014 |
|||||||||||
|---|---|---|---|---|---|---|---|---|---|---|---|---|---|---|---|---|
Accumulated translation gains |
$ | 3,036 | $ | 53 | $ | (1,023 | ) | $ | 340 | $ | 2,406 | |||||
Accumulated unrealized gains (losses) on available-for-sale securities, net |
916 | 528 | (1,641 | ) | 169 | (28 | ) | |||||||||
| | | | | | | | | | | | | | | | | |
Total accumulated other comprehensive income |
$ | 3,952 | $ | 581 | $ | (2,664 | ) | $ | 509 | $ | 2,378 | |||||
| | | | | | | | | | | | | | | | | |
| | | | | | | | | | | | | | | | | |
| | | | | | | | | | | | | | | | | |
| |
Balance at May 1, 2014 |
Other Comprehensive Income (Loss), Before Tax |
Amounts Reclassified out of Accumulated Other Comprehensive Income |
Related Tax Effects |
Balance at April 30, 2015 |
|||||||||||
|---|---|---|---|---|---|---|---|---|---|---|---|---|---|---|---|---|
Accumulated translation gains |
$ | 2,406 | $ | 22 | $ | — | $ | (8 | ) | $ | 2,420 | |||||
Accumulated unrealized gains (losses) on available-for-sale securities, net |
(28 | ) | 44,097 | (577 | ) | (5,843 | ) | 37,649 | ||||||||
| | | | | | | | | | | | | | | | | |
Total accumulated other comprehensive income |
$ | 2,378 | $ | 44,119 | $ | (577 | ) | $ | (5,851 | ) | $ | 40,069 | ||||
| | | | | | | | | | | | | | | | | |
| | | | | | | | | | | | | | | | | |
| | | | | | | | | | | | | | | | | |
112
OMNIVISION TECHNOLOGIES, INC.
NOTES TO CONSOLIDATED FINANCIAL STATEMENTS—(Continued)
For the Years Ended April 30, 2015, 2014 and 2013
Note 10—Comprehensive Income—(Continued)
The following table sets forth the amounts reclassified out of Accumulated Other Comprehensive Income into the Consolidated Statements of Income and the associated presentation location, for the periods indicated (in thousands):
| |
|
Year Ended April 30, | ||||||||||
|---|---|---|---|---|---|---|---|---|---|---|---|---|
Comprehensive Income Components
|
Location | 2015 | 2014 | 2013 | ||||||||
Accumulated translation gains |
Other income, net |
$ | — | $ | (1,023 | ) | $ | — | ||||
Accumulated unrealized gains (losses) on available-for-sale securities, net |
Other income, net |
(577 | ) | (1,641 | ) | — | ||||||
| | | | | | | | | | | | | |
|
Total amounts reclassified out of Accumulated Other Comprehensive Income |
$ | (577 | ) | $ | (2,664 | ) | $ | — | |||
| | | | | | | | | | | | | |
| | | | | | | | | | | | | |
| | | | | | | | | | | | | |
Note 11—Fair Value Measurements
The authoritative guidance for fair value measurements specifies a hierarchy of valuation techniques based upon whether the inputs to those valuation techniques reflect assumptions other market participants would use based upon market data obtained from independent sources (observable inputs) or reflect the Company's own assumption of market participant valuation (unobservable inputs). The fair value hierarchy consists of the following three levels:
- •
- Level 1—Inputs are quoted prices in active markets for identical
assets or liabilities.
- •
- Level 2—Inputs are quoted prices for similar assets or liabilities
in an active market, quoted prices for identical or similar assets or liabilities in markets that are not active, inputs other than quoted prices that are observable and market-corroborated inputs
which are derived principally from or corroborated by observable market data.
- •
- Level 3—Inputs are derived from valuation techniques in which one or more significant inputs or value drivers are unobservable.
113
OMNIVISION TECHNOLOGIES, INC.
NOTES TO CONSOLIDATED FINANCIAL STATEMENTS—(Continued)
For the Years Ended April 30, 2015, 2014 and 2013
Note 11—Fair Value Measurements—(Continued)
The following table presents the Company's financial assets and liabilities that are measured at fair value on a recurring basis which were comprised of the following types of instruments as of the date indicated (in thousands):
| |
April 30, 2015 | ||||||||||||
|---|---|---|---|---|---|---|---|---|---|---|---|---|---|
| |
Total | Level 1 | Level 2 | Level 3 | |||||||||
Money market funds |
$ | 15,338 | $ | 15,338 | $ | — | $ | — | |||||
U.S. government debt securities and municipal bonds |
65,783 | — | 65,783 | — | |||||||||
Corporate debt securities/commercial paper |
200,158 | — | 200,158 | — | |||||||||
Equity investment in XinTec |
19,502 | 19,502 | — | — | |||||||||
| | | | | | | | | | | | | | |
Total assets |
$ | 300,781 | $ | 34,840 | $ | 265,941 | $ | — | |||||
| | | | | | | | | | | | | | |
| | | | | | | | | | | | | | |
| | | | | | | | | | | | | | |
Interest rate swap |
$ | (2,073 | ) | $ | — | $ | (2,073 | ) | $ | — | |||
| | | | | | | | | | | | | | |
Total liabilities |
$ | (2,073 | ) | $ | — | $ | (2,073 | ) | $ | — | |||
| | | | | | | | | | | | | | |
| | | | | | | | | | | | | | |
| | | | | | | | | | | | | | |
The following table presents the Company's financial assets and liabilities that are measured at fair value on a recurring basis which were presented on the Company's Consolidated Balance Sheets as of the date indicated (in thousands):
| |
April 30, 2015 | ||||||||||||
|---|---|---|---|---|---|---|---|---|---|---|---|---|---|
| |
Total | Level 1 | Level 2 | Level 3 | |||||||||
Cash equivalents |
$ | 76,008 | $ | 15,338 | $ | 60,670 | $ | — | |||||
Short-term investments |
205,271 | — | 205,271 | — | |||||||||
Long-term investments |
19,502 | 19,502 | — | — | |||||||||
| | | | | | | | | | | | | | |
Total assets |
$ | 300,781 | $ | 34,840 | $ | 265,941 | $ | — | |||||
| | | | | | | | | | | | | | |
| | | | | | | | | | | | | | |
| | | | | | | | | | | | | | |
Interest rate swap |
$ | (2,073 | ) | $ | — | $ | (2,073 | ) | $ | — | |||
| | | | | | | | | | | | | | |
Total liabilities |
$ | (2,073 | ) | $ | — | $ | (2,073 | ) | $ | — | |||
| | | | | | | | | | | | | | |
| | | | | | | | | | | | | | |
| | | | | | | | | | | | | | |
114
OMNIVISION TECHNOLOGIES, INC.
NOTES TO CONSOLIDATED FINANCIAL STATEMENTS—(Continued)
For the Years Ended April 30, 2015, 2014 and 2013
Note 11—Fair Value Measurements—(Continued)
The following table presents the Company's financial assets and liabilities that are measured at fair value on a recurring basis which were comprised of the following types of instruments as of the date indicated (in thousands):
| |
April 30, 2014 | ||||||||||||
|---|---|---|---|---|---|---|---|---|---|---|---|---|---|
| |
Total | Level 1 | Level 2 | Level 3 | |||||||||
Money market funds |
$ | 57,207 | $ | 57,207 | $ | — | $ | — | |||||
U.S. government debt securities and municipal bonds |
17,834 | — | 17,834 | — | |||||||||
Corporate debt securities/commercial paper |
180,764 | — | 180,764 | — | |||||||||
| | | | | | | | | | | | | | |
Total assets |
$ | 255,805 | $ | 57,207 | $ | 198,598 | $ | — | |||||
| | | | | | | | | | | | | | |
| | | | | | | | | | | | | | |
| | | | | | | | | | | | | | |
Interest rate swaps |
$ | (2,980 | ) | $ | — | $ | (2,980 | ) | $ | — | |||
| | | | | | | | | | | | | | |
Total liabilities |
$ | (2,980 | ) | $ | — | $ | (2,980 | ) | $ | — | |||
| | | | | | | | | | | | | | |
| | | | | | | | | | | | | | |
| | | | | | | | | | | | | | |
The following table presents the Company's financial assets and liabilities that are measured at fair value on a recurring basis which were presented on the Company's Consolidated Balance Sheets as of the date indicated (in thousands):
| |
April 30, 2014 | ||||||||||||
|---|---|---|---|---|---|---|---|---|---|---|---|---|---|
| |
Total | Level 1 | Level 2 | Level 3 | |||||||||
Cash equivalents |
$ | 102,812 | $ | 57,207 | $ | 45,605 | $ | — | |||||
Short-term investments |
152,993 | — | 152,993 | — | |||||||||
| | | | | | | | | | | | | | |
Total assets |
$ | 255,805 | $ | 57,207 | $ | 198,598 | $ | — | |||||
| | | | | | | | | | | | | | |
| | | | | | | | | | | | | | |
| | | | | | | | | | | | | | |
Interest rate swaps |
$ | (2,980 | ) | $ | — | $ | (2,980 | ) | $ | — | |||
| | | | | | | | | | | | | | |
Total liabilities |
$ | (2,980 | ) | $ | — | $ | (2,980 | ) | $ | — | |||
| | | | | | | | | | | | | | |
| | | | | | | | | | | | | | |
| | | | | | | | | | | | | | |
There have been no transfers between Level 1 and Level 2 in fiscal 2015, 2014, and 2013. The Company did not hold any investments classified as Level 3 as of April 30, 2015.
For the Company's interest rate swap, the Company obtains fair value quotes from the issuing bank and assesses the quotes for reasonableness by comparing them to the present values of expected cash flows. The present value approach is based on observable market interest rate curves that are commensurate with the terms of the interest rate swap. The carrying value represents the fair value of the swap, as adjusted for any non-performance risk associated with the Company. XinTec completed its IPO and became a listed company on the Taiwan Stock Exchange. The Company started to record its investment in XinTec on a mark-to-market basis. The fair value of the investment in XinTec as of April 30, 2015 was based on the per share closing price of the stock on the Taiwan Stock Exchange.
Due to their short maturities, the reported amounts of the Company's financial instruments, including cash equivalents, short-term investments, accounts receivable, accounts payable and other current liabilities approximate their fair values.
115
OMNIVISION TECHNOLOGIES, INC.
NOTES TO CONSOLIDATED FINANCIAL STATEMENTS—(Continued)
For the Years Ended April 30, 2015, 2014 and 2013
Note 11—Fair Value Measurements—(Continued)
For its investment in WLCSP, the Company uses the equity method of accounting. (See Note 5.) As of April 30, 2015, using the per share closing price of the stock of $8.84 on the Shanghai Stock Exchange, the aggregate fair value of the Company's investment in WLCSP totaled approximately $267.5 million.
The Mortgage Loan and the Construction Loan are recorded at cost. Their book values, however, approximate fair values as the underlying interest rates are based on risk-adjusted market rates; they are categorized as Level 2 for purposes of the fair value measurement hierarchy.
Note 12—Employee Stock Purchase, Equity Incentive and Stock Option Plans
The Company's equity incentive and stock-based compensation plans as of April 30, 2015 are summarized as follows (in thousands):
Name of Plan
|
Shares Authorized |
Shares Available for Grant |
Options Outstanding |
Restricted Stock Units Outstanding |
|||||||||
|---|---|---|---|---|---|---|---|---|---|---|---|---|---|
2007 Equity Incentive Plan |
18,100 | 3,739 | 3,077 | 3,052 | |||||||||
2000 Stock Plan |
— | — | 990 | — | |||||||||
2000 Director Option Plan |
— | — | 80 | — | |||||||||
| | | | | | | | | | | | | | |
Total |
18,100 | 3,739 | 4,147 | 3,052 | |||||||||
| | | | | | | | | | | | | | |
| | | | | | | | | | | | | | |
| | | | | | | | | | | | | | |
As of April 30, 2015, 10,938,032 and 1,980,428 shares of common stock have been reserved for issuance under the Company's employee equity incentive plans and employee stock purchase plan, respectively.
2007 Equity Incentive Plan
In September 2007, on the recommendation of the Company's board of directors, the stockholders of the Company approved the 2007 Equity Incentive Plan (the "2007 Plan"). The 2007 Plan replaced the Company's 2000 Stock Plan. The Company has initially reserved 6,000,000 shares of common stock for issuance under the 2007 Plan. The 2007 Plan provides for the grant of the following types of incentive awards: (i) stock options; (ii) stock appreciation rights; (iii) restricted stock; (iv) restricted stock units; (v) performance shares and performance units; and (vi) other stock or cash awards. In general, stock option and stock appreciation right awards under the 2007 Plan will be granted at a price not less than 100% of the fair market value of the Company's common stock on the date of grant. With the approval of the Company's stockholders in September 2009, the Company modified certain terms of the 2007 Plan. Under the modified 2007 Plan, the Company's stock option awards generally have a maximum contractual term of seven years and vest over four years. Restricted stock units granted under the 2007 Plan generally vest over three years. The 2007 Plan also covers grants of equity-based compensation to the Company's directors. In September 2011 and 2013, the stockholders of the Company approved amendments to the 2007 Plan, increasing the shares available for issuance under the 2007 Plan by 7,200,000 and 4,900,000 shares, respectively. As of April 30, 2015, options to purchase approximately 3,077,000 shares of common stock were outstanding under the 2007 Plan.
116
OMNIVISION TECHNOLOGIES, INC.
NOTES TO CONSOLIDATED FINANCIAL STATEMENTS—(Continued)
For the Years Ended April 30, 2015, 2014 and 2013
Note 12—Employee Stock Purchase, Equity Incentive and Stock Option Plans—(Continued)
2000 Stock Plan
In February 2000, the Company adopted the 2000 Stock Plan under which 6,000,000 shares of common stock were initially reserved for issuance together with an annual increase in the number of shares reserved thereunder beginning on the first day of the Company's fiscal year, commencing May 1, 2002, in an amount equal to the lesser of: 3,000,000 shares, or 6% of outstanding shares of common stock on the last day of the prior fiscal year, or an amount determined by the Company's board of directors. The 2000 Stock Plan provided for grants of incentive stock options to its employees including officers and employees, directors and nonstatutory stock options to its consultants including nonemployee directors. Incentive stock options were granted at a price not less than 100% of the fair market value of the Company's common stock and at a price not less than 110% of the fair market value for grants to any person who owned more than 10% of the voting power of all classes of stock on the date of grant. Nonstatutory stock options were granted at a price not less than 85.0% of the fair market value of the common stock and at a price not less than 110% of the fair market value for grants to a person who owned more than 10% of the voting power of all classes of stock on the date of the grant. Options granted under the 2000 Stock Plan have been at fair market value on the date of the grant and generally vest over four years and are exercisable up to ten years (five years for grants to any person who owned more than 10% of the voting power of all classes of stock on the date of the grant). With the adoption of the 2007 Plan, no additional equity awards will be issued under the 2000 Stock Plan. As of April 30, 2015, options to purchase approximately 990,000 shares of common stock were outstanding under the 2000 Stock Plan.
2000 Director Option Plan
The 2000 Director Option Plan was adopted by the board of directors in February 2000 and approved by the shareholders in March 2000. Under this plan 500,000 shares of common stock were initially reserved for issuance together with an annual increase in the number of shares reserved thereunder beginning on the first day of the Company's fiscal year commencing May 1, 2002 equal to the lesser of 150,000 shares, or 0.25% of the outstanding shares of the common stock on the last day of the prior fiscal year, or an amount determined by the board of directors. The 2000 Director Option Plan provided for an initial grant to the nonemployee director to purchase 40,000 shares of common stock. Subsequent to the initial grants, each nonemployee director was granted an option to purchase 20,000 shares of common stock at the next meeting of the board of directors following the annual meeting of stockholders, if on the date of the annual meeting the director had served on the board of directors for not less than six months. The contractual term of options granted under the 2000 Director Option Plan was ten years, but the options expire three months following the termination of the optionee's status as a director or twelve months if the termination is due to death or disability. The initial 40,000 share grants were exercisable at a rate of one-fourth of the shares on the first anniversary of the grant date and at a rate of 1/16th of the shares per quarter thereafter. The subsequent 20,000 share grants were exercisable at the rate of 1/16th of the shares per quarter. The exercise price of all of these options is 100% of the fair market value of the common stock on the date of grant. In November 2007, the Company's board of directors approved the termination of the Company's 2000 Director Option Plan. The 2007 Plan will also cover all future grants of equity-based compensation to directors. As of April 30, 2015, options to purchase approximately 80,000 shares of common stock were outstanding under the 2000 Director Option Plan.
117
OMNIVISION TECHNOLOGIES, INC.
NOTES TO CONSOLIDATED FINANCIAL STATEMENTS—(Continued)
For the Years Ended April 30, 2015, 2014 and 2013
Note 12—Employee Stock Purchase, Equity Incentive and Stock Option Plans—(Continued)
2009 Employee Stock Purchase Plan
The 2009 Employee Stock Purchase Plan (the "2009 Purchase Plan") was adopted by the board of directors in July 2009 and was approved by the stockholders of the Company in September 2009. The 2009 Purchase Plan replaced the Company's 2000 Employee Stock Purchase Plan in December 2009. The board of directors has initially reserved a total of 2,500,000 shares of common stock for issuance under the 2009 Purchase Plan. Each offering period under the 2009 Purchase Plan will have a duration of approximately 24 months, commencing on the first trading day on or after June 1 and December 1 of each year and terminating on the last trading day in the period ending 24 months later. Each offering period will generally consist of four six-month purchase periods in which shares may be purchased on a participant's behalf. The purchase price will be 85% of the lesser of the fair market value of the common stock on the first trading day of the offering period or on the last day of the purchase period. If the fair market value of the common stock on the last day of the purchase period is lower than the fair market value of the common stock on the enrollment date of the associated offering period, all participants in such offering period will automatically be rolled over to the immediately following offering period. Employees may end their participation in an offering period at any time, and their participation ends automatically on termination of employment with the Company. The first offering period under the 2009 Purchase Plan began on December 1, 2009. In September 2013, the stockholders of the Company approved an amendment to the 2009 Purchase Plan, increasing the number of shares reserved for issuance by 2,500,000 shares. As of April 30, 2015, approximately 3,019,572 shares had been purchased under the 2009 Purchase Plan.
118
OMNIVISION TECHNOLOGIES, INC.
NOTES TO CONSOLIDATED FINANCIAL STATEMENTS—(Continued)
For the Years Ended April 30, 2015, 2014 and 2013
Note 12—Employee Stock Purchase, Equity Incentive and Stock Option Plans—(Continued)
Stock-Based Compensation Award Activity
The following table summarizes the equity award activities under the 2000 Stock Plan, the 2000 Director Option Plan and the 2007 Plan, for the three fiscal years ended April 30, 2015:
| |
|
Options Outstanding | Restricted Stock Units Outstanding |
Restricted Stock Units |
||||||||||||
|---|---|---|---|---|---|---|---|---|---|---|---|---|---|---|---|---|
| |
Shares Available For Grant |
Number of Shares |
Weighted Average Exercise Price Per Share |
Number of Shares |
Weighted Average Grant Date Fair Market Value Per Share |
|||||||||||
| |
(in thousands) |
(in thousands) |
|
(in thousands) |
|
|||||||||||
Balance at May 1, 2012 |
7,488 | 3,570 | $ | 19.53 | 2,053 | $ | 27.24 | |||||||||
Stock options granted |
(644 | ) | 644 | 13.53 | — | — | ||||||||||
Stock options exercised |
— | (137 | ) | 7.95 | — | — | ||||||||||
Stock options expired or forfeited |
2 | (83 | ) | 20.80 | — | — | ||||||||||
Restricted stock units granted(1) |
(2,446 | ) | — | — | 1,528 | 13.39 | ||||||||||
Restricted stock units vested(1) |
— | — | — | (903 | ) | 24.39 | ||||||||||
Restricted stock units expired or forfeited(1) |
359 | — | — | (224 | ) | 20.26 | ||||||||||
| | | | | | | | | | | | | | | | | |
Balance at April 30, 2013 |
4,759 | 3,994 | 18.93 | 2,454 | 20.30 | |||||||||||
2007 Plan amendment |
4,900 | — | — | — | — | |||||||||||
Stock options granted |
(692 | ) | 692 | 18.47 | — | — | ||||||||||
Stock options exercised |
— | (465 | ) | 14.66 | — | — | ||||||||||
Stock options expired or forfeited |
171 | (218 | ) | 24.66 | — | — | ||||||||||
Restricted stock units granted(1) |
(2,627 | ) | — | — | 1,642 | 18.36 | ||||||||||
Restricted stock units vested(1) |
— | — | — | (1,110 | ) | 22.02 | ||||||||||
Restricted stock units expired or forfeited(1) |
410 | — | — | (254 | ) | 18.82 | ||||||||||
| | | | | | | | | | | | | | | | | |
Balance at April 30, 2014 |
6,921 | 4,003 | 19.04 | 2,732 | 18.57 | |||||||||||
Stock options granted |
(637 | ) | 637 | 22.68 | — | — | ||||||||||
Stock options exercised |
— | (483 | ) | 15.86 | — | — | ||||||||||
Stock options expired or forfeited |
— | (10 | ) | 23.41 | — | — | ||||||||||
Restricted stock units granted(1) |
(2,751 | ) | — | — | 1,719 | 22.96 | ||||||||||
Restricted stock units vested(1) |
— | — | — | (1,271 | ) | 20.49 | ||||||||||
Restricted stock units expired or forfeited(1) |
206 | — | — | (128 | ) | 20.25 | ||||||||||
| | | | | | | | | | | | | | | | | |
Balance at April 30, 2015—shares available for grant |
3,739 | — | — | — | — | |||||||||||
| | | | | | | | | | | | | | | | | |
| | | | | | | | | | | | | | | | | |
| | | | | | | | | | | | | | | | | |
Balance at April 30, 2015—options |
— | 4,147 | 19.95 | — | — | |||||||||||
| | | | | | | | | | | | | | | | | |
| | | | | | | | | | | | | | | | | |
| | | | | | | | | | | | | | | | | |
Balance at April 30, 2015—restricted stock units |
— | — | — | 3,052 | 20.17 | |||||||||||
| | | | | | | | | | | | | | | | | |
| | | | | | | | | | | | | | | | | |
| | | | | | | | | | | | | | | | | |
Options Exercisable at April 30, 2015 |
— | 2,909 | 19.82 | — | — | |||||||||||
| | | | | | | | | | | | | | | | | |
| | | | | | | | | | | | | | | | | |
| | | | | | | | | | | | | | | | | |
Vested and expected to vest at April 30, 2015—options |
— | 4,022 | $ | 19.92 | — | — | ||||||||||
| | | | | | | | | | | | | | | | | |
| | | | | | | | | | | | | | | | | |
| | | | | | | | | | | | | | | | | |
Vested and expected to vest at April 30, 2015—restricted stock units |
— | — | — | 2,707 | $ | 20.17 | ||||||||||
| | | | | | | | | | | | | | | | | |
| | | | | | | | | | | | | | | | | |
| | | | | | | | | | | | | | | | | |
- (1)
- Shares subject to awards granted for less than fair market value on the date of grant count against the share reserve as two shares for every one share subject to such an award. When a share is returned to the plan, two shares will be credited back to the reserve. With the approval of the Company's stockholders in September 2009, the Company modified certain terms of the 2007 Plan. Specifically, for restricted stock units granted after September 2009, the grant will count against the share reserve as 1.6 shares for every one share granted. When a share is returned to the plan which was granted after September 2009, 1.6 shares will be credited back to the reserve.
119
OMNIVISION TECHNOLOGIES, INC.
NOTES TO CONSOLIDATED FINANCIAL STATEMENTS—(Continued)
For the Years Ended April 30, 2015, 2014 and 2013
Note 12—Employee Stock Purchase, Equity Incentive and Stock Option Plans—(Continued)
As of April 30, 2015 and 2014, options to purchase 2,909,000 and 2,806,000 shares, respectively, were vested. Information regarding the options outstanding as of April 30, 2015 is summarized below:
| |
Options Outstanding | Options Exercisable | |||||||||||||||||||||||
|---|---|---|---|---|---|---|---|---|---|---|---|---|---|---|---|---|---|---|---|---|---|---|---|---|---|
Range of Exercise Prices
|
Options Outstanding |
Weighted Average Remaining Contractual Life |
Weighted Average Exercise Price |
Aggregate Intrinsic Value |
Options Vested and Exercisable |
Weighted Average Remaining Contractual Life |
Weighted Average Exercise Price |
Aggregate Intrinsic Value |
|||||||||||||||||
| |
(in thousands) |
(in years) |
|
(in thousands) |
(in thousands) |
(in years) |
|
(in thousands) |
|||||||||||||||||
$ 5.82 - $14.93 |
1,195 | 3.34 | $ | 13.21 | 1,026 | $ | 13.19 | ||||||||||||||||||
$15.09 - $18.47 |
1,218 | 3.51 | 17.67 | 817 | 17.40 | ||||||||||||||||||||
$19.38 - $22.68 |
1,074 | 4.56 | 22.22 | 437 | 21.56 | ||||||||||||||||||||
$25.40 - $25.56 |
152 | 1.12 | 25.56 | 152 | 25.56 | ||||||||||||||||||||
$34.80 - $34.80 |
508 | 3.17 | 34.80 | 477 | 34.80 | ||||||||||||||||||||
| | | | | | | | | | | | | | | | | | | | | | | | | | |
$ 5.82 - $34.80 |
4,147 | 3.60 | $ | 19.95 | $ | 36,458 | 2,909 | 2.80 | $ | 19.82 | $ | 26,793 | |||||||||||||
| | | | | | | | | | | | | | | | | | | | | | | | | | |
| | | | | | | | | | | | | | | | | | | | | | | | | | |
| | | | | | | | | | | | | | | | | | | | | | | | | | |
The aggregate intrinsic value in the table above represents the total pretax intrinsic value (the aggregate difference between the closing stock price of the Company's common stock on April 30, 2015 of $27.90 and the exercise price of in-the-money options) that would have been received by the option holders had all option holders exercised their options as of that date. The total number of shares of common stock underlying in-the-money options exercisable as of April 30, 2015 was 2,432,309 shares.
The total intrinsic value of options exercised, the total intrinsic value of restricted stock units vested and the total cash received from employees as a result of employee stock option exercises during the periods indicated were as follows (in thousands):
| |
April 30, | ||||||
|---|---|---|---|---|---|---|---|
| |
2015 | 2014 | |||||
Total intrinsic value of options exercised |
$ | 4,464 | $ | 1,784 | |||
Total intrinsic value of restricted stock units vested |
29,222 | 20,330 | |||||
Total cash received from employees as a result of employee stock option exercises |
$ | 5,633 | $ | 6,825 | |||
120
OMNIVISION TECHNOLOGIES, INC.
NOTES TO CONSOLIDATED FINANCIAL STATEMENTS—(Continued)
For the Years Ended April 30, 2015, 2014 and 2013
Note 12—Employee Stock Purchase, Equity Incentive and Stock Option Plans—(Continued)
Unrecognized compensation expense and the weighted average period over which the Company expects to recognize such compensation as of the dates indicated were as follows (dollars in thousands):
| |
April 30, | ||||||
|---|---|---|---|---|---|---|---|
| |
2015 | 2014 | |||||
Unvested stock options: |
|||||||
Unrecognized compensation expense, net of forfeitures |
$ | 7,920 | $ | 8,403 | |||
Weighted average period (years) |
2.4 | 2.5 | |||||
Unvested restricted stock units: |
|||||||
Unrecognized compensation expense, net of forfeitures |
$ | 36,416 | $ | 28,749 | |||
Weighted average period (years) |
1.6 | 1.7 | |||||
2009 Purchase Plan: |
|||||||
Unrecognized compensation expense |
$ | 1,155 | $ | 3,396 | |||
Weighted average period (years) |
0.8 | 1.1 | |||||
The Company's current policy is to issue new shares to settle the exercise of stock options and prospectively, the vesting of restricted stock units.
Valuation Assumptions
The authoritative guidance for stock-based compensation requires companies to estimate the fair value of stock-based compensation awards on the measurement date. The value of the portion of the award that is ultimately expected to vest is recognized as expense over the requisite service period in the Company's Consolidated Statements of Income.
For restricted stock unit awards, the per-share fair value is the closing market price of the Company's common stock as reported on the NASDAQ Global Market ("NASDAQ") on the measurement date. For stock option awards and rights issued under the 2009 Purchase Plan, the Company measures the fair value using the Black-Scholes option pricing model. Black-Scholes was developed to estimate the fair value of freely tradable, fully transferable options without vesting restrictions. These assumptions differ significantly from the characteristics of the Company's stock-based compensation awards. Black-Scholes also requires the use of highly subjective, complex assumptions, including expected term and the price volatility of the Company's stock.
Using the Black-Scholes option pricing model, the per share weighted average estimated grant date fair value for employee options granted under the 2007 Plan, and rights issued pursuant to the 2009 Purchase Plan, during the periods indicated was as follows:
| |
Year Ended April 30, | |||||||||
|---|---|---|---|---|---|---|---|---|---|---|
| |
2015 | 2014 | 2013 | |||||||
Per share weighted average estimated grant date fair value of stock options granted |
$ | 8.98 | $ | 7.92 | $ | 6.36 | ||||
| | | | | | | | | | | |
| | | | | | | | | | | |
| | | | | | | | | | | |
Per share weighted average estimated fair value of rights issued |
$ | 5.56 | $ | 5.83 | $ | 6.06 | ||||
| | | | | | | | | | | |
| | | | | | | | | | | |
| | | | | | | | | | | |
121
OMNIVISION TECHNOLOGIES, INC.
NOTES TO CONSOLIDATED FINANCIAL STATEMENTS—(Continued)
For the Years Ended April 30, 2015, 2014 and 2013
Note 12—Employee Stock Purchase, Equity Incentive and Stock Option Plans—(Continued)
The following weighted average assumptions are included in the estimated fair value calculations for stock options granted in the periods indicated:
| |
Employee Stock Option Plans Year Ended April 30, |
Employee Stock Purchase Plan Year Ended April 30, |
|||||||||||||||||
|---|---|---|---|---|---|---|---|---|---|---|---|---|---|---|---|---|---|---|---|
| |
2015 | 2014 | 2013 | 2015 | 2014 | 2013 | |||||||||||||
Risk-free interest rate |
1.3 | % | 1.0 | % | 0.6 | % | 0.1 | % | 0.1 | % | 0.1 | % | |||||||
Expected term of options (in years) |
4.78 | 4.59 | 4.30 | 0.5 | 0.5 | 0.5 | |||||||||||||
Expected volatility |
45 | % | 51 | % | 60 | % | 39 | % | 46 | % | 63 | % | |||||||
Expected dividend yield |
0 | % | 0 | % | 0 | % | 0 | % | 0 | % | 0 | % | |||||||
The methodologies for determining the above values were as follows:
- •
- Expected term: The expected term represents the period
that the Company's stock-based awards are expected to be outstanding and is estimated based on historical experience.
- •
- Risk-free interest rate: The risk-free interest rate
assumption is based upon observed interest rates appropriate for the expected term of the Company's stock-based awards.
- •
- Expected volatility: The Company determines expected
volatility based on an average between the historical volatility of the Company's common stock and the implied volatility based on the Company's traded options with lives of six months or more.
Averaging two data sources may provide a better proxy to what market place participants would use to value the Company's options.
- •
- Dividend yield: The dividend yield assumption reflects
the Company's intention not to pay a cash dividend under its dividend policy.
- •
- Estimated pre-vesting forfeitures: When estimating pre-vesting forfeitures, the Company considers forfeiture behavior based on actual historical information.
Note 13—Risks and Uncertainties
Financial instruments which potentially subject the Company to concentrations of credit risk consist principally of cash and cash equivalents, short-term investments, trade receivables and the interest rate swaps.
The Company maintains cash and cash equivalents and short-term investments with various financial institutions, located in several different jurisdictions. The majority of the cash and cash equivalents balances are held in the U.S., Cayman Islands, and Singapore. The short-term investments are primarily held in the U.S. and Cayman Islands. Deposits held with banks may generally be redeemed upon demand and may exceed the limit of insurance provided on such deposits. All these deposits and other financial instruments, including the Company's interest rate swap, are maintained with financial institutions of reputable credit and therefore bear minimal credit risk. The Company has not sustained credit losses from instruments held at financial institutions.
122
OMNIVISION TECHNOLOGIES, INC.
NOTES TO CONSOLIDATED FINANCIAL STATEMENTS—(Continued)
For the Years Ended April 30, 2015, 2014 and 2013
Note 13—Risks and Uncertainties—(Continued)
The Company's products are primarily sold to OEMs, VARs and to distributors. The Company's sales to significant customers as a percentage of revenues for the periods indicated were as follows:
| |
Year Ended April 30, | |||||||||
|---|---|---|---|---|---|---|---|---|---|---|
| |
2015 | 2014 | 2013 | |||||||
Percentage of revenues: |
||||||||||
Customer A |
13.8 | % | 13.8 | % | 10.7 | % | ||||
Customer B |
13.3 | 11.0 | 11.7 | |||||||
Customer C |
11.5 | * | * | |||||||
Customer D |
* | * | 18.0 | |||||||
Customer E |
* | % | 12.5 | % | 10.3 | % | ||||
- *
- Less than ten percent of revenues.
The Company performs ongoing credit evaluations of its customers and maintains an allowance for doubtful accounts. Significant customer accounts receivable as a percentage of net accounts receivable for the periods indicated were as follows:
| |
April 30, | ||||||
|---|---|---|---|---|---|---|---|
| |
2015 | 2014 | |||||
Percentage of accounts receivable, net: |
|||||||
Customer A |
20.4 | % | 12.7 | % | |||
Customer B |
13.5 | 10.4 | |||||
Customer C |
* | % | 17.0 | % | |||
- *
- Less than ten percent of accounts receivable, net.
Certain of the Company's wafer, color filter application and packaging services are obtained from a single source or a limited group of suppliers. The partial or complete loss of one or more of these sources could have at least a temporary adverse effect on the Company's consolidated results of operations.
Note 14—Segment and Geographic Information
For all periods presented, the Company operated as a single reportable business segment.
The Company sells its image-sensor products either directly to OEMs and VARs or indirectly through distributors. The following table illustrates the percentage of revenues from sales to OEMs and VARs and to distributors for the periods indicated:
| |
Year Ended April 30, | |||||||||
|---|---|---|---|---|---|---|---|---|---|---|
| |
2015 | 2014 | 2013 | |||||||
OEMs and VARs |
75.3 | % | 81.2 | % | 81.2 | % | ||||
Distributors |
24.7 | 18.8 | 18.8 | |||||||
| | | | | | | | | | | |
Total |
100.0 | % | 100.0 | % | 100.0 | % | ||||
| | | | | | | | | | | |
123
OMNIVISION TECHNOLOGIES, INC.
NOTES TO CONSOLIDATED FINANCIAL STATEMENTS—(Continued)
For the Years Ended April 30, 2015, 2014 and 2013
Note 14—Segment and Geographic Information—(Continued)
Since the end-user customers of the Company's customers market and sell their products worldwide, the Company's revenues by geographic location are not necessarily indicative of the geographic distribution of end-user sales, but rather indicate where their components are sourced. The revenues by geography in the following table are based on the country or region in which the Company's customers issue their purchase orders for the periods presented (in thousands):
| |
Year Ended April 30, | |||||||||
|---|---|---|---|---|---|---|---|---|---|---|
| |
2015 | 2014 | 2013 | |||||||
China |
$ | 1,101,474 | $ | 1,122,802 | $ | 955,378 | ||||
Japan |
83,003 | 89,311 | 57,604 | |||||||
South Korea |
61,432 | 158,693 | 275,105 | |||||||
Singapore |
47,123 | 17,376 | 8,078 | |||||||
United States |
11,752 | 4,781 | 3,997 | |||||||
All other |
73,991 | 60,966 | 107,767 | |||||||
| | | | | | | | | | | |
Total |
$ | 1,378,775 | $ | 1,453,929 | $ | 1,407,929 | ||||
| | | | | | | | | | | |
| | | | | | | | | | | |
| | | | | | | | | | | |
The Company's long-lived assets, including its property, plant and equipment, net, long-term investments, land-use rights and other long-term assets are located in the following countries as of the dates indicated (in thousands):
| |
April 30, | ||||||
|---|---|---|---|---|---|---|---|
| |
2015 | 2014 | |||||
China |
$ | 154,573 | $ | 162,207 | |||
Taiwan |
157,722 | 126,820 | |||||
United States |
47,785 | 50,552 | |||||
All other |
706 | 623 | |||||
| | | | | | | | |
Total |
$ | 360,786 | $ | 340,202 | |||
| | | | | | | | |
| | | | | | | | |
| | | | | | | | |
Note 15—Commitments and Contingencies
Commitments
During the three months ended July 31, 2014, the Company entered into a development and supply agreement with Powerchip Technology Corporation ("PTC") pursuant to which the Company would deposit up to $1.0 million with PTC as prepaid wafer credit. As of April 30, 2015, the Company has not made any deposits under this agreement.
124
OMNIVISION TECHNOLOGIES, INC.
NOTES TO CONSOLIDATED FINANCIAL STATEMENTS—(Continued)
For the Years Ended April 30, 2015, 2014 and 2013
Note 15—Commitments and Contingencies—(Continued)
The Company leases certain facilities and software under non-cancelable operating lease agreements. The non-cancelable operating leases expire at various dates through fiscal 2023. At April 30, 2015, future minimum lease commitments under operating leases are as follows (in thousands):
Years Ended April 30,
|
|
|||
|---|---|---|---|---|
2016 |
$ | 5,909 | ||
2017 |
2,528 | |||
2018 |
1,202 | |||
2019 |
985 | |||
2020 |
672 | |||
Thereafter |
765 | |||
| | | | | |
Total |
$ | 12,061 | ||
| | | | | |
| | | | | |
| | | | | |
The following table presents rental expenses under all operating leases during the periods presented (in thousands):
| |
Year Ended April 30, | |||||||||
|---|---|---|---|---|---|---|---|---|---|---|
| |
2015 | 2014 | 2013 | |||||||
Rental expenses under operating leases |
$ | 10,268 | $ | 9,775 | $ | 11,491 | ||||
| | | | | | | | | | | |
| | | | | | | | | | | |
| | | | | | | | | | | |
Litigation
From time to time, the Company has been subject to legal proceedings and claims with respect to such matters as patents, product liabilities and other actions arising out of the normal course of business.
Ziptronix, Inc. v. OmniVision Technologies, Inc., Taiwan Semiconductor Manufacturing Company Ltd., and TSMC North America Corp.
On December 6, 2010, Ziptronix, Inc. ("Ziptronix") filed a complaint alleging patent infringement against the Company in the District Court for the Northern District of California. The case is entitled Ziptronix, Inc. v. OmniVision Technologies, Inc., Taiwan Semiconductor Manufacturing Company Ltd., and TSMC North America Corp., Case No. CV10-05525. In its complaint, Ziptronix asserts that the Company has made, used, offered to sell, sold and/or imported into the United States image sensors that infringe the following six patents: U.S. Patent Nos. 7,387,944 ("Method for Low Temperature Bonding and Bonded Structure"), 7,335,572 ("Method for Low Temperature Bonding and Bonded Structure"), 7,553,744 ("Method for Low Temperature Bonding and Bonded Structure"), 7,037,755 ("Three Dimensional Device Integration Method and Integrated Device"), 6,864,585 ("Three Dimensional Device Integration Method and Integrated Device"), and 7,807,549 ("Method for Low Temperature Bonding and Bonded Structure"). The complaint seeks unspecified monetary damages, enhanced damages, interest, fees, expenses, costs, and injunctive relief against the Company. The Company answered the complaint on May 4, 2011 and denied each of Ziptronix's infringement claims against it.
125
OMNIVISION TECHNOLOGIES, INC.
NOTES TO CONSOLIDATED FINANCIAL STATEMENTS—(Continued)
For the Years Ended April 30, 2015, 2014 and 2013
Note 15—Commitments and Contingencies—(Continued)
On November 22, 2011, Defendants Taiwan Semiconductor Manufacturing Company Ltd., and TSMC North America Corp. (collectively "TSMC") filed amended counterclaims asserting that Ziptronix has infringed, actively induced infringement of, and/or induced contributory infringement of the following five patents: U.S. Patent Nos. 6,682,981 ("Stress Controlled Dielectric Integrated Circuit Fabrication"), 7,307,020 ("Membrane 3D IC Fabrication"), 6,765,279 ("Membrane 3D IC Fabrication"), 7,385,835 ("Membrane 3D IC Fabrication"), and 6,350,694 ("Reducing CMP Scratch, Dishing and Erosion by Post CMP Etch Back Method for Low-K Materials"). Ziptronix answered the amended counterclaims on December 9, 2011 and denied each of TSMC's infringement claims against it.
On August 9, 2012, Ziptronix filed a second amended complaint adding claims that the defendants infringe the following three patents: U.S. Patent Nos. 8,153,505 ("Method for Low Temperature Bonding and Bonded Structure"), 8,043,329 ("Method for Low Temperature Bonding and Bonded Structure"), and 7,871,898 ("Method for Low Temperature Bonding and Bonded Structure"). The Company answered the second amended complaint on August 27, 2012, and denied each of Ziptronix's infringement claims against it.
Claim construction briefing has been submitted, but there is no claim construction hearing currently scheduled. On September 30, 2014, the court granted TSMC's motion for summary judgment of noninfringement based on extraterritoriality issues. On March 2, 2015, the court granted the Company's motion for summary judgment of noninfringement of its non-U.S. sales. The court's summary judgment motion addresses most of Ziptronix's infringement claims asserted in the case and the Company expects to vigorously defend itself against Ziptronix's remaining allegations of infringement. The Company is currently unable to predict the ultimate outcome of this case and therefore cannot determine the likelihood of loss nor estimate the loss or a range of possible loss.
Securities Litigation
On October 26, 2011, the first of several putative class action complaints was filed in the United States District Court for the Northern District of California against the Company and three of its executives, one of whom is a director. All of the complaints alleged that the defendants violated the federal securities laws by making misleading statements or omissions regarding the Company's business and financial results, in particular regarding the use of its imaging sensors in Apple Inc.'s iPhone. These actions have been consolidated as In re OmniVision Technologies, Inc. Litigation, Case No. 11-CV-5235 (RMW) (the "Securities Case"). On April 23, 2012, plaintiffs filed a consolidated complaint on behalf of a purported class of purchasers of the Company's common stock between August 27, 2010 and November 6, 2011, seeking unspecified damages. On March 29, 2013, the court denied the defendants' motion to dismiss. On December 30, 2014, the parties entered into a stipulation and agreement of settlement to resolve the litigation, which was then submitted to the court for preliminary approval. The stipulation and agreement of settlement provides for a payment of $12.5 million to the plaintiff class, which is funded solely by the Company's insurance carriers. The Company also entered into a mutual release agreement with one of its insurance carriers. In March 2015, the court entered an order granting preliminary approval of the settlement and ordering notice to the putative plaintiff class. On June 5, 2015, the court granted final approval of the settlement and entered a final judgment and order dismissing the action.
126
OMNIVISION TECHNOLOGIES, INC.
NOTES TO CONSOLIDATED FINANCIAL STATEMENTS—(Continued)
For the Years Ended April 30, 2015, 2014 and 2013
Note 15—Commitments and Contingencies—(Continued)
As of April 30, 2015, prior to the court granting final approval of the settlement, the Company reported on its Consolidated Balance Sheet $12.5 million as Recoverable insurance proceeds within Total current assets, and $12.5 million as Litigation settlement accrual within Total current liabilities.
Derivative Litigation
On November 15, 2011, the first of three shareholder derivative complaints was filed in the Superior Court of California, County of Santa Clara, against several of the Company's current and former officers and directors. These three state court actions were consolidated under the caption In re OmniVision Technologies, Inc. Derivative Litigation, Case No. 1-12-CV-216875. On March 21, 2012, a fourth similar shareholder derivative complaint captioned Carpenters Pension Fund of West Virginia v. Shaw Hong, et al., Case No. 12-CV-1423, was filed in the United States District Court for the Northern District of California. On May 10, 2012, a fifth similar shareholder derivative complaint captioned Edker Pope v. Shaw Hong, et. al., Case No. 7514, was filed in the Court of Chancery of the State of Delaware. These complaints make allegations similar to those presented in Securities Case, but they assert various state law causes of action, including claims of breach of fiduciary duty and unjust enrichment. All of these derivative complaints seek unspecified damages on behalf of the Company, which is named solely as nominal defendant against whom no recovery is sought. The proceedings in these derivative actions have been stayed by agreement. The Company is currently unable to predict the outcome of these actions and therefore cannot determine the likelihood of loss nor estimate the loss or a range of possible loss.
Raytheon Company v. Sony Corporation, OmniVision Technologies, Inc., and Apple, Inc.
On March 6, 2015, Raytheon Company ("Raytheon") filed a complaint alleging patent infringement against the Company in the District Court for the Eastern District of Texas. The case is entitled Raytheon Co. v. Sony Corp. et al., Case No. 2:15-CV-00342-JRG-RSP. In its complaint, Raytheon asserts that the Company has made, used, offered to sell, sold and/or imported into the United States image sensors that infringe U.S. Patent No. 5,591,678 (the "'678 Patent"). The complaint seeks unspecified monetary damages, interest, fees, expenses, costs and other equitable relief against the Company. The Company answered the complaint on May 1, 2015 and denied each of Raytheon's infringement claims against it. In addition, the '678 Patent expired in January 2014. The Company is currently unable to predict the ultimate outcome of this case and therefore cannot determine the likelihood of loss nor estimate the loss or a range of possible loss.
Merger Litigation
In connection with the Merger Agreement and the transactions contemplated thereby, a number of putative class action lawsuits have been filed in the Superior Court of the State of California, County of Santa Clara. The actions filed Pope v. OmniVision Technologies, Inc., et al., No. 15-CV-280161 (filed May 4, 2015); Francisco v. Xiaoying, et al., No. 15-CV-280270 (filed May 6, 2015); Agee v. OmniVision Technologies, Inc., No. 15-CV-280311 (filed May 7, 2015); Levine v. OmniVision Technologies, Inc., No. 15-CV-280344 (filed May 7, 2015); O'Donnell v. OmniVision Technologies, Inc., No. 15-CV-280411 (filed May 8, 2015); Smith v. Hong, et al., No. 15-CV-280863 (filed May 19, 2015); and Nido v. OmniVision Technologies, Inc., No. 15-CV-281031 (filed May 22, 2015). In general, the various complaints assert that, among other things, the members of the Board of Directors breached their
127
OMNIVISION TECHNOLOGIES, INC.
NOTES TO CONSOLIDATED FINANCIAL STATEMENTS—(Continued)
For the Years Ended April 30, 2015, 2014 and 2013
Note 15—Commitments and Contingencies—(Continued)
fiduciary duties to OmniVision's stockholders by engaging in a process that was not designed to, and did not, maximize the stockholders' value, and that OmniVision and the proposed acquiring entities aided and abetted the Board of Directors' alleged breaches of fiduciary duties. The complaints generally seek to enjoin the merger, rescission of the merger to the extent it is implemented, or alternatively, rescissionary damages. On June 2, 2015, the actions were consolidated under the caption In re OmniVision Technologies, Inc. Shareholder Litigation, No. 15-CV-280161. On June 8, 2015, a consolidated amended complaint was filed. The amended complaint adds allegations that the Board of Directors breached their fiduciary duties by issuing a false and misleading preliminary proxy statement. The amended complaint also adds allegations that J.P. Morgan aided and abetted the directors' alleged breaches of fiduciary duty. The Company is currently unable to predict the outcome of this action and therefore cannot determine the likelihood of loss nor estimate the loss or a range of possible loss.
Note 16—Related Party Transactions
The following table presents the amounts paid for services provided by related parties and the balances payable for the periods indicated (in thousands):
| |
|
Year Ended April 30, | ||||||||||
|---|---|---|---|---|---|---|---|---|---|---|---|---|
Related Party
|
Description | 2015 | 2014 | 2013 | ||||||||
VisEra |
Purchases of color filter and other manufacturing services |
$ | 96,895 | $ | 119,919 | $ | 166,100 | |||||
| | | | | | | | | | | | | |
| | | | | | | | | | | | | |
| | | | | | | | | | | | | |
|
Rent and other services(1) |
$ | — | $ | 3 | $ | 3,664 | |||||
| | | | | | | | | | | | | |
| | | | | | | | | | | | | |
| | | | | | | | | | | | | |
|
Balance payable at year end, net |
$ | 12,342 | $ | 19,160 | $ | 28,024 | |||||
| | | | | | | | | | | | | |
| | | | | | | | | | | | | |
| | | | | | | | | | | | | |
WLCSP |
Purchases of packaging services |
$ | 25,038 | $ | 2,097 | $ | — | |||||
| | | | | | | | | | | | | |
| | | | | | | | | | | | | |
| | | | | | | | | | | | | |
|
Balance payable at year end, net |
$ | 3,005 | $ | 1,156 | $ | — | |||||
| | | | | | | | | | | | | |
| | | | | | | | | | | | | |
| | | | | | | | | | | | | |
- (1)
- The Company leased manufacturing floor space from VisEra from November 2011 to May 2013.
128
OMNIVISION TECHNOLOGIES, INC.
NOTES TO CONSOLIDATED FINANCIAL STATEMENTS—(Continued)
For the Years Ended April 30, 2015, 2014 and 2013
Supplementary Data (Unaudited)
| |
Three Months Ended | ||||||||||||
|---|---|---|---|---|---|---|---|---|---|---|---|---|---|
| |
July 31, 2014 |
October 31, 2014 |
January 31, 2015 |
April 30, 2015 |
|||||||||
| |
(in thousands, except per share data) |
||||||||||||
Revenues |
$ | 406,536 | $ | 394,045 | $ | 292,341 | $ | 285,853 | |||||
Cost of revenues |
318,116 | 307,548 | 227,759 | 221,903 | |||||||||
Gross profit |
88,420 | 86,497 | 64,582 | 63,950 | |||||||||
Net income |
$ | 45,327 | $ | 28,044 | $ | 14,023 | $ | 5,996 | |||||
Net income per share: |
|||||||||||||
Basic(1) |
$ | 0.80 | $ | 0.49 | $ | 0.24 | $ | 0.10 | |||||
| | | | | | | | | | | | | | |
| | | | | | | | | | | | | | |
| | | | | | | | | | | | | | |
Diluted(1) |
$ | 0.78 | $ | 0.47 | $ | 0.23 | $ | 0.10 | |||||
| | | | | | | | | | | | | | |
| | | | | | | | | | | | | | |
| | | | | | | | | | | | | | |
Shares used in computing net income per share: |
|||||||||||||
Basic |
56,583 | 57,617 | 57,948 | 58,104 | |||||||||
| | | | | | | | | | | | | | |
| | | | | | | | | | | | | | |
| | | | | | | | | | | | | | |
Diluted |
58,158 | 59,423 | 60,134 | 60,349 | |||||||||
| | | | | | | | | | | | | | |
| | | | | | | | | | | | | | |
| | | | | | | | | | | | | | |
| |
Three Months Ended | ||||||||||||
|---|---|---|---|---|---|---|---|---|---|---|---|---|---|
| |
July 31, 2013 |
October 31, 2013 |
January 31, 2014 |
April 30, 2014 |
|||||||||
| |
(in thousands, except per share data) |
||||||||||||
Revenues |
$ | 373,688 | $ | 397,249 | $ | 352,023 | $ | 330,969 | |||||
Cost of revenues |
308,527 | 322,383 | 282,891 | 264,406 | |||||||||
Gross profit |
65,161 | 74,866 | 69,132 | 66,563 | |||||||||
Net income |
$ | 23,061 | $ | 26,303 | $ | 30,560 | $ | 15,073 | |||||
Net income per share: |
|||||||||||||
Basic(1) |
$ | 0.42 | $ | 0.47 | $ | 0.55 | $ | 0.27 | |||||
| | | | | | | | | | | | | | |
| | | | | | | | | | | | | | |
| | | | | | | | | | | | | | |
Diluted(1) |
$ | 0.42 | $ | 0.47 | $ | 0.54 | $ | 0.26 | |||||
| | | | | | | | | | | | | | |
| | | | | | | | | | | | | | |
| | | | | | | | | | | | | | |
Shares used in computing net income per share: |
|||||||||||||
Basic |
54,611 | 55,584 | 55,913 | 56,042 | |||||||||
| | | | | | | | | | | | | | |
| | | | | | | | | | | | | | |
| | | | | | | | | | | | | | |
Diluted |
55,344 | 55,732 | 56,186 | 56,882 | |||||||||
| | | | | | | | | | | | | | |
| | | | | | | | | | | | | | |
| | | | | | | | | | | | | | |
- (1)
- Net income per share is computed independently for each of the quarters presented. Therefore, the sum of quarterly basic and diluted per share information may not equal annual basic and diluted earnings per share.
129
ITEM 9. CHANGES IN AND DISAGREEMENTS WITH ACCOUNTANTS ON ACCOUNTING AND FINANCIAL DISCLOSURE
None.
ITEM 9A. CONTROLS AND PROCEDURES
Disclosure Controls and Procedures
Evaluation of Disclosure Controls and Procedures ("Disclosure Controls"). We evaluated the effectiveness of the design and operation of our Disclosure Controls, as defined by the rules and regulations of the SEC (the "Evaluation"), as of the end of the period covered by this Report. This Evaluation was performed under the supervision and with the participation of management, including our Chief Executive Officer (the "CEO"), as principal executive officer, and Chief Financial Officer (the "CFO"), as principal financial officer.
Attached as Exhibits 31.1 and 31.2 of this Report are the certifications of the CEO and the CFO, respectively, in compliance with Section 302 of the Sarbanes-Oxley Act of 2002 (the "Certifications"). This section of the Report provides information concerning the Evaluation referred to in the Certifications and should be read in conjunction with the Certifications.
Disclosure Controls are controls and procedures designed to ensure that information required to be disclosed in the reports filed or submitted under the Securities Exchange Act of 1934, as amended, is recorded, processed, summarized and reported within the time periods as specified in the SEC's rules and forms. In addition, Disclosure Controls are designed to ensure the accumulation and communications of information required to be disclosed in reports filed or submitted under the Securities Exchange Act of 1934, as amended, to our management, including the CEO and CFO, to allow timely decisions regarding required disclosure.
Based on the Evaluation, our CEO and CFO have concluded that our Disclosure Controls are effective at the reasonable assurance level as of the end of fiscal year 2015.
Inherent Limitations on the Effectiveness of Disclosure Controls
Our management, including the CEO and CFO, does not expect that the Disclosure Controls will prevent all errors and all fraud. Disclosure Controls, no matter how well conceived, managed, utilized and monitored, can provide only reasonable assurance that the objectives of such controls are met. Therefore, because of the inherent limitation of Disclosure Controls, no evaluation of such controls can provide absolute assurance that all control issues and instances of fraud, if any, within us have been detected.
Management's Annual Report on Internal Control over Financial Reporting
Management is responsible for establishing and maintaining adequate internal control over financial reporting. Management conducted an assessment of our internal control over financial reporting as of April 30, 2015 based on the framework established by the Committee of Sponsoring Organizations of the Treadway Commission in Internal Control—Integrated Framework (2013). Based on this assessment, management concluded that, as of April 30, 2015, our internal control over financial reporting was effective. The independent registered public accounting firm, PricewaterhouseCoopers LLP, has issued a report on our internal control over financial reporting. The report on the audit of internal control over financial reporting appears on page 80 of this Annual Report on Form 10-K.
Internal control over financial reporting cannot provide absolute assurance of achieving financial reporting objectives because of its inherent limitations. Internal control over financial reporting is a process that involves human diligence and compliance, and is subject to lapses in judgment and
130
breakdowns resulting from human failures. Internal control over financial reporting also can be circumvented by collusion or improper management override. Because of such limitations, there is a risk that material misstatements may not be prevented or detected on a timely basis by internal control over financial reporting. However, these inherent limitations are known features of the financial reporting process. Therefore it is possible to design into the process safeguards to reduce, though not eliminate, this risk.
Changes in Internal Control over Financial Reporting
There were no changes in our internal control over financial reporting that occurred during the three months ended April 30, 2015, that have materially affected, or are reasonably likely to materially affect, our internal control over financial reporting.
None.
131
ITEM 10. DIRECTORS, EXECUTIVE OFFICERS OF THE REGISTRANT AND CORPORATE GOVERNANCE
The information required by this item concerning our directors is incorporated by reference to the sections captioned "Proposal One—Election of Class III Directors" and "Corporate Governance" contained in our proxy statement related to our 2015 Annual Meeting of Stockholders, to be filed with the SEC within 120 days of the end of our fiscal year pursuant to General Instruction G(3) of Form 10-K (the "Proxy Statement"). The information required by this item concerning compliance with Section 16(a) of the Exchange Act is incorporated by references to the section captioned "Section 16(a) Beneficial Ownership Reporting Compliance" in our Proxy Statement. Certain information required by this item concerning executive officers is set forth in Part I of this Report in Item 1. "Business" under the heading "Executive Officers of the Registrant."
Code of Ethics
We have a code of ethics that applies to all of our employees, including our principal executive officer, principal financial officer and principal accounting officer. This code of ethics is posted on our Internet website. The Internet address for our website is http://www.ovt.com, and the code of ethics may be found on the "Corporate Governance" section of our "Investors" webpage.
We intend to satisfy the disclosure requirement under Item 5.05 of Form 8-K regarding any amendment to, or waiver from, a provision of this code of ethics by posting such information on our website, at the address and location specified above, or as otherwise required by the NASDAQ Global Market.
ITEM 11. EXECUTIVE COMPENSATION
The information required by this item is incorporated by reference to the section captioned "Executive Compensation" contained in the Proxy Statement.
ITEM 12. SECURITY OWNERSHIP OF CERTAIN BENEFICIAL OWNERS AND MANAGEMENTAND RELATED STOCKHOLDER MATTERS
The information required by this item is incorporated by reference to the sections captioned "Security Ownership of Certain Beneficial Owners and Management" and "Equity Compensation Plan Information" contained in the Proxy Statement.
ITEM 13. CERTAIN RELATIONSHIPS AND RELATED TRANSACTIONS AND DIRECTOR INDEPENDENCE
The information required by this item is incorporated by reference to the section captioned "Related Party Transactions" contained in the Proxy Statement.
ITEM 14. PRINCIPAL ACCOUNTING FEES AND SERVICES
The information required by this item is incorporated by reference to the section captioned "Proposal Two—Ratification of Appointment of Independent Registered Public Accounting Firm" contained in the Proxy Statement.
132
ITEM 15. EXHIBITS AND FINANCIAL STATEMENT SCHEDULES
- (a)
- The
following documents are filed as part of this Report:
- 1.
- Consolidated
Financial Statements. Refer to the financial statements filed as a part of this Report under "Item 8—Financial Statements and Supplementary Data."
- 2.
- Financial
Statement Schedules. The following financial schedule is filed as part of this Report under "Schedule II—Valuation and Qualifying Accounts for the Years Ended April 30, 2015, 2014 and 2013." All other schedules called
for by Form 10-K have been omitted because they are not applicable or are not required or the information required to be set forth therein is included in the consolidated financial statements
or notes thereto.
- 3.
- Exhibits.
| Exhibit Number |
Description | ||
|---|---|---|---|
| 2.1 | +(20) | Patent Assignment Agreement dated March 30, 2011 between the Registrant and Eastman Kodak Company | |
| 2.2 | +(21) | Agreement and Plan of Merger, dated as of April 30, 2015, by and among Seagull International Limited, Seagull Acquisition Corporation, and OmniVision Technologies, Inc. | |
| 3.1 | (1) | Restated Certificate of Incorporation | |
| 3.2 | (19) | Bylaws of the Registrant as amended on November 27, 2007 and November 21, 2011 | |
| 3.2.1 | (22) | Certificate of Amendment of the Amended and Restated Bylaws of the Registrant effective as of April 29, 2015 | |
| 4.1 | (1) | Specimen Common Stock Certificate | |
| 4.2 | (1) | Amended and Restated Registration Rights Agreement, dated as of May 20, 1998, by and among the Registrant and certain stockholders of the Registrant | |
| 4.3 | (3) | Preferred Stock Rights Agreement, dated August 21, 2001, between the Registrant and EquiServe Trust Company, N.A., including the Certificate of Designation, the form of Rights Certificate and Summary of Rights attached thereto as Exhibits A, B and C, respectively | |
| 4.4 | (6) | Amendment to Preferred Stock Rights Agreement, dated August 21, 2001, between the Registrant and EquiServe Trust Company, N.A., effective June 7, 2004 | |
| 10.1 | *(1) | Form of Indemnification Agreement between the Registrant and each of its directors and officers | |
| 10.2 | *(1) | 2000 Stock Plan and form of option agreement | |
| 10.3 | *(1) | 2000 Employee Stock Purchase Plan and form of subscription agreement | |
| 10.4 | *(1) | 2000 Director Stock Option Plan and form of option agreement | |
| 10.7 | (2) | Agreement on Construction of Complete Municipal Facilities, Shanghai Songjiang Export Processing Zone between OmniView Technology International Ltd. and Shanghai Songjiang Export Processing Zone Administrative Committee dated December 28, 2000 | |
133
| Exhibit Number |
Description | ||
|---|---|---|---|
| 10.8 | (2) | Shanghai Songjiang Export Processing Zone Administrative Committee Official Reply to the Feasibility Study Report and Articles of Association of Foreign Solely-funded Omni View Electronics (Shanghai) Co., Ltd. dated December 19, 2000 | |
| 10.9 | (2) | Contract on the Transfer of Shanghai State-owned Land Use Right between OmniView Technology International Ltd. and Shanghai Songjiang District Building and Land Administrative Bureau dated December 28, 2000 | |
| 10.11 | *(7) | Executive Officer Profit Sharing/Bonus Plan | |
| 10.12 | (9) | Amended and Restated Shareholders' Agreement dated August 12, 2005, by and between the Registrant, Taiwan Semiconductor Manufacturing Company Limited and certain other parties | |
| 10.15 | (12) | Land-Use-Right Purchase Agreement by and between the Registrant and the Construction and Transportation Commission of the Pudong New District, Shanghai, dated December 31, 2006 | |
| 10.16 | (12) | First Amendment to the Amended and Restated Shareholders' Agreement by and between the Registrant and Taiwan Semiconductor Manufacturing Company Limited dated December 31, 2006 | |
| 10.18 | (13) | Loan and Security Agreement by and between the Registrant and Citibank, N.A., dated March 16, 2007 | |
| 10.18.1 | (16) | First Amendment to Loan and Security Agreement dated March 16, 2007, by and between the Registrant and Citibank, N.A., dated October 31, 2008 | |
| 10.18.2 | (20) | Second Amendment to Loan and Security Agreement dated April 11, 2012, by and between the Registrant and Citibank, N.A., dated October 31, 2008 | |
| 10.19 | (13) | Deed of Trust, Assignment of Rents and Leases, Security Agreement and Fixture Filing made as of March 20, 2007 by the Registrant, as trustor, to First American Title Insurance Company, as trustee, for the benefit of Citibank, N.A., as beneficiary | |
| 10.20 | (13) | Stock Pledge Agreement entered into as of March 16, 2007 by the Registrant, as pledgor, in favor of Citibank, N.A., as secured party | |
| 10.21 | (13) | Promissory Note Secured by Deed of Trust (Term Loan) issued by the Registrant to Citibank, N.A., dated March 16, 2007 | |
| 10.22 | (13) | Promissory Note Secured by Deed of Trust (Mortgage Loan) by the Registrant to Citibank, N.A., dated March 16, 2007 | |
| 10.23 | (13) | Investment Agreement by and between the OmniVision Trading (Hong Kong) Company Limited and China WLCSP Limited, dated April 6, 2007 | |
| 10.24 | (13) | Equity Interests Transfer Agreement by and among OmniVision Trading (Hong Kong) Company Limited, China WLCSP Limited and Infinity-CSVC Venture Capital Enterprise, dated April 6, 2007 | |
| 10.25 | (13) | Letter Agreement by and between the Registrant and Citibank, N.A., dated March 20, 2007 | |
| 10.26 | *(18) | 2007 Equity Incentive Plan (as amended on July 29, 2013) | |
| 10.27 | *(14) | Form of Non-Employee Director Stock Option Agreement | |
134
| Exhibit Number |
Description | ||
|---|---|---|---|
| 10.28 | *(14) | Form of Employee/Consultant Stock Option Agreement | |
| 10.29 | *(15) | Form of Restricted Stock Unit Agreement (Global) under the 2007 Equity Incentive Plan | |
| 10.30 | *(15) | Form of Restricted Stock Unit Agreement (Net Issuance) under the 2007 Equity Incentive Plan | |
| 10.31 | *(15) | Form of Restricted Stock Unit Agreement (China) and Addenda for certain other foreign jurisdictions under the 2007 Equity Incentive Plan | |
| 10.32 | *(15) | Form of Performance Shares Agreement under the 2007 Equity Incentive Plan | |
| 10.33 | (17) | Fixed Assets Loan Agreement dated August 27, 2009, by and between OmniVision Technologies (Shanghai) Co., Ltd., a wholly owned subsidiary of the Registrant, and Industrial and Commercial Bank of China Ltd. | |
| 10.34 | (17) | Mortgage Agreement dated August 27, 2009, by and between OmniVision Technologies (Shanghai) Co., a wholly owned subsidiary of the Registrant, and Industrial and Commercial Bank of China Ltd. | |
| 10.35 | *(18) | 2009 Employee Stock Purchase Plan (as amended on July 29, 2013) | |
| 21.1 | Subsidiaries of the Registrant | ||
| 23.1 | Consent of PricewaterhouseCoopers LLP, Independent Registered Public Accounting Firm | ||
| 23.2 | Consent of Deloitte & Touche, Independent Auditors of VisEra Holding Company and Subsidiary | ||
| 24.1 | Power of Attorney (included on page 139) | ||
| 31.1 | Certification of Chief Executive Officer pursuant to Section 302 of Sarbanes-Oxley Act of 2002 | ||
| 31.2 | Certification of Chief Financial Officer pursuant to Section 302 of Sarbanes-Oxley Act of 2002 | ||
| 32 | Certification of Chief Executive Officer and Chief Financial Officer pursuant to 18 U.S.C. Section 1350, as adopted pursuant to Section 906 of Sarbanes-Oxley Act of 2002 | ||
| 99.1 | Audited Financial Statements of VisEra Holding Company and Subsidiary as of December 31, 2014 and 2013 and for the years ended December 31, 2014, 2013 and 2012 | ||
| 101.INS | XBRL Instance Document | ||
| 101.SCH | XBRL Taxonomy Extension Schema Document | ||
| 101.CAL | XBRL Taxonomy Extension Calculation Linkbase Document | ||
| 101.DEF | XBRL Taxonomy Extension Definition Linkbase Document | ||
| 101.LAB | XBRL Taxonomy Extension Label Linkbase Document | ||
| 101.PRE | XBRL Taxonomy Extension Presentation Linkbase Document | ||
- *
- Indicates a management contract or compensatory plan or arrangement.
135
- +
- Schedules,
exhibits and similar attachments to this exhibit have been omitted pursuant to Item 601(b)(2) of Regulation S-K. The registrant will
furnish supplementally a copy of any omitted schedule, exhibit or similar attachment to the Securities and Exchange Commission upon its request.
- (1)
- Incorporated
by reference to exhibits filed with Registrant's Registration Statement on Form S-1 (File No. 333-31926) as declared effective by
the Securities and Exchange Commission on July 13, 2000.
- (2)
- Incorporated
by reference to exhibits filed with Registrant's Quarterly Report on Form 10-Q for the quarter ended January 31, 2001.
- (3)
- Incorporated
by reference to exhibits filed with Registrant's Registration Statement on Form 8-A (Reg. No. 000-29939) as declared effective by
the Securities and Exchange Commission on September 12, 2001.
- (4)
- Intentionally
omitted.
- (5)
- Intentionally
omitted.
- (6)
- Incorporated
by reference to exhibits filed with Registrant's Quarterly Report on Form 10-Q for the quarter ended July 31, 2004.
- (7)
- Incorporated
by reference to exhibits filed with Registrant's Current Report on Form 8-K filed with the Securities and Exchange Commission on
March 31, 2005.
- (8)
- Intentionally
omitted.
- (9)
- Incorporated
by reference to an exhibit filed with Registrant's Quarterly Report on Form 10-Q for the quarter ended July 31, 2005.
- (10)
- Intentionally
omitted.
- (11)
- Intentionally
omitted.
- (12)
- Incorporated
by reference to exhibits filed with Registrant's Quarterly Report on Form 10-Q for the quarter ended January 31, 2007.
- (13)
- Incorporated
by reference to exhibits filed with Registrant's Annual Report on Form 10-K for the fiscal year ended April 30, 2007.
- (14)
- Incorporated
by reference to exhibits filed with Registrant's Current Report on Form 8-K filed with the Securities and Exchange Commission on
November 30, 2007.
- (15)
- Incorporated
by reference to exhibits filed with Registrant's Annual Report on Form 10-K for the fiscal year ended April 30, 2008.
- (16)
- Incorporated
by reference to exhibits filed with Registrant's Quarterly Report on Form 10-Q for the quarter ended October 31, 2008.
- (17)
- Incorporated
by reference to exhibits filed with Registrant's Quarterly Report on Form 10-Q for the quarter ended July 31, 2009.
- (18)
- Incorporated
by reference to exhibits filed with Registrant's Current Report on Form 8-K filed with the Securities and Exchange Commission on
October 2, 2013.
- (19)
- Incorporated
by reference to exhibits filed with Registrant's Quarterly Report on Form 10-Q for the quarter ended January 31, 2012.
- (20)
- Incorporated by reference to exhibits filed with Registrant's Annual Report on Form 10-K for the fiscal year ended April 30, 2012.
136
- (21)
- Incorporated
by reference to an exhibit filed with Registrant's Current Report on Form 8-K filed with the Securities and Exchange Commission on
April 30, 2015.
- (22)
- Incorporated by reference to an exhibit filed with Registrant's Current Report on Form 8-K filed with the Securities and Exchange Commission on April 30, 2015.
137
OMNIVISION TECHNOLOGIES, INC.
VALUATION AND QUALIFYING ACCOUNTS
For the Years Ended April 30, 2015, 2014 and 2013
(In thousands)
Description
|
Balance at Beginning of Year |
Additions and Charges to Expenses |
Write-offs and Deductions |
Balance at End of Year |
|||||||||
|---|---|---|---|---|---|---|---|---|---|---|---|---|---|
Allowance for doubtful accounts: |
|||||||||||||
Fiscal year ended April 30, 2015 |
$ | 998 | $ | 159 | $ | 233 | $ | 924 | |||||
| | | | | | | | | | | | | | |
| | | | | | | | | | | | | | |
| | | | | | | | | | | | | | |
Fiscal year ended April 30, 2014 |
$ | 945 | $ | 53 | $ | — | $ | 998 | |||||
| | | | | | | | | | | | | | |
| | | | | | | | | | | | | | |
| | | | | | | | | | | | | | |
Fiscal year ended April 30, 2013 |
$ | 555 | $ | 390 | $ | — | $ | 945 | |||||
| | | | | | | | | | | | | | |
| | | | | | | | | | | | | | |
| | | | | | | | | | | | | | |
Deferred tax valuation allowance: |
|||||||||||||
Fiscal year ended April 30, 2015 |
$ | 17,326 | $ | 2,712 | $ | 5,110 | $ | 14,928 | |||||
| | | | | | | | | | | | | | |
| | | | | | | | | | | | | | |
| | | | | | | | | | | | | | |
Fiscal year ended April 30, 2014 |
$ | 12,116 | $ | 5,210 | $ | — | $ | 17,326 | |||||
| | | | | | | | | | | | | | |
| | | | | | | | | | | | | | |
| | | | | | | | | | | | | | |
Fiscal year ended April 30, 2013 |
$ | 10,419 | $ | 1,697 | $ | — | $ | 12,116 | |||||
| | | | | | | | | | | | | | |
| | | | | | | | | | | | | | |
| | | | | | | | | | | | | | |
Allowance for sales returns: |
|||||||||||||
Fiscal year ended April 30, 2015 |
$ | 3,106 | $ | — | $ | 1,151 | $ | 1,955 | |||||
| | | | | | | | | | | | | | |
| | | | | | | | | | | | | | |
| | | | | | | | | | | | | | |
Fiscal year ended April 30, 2014 |
$ | 5,371 | $ | — | $ | 2,265 | $ | 3,106 | |||||
| | | | | | | | | | | | | | |
| | | | | | | | | | | | | | |
| | | | | | | | | | | | | | |
Fiscal year ended April 30, 2013 |
$ | 2,489 | $ | 10,327 | $ | 7,445 | $ | 5,371 | |||||
| | | | | | | | | | | | | | |
| | | | | | | | | | | | | | |
| | | | | | | | | | | | | | |
138
Pursuant to the requirements of Section 13 or 15(d) of the Securities Exchange Act of 1934, the Registrant has duly caused this Report to be signed on its behalf by the undersigned, thereunto duly authorized.
|
OMNIVISION TECHNOLOGIES, INC. | |||
|
By: |
/s/ SHAW HONG Shaw Hong Chief Executive Officer |
||
Date: June 29, 2015
KNOW ALL PERSONS BY THESE PRESENTS, that each person whose signature appears below constitutes and appoints Shaw Hong and Anson Chan, and each of them, his true and lawful attorneys-in-fact and agents, with full power of substitution and resubstitution, to sign any and all amendments (including post-effective amendments) to this Annual Report on Form 10-K and to file the same, with all exhibits thereto and other documents in connection therewith, with the Securities and Exchange Commission, granting unto each of said attorneys-in-fact and agents, full power and authority to do and perform each and every act and thing requisite and necessary to be done in connection therewith, as fully to all intents and purposes as he or she might or could do in person, hereby ratifying and confirming all that each of said attorneys-in-facts and agents, or his substitute or substitutes, or any of them, shall do or cause to be done by virtue hereof.
Pursuant to the requirements of the Securities Exchange Act of 1934, as amended, this Report has been signed below by the following persons on behalf of the Registrant and in the capacities and on the dates indicated:
Signature
|
Title
|
Date
|
||
|---|---|---|---|---|
| /s/ SHAW HONG Shaw Hong |
Chief Executive Officer and Director (Principal Executive Officer) | June 29, 2015 | ||
/s/ ANSON CHAN Anson Chan |
Chief Financial Officer (Principal Financial and Accounting Officer) |
June 29, 2015 |
||
/s/ HENRY YANG Henry Yang |
Chief Operating Officer and Director |
June 29, 2015 |
||
/s/ WEN-LIANG WILLIAM HSU William Hsu |
Director |
June 29, 2015 |
||
/s/ JOSEPH JENG Joseph Jeng |
Director |
June 29, 2015 |
||
/s/ DWIGHT STEFFENSEN Dwight Steffensen |
Director |
June 29, 2015 |
139
| Exhibit Number |
Description | ||
|---|---|---|---|
| 2.1 | +(20) | Patent Assignment Agreement dated March 30, 2011 between the Registrant and Eastman Kodak Company | |
| 2.2 | +(21) | Agreement and Plan of Merger, dated as of April 30, 2015, by and among Seagull International Limited, Seagull Acquisition Corporation, and OmniVision Technologies, Inc. | |
| 3.1 | (1) | Restated Certificate of Incorporation | |
| 3.2 | (19) | Bylaws of the Registrant as amended November 27, 2007 and November 21, 2011 | |
| 3.2.1 | (22) | Certificate of Amendment of the Amended and Restated Bylaws of the Registrant effective as of April 29, 2015 | |
| 4.1 | (1) | Specimen Common Stock Certificate | |
| 4.2 | (1) | Amended and Restated Registration Rights Agreement, dated as of May 20, 1998, by and among the Registrant and certain stockholders of the Registrant | |
| 4.3 | (3) | Preferred Stock Rights Agreement, dated August 21, 2001, between the Registrant and Equiserve Trust Company, N.A., including the Certificate of Designation, the form of Rights Certificate and Summary of Rights attached thereto as Exhibits A, B and C, respectively | |
| 4.4 | (6) | Amendment to Preferred Stock Rights Agreement, dated August 21, 2001, between the Registrant and EquiServe Trust Company, N.A., effective June 7, 2004 | |
| 10.1 | *(1) | Form of Indemnification Agreement between the Registrant and each of its directors and officers | |
| 10.2 | *(1) | 2000 Stock Plan and form of option agreement | |
| 10.3 | *(1) | 2000 Employee Stock Purchase Plan and form of subscription agreement | |
| 10.4 | *(1) | 2000 Director Stock Option Plan and form of option agreement | |
| 10.7 | (2) | Agreement on Construction of Complete Municipal Facilities, Shanghai Songjiang Export Processing Zone between OmniView Technology International Ltd. and Shanghai Songjiang Export Processing Zone Administrative Committee dated December 28, 2000 | |
| 10.8 | (2) | Shanghai Songjiang Export Processing Zone Administrative Committee Official Reply to the Feasibility Study Report and Articles of Association of Foreign Solely-funded Omni View Electronics (Shanghai) Co., Ltd. dated December 19, 2000 | |
| 10.9 | (2) | Contract on the Transfer of Shanghai State-owned Land Use Right between OmniView Technology International Ltd. and Shanghai Songjiang District Building and Land Administrative Bureau dated December 28, 2000 | |
| 10.11 | *(7) | Executive Officer Profit Sharing/Bonus Plan | |
| 10.12 | (9) | Amended and Restated Shareholders' Agreement dated August 12, 2005, by and between the Registrant, Taiwan Semiconductor Manufacturing Company Limited and certain other parties | |
| 10.15 | (12) | Land-Use-Right Purchase Agreement by and between the Registrant and the Construction and Transportation Commission of the Pudong New District, Shanghai, dated December 31, 2006 | |
| Exhibit Number |
Description | ||
|---|---|---|---|
| 10.16 | (12) | First Amendment to the Amended and Restated Shareholders' Agreement by and between the Registrant and Taiwan Semiconductor Manufacturing Company Limited dated December 31, 2006 | |
| 10.18 | (13) | Loan and Security Agreement by and between the Registrant and Citibank, N.A., dated March 16, 2007 | |
| 10.18.1 | (16) | First Amendment to Loan and Security Agreement dated March 16, 2007, by and between the Registrant and Citibank, N.A., dated October 31, 2008 | |
| 10.18.2 | (20) | Second Amendment to Loan and Security Agreement dated April 11, 2012, by and between the Registrant and Citibank, N.A., dated October 31, 2008 | |
| 10.19 | (13) | Deed of Trust, Assignment of Rents and Leases, Security Agreement and Fixture Filing made as of March 20, 2007 by the Registrant, as trustor, to First American Title Insurance Company, as trustee, for the benefit of Citibank, N.A., as beneficiary | |
| 10.20 | (13) | Stock Pledge Agreement entered into as of March 16, 2007 by the Registrant, as pledgor, in favor of Citibank, N.A., as secured party | |
| 10.21 | (13) | Promissory Note Secured by Deed of Trust (Term Loan) issued by the Registrant to Citibank, N.A., dated March 16, 2007 | |
| 10.22 | (13) | Promissory Note Secured by Deed of Trust (Mortgage Loan) by the Registrant to Citibank, N.A., dated March 16, 2007 | |
| 10.23 | (13) | Investment Agreement by and between the OmniVision Trading (Hong Kong) Company Limited and China WLCSP Limited, dated April 6, 2007 | |
| 10.24 | (13) | Equity Interests Transfer Agreement by and among OmniVision Trading (Hong Kong) Company Limited, China WLCSP Limited and Infinity-CSVC Venture Capital Enterprise, dated April 6, 2007 | |
| 10.25 | (13) | Letter Agreement by and between the Registrant and Citibank, N.A., dated March 20, 2007 | |
| 10.26 | *(18) | 2007 Equity Incentive Plan (as amended on July 29, 2013) | |
| 10.27 | *(14) | Form of Non-Employee Director Stock Option Agreement | |
| 10.28 | *(14) | Form of Employee/Consultant Stock Option Agreement | |
| 10.29 | *(15) | Form of Restricted Stock Unit Agreement (Global) under the 2007 Equity Incentive Plan | |
| 10.30 | *(15) | Form of Restricted Stock Unit Agreement (Net Issuance) under the 2007 Equity Incentive Plan | |
| 10.31 | *(15) | Form of Restricted Stock Unit Agreement (China) and Addenda for certain other foreign jurisdictions under the 2007 Equity Incentive Plan | |
| 10.32 | *(15) | Form of Performance Shares Agreement under the 2007 Equity Incentive Plan | |
| 10.33 | (17) | Fixed Assets Loan Agreement dated August 27, 2009, by and between OmniVision Technologies (Shanghai) Co., Ltd., a wholly owned subsidiary of the Registrant, and Industrial and Commercial Bank of China Ltd. | |
| 10.34 | (17) | Mortgage Agreement dated August 27, 2009, by and between OmniVision Technologies (Shanghai) Co., a wholly owned subsidiary of the Registrant, and Industrial and Commercial Bank of China Ltd. | |
| 10.35 | *(18) | 2009 Employee Stock Purchase Plan (as amended on July 29, 2013) | |
| Exhibit Number |
Description | ||
|---|---|---|---|
| 21.1 | Subsidiaries of the Registrant | ||
| 23.1 | Consent of PricewaterhouseCoopers LLP, Independent Registered Public Accounting Firm | ||
| 23.2 | Consent of Deloitte & Touche, Independent Auditors of VisEra Holding Company and Subsidiary | ||
| 24.1 | Power of Attorney (included on page 139) | ||
| 31.1 | Certification of Chief Executive Officer pursuant to Section 302 of Sarbanes-Oxley Act of 2002 | ||
| 31.2 | Certification of Chief Financial Officer pursuant to Section 302 of Sarbanes-Oxley Act of 2002 | ||
| 32 | Certification of Chief Executive Officer and Chief Financial Officer pursuant to 18 U.S.C. Section 1350, as adopted pursuant to Section 906 of Sarbanes-Oxley Act of 2002 | ||
| 99.1 | Audited Financial Statements of VisEra Holding Company and Subsidiary as of December 31, 2014 and 2013 and for the years ended December 31, 2014, 2013 and 2012 | ||
| 101.INS | XBRL Instance Document | ||
| 101.SCH | XBRL Taxonomy Extension Schema Document | ||
| 101.CAL | XBRL Taxonomy Extension Calculation Linkbase Document | ||
| 101.DEF | XBRL Taxonomy Extension Definition Linkbase Document | ||
| 101.LAB | XBRL Taxonomy Extension Label Linkbase Document | ||
| 101.PRE | XBRL Taxonomy Extension Presentation Linkbase Document | ||
- *
- Indicates
a management contract or compensatory plan or arrangement.
- +
- Schedules,
exhibits and similar attachments to this exhibit have been omitted pursuant to Item 601(b)(2) of Regulation S-K. The registrant will
furnish supplementally a copy of any omitted schedule, exhibit or similar attachment to the Securities and Exchange Commission upon its request.
- (1)
- Incorporated
by reference to exhibits filed with Registrant's Registration Statement on Form S-1 (File No. 333-31926) as declared effective by
the Securities and Exchange Commission on July 13, 2000.
- (2)
- Incorporated
by reference to exhibits filed with Registrant's Quarterly Report on Form 10-Q for the quarter ended January 31, 2001.
- (3)
- Incorporated
by reference to exhibits filed with Registrant's Registration Statement on Form 8-A (Reg. No. 000-29939) as declared effective by
the Securities and Exchange Commission on September 12, 2001.
- (4)
- Intentionally
omitted.
- (5)
- Intentionally
omitted.
- (6)
- Incorporated
by reference to exhibits filed with Registrant's Quarterly Report on Form 10-Q for the quarter ended July 31, 2004.
- (7)
- Incorporated by reference to exhibits filed with Registrant's Current Report on Form 8-K filed with the Securities and Exchange Commission on March 31, 2005.
- (8)
- Intentionally
omitted.
- (9)
- Incorporated
by reference to an exhibit filed with Registrant's Quarterly Report on Form 10-Q for the quarter ended July 31, 2005.
- (10)
- Intentionally
omitted.
- (11)
- Intentionally
omitted.
- (12)
- Incorporated
by reference to exhibits filed with Registrant's Quarterly Report on Form 10-Q for the quarter ended January 31, 2007.
- (13)
- Incorporated
by reference to exhibits filed with Registrant's Annual Report on Form 10-K for the fiscal year ended April 30, 2007.
- (14)
- Incorporated
by reference to exhibits filed with Registrant's Current Report on Form 8-K filed with the Securities and Exchange Commission on
November 30, 2007.
- (15)
- Incorporated
by reference to exhibits filed with Registrant's Annual Report on Form 10-K for the fiscal year ended April 30, 2008.
- (16)
- Incorporated
by reference to exhibits filed with Registrant's Quarterly Report on Form 10-Q for the quarter ended October 31, 2008.
- (17)
- Incorporated
by reference to exhibits filed with Registrant's Quarterly Report on Form 10-Q for the quarter ended July 31, 2009.
- (18)
- Incorporated
by reference to exhibits filed with Registrant's Current Report on Form 8-K filed with the Securities and Exchange Commission on
October 2, 2013.
- (19)
- Incorporated
by reference to exhibits filed with Registrant's Quarterly Report on Form 10-Q for the quarter ended January 31, 2012.
- (20)
- Incorporated
by reference to exhibits filed with Registrant's Annual Report on Form 10-K for the fiscal year ended April 30, 2012.
- (21)
- Incorporated
by reference to an exhibit filed with Registrant's Current Report on Form 8-K filed with the Securities and Exchange Commission on
April 30, 2015.
- (22)
- Incorporated by reference to an exhibit filed with Registrant's Current Report on Form 8-K filed with the Securities and Exchange Commission on April 30, 2015.