Attached files
| file | filename |
|---|---|
| 8-K - SWISS HELVETIA FUND, INC. | p15-0242_8k.htm |

Portfolio and Performance Review
The Swiss Helvetia Fund, Inc.
The Swiss Helvetia Fund, Inc.
Date: June 25, 2015
|
Stefan Frischknecht, CFA
|
Fund Manager
|

Agenda
Source: Schroders
n Case for Swiss equities
n Performance
n Portfolio positioning
n Outlook
n Conclusion
n Q & A
n Appendix
1

Switzerland leading in global competitiveness
Top position maintained for several consecutive years
2
Source: World Economic Forum, Global Competitiveness Report 2014-15; report includes rankings for 144 economies.

Swiss stocks also leading in global competitiveness
Very high percentage of Swiss index members are global leaders
Source: Schroders
3
|
Name
|
Global rank
within market |
Market
|
|
Nestle
|
1
|
Food
|
|
Novartis
|
2
|
Drugs
|
|
Roche
|
1
|
Diagnostics
|
|
UBS
|
1
|
Wealth management
|
|
ABB
|
2
|
Power transmission / distribution
|
|
Richemont
|
1
|
Jewelry
|
|
Syngenta
|
1
|
Crop protection
|
|
Swiss Re
|
2
|
Reinsurance
|
|
LafargeHolcim
|
1
|
Cement
|
|
Givaudan
|
1
|
Flavours / fragrance
|
|
Adecco
|
1
|
Staffing
|
|
Swatch
|
1
|
Watches
|
|
SGS
|
1
|
Inspection / testing
|
|
Transocean
|
1
|
Ocean drilling rigs
|
70% of blue chip stocks on the Swiss Market
Index (“SMI”) are ranked first or second within
their markets on a global basis
Index (“SMI”) are ranked first or second within
their markets on a global basis
Approx. 40% of Swiss mid caps, too

Global leadership in profit margins
4
Source: Schroders, Bloomberg, December 31, 2014
Thanks in large part to top market positions, Swiss profit margins are high
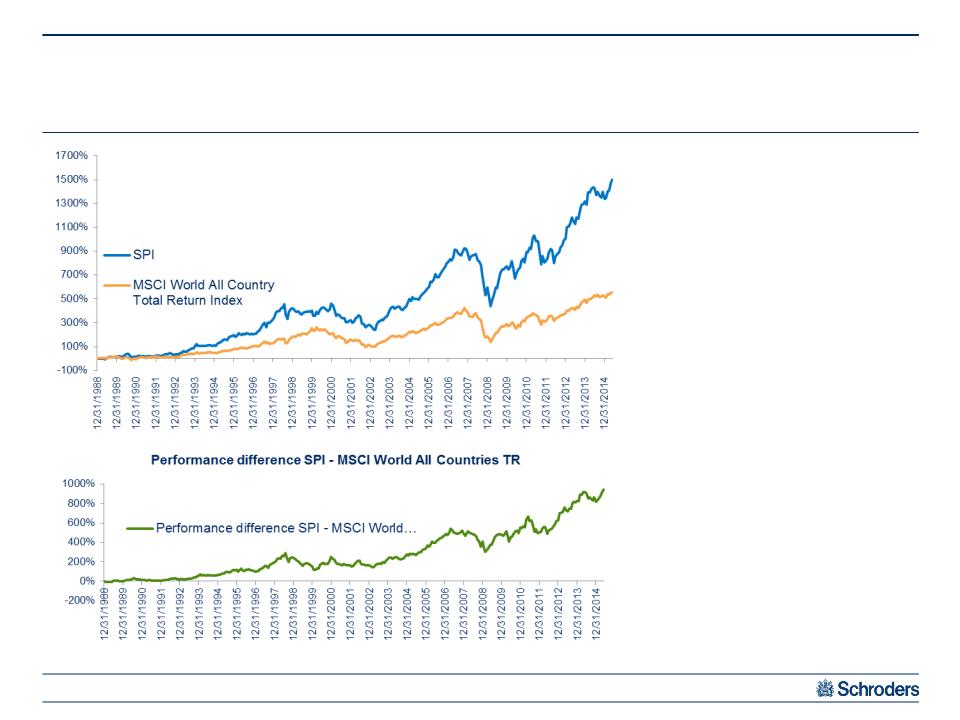
Swiss equities have an outstanding track record
5
Source: Bloomberg, performance in USD, May 31, 2015
Performance difference: 3.7%
p.a.
p.a.
Swiss Equities: 11.1 % p.a. in
USD
USD
MSCI World All Country
Total Return Index: 7.4% p.a.
in USD
Total Return Index: 7.4% p.a.
in USD
Swiss stocks significantly outperformed global stocks over past approx. 25 years

Other factors that help explain outperformance
6
n Low taxes
n Low interest rates
n Low debt / GDP ratio
n Stable political system
n Highly skilled labour force
n Leadership in innovation (highest density of patents per capita)*
Source: Schroders,
* Innovation Union Scoreboard 2011 (EU)
* Innovation Union Scoreboard 2011 (EU)
Apart from global leadership, Swiss domiciled companies benefit from:

Performance
For Q1 2015 and ytd 2015

Net Asset Value
Performance
8
NAV and price performance in USD
|
Performance in USD %
|
H2 2014
|
YTD 2015
|
Since July 1,
2014 |
|
NAV (US GAAP) as per quarterly filings
|
-7.78
|
10.95
|
2.32
|
|
SWZ NAV as published*
|
-7.43
|
10.61
|
2.39
|
|
Swiss Performance Index, SPI
|
-6.06
|
11.16
|
4.43
|
|
Difference NAV as per quarterly filings
|
-1.72
|
-0.21
|
-2.11
|
Source: Schroders, Citi for fund performance and Bloomberg for Index performance; year-to-date performance as at May 31, 2015
|
Performance in USD %
|
H2 2014
|
YTD 2015
|
Since July 1,
2014 |
|
Share price SWZ
|
-8.91
|
10.32
|
0.49
|
|
Swiss Performance Index, SPI
|
-6.06
|
11.16
|
4.43
|
|
Difference
|
-2.85
|
-0.84
|
-3.94
|
Share price
* published e.g., on Bloomberg
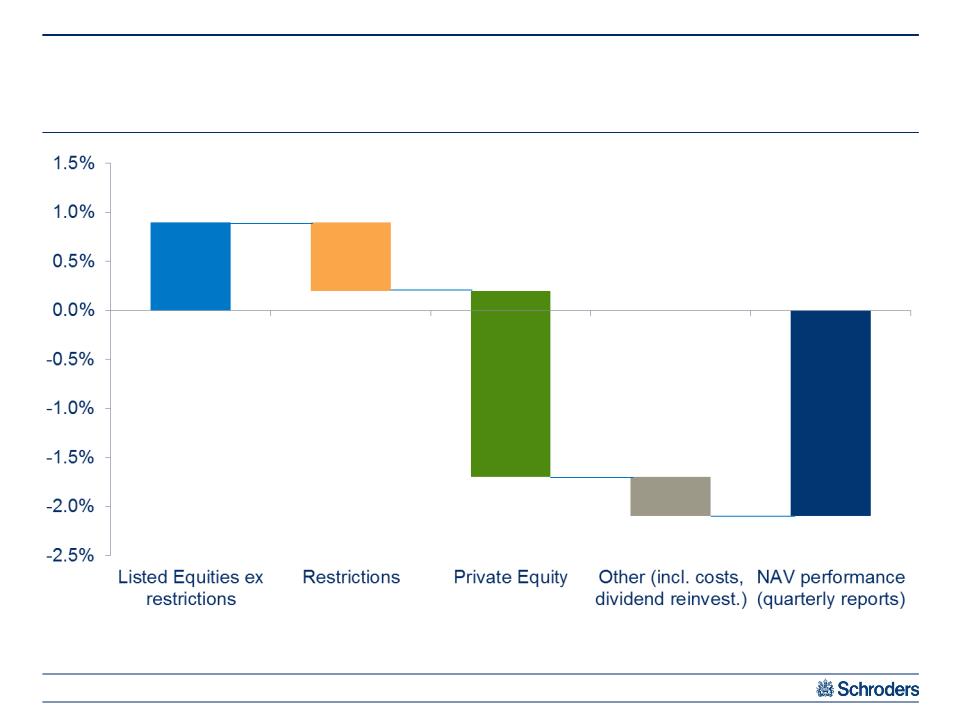
Approximate performance components:
Since take-over (July 1, 2014 - May 31, 2015)
9
Source: Schroders, Citi for Fund performance and Bloomberg for Index performance
0.9%
-0.7%
-1.9%
-0.4%
-2.1%

Portfolio
positioning
positioning

Portfolio positioning
ICB classification
11
Source: Schroders, Citi, Bloomberg, May 31, 2015

Top Ten holdings absolute
Portfolio positioning
As per 31 May 2015
12
Source: Schroders, May 31, 2015
|
Name
|
Absolute weight
|
|
Novartis
|
14.60%
|
|
Roche
|
11.94%
|
|
Nestlé
|
11.61%
|
|
Lindt & Sprüngli
|
4.61%
|
|
Syngenta
|
3.64%
|
|
Burckhardt Compression
|
3.09%
|
|
UBS
|
2.87%
|
|
Richemont, Cie. Fin
|
2.62%
|
|
Swatch (Registered)
|
2.55%
|
|
Credit Suisse
|
2.55%
|
|
Total
|
60.08%
|
Top relative weights
|
Name
|
Relative weight
|
|
Lindt & Sprüngli
|
+3.8%
|
|
Burckhardt Compression
|
+2.8%
|
|
Tecan
|
+2.2%
|
|
Swatch (Registered)
|
+2.1%
|
|
Logitech
|
+2.1%
|
|
Zurich Insurance
|
-3.4%
|
|
Roche
|
-3.5%
|
|
ABB
|
-3.6%
|
|
Novartis
|
-5.1%
|
|
Nestlé
|
-6.9%
|
Portfolio characteristics
Portfolio positioning
Moderate value tilt, high balance sheet quality, clear small & mid cap bias
13
Source: Bloomberg consensus estimates, Schroders, May 31, 2015
|
|
Swiss Performance Index
|
Swiss Helvetia Fund
|
|
P/E 2015e
|
19.3x
|
18.3x
|
|
P/E 2016e
|
17.6x
|
16.6x
|
|
P/B
|
4.4x
|
4.3x
|
|
Net debt / equity
|
34.3%
|
14.6%
|
|
Goodwill / equity
|
35.2%
|
29.6%
|
|
Small & Mid Cap wgt
|
15.5%
|
40.1%
|

Risk measures 31.05.2015
Portfolio positioning
Key statistical measures
14
Source: Schroders, Charles River, Prism, May 31, 2015
|
|
Swiss Helvetia Fund
|
|
Tracking error
|
2.7%
|
|
Beta
|
0.90
|
|
Relative VaR (95%)
|
1.3%
|
|
Volatility
|
9.9%
|
|
Active share
|
44.0%
|
Portfolio turnover
|
|
Swiss Helvetia Fund
|
|
Turnover in % of AuM
Q1 2015 |
12%
|
|
Turnover in % of AuM
YTD 2015 |
19%
|
Turnover calculation method: (Buys + Sells) / (average AuM)

Outlook

Investment Outlook
No change
n Stock market valuations have become more expensive
n But equity markets likely to benefit further from attractive / increasing dividends
n We believe that Swiss equities will be among the best performing equity markets long - term
- thanks to its global leaders
- which has over past 10 years led to superior earnings growth (which is likely to persist)
- in spite of strong Swiss franc (CHF overvalued; earnings impact limited to 2015 financial year)
- thanks to its global leaders
- which has over past 10 years led to superior earnings growth (which is likely to persist)
- in spite of strong Swiss franc (CHF overvalued; earnings impact limited to 2015 financial year)
n Simultaneously, investors need to be aware of shorter - term risks / volatility
(due to geopolitics, central banks, economic data, contagion from other asset classes, etc.)
(due to geopolitics, central banks, economic data, contagion from other asset classes, etc.)
16
Source: Schroders. Views expressed are those of the Fund’s portfolio management team

Investment Outlook
Global comparison of dividend yield versus government bond yield
17
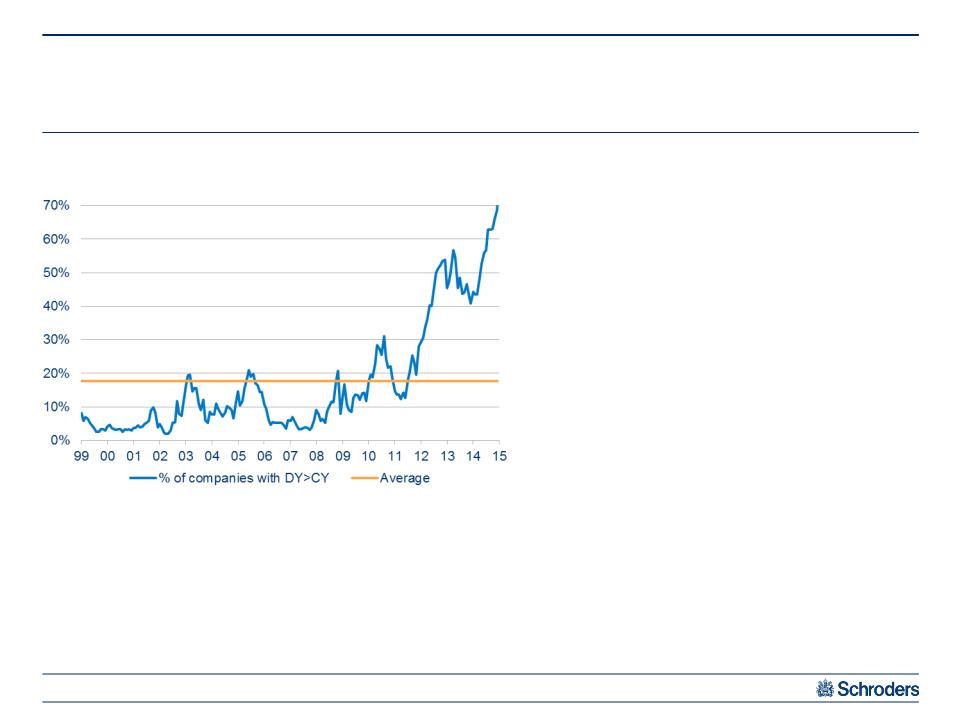
Investment Outlook
18
Source: LHS: Goldman Sachs Global Investment Research, January 2015
% of issuers where dividend yield exceeds corporate bond yield (iBoxx bond index)
n Our view is that equity valuations are not cheap in absolute terms
n However, they should continue to move higher in “search of yield”

Investment Outlook
Global comparison of earnings expecations
19
Source: Bloomberg, May 31, 2015, all earnings converted into US dollars

Real GDP growth (q/q)1
Real GDP since the crisis2
Index 2007 q4 = 100
Index 2007 q4 = 100
Investment Outlook
20
Blue dotted line is average path of real GDP after a non-financial crisis.
Based on IMF Study.
Based on IMF Study.
“Normal”
recovery
recovery

Investment Outlook
Historic development of USDCHF exchange rate
21
Source: Schroders, Bloomberg, May 31, 2015
The decision on January 15,
2015 by the Swiss National
Bank (SNB) to remove the
floor vs the Euro looks like
“business as usual” from
long-term perspective
2015 by the Swiss National
Bank (SNB) to remove the
floor vs the Euro looks like
“business as usual” from
long-term perspective

Conclusion

Conclusion
n Performance: significant negative impact from inherited private equity investments
n Listed stock selection positive, except in first 3 months since take-over
n Positive environment for stock markets as an asset class
n Swiss stock market not cheap (compared to other countries and on absolute basis)
n However, global leadership, superior earnings growth and low bond yields speak for Swiss equities
23
Source: Schroders. Views expressed are those of the Fund’s portfolio management team

Appendix

Swiss Equities
Swiss companies regional sales exposure
25
Source: HSBC, July 3, 2014; *UBS February 10, 2015, Data based on averages
Europe
ex domestic
ex domestic
MEA
Unclassified
APAC
Americas
Domestic
Europe
ex domestic
ex domestic
MEA
Unclassified
APAC
Americas
Domestic
Europe
ex domestic
ex domestic
MEA
Unclassified
APAC
Americas
Domestic
Europe
Unclassified
APAC
Americas
ex US
ex US
Domestic

CV
Stefan Frischknecht, CFA - Head Swiss Equities
nFund manager Swiss Equities
nMember of the Executive Board
nJoined Schroders in 1998
nInvestment experience since 1994
nMaster of Science, University of Bern
nCFA Charterholder
Source: Schroders
26

Important Information
27
This presentation is intended to be for information purposes only and it is not intended as promotional material in any respect. The
material is not intended as an offer or solicitation for the purchase or sale of any financial instrument. The material is not intended to
provide, and should not be relied on for, accounting, legal or tax advice, or investment recommendations. Information herein is
believed to be reliable but Schroder Investment Management North America Inc. does not warrant its completeness or accuracy.
The returns presented represent past performance and are not necessarily representative of future returns, which may vary. The
value of investments can fall as well as rise as a result of market or currency movements.
value of investments can fall as well as rise as a result of market or currency movements.
All investments, domestic and foreign, involve risks, including the risk of possible loss of principal. The market value of a fund’s
portfolio may decline as a result of a number of factors, including adverse economic and market conditions, prospects of stocks in the
portfolio, changing interest rates, and real or perceived adverse competitive industry conditions. Investing overseas involves special
risks including among others risks related to political or economic instability, foreign currency (such as exchange, valuation, and
fluctuation) risk, market entry or exit restrictions, illiquidity, and taxation.
The views and forecasts contained herein are those of the Schroders Swiss Equities team and are subject to change. The
information and opinions contained in this document have been obtained from sources we consider to be reliable. No responsibility
can be accepted for errors of facts obtained from third parties. Reliance should not be placed on the views and information in the
document when taking individual investment and/or strategic decisions.
Schroder Investment Management North America Inc.
875 Third Avenue, New York, NY 10022-6225
(212) 641-3800
www.schroders.com\us