Attached files
| file | filename |
|---|---|
| EX-10.26 - EX-10.26 - W2007 Grace Acquisition I Inc | d933018dex1026.htm |
| EX-32.2 - EX-32.2 - W2007 Grace Acquisition I Inc | d933018dex322.htm |
| EX-21.1 - EX-21.1 - W2007 Grace Acquisition I Inc | d933018dex211.htm |
| EX-32.1 - EX-32.1 - W2007 Grace Acquisition I Inc | d933018dex321.htm |
| EX-31.1 - EX-31.1 - W2007 Grace Acquisition I Inc | d933018dex311.htm |
| EX-31.2 - EX-31.2 - W2007 Grace Acquisition I Inc | d933018dex312.htm |
| EX-10.25 - EX-10.25 - W2007 Grace Acquisition I Inc | d933018dex1025.htm |
| EX-10.24 - EX-10.24 - W2007 Grace Acquisition I Inc | d933018dex1024.htm |
| EX-10.27 - EX-10.27 - W2007 Grace Acquisition I Inc | d933018dex1027.htm |
| EX-10.23 - EX-10.23 - W2007 Grace Acquisition I Inc | d933018dex1023.htm |
| EX-10.28 - EX-10.28 - W2007 Grace Acquisition I Inc | d933018dex1028.htm |
| EX-10.29 - EX-10.29 - W2007 Grace Acquisition I Inc | d933018dex1029.htm |
| EXCEL - IDEA: XBRL DOCUMENT - W2007 Grace Acquisition I Inc | Financial_Report.xls |
UNITED STATES
SECURITIES AND EXCHANGE COMMISSION
Washington, D.C. 20549
FORM 10-K
| x | ANNUAL REPORT PURSUANT TO SECTION 13 OR 15(d) OF THE SECURITIES EXCHANGE ACT OF 1934 |
For the fiscal year ended December 31, 2013
OR
| ¨ | TRANSITION REPORT PURSUANT TO SECTION 13 OR 15(d) OF THE SECURITIES EXCHANGE ACT OF 1934 |
Commission file number 001-12073
W2007 GRACE ACQUISITION I, INC.
(Exact Name of Registrant as Specified in Its Charter)
| Tennessee | 26-1187149 | |
| (State or Other Jurisdiction of Incorporation or Organization) |
(I.R.S. Employer Identification No.) | |
| 6011 Connection Drive Irving, TX |
75039 | |
| (Address of Principal Executive Offices) | (Zip Code) | |
Registrant’s telephone number, including area code: 972-368-2200
Securities registered pursuant to Section 12(b) of the Act: None
Securities registered pursuant to Section 12(g) of the Act: None
Indicate by check mark if the registrant is a well-known seasoned issuer, as defined in Rule 405 of the Securities Act. Yes ¨ No x
Indicate by check mark if the registrant is not required to file reports pursuant to Section 13 or Section 15(d) of the Act. Yes ¨ No x
Indicate by check mark whether the registrant (1) has filed all reports required to be filed by Section 13 or 15(d) of the Securities Exchange Act of 1934 during the preceding 12 months (or for such shorter period that the registrant was required to file such reports), and (2) has been subject to such filing requirements for the past 90 days. Yes ¨ No x
Indicate by check mark whether the registrant has submitted electronically and posted on its corporate Web site, if any, every Interactive Data File required to be submitted and posted pursuant to Rule 405 of Regulation S-T (§232.405 of this chapter) during the preceding 12 months (or for such shorter period that the registrant was required to submit and post such files). Yes ¨ No x
Indicate by check mark if disclosure of delinquent filers pursuant to Item 405 of Regulation S-K is not contained herein, and will not be contained, to the best of registrant’s knowledge, in definitive proxy or information statements incorporated by reference in Part III of this Form 10-K or any amendment to this Form 10-K. x
Indicate by check mark whether the registrant is a large accelerated filer, an accelerated filer, a non-accelerated filer, or a smaller reporting company. See definition of “large accelerated filer,” “accelerated filer” and “smaller reporting company” in Rule 12b-2 of the Exchange Act. (Check one):
| Large Accelerated filer | ¨ | Accelerated filer | ¨ | |||
| Non-Accelerated filer | x (Do not check if a smaller reporting company) | Smaller reporting company | ¨ | |||
Indicate by check mark whether the registrant is a shell company (as defined by Rule 12b-2 of the Act.) Yes ¨ No x
As of June 30, 2014, the aggregate market value of the outstanding common stock held by non-affiliates of the registrant, was $0.
As of June 12, 2015, there were 100 shares of the registrant’s common stock outstanding.
-2-
EXPLANATORY NOTE
Throughout this Form 10-K, the words “Company,” “we,” “our” and “us” refer to W2007 Grace Acquisition I, Inc., a Tennessee corporation, and its consolidated subsidiaries, unless otherwise stated or the context requires otherwise. On February 27, 2015, consolidated subsidiaries of the Company sold all 20 of their hotels and subsidiaries of W2007 Equity Inns Senior Mezz, LLC (Senior Mezz), an entity in which the Company has a 3% equity interest, sold 96 of their 106 hotels to subsidiaries of American Realty Capital Hospitality Trust, Inc. (ARCH). Any references to our hotels or our business or operations for periods from and after February 27, 2015 refer to the 10 hotels that are currently held by Senior Mezz (the Remaining Hotels).
CAUTIONARY STATEMENT ABOUT FORWARD-LOOKING STATEMENTS
Throughout this Form 10-K and documents incorporated herein by reference, we make forward-looking statements within the meaning of the safe harbor provisions of the U.S. Private Securities Litigation Reform Act of 1995. Forward-looking statements are not historical facts, but instead represent only our beliefs regarding future events, many of which, by their nature, are inherently uncertain and outside our control. Such statements are generally accompanied by words such as “may,” “believe,” “estimate,” “project,” “plan,” “intend,” “will,” “anticipate,” “expect” and words of similar import that convey uncertainty as to future events or outcomes. These forward-looking statements include information about possible or assumed future results of our business, financial condition and liquidity, results of operations, plans, and objectives. Statements regarding the following subjects are forward-looking by their nature:
| • | our business and investment strategy; |
| • | our projected operating results; |
| • | completion of any pending transactions; |
| • | our ability to obtain future financing arrangements; |
| • | our understanding of our competition; |
| • | market trends; and |
| • | projected capital expenditures. |
Such forward-looking statements are based on our beliefs, assumptions, and expectations of our future performance taking into account all information currently known to us. These beliefs, assumptions, and expectations can change as a result of many potential events or factors, not all of which are known to us. If a change occurs, our business, financial condition, liquidity, results of operations, plans and other objectives may vary materially from those expressed in our forward-looking statements. Additionally, the following factors could cause actual results to vary from our forward-looking statements:
| • | factors discussed in this Form 10-K, including those set forth under the sections titled “Risk Factors,” “Management’s Discussion and Analysis of Financial Condition and Results of Operations,” “Business” and “Properties;” |
| • | general volatility of the capital markets; |
| • | changes in our business or investment strategy; |
| • | availability, terms and deployment of capital; |
| • | availability of qualified personnel; |
| • | changes in our industry and the market in which we operate, interest rates or the general economy; and |
| • | the degree and nature of our competition. |
You should not place undue reliance on such forward-looking statements. We undertake no obligation and do not intend to publicly update or revise any forward-looking statements to reflect future events or developments, whether as a result of new information, future events or otherwise.
-3-
| ITEM 1. | BUSINESS |
OUR COMPANY
W2007 Grace Acquisition I, Inc., a Tennessee corporation (the Company), was incorporated on June 20, 2007. All of the common stock of the Company is owned by W2007 Grace I, LLC, a Tennessee limited liability company (Grace I). Grace I is owned by W2007 Finance Sub, LLC, a Delaware limited liability company, and Whitehall Parallel Global Real Estate Limited Partnership 2007, a Delaware limited partnership (collectively, Whitehall). The general partner of Whitehall Parallel Global Real Estate Limited Partnership 2007 and the partnerships owning W2007 Finance Sub, LLC is a wholly-owned subsidiary of The Goldman Sachs Group, Inc. (GS Group) and, therefore, is an affiliate of GS Group. GS Group in turn also controls Goldman, Sachs & Co. (GS) and Goldman Sachs Mortgage Company (GSMC). Consequently, GS and GSMC are also affiliates of Whitehall.
Grace I, the Company, Equity Inns, Inc. (Equity Inns), Grace II, L.P. (Grace II) and Equity Inns Partnership, L.P. (Equity LP) entered into an agreement and plan of merger pursuant to which Equity Inns merged with and into the Company and Grace II merged with and into Equity LP (such transactions collectively, the Merger). The Merger was completed on October 25, 2007. Prior to the Merger, the Company had no operations other than its activities in anticipation of the Merger.
Prior to the Merger, Equity Inns was a public hotel company and had elected to be taxed as a real estate investment trust (REIT) for federal income tax purposes. Equity Inns, through its wholly owned subsidiary, Equity Inns Trust (Equity Trust), was the sole general partner of Equity LP. Prior to the Merger, Equity Inns, Equity Trust and Equity LP (and its wholly owned subsidiaries) collectively owned 137 limited-service hotels located throughout the United States.
Subsequent to the Merger, Grace II changed its name to W2007 Equity Inns Partnership, L.P. (W2007 Equity LP). Since the Merger, Grace I has owned all of the shares of common stock of the Company and the Company has owned a 1% general partnership interest in W2007 Equity LP (with Grace I, our parent, owning a 1% general partnership interest and a 98% limited partnership interest). The Company also owns 100% of W2007 Equity Inns Trust, a Maryland trust (the Trust).
A group of 106 hotels (the OP Hotels) were owned by a series of wholly owned subsidiaries of W2007 Equity LP that were created in connection with financing for the Merger. GSMC acquired an option to purchase (the Purchase Option) a 97% equity interest in one of the Company’s wholly owned subsidiaries that indirectly owns all of the OP Hotels, which Purchase Option has since been acquired by an affiliate of Whitehall. A group of 20 hotels (the Trust Hotels) are owned by various limited partnerships with various corporations as their sole general partners, which corporations were wholly-owned by the Trust. These general partners each own a 1% ownership interest in the respective limited partnerships and W2007 Equity LP owns the remaining 99% ownership interest in the respective limited partnerships.
Following the Merger, the Company and Grace I entered into a Keepwell Agreement, effective as of the date of the Merger (the Keepwell Agreement), pursuant to which Grace I agreed to make such cash payments to the Company as are necessary to enable the Company to satisfy its obligations to the holders of the Company’s 8.75% Series B cumulative preferred stock (the Series B preferred stock) and 9.00% Series C cumulative preferred stock (the Series C preferred stock, and collectively with the Series B preferred stock, the preferred stock) in accordance with the Company’s charter when the Company determines, or is legally compelled, to satisfy such obligations. To date, no payments have been made and none are due under the Keepwell Agreement. The Keepwell Agreement may be terminated by Grace I at any time upon 30 days’ prior written notice. There are no third-party beneficiaries of the Keepwell Agreement.
On March 31, 2008, the Company, pursuant to Section 856(g)(2) of the Internal Revenue Code of 1986, as amended (the Code), revoked its election under Section 856(c)(1) of the Code to be a REIT for the taxable year ending on December 31, 2008. Consequently, subsequent to December 31, 2007, the Company is subject to income taxes at statutory corporate rates.
On April 11, 2014, the subsidiaries of W2007 Equity LP that owned the OP Hotels repaid the Mortgage Loan and the First Mezzanine Loan (each as defined in “Item 13. Certain Relationships and Related Transactions and Director Independence –Transactions with related persons – GE Mortgage loan agreement and Purchase Option”) in full with the proceeds of a $865 million non-recourse mortgage loan (the New Mortgage Loan) and a $111 million non-recourse mezzanine loan (the New Mezzanine Loan), each obtained from German American Capital Corporation (GACC) and secured, directly or indirectly, by the OP Hotels.
-4-
The New Mortgage Loan was componentized, while the New Mezzanine Loan was made pursuant to two separate, pari passu notes. Each of the loans is interest-only for the duration of its term, with a balloon payment of principal due upon maturity. The initial scheduled maturity date of each loan was May 1, 2016, with three one-year extension options available upon the satisfaction of certain conditions, the most restrictive of which is a debt yield test. The second and third extension options, but not the first, required the payment of an extension fee of 0.25% of the outstanding principal amount of the loans.
Under the loan agreements, the borrowers were required to fund and maintain certain reserves with the lender, including reserves for required repairs, taxes, insurance, the completion of franchise agreement capital improvements, the replacement of FF&E and rent payable under ground leases. In addition, under the loan agreements, if the borrowers did not maintain a certain aggregate debt yield, their net operating cash flows would be “trapped.” The loan agreements also specified certain limited uses for the “trapped” cash flows. Similar cash traps were required in an event of default under either of the loan agreements.
In June of 2014, GACC exercised its right under the loan agreements for the new loans to modify their relative principal balances and interest rates, for purposes of marketing and selling the loans. As a result of these modifications, the New Mortgage Loan had a weighted average interest rate of the one-month LIBOR rate, plus 3.1113%, while the New Mezzanine Loan had an interest rate of the one-month LIBOR rate, plus 4.7705%. The weighted average spread over LIBOR for the New Mortgage Loan was based on the principal balances under the New Mortgage Loan as of December 31, 2014. The principal balance and spread over LIBOR for each component of the New Mortgage Loan and each note of the New Mezzanine Loan is set forth below (as of December 31, 2014).
| Component/Note |
Principal Balance | Spread (Over LIBOR) | ||||||
| New Mortgage Loan |
||||||||
| Component A |
$ | 271,878,000 | 0.93270 | % | ||||
| Component B |
$ | 101,421,000 | 1.28270 | % | ||||
| Component C |
$ | 66,000,000 | 1.68270 | % | ||||
| Component D |
$ | 120,769,000 | 4.22678 | % | ||||
| Component E |
$ | 167,658,000 | 5.32678 | % | ||||
| Component F |
$ | 137,274,000 | 5.77678 | % | ||||
| New Mezzanine Loan |
||||||||
| Note A-1 |
$ | 66,600,000 | 4.7705 | % | ||||
| Note A-2 |
$ | 44,400,000 | 4.7705 | % | ||||
At the closing of the refinancing, GSMC acquired a 40% participation interest in each component of the New Mortgage Loan and a 100% participation interest in Note A-2 of the New Mezzanine Loan. In connection with the origination of the New Mortgage Loan and the New Mezzanine Loan, the borrowers thereunder were required to and did pay certain underwriting fees totaling $9.76 million to GACC, 40% of which GACC paid to GSMC in connection with GSMC’s acquisition of the participation interests in the loans.
On June 18, 2014, GACC securitized each of the New Mortgage Loan and the New Mezzanine Loan, and they are now held, respectively, by EQTY 2014-INNS Mortgage Trust and EQTY 2014-MZ Mezzanine Trust. GSMC no longer holds any interest in the loans.
Concurrently with the refinancing of the Mortgage Loan and the First Mezzanine Loan, the Purchase Option was exercised by WNT Holdings, LLC (WNT), an affiliate of Whitehall. As a result, WNT holds a 97% equity interest in W2007 Equity Inns Senior Mezz, LLC (Senior Mezz) who in turn owns a 100% indirect interest in the borrower under the New Mezzanine Loan and the borrowers under the New Mortgage Loan (the owner of the OP Hotels). The remaining 3% equity interest in Senior Mezz is owned indirectly by W2007 Equity LP.
-5-
The diagram below reflects our organizational structure as of December 31, 2013 and prior to the exercise of the Purchase Option and refinancing of the Company’s debt on April 11, 2014. Subsidiary entities have been consolidated to simplify the diagram.
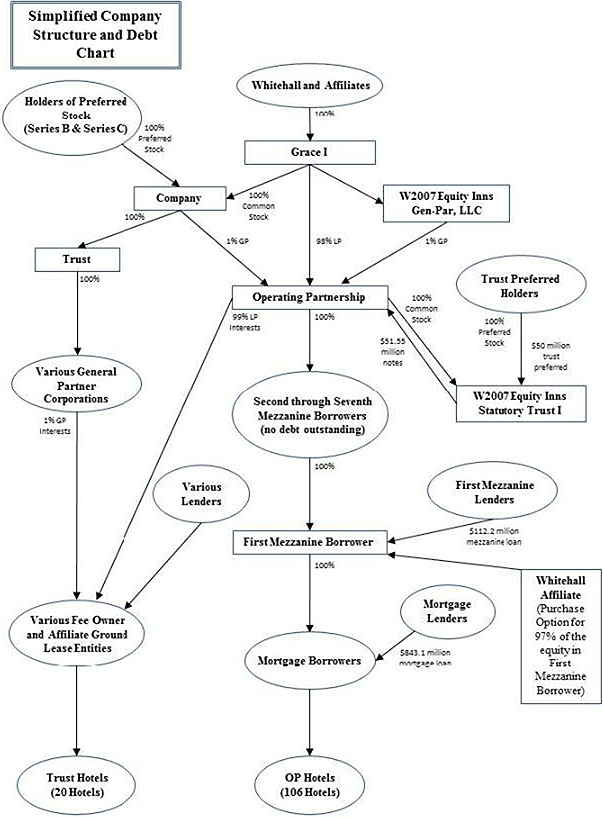
-6-
The diagram below reflects our organizational structure as of December 31, 2014 in light of the exercise of the Purchase Option and the refinancing of the Company’s debt. Subsidiary entities have been consolidated to simplify the diagram.
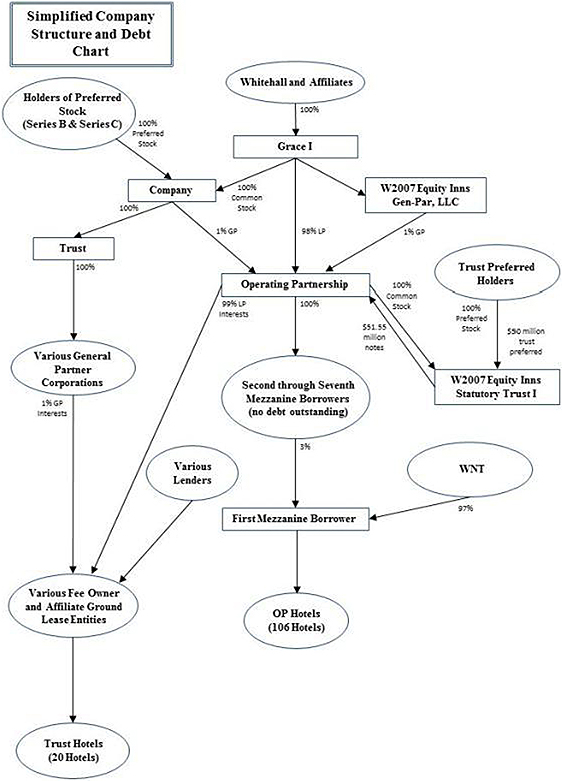
-7-
Sale of Assets
On May 23, 2014, the Company’s subsidiaries owning the 20 Trust Hotels and WNT’s subsidiaries owning the 106 OP Hotels (the Sellers) entered into a real estate sale agreement (the Original Purchase Agreement), which was amended and restated on November 11, 2014 (the Agreement), with subsidiaries of ARCH as purchasers (the Purchasers), pursuant to which the Purchasers agreed to purchase the 116 hotels listed below (the Portfolio) instead of all 126 hotels. The portion of the purchase price allocated to the properties is also listed below.
| Hotel Property |
Location |
Pool | Allocated Purchase Price |
|||||
| Courtyard |
Asheville, NC | Pool I | $ | 17,374,707 | ||||
| Courtyard |
Athens, GA | Pool I | $ | 12,520,081 | ||||
| Courtyard |
Bowling Green, KY | Pool I | $ | 13,903,166 | ||||
| Courtyard |
Carlsbad, CA | Pool II | $ | 22,686,825 | ||||
| Courtyard |
Dallas, TX | Pool I | $ | 26,447,729 | ||||
| Courtyard |
Dalton, GA | Pool II | $ | 10,241,716 | ||||
| Courtyard |
Elmhurst, IL | Pool I | $ | 10,890,288 | ||||
| Courtyard |
Gainesville, FL | Pool I | $ | 17,007,759 | ||||
| Courtyard |
Houston, TX | Pool II | $ | 32,083,929 | ||||
| Courtyard |
Jacksonville, FL | Pool I | $ | 6,606,165 | ||||
| Courtyard |
Knoxville, TN | Pool I | $ | 12,580,307 | ||||
| Courtyard |
Lexington, KY | Pool I | $ | 18,494,208 | ||||
| Courtyard |
Louisville, KY | Pool I | $ | 39,005,197 | ||||
| Courtyard |
Mobile, AL | Pool I | $ | 5,698,889 | ||||
| Courtyard |
Orlando, FL | Pool I | $ | 16,204,908 | ||||
| Courtyard |
Sarasota, FL | Pool I | $ | 11,537,396 | ||||
| Courtyard |
Tallahassee, FL | Pool I | $ | 13,209,349 | ||||
| Embassy Suites |
Orlando, FL | Pool I | $ | 23,802,848 | ||||
| Fairfield Inn & Suites |
Atlanta, GA | Pool I | $ | 8,604,369 | ||||
| Fairfield Inn & Suites |
Dallas, TX | Pool I | $ | 8,539,822 | ||||
| Hampton Inn |
Addison, TX | Pool I | $ | 10,753,205 | ||||
| Hampton Inn |
Albany, NY | Pool I | $ | 22,881,688 | ||||
| Hampton Inn |
Alcoa, TN | Pool II | $ | 7,960,928 | ||||
| Hampton Inn |
Austin, TX | Pool II | $ | 14,790,545 | ||||
| Hampton Inn |
Beckley, WV | Pool I | $ | 19,447,700 | ||||
| Hampton Inn |
Birmingham, AL | Pool I | $ | 9,284,784 | ||||
| Hampton Inn |
Boca Raton, FL | Pool I | $ | 13,994,573 | ||||
| Hampton Inn |
Charleston, SC | Pool I | $ | 8,205,785 | ||||
| Hampton Inn |
Chattanooga, TN | Pool I | $ | 8,350,000 | ||||
| Hampton Inn |
College Station, TX | Pool II | $ | 17,930,338 | ||||
| Hampton Inn |
Colorado Springs, CO | Pool I | $ | 7,308,506 | ||||
| Hampton Inn |
Columbus, GA | Pool I | $ | 5,900,000 | ||||
| Hampton Inn |
Deerfield Beach, FL | Pool I | $ | 12,809,617 | ||||
| Hampton Inn |
Dublin, OH | Pool I | $ | 12,621,596 | ||||
| Hampton Inn |
East Lansing, MI | Pool II | $ | 14,252,046 | ||||
| Hampton Inn |
Fayetteville, NC | Pool I | $ | 8,679,438 | ||||
| Hampton Inn |
Gastonia, NC | Pool I | $ | 11,841,758 | ||||
| Hampton Inn |
Glen Burnie, MD | Pool I | $ | 8,592,309 | ||||
| Hampton Inn |
Grand Rapids, MI | Pool I | $ | 14,884,362 | ||||
| Hampton Inn |
Gurnee, IL | Pool I | $ | 12,929,426 | ||||
| Hampton Inn |
Indianapolis, IN | Pool II | $ | 10,499,736 | ||||
| Hampton Inn |
Kansas City, MO | Pool I | $ | 9,271,676 | ||||
| Hampton Inn |
Madison Heights, MI | Pool I | $ | 15,711,626 | ||||
| Hampton Inn |
Maryland Heights, MO | Pool I | $ | 9,904,041 | ||||
| Hampton Inn |
Memphis, TN | Pool I | $ | 15,347,648 | ||||
-8-
| Hotel Property |
Location |
Pool | Allocated Purchase Price |
|||||
| Hampton Inn |
Milford, CT | Pool II | $ | 7,400,000 | ||||
| Hampton Inn |
Morgantown, WV | Pool I | $ | 17,681,700 | ||||
| Hampton Inn |
Naperville, IL | Pool II | $ | 10,587,539 | ||||
| Hampton Inn |
Norfolk, VA | Pool I | $ | 5,850,000 | ||||
| Hampton Inn |
Northville , MI | Pool I | $ | 9,776,761 | ||||
| Hampton Inn |
Orlando, FL | Pool II | $ | 13,886,925 | ||||
| Hampton Inn |
Overland Park, KS | Pool I | $ | 10,842,223 | ||||
| Hampton Inn |
Palm Beach Gardens, FL | Pool I | $ | 20,956,063 | ||||
| Hampton Inn |
Peabody, MA | Pool I | $ | 13,059,655 | ||||
| Hampton Inn |
Pickwick Dam, TN | Pool I | $ | 2,500,000 | ||||
| Hampton Inn |
Scranton, PA | Pool I | $ | 13,865,600 | ||||
| Hampton Inn |
State College, PA | Pool I | $ | 13,850,032 | ||||
| Hampton Inn |
Urbana, IL | Pool II | $ | 24,279,177 | ||||
| Hampton Inn |
West Columbia, SC | Pool I | $ | 6,000,000 | ||||
| Hampton Inn |
West Palm Beach, FL | Pool I | $ | 15,115,059 | ||||
| Hampton Inn |
Westlake, OH | Pool I | $ | 18,594,664 | ||||
| Hampton Inn & Suites |
Boynton Beach, FL | Pool I | $ | 32,415,587 | ||||
| Hampton Inn & Suites |
Franklin, TN | Pool I | $ | 21,016,491 | ||||
| Hilton Garden Inn |
Louisville, KY | Pool II | $ | 19,185,347 | ||||
| Hilton Garden Inn |
Rio Rancho, NM | Pool II | $ | 11,983,810 | ||||
| Hilton Garden Inn |
Round Rock, TX | Pool I | $ | 16,424,572 | ||||
| Holiday Inn |
Mt. Pleasant, SC | Pool I | $ | 7,900,000 | ||||
| Holiday Inn Express |
Miami, FL | Pool I | $ | 8,511,530 | ||||
| Homewood Suites |
Augusta, GA | Pool II | $ | 10,563,510 | ||||
| Homewood Suites |
Chicago, IL | Pool I | $ | 73,288,289 | ||||
| Homewood Suites |
Germantown, TN | Pool I | $ | 10,745,199 | ||||
| Homewood Suites |
Orlando, FL | Pool II | $ | 31,582,545 | ||||
| Homewood Suites |
Peabody, MA | Pool I | $ | 10,714,650 | ||||
| Homewood Suites |
Phoenix , AZ | Pool I | $ | 24,809,678 | ||||
| Homewood Suites |
San Antonio, TX | Pool I | $ | 17,635,891 | ||||
| Homewood Suites |
Seattle, WA | Pool II | $ | 55,983,779 | ||||
| Homewood Suites |
Windsor Locks, CT | Pool I | $ | 12,325,687 | ||||
| Hyatt Place |
Albuquerque, NM | Pool I | $ | 21,994,086 | ||||
| Hyatt Place |
Baton Rouge, LA | Pool I | $ | 13,075,389 | ||||
| Hyatt Place |
Birmingham, AL | Pool I | $ | 10,225,494 | ||||
| Hyatt Place |
Bloomington, MN | Pool I | $ | 14,667,789 | ||||
| Hyatt Place |
Blue Ash, OH | Pool I | $ | 10,337,545 | ||||
| Hyatt Place |
Columbus, OH | Pool I | $ | 13,352,636 | ||||
| Hyatt Place |
Franklin, TN | Pool I | $ | 19,879,751 | ||||
| Hyatt Place |
Glen Allen, VA | Pool I | $ | 9,128,843 | ||||
| Hyatt Place |
Indianapolis, IN | Pool I | $ | 16,261,993 | ||||
| Hyatt Place |
Las Vegas, NV | Pool I | $ | 19,906,596 | ||||
| Hyatt Place |
Linthicum Heights, MD | Pool I | $ | 12,476,068 | ||||
| Hyatt Place |
Memphis, TN | Pool I | $ | 15,767,331 | ||||
| Hyatt Place |
Miami, FL | Pool I | $ | 19,884,261 | ||||
| Hyatt Place |
Overland Park, KS | Pool I | $ | 9,949,330 | ||||
| Hyatt Place |
Tampa, FL | Pool I | $ | 20,915,567 | ||||
| Residence Inn |
Boise, ID | Pool I | $ | 12,668,682 | ||||
| Residence Inn |
Chattanooga, TN | Pool I | $ | 13,499,683 | ||||
| Residence Inn |
El Segundo, CA | Pool I | $ | 40,111,403 | ||||
| Residence Inn |
Ft Myers, FL | Pool I | $ | 11,932,019 | ||||
| Residence Inn |
Jacksonville, FL | Pool II | $ | 6,365,091 | ||||
-9-
| Hotel Property |
Location |
Pool | Allocated Purchase Price |
|||||
| Residence Inn |
Knoxville, TN | Pool I | $ | 14,263,366 | ||||
| Residence Inn |
Lexington, KY | Pool I | $ | 17,595,014 | ||||
| Residence Inn |
Macon, GA | Pool I | $ | 4,907,309 | ||||
| Residence Inn |
Mobile, AL | Pool I | $ | 9,523,623 | ||||
| Residence Inn |
Portland, OR | Pool I | $ | 50,878,043 | ||||
| Residence Inn |
San Diego, CA | Pool I | $ | 28,120,735 | ||||
| Residence Inn |
Sarasota, FL | Pool I | $ | 13,964,493 | ||||
| Residence Inn |
Savannah, GA | Pool I | $ | 11,231,254 | ||||
| Residence Inn |
Tallahassee, FL | Pool I | $ | 12,114,907 | ||||
| Residence Inn |
Tampa, FL | Pool I | $ | 10,709,571 | ||||
| Residence Inn |
Tampa, FL | Pool I | $ | 17,062,551 | ||||
| SpringHill Suites |
Asheville, NC | Pool II | $ | 14,796,371 | ||||
| SpringHill Suites |
Grand Rapids, MI | Pool I | $ | 11,413,845 | ||||
| SpringHill Suites |
Houston, TX | Pool I | $ | 13,200,866 | ||||
| SpringHill Suites |
Lexington, KY | Pool I | $ | 18,243,803 | ||||
| SpringHill Suites |
Round Rock, TX | Pool I | $ | 10,133,394 | ||||
| SpringHill Suites |
San Antonio, TX | Pool I | $ | 5,661,802 | ||||
| SpringHill Suites |
San Diego, CA | Pool I | $ | 21,190,695 | ||||
| TownePlace Suites |
Savannah, GA | Pool II | $ | 9,777,538 | ||||
The Company closed the sale of the Portfolio on February 27, 2015. The aggregate purchase price for the Portfolio was approximately $1.808 billion, subject to certain adjustments and proration. The purchase price consisted of approximately $1.361 billion in cash and approximately $447 million in preferred equity interests (the Preferred Equity) to be issued by two subsidiaries of ARCH (Pool I Owner and Pool II Owner) that are now the indirect owners of the Portfolio. Pool I Owner indirectly owns the 96 OP Hotels that are part of the Portfolio (the Pool I Hotels) and Pool II Owner indirectly owns the 20 Trust Hotels (the Pool II Hotels).
A portion of the purchase price has been allocated to each of the individual hotels in the Portfolio (as indicated in the chart above). The consideration received at closing, net of transaction costs, proration and other purchase price adjustments, generally was allocated amongst the Sellers in accordance with the allocated purchase prices of the portions of the Portfolio owned by them unless such costs are clearly associated with a particular pool (for example, the defeasance costs associated with the 20 Trust Hotels’ mortgages).
At closing, the Preferred Equity in the Pool I Owner was issued to the Sellers of the Pool I Hotels and the Preferred Equity in the Pool II Owner was issued to the Sellers of the Pool II Hotels. In each case, for the 18-month period after the closing, the Preferred Equity will accrue an annual preferred return of 7.50%. Thereafter, the annual preferred return will increase to 8.00%. The preferred return is payable in cash on a current basis each month. The Preferred Equity has a full liquidation preference to any other equity in the issuer.
The Preferred Equity is fully redeemable by the Pool I Owner or the Pool II Owner, as applicable, at any time at par plus any accrued and unpaid preferred return. In addition, there are certain mandatory redemption events, including a requirement that 50% of the Preferred Equity be redeemed by the third anniversary of the closing and 100% of the Preferred Equity be redeemed by the fourth anniversary of the closing.
The Sellers have the right to replace the managing member and assume full control of Pool I Owner or the Pool II Owner, respectively (including over any decision to refinance or sell Pool I Owner or the Pool II Owner, as applicable, or any properties) upon the occurrence, subject to certain cure and grace periods, of any “Changeover Event” (as described below). Changeover Events consist of the following types of events: failure to make payments when due; failure to contribute protective capital when required; breaches of representations, warranties and covenants; events of default under debt documents, lease agreements and franchise agreements; and insolvency events.
Following a Changeover Event, in addition to a Seller’s mandatory redemption rights, each Seller has the right to exercise a buy/sell option pursuant to which an ARCH affiliate must propose a price to the respective Seller for Pool I Owner or Pool II Owner, as applicable, for which the ARCH affiliate would either (i) buy all of the applicable Seller’s interests in the respective holding company for the amount that such Seller would receive in distribution if such holding company were sold
-10-
for such price, or (ii) sell to the applicable Seller all of the ARCH affiliate’s interest in such holding company for the amount that the ARCH affiliate would receive in distribution if such holding company were sold for such price. The applicable Seller would then have the right to elect to either sell its interests to the ARCH affiliate or to buy the ARCH affiliate’s interest at the applicable price.
The Purchasers assumed the New Mortgage Loan and the New Mezzanine Loan at closing.
The Sellers were required to repay $72.1 million of the debt secured by the Remaining Hotels and obtained the release of the Remaining Hotels from the lien securing the debt. Following that repayment, the cash portion of the purchase price for the Pool I Hotels was reduced by the remaining outstanding principal amount of the assumed debt (approximately $903.9 million in the aggregate).
Whitehall and one of its affiliates provided customary non-recourse carve-out guarantees and environmental indemnities in respect of the assumed debt (which they previously did). ARCH and certain of its affiliates guarantee the reimbursement of the Whitehall guarantors for any liabilities incurred under these guarantees and indemnities. In the event that the Whitehall guarantors have not been released from these guarantees and indemnities within the 18-month period following the closing, they will be entitled to receive an annual fee of $8 million.
The Pool II Hotels were delivered to the Purchasers free of any mortgages. Accordingly, at the closing, the Sellers defeased, or in the case of one mortgage prepaid, the debt that previously encumbered the Pool II Hotels. The Purchasers obtained new financing secured by those hotels to fund a portion of the purchase price.
W2007 Equity LP redeemed its junior subordinated debt in full at closing on February 27, 2015.
W2007 Equity LP, WNT and Whitehall Street Global Real Estate Limited Partnership 2007, an affiliate of GS Group, GS and GSMC, engaged GS and Deutsche Bank Securities Inc. (DB) to provide advisory services in connection with a potential sale or other transaction relating to the 126 hotels. As a result of that engagement, upon consummation of the sale of the Portfolio in accordance with the Agreement, GS and DB were paid, in the aggregate, an advisory fee of 1.10% of the aggregate consideration paid to the Sellers. GS and DB split the advisory fee 60% and 40% respectively.
As of December 31, 2014 and 2013, we owned interests in 126 hotels located in 35 states comprising 14,934 rooms. As described above, the 20 Trust Hotels and 96 of the OP Hotels were sold on February 27, 2015.
OUR HOTELS
On February 27, 2015, the 20 Trust Hotels and 96 of the 106 OP Hotels were sold to affiliates of ARCH. The Remaining Hotels held by Senior Mezz were under contract to be sold for a combined purchase price of $100 million. The contract for the sale of the Remaining Hotels was terminated by the purchasers on May 6, 2015. On June 8, 2015, the Company entered into a reinstatement and amendment to the terminated contract, which among other things, reinstated the contract for nine of the Remaining Hotels, amended the purchase price to $85 million and scheduled closing for July 23, 2015. There can be no assurance as to whether or when the transaction will close, as to the actual proceeds that will be realized if it does close or as to what the assets might ultimately sell for in an alternate transaction if the pending transaction does not close. Even if the transaction does close, there can be no assurance as to when a distribution from such sale proceeds will be received by the Company. While the Company intends to sell the one Remaining Hotel not currently under contract to be sold, there can be no assurance as to whether or when that hotel will be sold, the form of consideration which may be received in respect of that hotel or whether the consideration which may be received in respect of that hotel will be greater or less than the purchase price allocated to that hotel in the terminated sale agreement. Even if a transaction for the one Remaining Hotel not currently under contract to be sold does occur, there can be no assurance as to when a distribution from such sale proceeds will be received by the Company.
Through our subsidiaries, we primarily owned premium-branded, limited-service hotels in the upscale and upper midscale segments of the lodging industry, as these segments are currently defined by Smith Travel Research (STR), a leading source of lodging industry data. Limited-service hotels typically generate most of their revenue from room rentals, have limited food and beverage outlets and meeting space and require fewer employees than traditional full-service hotels. We believe that premium-branded, limited-service hotels have the potential to generate attractive returns relative to other types of hotels due to their ability to achieve revenue per available room (RevPAR) levels at or close to those generated by traditional full-service hotels, while achieving higher profit margins due to their more efficient operating model and less volatile cash flows. See “Item 7. Management’s Discussion & Analysis” for additional information regarding RevPAR.
The diversity of our portfolio was such that, as of December 31, 2014 and 2013, no individual hotel exceeded 10% of the total rooms in the portfolio. Our brand and segment diversity of the Trust Hotels that were included in continuing operations as of December 31, 2014 and 2013 is illustrated by the following table:
-11-
Brand and Segment (as defined by STR) Diversity
| Number of Hotels | Number of Rooms | |||||||
| Upscale hotels: |
||||||||
| Homewood Suites (1) |
3 | 478 | ||||||
| Courtyard (2) |
3 | 414 | ||||||
| Hilton Garden Inn (1) |
2 | 241 | ||||||
| SpringHill Suites (2) |
1 | 88 | ||||||
| Residence Inn (2) |
1 | 78 | ||||||
|
|
|
|
|
|||||
| 10 | 1,299 | |||||||
| Upper midscale hotels: |
||||||||
| Hampton Inn (1) |
9 | 1,163 | ||||||
| TownePlace Suites (2) |
1 | 95 | ||||||
|
|
|
|
|
|||||
| 10 | 1,258 | |||||||
|
|
|
|
|
|||||
| Total |
20 | 2,557 | ||||||
|
|
|
|
|
|||||
Franchise affiliation
| (1) | Hilton Hotels Corporation |
| (2) | Marriott International, Inc. |
The diversity of the OP Hotels was such that, as of December 31, 2014 and 2013 no individual hotel exceeded 2% of the total rooms in the portfolio. The brand and segment diversity of the OP Hotels that are included in continuing operations as of December 31, 2014 and 2013 is illustrated by the following table:
Brand and Segment (as defined by STR) Diversity
| Number of Hotels | Number of Rooms | |||||||
| Upper upscale hotels: |
||||||||
| Embassy Suites (1) |
1 | 246 | ||||||
| Upscale hotels: |
||||||||
| Residence Inn (2) |
24 | 2,465 | ||||||
| Hyatt Place (3) |
15 | 1,954 | ||||||
| Courtyard (2) |
14 | 1,434 | ||||||
| Homewood Suites (1) |
7 | 900 | ||||||
| SpringHill Suites (2) |
6 | 659 | ||||||
| Hilton Garden Inn (1) |
1 | 122 | ||||||
|
|
|
|
|
|||||
| 67 | 7,534 | |||||||
| Upper midscale hotels: |
||||||||
| Hampton Inn (1) |
34 | 4,114 | ||||||
| Fairfield Inn (2) |
2 | 259 | ||||||
| Holiday Inn (4) |
1 | 158 | ||||||
| Holiday Inn Express (4) |
1 | 66 | ||||||
|
|
|
|
|
|||||
| 38 | 4,597 | |||||||
|
|
|
|
|
|||||
| Total |
106 | 12,377 | ||||||
|
|
|
|
|
|||||
Franchise affiliation
| (1) | Hilton Hotels Corporation |
| (2) | Marriott International, Inc. |
| (3) | Hyatt Corporation |
| (4) | Intercontinental Hotels Group |
-12-
Our hotel portfolio included upper upscale, upscale and upper midscale hotels. This array of product offerings coupled with a property mix that is spread between suburban and urban locations helped to insulate us from various economic climates, including a depressed business travel climate.
We believe the geographic diversity of our hotel portfolio helped to limit our exposure to any one market. The following table illustrates the geographic presence of the Trust Hotels that are included in continuing operations by the number of rooms as of December 31, 2014 and 2013:
Geographical Diversity
| Region (as defined by STR): |
||||
| East North Central |
18.5 | % | ||
| East South Central |
9.0 | % | ||
| Mountain |
5.0 | % | ||
| New England |
5.8 | % | ||
| Pacific |
12.0 | % | ||
| South Atlantic |
32.9 | % | ||
| West South Central |
16.8 | % |
The following table illustrates the geographical presence of the OP Hotels that are included in continuing operations by the number of rooms as of December 31, 2014 and 2013:
Geographical Diversity
| Region (as defined by STR): |
||||
| East North Central |
13.3 | % | ||
| East South Central |
15.9 | % | ||
| Middle Atlantic |
6.7 | % | ||
| Mountain |
7.3 | % | ||
| New England |
3.5 | % | ||
| Pacific |
4.4 | % | ||
| South Atlantic |
31.7 | % | ||
| West North Central |
6.7 | % | ||
| West South Central |
10.5 | % |
We believe that multiple brands at the upscale and upper midscale levels helped to insulate our asset portfolio against the volatility of individual brand results relative to industry RevPAR performance. The following table summarizes key performance indicators, by brand, of the Trust Hotels that are included in continuing operations for the periods below:
| Year Ended December 31, 2014 | Year Ended December 31, 2013 | |||||||||||||||||||||||||||||||
| Brand |
Number of Hotels |
Number of Rooms |
% Occupancy |
Average Daily Rate (ADR) |
RevPAR | % Occupancy |
Average Daily Rate (ADR) |
RevPAR | ||||||||||||||||||||||||
| Hampton Inn |
9 | 1,163 | 74.4 | % | $ | 100.91 | $ | 75.10 | 71.1 | % | $ | 97.81 | $ | 69.54 | ||||||||||||||||||
| Residence Inn |
1 | 78 | 81.7 | % | $ | 94.61 | $ | 77.26 | 78.5 | % | $ | 87.42 | $ | 68.58 | ||||||||||||||||||
| Courtyard |
3 | 414 | 67.4 | % | $ | 120.64 | $ | 81.26 | 65.7 | % | $ | 117.86 | $ | 77.41 | ||||||||||||||||||
| Homewood Suites |
3 | 478 | 78.6 | % | $ | 133.87 | $ | 105.23 | 81.1 | % | $ | 121.53 | $ | 98.62 | ||||||||||||||||||
| SpringHill Suites |
1 | 88 | 74.5 | % | $ | 120.06 | $ | 89.42 | 75.0 | % | $ | 112.58 | $ | 84.42 | ||||||||||||||||||
| Hilton Garden Inn |
2 | 241 | 70.8 | % | $ | 102.58 | $ | 72.60 | 67.6 | % | $ | 98.71 | $ | 66.71 | ||||||||||||||||||
| TownePlace Suites |
1 | 95 | 83.2 | % | $ | 79.16 | $ | 65.87 | 72.0 | % | $ | 76.11 | $ | 54.81 | ||||||||||||||||||
|
|
|
|
|
|
|
|
|
|
|
|
|
|
|
|
|
|||||||||||||||||
| 20 | 2,557 | 74.3 | % | $ | 110.05 | $ | 81.72 | 72.2 | % | $ | 105.23 | $ | 75.94 | |||||||||||||||||||
|
|
|
|
|
|
|
|
|
|
|
|
|
|
|
|
|
|||||||||||||||||
-13-
The following table summarizes key performance indicators, by brand, of the OP Hotels that are included in continuing operations for the periods below:
| Year Ended December 31, 2014 | Year Ended December 31, 2013 | |||||||||||||||||||||||||||||||
| Brand |
Number of Hotels |
Number of Rooms |
% Occupancy |
Average Daily Rate (ADR) |
RevPAR | % Occupancy |
Average Daily Rate (ADR) |
RevPAR | ||||||||||||||||||||||||
| Hampton Inn |
34 | 4,114 | 71.3 | % | $ | 104.20 | $ | 74.34 | 69.8 | % | $ | 99.42 | $ | 69.41 | ||||||||||||||||||
| Residence Inn |
24 | 2,465 | 77.7 | % | $ | 115.63 | $ | 89.86 | 76.5 | % | $ | 111.60 | $ | 85.43 | ||||||||||||||||||
| Hyatt Place |
15 | 1,954 | 75.2 | % | $ | 101.19 | $ | 76.12 | 72.6 | % | $ | 96.60 | $ | 70.15 | ||||||||||||||||||
| Courtyard |
14 | 1,434 | 72.6 | % | $ | 112.99 | $ | 82.04 | 70.8 | % | $ | 107.85 | $ | 76.35 | ||||||||||||||||||
| Homewood Suites |
7 | 900 | 79.7 | % | $ | 133.80 | $ | 106.59 | 77.8 | % | $ | 128.65 | $ | 100.15 | ||||||||||||||||||
| SpringHill Suites |
6 | 659 | 74.5 | % | $ | 106.65 | $ | 79.49 | 71.7 | % | $ | 100.95 | $ | 72.41 | ||||||||||||||||||
| Hilton Garden Inn |
1 | 122 | 72.0 | % | $ | 102.86 | $ | 74.02 | 70.1 | % | $ | 100.10 | $ | 70.19 | ||||||||||||||||||
| Fairfield Inn & Suites |
2 | 259 | 67.8 | % | $ | 87.44 | $ | 59.30 | 59.1 | % | $ | 86.09 | $ | 50.92 | ||||||||||||||||||
| Embassy Suites |
1 | 246 | 75.4 | % | $ | 118.84 | $ | 89.61 | 79.6 | % | $ | 110.19 | $ | 87.68 | ||||||||||||||||||
| Holiday Inn |
1 | 158 | 53.8 | % | $ | 109.38 | $ | 58.80 | 59.3 | % | $ | 99.26 | $ | 58.84 | ||||||||||||||||||
| Holiday Inn Express |
1 | 66 | 83.4 | % | $ | 123.33 | $ | 102.92 | 80.5 | % | $ | 118.20 | $ | 95.16 | ||||||||||||||||||
|
|
|
|
|
|
|
|
|
|
|
|
|
|
|
|
|
|||||||||||||||||
| 106 | 12,377 | 74.0 | % | $ | 109.68 | $ | 81.17 | 72.3 | % | $ | 104.99 | $ | 75.90 | |||||||||||||||||||
|
|
|
|
|
|
|
|
|
|
|
|
|
|
|
|
|
|||||||||||||||||
STRATEGY
On February 27, 2015, the 20 Trust Hotels and 96 of the 106 OP Hotels were sold to affiliates of ARCH.
The Remaining Hotels held by Senior Mezz were under contract to be sold for a combined purchase price of $100 million. The contract for the sale of the Remaining Hotels was terminated by the purchasers on May 6, 2015. On June 8, 2015, the Company entered into a reinstatement and amendment to the terminated contract, which among other things, reinstated the contract for nine of the Remaining Hotels, amended the purchase price to $85 million and scheduled closing for July 23, 2015. There can be no assurance as to whether or when the transaction will close, as to the actual proceeds that will be realized if it does close or as to what the assets might ultimately sell for in an alternate transaction if the pending transaction does not close. Even if the transaction does close, there can be no assurance as to when a distribution from such sale proceeds will be received by the Company. While the Company intends to sell the one Remaining Hotel not currently under contract to be sold, there can be no assurance as to whether or when that hotel will be sold, the form of consideration which may be received in respect of that hotel or whether the consideration which may be received in respect of that hotel will be greater or less than the purchase price allocated to that hotel in the terminated sale agreement. Even if a transaction for the one Remaining Hotel not currently under contract to be sold does occur, there can be no assurance as to when a distribution from such sale proceeds will be received by the Company.
We do not have any current plans to acquire any additional hotels, although if a Changeover Event occurs, we and Senior Mezz may take control over the Portfolio. In addition, our ability to generate returns on the Remaining Hotels may be limited to the extent of the proceeds in the proposed sale.
SEGMENT REPORTING
The Company has considered each of its hotels to be an operating segment, none of which meets the threshold for a reportable segment as prescribed by accounting principles generally accepted in the United States (GAAP). The Company allocates resources and assesses operating performance based on each individual hotel. Additionally, the Company aggregates these individually immaterial operating segments into one reporting segment using the criteria established by the authoritative accounting guidance, including the similarities of its product offering, types of customers and method of providing service. Additional segment information may be found in the footnotes to our consolidated financial statements located in “Item 8. Financial Statements and Supplementary Data.”
EMPLOYEES
The Company has no employees. During 2014 and 2013, all persons involved in the day-to-day operation of the Company’s hotels were employed by third party management companies engaged pursuant to hotel management agreements. In addition, all persons supporting the Company through asset management and various other activities were employed by a related party engaged pursuant to an asset management agreement.
-14-
COMPETITION
The hotel industry is highly competitive with various participants competing on the basis of price, level of service and geographic location. Each of our hotels is located in a developed area that includes other hotel properties. Many of our management agreements have not had restrictions on the ability of the companies that manage our hotels to convert, franchise or develop other hotel properties in our markets. As a result, our hotels in a given market may compete with other hotels that our managers may own, invest in, manage or franchise. The number of competitive hotel properties in a particular area could have a material adverse effect on the occupancy, average daily rate (ADR) and RevPAR of our hotels. We believe that brand recognition, location, the quality of the hotel, consistency of services provided, supply of rooms in the market and price are and have been the principal competitive factors affecting our hotels.
FRANCHISE AGREEMENTS
A part of our asset management program is the licensing of our hotels under nationally franchised brands. We believe that the public’s perception of quality associated with a franchisor is an important feature in the operation of a hotel. We also believe that franchised properties generally have higher levels of RevPAR than unfranchised properties due to access to national reservation systems and national advertising and marketing programs provided by franchisors. Our franchise agreements generally have initial terms ranging from five to 21 years and expire between 2015 and 2028.
We typically have had commitments to franchisors to make certain capital improvements to our hotels (prior to April 11, 2014, this included all 126 hotels; after April 11, 2014, this included only the 20 Trust Hotels), which will be funded primarily through our operating cash flows. We made capital improvements of approximately $12 million and $24 million to our hotels in 2014 and 2013, respectively.
INFLATION
Operators of hotels, in general, possess the ability to adjust room rates daily to reflect the effects of inflation. However, competitive pressures may limit the ability of the companies that manage and operate our hotels to raise room rates.
SEASONALITY
Our operations historically have been seasonal in nature, generally reflecting higher RevPAR during the second and third quarters. This seasonality can be expected to cause fluctuations in our quarterly operating results.
ENVIRONMENTAL MATTERS
Under various federal, state and local environmental laws, ordinances and regulations, a current or previous owner or operator of real property may be liable for the costs of removal or remediation of hazardous or toxic substances on, under or in such property. These laws may impose liability whether or not the owner or operator knew of, or was responsible for, the presence of such hazardous or toxic substances. In addition, certain environmental laws and common law principles could be used to impose liability for release of asbestos-containing materials, and third parties may seek recovery from owners or operators of real properties for personal injury associated with exposure to released asbestos-containing materials. Environmental laws also may impose restrictions on the manner in which property may be used or businesses may be operated, and these restrictions may require corrective or other expenditures. In connection with our current or prior ownership or operation of hotels, we may be potentially liable for various environmental costs or liabilities. Although we are currently not aware of any material environmental claims pending or threatened against us, we can offer no assurance that a material environmental claim will not be asserted against us in the future.
In connection with the Merger, Phase I environmental site assessments were obtained for our hotels. These assessments included historical reviews of the hotels, reviews of certain public records, preliminary investigations of the sites and surrounding properties, screenings for hazardous and toxic substances and underground storage tanks, and the preparation and issuance of a written report. These assessments did not include invasive procedures to detect contaminants from former operations of our hotels or those migrating from neighbors or caused by third parties. These assessments have not revealed any environmental liability that we believe would have a material adverse effect on our business, assets, results of operations or liquidity, nor are we aware of any such liability or material environmental issues.
| ITEM 1A. | RISK FACTORS |
The risks described below could materially and adversely affect our business, financial condition, cash flow and ability to make distributions to our shareholders. The following risk factors are not necessarily exhaustive, particularly as to possible future events, and new risk factors may arise from time to time. Many things can happen that can cause our actual financial and operating results to be different than those described or anticipated by us in our Securities and Exchange Commission
-15-
(SEC) filings. As noted above, references to “our hotel properties” and similar references herein for periods from and after February 27, 2015 refer to the Remaining Hotels, which are owned by Senior Mezz in which we own a 3% equity interest. See “Item 1. Business” for additional information.
Risks related to our business
As a result of the sale of the Portfolio, we are at risk of not collecting the preferred return and the initial capital contribution of the Preferred Equity either through the interest held by us or our 3% equity interest in Senior Mezz.
At the closing of the sale of the Portfolio, the Preferred Equity in the Pool I Owner was issued to the Sellers of the Pool I Hotels and the Preferred Equity in the Pool II Owner was issued to the Sellers of the Pool II Hotels. The Preferred Equity is our most significant asset as of March 31, 2015 through both the Preferred Equity owned directly by us and the Preferred Equity owned indirectly through our 3% equity interest in Senior Mezz. In each case, for the 18-month period after the closing, the Preferred Equity will accrue an annual preferred return of 7.50%. Thereafter, the annual preferred return will increase to 8.00%. The preferred return is payable in cash on a current basis each month. The Preferred Equity has a full liquidation preference prior to any other equity in the issuer.
The Preferred Equity is fully redeemable at any time at par plus any accrued and unpaid preferred return. In addition, there are certain mandatory redemption events, including a requirement that 50% of the Preferred Equity be redeemed by the third anniversary of the closing and 100% of the Preferred Equity be redeemed by the fourth anniversary of the closing.
The ability of the Pool I Owner and the Pool II Owner to make the payments described above will depend upon the performance of the Portfolio. Generally, the risks to our business relating to hotels apply to the Portfolio and also to the ability of the Pool I Owner and the Pool II Owner to make payments to the Sellers in respect of the Preferred Equity. There can be no assurance as to whether or when the Sellers will receive payment of its initial capital contribution in respect of the Preferred Equity.
In addition, in the event that a Changeover Event occurs, we and Senior Mezz may assume control of the Portfolio, which would be subject to the risks inherent in owning a portfolio of hotel assets.
Our business depends upon demand for hotel rooms. Any setback in the economic recovery will adversely affect our future financial condition and cash flow.
Our hotel properties experienced declining operating performance across various U.S. markets during the recent economic recession. Our business prospects depend upon continued revenue and net income growth from anticipated improvement in demand for hotel rooms as the economic recovery continues, both in respect of the Preferred Equity and in the Remaining Hotels. We, however, cannot provide any assurances that demand for hotel rooms will increase from current levels, or the time or extent of any such demand growth. If demand does not continue to increase as the economy recovers, or if there is a setback in the economic recovery resulting in weakening demand, our operating results could be adversely affected. As a result, any delay in the continued economic recovery or a new economic downturn will adversely affect our future cash flow.
Our returns depend on management of our hotels by third parties, and ineffective or poor management could result in losses to our shareholders.
Although we and WNT own the Remaining Hotels, third party operators operating under management agreements control the daily operations of these hotels. Under the terms of the management agreements, our and WNT’s ability to participate in operating decisions regarding the Remaining Hotels is limited. We and WNT depend on these third party management companies to adequately operate the hotels as provided in the management agreements. Neither we nor WNT have the authority to require any hotel to be operated in a particular manner or to govern any particular aspect of the daily operations of any hotel (for instance, setting room rates). Thus, even if we or WNT believe the hotels are being operated inefficiently or in a manner that does not result in satisfactory occupancy rates, RevPAR and ADR, we may not be able to cause the management company to change its method of operation of our hotels. We and WNT can only seek redress if a management company violates the terms of the applicable management agreement, and then only to the extent of the remedies provided for under the terms of the management agreement. Additionally, in the event that any of the management companies that manage our hotels need to be replaced, we and WNT may experience significant disruptions at the hotels and in the operations generally.
-16-
The terms of our franchise agreements and the risk of loss of a franchise could adversely affect our business.
The Remaining Hotels operate under franchise agreements, and we are subject to the risks that are found in concentrating our hotel investments in several franchise brands. These risks include reductions in business following negative publicity related to one of our brands.
The maintenance of the franchise licenses for the hotels is subject to the franchisors’ operating standards and other terms and conditions. The franchisors periodically inspect the hotels to ensure that the owners and the companies that manage our hotels follow their standards. Failure by us, WNT or one of the companies which manage our hotels to maintain these standards or other terms and conditions could result in a franchise license being canceled. If a franchise license terminates due to a failure to make required improvements or to otherwise comply with its terms, there may be liability to the franchisor for a termination payment, which varies by franchisor and by hotel. As a condition of the continued holding of a franchise license, a franchisor could also possibly require capital expenditures to be made, even if we or WNT do not believe the capital improvements are necessary or desirable or will result in an acceptable return on our investment. Accordingly, there is a risk of losing a franchise license if franchisor required capital expenditures are not made.
If a franchisor terminates the franchise license, we and WNT may try either to obtain a suitable replacement franchise or to operate the hotel without a franchise license. The loss of a franchise license could materially and adversely affect the operations or the underlying value of the hotel because of the loss of associated name recognition, marketing support and centralized reservation systems provided by the franchisor and could materially and adversely affect our revenues.
We may not be able to sell our hotels on favorable terms or at all
On February 27, 2015, we and the other Sellers sold the Portfolio, resulting in Senior Mezz continuing to own the Remaining Hotels. On March 25, 2015, subsidiaries of Senior Mezz entered into an agreement to sell the Remaining Hotels for $100 million. The contract for the sale of the Remaining Hotels was terminated by the purchasers on May 6, 2015. On June 8, 2015, the Company entered into a reinstatement and amendment to the terminated contract, which among other things, reinstated the contract for nine of the Remaining Hotels, amended the purchase price to $85 million and scheduled closing for July 23, 2015. There can be no assurance as to whether or when the transaction will close, as to the actual proceeds that will be realized if it does close, or as to what the assets might ultimately sell for in an alternate transaction if the pending transaction does not close. Even if the transaction does close, there can be no assurance as to when a distribution from such sale proceeds will be received by the Company. While the Company intends to sell the one Remaining Hotel not currently under contract to be sold, there can be no assurance as to whether or when that hotel will be sold, the form of consideration which may be received in respect of that hotel or whether the consideration which may be received in respect of that hotel will be greater or less than the purchase price allocated to that hotel in the terminated sale agreement. Even if a transaction for the one Remaining Hotel not currently under contract to be sold does occur, there can be no assurance as to when a distribution from such sale proceeds will be received by the Company.
We cannot assure you that the market value of the Remaining Hotels will not decrease in the future. If the sale of the Remaining Hotels does not occur and/or a Changeover Event occurs and we and Senior Mezz assume control over the Portfolio, we may not be able to sell the hotels on favorable terms, and such hotels may be sold at a loss. We face competition for buyers of our hotel properties. Other sellers of hotels may have the financial resources to dispose of their hotels on unfavorable terms that we would be unable to accept.
Risks related to the real estate and lodging industries
Investing in hotel assets involves unique risks.
We have invested in hotels, which are subject to all the risks common to the hotel industry. These risks could adversely affect hotel occupancy and rates that can be charged for hotel rooms, and generally include:
| • | competition from other hotel properties in our markets; |
| • | over-building of hotels in our markets, which results in increased supply and could adversely affect occupancy and revenues at our hotels; |
| • | dependence on business and commercial travelers and tourism; |
| • | increases in operating costs due to inflation, increased energy costs and other factors that may not be offset by increased room rates; |
| • | changes in interest rates and in the availability, cost and terms of debt financing; |
| • | increases in assessed property taxes from changes in valuation or real estate tax rates; |
| • | increases in the cost of property insurance; |
-17-
| • | changes in governmental laws and regulations, fiscal policies and zoning ordinances and the related costs of compliance with laws and regulations, fiscal policies and ordinances; |
| • | unforeseen events beyond our control, such as terrorist attacks, travel related health concerns which could reduce travel, including pandemics and epidemics such as H1N1 influenza (swine flu), avian bird flu and SARS, imposition of taxes or surcharges by regulatory authorities, travel-related accidents, travel infrastructure interruptions and unusual weather patterns, including natural disasters such as hurricanes, tsunamis and earthquakes; |
| • | adverse effects of national, regional, and local economic and market conditions and increases in energy costs or labor costs and other expenses affecting travel, which may affect travel patterns and reduce the number of business and commercial travelers and tourists; |
| • | adverse effects of a downturn in the lodging industry; and |
| • | risks generally associated with the ownership of hotel properties and real estate, as we discuss in more detail below. |
These factors could adversely affect hotel revenues and expenses in properties in which we hold interests, which in turn could adversely affect our financial condition, net income and cash flows.
Failure of the hotel industry to continue to improve or remain stable may adversely affect our financial condition, net income and cash flows.
Our business is focused on the hotel industry, and we cannot assure you that hotel industry fundamentals will continue to improve or remain stable. Economic slowdown and world events outside our control, such as terrorism, have adversely affected the hotel industry in the recent past and if these events reoccur, may adversely affect the industry in the future. In the event conditions in the hotel industry do not continue to improve or remain stable, our financial condition, net income and cash flows will be adversely affected.
Illiquidity of real estate investments could significantly impede our ability to respond to adverse changes in the performance of our properties and harm our financial condition.
While the Company expects to sell the Remaining Hotels, there can be no assurance that a sale of the Remaining Hotels will occur. We cannot predict whether we will be able to sell any property for the price or on the terms set by us, or whether any price or other terms offered by a prospective purchaser would be acceptable to us. We also cannot predict the length of time needed to find a willing purchaser and to close the sale of a property.
Because real estate investments are relatively illiquid, our ability to promptly sell one or more properties in our portfolio in response to changing economic, financial and investment conditions is limited. The real estate market is affected by many factors that are beyond our control, including:
| • | adverse changes in national and local economic and market conditions; |
| • | changes in interest rates and in the availability, cost and terms of debt financing; |
| • | changes in costs of compliance with governmental laws and regulations, fiscal policies, zoning and other ordinances; |
| • | the ongoing need for capital improvements, particularly in older structures; |
| • | changes in operating expenses; and |
| • | civil unrest, acts of war and natural disasters, including earthquakes and floods, which may result in uninsured and underinsured losses. |
We may be required to expend funds to correct defects or to make improvements before a property can be sold. We cannot assure you that we will have funds available to correct those defects or to make those improvements. These factors and any others that would impede our ability to respond to adverse changes in the performance of our properties could have a material adverse effect on our financial condition, net income and cash flow.
-18-
Significant capital expenditures may be required to maintain our hotels.
Our hotels have an ongoing need for renovations and other capital improvements, including replacements of furniture, fixtures and equipment. Franchisors of the hotels may also require periodic capital improvements as a condition of maintaining franchise licenses. Generally, owners of hotels are responsible for the cost of these capital improvements, which gives rise to the following risks:
| • | cost overruns and delays; |
| • | renovations can be disruptive to operations and can displace revenue at the hotels, including revenue lost while rooms under renovation are out of service; |
| • | the cost of funding renovations and the possibility that financing for these renovations may not be available on attractive terms; and |
| • | the risk that the return on our investment in these capital improvements will not be what we expect. |
If we have insufficient cash flow to fund needed capital expenditures, then borrowing or liquidation of hotels or other assets may be required to fund future capital improvements.
Our hotels could be subject to environmental risks.
Our past and present hotel properties are subject to various federal, state and local environmental laws. Under these laws, courts and government agencies have the authority to require the owner of a contaminated property to clean up the property, even if the owner did not know of or was not responsible for the contamination. These laws also apply to persons who owned a property at the time it became contaminated. In addition to the costs of cleanup, environmental contamination can affect the value of a property and, therefore, an owner’s ability to borrow funds using the property as collateral or to sell the property. Under the environmental laws, courts and government agencies also have the authority to require that a person who sent waste to a waste disposal facility, like a landfill or an incinerator, to pay for the clean-up of that facility if it becomes contaminated and threatens human health or the environment. Various court decisions have established that third parties may recover damages for injury caused by property contamination, such as asbestos.
In addition, when excessive moisture accumulates in buildings or on building materials, mold growth may occur, particularly if the moisture problem remains undiscovered or is not addressed over a period of time. Some molds may produce airborne toxins or irritants. Concern about indoor exposure to mold has been increasing as exposure to mold may cause a variety of adverse health effects and symptoms, including allergic or other reactions. As a result, the presence of significant mold at any of our hotels could require us to undertake a costly remediation program to contain or remove the mold from the affected hotel. In addition, the presence of significant mold could expose us to liability from guests, employees and others if property damage or health concerns arise.
Our hotels may not comply with the Americans with Disabilities Act and other government regulations.
Under the Americans with Disabilities Act of 1990 (the ADA), all public accommodations must meet various federal requirements related to access and use by disabled persons. Compliance with the ADA’s requirements could require costly removal of access barriers, and non-compliance could result in the U.S. government imposing fines or in private litigants winning damages. If we and/or Senior Mezz are required to make substantial modifications to our hotels, whether to comply with the ADA or other changes in governmental rules and regulations, our financial condition, net income and cash flows could be adversely impacted.
The insurance maintained for our hotels may be inadequate.
Senior Mezz maintains comprehensive insurance on each of our hotels, including liability and property coverage, of the type and amount we believe are customarily obtained for or by hotel owners.
There are certain types of losses, generally of a catastrophic nature, such as earthquakes, floods, hurricanes and acts of terrorism, for which our insurance coverage may not be sufficient to cover the full current market value or replacement cost of our damaged or destroyed asset. Inflation, increases in insurance premiums, changes in building codes and ordinances, environmental considerations and other factors could also keep us from using insurance proceeds to fully replace or renovate a hotel after it has been damaged or destroyed. In those circumstances, the insurance proceeds that we receive could be inadequate to restore our economic position on the damaged or destroyed hotel.
-19-
We could be responsible for the costs discussed above if an environmental condition existed or was alleged to exist at one of our properties. The costs to clean up a contaminated property, to defend against a claim, or to comply with environmental laws could be substantial and could adversely affect our net income and cash flow. Even though we have not encountered a substantial environmental claim to date, we may have material environmental liabilities of which we are unaware. We can make no assurances that future laws or regulations will not impose material environmental liabilities or the current environmental condition of our hotels will not be affected by the condition of the properties in the vicinity of our hotels (such as the presence of leaking underground storage tanks) or by third parties unrelated to us.
The hotel business is seasonal, which affects our cash flow from quarter to quarter.
The hotel industry is seasonal in nature. This seasonality can cause quarterly fluctuations in our financial condition, net income and cash flow. Our quarterly operating results may be adversely affected by factors outside our control, including weather conditions and poor economic factors in certain markets in which our hotels operate. We can provide no assurances that our cash flows will be sufficient to offset any shortfalls that occur as a result of these fluctuations.
Many real estate costs are fixed, even if revenue from our hotels decreases.
Many costs, such as real estate taxes, insurance premiums and maintenance costs, generally are not reduced even when a hotel is not fully occupied, room rates decrease or other circumstances cause a reduction in revenues. In addition, newly renovated hotels may not produce the revenues we anticipate immediately, or at all, and the hotel’s operating cash flow may be insufficient to pay the operating expenses and debt service associated with these hotels. If our hotels are unable to offset real estate costs with sufficient revenues, we may be adversely affected.
The increasing use of Internet travel intermediaries by consumers may materially and adversely affect our profitability.
Although a majority of rooms sold on the Internet are sold through websites maintained by the hotel franchisors and managers, some of our hotel rooms will be booked through Internet travel intermediaries. Typically, these Internet travel intermediaries purchase rooms at a negotiated discount from participating hotels, which could result in lower room rates than the franchisor or manager otherwise could have obtained. As these Internet bookings increase, these intermediaries may be able to obtain higher commissions, reduced room rates or other significant contract concessions from us and any hotel management companies that we engage. Moreover, some of these Internet travel intermediaries are attempting to offer hotel rooms as a commodity, by increasing the importance of price and general indicators of quality, such as “three-star downtown hotel,” at the expense of brand identification or quality of product or service. If consumers develop brand loyalties to Internet reservations systems rather than to the brands under which our hotels are franchised, the value of our hotels could deteriorate and our business could be materially and adversely affected. Although most of the business for our hotels is expected to be derived from traditional channels, if the amount of sales made through Internet intermediaries increases significantly, room revenues may flatten or decrease and our profitability may be materially and adversely affected.
Risks related to our organization and structure
We are subject to the risk of possibly being required to register as an investment company.
On February 27, 2015, we completed the sale of the Portfolio to ARCH and in return acquired the Preferred Equity, which currently represents more than 40% of our total assets (exclusive of cash and certain cash equivalents). Although our board of directors believes that we are not engaged primarily in the business of investing, reinvesting, or trading in securities, and we do not hold ourselves out as being primarily engaged in those activities, we appear to fall within the scope of section 3(a)(1)(C) of the Investment Company Act of 1940, as amended (the Investment Company Act), because the value of our investment securities (as defined in the Investment Company Act) is more than 40% of our total assets (exclusive of cash and certain cash equivalents).
A company that falls within the scope of section 3(a)(1)(C) of the Investment Company Act can avoid being regulated as an investment company if it can rely on certain of the exclusions from being deemed to be an “investment company” under the Investment Company Act. One such exclusion that management believes applies is Rule 3a-2 under the Investment Company Act, which allows a 3(a)(1)(C) investment company (as a “transient investment company”) a grace period of one year from the date of classification (in our case, the date of the sale of the Portfolio), to avoid registration under the Investment Company Act so long as it does not intend to engage primarily in the business of investing, reinvesting, owning, holding or trading in securities.
-20-
Rule 3a-2 under the Investment Company Act provides that a company is deemed not to be an investment company during a period of time not to exceed one year provided that the company has a bona fide intent to be engaged primarily, as soon as is reasonably possible (in any event by the termination of such period of time), in a business other than that of an investment company.
Accordingly, the Board will explore transactions pursuant to which we may cease to be deemed to be an investment company, such as the merger contemplated by the stipulation described in “Item 3. Legal Proceedings”, or the disposition of our investment securities, including through liquidation, or the acquisition of sufficient assets that are not investment securities in order for us not to be deemed an investment company under the Investment Company Act. There can be no assurance that we will be able to complete such actions by the applicable deadline, or at all. If we were required to register as an “investment company” under the Investment Company Act, applicable restrictions could make it impractical for us to continue our business as currently conducted and could have a material adverse effect on us.
Our officers and directors face conflicts of interest related to the positions they hold with affiliated entities.
All of our executive officers and directors are employed by our asset manager. As a result, these individuals may owe duties to other entities, which duties may conflict with our interests. Their loyalties to these other entities could result in actions or inactions that are detrimental to our business. Conflicts with our business and interests are most likely to arise from involvement in activities related to management time and services between us and the other entities and transactions with the asset manager’s affiliates.
Risks related to the preferred stock
There is only a limited trading market for the Series B preferred stock and the Series C preferred stock.
There is only a limited trading market for the Series B preferred stock and Series C preferred stock. The Series B preferred stock and Series C preferred stock trade on the OTC under the stock symbols “WGCBP” and “WGCCP,” respectively. Therefore, there can be no assurance as to the liquidity of any markets that may develop for the preferred stock, the ability of holders of the preferred stock to sell their shares, or the prices at which holders may be able to sell shares of the preferred stock. Holders of shares of the preferred stock who desire to liquidate substantial holdings at a single point in time may find that they are unable to dispose of their shares in the market without causing a substantial decline in the market value of such shares.
Whitehall, through Grace I, could exercise its vote over our common stock in a manner that would benefit Whitehall and its affiliates to the detriment of holders of the preferred stock.
Grace I, a subsidiary of Whitehall, owns all of our common stock and generally has control over decisions requiring shareholder approval, including the election of our directors (other than the two directors which may be elected by the holders of the Series B preferred stock and Series C preferred stock voting together as a single class while dividends of the preferred stock are in arrears). In circumstances involving a conflict of interest between Whitehall and holders of the preferred stock, Grace I could exercise its vote over our common stock in a manner that would benefit Whitehall and its affiliates to the detriment of holders of the preferred stock.
Whitehall, through PFD Holdings, LLC (PFD Holdings), could exercise its vote over the preferred stock in a manner that would benefit Whitehall and its affiliates to the detriment of other holders of the preferred stock.
PFD Holdings, a subsidiary of Whitehall, owns a majority of the preferred stock. In circumstances involving a conflict of interest between Whitehall and holders of the preferred stock, PFD Holdings could exercise its vote, or fail to exercise its vote, with respect to the shares of preferred stock owned by it in a manner that would benefit Whitehall and its affiliates to the detriment of other holders of the preferred stock (including with respect to the two directors which may be elected by the holders of the Series B preferred stock and Series C preferred stock voting together as a single class while dividends of the preferred stock are in arrears).
Our assets are insufficient to satisfy the liquidation preference and accrued and unpaid dividends.
Based on the 5.85 million shares of Series B preferred stock and Series C preferred stock outstanding, the total amount available to be distributed from the sale of the Portfolio is not expected to exceed approximately $22.96 per share of Series B preferred stock and Series C preferred stock which assumes that (a) the disposition fees payable to RMD are fully paid, (b)
-21-
the real estate tax make-whole under the Agreement is fully paid to ARCH and (c) the Company receives its 3% equity interest from the sale of the Remaining Hotels for $100 million (which has since been terminated, restated and amended, as described herein), net of costs to sell and does not take into account (i) the monthly preferred return, any present value discount of the Preferred Equity, or any risk that the Preferred Equity is not collectible, or (ii) any cash or other working capital assets and liabilities of the Company or Senior Mezz. While the Company currently has a stipulation of settlement pending court approval as described in “Item 3. Legal Proceedings”, which stipulation contemplates the payment of $26.00 per share of the Series B preferred stock and the Series C preferred stock in a going-private merger, there can be no assurance when such a transaction will occur or that such a transaction will occur at all. In the event that such a settlement is not approved or does not otherwise occur, we may engage in another transaction which would likely result in payment by us of less than $26.00 per share of the Series B preferred stock and the Series C preferred stock in extinguishment of such shares. Such a transaction may be considered prior to any redemption of the Preferred Equity in order to avoid registration as an investment company under the Investment Company Act as described above. Any such transaction would likely result in the Company monetizing the Preferred Equity. Solely for the purposes of this paragraph, we have assumed we own 100% of W2007 Equity LP (which in turn owns 3% of the equity interests of Senior Mezz), even though we actually own a 1% ownership interest in W2007 Equity LP. Nothing in this paragraph is an admission or assurance that we have the right to or will acquire the other 99% interest in W2007 Equity LP.
| ITEM 1B. | UNRESOLVED STAFF COMMENTS |
Not applicable.
| ITEM 2. | PROPERTIES |
As of December 31, 2013, we owned interests in 126 hotels located in 35 states comprising 14,934 rooms. The following table presents certain information related to the 20 Trust Hotels owned by our subsidiaries and the 106 OP Hotels owned by Senior Mezz (in which we had a 3% equity interest):
| Service | Year Ended December 31, 2013 | |||||||||||||||||||
| Hotel Property |
Location |
Type |
Rooms | Occupancy | ADR | RevPar | ||||||||||||||
| Hampton Inn |
Alcoa, TN | Limited | 118 | 81.1 | % | $ | 72.54 | $ | 58.84 | |||||||||||
| SpringHill Suites |
Asheville, NC | Limited | 88 | 75.0 | % | $ | 112.58 | $ | 84.42 | |||||||||||
| Homewood Suites |
Augusta, GA | Limited | 65 | 78.2 | % | $ | 116.45 | $ | 91.01 | |||||||||||
| Hampton Inn |
Austin, TX | Limited | 121 | 70.8 | % | $ | 106.38 | $ | 75.29 | |||||||||||
| Courtyard |
Carlsbad, CA | Limited | 145 | 68.4 | % | $ | 120.61 | $ | 82.56 | |||||||||||
| Hampton Inn |
College Station, TX | Limited | 133 | 70.0 | % | $ | 110.03 | $ | 77.03 | |||||||||||
| Courtyard |
Dalton, GA | Limited | 93 | 66.6 | % | $ | 90.05 | $ | 60.01 | |||||||||||
| Hampton Inn |
East Lansing, MI | Limited | 86 | 78.4 | % | $ | 120.79 | $ | 94.71 | |||||||||||
| Courtyard |
Houston, TX | Limited | 176 | 62.9 | % | $ | 130.97 | $ | 82.37 | |||||||||||
| Hampton Inn |
Indianapolis, IN | Limited | 128 | 66.7 | % | $ | 89.69 | $ | 59.80 | |||||||||||
| Residence Inn |
Jacksonville, FL | Limited | 78 | 78.5 | % | $ | 87.42 | $ | 68.58 | |||||||||||
| Hilton Garden Inn |
Louisville, KY | Limited | 112 | 69.8 | % | $ | 111.34 | $ | 77.71 | |||||||||||
| Hampton Inn |
Milford, CT | Limited | 148 | 65.3 | % | $ | 83.86 | $ | 54.79 | |||||||||||
| Hampton Inn |
Naperville, IL | Limited | 129 | 64.0 | % | $ | 98.42 | $ | 62.99 | |||||||||||
| Hampton Inn |
Orlando, FL | Limited | 170 | 79.3 | % | $ | 82.89 | $ | 65.72 | |||||||||||
| Homewood Suites |
Orlando, FL | Limited | 252 | 79.9 | % | $ | 101.22 | $ | 80.88 | |||||||||||
| Hilton Garden Inn |
Rio Rancho, NM | Limited | 129 | 65.7 | % | $ | 87.06 | $ | 57.17 | |||||||||||
| TownePlace Suites |
Savannah, GA | Limited | 95 | 72.0 | % | $ | 76.11 | $ | 54.81 | |||||||||||
| Homewood Suites |
Seattle, WA | Limited | 161 | 84.3 | % | $ | 153.56 | $ | 129.45 | |||||||||||
| Hampton Inn |
Urbana, IL | Limited | 130 | 65.9 | % | $ | 132.80 | $ | 87.47 | |||||||||||
|
|
|
|
|
|
|
|
|
|||||||||||||
| Subtotal Trust Hotels |
2,557 | 72.2 | % | $ | 105.23 | $ | 75.94 | |||||||||||||
|
|
|
|
|
|
|
|
|
|||||||||||||
| Hampton Inn |
Addison, TX | Limited | 158 | 68.6 | % | $ | 79.97 | $ | 54.90 | |||||||||||
| Hampton Inn |
Albany, NY | Limited | 153 | 76.5 | % | $ | 111.13 | $ | 84.99 | |||||||||||
| Hyatt Place |
Albuquerque, NM | Limited | 126 | 78.1 | % | $ | 100.00 | $ | 78.10 | |||||||||||
| Courtyard |
Asheville, NC | Limited | 78 | 76.0 | % | $ | 117.88 | $ | 89.59 | |||||||||||
| Courtyard |
Athens, GA | Limited | 105 | 60.0 | % | $ | 101.28 | $ | 60.76 | |||||||||||
| Fairfield Inn & Suites |
Atlanta, GA | Limited | 143 | 56.5 | % | $ | 78.71 | $ | 44.44 | |||||||||||
-22-
| Service | Year Ended December 31, 2013 | |||||||||||||||||||
| Hotel Property |
Location |
Type |
Rooms | Occupancy | ADR | RevPar | ||||||||||||||
| Hyatt Place |
Baton Rouge, LA | Limited | 126 | 66.2 | % | $ | 95.81 | $ | 63.42 | |||||||||||
| Hampton Inn |
Beckley, WV | Limited | 108 | 82.4 | % | $ | 116.67 | $ | 96.12 | |||||||||||
| Hampton Inn |
Birmingham, AL | Limited | 129 | 71.9 | % | $ | 101.51 | $ | 72.95 | |||||||||||
| Hyatt Place |
Birmingham, AL | Limited | 126 | 64.7 | % | $ | 86.87 | $ | 56.23 | |||||||||||
| Hyatt Place |
Bloomington, MN | Limited | 126 | 79.2 | % | $ | 101.00 | $ | 80.00 | |||||||||||
| Hyatt Place |
Blue Ash, OH | Limited | 125 | 62.5 | % | $ | 90.00 | $ | 56.21 | |||||||||||
| Hampton Inn |
Boca Raton, FL | Limited | 94 | 75.5 | % | $ | 114.48 | $ | 86.48 | |||||||||||
| Residence Inn |
Boise, ID | Limited | 104 | 81.6 | % | $ | 94.93 | $ | 77.45 | |||||||||||
| Courtyard |
Bowling Green, KY | Limited | 93 | 75.8 | % | $ | 97.76 | $ | 74.13 | |||||||||||
| Hampton Inn & Suites |
Boynton Beach, FL | Limited | 164 | 82.4 | % | $ | 109.52 | $ | 90.20 | |||||||||||
| Hampton Inn |
Charleston, SC | Limited | 124 | 73.4 | % | $ | 83.16 | $ | 61.05 | |||||||||||
| Hampton Inn |
Chattanooga, TN | Limited | 167 | 51.3 | % | $ | 78.05 | $ | 40.06 | |||||||||||
| Residence Inn |
Chattanooga, TN | Limited | 76 | 72.7 | % | $ | 123.77 | $ | 90.02 | |||||||||||
| Homewood Suites |
Chicago, IL | Limited | 233 | 83.1 | % | $ | 177.79 | $ | 147.80 | |||||||||||
| Hampton Inn |
Colorado Springs, CO | Limited | 125 | 47.5 | % | $ | 87.64 | $ | 41.62 | |||||||||||
| Residence Inn |
Colorado Springs, CO | Limited | 96 | 67.0 | % | $ | 100.03 | $ | 67.06 | |||||||||||
| Hampton Inn |
Columbus, GA | Limited | 118 | 59.5 | % | $ | 65.82 | $ | 39.17 | |||||||||||
| Hyatt Place |
Columbus, OH | Limited | 124 | 69.7 | % | $ | 96.31 | $ | 67.15 | |||||||||||
| Courtyard |
Dallas, TX | Limited | 184 | 68.7 | % | $ | 109.66 | $ | 75.39 | |||||||||||
| Fairfield Inn & Suites |
Dallas, TX | Limited | 116 | 62.5 | % | $ | 94.30 | $ | 58.91 | |||||||||||
| Hampton Inn |
Deerfield Beach, FL | Limited | 106 | 79.7 | % | $ | 101.63 | $ | 80.98 | |||||||||||
| Hampton Inn |
Dublin, OH | Limited | 123 | 69.5 | % | $ | 98.65 | $ | 68.58 | |||||||||||
| Residence Inn |
Eagan, MN | Limited | 120 | 78.1 | % | $ | 98.51 | $ | 76.94 | |||||||||||
| Residence Inn |
El Segundo, CA | Limited | 150 | 88.6 | % | $ | 143.18 | $ | 126.84 | |||||||||||
| Courtyard |
Elmhurst, IL | Limited | 140 | 66.1 | % | $ | 94.18 | $ | 62.24 | |||||||||||
| Hampton Inn |
Fayetteville, NC | Limited | 121 | 81.3 | % | $ | 75.36 | $ | 61.24 | |||||||||||
| Hampton Inn & Suites |
Franklin, TN | Limited | 127 | 75.2 | % | $ | 118.60 | $ | 89.21 | |||||||||||
| Hyatt Place |
Franklin, TN | Limited | 126 | 72.8 | % | $ | 105.70 | $ | 76.94 | |||||||||||
| Residence Inn |
Ft Myers, FL | Limited | 78 | 70.4 | % | $ | 106.35 | $ | 74.90 | |||||||||||
| Courtyard |
Gainesville, FL | Limited | 81 | 80.1 | % | $ | 112.53 | $ | 90.18 | |||||||||||
| Hampton Inn |
Gastonia, NC | Limited | 107 | 72.1 | % | $ | 90.87 | $ | 65.54 | |||||||||||
| Homewood Suites |
Germantown, TN | Limited | 92 | 79.9 | % | $ | 101.34 | $ | 80.92 | |||||||||||
| Hyatt Place |
Glen Allen, VA | Limited | 124 | 64.2 | % | $ | 89.35 | $ | 57.41 | |||||||||||
| Hampton Inn |
Glen Burnie, MD | Limited | 116 | 69.1 | % | $ | 99.80 | $ | 69.01 | |||||||||||
| Hampton Inn |
Grand Rapids, MI | Limited | 84 | 74.9 | % | $ | 122.47 | $ | 91.77 | |||||||||||
| SpringHill Suites |
Grand Rapids, MI | Limited | 76 | 72.8 | % | $ | 118.21 | $ | 86.07 | |||||||||||
| Hampton Inn |
Gurnee, IL | Limited | 134 | 70.7 | % | $ | 90.46 | $ | 63.92 | |||||||||||
| SpringHill Suites |
Houston, TX | Limited | 122 | 73.0 | % | $ | 92.45 | $ | 67.45 | |||||||||||
| Hyatt Place |
Indianapolis, IN | Limited | 124 | 67.8 | % | $ | 107.38 | $ | 72.83 | |||||||||||
| Courtyard |
Jacksonville, FL | Limited | 81 | 77.5 | % | $ | 88.59 | $ | 68.62 | |||||||||||
| Hampton Inn |
Kansas City, MO | Limited | 120 | 62.1 | % | $ | 102.66 | $ | 63.72 | |||||||||||
| Courtyard |
Knoxville, TN | Limited | 78 | 65.4 | % | $ | 122.99 | $ | 80.48 | |||||||||||
| Residence Inn |
Knoxville, TN | Limited | 78 | 77.2 | % | $ | 105.22 | $ | 81.26 | |||||||||||
| Hyatt Place |
Las Vegas, NV | Limited | 202 | 76.6 | % | $ | 85.37 | $ | 65.42 | |||||||||||
| Courtyard |
Lexington, KY | Limited | 90 | 81.0 | % | $ | 109.66 | $ | 88.79 | |||||||||||
| Residence Inn |
Lexington, KY | Limited | 91 | 79.2 | % | $ | 104.63 | $ | 82.84 | |||||||||||
| SpringHill Suites |
Lexington, KY | Limited | 108 | 77.5 | % | $ | 100.24 | $ | 77.65 | |||||||||||
| Hyatt Place |
Linthicum Heights, MD | Limited | 127 | 76.7 | % | $ | 96.39 | $ | 73.96 | |||||||||||
| Courtyard |
Louisville, KY | Limited | 140 | 74.8 | % | $ | 134.81 | $ | 100.81 | |||||||||||
| Residence Inn |
Macon, GA | Limited | 78 | 67.8 | % | $ | 90.17 | $ | 61.11 | |||||||||||
| Hampton Inn |
Madison Heights, MI | Limited | 123 | 79.1 | % | $ | 95.04 | $ | 75.19 | |||||||||||
| Hampton Inn |
Maryland Heights, MO | Limited | 122 | 63.0 | % | $ | 95.97 | $ | 60.42 | |||||||||||
-23-
| Service | Year Ended December 31, 2013 | |||||||||||||||||||
| Hotel Property |
Location |
Type |
Rooms | Occupancy | ADR | RevPar | ||||||||||||||
| Hampton Inn |
Memphis, TN | Limited | 124 | 76.8 | % | $ | 100.76 | $ | 77.37 | |||||||||||
| Hyatt Place |
Memphis, TN | Limited | 126 | 70.6 | % | $ | 95.63 | $ | 67.48 | |||||||||||
| Holiday Inn Express |
Miami, FL | Limited | 66 | 80.5 | % | $ | 118.20 | $ | 95.16 | |||||||||||
| Hyatt Place |
Miami, FL | Limited | 124 | 85.9 | % | $ | 110.56 | $ | 94.92 | |||||||||||
| Courtyard |
Mobile, AL | Limited | 78 | 63.0 | % | $ | 95.98 | $ | 60.45 | |||||||||||
| Residence Inn |
Mobile, AL | Limited | 66 | 77.6 | % | $ | 107.00 | $ | 83.07 | |||||||||||
| Residence Inn |
Monmouth Junction, NJ | Limited | 208 | 57.7 | % | $ | 114.00 | $ | 65.76 | |||||||||||
| Hampton Inn |
Morgantown, WV | Limited | 107 | 72.1 | % | $ | 114.62 | $ | 82.64 | |||||||||||
| Holiday Inn |
Mt. Pleasant, SC | Full | 158 | 59.3 | % | $ | 99.26 | $ | 58.84 | |||||||||||
| Hampton Inn |
Norfolk, VA | Limited | 117 | 60.5 | % | $ | 87.09 | $ | 52.72 | |||||||||||
| Hampton Inn |
Northville , MI | Limited | 124 | 63.1 | % | $ | 97.56 | $ | 61.53 | |||||||||||
| Residence Inn |
Oklahoma City, OK | Limited | 136 | 77.3 | % | $ | 96.32 | $ | 74.45 | |||||||||||
| Residence Inn |
Omaha, NE | Limited | 80 | 80.3 | % | $ | 107.56 | $ | 86.40 | |||||||||||
| Courtyard |
Orlando, FL | Limited | 112 | 70.3 | % | $ | 100.69 | $ | 70.83 | |||||||||||
| Embassy Suites |
Orlando, FL | Full | 246 | 79.6 | % | $ | 110.19 | $ | 87.68 | |||||||||||
| Hampton Inn |
Overland Park, KS | Limited | 133 | 59.4 | % | $ | 96.96 | $ | 57.57 | |||||||||||
| Hyatt Place |
Overland Park, KS | Limited | 124 | 65.1 | % | $ | 91.38 | $ | 59.46 | |||||||||||
| Hampton Inn |
Palm Beach Gardens, FL | Limited | 116 | 81.1 | % | $ | 108.91 | $ | 88.34 | |||||||||||
| Homewood Suites |
Peabody, MA | Limited | 85 | 75.9 | % | $ | 121.21 | $ | 91.99 | |||||||||||
| Hampton Inn |
Peabody, MA | Limited | 120 | 68.1 | % | $ | 113.34 | $ | 77.14 | |||||||||||
| Homewood Suites |
Phoenix , AZ | Limited | 124 | 77.2 | % | $ | 113.46 | $ | 87.57 | |||||||||||
| Hampton Inn |
Pickwick Dam, TN | Limited | 50 | 61.6 | % | $ | 99.63 | $ | 61.33 | |||||||||||
| Residence Inn |
Portland, OR | Limited | 168 | 87.5 | % | $ | 134.85 | $ | 117.94 | |||||||||||
| Hilton Garden Inn |
Round Rock, TX | Limited | 122 | 70.1 | % | $ | 100.10 | $ | 70.19 | |||||||||||
| SpringHill Suites |
Round Rock, TX | Limited | 104 | 63.9 | % | $ | 91.68 | $ | 58.59 | |||||||||||
| Homewood Suites |
San Antonio, TX | Limited | 123 | 81.1 | % | $ | 107.58 | $ | 87.29 | |||||||||||
| SpringHill Suites |
San Antonio, TX | Limited | 112 | 65.6 | % | $ | 84.04 | $ | 55.12 | |||||||||||
| Residence Inn |
San Diego, CA | Limited | 95 | 87.1 | % | $ | 145.04 | $ | 126.35 | |||||||||||
| SpringHill Suites |
San Diego, CA | Limited | 137 | 76.5 | % | $ | 117.35 | $ | 89.74 | |||||||||||
| Courtyard |
Sarasota, FL | Limited | 81 | 71.0 | % | $ | 101.17 | $ | 71.84 | |||||||||||
| Residence Inn |
Sarasota, FL | Limited | 78 | 80.2 | % | $ | 107.78 | $ | 86.48 | |||||||||||
| Residence Inn |
Savannah, GA | Limited | 66 | 85.8 | % | $ | 107.51 | $ | 92.24 | |||||||||||
| Hampton Inn |
Scranton, PA | Limited | 129 | 70.9 | % | $ | 109.54 | $ | 77.62 | |||||||||||
| Homewood Suites |
Sharonville, OH | Limited | 111 | 71.8 | % | $ | 101.79 | $ | 73.05 | |||||||||||
| Residence Inn |
Somers Point, NJ | Limited | 119 | 67.6 | % | $ | 118.03 | $ | 79.75 | |||||||||||
| Hampton Inn |
State College, PA | Limited | 119 | 60.5 | % | $ | 112.89 | $ | 68.33 | |||||||||||
| Courtyard |
Tallahassee, FL | Limited | 93 | 66.3 | % | $ | 112.23 | $ | 74.45 | |||||||||||
| Residence Inn |
Tallahassee, FL | Limited | 78 | 76.8 | % | $ | 107.01 | $ | 82.15 | |||||||||||
| Hyatt Place |
Tampa, FL | Limited | 124 | 86.7 | % | $ | 98.84 | $ | 85.65 | |||||||||||
| Residence Inn |
Tampa, FL | Limited | 78 | 82.0 | % | $ | 97.90 | $ | 80.27 | |||||||||||
| Residence Inn |
Tampa, FL | Limited | 102 | 78.2 | % | $ | 98.26 | $ | 76.81 | |||||||||||
| Residence Inn |
Tinton Falls, NJ | Limited | 96 | 94.2 | % | $ | 107.86 | $ | 101.56 | |||||||||||
| Residence Inn |
Tucson, AZ | Limited | 128 | 59.2 | % | $ | 101.37 | $ | 60.01 | |||||||||||
| Hampton Inn |
West Columbia, SC | Limited | 120 | 65.6 | % | $ | 81.66 | $ | 53.61 | |||||||||||
| Hampton Inn |
West Palm Beach, FL | Limited | 110 | 78.2 | % | $ | 109.09 | $ | 85.31 | |||||||||||
| Hampton Inn |
Westlake, OH | Limited | 122 | 73.9 | % | $ | 103.73 | $ | 76.67 | |||||||||||
| Residence Inn |
Williston, VT | Limited | 96 | 79.3 | % | $ | 108.19 | $ | 85.80 | |||||||||||
| Homewood Suites |
Windsor Locks, CT | Limited | 132 | 71.0 | % | $ | 114.42 | $ | 81.29 | |||||||||||
|
|
|
|
|
|
|
|
|
|||||||||||||
| Subtotal OP Hotels |
12,377 | 72.3 | % | $ | 104.99 | $ | 75.90 | |||||||||||||
|
|
|
|
|
|
|
|
|
|||||||||||||
| 14,934 | 72.3 | % | $ | 105.03 | $ | 75.91 | ||||||||||||||
|
|
|
|
|
|
|
|
|
|||||||||||||
-24-
| ITEM 3. | LEGAL PROCEEDINGS |
The Company is involved in various legal proceedings and disputes arising in the ordinary course of business. The Company does not believe that the disposition of such legal proceedings and disputes will have a material adverse effect on our business, the financial position, continuing operations or cash flows except as described below.
In September 2013, a putative class action lawsuit (the Johnson Lawsuit) was filed in the Tennessee Chancery Court, Shelby County, Tennessee (the Chancery Court) by several current and former holders of the preferred stock. Plaintiffs allege that, since October 2007, the defendants named in the complaint have engaged in a scheme to oppress and then squeeze-out the holders of the preferred stock, including by allegedly suppressing the marketability of the shares, causing the Company to cease paying dividends, and purchasing 58.8% of the shares in a series of alleged “creeping” tender offers beginning in 2012. The complaint names as defendants the Company, the members of our board of directors, the majority shareholders of the Company (Grace I, Whitehall and PFD Holdings), the GS Group and Goldman Sachs Realty Management L.P. (RMD). The complaint asserts claims for breach of contract, breach of fiduciary duty, aiding and abetting, and for violations of the Tennessee Blue Sky laws and the Tennessee Business Corporations Act. On October 4, 2013, defendants removed the action to the United States District Court for the Western District of Tennessee (the Federal Court). On November 6, 2013, plaintiffs filed a motion to remand the case to Chancery Court. The defendants filed their opposition on December 6, 2013. The remand motion was fully briefed on December 20, 2013. On July 28, 2014, the Federal Court denied the remand motion. The defendants also moved to dismiss the Johnson Lawsuit on January 23, 2014. The Federal Court entered a scheduling order governing further proceedings in the litigation on February 14, 2014, as amended on June 19, 2014 and July 28, 2014, and the parties engaged in merits and class certification discovery. Also, pursuant to the schedule, plaintiffs filed their opposition to defendants’ dismissal motion on March 21, 2014, and defendants filed their reply papers in further support of their motion on April 25, 2014. Plaintiffs moved for class certification on May 16, 2014.
After the Company announced the Original Purchase Agreement with ARCH on June 2, 2014, defendants and plaintiffs engaged in settlement negotiations. Thereafter, plaintiffs made requests for, and defendants provided to plaintiffs, information regarding the transaction contemplated by the Original Purchase Agreement (the ARCH Transaction). Among other information provided, the Company estimated a reasonable fair present value of the proceeds that could be distributed to holders of the preferred stock as a result of the ARCH Transaction, as announced, to be approximately $18.50 per share of preferred stock. Plaintiffs retained and consulted with two financial advisors with regard to the ARCH Transaction. During this period, the parties to the Johnson Lawsuit continued to engage in both merits and class certification discovery. On August 20, 2014, the parties entered into a Memorandum of Understanding (MOU) containing the key terms of a proposed settlement. On August 22, 2014, the parties held a telephone conference with the Federal Court, in which the Federal Court agreed that, in light of the MOU, the parties would no longer be subject to the pending deadlines in the then current scheduling order. For the Federal Court’s convenience in managing its docket, the defendants agreed to withdraw their pending motion to dismiss without prejudice. On September 2, 2014, the Federal Court granted the defendants’ motion to withdraw its motion to dismiss without prejudice to renew. The defendants may renew their motion to dismiss in the event that the proposed settlement of the Johnson Lawsuit does not become final.
The stipulation, which was submitted to the Federal Court on October 9, 2014 and amended on December 4, 2014, would settle claims with respect to two classes described in the Johnson Lawsuit: (1) the “Holder Class” consisting of any and all persons who, as of August 22, 2014 and through the effective time of the merger contemplated by the stipulation, hold the preferred stock, excluding defendants and their affiliates, persons who opt out of the Holder Class and holders of dissenting shares and (2) the “Seller Class” consisting of all persons who sold some or all of their shares of preferred stock between October 25, 2007 and October 8, 2014, inclusive, and suffered a loss, excluding the defendants, their affiliates and persons who sold shares to PFD Holdings, and persons who opt out of the Seller Class. The stipulation was preliminarily approved by the Federal Court on April 30, 2015 and remains subject to final approval by the Federal Court. A hearing on final approval is scheduled for September 11, 2015.
In October 2013, a similar lawsuit was filed by another plaintiff in the same Chancery Court (the Dent Lawsuit), alleging similar breaches against several of the same defendants named in the Johnson Lawsuit, in addition to a former member of the Company’s board of directors. The plaintiffs and defendants in the Dent Lawsuit agreed to stay this case until the motion to remand in the Johnson lawsuit was decided. As stipulated by the parties, plaintiff must file any response to defendants’ motion to stay within ten business days after notice of the Federal Court decision denying the remand motion. Defendants notified plaintiff of the resolution of the remand motion in the Johnson Lawsuit, and plaintiff has not filed a response to the motion to stay. The proposed settlement in the Johnson Lawsuit purports to encompass the claims asserted in the Dent Lawsuit.
-25-
| ITEM 4. | MINE SAFETY DISCLOSURES |
Not applicable.
| ITEM 5. | MARKET FOR REGISTRANT’S COMMON EQUITY, RELATED STOCKHOLDER MATTERS, AND ISSUER PURCHASES OF EQUITY SECURITIES |
Since the Merger, all of our 100 issued and outstanding shares of common stock have been held by Grace I. Therefore, there is currently no public trading market for our common stock.
We have not paid any cash dividends on our common stock in the past two years. Payment of any future dividends will depend upon our earnings and capital requirements, contractual restrictions, and other factors our board of directors considers appropriate. Our ability to declare common dividends is affected by covenants under the Company’s debt agreements and limitations under the Company’s charter. See Note 7 of the consolidated financial statements located in “Item 8. Financial Statements and Supplementary Data” for further information.
| ITEM 6. | SELECTED FINANCIAL DATA |
The following selected historical financial information should be read in conjunction with “Management’s Discussion and Analysis of Financial Condition and Results of Operations” and the historical consolidated financial statements as of December 31, 2014, 2013 and 2012 and for the four years ended December 31, 2014, 2013, 2012 and 2011, and the related notes included in “Item 8. Financial Statements and Supplementary Data.”
-26-
| Year Ended December 31, | ||||||||||||||||||||||||
| 2014 | 2013 | 2012 | 2011 | 2010 | 2009 | |||||||||||||||||||
| (in thousands) | ||||||||||||||||||||||||
| Operating Data (1), (2): |
||||||||||||||||||||||||
| Total hotel revenues |
$ | 179,627 | $ | 428,551 | $ | 409,847 | $ | 388,299 | $ | 365,150 | $ | 343,393 | ||||||||||||
| Total operating expenses |
167,895 | 409,468 | 459,860 | 357,725 | 432,668 | 683,749 | ||||||||||||||||||
| Operating income (loss) |
11,732 | 19,083 | (50,013 | ) | 30,574 | (67,518 | ) | (340,356 | ) | |||||||||||||||
| Loss from continuing operations |
(31,664 | ) | (63,532 | ) | (134,359 | ) | (54,220 | ) | (113,072 | ) | (418,303 | ) | ||||||||||||
| Income (loss) from discontinued operations |
— | (8,081 | ) | (1,876 | ) | 4,720 | (16,035 | ) | (9,536 | ) | ||||||||||||||
| Net loss |
(31,664 | ) | (71,613 | ) | (136,235 | ) | (49,500 | ) | (129,107 | ) | (427,839 | ) | ||||||||||||
| Net loss attributable to the Company |
(27,280 | ) | (1,802 | ) | (1,835 | ) | (576 | ) | (1,739 | ) | (5,092 | ) | ||||||||||||
| Net loss attributable to common shareholders |
(27,280 | ) | (1,802 | ) | (1,835 | ) | (576 | ) | (1,739 | ) | (5,092 | ) | ||||||||||||
| Balance Sheet Data: |
||||||||||||||||||||||||
| Investments in real estate, net |
$ | 240,830 | $ | 1,392,097 | $ | 1,562,422 | $ | 1,697,963 | $ | 1,754,844 | $ | 1,883,441 | ||||||||||||
| Cash and cash equivalents |
12,444 | 12,404 | 13,051 | 11,782 | 10,825 | 15,745 | ||||||||||||||||||
| Restricted cash |
2,809 | 46,849 | 35,341 | 41,980 | 45,185 | 58,194 | ||||||||||||||||||
| Total assets |
265,020 | 1,470,450 | 1,630,362 | 1,772,894 | 1,833,291 | 1,978,152 | ||||||||||||||||||
| Total debt |
203,126 | 1,161,725 | 1,245,557 | 1,261,040 | 1,284,075 | 1,297,207 | ||||||||||||||||||
| Total other liabilities |
41,220 | 58,515 | 62,966 | 53,767 | 41,552 | 53,745 | ||||||||||||||||||
| Total shareholders’ equity |
36,421 | 63,917 | 65,719 | 66,486 | 67,063 | 68,707 | ||||||||||||||||||
| Non-controlling equity purchase option |
— | 175,000 | 175,000 | 281,811 | 281,811 | 281,811 | ||||||||||||||||||
| Non-controlling interest |
(15,747 | ) | 11,293 | 81,120 | 109,790 | 158,790 | 276,682 | |||||||||||||||||
| Cash Flow Data: |
||||||||||||||||||||||||
| Cash flows from operating activities |
$ | 22,038 | $ | 62,451 | $ | 63,662 | $ | 56,281 | $ | 53,868 | $ | 37,434 | ||||||||||||
| Cash flows from (used in) investing activities |
20,150 | 35,815 | (36,729 | ) | (39,162 | ) | (50,856 | ) | (69,056 | ) | ||||||||||||||
| Cash flows from (used in) financing activities |
(42,148 | ) | (98,913 | ) | (25,664 | ) | (16,162 | ) | (7,931 | ) | 35,828 | |||||||||||||
| Other Data: |
||||||||||||||||||||||||
| Cash dividends declared per common share |
$ | — | $ | — | $ | — | $ | — | $ | — | $ | — | ||||||||||||
| EBITDA (unaudited) (3) |
32,893 | 99,243 | 39,437 | 120,837 | (461 | ) | (266,126 | ) | ||||||||||||||||
| Adjusted EBITDA (unaudited) (3) |
54,188 | 135,436 | 125,898 | 118,189 | 101,164 | 100,314 | ||||||||||||||||||
| (1) | All years presented have been adjusted to reflect hotels no longer owned as of December 31, 2014 and 2013 (no hotels were sold during the year ended December 31, 2014) as discontinued operations. |
| (2) | The Company has not disclosed earnings per share data as this information is not meaningful as there are only 100 shares of common stock issued and outstanding, all of which are wholly owned by Grace I. |
| (3) | A more detailed description and computation of EBITDA is contained in the “Non-GAAP Financial Measures” section of “Item 7. Management’s Discussion and Analysis of Financial Condition and Results of Operations.” |
-27-
| ITEM 7. | MANAGEMENT’S DISCUSSION AND ANALYSIS OF FINANCIAL CONDITION AND RESULTS OF OPERATIONS |
The following discussion should be read in conjunction with the consolidated financial statements and related notes included elsewhere in this report. This discussion contains forward-looking statements about our business. These statements are based on current expectations and assumptions that are subject to risks and uncertainties. Actual results could differ materially because of factors discussed in “Cautionary Statement About Forward-Looking Statements” and “Risk Factors” contained elsewhere in this report.
In 2014, there were very significant changes regarding the Company, including (i) the refinancing of certain of the Company’s indebtedness on April 11, 2014, (ii) the exercise of the Purchase Option on April 11, 2014, and (iii) the entry into a non-binding memorandum of understanding with respect to certain litigation involving the preferred stock of the Company on August 20, 2014 as described in “Item 3. Legal Proceedings.” These changes have had a substantial impact on the Company.
As described in “Item 1. Business” of this Form 10-K, on February 27, 2015, consolidated subsidiaries of the Company sold all 20 of the Trust Hotels, and subsidiaries of Senior Mezz, an entity in which the Company has a 3% equity interest, sold 96 of the 106 OP hotels to subsidiaries of ARCH. On March 25, 2015, subsidiaries of Senior Mezz entered into an agreement to sell the Remaining Hotels for $100 million. The agreement to sell the Remaining Hotels was terminated on May 6, 2015 and reinstated and amended on June 8, 2015 to reinstate the contract and provide for the sale of nine of the Remaining Hotels for a purchase price of $85 million. If the sale of nine of the Remaining Hotels closes, subsidiaries of Senior Mezz will own one Remaining Hotel. As such, as of the date of this Form 10-K, the Company owns interests in several companies, but no longer operates any assets. Furthermore, the discussions herein of our historical financial condition, results of operations and cash flow are not expected to be indicative of our future financial condition, results of operations or cash flow.
EXECUTIVE OVERVIEW
Following the recession that commenced in 2008, the lodging industry has experienced improvement in fundamentals, which continued in 2013 and 2014. ADR, which typically lags occupancy growth in the early stage of a recovery, has shown upward growth. We believe improvements in the economy will continue to positively impact the lodging and hotel operating results for the near future.
As mentioned above, the U.S. lodging industry continued to exhibit positive fundamentals during 2013 and 2014. While there continued to be concerns about a slow-moving national economy and decreased spending, as well as the increased global volatility and risk related to the European debt crisis, corporate profits and employment continued to improve in the United States during the periods covered by this Form 10-K.
The strength in corporate transient, group and leisure travel, specifically in the major urban markets, has continued to drive increases in occupancy and ADR. New hotel supply remains at historically low levels and is expected to remain relatively low given the lack of available financing for new hotel construction. There can be no assurance that this low level of new supply will continue and, in fact, supply levels have increased from their historic lows during 2014 and early 2015. We continue to believe that we will see a long and healthy recovery in the lodging industry and believe our properties have significant opportunities to achieve significant growth in their operating cash flows and long-term economic values.
RESULTS OF OPERATIONS
RevPAR is a commonly used measure within the hotel industry to evaluate hotel operations. RevPAR is defined as the product of the ADR charged and the average daily occupancy achieved. RevPAR does not include revenues from food and beverage or parking, telephone or other guest services generated by the property. Although RevPAR does not include these ancillary revenues, it is generally considered the leading indicator of core revenues for many hotels. We also use RevPAR to compare the results of our hotels between periods and to analyze results of our comparable hotels (hotels we have owned for the entire years ended December 31, 2014, 2013, 2012 and 2011). RevPAR improvements attributable to increases in occupancy are generally accompanied by increases in most categories of variable operating costs. RevPAR improvements attributable to increases in ADR are generally accompanied by increases in limited categories of operating costs, such as management fees and franchise fees.
We present our results of operations on a consolidated basis in accordance with GAAP, consistent with the preparation of our consolidated financial statements. GAAP requires us to consolidate all of the operations of those hotels that we control, including through subsidiaries. As a result for the year ended December 31, 2014, our results of operations reflect 100% of
-28-
the revenues and expenses of the Trust Hotels and the OP Hotels until the exercise of the Purchase Option on April 11, 2014. After April 11, 2014, our results of operations reflect 100% of the revenues and expenses of only the Trust Hotels and we recognize our 3% of the net income or loss of Senior Mezz (which indirectly owns the OP Hotels) in a single line item. For the years ended December 31, 2013, 2012 and 2011, our results of operations reflect 100% of the revenues and expenses of the Trust Hotels and the OP Hotels. However, because we own only a 1% ownership interest in W2007 Equity LP, the subsidiary through which we indirectly own and control the OP Hotels and which has a 99% ownership interest in the Trust Hotels, Grace I, rather than us, participates more significantly in the results of the hotels. We refer to the interest held by Grace I as the “non-controlling interest.” In reviewing our results of operations it is important to bear in mind that only a small portion of the results of our hotels ultimately redound to our benefit, in the case of a profit, or detriment, in the case of a loss. Also, certain expenses, including the litigation settlement described under “Item 3. Legal Proceedings,” relate directly to the Company and, therefore, these expenses are or will be borne entirely by the Company.
The following tables summarize the change in key line items from our consolidated statements of operations and comprehensive loss for the indicated dates below (in thousands):
| Year Ended December 31, | Change | |||||||||||||||||||||||||||
| 2014 | 2013 | 2012 | 2011 | 2014 to 2013 |
2013 to 2012 |
2012 to 2011 |
||||||||||||||||||||||
| Total hotel revenues |
$ | 179,627 | $ | 428,551 | $ | 409,847 | $ | 388,299 | $ | (248,924 | ) | $ | 18,704 | $ | 21,548 | |||||||||||||
| Direct hotel expenses |
103,447 | 253,347 | 244,728 | 233,437 | (149,900 | ) | 8,619 | 11,291 | ||||||||||||||||||||
| Property tax, ground lease, insurance and property management fees |
13,064 | 31,656 | 31,020 | 29,440 | (18,592 | ) | 636 | 1,580 | ||||||||||||||||||||
| Corporate overhead |
5,967 | 6,454 | 6,482 | 5,245 | (487 | ) | (28 | ) | 1,237 | |||||||||||||||||||
| Asset management fees |
3,073 | 7,063 | 6,648 | 6,137 | (3,990 | ) | 415 | 511 | ||||||||||||||||||||
| Depreciation and amortization |
33,308 | 83,292 | 85,298 | 78,983 | (49,984 | ) | (2,006 | ) | 6,315 | |||||||||||||||||||
| Impairment charges |
9,036 | 27,656 | 85,684 | 4,483 | (18,620 | ) | (58,028 | ) | 81,201 | |||||||||||||||||||
|
|
|
|
|
|
|
|
|
|
|
|
|
|
|
|||||||||||||||
| Operating income (loss) |
11,732 | 19,083 | (50,013 | ) | 30,574 | (7,351 | ) | 69,096 | (80,587 | ) | ||||||||||||||||||
| Equity in loss from Senior Mezz |
(1,429 | ) | — | — | — | (1,429 | ) | — | — | |||||||||||||||||||
| Interest income |
76 | 82 | 87 | 101 | (6 | ) | (5 | ) | (14 | ) | ||||||||||||||||||
| Interest expense |
(31,325 | ) | (82,856 | ) | (84,433 | ) | (84,512 | ) | 51,531 | 1,577 | 79 | |||||||||||||||||
| Other income |
112 | 216 | 35 | 18 | (104 | ) | 181 | 17 | ||||||||||||||||||||
| Unrealized loss on derivatives |
— | (57 | ) | (35 | ) | (401 | ) | 57 | (22 | ) | 366 | |||||||||||||||||
| Contingent loss on litigation settlement |
(24,250 | ) | — | — | — | (24,250 | ) | — | — | |||||||||||||||||||
| Gain on sale of investment of real estate |
221 | — | — | — | 221 | — | — | |||||||||||||||||||||
| Gain on extinguishment of debt |
13,199 | — | — | — | 13,199 | — | — | |||||||||||||||||||||
|
|
|
|
|
|
|
|
|
|
|
|
|
|
|
|||||||||||||||
| Loss from continuing operations |
(31,664 | ) | (63,532 | ) | (134,359 | ) | (54,220 | ) | 31,868 | 70,827 | (80,139 | ) | ||||||||||||||||
| Income (loss) from discontinued operations |
— | (8,081 | ) | (1,876 | ) | 4,720 | 8,081 | (6,205 | ) | (6,596 | ) | |||||||||||||||||
|
|
|
|
|
|
|
|
|
|
|
|
|
|
|
|||||||||||||||
| Net loss |
(31,664 | ) | (71,613 | ) | (136,235 | ) | (49,500 | ) | 39,949 | 64,622 | (86,735 | ) | ||||||||||||||||
| Net loss attributable to non-controlling interest |
4,384 | 69,811 | 134,400 | 48,924 | (65,427 | ) | (64,589 | ) | 85,476 | |||||||||||||||||||
|
|
|
|
|
|
|
|
|
|
|
|
|
|
|
|||||||||||||||
| Net loss attributable to the Company |
$ | (27,280 | ) | $ | (1,802 | ) | $ | (1,835 | ) | $ | (576 | ) | $ | (25,478 | ) | $ | 33 | $ | (1,259 | ) | ||||||||
|
|
|
|
|
|
|
|
|
|
|
|
|
|
|
|||||||||||||||
-29-
Comparison of the year ended December 31, 2014 to the year ended December 31, 2013
The key performance indicators of the hotels that are included in continuing operations as of December 31, 2014 are illustrated by the following table:
| Year Ended December 31, | ||||||||
| 2014 | 2013 | |||||||
| Total hotel revenues (in thousands) |
$ | 179,627 | $ | 428,551 | ||||
| Rooms revenue (in thousands) |
$ | 173,222 | $ | 413,732 | ||||
| Occupancy |
74.3 | % | 72.3 | % | ||||
| ADR |
$ | 110.05 | $ | 105.03 | ||||
| RevPAR |
$ | 81.72 | $ | 75.91 | ||||
Total hotel revenues
Rooms revenue for the year ended December 31, 2014 decreased $240.5 million, or 58.1%, to $173.2 million from $413.7 million for the year ended December 31, 2013. The decrease in rooms revenue was primarily due to the deconsolidation of the 106 OP Hotels on April 11, 2014. During 2014, we experienced a 4.8% increase in ADR as the economy continued to improve. Food and beverage revenue experienced a similar decrease of $4.6 million, or 56.9%, primarily due to the deconsolidation of the 106 OP Hotels on April 11, 2014. Other revenue, which consists mainly of guest telephone charges, equipment rentals, vending income, in-room movie sales, parking and business centers, experienced a decrease of $3.8 million, 56.7%, also primarily due to the deconsolidation of the 106 OP Hotels on April 11, 2014.
Direct hotel expenses
Direct hotel expenses consist of direct expenses from departments associated with revenue streams (departmental expenses) and non-departmental expenses associated with operating our hotels. We experienced decreases of $70.5 million in departmental expenses and $79.4 million in non-departmental expenses during 2014, primarily due to the deconsolidation of the 106 OP Hotels on April 11, 2014. The decrease in these expenses is consistent with the decrease in total hotel revenues over the same period. Direct hotel expenses were 57.6% and 59.1% of total hotel revenues for 2014 and 2013, respectively, and this change was due primarily to the change in the mix of hotel brands that remain after the deconsolidation of the OP Hotels.
Property tax, ground lease, insurance and property management fees
Property tax, ground lease, insurance and property management fees decreased $18.6 million to $13.1 million for 2014 compared to $31.7 million for 2013. This decrease is primarily related to the deconsolidation of the 106 OP Hotels on April 11, 2014 partially offset by increased real estate taxes and to a lesser extent higher base management fees and insurance.
Corporate overhead
Corporate overhead expenses decreased slightly for 2014 compared to 2013, $6.0 million and $6.5 million, respectively. This decrease was primarily attributable to the decrease in corporate overhead related to the deconsolidation of the 106 OP Hotels on April 11, 2014 and the resultant decrease in overhead related to our hotels.
Asset management fees
Asset management fees decreased $4.0 million to $3.1 million for 2014 compared to $7.1 million for 2013. This decrease is primarily due to the deconsolidation of the 106 OP Hotels on April 11, 2014 and the resultant decrease in asset management fees related to our hotels.
Depreciation and amortization
Depreciation and amortization decreased $50.0 million to $33.3 million for 2014 compared to $83.3 million for 2013. This decrease is primarily attributable to the deconsolidation of the 106 OP Hotels on April 11, 2014 and the resultant decrease in depreciation on our hotels.
-30-
Impairment charges
Impairment charges decreased $18.6 million to $9.0 million for 2014 compared to $27.7 million for 2013. This decrease is attributable to a decrease in the number of hotels impaired in 2014 compared to 2013. The decrease in the number of impaired hotels is primarily due to the continued improved operating performance at the hotels.
Equity in loss from Senior Mezz
For 2014, the equity in loss from Senior Mezz was $1.4 million and relates to our 3% equity interest in Senior Mezz. Prior to April 11, 2014, the Company consolidated Senior Mezz.
Interest expense
Interest expense decreased $51.5 million to $31.3 million for 2014 compared to $82.9 million for 2013. This decrease is primarily attributable to principal repayments under the Company’s various notes payable and the refinancing of the GE Mortgage (as defined in Note 7 to the consolidated financial statements included in “Item 8. Financial Statements and Supplementary Data”) and the subsequent exercise of the Purchase Option.
Contingent loss on litigation settlement
As discussed more fully in the notes to the consolidated financial statements included in “Item 8. Financial Statements and Supplementary Data,” in August 2014, the Company and certain other defendants entered into a non-binding memorandum of understanding with respect to a settlement of the claims raised in the Johnson Lawsuit. The agreement generally provides for the following: (1) the effectuation of a merger that will result in exchange of $26.00 in cash for each share of Series B preferred stock and Series C preferred stock outstanding; (2) the establishment of a $6 million fund to be distributed pursuant to a plan of allocation to sellers of the Series B preferred stock and Series C preferred stock; and (3) the payment of reasonable counsel fees, as awarded by the Court. Therefore during 2014, the Company accrued $24.25 million related to the agreement which is included in contingent loss on litigation settlement. The Company anticipates funding the settlement with cash on hand or, if necessary, funding from Whitehall. Ongoing defense costs will be expensed as incurred and could be significant.
Gain on extinguishment of debt
The Company recognized interest on the GE Mortgage under the effective interest method. In conjunction with the repayment of the GE Mortgage on April 11, 2014, the Company wrote-off the interest accrued under the effective interest method, but which was not due or payable to the lender. This write-off resulted in a gain of $13,199,329 during 2014 which is included in gain on extinguishment of debt.
Loss from discontinued operations
For 2014, the Company had no discontinued operations. For 2013, loss from discontinued operations was $8.1 million, related primarily to $2.0 million of operating income offset by $1.6 million in interest expense and $8.5 million in combined loss on the extinguishment of debt and loss on sale of investments in real estate.
Net loss
As a result of the foregoing, for 2014 we recorded a net loss of $31.7 million compared to a net loss of $71.6 million for 2013.
Net loss attributable to non-controlling interest
Non-controlling interest represents the interest not owned by us in our subsidiary and, indirectly, our hotels. As a result of the decrease in our net loss during 2014 compared to 2013, the net loss attributable to non-controlling interest decreased to $4.4 million in 2014 from $69.8 million in 2013. In addition, the contingent loss on litigation settlement of $24.3 million was attributable solely to Grace Acquisition I.
-31-
Net loss attributable to the Company
Net loss attributable to the Company represents the net loss not attributable to non-controlling interests. The net loss attributable to the Company was increased to $27.3 million in 2014 from $1.8 million in 2013. The increased loss is primarily due to the contingent loss on litigation settlement of $24.3 million which was attributable solely to Grace Acquisition I.
Comparison of the year ended December 31, 2013 to the year ended December 31, 2012
The key performance indicators of the hotels that are included in continuing operations as of December 31, 2013 are illustrated by the following table:
| Year Ended December 31, | ||||||||
| 2013 | 2012 | |||||||
| Total hotel revenues (in thousands) |
$ | 428,551 | $ | 409,847 | ||||
| Rooms revenue (in thousands) |
$ | 413,732 | $ | 395,697 | ||||
| Occupancy |
72.3 | % | 70.9 | % | ||||
| ADR |
$ | 105.03 | $ | 102.16 | ||||
| RevPAR |
$ | 75.91 | $ | 72.39 | ||||
Total hotel revenues
Rooms revenue for the year ended December 31, 2013 increased $18.0 million, or 4.6%, to $413.7 million from $395.7 million for the year ended December 31, 2012. The increase in rooms revenue was partially due to the continued improvements in occupancy coupled with an increase in ADR at our comparable hotels. During 2013, we experienced a 2.8% increase in ADR as the economy continued to improve. Food and beverage revenue experienced a similar increase of $0.4 million, or 5.2%, due to improved occupancy and increased food and beverage offerings through the addition of the Bistro concept at many of our Courtyard properties during 2013. Other revenue, which consists mainly of guest telephone charges, equipment rentals, vending income, in-room movie sales, parking and business centers, experienced a slight increase of $0.3 million.
Direct hotel expenses
Direct hotel expenses consist of direct expenses from departments associated with revenue streams (departmental expenses) and non-departmental expenses associated with operating our hotels. We experienced increases of $2.4 million in departmental expenses and $6.3 million in non-departmental expenses during 2013. The increase in these expenses is consistent with the increase in total hotel revenues over the same period. Direct hotel expenses were relatively consistent at 59.1% and 59.7% of total hotel revenues for 2013 and 2012, respectively.
Property tax, ground lease, insurance and property management fees
Property tax, ground lease, insurance and property management fees increased $0.6 million to $31.7 million for 2013 compared to $31.0 million for 2012. This increase is primarily related to increased property tax assessments, higher premiums for insurance policies and increased management fees due to the increased revenues at the hotels.
Corporate overhead
Corporate overhead expenses were essentially unchanged for 2013 compared to 2012, $6.5 million in each year.
Asset management fees
Asset management fees increased $0.4 million to $7.1 million for 2013 compared to $6.7 million for 2012. This increase is consistent with the contractual increase provided for in the GSMC Mortgage described in Note 7 to “Item 8. Financial Statements and Supplementary Data”.
-32-
Depreciation and amortization
Depreciation and amortization decreased $2.0 million to $83.3 million for 2013 compared to $85.3 million for 2012. This decrease is primarily attributable to certain assets becoming fully depreciated in 2013 partially offset by depreciation on capital improvements made at certain hotels since December 31, 2012.
Impairment charges
Impairment charges decreased $58.0 million to $27.7 million for 2013 compared to $85.7 million for 2012. This decrease is attributable to a decrease in the number of hotels impaired in 2013 compared to 2012. The decrease in the number of impaired hotels is primarily due to the continued improved operating performance at the hotels.
Interest expense
Interest expense decreased $1.6 million to $82.9 million for 2013 compared to $84.4 million for 2012. This decrease is primarily attributable to principal repayments under the Company’s various notes payable.
Income (loss) from discontinued operations
For 2013, loss from discontinued operations was $8.1 million, related primarily to $2.0 million of operating income offset by $1.6 million in interest expense and $8.5 million in combined loss on the extinguishment of debt and loss on sale of investments in real estate. For 2012, loss from discontinued operations was $1.9 million, related primarily to $0.2 million of operating income and $0.3 million in net gain on sale of investments in real estate offset by a $1.0 million impairment charge and $1.5 million in interest expense.
Net loss
As a result of the foregoing, for 2013 we recorded a net loss of $71.6 million compared to a net loss of $136.2 million for 2012.
Net loss attributable to non-controlling interest
Non-controlling interest represents the interest not owned by us in our subsidiary and, indirectly, our hotels. As a result of the decrease in our net loss during 2013 compared to 2012, the net loss attributable to non-controlling interest decreased to $69.8 million in 2013 from $134.4 million in 2012.
Net loss available to the Company
Net loss available to the Company represents the net loss not attributable to non-controlling interests. The net loss available to the Company was essentially unchanged at $1.8 million in 2013.
Comparison of the year ended December 31, 2012 to the year ended December 31, 2011
The key performance indicators of the hotels that are included in continuing operations as of December 31, 2012 are illustrated by the following table:
| Year Ended December 31, | ||||||||
| 2012 | 2011 | |||||||
| Total hotel revenues (in thousands) |
$ | 409,847 | $ | 388,299 | ||||
| Rooms revenue (in thousands) |
$ | 395,697 | $ | 374,706 | ||||
| Occupancy |
70.9 | % | 69.4 | % | ||||
| ADR |
$ | 102.16 | $ | 99.00 | ||||
| RevPAR |
$ | 72.39 | $ | 68.74 | ||||
Total hotel revenues
Rooms revenue for the year ended December 31, 2012 increased $21.0 million, or 5.6%, to $395.7 million from $374.7 million for the year ended December 31, 2011. The increase in rooms revenue was partially due to the continued improvements in occupancy coupled with an increase in ADR at our comparable hotels. During 2012, we experienced a 3.2%
-33-
increase in ADR as the economy continued to improve. Food and beverage revenue experienced a similar increase of $0.5 million, or 7.4%, due to improved occupancy and increased food and beverage offerings through the addition of the Bistro concept at many of our Courtyard properties during 2012. Other revenue, which consists mainly of guest telephone charges, equipment rentals, vending income, in-room movie sales, parking and business centers, was essentially unchanged at $6.4 million.
Direct hotel expenses
Direct hotel expenses consist of direct expenses from departments associated with revenue streams (departmental expenses) and non-departmental expenses associated with operating our hotels. We experienced increases of $6.6 million in departmental expenses and $4.7 million in non-departmental expenses during 2012. The increase in these expenses is consistent with the increase in total hotel revenues over the same period. Direct hotel expenses were 59.7% and 60.1% of total hotel revenues for 2012 and 2011, respectively.
Property tax, ground lease, insurance and property management fees
Property tax, ground lease, insurance and property management fees increased $1.6 million to $31.0 million for 2012 compared to $29.4 million for 2011. This increase is primarily related to increased property tax assessments and, to a lesser extent, higher premiums for insurance policies.
Corporate overhead
Corporate overhead expenses increased $1.2 million to $6.5 million for 2012 compared to $5.3 million for 2011. This increase is primarily attributable to a $1.2 million increase in environmental remediation expenses and a $1.3 million increase in unreimbursed deductibles on insurance claims relating to property damage at our hotels, partially offset by a $0.7 million decrease in legal fees and a $0.6 million decrease in other expenses.
Asset management fees
Asset management fees increased $0.5 million to $6.6 million for 2012 compared to $6.1 million for 2011. This increase is consistent with the contractual increase provided for in the GSMC Mortgage described in Note 7 to “Item 8. Financial Statements and Supplementary Data.”
Depreciation and amortization
Depreciation and amortization increased $6.3 million to $85.3 million for 2012 compared to $79.0 million for 2011. This increase is primarily attributable to capital improvements made at certain hotels since December 31, 2011.
Impairment charges
Impairment charges increased $81.2 million to $85.7 million for 2012 compared to $4.5 million for 2011. This increase is attributable to the impairment of 13 of our hotels for 2012 compared to the impairment of one hotel for 2011. The increase in the number of impaired hotels is primarily due to the realization that based on recent discussions with franchisors, certain franchise agreements will not be renewed upon expiration.
Interest expense
Interest expense decreased $0.1 million to $84.4 million for 2012 compared to $84.5 million for 2011. This decrease is primarily attributable to principal repayments under the Company’s various notes payable partially offset by increases in the interest due under our variable rate debt.
Income (loss) from discontinued operations
For 2012, loss from discontinued operations was $1.9 million, related primarily to $0.2 million of operating income and $0.3 million in net gain on sale of investments in real estate offset by a $1.0 million impairment charge and $1.5 million in interest expense. For 2011, income from discontinued operations was $4.7 million, related primarily to a $7.5 million gain on extinguishment of debt on two hotels sold via foreclosure sale during 2011 and $0.5 million in operating income. This gain was offset by a $0.4 million loss on sale of investment in real estate and $2.9 million in interest expense related to the hotels disposed of during 2012 and 2011.
-34-
Net loss
As a result of the foregoing, for 2012 we recorded a net loss of $136.2 million compared to a net loss of $49.5 million for 2011.
Net loss attributable to non-controlling interest
Non-controlling interest represents the interest not owned by us in our subsidiary and, indirectly, our hotels. As a result of the increase in our net loss during 2012 compared to 2011, the net loss attributable to non-controlling interest increased to $134.4 million in 2012 from $48.9 million in 2011.
Net loss available to the Company
Net loss available to the Company represents the net loss not attributable to non-controlling interests. As a result of the increase in our net loss during 2012 compared to 2011, the net loss available to the Company increased to $1.8 million in 2012 from $0.6 million in 2011.
LIQUIDITY AND CAPITAL RESOURCES
The Company’s principal source of cash to meet its operating requirements has been from the results of operations from the Company’s hotels. At December 31, 2014 and 2013, we expected that the operating cash flows would be sufficient to fund the continuing operations of the Company, including required interest obligations and other reserves required by the terms of our debt agreements. As a result of the sale of the Portfolio and the receipt of the Preferred Equity, the Company’s principal source of cash flow is expected to be distributions on the Preferred Equity.
As discussed previously, during the year ended December 31, 2014, the Company accrued $24.25 million related to a legal settlement agreement. The Company anticipates funding the settlement with cash on hand or, if necessary, liquidity from Whitehall.
Periodically, certain hotels may undergo renovations as a result of decisions to upgrade portions of the hotels, such as guestrooms, meeting space and restaurants, in order to better compete with other hotels in our markets or to meet the franchisor’s brand standards. The Company anticipates that funding for these renovations would be obtained from cash on hand and/or cash generated from operating the hotels.
Operating activities
Net cash flows from operating activities were $22.0 million, $62.5 million, $63.7 million and $56.3 million for the years ended December 31, 2014, 2013, 2012 and 2011, respectively. The decrease in cash flows from operating activities in 2014 from 2013 was primarily due to the deconsolidation of the 106 Senior Mezz hotels and the payment of accrued interest on notes payable. The slight decrease in cash flows from operating activities in 2013 from 2012 was primarily due to an increase in the cash paid for interest under our notes payable during 2013. The increase in cash flows from operating activities in 2012 from 2011 was primarily due to increased operating performance at our hotels.
Investment activities
Net cash flow from investing activities was $20.2 million for the year ended December 31, 2014, which consisted of a decrease in restricted cash of $30.1 million and proceeds from property casualty insurance of $1.4 million, partially offset by $11.6 million of capital additions to hotels.
Net cash flow from investing activities was $35.8 million for the year ended December 31, 2013, which consisted of net proceeds of $70.1 million from the sale of four hotels and proceeds from property casualty insurance of $2.1 million, partially offset by $23.7 million of capital additions to hotels, an increase in restricted cash of $11.5 million and $1.1 million paid for initial franchise fees at certain hotels.
-35-
Net cash flow used in investing activities was $36.7 million for the year ended December 31, 2012, which consisted of $46.4 million of capital additions to hotels, partially offset by a decrease in restricted cash of $6.6 million, net proceeds of $2.3 million from the sale of one hotel and proceeds from property casualty insurance of $0.7 million.
Financing activities
Net cash flow used in financing activities was $42.1 million for the year ended December 31, 2014, which primarily consisted $959.6 million of principal payments on the Company’s notes payable, the payment of deferred financing costs of $21.0 million, cash received in connection of the exercise of the Purchase Option of $38.9 million partially offset by an advance from affiliate of $1.7 million and the issuance of notes payable of $976.0 million.
Net cash flow used in financing activities was $98.9 million for the year ended December 31, 2013, which primarily consisted of $96.2 million of principal payments on the Company’s notes payable and defeasance premiums of $2.6 million.
Net cash flow used in financing activities was $25.7 million for the year ended December 31, 2012, which primarily consisted of $25.6 million of principal payments on the Company’s notes payable.
CONTRACTUAL OBLIGATIONS AND OFF BALANCE SHEET ARRANGEMENTS
We historically have had obligations and commitments to make future payments under debt and operating lease contracts. The following table details these obligations as of December 31, 2014, assuming extension options will not be exercised (in thousands):
| Payments Due by Period | ||||||||||||||||||||
| < 1 Year | 2-3 Years | 4-5 Years | > 5 Years | Total | ||||||||||||||||
| Long-term debt obligations |
$ | 55,266 | $ | 99,381 | $ | — | $ | 50,000 | $ | 204,647 | ||||||||||
| Estimated interest obligations (1) |
10,076 | 8,663 | 3,110 | 31,878 | 53,727 | |||||||||||||||
| Operating lease obligations |
— | — | — | — | — | |||||||||||||||
|
|
|
|
|
|
|
|
|
|
|
|||||||||||
| $ | 65,342 | $ | 108,044 | $ | 3,110 | $ | 81,878 | $ | 258,374 | |||||||||||
|
|
|
|
|
|
|
|
|
|
|
|||||||||||
| (1) | Respective LIBOR rate as of December 31, 2014 was used in estimating future interest obligations for floating rate debt. |
The following table details these obligations as of December 31, 2013, assuming extension options will not be exercised (in thousands):
| Payments Due by Period | ||||||||||||||||||||
| < 1 Year | 2-3 Years | 4-5 Years | > 5 Years | Total | ||||||||||||||||
| Long-term debt obligations |
$ | 959,605 | $ | 154,647 | $ | — | $ | 50,000 | $ | 1,164,252 | ||||||||||
| Estimated interest obligations (1) |
73,048 | 15,891 | 3,100 | 33,325 | 125,364 | |||||||||||||||
| Operating lease obligations |
843 | 1,748 | 1,820 | 7,899 | 12,310 | |||||||||||||||
|
|
|
|
|
|
|
|
|
|
|
|||||||||||
| $ | 1,033,496 | $ | 172,286 | $ | 4,920 | $ | 91,224 | $ | 1,301,926 | |||||||||||
|
|
|
|
|
|
|
|
|
|
|
|||||||||||
| (1) | Respective LIBOR rate as of December 31, 2013 was used in estimating future interest obligations for floating rate debt. |
Historically, under our franchise agreements, we were periodically required to make capital improvements in order to maintain the hotels in accordance with the franchisor’s brand standards. Additionally, under certain covenants under agreements governing our indebtedness, we are generally obligated to fund 4% (5% for our Marriott branded hotels) of total hotel revenues to a separate room renovation account for ongoing replacement or refurbishment of furniture, fixtures and equipment at our hotels.
We also maintained certain contractual agreements with property managers and franchisors that required us to pay fees in conjunction with operating our hotels. Generally, the amounts payable under these agreements were dependent upon the operating results of our hotels. Fees paid to property managers generally include base management fees, incentive management fees and accounting fees. Fees paid to franchisors generally include royalty fees, marketing fees, frequent guest program fees and reservation fees. The following table is a historic detail of these fees (in thousands):
| Year Ended December 31, | ||||||||||||||||||||
| 2014 | 2013 | 2012 | 2011 | 2010 | ||||||||||||||||
| Management related fees |
$ | 4,591 | $ | 11,180 | $ | 10,811 | $ | 10,840 | $ | 11,093 | ||||||||||
| Franchisor related fees |
18,023 | 44,089 | 39,640 | 37,886 | 35,152 | |||||||||||||||
|
|
|
|
|
|
|
|
|
|
|
|||||||||||
| $ | 22,614 | $ | 55,269 | $ | 50,451 | $ | 48,726 | $ | 46,245 | |||||||||||
|
|
|
|
|
|
|
|
|
|
|
|||||||||||
During 2014 and 2013, we did not maintain any off-balance sheet arrangements and do not currently anticipate any such arrangements.
-36-
INFLATION
Operators of hotels, in general, possess the ability to adjust room rates daily to reflect the effects of inflation. However, competitive pressures may limit the ability of the companies which manage our hotels to raise room rates.
SEASONALITY
Our operations historically have been seasonal in nature, generally reflecting higher RevPAR during the second and third quarters. This seasonality can be expected to cause fluctuations in our quarterly operating results.
CRITICAL ACCOUNTING POLICIES
Our accounting policies are fully described in Note 2 of the Notes to Consolidated Financial Statements included in “Item 8. Financial Statements and Supplementary Data”. We believe that the following discussion addresses our most critical accounting policies, representing those policies considered most vital to the portrayal of our financial condition and results of operations and require management’s most difficult, subjective and complex judgments.
Investments in real estate
Real estate investments are carried at depreciated cost net of reduction for impairment. Expenditures for ordinary repairs and maintenance are expensed as incurred. Significant renovations and improvements, which improve or extend the useful life of the assets, are capitalized. Full stock replacements of china, glass, silver, uniforms and linen are capitalized and incidental purchases are expensed as incurred.
Depreciation is calculated using the straight-line method over the estimated useful lives of the respective assets as follows: buildings and improvements over 7.5 to 39 years; land improvements over 15 years; and furniture, fixtures and equipment, including china, glass, silver, uniforms and linen, over 3 to 7 years.
Assets are classified as held for sale if a disposal plan is in place, actions to achieve the sale have been initiated, a sale is probable and it is unlikely that significant changes to the plan will be made or that the plan will be withdrawn. Sales of the Company’s investments in real estate take a significant amount of time to consummate and many changes in the terms and timing are typical in the process. Accordingly, management does not classify assets as held for sale until a contract is pending, closing is scheduled and the probability of significant changes in terms or timing is insignificant. We evaluate assets held for sale for impairment each reporting period and record them at the lower of their carrying amounts or fair value less costs to sell.
Fair value measurements
Fair value measurements are market-based measurements, not entity-specific measurements. Fair value measurement assumptions are classified under a hierarchy that distinguishes between market participant assumptions based on market data obtained from sources independent of the reporting entity (observable inputs that are classified within Levels 1 and 2 of the hierarchy) and management’s own assumptions about market participant assumptions (unobservable inputs classified within Level 3 of the hierarchy).
In instances where the determination of the fair value measurement is based on inputs from different levels of the fair value hierarchy, the level in the fair value hierarchy within which the entire fair value measurement falls is based on the lowest level input that is significant to the fair value measurement in its entirety. Management’s assessment of the significance of a particular input to the fair value measurement in its entirety requires judgment and considers factors specific to the asset or liability.
Fair value measurements of financial and nonfinancial assets and liabilities are based on (1) the assumptions that market participants would use in pricing the asset or liability, if available, or (2) management’s assumptions of market participant assumptions.
Certain assets and liabilities are not measured at fair value on an ongoing basis but are subject to fair value adjustments only in certain circumstances (for example, when recording impairment on long-lived assets). Management reviews its investments for impairment whenever events or changes in circumstances indicate that the carrying amount of an asset may not be recoverable. The assumptions used both in estimating fair value through a discounted cash flow model and the undiscounted cash flow analysis are inherently judgmental and reflect current and projected trends in revenue per available
-37-
room, operating expenses, capitalization rates, discount rates, and the estimated holding periods for the applicable hotels. If an indicator of potential impairment exists, the hotel is tested for impairment for financial accounting purposes by comparing its carrying value to the estimated future undiscounted cash flows. The amount of the impairment is calculated as the amount by which the carrying value of the hotel exceeds its fair value.
NON-GAAP FINANCIAL MEASURES
The following non-GAAP presentations of EBITDA and Adjusted EBITDA are made to help in evaluating the Company’s operating performance.
EBITDA is defined as net income (loss) before interest expense and interest income, income taxes, and depreciation and amortization. The Company adjusts EBITDA to exclude impairment charges, gains or losses on sales of investments in real estate and gains or losses on extinguishment of debt because the Company believes these charges are not indicative of the performance of the underlying investments in real estate. The Company presents EBITDA and Adjusted EBITDA because it believes they provide an indicator of the Company’s ability to meet its future debt payments and working capital requirements, as well as an overall evaluation of the Company’s financial condition. EBITDA and Adjusted EBITDA, as calculated by the Company, may not be comparable to EBITDA and Adjusted EBITDA reported by other companies that do not define such terms exactly as the Company defines them. EBITDA and Adjusted EBITDA should not be considered as alternative measures of the Company’s net loss as an indicator of operating performance or GAAP cash flows from operating activities as a measure of liquidity.
The following table reconciles net loss to EBITDA and Adjusted EBITDA (in thousands) (unaudited):
| Year Ended December 31, | ||||||||||||||||
| 2014 | 2013 | 2012 | 2011 | |||||||||||||
| Net loss |
$ | (31,664 | ) | $ | (71,613 | ) | $ | (136,235 | ) | $ | (49,500 | ) | ||||
| Interest income |
(76 | ) | (82 | ) | (87 | ) | (101 | ) | ||||||||
| Interest expense |
31,325 | 82,856 | 84,435 | 84,512 | ||||||||||||
| Interest expense, discontinued operations |
— | 1,578 | 1,508 | 2,949 | ||||||||||||
| Depreciation and amortization |
33,308 | 83,292 | 85,298 | 78,983 | ||||||||||||
| Depreciation and amortization, discontinued operations |
— | 3,212 | 4,520 | 3,994 | ||||||||||||
|
|
|
|
|
|
|
|
|
|||||||||
| EBITDA |
32,893 | 99,243 | 39,439 | 120,837 | ||||||||||||
| Equity in loss from Senior Mezz |
1,429 | — | — | — | ||||||||||||
| Contingent loss on litigation settlement |
24,250 | — | — | — | ||||||||||||
| Net gain on extinguishment of debt |
(13,199 | ) | — | — | — | |||||||||||
| Net (gain) loss on extinguishment of debt, discontinued operations |
— | 2,647 | — | (7,488 | ) | |||||||||||
| Impairment charges |
9,036 | 27,656 | 85,684 | 4,483 | ||||||||||||
| Impairment charges, discontinued operations |
— | — | 1,031 | — | ||||||||||||
| Net gain on sale of real estate |
(221 | ) | — | — | — | |||||||||||
| Net (gain) loss on sale of real estate, discontinued operations |
— | 5,890 | (254 | ) | 357 | |||||||||||
|
|
|
|
|
|
|
|
|
|||||||||
| Adjusted EBITDA |
$ | 54,188 | $ | 135,436 | $ | 125,900 | $ | 118,189 | ||||||||
|
|
|
|
|
|
|
|
|
|||||||||
| ITEM 7A. | QUANTITATIVE AND QUALITATIVE DISCLOSURE ABOUT MARKET RISK |
Market risk includes risks that arise from changes in interest rates, equity prices and other market changes that affect market sensitive instruments. Our primary market risk exposure was to changes in interest rates on our variable rate debt. As of December 31, 2013, we had approximately $1.0 billion of total variable rate debt outstanding (or 86% of total indebtedness). If market rates of interest on our variable rate debt outstanding as of December 31, 2013 were to increase by 1.00%, or 100 basis points, interest expense would decrease future earnings and cash flows by approximately $2.9 million annually. As a result of the sale of the Portfolio and the associated defeasing and repayment of debt, we no longer have any variable rate debt outstanding.
-38-
Our interest rate risk objectives are to limit the impact of interest rate fluctuations on earnings and cash flows and to lower our overall borrowing costs. To achieve these objectives, we have historically managed our exposure to fluctuations in market interest rates through the use of fixed rate debt instruments to the extent that reasonably favorable rates are obtainable. Historically, we entered into interest rate caps to mitigate our interest rate risk on a portion of our variable rate debt. We do not enter into derivative or interest rate transactions for speculative purposes.
| ITEM 8. | FINANCIAL STATEMENTS AND SUPPLEMENTARY DATA |
See our Consolidated Financial Statements and the Notes thereto beginning at page F-1 included in Item 15, which is incorporated herein by reference.
| ITEM 9. | CHANGES IN AND DISAGREEMENTS WITH ACCOUNTANTS ON ACCOUNTING AND FINANCIAL DISCLOSURES |
None.
| ITEM 9A. | CONTROLS AND PROCEDURES |
Evaluation of disclosure controls and procedures
The Company carried out an evaluation with the participation of the Company’s management, including its Chief Executive Officer and Chief Financial Officer, of the effectiveness of the design and operation of the Company’s disclosure controls and procedures (as defined in Rule 13a-15(e) and 15(d)-15(e) under the Exchange Act) as of the end of the period covered by this report. Based upon that evaluation, the Company’s Chief Executive Officer and Chief Financial Officer concluded that, as of the end of the period covered by this report, these disclosure controls and procedures were not effective because the Company did not file its periodic reports within the time periods specified in the SEC rules and forms as a result of the SEC’s determination that the Company’s reporting obligation under Section 15(d) of the Exchange Act resumed January 1, 2014. The Company is in the process of preparing and filing its past due periodic reports and intends to become current as soon as practicable.
Management’s report on internal control over financial reporting
Management is responsible for establishing and maintaining adequate internal control over financial reporting as defined in Rule 15d-15(f) under the Exchange Act. The Company’s internal control over financial reporting is designed to provide reasonable assurance as to the reliability of the Company’s financial reporting and the preparation of financial statements in accordance with GAAP. Our internal control over financial reporting includes those policies and procedures that:
| • | Pertain to the maintenance of records that in reasonable detail accurately and fairly reflect the transactions and dispositions of the assets of the Company; |
| • | Provide reasonable assurance that transactions are recorded as necessary to permit preparation of financial statements in accordance with GAAP, and that receipts and expenditures of the Company are being made only in accordance with authorizations of management and directors of the Company; and |
| • | Provide reasonable assurance regarding prevention or timely detection of unauthorized acquisition, use or disposition of the Company’s assets that could have a material effect on the Company’s consolidated financial statements. |
Because of its inherent limitations, internal control over financial reporting may not prevent or detect misstatements. Also, projections of any evaluation of effectiveness to future periods are subject to the risk that controls may become inadequate because of changes in conditions, or that the degree of compliance with the policies or procedures may deteriorate.
Management has assessed the effectiveness of the Company’s internal control over financial reporting as of December 31, 2013. In making this assessment, management used the criteria established by the Committee of Sponsoring Organizations of the Treadway Commission (COSO) in “Internal Control — Integrated Framework (1992).” Based on its assessment, management has concluded that, as of December 31, 2013, the Company’s internal control over financial reporting was effective based on those criteria.
-39-
Changes in internal control over financial reporting
There have been no changes in our internal control over financial reporting (as defined in Rule 15(d)-15(e) of the Exchange Act) during the most recent fiscal quarter that have materially affected, or are reasonably likely to materially affect, our internal control over financial reporting.
| ITEM 9B. | OTHER INFORMATION |
None.
| ITEM 10. | DIRECTORS, EXECUTIVE OFFICERS AND CORPORATE GOVERNANCE |
We operate under the direction of our board of directors, which is responsible for the overall management and control of our affairs. Because our directors take a critical role in guiding our strategic direction and overseeing our management, they must demonstrate broad-based business and professional skills and experiences. Based on the experiences and qualifications described below, we believe our directors have the appropriate mix of experiences, qualifications, attributes and skills required of our board members in the context of the current needs of our Company.
Our executive officers and directors are (ages as of December 31, 2013):
| Name |
Age | Position | ||||
| Todd Giannoble |
41 | Chief Executive Officer, President, Director | ||||
| Greg Fay |
48 | Chief Financial Officer, Treasurer, Secretary, Director | ||||
| Brian Nordahl |
50 | Vice President, Director | ||||
On October 15, 2014, Dan Smith, who had been a director and officer from 2010 until his resignation, resigned from our board of directors, as well as his offices of vice president and secretary. Greg Fay replaced Mr. Smith as the Secretary of the Company.
On April 1, 2015, Mark Ricketts, who had been a director and officer from 2010 until his resignation, resigned from our board of directors, as well as his office of vice president.
Todd Giannoble
Mr. Giannoble joined our board of directors in February of 2008 and has served as our Chief Executive Officer and President since February of 2008. In addition to serving on the board, Mr. Giannoble is a Managing Director with RMD and serves as President of the hotel platform that provides asset management services to the Whitehall Street Real Estate Limited Partnerships. RMD oversees 280 hotels with a combined total of 30,000 rooms.
Prior to his employment with RMD, Mr. Giannoble served as a Vice President and Associate for GS. Prior to GS, Mr. Giannoble held various positions within Bristol Hotels and Resorts which was a hotel ownership and management company with more than 120 hotels throughout the U.S. and Canada. Mr. Giannoble was previously on the Board of Directors for Strategic Hotel Capital and has more than 20 years of experience in the hospitality and banking industries. Mr. Giannoble currently serves on the Courtyard Franchise Advisory Committee as well as on the Hyatt Place Franchise Advisory Committee.
Mr. Giannoble received a B.A. (with Distinction) from Cornell University’s Hotel School and a degree (with Honors) from the Culinary Institute of America.
Greg Fay
Mr. Fay joined our board of directors in February of 2008 and has served as our Chief Financial Officer since November of 2007, as our Treasurer since September of 2012 and our Secretary since October 2014. In addition to serving on the board, Mr. Fay is a Vice President with RMD, and serves as Chief Financial Officer of the hotel platform. Prior to joining RMD, Mr. Fay was the Chief Financial Officer of Builder Financial Corp., and prior to that he was Chief Financial Officer of The Rendina Companies. Prior to joining The Rendina Companies, Mr. Fay was the Chief Accounting and Administrative Officer
-40-
of Innkeepers USA Trust, a public hotel REIT, for seven years. For nearly 12 years prior to joining Innkeepers, Mr. Fay held various positions in the audit practice of Coopers & Lybrand, LLP, and was a member of the firm’s Hospitality and Real Estate practice for the Southwestern United States. He is a summa cum laude graduate of the University of South Alabama with a B.S. in Accounting.
Brian Nordahl
Mr. Nordahl joined our board of directors in April of 2010. In addition to serving on the board, Mr. Nordahl is a Vice President with RMD where he is responsible for leading both asset and debt acquisition opportunities, as well as other real estate activities. He has over 25 years of experience in the hospitality real estate and finance fields. Prior to joining RMD, Mr. Nordahl served as Vice President of Acquisitions for Sage Hospitality Resources, as a Principal with the private equity firm Watermark Capital Partners and as a Principal with Deloitte Consulting where he also served as the National Leader of the Hospitality Consulting Practice. He began his hospitality career in operations with Westin Hotels & Resorts. Mr. Nordahl holds a B.S. in Hospitality Management from Florida International University.
Section 16(a) beneficial ownership reporting compliance
Section 16(a) of the Securities Exchange Act is not applicable to our directors, officers and beneficial owners of more than 10% of any class of equity securities since the Company has no class of equity securities registered pursuant to Section 12 of the Exchange Act and is not a closed-end investment company registered under the Investment Company Act.
Code of ethics
We have not adopted a Code of Ethics that applies to our executive officers, including our principal executive, financial and accounting officers. We do not believe the adoption of a code of ethics at this time would provide any meaningful additional protection to the Company because each of our directors and executive officers are subject to the GS code of ethics through their current employer, RMD, that is applicable to all employees of RMD, and we do not have any employees.
Audit committee and audit committee financial expert
There is no separately-designated standing audit committee as our board of directors acts as the Company’s audit committee. Our board of directors does not have an independent “financial expert” because it believes the Company’s management has sufficient financial expertise. In addition, our stock is not listed on a national exchange and the Company is not subject to the special corporate governance requirements of any such exchange.
| ITEM 11. | EXECUTIVE COMPENSATION |
We do not currently have any employees and do not expect to have any employees. Services necessary for our business are provided by individuals who are employees of RMD pursuant to an asset management agreement between Grace I and RMD.
None of our directors or executive officers receives direct compensation from us. Our directors and executive officers are employees of RMD and paid a salary and bonus by RMD. No portion of their salary or bonus is allocated to us.
RMD is paid a monthly fee by us for its asset management services. For the years ended December 31, 2014 and 2013, RMD earned asset management fees of $3.1 million and $7.3 million, of which $0.0 million and $3.6 million were deferred, respectively. Because Grace I effectively has no operations of its own, Grace I allocated substantially all of the asset management fees to us for 2014, 2013 and 2012. See Note 3 of the consolidated financial statements located in “Item 8. Financial Statements and Supplementary Data” for further information.
The Company does not have a standing compensation committee or a committee performing similar functions, since the Company does not have any employees and does not compensate our directors and executive officers. Accordingly, we do not have a compensation committee report.
As our executive officers do not receive compensation directly from us for services rendered to us, and we do not intend to pay any compensation directly to our executive officers, we do not have, and our board of directors has not considered, a compensation policy or program for our executive officers.
-41-
| ITEM 12. | SECURITY OWNERSHIP OF CERTAIN BENEFICIAL OWNERS AND MANAGEMENT AND RELATED STOCKHOLDER MATTERS |
Equity compensation plan information
The Company does not currently have any equity compensation plans.
Security of certain beneficial owners
The following table sets forth information as of June 12, 2015 regarding the beneficial ownership of our common stock, Series B preferred stock and Series C preferred stock by each person known by us to own 5% or more of the outstanding shares of our common stock, Series B preferred stock and Series C preferred stock, respectively, each of our directors, each of our executive officers, and our directors and executive officers as a group.
Unless otherwise indicated below, each person or entity has an address in care of our principal executive offices at 6011 Connection Drive, Irving, Texas 75039.
| Name of Beneficial Owner |
Amount and Nature of Beneficial Ownership of Common Stock |
Percentage of Class |
Amount and Nature of Beneficial Ownership of Series B Preferred Stock |
Percentage of Class |
Amount and Nature of Beneficial Ownership of Series C Preferred Stock |
Percentage of Class |
||||||||||||||||||
| W2007 Grace I, LLC (1) |
100 | 100 | % | — | — | — | — | |||||||||||||||||
| PFD Holdings, LLC (1) |
— | — | 1,746,005 | 50.6 | % | 1,704,730 | 71.0 | % | ||||||||||||||||
| Todd Giannoble |
— | — | — | — | — | — | ||||||||||||||||||
| Greg Fay |
— | — | — | — | — | — | ||||||||||||||||||
| Brian Nordahl |
— | — | — | — | — | — | ||||||||||||||||||
| Directors and executive officers as a group (3 persons) |
— | — | — | — | — | — | ||||||||||||||||||
| (1) | Each of W2007 Grace I, LLC and PFD Holdings, LLC is controlled by Whitehall, which, in turn, is controlled by affiliates of GS Group, the parent entity of GS. The address for Grace I, LLC and PFD Holdings, LLC is c/o Whitehall Parallel Global Real Estate Limited Partnership 2007, 200 West Street, New York, NY 10282. |
| ITEM 13. | CERTAIN RELATIONSHIPS AND RELATED TRANSACTIONS AND DIRECTOR INDEPENDENCE |
Policies and procedures for transactions with related persons
We do not currently have written formal policies and procedures for the review, approval or ratification of transactions with related persons, as defined by Item 404 of Regulation S-K of the Exchange Act. Under that definition, transactions with related persons are transactions in which we were or are a participant and the amount involved exceeds $120,000 and in which any related person had or will have a direct or indirect material interest. Related parties include any executive officers, directors, director nominees, beneficial owners of more than 5% of our voting securities, immediate family members of any of the foregoing persons, and any firm, corporation or other entity in which any of the foregoing persons is employed and in which such person has 10% or greater beneficial ownership interest.
Transactions with related persons
Asset management agreement with RMD
The asset management agreement between Grace I and RMD is effective through December 31, 2019. Either party may terminate the agreement with 30 days written notice without cause or the payment of a fee. GS, the ultimate parent of RMD, is an affiliate of the Company.
RMD is paid a monthly fee by the Company for its asset management services. Pursuant to the Modification Agreement discussed in Note 7 to the consolidated financial statements included in “Item 8. Financial Statements and Supplementary Data,” the asset management fee was limited to $6,600,000 in 2011 with 5% increases in subsequent years thereafter until the GE Mortgage has been paid in full. The payment of 50% of the fee is deferred until the Company reaches a quarterly
-42-
minimum debt yield of 13% or until the GE Mortgage has been paid in full. During periods where the Company has met such minimum yield, the asset management fee payment is limited to then current amounts, not to include previously deferred amounts. In connection with the refinancing of the GE Mortgage as discussed in Note 7 to the consolidated financial statements included in “Item 8. Financial Statements and Supplementary Data,” the restriction on the payment of asset management fees terminated. In April 2014, the Company paid $4,650,000 in accrued asset management fees to RMD and RMD forgave $6,708,000 in accrued asset management fees. This forgiveness was recorded as an increase in equity as the indebtedness was forgiven by RMD, an affiliate of the Company. For the years ended December 31, 2014, 2013, 2012 and 2011, RMD earned asset management fees of $3,073,000, $7,276,000, $6,951,000 and $6,539,000, of which $0, $3,638,000, $3,465,000 and $3,300,000 were deferred, respectively. Deferred asset management fees included in accounts payable and accrued liabilities in the accompanying consolidated balance sheets as of December 31, 2014, 2013 and 2012 are $0, $10,403,000 and $6,765,000, respectively. Since Grace I effectively has no operations of its own, Grace I allocated substantially all of the asset management fees to the Company for the years ended December 31, 2014, 2013, 2012 and 2011.
RMD is entitled to receive a disposition fee equal to 0.50% of the adjusted proceeds of $5,000,000 or more and 0.75% of the adjusted proceeds under $5,000,000 received by the Company in connection with the sale of any asset owned by the Company. As of December 31, 2014, 2013 and 2012, accrued disposition fees were $361,000, $384,000 and $23,000, respectively, of which $361,000 were incurred in connection with the sale of four hotels during the year ended December 31, 2013. In connection with the exercise of the Purchase Option on April 11, 2014, $23,000 of accrued disposition fees were transferred to WNT which were related to hotels sold by subsidiaries of Senior Mezz in 2008. There were no other disposition fees earned by RMD.
In addition to the $5,063,000 payable to WNT transferred to the Company in connection with the exercise of the Purchase Option, the Company had a $1.7 million payable to WNT as of December 31, 2014.
As additional compensation, RMD was entitled under the prior agreement to receive an incentive fee of 20% of any distributable cash after all members of Grace I achieved an internal rate of return on their investment of at least 15%, but less than 20%; an incentive fee of 25% of any distributable cash after all members achieved an internal rate of return of 20%, but less than 25%; and an incentive fee of 30% of any distributable cash after all members achieved an internal rate of return of 25%. The A&R AMA removed the provision for the payment of any incentive fees. For the years ended December 31, 2014, 2013, 2012 and 2011, no incentive fees were earned by RMD.
Relationships with Pillar Hotels and Resorts
On September 15, 2011, Pillar Hotels and Resorts, L.P. (Pillar) and its subsidiaries were sold to Capstone Management, LLC, an affiliate of InterMountain Management, LLC (InterMountain Management; Pillar Sale). Prior to this sale, Pillar was an affiliate of the Company.
As of December 31, 2014, the Company engaged Pillar as the property manager for 3 hotels and Senior Mezz engaged Pillar as the property manager for 21 hotels. The property management agreements (the PMAs) terminate between June 2018 and February 2019. The PMAs will automatically renew for an additional one year term unless the Company or Pillar elects not to renew the agreement. The Company may terminate the PMAs with 30 days written notice without cause or the payment of a fee.
The Company pays Pillar a monthly hotel management fee generally equal to 2% per annum of gross revenues for each hotel managed. For the 14 Hyatt Place hotels managed by Pillar for Senior Mezz, the monthly hotel management fees are subordinated to a priority return to the Company. For the years ended December 31, 2014, 2013, 2012 and 2011, the Company incurred base management fees of $299,000, $759,000, $705,000 and $668,000 and incentive fees of $11,000, $113,000, $153,000 and $147,000, respectively, which are included in property tax, ground lease, insurance and property management fees and income (loss) from discontinued operations in the accompanying consolidated statements of operations and comprehensive loss. Of the $815,000 total hotel management fee incurred for the year ended December 31, 2011, $489,000 was earned by Pillar prior to the Pillar Sale.
The Company pays Pillar a fixed monthly accounting fee. The accounting fee was $130,000, $368,000, $371,000 and $360,000 for the years ended December 31, 2014, 2013, 2012 and 2011, respectively, and is included in non-departmental direct hotel expenses and income (loss) from discontinued operations in the accompanying consolidated statements of operations and comprehensive loss.
-43-
The Company also pays Pillar a monthly capital oversight fee generally equal to its costs incurred related to procurement activities surrounding the Company’s capital expenditures. The capital oversight fee was $384,000, $727,000, $1,624,000 and $1,222,000 for the years ended December 31, 2014, 2013, 2012 and 2011, respectively. Of the $1,222,000 capital oversight fee incurred in 2011, $900,000 is included in asset management fees and income (loss) from discontinued operations in the accompanying consolidated statements of operations and comprehensive loss. The 2014, 2013, 2012 and the remaining 2011 capital oversight fees were capitalized to investments in real estate in the accompanying consolidated balance sheets as they represent fees incurred after the Pillar Sale.
In 2011, in accordance with the Secondment Agreement, Pillar seconded the employees of AH 2007 Management to operate the hotels of the Company as well as the hotels of affiliates of the Company. Prior to the Pillar Sale, AH 2007 Management was a subsidiary of the Company. Pillar reimbursed AH 2007 Management for salaries, bonuses and any other compensation or benefit payable to the seconded employees. The Company reimbursed Pillar for such costs related to employees at the Company’s hotels, which are included in income (loss) from discontinued operations in the accompanying consolidated statements of operations and comprehensive loss. In connection with the Pillar Sale, the net assets of AH 2007 Management were acquired by InterMountain Management. See Note 12 to the accompanying consolidated financial statements located in “Item 8. Financial Statements and Supplementary Data” for additional disclosure.
As a result of the Pillar Sale, RMD is entitled to an earn-out fee for a portion of Pillar’s annual cash flows.
GE Mortgage loan agreement and Purchase Option
In October 2007, the Company entered into the GE Mortgage, a loan agreement pursuant to which the Company issued a $1,800,000,000 note to GSMC. Under its rights within the GE Mortgage, GSMC componentized the loan in February 2008 for purposes of marketing and selling the individual components of the loan. In connection with the componentization, the Company paid a fee of $9,850,000 to GSMC. As described in “Item 1. Business,” GSMC is an affiliate of Whitehall. After the componentization, the GE Mortgage was composed of a mortgage loan (the Mortgage Loan) and seven mezzanine loans (each a Mezzanine Loan).
In June 2009, the Company entered into a series of recapitalization transactions as follows:
| • | Whitehall funded $175,000,000 of its $350,000,000 payment guaranty which reduced the outstanding balance under the Mortgage Loan. The Company recorded this as a deemed contribution and a corresponding reduction of its outstanding indebtedness. As of September 2009, Whitehall satisfied its conditions to fully extinguish the payment guaranty. |
| • | The borrower under the First Mezzanine Loan, a wholly owned subsidiary of the Company, made a proportionate and voluntary prepayment of $15,231,000 to reduce the outstanding balance under the First Mezzanine Loan. |
| • | GSMC cancelled $544,841,000 of indebtedness outstanding under the Second, Third, Fourth, Fifth, Sixth and Seventh Mezzanine Loans, resulting in an increase in shareholders’ equity of $260,254,000 on the forgiveness of debt. The forgiveness of debt was recorded as an increase in shareholders’ equity as the indebtedness was forgiven by GSMC, an affiliate of the Company. |
| • | An affiliate of GSMC was granted the Purchase Option. The Purchase Option is not effective or exercisable until both the Mortgage Loan and the First Mezzanine Loan have been paid in full. Whitehall and GSMC’s affiliate have agreed to a tiered sharing agreement with respect to distributions received by GSMC’s affiliate under the Purchase Option. |
The largest aggregate amount of principal outstanding held by GSMC during the years ended December 31, 2014, 2013, 2012 and 2011 was $25,000,000, $25,000,000, $0 and $278,059,000, respectively. There were no principal payments made to GSMC during these periods except in connection with the repayment of these notes in full in April 2014. During the years ended December 31, 2014, 2013, 2012 and 2011, GSMC earned interest of $552,000, $27,000, $0, and $2,038,000, respectively, under their debt investments in the Mortgage Loan and the First Mezzanine Loan. The weighted average interest rates related to these interest payments were 7.75%, 7.86%, 0% and 5.87% for the years ended December 31, 2014, 2013, 2012 and 2011, respectively. For these same periods, the weighted average interest rates on the interest that was deferred in connection with the Modification Agreement were 0%, 0%, 0% and 9.00%.
During the year ended December 31, 2014, the Company paid approximately $21,049,000 of deferred financing costs, of which approximately $5,856,000 was paid to German American Capital Corporation and $3,904,000 was paid to GSMC in connection with the origination of the GACC Mortgage and Mezzanine Loans. These deferred financing costs were transferred to WNT in connection with its exercise of the Purchase Option.
-44-
See Note 7 to the accompanying consolidated financial statements located in “Item 8. Financial Statements and Supplementary Data” for additional disclosure related to the GE Mortgage and the Purchase Option.
Miscellaneous affiliate relationships
In August 2012, PFD Holdings, an affiliate of Whitehall, purchased 2,018,250 shares of Series B preferred stock and Series C preferred stock. In August 2013, PFD Holdings purchased an additional 1,422,485 shares of Series B preferred stock and Series C preferred stock. In December 2014, PFD Holdings purchased an additional 10,000 shares of Series B preferred stock and Series C preferred stock. As a result of these purchases, PFD Holdings owns 59.0% of the outstanding Series B preferred stock and Series C preferred stock.
In connection with arranging the financing for the Company upon acquisition in 2007, an affiliate of the Company was paid a fee of $18,000,000. This fee was included in deferred financing costs in the accompanying consolidated balance sheets as of December 31, 2013 and 2012. This fully amortized fee was written-off in connection with the refinancing of the GE Mortgage in April 2014. In 2007, the Company also paid an affiliate of the Company a fee of $10,007,000 for advisory services related to the Merger. This fee is included in the purchase price consideration which was allocated to the assets and liabilities of the Company.
Whitehall has guaranteed up to $6,495,000 of the Company’s obligations under the franchise agreements with certain franchisors.
W2007 Equity LP, WNT and Whitehall Street Global Real Estate Limited Partnership 2007, an affiliate of GS Group, GS and GSMC, engaged GS and Deutsche Bank Securities Inc. (DB) to provide advisory services in connection with a potential sale or other transaction relating to the 126 hotels. As a result of that engagement, upon consummation of the sale of the Portfolio, GS and DB were paid, in the aggregate, an advisory fee of 1.10% of the aggregate consideration paid to the Sellers. GS and DB split the advisory fee 60% and 40%, respectively, resulting in a payment of $12.0 million to GS.
Independence
Our shares are not listed for trading on any national securities exchange or in an automated inter-dealer quotation system of a national securities association and therefore our board of directors is not subject to the independence requirements of any national securities exchange or an inter-dealer quotation system which requires our board to have a majority of our directors be independent. In the absence of such requirements, we have elected to use the definition for “director independence” under the Nasdaq Stock Market’s listing standard, which defines an “independent director” as a “person other than an Executive Officer or employee of the Company or any other individual having a relationship which, in the opinion of the Company’s board of directors, would interfere with the exercise of independent judgment in carrying out the responsibilities of a director.” The definition further provides that, among others, employment of a director by us (or any parent or subsidiary of ours) at any time during the past three years is considered a bar to independence regardless of the determination of our board of directors. Our board of directors has determined that none of its members is independent.
| ITEM 14. | PRINCIPAL ACCOUNTANT FEES AND SERVICES |
Independent registered public accounting firm
Ernst & Young LLP has served as our independent registered public accounting firm since 2007. Our management believes that they are knowledgeable about our operations and accounting practices and well qualified to act as our independent registered public accounting firm.
-45-
Audit and non-audit fees
The following table presents fees for professional services rendered by our independent registered public accounting firm, Ernst & Young LLP for the years ended December 31, 2014, 2013 and 2012 (in thousands):
| 2014 | 2013 | 2012 | ||||||||||
| Audit fees |
$ | 430 | $ | 564 | $ | 465 | ||||||
| Audit-related fees |
— | 25 | 15 | |||||||||
| Tax fees |
— | — | — | |||||||||
| All other fees |
— | — | — | |||||||||
|
|
|
|
|
|
|
|||||||
| Total fees |
$ | 430 | $ | 589 | $ | 480 | ||||||
|
|
|
|
|
|
|
|||||||
Pre-approval policies and procedures
Our board of directors functions as our audit committee. It is the policy of the Company for all non audit-related work performed by our independent registered public accounting firm to be approved in advance by our board of directors.
-46-
| ITEM 15. | FINANCIAL STATEMENT SCHEDULES AND EXHIBITS |
1. Financial Statements
Included herein beginning on page F-1.
2. Financial Statement Schedules
The following financial statement schedules are included herein beginning on page F-39:
Schedule III—Real Estate and Accumulated Depreciation
2(a). All other schedules for which provision is made in Regulation S-X are either not required to be included herein under the related instructions or are inapplicable or the related information is included in the footnotes to the applicable financial statement and, therefore, have been omitted.
3. Exhibits
Exhibits required by Item 601 of Regulation S-K: The exhibits filed in response to this item are listed below.
| Exhibit Number |
Description of Exhibit | |
| 3.1 | Amended and Restated Charter of the Registrant (incorporated by reference to Exhibit 3.1 to the Company’s Annual Report on Form 10-K (SEC File No. 001-12073) filed with the SEC on May 1, 2015). | |
| 3.2 | By-Laws of the Registrant (incorporated by reference to Exhibit 3.2 to the Company’s Annual Report on Form 10-K (SEC File No. 001-12073) filed with the SEC on May 1, 2015). | |
| 10.1 | Asset Management Agreement, dated as of October 25, 2007, by and between W2007 Grace I, LLC and Archon Group, L.P. (incorporated by reference to Exhibit 10.1 to the Company’s Annual Report on Form 10-K (SEC File No. 001-12073) filed with the SEC on May 1, 2015). | |
| 10.2 | Keepwell Agreement, dated as of October 25, 2007, by and between W2007 Grace I, LLC and W2007 Grace Acquisition I, Inc. (incorporated by reference to Exhibit 10.2 to the Company’s Annual Report on Form 10-K (SEC File No. 001-12073) filed with the SEC on May 1, 2015). | |
| 10.3 | Purchase Option, dated as of June 29, 2009, by and between W2007 Equity Inns Intermediate Mezz I, LLC and Goldman Sachs Lending Partners LLC. (incorporated by reference to Exhibit 10.3 to the Company’s Annual Report on Form 10-K (SEC File No. 001-12073) filed with the SEC on May 1, 2015). | |
| 10.4 | Purchase Option Amendment, dated as of February 1, 2012, by and between W2007 Equity Inns Intermediate Mezz I, LLC and MTGLQ Investors, L.P. (incorporated by reference to Exhibit 10.4 to the Company’s Annual Report on Form 10-K (SEC File No. 001-12073) filed with the SEC on May 1, 2015). | |
| 10.5 | Assignment and Assumption Agreement of the Purchase Option, dated as of September 30, 2011, by and between Goldman Sachs Lending Partners LLC and MTGLQ Investors, L.P. (incorporated by reference to Exhibit 10.5 to the Company’s Annual Report on Form 10-K (SEC File No. 001-12073) filed with the SEC on May 1, 2015). | |
| 10.6 | Assignment and Assumption Agreement of the Purchase Option, dated as of July 13, 2012, by and between MTGLQ Investors, L.P. and WNT Holdings, LLC. (incorporated by reference to Exhibit 10.6 to the Company’s Annual Report on Form 10-K (SEC File No. 001-12073) filed with the SEC on May 1, 2015).) | |
| 10.7 | Amended and Restated Agreement of Limited Partnership, dated as of March 31, 2008, of W2007 Equity Inns Partnership, L.P. (incorporated by reference to Exhibit 10.7 to the Company’s Annual Report on Form 10-K (SEC File No. 001-12073) filed with the SEC on May 1, 2015). | |
| 10.8 | Amendment to Agreement of Limited Partnership of W2007 Equity Inns Partnership, L.P., dated as of March 31, 2008 (incorporated by reference to Exhibit 10.8 to the Company’s Annual Report on Form 10-K (SEC File No. 001-12073) filed with the SEC on May 1, 2015). | |
-47-
| 10.9 | Amended and Restated Real Estate Sale Agreement, dated November 11, 2014 (the Amended and Restated Sale Agreement), by and among American Realty Capital Hospitality Portfolio Member, LLC, ARC Hospitality Portfolio I Owner, LLC, ARC Hospitality Portfolio I TFGL Owner, LLC, ARC Hospitality Portfolio I BHGL Owner, LLC, ARC Hospitality Portfolio I PXGL Owner, LLC, ARC Hospitality Portfolio I GBGL Owner, LLC, ARC Hospitality Portfolio I NFGL Owner, LLC, ARC Hospitality Portfolio I MBGL 1000 Owner, LLC, ARC Hospitality Portfolio I MBGL 950 Owner, LLC, ARC Hospitality Portfolio I NTC Owner, LP, ARC Hospitality Portfolio I DLGL Owner, LP, ARC Hospitality Portfolio I SAGL Owner, LP, ARC Hospitality Portfolio II Owner, LLC, ARC Hospitality Portfolio II NTC Owner, LP, W2007 Equity Inns Realty, LLC, W2007 Equity Inns Realty, L.P., W2007 EQI Urbana Partnership, L.P., W2007 EQI Seattle Partnership, L.P., W2007 EQI Savannah 2 Partnership, L.P., W2007 EQI Rio Rancho Partnership, L.P., W2007 EQI Orlando Partnership, L.P., W2007 EQI Orlando 2 Partnership, L.P., W2007 EQI Naperville Partnership, L.P., W2007 EQI Milford Partnership, L.P., W2007 EQI Louisville Partnership, L.P., W2007 EQI Knoxville Partnership, L.P., W2007 EQI Jacksonville Partnership I, L.P., W2007 EQI Indianapolis Partnership, L.P., W2007 EQI Houston Partnership, L.P., W2007 EQI HI Austin Partnership, L.P., W2007 EQI East Lansing Partnership, L.P., W2007 EQI Dalton Partnership, L.P., W2007 EQI College Station Partnership, L.P., W2007 EQI Carlsbad Partnership, L.P., W2007 EQI Augusta Partnership, L.P. and W2007 EQI Asheville Partnership, L.P. (incorporated by reference to Exhibit 10.1 to the Company’s Current Report on Form 8-K (SEC File No. 001-12073) filed with the SEC on March 5, 2015). | |
| 10.10 | First Amendment to Amended and Restated Sale Agreement, dated February 13, 2015 (incorporated by reference to Exhibit 10.2 to the Company’s Current Report on Form 8-K (SEC File No. 001-12073) filed with the SEC on March 5, 2015). | |
| 10.11 | Letter Agreement Amendment to Amended and Restated Sale Agreement, dated February 24, 2015 (incorporated by reference to Exhibit 10.3 to the Company’s Current Report on Form 8-K (SEC File No. 001-12073) filed with the SEC on March 5, 2015). | |
| 10.12 | Amended and Restated Limited Liability Company Agreement of ARC Hospitality Portfolio I Holdco, LLC, dated February 27, 2015 (incorporated by reference to Exhibit 10.4 to the Company’s Current Report on Form 8-K (SEC File No. 001-12073) filed with the SEC on March 5, 2015). | |
| 10.13 | Amended and Restated Limited Liability Company Agreement of ARC Hospitality Portfolio II Holdco, LLC, dated February 27, 2015 (incorporated by reference to Exhibit 10.5 to the Company’s Current Report on Form 8-K (SEC File No. 001-12073) filed with the SEC on March 5, 2015). | |
| 10.14 | Mortgage Loan Agreement, dated as of April 11, 2014 (the Mortgage Loan Agreement), among W2007 Equity Inns Realty, LLC, a Delaware limited liability company, and W2007 Equity Inns Realty, L.P., a Delaware limited partnership, as the mortgage borrowers, and German American Capital Corporation, as the Mortgage Lender (incorporated by reference to Exhibit 10.14 to the Company’s Annual Report on Form 10-K (SEC File No. 001-12073) filed with the SEC on May 1, 2015). | |
| 10.15 | First Amendment to the Mortgage Loan Agreement, dated as of June 18, 2014 (incorporated by reference to Exhibit 10.15 to the Company’s Annual Report on Form 10-K (SEC File No. 001-12073) filed with the SEC on May 1, 2015). | |
| 10.16 | Mezzanine Loan Agreement, dated as April 11, 2014 (the Mezzanine Loan Agreement), between WNT Mezz I, LLC, a Delaware limited liability company, as the original borrower, and German American Capital Corporation, as the original Mezzanine Lender (incorporated by reference to Exhibit 10.16 to the Company’s Annual Report on Form 10-K (SEC File No. 001-12073) filed with the SEC on May 1, 2015). | |
| 10.17 | First Amendment to the Mezzanine Loan Agreement, dated as of June 18, 2014 (incorporated by reference to Exhibit 10.17 to the Company’s Annual Report on Form 10-K (SEC File No. 001-12073) filed with the SEC on May 1, 2015). | |
| 10.18 | Assumption and Release Agreement dated February 27, 2015 by and among W2007 Equity Inns Realty, LLC, W2007 Equity Inns Realty, L.P., ARC Hospitality Portfolio I Owner, LLC, ARC Hospitality Portfolio I BHGL Owner, Llc, ARC Hospitality Portfolio I PXGL Owner, LLC, ARC Hospitality Portfolio I GBGL Owner, Llc, ARC Hospitality Portfolio I NFGL Owner, Llc, ARC Hospitality Portfolio I MBGL 1000 Owner, LLC, ARC Hospitality Portfolio I MBGL 950 Owner, LLC, ARC Hospitality Portfolio I NTC Owner, LP, Arc Hospitality Portfolio I DLGL Owner, LP, ARC Hospitality Portfolio I SAGL Owner, LP, U.S. Bank National Association, as Trustee for the Registered Holders of Eqty 2014-Inns Mortgage Trust, Commercial Mortgage Pass-Through Certificates, Whitehall Street Global Real Estate Limited Partnership 2007, Whitehall Parallel Global Real Estate Limited Partnership 2007, American Realty Capital Hospitality Operating Partnership, L.P. and American Realty Capital Hospitality Trust, Inc. (incorporated by reference to Exhibit 10.18 to the Company’s Annual Report on Form 10-K (SEC File No. 001-12073) filed with the SEC on May 1, 2015). | |
-48-
| 10.19 | Assumption and Release Agreement (Mezzanine) dated February 27, 2015 by and among WNT Mezz I, LLC, ARC Hospitality Portfolio I Mezz, LP, U.S. Bank National Association, as trustee for the registered holders of EQTY 2014-MZ Mezzanine Trust, Commercial Mezzanine Pass-Through Certificates, Whitehall Street Global Real Estate Limited Partnership 2007, and Whitehall Parallel Global Real Estate Limited Partnership 2007, American Realty Capital Hospitality Operating Partnership, L.P., and American Realty Capital Hospitality Trust, Inc. (incorporated by reference to Exhibit 10.19 to the Company’s Annual Report on Form 10-K (SEC File No. 001-12073) filed with the SEC on May 1, 2015). | |
| 10.20 | Guaranty dated as of February 27, 2015, by American Realty Capital Hospitality Operating Partnership, L.P., American Realty Capital Hospitality Trust, Inc., Nicholas S. Schorsch, William M. Kahane, Edward M. Weil, Jr., Peter M. Budko for the benefit of W2007 Equity Inns Partnership, L.P. and W2007 Equity Inns Trust (incorporated by reference to Exhibit 10.20 to the Company’s Annual Report on Form 10-K (SEC File No. 001-12073) filed with the SEC on May 1, 2015). | |
| 10.21 | Environmental Indemnity Agreement dated as of February 27, 2015, by American Realty Capital Hospitality Operating Partnership, L.P., American Realty Capital Hospitality Trust, Inc., Nicholas S. Schorsch, William M. Kahane, Edward M. Weil, Jr., Peter M. Budko for the benefit of W2007 Equity Inns Partnership, L.P. and W2007 Equity Inns Trust (incorporated by reference to Exhibit 10.21 to the Company’s Annual Report on Form 10-K (SEC File No. 001-12073) filed with the SEC on May 1, 2015). | |
| 10.22 | Mandatory Redemption Guaranty dated as of February 27, 2015, by American Realty Capital Hospitality Operating Partnership, L.P., American Realty Capital Hospitality Trust, Inc., Nicholas S. Schorsch, William M. Kahane, Edward M. Weil, Jr., Peter M. Budko for the benefit of W2007 Equity Inns Partnership, L.P. and W2007 Equity Inns Trust (incorporated by reference to Exhibit 10.22 to the Company’s Annual Report on Form 10-K (SEC File No. 001-12073) filed with the SEC on May 1, 2015). | |
| 10.23* | Loan Agreement, dated as of October 25, 2007, by and among W2007 Equity Inns Realty, LLC, W2007 Equity Inns Realty, L.P. and Goldman Sachs Mortgage Company. | |
| 10.24* | First Omnibus Amendment to Loan Documents (Mortgage), dated as of February 11, 2008, by and among W2007 Equity Inns Realty, LLC, W2007 Equity Inns Realty, L.P. and Goldman Sachs Mortgage Company. | |
| 10.25* | Second Omnibus Amendment to Loan Documents (Mortgage), dated as of April 2, 2008 by and among W2007 Equity Inns Realty, LLC, W2007 Equity Inns Realty, L.P. and Goldman Sachs Mortgage Company. | |
| 10.26* | Third Omnibus Amendment to Loan Documents (Mortgage), dates as of December 15, 2010, by and among General Electric Capital Corporation, New York Life Insurance Company, PB Capital Corporation, The Governor and Company of the Bank of Ireland, Connecticut Branch, Goldman Sachs Mortgage Company, Guggenheim Structures Real Estate Funding 2005-1 Ltd., Oregon Public Employees Retirement Fund, KeyBank National Association, W2007 Equity Inns Realty, LLC and W2007 Equity Inns Realty, L.P. | |
| 10.27* | Mezzanine A Loan Agreement, dated as of October 25, 2007, by and between W2007 Equity Inns Senior Mezz, LLC and Goldman Sachs Mortgage Company. | |
| 10.28* | Omnibus Amendment to Loan Documents (Mezzanine A), dated as of April 2, 2008, by and between Goldman Sachs Mortgage Company and W2007 Equity Inns Senior Mezz, LLC. | |
| 10.29* | Second Omnibus Amendment to Loan Documents (Mezzanine Loan), dated as of December 15, 2010, by and between Goldman Sachs Mortgage Company and W2007 Equity Inns Senior Mezz, LLC. | |
| 21.1* | List of subsidiaries of W2007 Grace Acquisition I, Inc. | |
| 31.1* | Certification of Todd Giannoble, Chief Executive Officer of W2007 Grace Acquisitions I, Inc., pursuant to Rule 13a-14(a) of the Securities Exchange Act of 1934, as amended, and dated June 12, 2015. | |
| 31.2* | Certification of Greg Fay, Chief Financial Officer of W2007 Grace Acquisition I, Inc., pursuant to Rule 15d-14(a) of the Securities Exchange Act of 1934, as amended, and dated June 12, 2015. | |
| 32.1* | Certification of Todd Giannoble, Chief Executive Officer of W2007 Grace Acquisition I, Inc. pursuant to 18 U.S.C. Section 1350 as adopted pursuant to Section 906 of the Sarbanes-Oxley Act of 2002 and dated June 12, 2015. | |
| 32.2* | Certification of Greg Fay, Chief Financial Officer of W2007 Grace Acquisition I, Inc. pursuant to 18 U.S.C. Section 1350 as adopted pursuant to Section 906 of the Sarbanes-Oxley Act of 2002 and dated June 12, 2015. | |
| 101.INS* | XBRL Instance Document | |
| 101.SCH* | XBRL Taxonomy Extension Schema Document. | |
| 101.CAL* | XBRL Taxonomy Calculation Linkbase Document. | |
| 101.DEF* | XBRL Taxonomy Extension Definition Linkbase Document. | |
| 101.LAB* | XBRL Taxonomy Label Linkbase Document. | |
| 101.PRE* | XBRL Taxonomy Presentation Linkbase Document. | |
| * | Filed herewith |
-49-
Pursuant to the requirements of Section 13 or 15(d) of the Securities Exchange Act of 1934, the registrant has duly caused this report to be signed on its behalf by the undersigned thereunto duly authorized.
| W2007 Grace Acquisition I, Inc. (registrant) | ||
| Date: June 12, 2015 | ||
| By: | /s/ Todd Giannoble | |
| Todd Giannoble | ||
| Chief Executive Officer | ||
Pursuant to the requirements of Section 13 or 15(d) of the Securities Exchange Act of 1934, this report has been signed below on behalf of the Registrant in the capacities and on the dates indicated.
| Signature |
Title |
Date | ||||
|
/s/ TODD GIANNOBLE Todd Giannoble |
Chief Executive Officer and Director (Principal Executive Officer) |
June 12, 2015 | ||||
| /s/ GREG FAY Greg Fay |
Chief Financial Officer and Director (Principal Financial and Accounting Officer) |
June 12, 2015 | ||||
| /s/ BRIAN NORDAHL Brian Nordahl |
Director | June 12, 2015 | ||||
Supplemental Information to be furnished with reports filed pursuant to Section 15(d) of the Securities Act by registrants which have not registered securities pursuant to Section 12 of the Securities Act.
The registrant has not provided an annual report for the fiscal year covered by this report to its security holders, other than this annual report on Form 10-K, and has not sent any proxy statement, form of proxy or other proxy soliciting material to more than 10 of the registrant’s security holders with respect to any annual or other meeting of security holders.
-50-
Report of Independent Registered Public Accounting Firm
The Board of Directors and Shareholders of
W2007 Grace Acquisition I, Inc.
We have audited the accompanying consolidated balance sheets of W2007 Grace Acquisition I, Inc. as of December 31, 2014, 2013 and 2012, and the related consolidated statements of operations and comprehensive loss, changes in equity and cash flows for each of the four years in the period ended December 31, 2014. Our audits also included the financial statement schedules listed in the Index at Item 15.2. These financial statements and schedules are the responsibility of the Company’s management. Our responsibility is to express an opinion on these financial statements and schedules based on our audits.
We conducted our audits in accordance with the standards of the Public Company Accounting Oversight Board (United States). Those standards require that we plan and perform the audit to obtain reasonable assurance about whether the financial statements are free of material misstatement. We were not engaged to perform an audit of the Company’s internal control over financial reporting. Our audits included consideration of internal control over financial reporting as a basis for designing audit procedures that are appropriate in the circumstances, but not for the purpose of expressing an opinion on the effectiveness of the Company’s internal control over financial reporting. Accordingly, we express no such opinion. An audit also includes examining, on a test basis, evidence supporting the amounts and disclosures in the financial statements, assessing the accounting principles used and significant estimates made by management, and evaluating the overall financial statement presentation. We believe that our audits provide a reasonable basis for our opinion.
In our opinion, the financial statements referred to above present fairly, in all material respects, the consolidated financial position of W2007 Grace Acquisition I, Inc. at December 31, 2014, 2013 and 2012, and the consolidated results of its operations and its cash flows for each of the four years in the period ended December 31, 2014, in conformity with U.S. generally accepted accounting principles. Also, in our opinion, the related financial statement schedules, when considered in relation to the basic financial statements taken as a whole, present fairly in all material respects the information set forth therein.
As discussed in Note 2 to the consolidated financial statements, the Company changed its reporting of discontinued operations as a result of the adoption of the amendments to the FASB Accounting Standards Codification resulting from Accounting Standards Update No. 2014-08, “Presentation of Financial Statements (Topic 205) and Property, Plant, and Equipment (Topic 360): Reporting Discontinued Operations and Disclosures of Disposals of Components of an Entity”. Our opinion is not modified with respect to this matter.
/s/ Ernst & Young, LLP
Fort Worth, TX
June 12, 2015
F-1
W2007 GRACE ACQUISITION I, INC.
(in thousands, except share and per share amounts)
| December 31, 2014 |
December 31, 2013 |
December 31, 2012 |
||||||||||
| ASSETS | ||||||||||||
| INVESTMENTS IN REAL ESTATE, net |
$ | 240,830 | $ | 1,392,097 | $ | 1,562,422 | ||||||
| INVESTMENT IN SENIOR MEZZ |
4,920 | — | — | |||||||||
| CASH AND CASH EQUIVALENTS |
12,444 | 12,404 | 13,051 | |||||||||
| RESTRICTED CASH |
2,809 | 46,849 | 35,341 | |||||||||
| ACCOUNTS RECEIVABLE, net |
1,906 | 8,453 | 8,760 | |||||||||
| OTHER ASSETS |
834 | 6,492 | 5,548 | |||||||||
| DEFERRED FINANCING COSTS, net of accumulated amortization of $1,803, $36,309 and $36,235, respectively |
359 | 614 | 980 | |||||||||
| DEFERRED FRANCHISE FEES, net of accumulated amortization of $820, $3,704 and $3,283, respectively |
918 | 3,541 | 4,260 | |||||||||
|
|
|
|
|
|
|
|||||||
| Total assets |
$ | 265,020 | $ | 1,470,450 | $ | 1,630,362 | ||||||
|
|
|
|
|
|
|
|||||||
| LIABILITIES AND EQUITY | ||||||||||||
| NOTES PAYABLE |
$ | 203,126 | $ | 1,161,725 | $ | 1,245,557 | ||||||
| OTHER LIABILITIES: |
||||||||||||
| Accounts payable and accrued liabilities |
33,437 | 41,986 | 42,347 | |||||||||
| Payable to affiliate |
6,763 | — | — | |||||||||
| Accrued interest payable |
1,020 | 16,529 | 20,619 | |||||||||
|
|
|
|
|
|
|
|||||||
| Total liabilities |
244,346 | 1,220,240 | 1,308,523 | |||||||||
| COMMITMENTS AND CONTINGENCIES |
||||||||||||
| SHAREHOLDERS’ EQUITY: |
||||||||||||
| Preferred stock, $0.01 par value, 10,000,000 shares authorized: |
||||||||||||
| Series B, 8.75%, $0.01 par value, $25.00 redemption value, 3,450,000 shares issued and outstanding |
60,375 | 60,375 | 60,375 | |||||||||
| Series C, 9.00%, $0.01 par value, $25.00 redemption value, 2,400,000 shares issued and outstanding |
40,800 | 40,800 | 40,800 | |||||||||
| Series D, 8.00%, $0.01 par value, $250.00 redemption value, 125 shares issued and outstanding |
31 | 31 | 31 | |||||||||
| Common stock, $0.01 par value, 100,000,000 shares authorized, 100 shares issued and outstanding |
— | — | — | |||||||||
| Additional paid-in-capital |
9,979 | 10,195 | 10,195 | |||||||||
| Retained deficit |
(74,764 | ) | (47,484 | ) | (45,682 | ) | ||||||
|
|
|
|
|
|
|
|||||||
| Total shareholders’ equity |
36,421 | 63,917 | 65,719 | |||||||||
| NON-CONTROLLING EQUITY PURCHASE OPTION |
— | 175,000 | 175,000 | |||||||||
| NON-CONTROLLING INTEREST |
(15,747 | ) | 11,293 | 81,120 | ||||||||
|
|
|
|
|
|
|
|||||||
| Total equity |
20,674 | 250,210 | 321,839 | |||||||||
|
|
|
|
|
|
|
|||||||
| Total liabilities and equity |
$ | 265,020 | $ | 1,470,450 | $ | 1,630,362 | ||||||
|
|
|
|
|
|
|
|||||||
The accompanying notes are an integral part of these consolidated financial statements.
F-2
W2007 GRACE ACQUISITION I, INC.
CONSOLIDATED STATEMENTS OF OPERATIONS AND COMPREHENSIVE LOSS
(in thousands)
| Year Ended December 31, | ||||||||||||||||
| 2014 | 2013 | 2012 | 2011 | |||||||||||||
| REVENUES: |
||||||||||||||||
| Rooms |
$ | 173,222 | $ | 413,732 | $ | 395,697 | $ | 374,706 | ||||||||
| Food and beverage |
3,522 | 8,164 | 7,760 | 7,228 | ||||||||||||
| Other |
2,883 | 6,655 | 6,390 | 6,365 | ||||||||||||
|
|
|
|
|
|
|
|
|
|||||||||
| Total hotel revenues |
179,627 | 428,551 | 409,847 | 388,299 | ||||||||||||
|
|
|
|
|
|
|
|
|
|||||||||
| OPERATING EXPENSES: |
||||||||||||||||
| Direct hotel expenses: |
||||||||||||||||
| Rooms |
42,743 | 106,117 | 103,885 | 98,074 | ||||||||||||
| Food and beverage |
3,167 | 7,645 | 7,395 | 6,618 | ||||||||||||
| Other |
1,708 | 4,398 | 4,527 | 4,563 | ||||||||||||
| Non-departmental |
55,829 | 135,187 | 128,921 | 124,182 | ||||||||||||
| Property tax, ground lease, insurance and property management fees |
13,064 | 31,656 | 31,020 | 29,440 | ||||||||||||
| Corporate overhead |
5,967 | 6,454 | 6,482 | 5,245 | ||||||||||||
| Asset management fees |
3,073 | 7,063 | 6,648 | 6,137 | ||||||||||||
| Depreciation and amortization |
33,308 | 83,292 | 85,298 | 78,983 | ||||||||||||
| Impairment charges |
9,036 | 27,656 | 85,684 | 4,483 | ||||||||||||
|
|
|
|
|
|
|
|
|
|||||||||
| Total operating expenses |
167,895 | 409,468 | 459,860 | 357,725 | ||||||||||||
|
|
|
|
|
|
|
|
|
|||||||||
| OPERATING INCOME |
11,732 | 19,083 | (50,013 | ) | 30,574 | |||||||||||
| Equity in loss from Senior Mezz |
(1,429 | ) | — | — | — | |||||||||||
| Interest income |
76 | 82 | 87 | 101 | ||||||||||||
| Interest expense |
(31,325 | ) | (82,856 | ) | (84,433 | ) | (84,512 | ) | ||||||||
| Other income |
112 | 216 | 35 | 18 | ||||||||||||
| Unrealized loss on derivatives |
— | (57 | ) | (35 | ) | (401 | ) | |||||||||
| Contingent loss on litigation settlement |
(24,250 | ) | — | — | — | |||||||||||
| Gain on sale of investment in real estate |
221 | — | — | — | ||||||||||||
| Gain on extinguishment of debt |
13,199 | — | — | — | ||||||||||||
|
|
|
|
|
|
|
|
|
|||||||||
| LOSS FROM CONTINUING OPERATIONS |
(31,664 | ) | (63,532 | ) | (134,359 | ) | (54,220 | ) | ||||||||
| Income (loss) from discontinued operations |
— | (8,081 | ) | (1,876 | ) | 4,720 | ||||||||||
|
|
|
|
|
|
|
|
|
|||||||||
| NET LOSS |
(31,664 | ) | (71,613 | ) | (136,235 | ) | (49,500 | ) | ||||||||
| Net loss attributable to non-controlling interest |
4,384 | 69,811 | 134,400 | 48,924 | ||||||||||||
|
|
|
|
|
|
|
|
|
|||||||||
| NET LOSS ATTRIBUTABLE TO THE COMPANY |
$ | (27,280 | ) | $ | (1,802 | ) | $ | (1,835 | ) | $ | (576 | ) | ||||
|
|
|
|
|
|
|
|
|
|||||||||
| AMOUNTS ATTRIBUTABLE TO COMMON SHAREHOLDERS: |
||||||||||||||||
| Loss from continuing operations |
$ | (27,280 | ) | $ | (1,721 | ) | $ | (1,816 | ) | $ | (623 | ) | ||||
| Income (loss) from discontinued operations |
— | (81 | ) | (19 | ) | 47 | ||||||||||
|
|
|
|
|
|
|
|
|
|||||||||
| Net loss attributable to common shareholders |
$ | (27,280 | ) | $ | (1,802 | ) | $ | (1,835 | ) | $ | (576 | ) | ||||
|
|
|
|
|
|
|
|
|
|||||||||
| COMPREHENSIVE LOSS ATTRIBUTABLE TO COMMON SHAREHOLDERS |
$ | (27,280 | ) | $ | (1,802 | ) | $ | (1,835 | ) | $ | (576 | ) | ||||
|
|
|
|
|
|
|
|
|
|||||||||
The accompanying notes are an integral part of these consolidated financial statements.
F-3
W2007 GRACE ACQUISITION I, INC.
CONSOLIDATED STATEMENTS OF CHANGES IN EQUITY
(in thousands)
| Preferred Stock | Common Stock | Additional Paid-in Capital |
Retained Deficit |
Non-controlling Equity Purchase Option |
Non-controlling Interest |
Total | ||||||||||||||||||||||||||||||
| Shares | Dollars | Shares | Dollars | |||||||||||||||||||||||||||||||||
| Balance at January 1, 2011 |
5,850,125 | $ | 101,206 | 100 | $ | — | $ | 9,128 | $ | (43,271 | ) | $ | 281,811 | $ | 158,790 | $ | 507,664 | |||||||||||||||||||
| Net loss |
— | — | — | — | (576 | ) | — | (48,924 | ) | (49,500 | ) | |||||||||||||||||||||||||
| Distributions (1) |
— | — | — | — | (1 | ) | — | — | (76 | ) | (77 | ) | ||||||||||||||||||||||||
| Preferred stock dividends |
— | — | — | — | — | — | — | — | — | |||||||||||||||||||||||||||
|
|
|
|
|
|
|
|
|
|
|
|
|
|
|
|
|
|
|
|||||||||||||||||||
| Balance at December 31, 2011 |
5,850,125 | $ | 101,206 | 100 | $ | — | $ | 9,127 | $ | (43,847 | ) | $ | 281,811 | $ | 109,790 | $ | 458,087 | |||||||||||||||||||
|
|
|
|
|
|
|
|
|
|
|
|
|
|
|
|
|
|
|
|||||||||||||||||||
| Net loss |
— | — | — | — | — | (1,835 | ) | — | (134,400 | ) | (136,235 | ) | ||||||||||||||||||||||||
| Distributions (1) |
— | — | — | — | — | — | — | (13 | ) | (13 | ) | |||||||||||||||||||||||||
| Adjustment to non-controlling equity purchase option |
— | — | — | — | 1,068 | — | (106,811 | ) | 105,743 | — | ||||||||||||||||||||||||||
| Preferred stock dividends |
— | — | — | — | — | — | — | — | — | |||||||||||||||||||||||||||
|
|
|
|
|
|
|
|
|
|
|
|
|
|
|
|
|
|
|
|||||||||||||||||||
| Balance at December 31, 2012 |
5,850,125 | $ | 101,206 | 100 | $ | — | $ | 10,195 | $ | (45,682 | ) | $ | 175,000 | $ | 81,120 | $ | 321,839 | |||||||||||||||||||
|
|
|
|
|
|
|
|
|
|
|
|
|
|
|
|
|
|
|
|||||||||||||||||||
| Net loss |
— | — | — | — | — | (1,802 | ) | — | (69,811 | ) | (71,613 | ) | ||||||||||||||||||||||||
| Distributions (1) |
— | — | — | — | — | — | — | (16 | ) | (16 | ) | |||||||||||||||||||||||||
| Preferred stock dividends |
— | — | — | — | — | — | — | — | — | |||||||||||||||||||||||||||
|
|
|
|
|
|
|
|
|
|
|
|
|
|
|
|
|
|
|
|||||||||||||||||||
| Balance at December 31, 2013 |
5,850,125 | $ | 101,206 | 100 | $ | — | $ | 10,195 | $ | (47,484 | ) | $ | 175,000 | $ | 11,293 | $ | 250,210 | |||||||||||||||||||
|
|
|
|
|
|
|
|
|
|
|
|
|
|
|
|
|
|
|
|||||||||||||||||||
| Net loss |
— | — | — | — | — | (27,280 | ) | — | (4,384 | ) | (31,664 | ) | ||||||||||||||||||||||||
| Distributions (1) |
— | — | — | — | — | — | — | (9 | ) | (9 | ) | |||||||||||||||||||||||||
| Forgiveness of accrued asset management fees |
— | — | — | — | 80 | — | — | 6,628 | 6,708 | |||||||||||||||||||||||||||
| Exercise of Purchase Option |
— | — | — | — | (296 | ) | — | (175,000 | ) | (29,275 | ) | (204,571 | ) | |||||||||||||||||||||||
|
|
|
|
|
|
|
|
|
|
|
|
|
|
|
|
|
|
|
|||||||||||||||||||
| Balance at December 31, 2014 |
5,850,125 | $ | 101,206 | 100 | $ | — | $ | 9,979 | $ | (74,764 | ) | $ | — | $ | (15,747 | ) | $ | 20,674 | ||||||||||||||||||
|
|
|
|
|
|
|
|
|
|
|
|
|
|
|
|
|
|
|
|||||||||||||||||||
| (1) | Distribution to Grace I for corporate expenses incurred. |
The accompanying notes are an integral part of these consolidated financial statements.
F-4
W2007 GRACE ACQUISITION I, INC.
CONSOLIDATED STATEMENTS OF CASH FLOWS
(in thousands)
| Year Ended December 31, | ||||||||||||||||
| 2014 | 2013 | 2012 | 2011 | |||||||||||||
| CASH FLOWS FROM OPERATING ACTIVITIES: |
||||||||||||||||
| Net loss |
$ | (31,664 | ) | $ | (71,613 | ) | $ | (136,235 | ) | $ | (49,500 | ) | ||||
| Adjustments to reconcile net loss to net cash from operating activities: |
||||||||||||||||
| Bad debt expense |
51 | 72 | 250 | 283 | ||||||||||||
| Accretion of notes payable fair value adjustment at acquisition |
1,006 | 1,507 | 1,076 | 1,133 | ||||||||||||
| Amortization of deferred financing costs |
255 | 366 | 290 | 308 | ||||||||||||
| Deductible on involuntary conversion claims |
269 | 532 | 992 | 360 | ||||||||||||
| Fair value adjustment of derivative instruments |
— | 57 | 35 | 401 | ||||||||||||
| Depreciation and amortization |
33,308 | 86,504 | 89,818 | 82,977 | ||||||||||||
| Amortization of below market ground leases |
73 | 262 | 284 | 305 | ||||||||||||
| Equity in loss from Senior Mezz |
1,429 | — | — | — | ||||||||||||
| Net (gain) loss on extinguishment of debt |
(13,199 | ) | 2,647 | — | (7,488 | ) | ||||||||||
| Net (gain) loss on sale of investments in real estate |
(221 | ) | 5,890 | (254 | ) | 357 | ||||||||||
| Impairment charges |
9,036 | 27,656 | 86,715 | 4,483 | ||||||||||||
| Contingent loss on litigation settlement |
24,250 | — | — | — | ||||||||||||
| Changes in operating assets and liabilities: |
||||||||||||||||
| Accounts receivable |
(3,615 | ) | (272 | ) | (170 | ) | 1,137 | |||||||||
| Other assets |
(2,155 | ) | (380 | ) | 2,247 | (1,306 | ) | |||||||||
| Accounts payable and accrued liabilities |
5,525 | 2,443 | 3,882 | 2,120 | ||||||||||||
| Accrued interest payable |
(2,310 | ) | 6,780 | 14,732 | 20,711 | |||||||||||
|
|
|
|
|
|
|
|
|
|||||||||
| Net cash from operating activities |
22,038 | 62,451 | 63,662 | 56,281 | ||||||||||||
|
|
|
|
|
|
|
|
|
|||||||||
| CASH FLOWS FROM INVESTING ACTIVITIES: |
||||||||||||||||
| Additions to investments in real estate |
(11,602 | ) | (23,682 | ) | (46,356 | ) | (42,427 | ) | ||||||||
| Proceeds from property casualty insurance |
1,391 | 2,051 | 736 | 25 | ||||||||||||
| Change in restricted cash |
30,121 | (11,508 | ) | 6,639 | 2,486 | |||||||||||
| Net proceeds from sale of investments in real estate |
240 | 70,112 | 2,252 | 839 | ||||||||||||
| Payment of initial franchise fees |
— | (1,158 | ) | — | (85 | ) | ||||||||||
|
|
|
|
|
|
|
|
|
|||||||||
| Net cash from (used in) investing activities |
20,150 | 35,815 | (36,729 | ) | (39,162 | ) | ||||||||||
|
|
|
|
|
|
|
|
|
|||||||||
| CASH FLOWS FROM FINANCING ACTIVITIES: |
||||||||||||||||
| Principal payments on notes payable |
(959,605 | ) | (96,209 | ) | (25,629 | ) | (16,162 | ) | ||||||||
| Proceeds from notes payable |
976,000 | — | — | — | ||||||||||||
| Advance from affiliate |
1,700 | — | — | — | ||||||||||||
| Payment of defeasance premiums |
— | (2,647 | ) | — | — | |||||||||||
| Payment of deferred financing costs |
(21,049 | ) | — | — | — | |||||||||||
| Purchase of interest rate derivative instruments |
(293 | ) | (57 | ) | (35 | ) | — | |||||||||
| Cash received in connection with the exercise of the purchase option |
(38,901 | ) | — | — | — | |||||||||||
|
|
|
|
|
|
|
|
|
|||||||||
| Net cash used in financing activities |
(42,148 | ) | (98,913 | ) | (25,664 | ) | (16,162 | ) | ||||||||
|
|
|
|
|
|
|
|
|
|||||||||
| NET CHANGE IN CASH AND CASH EQUIVALENTS |
40 | (647 | ) | 1,269 | 957 | |||||||||||
| CASH AND CASH EQUIVALENTS, beginning of period |
12,404 | 13,051 | 11,782 | 10,825 | ||||||||||||
|
|
|
|
|
|
|
|
|
|||||||||
| CASH AND CASH EQUIVALENTS, end of period |
$ | 12,444 | $ | 12,404 | $ | 13,051 | $ | 11,782 | ||||||||
|
|
|
|
|
|
|
|
|
|||||||||
| SUPPLEMENTAL DISCLOSURES: |
||||||||||||||||
| Interest paid |
$ | 31,502 | $ | 75,774 | $ | 69,952 | $ | 65,359 | ||||||||
| Non-cash additions to investments in real estate included in accounts payable and accrued liabilities |
$ | 1,453 | $ | 2,127 | $ | 4,226 | $ | 4,619 | ||||||||
| Non-cash additions to notes payable (interest on First Mezzanine Loan added to principal balance) |
$ | — | $ | 10,870 | $ | 9,070 | $ | 7,772 | ||||||||
| Non-cash distributions to common shareholder |
$ | — | $ | — | $ | — | $ | (1 | ) | |||||||
| Non-cash distributions to non-controlling interest |
$ | (9 | ) | $ | (16 | ) | $ | (13 | ) | $ | (76 | ) | ||||
| Adjustment to non-controlling equity purchase option |
$ | — | $ | — | $ | (106,811 | ) | $ | — | |||||||
See Note 1 for the detail of the net assets transferred in conjunction with the exercise of the equity purchase option.
The accompanying notes are an integral part of these consolidated financial statements.
F-5
W2007 GRACE ACQUISITION I, INC.
NOTES TO CONSOLIDATED FINANCIAL STATEMENTS
1. ORGANIZATION :
W2007 Grace I, LLC (Grace I), a Tennessee limited liability company, was formed on June 20, 2007. Grace I is owned by W2007 Finance Sub, LLC, a Delaware limited liability company, and Whitehall Parallel Global Real Estate Limited Partnership 2007, a Delaware limited partnership (collectively, Whitehall). WNT is also owned by Whitehall. The general partner of Whitehall Parallel Global Real Estate Limited Partnership 2007 and the partnerships owning W2007 Finance Sub, LLC is a wholly-owned subsidiary of The Goldman Sachs Group, Inc. (GS Group) and, therefore, is an affiliate of GS Group. GS Group in turn also controls Goldman, Sachs & Co. (GS) and Goldman Sachs Mortgage Company (GSMC). Consequently, GS and GSMC are also affiliates of Whitehall.
Grace I, W2007 Grace Acquisition I, Inc. (Grace Acquisition I), Equity Inns, Inc. (Equity Inns), Grace II, L.P. (Grace II) and Equity Inns Partnership, L.P. (Equity LP) entered into an agreement and plan of merger (Merger Agreement) whereby Equity Inns would merge with and into Grace Acquisition I and Grace II would merge with and into Equity LP (Merger). The Merger was completed on October 25, 2007. Prior to the Merger, Grace Acquisition I had no operations other than its activities in anticipation of the Merger.
Prior to the Merger, Equity Inns was a public hotel company and had elected to be taxed as a real estate investment trust (REIT) for federal income tax purposes. Equity Inns, through its wholly owned subsidiary, Equity Inns Trust (Equity Trust), was the sole general partner of Equity LP. Equity Inns, Equity Trust and Equity LP (and its wholly owned subsidiaries) are hereinafter collectively referred to as Equity. Prior to the Merger, Equity owned 137 limited-service hotels located throughout the United States.
Subsequent to the Merger, Grace II changed its name to W2007 Equity Inns Partnership, L.P. (W2007 Equity LP). As of December 31, 2014 and 2013, Grace I owns all of the common shares of Grace Acquisition I and Grace Acquisition I owns a 1% general partnership interest in W2007 Equity LP (with Grace I owning a 1% general partnership interest and a 98% limited partnership interest). Grace Acquisition I and W2007 Equity LP (and its wholly owned subsidiaries) are hereinafter referred to as the Company.
Following the Merger, the Company and Grace I entered into a Keepwell Agreement, effective as of the date of the Merger (the Keepwell Agreement), pursuant to which Grace I agreed to make such cash payments to the Company as are necessary to enable the Company to satisfy its obligations to the holders of the Company’s 8.75% Series B cumulative preferred stock (Series B preferred stock) and 9.00% Series C cumulative preferred stock (Series C preferred stock) in accordance with the Company’s charter when the Company determines, or is legally compelled, to satisfy such obligations. To date, no payments have been made and none are due under the Keepwell Agreement. The Keepwell Agreement may be terminated by Grace I at any time upon 30 days’ prior written notice. There are no third-party beneficiaries of the Keepwell Agreement.
On March 31, 2008, Grace Acquisition I, pursuant to Section 856(g)(2) of the Internal Revenue Code of 1986, as amended (the Code), revoked its election under Section 856(c)(1) of the Code to be a REIT for the taxable year ending on December 31, 2008. Consequently, subsequent to December 31, 2007, Grace Acquisition I is subject to income taxes at statutory corporate rates.
F-6
The Company leased substantially all of its hotels to subsidiaries (TRS Lessees) of W2007 Equity Inns TRS Holdings, Inc. (TRS Holdings), a taxable REIT subsidiary, pursuant to certain percentage lease agreements (the TRS Leases). The TRS Leases were necessary for the Company to comply with certain REIT provisions of the Code. As discussed above, the Company has revoked its election to be taxed as a REIT. As of December 31, 2012, all of the TRS Leases had been terminated.
In July 2012, WNT Holdings, LLC (WNT), a Delaware limited liability company and a subsidiary of Whitehall, acquired, for $175,000,000, an option (Purchase Option) to purchase a 97% equity interest in W2007 Equity Inns Senior Mezz, LLC (Senior Mezz), a wholly owned subsidiary of the Company, from an affiliate of GSMC. The Purchase Option was not effective or exercisable until certain notes payable of Senior Mezz and its subsidiaries had been paid in full. On April 11, 2014, Senior Mezz and its subsidiaries refinanced the GE Mortgage Note Payable (see Note 7) and WNT exercised the Purchase Option. As a result of the loss of control of Senior Mezz, effective April 11, 2014, the Company deconsolidated Senior Mezz and began recognizing its 3% interest in the entity using the equity method. This is reflected in the accompanying consolidated balance sheets under the caption investment in Senior Mezz. The net assets transferred to WNT and the net decrease in equity are as follows (in thousands):
| Investments in real estate |
$ | 1,119,302 | ||
| Restricted cash |
13,919 | |||
| Cash and cash equivalents |
38,901 | |||
| Accounts receivable, net |
14,505 | |||
| Other assets |
6,857 | |||
| Interest rate derivative instrument |
293 | |||
| Deferred financing costs, net |
21,049 | |||
| Deferred franchise fees, net |
3,663 | |||
| Notes payable |
(976,000 | ) | ||
| Accounts payable and accrued liabilities |
(31,591 | ) | ||
|
|
|
|||
| Net assets transferred |
210,898 | |||
| Recognition of investment in Senior Mezz |
(6,327 | ) | ||
|
|
|
|||
| Net decrease in equity |
$ | 204,571 | ||
|
|
|
A receivable from the Company to Senior Mezz of approximately $5,063,000 was included in accounts receivable above and, at December 31, 2014, the related payable from the Company to Senior Mezz was included in payable to affiliate in the accompanying consolidated balance sheets.
F-7
As of December 31, 2013, the Company owned 126 hotels located in 35 states, the majority of which operate under franchise agreements with Marriott, Hilton, Hyatt and Intercontinental. As of December 31, 2013, the managers of the hotels are as follows:
| Number of Hotels |
||||
| Hilton Hotels Corporation |
46 | |||
| Pillar Hotels and Resorts, L.P. |
24 | |||
| McKibbon Hotel Group |
21 | |||
| Huntington Hotel Group |
13 | |||
| Other (represented by four different management companies) |
22 | |||
|
|
|
|||
| 126 | ||||
|
|
|
|||
As of December 31, 2014, the Company owned 20 hotels located in 13 states, which operated under franchise agreements with Marriott and Hilton. As of December 31, 2014, the managers of these hotels were as follows:
| Number of Hotels |
||||
| Hilton Hotels Corporation |
9 | |||
| Gateway Lodging Co., Inc. |
4 | |||
| Pillar Hotels and Resorts, L.P. |
3 | |||
| McKibbon Hotel Group |
2 | |||
| Huntington Hotel Group |
2 | |||
|
|
|
|||
| 20 | ||||
|
|
|
|||
F-8
In addition, as of December 31, 2014, the Company owned a 3% interest in Senior Mezz which indirectly owned 106 hotels located in 34 states, which operated under franchise agreements with Marriott, Hilton, Hyatt and Intercontinental. As of December 31, 2014, the managers of these hotels were as follows:
| Number of Hotels |
||||
| Hilton Hotels Corporation |
37 | |||
| Pillar Hotels and Resorts, L.P. |
21 | |||
| McKibbon Hotel Group |
19 | |||
| Huntington Hotel Group |
11 | |||
| Other (represented by four different management companies) |
18 | |||
|
|
|
|||
| 106 | ||||
|
|
|
|||
2. SUMMARY OF SIGNIFICANT ACCOUNTING POLICIES :
Principles of consolidation
The consolidated financial statements include the accounts of Grace Acquisition I, W2007 Equity LP and subsidiaries of W2007 Equity LP. Because Grace Acquisition I is the general partner of W2007 Equity LP and has control over its management and major operating decisions, the accounts of W2007 Equity LP are consolidated in the consolidated financial statements of Grace Acquisition I. All significant intercompany balances and transactions have been eliminated.
Use of estimates
The Company prepares its financial statements in conformity with accounting principles generally accepted in the United States. This requires management to make estimates and assumptions that affect the reported amounts of assets and liabilities and disclosure of contingent assets and liabilities as of the date of the financial statements and the reported amounts of revenues and expenses during the reporting period. Actual results could differ from those estimates.
Investments in real estate
Real estate investments are carried at depreciated cost net of reduction for impairment. Expenditures for ordinary repairs and maintenance are expensed as incurred. Significant renovations and improvements, which improve or extend the useful life of the assets, are capitalized. Full stock replacements of china, glass, silver, uniforms and linen are capitalized and incidental purchases are expensed as incurred.
F-9
Investments in real estate consist of the following (in thousands):
| December 31, 2014 |
December 31, 2013 |
December 31, 2012 |
||||||||||
| Land and improvements |
$ | 50,900 | $ | 277,497 | $ | 299,577 | ||||||
| Buildings and improvements |
258,829 | 1,159,285 | 1,253,710 | |||||||||
| Furniture, fixtures and equipment |
— | 322,019 | 324,366 | |||||||||
| Below market ground leases |
— | 13,253 | 13,253 | |||||||||
|
|
|
|
|
|
|
|||||||
| Total cost |
309,729 | 1,772,054 | 1,890,906 | |||||||||
| Accumulated depreciation and amortization |
(68,899 | ) | (379,957 | ) | (328,484 | ) | ||||||
|
|
|
|
|
|
|
|||||||
| Investment in real estate, net |
$ | 240,830 | $ | 1,392,097 | $ | 1,562,422 | ||||||
|
|
|
|
|
|
|
|||||||
Depreciation is calculated using the straight-line method over the estimated useful lives of the respective assets as follows: buildings and improvements over 7.5 to 39 years; land improvements over 15 years; and furniture, fixtures and equipment, including china, glass, silver, uniforms and linen, over 3 to 7 years. Below market ground leases were amortized over the remaining term of the related lease agreements, which ranged from 16 to 52 years. Effective from the exercise of the Purchase Option on April 11, 2014, none of the Company’s consolidated hotels are, as of December 31, 2014, subject to a ground lease. For the years ended December 31, 2014, 2013, 2012 and 2011, the Company recognized depreciation expense, including discontinued operations, of $33,081,000, $85,951,000, $89,170,000 and $82,340,000 respectively.
Assets are classified as held for sale if a disposal plan is in place, actions to achieve the sale have been initiated, a sale is probable and it is unlikely that significant changes to the plan will be made or that the plan will be withdrawn. Sales of the Company’s investments in real estate take a significant amount of time to consummate and many changes in the terms and timing are typical in the process. Accordingly, management does not classify assets as held for sale until a contract is pending, closing is scheduled and the probability of significant changes in terms or timing is insignificant. We evaluate assets held for sale for impairment each reporting period and record them at the lower of their carrying amounts or fair value less costs to sell.
On May 23, 2014, the subsidiaries of Grace I and WNT entered into an agreement to sell their 126 hotels for a combined purchase price of $1.925 billion, subject to certain adjustments, to affiliates of ARC Hospitality. The agreement was subsequently amended and restated on November 11, 2014 to exclude ten hotels from the sale (all ten of which are owned by subsidiaries of WNT), remove several closing contingencies and extend the closing date. The amended and restated agreement provided for the sale of 116 hotels for a combined purchase price of $1.808 billion with closing scheduled on February 27, 2015 (see Note 16). The closing of the sale was subject to lender approvals as well as other customary closing conditions. As of December 31, 2014, the Company concluded that there could be no assurance that the transaction would close as scheduled and, therefore, the real estate investments to be sold were not classified as held for sale as of December 31, 2014. No real estate investments were classified as held for sale as of December 2013 or 2012.
F-10
Investment in Senior Mezz
The Company’s 3% investment in Senior Mezz is accounted for under the equity method of accounting. The Company initially recognized it pro rata interest in the net assets of Senior Mezz and has also recognized its pro rata interest in Senior Mezz’s net income or loss. Management reviews the investment in Senior Mezz for impairment each reporting period. The investment is impaired when its estimated fair value is less than the carrying amount of the investment. Any impairment is recorded in equity in income (loss) from Senior Mezz. No such impairment was recorded for the year ended December 31, 2014.
Fair value measurements
Fair value measurements are market-based measurements, not entity-specific measurements. Fair value measurement assumptions are classified under a hierarchy that distinguishes between market participant assumptions based on market data obtained from sources independent of the reporting entity (observable inputs that are classified within Levels 1 and 2 of the hierarchy) and management’s own assumptions about market participant assumptions (unobservable inputs classified within Level 3 of the hierarchy).
In instances where the determination of the fair value measurement is based on inputs from different levels of the fair value hierarchy, the level in the fair value hierarchy within which the entire fair value measurement falls is based on the lowest level input that is significant to the fair value measurement in its entirety. Management’s assessment of the significance of a particular input to the fair value measurement in its entirety requires judgment and considers factors specific to the asset or liability.
Fair value measurements of financial and nonfinancial assets and liabilities are based on (1) the assumptions that market participants would use in pricing the asset or liability, if available, or (2) management’s estimates of market participant assumptions.
F-11
Certain assets and liabilities are not measured at fair value on an ongoing basis but are subject to fair value adjustments only in certain circumstances (for example, when recording impairment on long-lived assets). The following table presents nonfinancial assets measured at fair value on a nonrecurring basis as of December 31, 2014, 2013, 2012 and 2011, and related impairment charges recorded (in thousands):
| Level 1 | Level 2 | Level 3 | Total Impairment Write-downs |
|||||||||||||
| 2014 |
||||||||||||||||
| Investments in real estate |
$ | — | $ | — | $ | — | $ | 7,582 | (1) | |||||||
| Investments in real estate |
— | — | 30,367 | 1,454 | ||||||||||||
|
|
|
|||||||||||||||
| $ | 9,036 | |||||||||||||||
| 2013 |
||||||||||||||||
| Investments in real estate |
$ | — | $ | — | $ | — | $ | 1,757 | (2) | |||||||
| Investments in real estate |
— | — | — | 3,297 | (3) | |||||||||||
| Investments in real estate |
— | — | 63,205 | 22,602 | ||||||||||||
|
|
|
|||||||||||||||
| $ | 27,656 | |||||||||||||||
| 2012 |
||||||||||||||||
| Investments in real estate |
$ | — | $ | — | $ | — | $ | 1,031 | (4) | |||||||
| Investments in real estate |
— | — | — | 21,505 | (5) | |||||||||||
| Investments in real estate |
— | — | 113,015 | 64,179 | ||||||||||||
|
|
|
|||||||||||||||
| $ | 86,715 | (6) | ||||||||||||||
| 2011 |
||||||||||||||||
| Investments in real estate |
$ | — | $ | — | $ | 6,518 | $ | 4,483 | ||||||||
| (1) | This impairment charge was recognized during the three months ended June 30, 2014 based on a fair value (Level 3) of $38,268 as of June 30, 2014. |
| (2) | This impairment charge was recognized during the three months ended June 30, 2013 based on a fair value (Level 3) of $5,352 as of June 30, 2013. |
| (3) | This impairment charge was recognized during the three months ended September 30, 2013 based on a fair value (Level 3) of $6,588 as of September 30, 2013. |
| (4) | This impairment charge was recognized during the three months ended March 31, 2012 based on a fair value (Level 3) of $2,059 as of March 31, 2012. |
| (5) | This impairment charge was recognized during the three months ended September 30, 2012 based on a fair value (Level 3) of $29,629 as of September 30, 2012. |
| (6) | $1,031 is included in income (loss) from discontinued operations in the accompanying consolidated statements of operations and comprehensive loss for the year ended December 31, 2012. |
Management reviews its investments for impairment whenever events or changes in circumstances indicate that the carrying amount of an asset may not be recoverable. The impairment write-downs recorded in 2014 were the result of the allocated purchase prices of the hotels under contract to sell to ARC Hospitality, which represents management’s best estimate of fair values, and in 2013, 2012 and 2011 were the result of unfavorable economic conditions within the markets in which the impaired hotels were located and hotel specific factors that were expected to negatively impact the future operations of the hotels. The assumptions used both in estimating fair values through a discounted cash flow model and the undiscounted cash flow analysis are inherently judgmental and reflect current and projected trends in revenue per available room, operating expenses, capitalization rates, discount rates, and the estimated holding periods for the applicable hotels. If an indicator of potential impairment existed, the hotel was tested for impairment for financial accounting purposes by comparing its carrying value to the estimated future undiscounted cash flows. The amount of the impairment is calculated as the amount by which the carrying value of the hotel exceeds its fair value.
F-12
The following table presents quantitative information about significant unobservable inputs used in determining the fair value of the above noted nonfinancial assets ($ in thousands):
2014
| Property Type |
Fair Value | Valuation Techniques |
Unobservable Inputs |
Range of Inputs | ||||||
| Hotels (2) |
$ | 68,635 | Discounted cash flows | Discount rate | 12% | |||||
| Exit price per key | $82 - $125 | |||||||||
| Hold period | 2 months - 6 months | |||||||||
| Revenue growth | 1.55% - 5.00% | |||||||||
| Expense growth | 0.81% - 5.10% | |||||||||
| 2013
|
||||||||||
| Property Type |
Fair Value | Valuation Techniques |
Unobservable Inputs |
Range of Inputs | ||||||
| Hotels (8) |
$ | 65,876 | Discounted cash flows | Discount rate | 12% | |||||
| Exit price per key | $40 - $75 | |||||||||
| Exit capitalization rate | 7.25% - 8.00% | |||||||||
| Hold period | 1.7 years - 2.3 years | |||||||||
| Revenue growth | (6.72%) - 7.84% | |||||||||
| Expense growth | (5.37%) - 5.68% | |||||||||
| Hotel (1) |
$ | 9,269 | Competitive set pricing | Price per key | $100/key | |||||
| 2012
|
||||||||||
| Property Type |
Fair Value | Valuation Techniques |
Unobservable Inputs |
Range of Inputs | ||||||
| Hotels (13) |
$ | 144,703 | Discounted cash flows | Discount rate | 12% | |||||
| Exit price per key | $22 - $75 | |||||||||
| Exit capitalization rate | 7.5% - 8.3% | |||||||||
| Hold period | 2.8 years - 3.1 years | |||||||||
| Revenue growth | 4.6% - 8.9% | |||||||||
| Expense growth | 3.5% - 6.5% | |||||||||
F-13
Cash and cash equivalents
The Company considers all highly liquid investments purchased with a maturity of three months or less that are not restricted to be cash equivalents. Cash equivalents are placed with reputable institutions and the balances may at times exceed federally insured deposit levels; however, the Company has not experienced any losses in such accounts.
The Company also considers deposits in transit from credit card processors to be cash equivalents.
Accounts receivable and related allowance for doubtful accounts
Accounts receivable consist of amounts owed by guests staying in the hotels as of December 31, 2014, 2013 and 2012 and amounts due from business customers or groups. The Company maintains an allowance for doubtful accounts for estimated losses resulting from the inability of guests to make required payments for services. The allowance is maintained at a level believed adequate to absorb estimated receivable losses. The estimate is based on receivable loss experience, known and inherent credit risks, current economic conditions and other relevant factors including specific reserves for certain accounts. The allowance for doubtful accounts is $53,000, $252,000 and $597,000 as of December 31, 2014, 2013 and 2012, respectively.
Deferred financing costs
Deferred financing costs incurred in connection with the issuance of the notes payable are amortized over the contractual lives of the related notes payable using the straight-line method, adjusted for actual prepayments, which approximates the effective interest method. The respective amortization is included in interest expense and income (loss) from discontinued operations in the accompanying consolidated statements of operations and comprehensive loss.
Deferred franchise fees
The Company amortizes initial payments for franchises using the straight-line method over the lives of the franchise agreements, which range from 5 to 21 years. The respective amortization is included in depreciation and amortization and income (loss) from discontinued operations in the accompanying consolidated statements of operations and comprehensive loss.
F-14
Inventory
Inventories consist principally of food and beverage products and are stated at the lower of cost (as determined on a first-in, first-out basis) or market value. Inventories are included in other assets in the accompanying consolidated balance sheets.
Preferred stock
The carrying values of Grace Acquisition I’s Series B preferred stock and Series C preferred stock are $17.50 and $17.00 per share, respectively, which represent the fair values at the Merger date.
Non-controlling equity purchase option
The non-controlling equity purchase option (Purchase Option) represented the GSMC affiliate’s option to purchase a 97% equity interest in one of the Company’s wholly owned subsidiaries which indirectly owns 106 of the Company’s hotels (as of December 31, 2013, these hotels had a net book value of $1,135,795,000), which Purchase Option has since been acquired by WNT (see Note 7) and was exercised on April 11, 2014 (see Note 1). The initial carrying value of the Purchase Option was the fair value of the Purchase Option at its issuance in June 2009. In February 2012, the Purchase Option was amended and, therefore, the carrying value of the Purchase Option was adjusted to reflect the estimated fair value at the amendment date.
Non-controlling interest
Non-controlling interest represents Grace I’s proportionate share (99%) of the equity of W2007 Equity LP as provided for in its partnership agreement. The majority of the Company’s activities are conducted by W2007 Equity LP and its subsidiaries, and thus are reflected in non-controlling interest. However, the litigation accrual (see Note 14) has been deemed to relate to Grace Acquisition I and, therefore, is not reflected in non-controlling interest.
Revenue recognition
Revenues include room, food and beverage, and other hotel revenues such as guest telephone charges, equipment rentals, vending income, in-room movie sales, parking and business centers. Revenues from the hotels are recognized when the services are delivered and are recorded net of any sales or occupancy taxes collected from guests.
Non-departmental expenses
Non-departmental expenses include hotel-level general and administrative expenses, advertising and marketing costs, repairs and maintenance, frequent guest programs, franchise fees and utility costs. Non-departmental expenses are expensed as incurred.
F-15
Advertising and marketing
Advertising and marketing costs are expensed as incurred or as the advertising takes place. Advertising and marketing costs were $4,936,000, $11,908,000, $10,333,000 and $9,977,000 for the years ended December 31, 2014, 2013, 2012 and 2011, respectively. Included in marketing costs are fees (generally a percentage of room revenue) payable to marketing funds of the franchisors of the hotels.
Interest rate derivative instruments
The Company’s derivative transactions consist of interest rate cap agreements entered into to mitigate the Company’s exposure to increasing borrowing costs in the event of a rising interest rate environment. The Company has elected not to designate its interest rate cap agreements as cash flow hedges. Therefore, changes in the fair value of the interest rate caps are recorded as unrealized loss on derivatives in the accompanying consolidated statements of operations and comprehensive loss.
The valuations of the interest rate caps are determined using widely accepted valuation techniques including discounted cash flow analysis on the expected cash flows of each derivative. This analysis reflects the contractual terms of the derivatives, including the period to maturity, and uses observable market-based inputs, including interest rate curves. The cash receipts are based on an expectation of future interest rates using a forward curve that is derived from observable market interest rate curves.
The analysis has incorporated credit valuation adjustments to appropriately reflect the respective counterparty’s nonperformance risk in the fair value measurements. Management evaluated the counterparty’s nonperformance risk based on the counterparty’s most recent credit rating and any changes in credit rating over the past year. In adjusting the fair value of the derivative contract for the effect of nonperformance risk, management has considered the impact of netting and any applicable credit enhancements. Management concluded that the nonperformance risk is insignificant and no adjustment to the value was necessary for this input. Therefore, all inputs used to value the derivatives fall within Level 2 of the fair value hierarchy and the derivative valuations in their entirety are classified in Level 2 of the fair value hierarchy.
Income taxes
Certain transactions of the Company may be subject to accounting methods for income tax purposes which differ from the accounting methods used in preparing these financial statements. Accordingly, the net income or loss of the Company and the resulting balances in the shareholders’ equity accounts reported for income tax purposes may differ from the balances reported for those same items in the accompanying consolidated financial statements.
Grace Acquisition I and TRS Holdings (the Taxable Entities) are subject to federal and state income taxes. The Taxable Entities account for income taxes using the asset and liability method under which deferred tax assets and liabilities are recognized for the future tax consequences attributable to differences between the financial statement carrying amounts of assets and liabilities and their respective tax bases.
F-16
For uncertain tax positions, the Company makes a determination as to whether it is “more likely than not” that a tax position taken, based on its technical merits, will be sustained upon examination, including resolution of any appeals and litigation processes. If the more-likely-than-not threshold is met, the Company measures the related tax position to determine the amount of provision or benefit, if any, to recognize in the financial statements. The Company applies this policy to all tax positions related to income taxes subject to the asset and liability method. The Company files income tax returns in the U.S. federal jurisdiction and various states. If applicable, the Company classifies interest and penalties related to underpayment of income taxes as income tax expense. No income tax examinations are currently in process. As of December 31, 2014, tax years 2011 through 2014 remain subject to potential examination by certain federal and state taxing authorities. There are no amounts related to interest and penalties for the years ended December 31, 2014, 2013, 2012 and 2011, and management has determined that no material unrecognized tax benefits or liabilities exist as of December 31, 2014, 2013 or 2012. The Company does not anticipate any significant changes to unrecognized income tax benefits over the next year.
Concentration of credit risk
As of December 31, 2014, based on 2014 total revenues, the Company’s hotels are concentrated in Florida (18%), Texas (18%), Washington (12%), Illinois (10%), Georgia (9%), California (7%), and Kentucky (5%). As of December 31, 2013, based on 2013 total revenues, the Company’s hotels are concentrated in Florida (19%), Texas (10%), Tennessee (7%), Illinois (6%), Kentucky (5%), California (5%), Georgia (4%) and Michigan (4%).
Segment reporting
The Company considers each of its hotels to be an operating segment, none of which meets the threshold for a reportable segment as prescribed by the authoritative accounting guidance. The Company allocates resources and assesses operating performance based on each individual hotel. Additionally, the Company aggregates these individually immaterial operating segments into one segment using the criteria established by the authoritative accounting guidance, including the similarities of its product offering, types of customers and method of providing service.
Reclassifications
Certain amounts in the consolidated financial statements for the years ended December 31, 2013, 2012 and 2011 have been reclassified for discontinued operations. These reclassifications have no effect on the results of operations previously reported.
F-17
Recently issued accounting standards
In April 2014, the Financial Accounting Standards Board (FASB) issued Accounting Standards Update (ASU) 2014-08 Presentation of Financial Statements and Property, Plant and Equipment: Reporting Discontinued Operations and Disclosure of Disposals of Components of an Entity (ASU 2014-08). Under the new guidance, only a disposal of a component that represents a major strategic shift of an organization qualifies for discontinued operations reporting. The guidance also requires expanded disclosures about discontinued operations and new disclosures in regards to individually significant disposals that do not qualify for discontinued operations reporting. This guidance is effective for the first annual period beginning on or after December 15, 2014. Early adoption is permitted, but only for disposals that have not been reported in previously-issued financial statements. The Company elected to early adopt this guidance for the year ended December 31, 2014. During the year ended December 31, 2014, the Company did not have any disposals that represented a strategic shift nor were there any property sales in the current year that would have met the definition of discontinued operations prior to the adoption of the new standard.
In May 2014, the FASB issued ASU 2014-09 Revenue from Contracts with Customers, which requires an entity to recognize the amount of revenue to which it expects to be entitled for the transfer of promised goods or services to customers. ASU 2014-09 will replace most existing revenue recognition guidance in GAAP when it becomes effective. The standard permits the use of either the retrospective or cumulative effect transition method. The new standard is effective for the Company on January 1, 2018, but can be early adopted on January 1, 2017. The Company is evaluating the effect that ASU 2014-09 will have on its consolidated financial statements and related disclosures. The Company has not yet selected a transition method nor has it determined the effect of the standard on its ongoing financial reporting. The Company will make additional disclosures upon adoption.
In August 2014, the FASB issued ASU 2014-15 Presentation of Financial Statements – Going Concern. The new guidance establishes management’s responsibility to evaluate whether there is substantial doubt about an entity’s ability to continue as a going concern or to provide related footnote disclosures. The amendments require management to assess an entity’s ability to continue as a going concern by incorporating and expanding upon certain principles in U.S. auditing standards. Specifically, ASU 2014-15 provides a definition of the term substantial doubt and requires an assessment for a period of one year after the date that the financial statements are issued or available to be issued. It also requires certain disclosures when substantial doubt is alleviated as a result of consideration of management’s plans and requires an express statement and other disclosures when substantial doubt is not alleviated. The guidance is effective for the annual periods beginning on or after December 15, 2016; early adoption is permitted. The Company has not adopted ASU 2014-15, however, the Company does not anticipate that the adoption of this standard will have a material impact on the financial position, results of operations and related disclosures.
In February 2015, the FASB issued ASU No. 2015-02, Amendments to the Consolidation Analysis, which requires amendments to both the variable interest entity and voting models. The amendments (i) rescind the indefinite deferral of certain aspects of accounting standards relating to consolidations and provide a permanent scope exception for registered money market funds and similar unregistered money market funds, (ii) modify the identification of variable interest (fees paid to a decision maker or service provider), the VIE characteristics for a limited partnership or similar entity and primary beneficiary determination under the VIE model, and (iii) eliminate the presumption within the current voting model that a general partner controls a limited partnership or similar entity. The new guidance is effective for annual reporting periods, and interim periods within those annual periods, beginning after December 15, 2015 with early adoption permitted. The amendments may be applied using either a modified retrospective or full retrospective approach. The Company is currently evaluating the effect the guidance will have on its consolidated financial statements.
On April 7, 2015, the FASB issued ASU No. 2015-03, Simplifying the Presentation of Debt Issuance Costs, which requires debt issuance costs to be presented in the balance sheet as a direct deduction from the carrying value of the debt liability. This standard is effective for fiscal years beginning after December 15, 2015 with early adoption permitted and will be applied on a retrospective basis. The new standard will be effective for the Company on January 1, 2016 and will not have a material impact on the Company’s financial position, results of operations or cash flows.
F-18
3. RELATED PARTY TRANSACTIONS :
In April 2014, the asset management agreement between Grace I and Goldman Sachs Realty Management, L.P. (RMD, formerly known as Archon Group, L.P.) was amended and restated (A&R AMA). The A&R AMA is effective through December 31, 2019 and either party may terminate the agreement with 30 days written notice without cause or the payment of a fee. The owner of RMD is an affiliate of the Company.
RMD is paid a monthly fee by the Company for its asset management services. Pursuant to the Modification Agreement discussed in Note 7, the asset management fee was limited to $6,600,000 in 2011 with 5% increases in subsequent years thereafter until the GE Mortgage (as defined in Note 7) has been paid in full. The payment of 50% of the fee is deferred until the Company reaches a quarterly minimum debt yield of 13% or until the GE Mortgage has been paid in full. During periods where the Company has met such minimum yield, the asset management fee payment is limited to then current amounts, not to include previously deferred amounts. In connection with the refinancing of the GE Mortgage as discussed in Note 7, the restriction on the payment of asset management fees terminated. In April 2014, the Company paid $4,650,000 in accrued asset management fees to RMD and RMD forgave $6,708,000 in accrued asset management fees. This forgiveness was recorded as an increase in equity as the indebtedness was forgiven by RMD, an affiliate of the Company. For the years ended December 31, 2014, 2013, 2012 and 2011, RMD earned asset management fees of $3,073,000, $7,276,000, $6,951,000 and $6,539,000, of which $0, $3,638,000, $3,465,000 and $3,300,000 were deferred, respectively. Deferred asset management fees included in accounts payable and accrued liabilities in the accompanying consolidated balance sheets as of December 31, 2014, 2013 and 2012 are $0, $10,403,000 and $6,765,000, respectively. Since Grace I effectively has no operations of its own, Grace I allocated substantially all of the asset management fees to the Company for the years ended December 31, 2014, 2013, 2012 and 2011.
RMD is entitled to receive a disposition fee equal to 0.50% of the adjusted proceeds of $5,000,000 or more and 0.75% of the adjusted proceeds under $5,000,000 received by the Company in connection with the sale of any asset owned by the Company. As of December 31, 2014 and 2013, accrued disposition fees were $361,000 which were incurred in connection with the sale of four hotels during the year ended December 31, 2013.
In addition to the $5,063,000 payable to WNT transferred to the Company in connection with the exercise of the Purchase Option (see Note 1), the Company had a $1.7 million payable to WNT as of December 31, 2014.
As additional compensation, RMD was entitled under the prior agreement to receive an incentive fee of 20% of any distributable cash after all members of Grace I achieved an internal rate of return on their investment of at least 15%, but less than 20%; an incentive fee of 25% of any distributable cash after all members achieved an internal rate of return of 20%, but less than 25%; and an incentive fee of 30% of any distributable cash after all members achieved an internal rate of return of 25%. The A&R AMA removed the provision for the payment of any incentive fees. For the years ended December 31, 2014, 2013, 2012 and 2011, no incentive fees were earned by RMD.
F-19
On September 15, 2011, Pillar Hotels and Resorts, L.P. (Pillar) and its subsidiaries were sold to Capstone Management, LLC, an affiliate of InterMountain Management, LLC (InterMountain Management; Pillar Sale). Prior to this sale, Pillar was an affiliate of the Company.
As of December 31, 2014, the Company engaged Pillar as the property manager for 3 hotels and Senior Mezz engaged Pillar as the property manager for 21 hotels. The property management agreements (the PMAs) terminate between June 2018 and February 2019. The PMAs will automatically renew for an additional one year term unless the Company or Pillar elects not to renew the agreement. The Company may terminate the PMAs with 30 days written notice without cause or the payment of a fee.
The Company pays Pillar a monthly hotel management fee generally equal to 2% per annum of gross revenues for each hotel managed. For the 14 Hyatt Place hotels managed by Pillar for Senior Mezz, the monthly hotel management fees are subordinated to a priority return to the Company. For the years ended December 31, 2014, 2013, 2012 and 2011, the Company incurred base management fees of $299,000, $759,000, $705,000 and $668,000 and incentive fees of $11,000, $113,000, $153,000 and $147,000, respectively, which are included in property tax, ground lease, insurance and property management fees and income (loss) from discontinued operations in the accompanying consolidated statements of operations and comprehensive loss. Of the $815,000 total hotel management fee incurred for the year ended December 31, 2011, $489,000 was earned by Pillar prior to the Pillar Sale.
The Company pays Pillar a fixed monthly accounting fee. The accounting fee was $130,000, $368,000, $371,000 and $360,000 for the years ended December 31, 2014, 2013, 2012 and 2011, respectively, and is included in non-departmental direct hotel expenses and income (loss) from discontinued operations in the accompanying consolidated statements of operations and comprehensive loss.
The Company also pays Pillar a monthly capital oversight fee generally equal to its costs incurred related to procurement activities surrounding the Company’s capital expenditures. The capital oversight fee was $384,000, $727,000, $1,624,000 and $1,222,000 for the years ended December 31, 2014, 2013, 2012 and 2011, respectively. Of the $1,222,000 capital oversight fee incurred in 2011, $900,000 is included in asset management fees and income (loss) from discontinued operations in the accompanying consolidated statements of operations and comprehensive loss. The 2014, 2013, 2012 and the remaining 2011 capital oversight fees were capitalized to investments in real estate in the accompanying consolidated balance sheets as they represent fees incurred after the Pillar Sale.
In 2011, in accordance with the Secondment Agreement, Pillar seconded the employees of AH 2007 Management to operate the hotels of the Company as well as the hotels of affiliates of the Company. Prior to the Pillar Sale, AH 2007 Management was a subsidiary of the Company. Pillar reimbursed AH 2007 Management for salaries, bonuses and any other compensation or benefit payable to the seconded employees. The Company reimbursed Pillar for such costs related to employees at the Company’s hotels, which are included in income (loss) from discontinued operations in the accompanying consolidated statements of operations and comprehensive loss. In connection with the Pillar Sale, the net assets of AH 2007 Management were acquired by InterMountain Management. See Note 12 for additional disclosure.
F-20
As a result of the Pillar Sale, RMD is entitled to an earn-out fee for a portion of Pillar’s annual cash flows.
In connection with arranging the financing for the Company upon acquisition in 2007, an affiliate of the Company was paid a fee of $18,000,000. This fee was included in deferred financing costs in the accompanying consolidated balance sheets as of December 31, 2013 and 2012. This fully amortized fee was written-off in connection with the refinancing of the GE Mortgage in April 2014. In 2007, the Company also paid an affiliate of the Company a fee of $10,007,000 for advisory services related to the Merger. This fee is included in the purchase price consideration which was allocated to the assets and liabilities of the Company.
See also Notes 1, 7, 8, 12, 14 and 16 for additional related party transactions.
4. HOTEL MANAGEMENT AGREEMENTS :
As of December 31, 2014, the Company had engaged four additional third party property managers to manage its remaining 17 hotels. The management agreements provide for the payment of base fees (generally based on fixed percentages of the gross revenues of the hotels managed) and incentive fees (generally based on the “gross operating profit” of the hotels managed). For the years ended December 31, 2014, 2013, 2012 and 2011, the Company incurred base management fees of $3,132,000, $7,392,000, $6,968,000 and $6,715,000 and incentive fees of $283,000, $573,000, $726,000 and $1,026,000, respectively, which are included in property tax, ground lease, insurance and property management fees and income (loss) from discontinued operations in the accompanying consolidated statements of operations and comprehensive loss. The management agreements have remaining terms ranging from one to two years, as of December 31, 2014, and certain management agreements have penalties for early termination.
The Company pays its additional third party property managers a fixed monthly accounting fee. The accounting fee was $736,000, $1,974,000, $1,871,000 and $1,877,000 for the years ended December 31, 2014, 2013, 2012 and 2011, respectively, and is included in non-departmental direct hotel expenses and income (loss) from discontinued operations in the accompanying consolidated statements of operations and comprehensive loss.
F-21
5. RESTRICTED CASH :
As of December 31, 2014, 2013 and 2012, restricted cash consists of the following (in thousands):
| December 31, | ||||||||||||
| 2014 | 2013 | 2012 | ||||||||||
| Required repairs reserve |
$ | 40 | $ | 39 | $ | 227 | ||||||
| Debt service reserve |
33 | 21 | 1,357 | |||||||||
| Ground rent reserve |
— | 334 | 199 | |||||||||
| Furniture, fixtures and equipment reserve |
1,948 | 4,359 | 7,174 | |||||||||
| Real estate taxes reserve |
268 | 6,806 | 6,943 | |||||||||
| Interest reserve |
61 | 61 | 61 | |||||||||
| Working capital reserve |
— | 33,859 | 18,217 | |||||||||
| Insurance reserve |
211 | 216 | 210 | |||||||||
| Operating expense reserve |
— | — | 824 | |||||||||
| Other reserves |
248 | 1,154 | 129 | |||||||||
|
|
|
|
|
|
|
|||||||
| $ | 2,809 | $ | 46,849 | $ | 35,341 | |||||||
|
|
|
|
|
|
|
|||||||
The above noted reserves are required and controlled by the lenders of the notes payable described in Note 7 and are restricted for specific use. The Company considers all changes in restricted cash to be investing activities in the consolidated statements of cash flows as the cash is invested in interest bearing accounts.
6. OTHER ASSETS :
As of December 31, 2014, 2013 and 2012, other assets consist of the following (in thousands):
| December 31, | ||||||||||||
| 2014 | 2013 | 2012 | ||||||||||
| Prepaid insurance |
$ | 407 | $ | 1,991 | $ | 1,369 | ||||||
| Prepaid real estate taxes |
85 | 814 | 945 | |||||||||
| Prepaid interest |
— | 872 | 879 | |||||||||
| Utility deposits |
20 | 151 | 143 | |||||||||
| Inventory |
18 | 277 | 298 | |||||||||
| Capital expenditure deposits |
— | 122 | 716 | |||||||||
| Other |
304 | 2,265 | 1,198 | |||||||||
|
|
|
|
|
|
|
|||||||
| $ | 834 | $ | 6,492 | $ | 5,548 | |||||||
|
|
|
|
|
|
|
|||||||
F-22
7. NOTES PAYABLE :
The Company has the following notes payable outstanding as of December 31, 2014, 2013 and 2012 (in thousands):
| December 31, 2014 | December 31, 2013 | December 31, 2012 | ||||||||||||||||||||||||||
| Indebtedness |
Maturity Date |
Interest Rate | Debt Balance |
Book Value of Collateral |
Debt Balance |
Book Value of Collateral |
Debt Balance |
Book Value of Collateral |
||||||||||||||||||||
| LIBOR% (2), (3) + (1) 6.86 |
||||||||||||||||||||||||||||
| GE Mortgage |
Nov. 2014 | $ | — | $ | — | $ | 955,266 | $ | 1,135,795 | $ | 1,014,998 | $ | 1,211,662 | |||||||||||||||
| Mortgages (7 hotels) |
Dec. 2016 | 5.865% | 77,212 | 102,611 | 78,766 | 106,659 | (4) | 80,232 | 111,134 | (4) | ||||||||||||||||||
| Mortgages (6 hotels) |
Oct. 2016 | 5.650% | 24,725 | 42,363 | 25,582 | 46,300 | (4) | 43,280 | 101,911 | (4) | ||||||||||||||||||
| Mortgages (6 hotels) |
Dec. 2015 | 5.440% | 48,984 | 85.412 | 50,772 | 92.590 | (4) | 52,463 | 95,060 | (4) | ||||||||||||||||||
| LIBOR (3) + 2.85% |
||||||||||||||||||||||||||||
| Junior subordinated debt |
Jul. 2035 | 50,000 | — | 50,000 | — | 50,000 | — | |||||||||||||||||||||
| Mortgage A |
Mar. 2015 | 5.770% | 3,726 | 10,444 | 3,866 | 10,753 | (4) | 3,999 | 14,319 | (4) | ||||||||||||||||||
| Mortgage B |
Dec. 2014 | 5.390% | — | — | — | — | (4) | 4,620 | 28,336 | (4) | ||||||||||||||||||
|
|
|
|
|
|
|
|
|
|
|
|
|
|||||||||||||||||
| $ | 204,647 | $ | 240,830 | $ | 1,164,252 | $ | 1,392,097 | $ | 1,249,592 | $ | 1,562,422 | |||||||||||||||||
| Fair value adjustment |
(1,521 | ) | (2,527 | ) | (4,035 | ) | ||||||||||||||||||||||
|
|
|
|
|
|
|
|||||||||||||||||||||||
| $ | 203,126 | $ | 1,161,725 | $ | 1,245,557 | |||||||||||||||||||||||
|
|
|
|
|
|
|
|||||||||||||||||||||||
| (1) | Weighted average spread over LIBOR was 6.86% and 6.29% as of December 31, 2013 and 2012, respectively |
| (2) | LIBOR floor of 1% |
| (3) | The 90-day LIBOR rates were 0.26%, 0.25% and 0.31% as of December 31, 2014, 2013 and 2012, respectively |
| (4) | The equity and excess cash flows after the mortgages have been satisfied were pledged as additional collateral on the GE Mortgage |
In October 2007, the Company entered into a loan agreement (GE Mortgage) pursuant to which the Company issued a $1,800,000,000 note to GSMC. Under its rights within the GE Mortgage, GSMC componentized the loan in February 2008 for purposes of marketing and selling the individual components of the loan. In connection with the componentization, the Company paid a fee of $9,850,000 to GSMC. After the componentization, the GE Mortgage was composed of a mortgage loan (Mortgage Loan) and seven mezzanine loans (Mezzanine Loans).
F-23
In June 2009, the Company entered into a series of recapitalization transactions as follows:
| • | Whitehall funded $175,000,000 of its $350,000,000 payment guaranty which reduced the outstanding balance under the Mortgage Loan. The Company recorded this as a deemed contribution and a corresponding reduction of its outstanding indebtedness. As of September 2009, Whitehall satisfied its conditions to fully extinguish the payment guaranty. |
| • | The First Mezzanine Borrower, a wholly owned subsidiary of the Company, made a proportionate and voluntary prepayment of $15,231,000 to reduce the outstanding balance under the First Mezzanine Loan. |
| • | GSMC cancelled $544,841,000 of indebtedness outstanding under the Second, Third, Fourth, Fifth, Sixth and Seventh Mezzanine Loans, resulting in an increase in shareholders’ equity of $260,254,000 on the forgiveness of debt. The forgiveness of debt was recorded as an increase in shareholders’ equity as the indebtedness was forgiven by GSMC, an affiliate of the Company. |
| • | An affiliate of GSMC was granted the Purchase Option. Pursuant to its terms, the Purchase Option was not effective or exercisable until both the Mortgage Loan and the First Mezzanine Loan were paid in full. Whitehall and GSMC’s affiliate agreed to a tiered sharing agreement with respect to distributions received by GSMC’s affiliate under the Purchase Option. |
Additionally, the Company made a voluntary principal payment of $5,000,000 plus interest in September 2009. This payment was proportionately allocated between the Mortgage Loan and the First Mezzanine Loan. As a result of these transactions, the outstanding balance under the Mortgage Loan and Mezzanine Loans was reduced by $740,072,000 to $1,039,808,000 as of December 31, 2009.
The Purchase Option originally expired in June 2015; in February 2012, the Purchase Option was amended to expire in July 2021, or such other later date if the maturity date of the Company’s debt is further extended. In July 2012, WNT acquired the Purchase Option.
On April 11, 2014, subsidiaries of Senior Mezz refinanced the GE Mortgage with a new $976 million loan originated by German American Capital Corporation (the GACC Mortgage and Mezzanine Loans). In connection with the refinancing, the “cash trap” under the GE Mortgage and the cash flow pledge of the 20 hotels which were not collateral on the GE Mortgage ceased. As a result of WNT’s exercise of the Purchase Option and the deconsolidation of Senior Mezz and its subsidiaries, the GACC Mortgage and Mezzanine Loans are not included in the Company’s consolidated financial statements as of December 31, 2014.
As described below, the Company recognized interest on the GE Mortgage under the effective interest method. In connection with the repayment of the GE Mortgage on April 11, 2014, the Company wrote-off the interest accrued under the effective interest method, but which was not due or payable to the lender. This write-off resulted in a gain of $13,199,329, which is included in gain on extinguishment of debt in the accompanying consolidated statements of operations and comprehensive loss.
During the year ended December 31, 2014, the Company paid approximately $21,049,000 of deferred financing costs, of which approximately $3,904,000 was paid to GSMC in connection with the origination of the GACC Mortgage and Mezzanine Loans. These deferred financing costs were transferred to WNT in connection with its exercise of the Purchase Option.
F-24
In December 2010, the Company entered into a modification of its existing loan agreement under the GE Mortgage (the Modification Agreement). The weighted average interest rate of the GE Mortgage was 90-day LIBOR, with a 1% LIBOR floor plus 6.86%, which was 7.86% as of December 31, 2013. In December 2010, the Company began recognizing interest expense on an effective yield basis through the anticipated maturity in November 2015. The effective yield was approximately 6.96% and 6.98% as of December 31, 2013 and 2012, respectively.
In accordance with the Modification Agreement, substantially all of the cash flows from the hotels were directed to accounts controlled by GE. The Modification Agreement also specified certain limited uses for the cash flow “trapped” by GE. Annually in August, all remaining cash in the working capital reserve account controlled by GE in excess of a specified amount, as defined in the Modification Agreement, were used to pay-down the Mortgage Loan. In August of 2013, 2012 and 2011, the Company made pay-downs on the Mortgage Loan of $24,312,000, $18,873,000 and $10,920,000, respectively. As described below, the net proceeds from the sale of three individually mortgaged hotels were used to pay down $46,290,000 of the GE Mortgage in November 2013.
In accordance with the Modification Agreement, First Mezzanine Loan debt service was deferred and capitalized on an annual basis at the end of each First Mezzanine Loan year until the Company achieves a specified debt yield. Upon satisfaction of the specified debt yield, only the current First Mezzanine Loan debt service due would be payable, with the deferred and capitalized debt service due upon maturity. During the years ended December 31, 2013, 2012 and 2011, $10,870,000, $9,070,000 and $7,772,000, respectively, of the First Mezzanine Loan debt service was capitalized to notes payable in the accompanying consolidated balance sheets.
In December 2013, GSMC purchased two tranches of the GE Mortgage totaling $25,000,000. The interest earned by GSMC on their debt investment was $552,000 and $27,000 for the years ended December 31, 2014 and 2013, respectively. During the years ended December 31, 2012 and 2011, GSMC earned interest of $0 and $2,038,000, respectively, under their debt investments in the Mortgage Loan and the First Mezzanine Loan.
In August 2012, the Company sold one of its hotels collateralized under the GE Mortgage. The net proceeds from the sale of the hotel were used to pay down $2,255,000 of the GE Mortgage. The Company recognized a net gain of $254,000 on this transaction, which is included in income (loss) from discontinued operations in the accompanying consolidated statements of operations and comprehensive loss.
In December 2011, the Company sold one of its hotels collateralized under the GE Mortgage. The proceeds from the sale of the hotel were used to pay down $813,000 of the GE Mortgage. The Company recognized a net loss of $357,000 on this transaction, which is included in income (loss) from discontinued operations in the accompanying consolidated statements of operations and comprehensive loss.
In November 2006, Equity completed an aggregate of $95,000,000 in collateralized financing under eight non-recourse, individual loan agreements. Each loan bears interest at a fixed rate of 5.865% per annum, with principal and interest payments due monthly until maturity on December 1, 2016, based on a 30-year amortization schedule. The Company assumed these loans in connection with the Merger. Under the loan agreements, if the collateralized property does not maintain a certain debt service coverage ratio (DSCR) or the Company does not spend an amount greater than or equal to 4% of that property’s operating revenues on furniture, fixtures and equipment (FF&E) expenditures for the first six years of the loan, then for the trailing five years annually thereafter, the Company will be required to fund an additional monthly amount into a lender controlled FF&E reserve from the point of noncompliance. In September
F-25
2010, the Company failed to make its required monthly debt service payments under one of the individual loan agreements, which was a technical event of default under the loan agreement. Shortly thereafter, the Company was officially noticed of the default by its lender and in September 2011, the lender effectuated a foreclosure sale whereby the collateralized property title transferred to the lender and the Company was relieved of its obligations under the loan agreement. The Company recognized a net gain of $3,679,000 on this transaction, which is included in income (loss) from discontinued operations in the accompanying consolidated statements of operations and comprehensive loss.
In September 2006, Equity completed an aggregate of $50,000,000 in collateralized financing under nine non-recourse, individual loan agreements. Each loan bears interest at a fixed rate of 5.65% per annum, with principal and interest payments due monthly until maturity on October 1, 2016, based on a 25-year amortization schedule. The Company assumed these loans in connection with the Merger. Beginning February 2013, the Company failed to make its required monthly debt service payments under one of the individual loan agreements, which was a technical event of default under the loan agreement. In April 2013, the Company sold the collateralized property under this loan agreement. The proceeds of $4,250,000 from the sale of the hotel were used to pay down the full balance of the loan, as well as accrued and default interest. The Company recognized a net loss of $224,000 on this transaction, which included a net prepayment penalty of $352,000. The net loss is included in income (loss) from discontinued operations in the accompanying consolidated statements of operations and comprehensive loss. In November 2013, the Company sold two of its hotels collateralized under two of the individual loan agreements. A portion of the $42,500,000 in net proceeds was used to purchase defeasance securities to fully relieve the Company’s obligations under the two individual loan agreements. The Company recognized a combined net loss of $1,976,000 related to the defeasance premiums, which is included in income (loss) from discontinued operations in the accompanying consolidated statements of operations and comprehensive loss. The remaining net proceeds of $26,613,000 were used to pay down the GE Mortgage. The Company recognized a combined net loss of $3,271,000 on the sale of these two hotels, which is included in income (loss) from discontinued operations in the accompanying consolidated statements of operations and comprehensive loss.
In November 2005, Equity completed an aggregate of $73,500,000 in collateralized financing under seven non-recourse, individual loan agreements. Each loan bears interest at a fixed rate of 5.44% per annum, with principal and interest payments due monthly until maturity on December 1, 2015, based on a 25-year amortization schedule. The Company assumed these loans in connection with the Merger. Under the loan agreements, if the collateralized property does not maintain a certain DSCR, the Company’s net operating cash flows will be “trapped.” In addition, beginning in January 2011 on an annual basis, if the Company does not spend an amount greater than or equal to 4% of that property’s operating revenues on FF&E expenditures for the preceding five years of the loan, the Company will be required to fund an additional monthly amount into the FF&E reserve from the point of noncompliance. In August 2010, the Company failed to make its required monthly debt service payments under one of the individual loan agreements, which was a technical event of default under the loan agreement. Shortly thereafter, the Company was officially noticed of the default by its lender and in August 2011, the lender effectuated a foreclosure sale whereby the collateralized property title transferred to the lender and the Company was relieved of its obligations under the loan agreement. The Company recognized a net gain of $3,809,000 on this transaction, which is included in income (loss) from discontinued operations in the accompanying consolidated statements of operations and comprehensive loss.
F-26
In November 2013, the Company sold its lone hotel collateralized under Mortgage B. A portion of the $25,000,000 in net proceeds was used to purchase defeasance securities to fully relieve the Company’s obligations under the individual loan agreement. The Company recognized a loss of $319,000 related to the defeasance premium, which is included in income (loss) from discontinued operations in the accompanying consolidated statements of operations and comprehensive loss. The remaining net proceeds of $19,677,000 were used to pay down the GE Mortgage. The Company recognized a net loss of $2,747,000 on the sale of this hotel, which is included in income (loss) from discontinued operations in the accompanying consolidated statements of operations and comprehensive loss.
In connection with the Merger, the assumption of the loans of Equity described above required the carrying value of the notes payable to be adjusted to the estimated fair value of these obligations at October 25, 2007, the date of the Merger. As a result, the Company recorded a fair value adjustment reducing the value of these loans by $10,196,000. This fair value adjustment is being accreted over the terms of the respective loans as an increase to interest expense based on the effective interest method. The Mortgage Loan and First Mezzanine Loan were recorded at cost.
In June 2005, Equity issued $50,000,000 in junior subordinated debt in a private placement that will mature in July 2035. The junior subordinated debt bore interest at 6.93% per annum for five years and beginning in July 2010, bears interest at 90-day LIBOR plus 2.85% per annum through maturity. Interest on the junior subordinated debt is due quarterly. The junior subordinated debt may be prepaid after July 2010 without penalty. The Company assumed the junior subordinated debt in connection with the Merger, which is recorded at cost.
Substantially all of the debt is collateralized by first mortgages on the hotels. The Company does not have any notes payable that contain cross-default provisions. The terms of the debt, except the GE Mortgage and the junior subordinated debt, generally require prepayment penalties if repaid prior to maturity or contain a defeasance clause whereby the cash flow from purchased defeasance investments would substitute as collateral for the mortgage.
F-27
As of December 31, 2013, scheduled principal maturities associated with the notes payable are as follows (in thousands):
| Year Ending December 31, |
Amount | |||
| 2014 |
$ | 959,605 | ||
| 2015 |
55,266 | |||
| 2016 |
99,381 | |||
| 2017 |
— | |||
| 2018 |
— | |||
| Thereafter |
50,000 | |||
|
|
|
|||
| $ | 1,164,252 | |||
|
|
|
|||
As of December 31, 2014, scheduled principal maturities associated with the notes payable are as follows (in thousands):
| Year Ending December 31, |
Amount | |||
| 2015 |
$ | 55,266 | ||
| 2016 |
99,381 | |||
| 2017 |
— | |||
| 2018 |
— | |||
| 2019 |
— | |||
| Thereafter |
50,000 | |||
|
|
|
|||
| $ | 204,647 | |||
|
|
|
|||
8. PREFERRED STOCK :
In connection with the Merger, Grace Acquisition I issued 3,450,000 shares of 8.75% Series B cumulative preferred stock and 2,400,000 shares of 9.00% Series C cumulative preferred stock. The preferred shares were issued to holders of Equity’s preferred stock and had terms essentially identical to the Equity preferred stock. The Series B preferred stock may be redeemed at $25.00 per share plus accrued but unpaid dividends at the election of Grace Acquisition I.
F-28
The Series C preferred stock may be redeemed at $25.00 per share plus accrued but unpaid dividends at the election of Grace Acquisition I, on or after February 15, 2011. The Series B preferred stock and Series C preferred stock have no stated maturity, sinking fund or mandatory redemption and are not convertible into any other securities of Grace Acquisition I.
In February 2008, Grace Acquisition I also issued 125 shares of 8% Series D cumulative preferred stock at $250 per share to GS.
In May 2008, Grace Acquisition I ceased dividend payments to its preferred shareholders due to the “cash trap” under the GE Mortgage. The GACC Mortgage and Mezzanine Loans do not currently restrict the use of the Senior Mezz subsidiaries’ cash to the same extent that the GE Mortgage did and the pledge of the cash flow from the Company’s 20 hotels was terminated. As of December 31, 2014 and 2013, Grace Acquisition I had $86,330,000 and $73,380,000, respectively, in accumulated, undeclared preferred stock dividends. Since at least six quarters of dividends on the Series B preferred stock and Series C preferred stock are outstanding, the preferred shareholders are entitled to elect two members to the board of directors of Grace Acquisition I. Grace Acquisition I has attempted to hold three meetings to elect the new board members; however, at each meeting a quorum was not achieved and, therefore, an election did not occur.
In August 2012, PFD Holdings, LLC (PFD Holdings), an affiliate of Whitehall, purchased 2,018,250 shares of Series B preferred stock and Series C preferred stock. In August 2013, PFD Holdings purchased an additional 1,422,485 shares of Series B preferred stock and Series C preferred stock. In December 2014, PFD Holdings purchased 10,000 shares of Series B preferred stock and Series C preferred stock. As a result of these purchases, PFD Holdings owns 59.0% of the outstanding Series B preferred stock and Series C preferred stock.
Grace Acquisition I’s charter provides for the issuance of up to 10,000,000 shares of preferred stock in one or more series and its board will establish the number of shares in each series and fix the designation, powers, preferences, and rights of each such series and the qualifications, limitations or restriction thereof.
9. OPERATING LEASES :
As of December 31, 2013, nine hotels were subject to ground lease agreements which required monthly payments with increases in rent throughout the term of the leases and have remaining terms ranging from 6 to 49 years (excluding available lessee extension options). The controlling interest in the Senior Mezz hotels (including the nine subject to ground lease agreements) was acquired by WNT as a result of the exercise of the Purchase Option in April 2014. Ground lease expense was recognized on a straight-line basis over the lives of the respective ground leases. The ground lease expense was $447,000, $1,590,000, $1,610,000 and $1,952,000 (including $73,000, $262,000, $284,000 and $305,000 of amortization of the below market ground leases) for the years ended December 31, 2014, 2013, 2012
F-29
and 2011, respectively, and is included in property tax, ground lease, insurance and property management fees and income (loss) from discontinued operations in the accompanying consolidated statements of operations and comprehensive loss. As of December 31, 2013, the estimated amortization expense of the below market ground leases was $262,000 for each of the five succeeding years. Approximate future ground lease payments under non-cancelable ground leases (assuming extension options will not be exercised) as of December 31, 2013, were as follows (in thousands):
| Year Ending December, 31 |
Amount | |||
| 2014 |
$ | 843 | ||
| 2015 |
872 | |||
| 2016 |
876 | |||
| 2017 |
903 | |||
| 2018 |
917 | |||
| Thereafter |
7,899 | |||
|
|
|
|||
| $ | 12,310 | |||
|
|
|
|||
10. FAIR VALUE OF FINANCIAL INSTRUMENTS :
As cash and cash equivalents and restricted cash have maturities of less than three months, the carrying values of cash and cash equivalents and restricted cash approximate fair value (Level 1 of the fair value hierarchy). The carrying values of accounts receivable, accounts payable and accrued liabilities and accrued interest payable approximate fair value due to the short maturity of these instruments (Level 2 of the fair value hierarchy).
The fair value of the Company’s notes payable is approximately $184 million, $1.2 billion and $1.3 billion as of December 31, 2014, 2013 and 2012, respectively. The fair value of the Company’s notes payable has been estimated based on a discounted cash flow analysis using a discount rate representing the Company’s estimate of the rate that would be used by market participants (Level 2 of the fair value hierarchy). Changes in assumptions or estimation methodologies may have a material effect on these estimated fair values.
F-30
The fair value of the interest rate derivative instruments change during the life of the instruments as a function of maturity, interest rates and the credit standing of the instrument seller. The fair value of the Company’s interest rate derivative instruments and the effects of these derivative instruments on the consolidated statements of operations and comprehensive loss are as follows (in thousands):
| Notional Amount |
Cap Rate |
Fair Value at December 31, |
Loss Recognized in Net Loss for the Year Ended December 31, |
|||||||||||||||||||||||||||||||||
| Instrument |
Maturity | 2013 | 2012 | 2014 | 2013 | 2012 | 2011 | |||||||||||||||||||||||||||||
| Interest rate cap |
946,557 | 4.50 | % | 11/03/12 | $ | — | $ | — | $ | — | $ | — | $ | — | $ | 401 | ||||||||||||||||||||
| Interest rate cap |
1,005,928 | 4.50 | % | 11/03/13 | — | — | — | — | 35 | — | ||||||||||||||||||||||||||
| Interest rate cap |
990,686 | 4.50 | % | 11/03/14 | — | — | — | 57 | — | — | ||||||||||||||||||||||||||
|
|
|
|
|
|
|
|
|
|
|
|
|
|||||||||||||||||||||||||
| $ | — | $ | — | $ | — | $ | 57 | $ | 35 | $ | 401 | |||||||||||||||||||||||||
|
|
|
|
|
|
|
|
|
|
|
|
|
|||||||||||||||||||||||||
The Company’s interest rate cap matured on November 3, 2014.
11. INCOME TAXES :
The following table reconciles the Taxable Entities’ income tax benefit at statutory rates to the actual income tax benefit recorded (in thousands):
| Year Ended December 31, | ||||||||||||||||
| 2014 | 2013 | 2012 | 2011 | |||||||||||||
| Income tax benefit at federal statutory rate |
$ | (7,164 | ) | $ | 444 | $ | 172 | $ | 751 | |||||||
| State income tax benefit, net of federal income tax benefit |
(4,125 | ) | 49 | 19 | 84 | |||||||||||
| Nondeductible book accrual |
9,531 | — | — | — | ||||||||||||
| Section 731a capital gain |
9,077 | — | — | — | ||||||||||||
| Other |
813 | 251 | 527 | (75 | ) | |||||||||||
| Increase in valuation allowance |
(8,132 | ) | (744 | ) | (718 | ) | (760 | ) | ||||||||
|
|
|
|
|
|
|
|
|
|||||||||
| Total income tax benefit |
$ | — | $ | — | $ | — | $ | — | ||||||||
|
|
|
|
|
|
|
|
|
|||||||||
F-31
At December 31, 2014, 2013 and 2012, the Taxable Entities’ deferred tax assets, deferred tax liabilities and related valuation allowances consist of the following (in thousands):
| December 31, | ||||||||||||
| 2014 | 2013 | 2012 | ||||||||||
| Federal and state net operating losses |
$ | 31,422 | $ | 43,210 | $ | 42,717 | ||||||
| Tax property basis greater than book basis |
3,394 | 3,336 | 3,092 | |||||||||
| Nondeductible book accrual |
9,531 | — | — | |||||||||
| Section 731a capital gain |
9,077 | — | — | |||||||||
| Other deferred tax assets |
647 | 201 | 201 | |||||||||
|
|
|
|
|
|
|
|||||||
| Total gross deferred tax assets |
54,071 | 46,747 | 46,010 | |||||||||
|
|
|
|
|
|
|
|||||||
| Forgiveness of debt treatment |
(1,324 | ) | (2,119 | ) | (2,119 | ) | ||||||
| Depreciation |
(767 | ) | (780 | ) | (786 | ) | ||||||
| Other deferred tax liabilities |
(39 | ) | (39 | ) | (39 | ) | ||||||
|
|
|
|
|
|
|
|||||||
| Total gross deferred tax liabilities |
(2,130 | ) | (2,938 | ) | (2,944 | ) | ||||||
|
|
|
|
|
|
|
|||||||
| Net deferred tax asset |
51,941 | 43,809 | 43,066 | |||||||||
| Valuation allowance |
(51,941 | ) | (43,809 | ) | (43,066 | ) | ||||||
|
|
|
|
|
|
|
|||||||
| $ | — | $ | — | $ | — | |||||||
|
|
|
|
|
|
|
|||||||
As of December 31, 2014, 2013 and 2012, the Company has recorded a valuation allowance equal to 100% of the net deferred tax asset due to the uncertainty of realizing the benefit of these assets. Accordingly, no provision or benefit for income taxes is reflected in the accompanying consolidated statements of operations and comprehensive loss. As of December 31, 2014, the Taxable Entities had net operating loss carryforwards for federal income tax purposes of $89,242,000, which begin to expire in 2021, and are available to offset future taxable income, if any, through 2034.
For the year ended December 31, 2014, Grace Acquisition I incurred federal alternative minimum tax expense of $480,000. The Company conducts business in certain states which have taxes with characteristics of an income tax. The Company incurred $473,000, $289,000, $286,000 and $389,000 for such tax for the years ended December 31, 2014, 2013, 2012 and 2011, respectively. Both of these items are included in corporate overhead in the accompanying consolidated statements of operations and comprehensive loss.
12. DISCONTINUED OPERATIONS :
In connection with the Pillar Sale, the net assets of AH 2007 Management were acquired by InterMountain Management. In addition, during 2011, the lender of two of the Company’s hotels effectuated a foreclosure sale whereby the collateralized property title transferred to lender and the Company was relieved of its obligations under the loan agreement and the Company sold a hotel through the normal course of business. Additionally, during 2013 and 2012, the Company sold four and one hotels, respectively, through the normal course of business. The operating results of AH 2007 Management, the two hotels sold via foreclosure sale and the six hotels sold through the normal course of business have been reported as discontinued operations in the consolidated statements of operations and comprehensive loss. As the Company has a 3% interest in Senior Mezz and therefore has continuing involvement as of December 31, 2014, the deconsolidation of Senior Mezz on April 11, 2014 is not reported as discontinued operations for the year ended December 31, 2014.
F-32
The following table summarizes the operating results of the discontinued operations (in thousands):
| Year Ended December 31, | ||||||||||||||||
| 2014 | 2013 | 2012 | 2011 | |||||||||||||
| Hotel revenues |
$ | — | $ | 16,105 | $ | 17,805 | $ | 32,045 | (1) | |||||||
| Direct hotel expenses |
— | (9,082 | ) | (11,142 | ) | (14,148 | ) | |||||||||
| Property taxes, ground lease, insurance and property management fees |
— | (1,462 | ) | (1,468 | ) | (2,352 | ) | |||||||||
| Corporate overhead |
— | (125 | ) | (143 | ) | (10,614 | )(1) | |||||||||
| Asset management fees |
— | (213 | ) | (303 | ) | (402 | ) | |||||||||
| Depreciation and amortization |
— | (3,212 | ) | (4,520 | ) | (3,994 | ) | |||||||||
| Impairment charge |
— | — | (1,031 | ) | — | |||||||||||
| Net gain (loss) on extinguishment of debt |
— | (2,647 | )(3) | — | 7,488 | |||||||||||
| Net gain (loss) on sale of investments in real estate |
— | (5,890 | ) | 254 | (357 | ) | ||||||||||
| Interest expense (2) |
— | (1,578 | ) | (1,508 | ) | (2,949 | ) | |||||||||
| Other income |
— | 23 | 180 | 3 | ||||||||||||
|
|
|
|
|
|
|
|
|
|||||||||
| Income (loss) from discontinued operations |
$ | — | $ | (8,081 | ) | $ | (1,876 | ) | $ | 4,720 | ||||||
| (Income) loss from discontinued operations attributable to non-controlling interest |
— | 8,000 | 1,857 | (4,673 | ) | |||||||||||
|
|
|
|
|
|
|
|
|
|||||||||
| Income (loss) from discontinued operations available to common shareholders |
$ | — | $ | (81 | ) | $ | (19 | ) | $ | 47 | ||||||
|
|
|
|
|
|
|
|
|
|||||||||
| (1) | Hotel revenues and corporate overhead include $10,301 of payroll related reimbursements and related costs for the year ended December 31, 2011 received from an affiliate of the Company. |
| (2) | The GE Mortgage required principal payments in conjunction with the sale of a hotel based on an allocated loan amount (ALA) per hotel and the effective yield. The Company allocates interest expense to discontinued operations based on the ALA of each sold hotel. See Note 7 for principal payments made with respect to the hotels included in discontinued operations. |
| (3) | Represents the defeasance premiums incurred to relieve the Company of its obligations under three of its individual loan agreements. |
As of December 31, 2012, the four hotels sold in 2013 had investments in real estate of $78,481,000, including net deferred franchise fees of $185,000, and an aggregated loan balance of $21,508,000.
F-33
13. PROPERTY TAX, GROUND LEASE, INSURANCE AND PROPERTY MANAGEMENT FEES:
For the years ended December 31, 2014, 2013, 2012 and 2011, property tax, ground lease, insurance and property management fees from continuing operations consists of the following (in thousands):
| Year Ended December 31, | ||||||||||||||||
| 2014 | 2013 | 2012 | 2011 | |||||||||||||
| Property tax |
$ | 7,120 | $ | 17,380 | $ | 17,201 | $ | 15,880 | ||||||||
| Ground lease |
447 | 1,590 | 1,581 | 1,530 | ||||||||||||
| Insurance |
1,772 | 4,261 | 4,045 | 3,934 | ||||||||||||
| Property management fees |
3,725 | 8,425 | 8,193 | 8,096 | ||||||||||||
|
|
|
|
|
|
|
|
|
|||||||||
| $ | 13,064 | $ | 31,656 | $ | 31,020 | $ | 29,440 | |||||||||
|
|
|
|
|
|
|
|
|
|||||||||
14. COMMITMENTS AND CONTINGENCIES :
The Company is involved in various legal proceedings and disputes arising in the ordinary course of business. The Company does not believe that the disposition of such legal proceedings and disputes will have a material adverse effect on the financial position, continuing operations or cash flows of the Company, other than as disclosed herein.
In September 2013, a putative class action lawsuit (the Johnson Lawsuit) was filed in the Chancery Court of Shelby County, Tennessee (the Chancery Court) by several current and former shareholders of the Series B and C preferred shares of Grace Acquisition I. The complaint, which alleges, among other things, breach of contract and breach of fiduciary duty that resulted in the loss of Series B and Series C preferred share value, names Grace Acquisition I, members of Grace Acquisition I’s board of directors, PFD Holdings, LLC, GS Group, Whitehall, Goldman Sachs Realty Management, L.P. and Grace I as defendants. Shortly after the filing of the Johnson Lawsuit, the defendants removed the case to the United States District Court for the Western District of Tennessee (the Federal Court). In November 2013, the plaintiffs filed a motion to remand the case back to the Circuit Court, which the defendants opposed. On July 28, 2014, the Federal Court denied the plaintiffs’ motion to remand. In addition, in January 2014, the defendants also filed a motion to dismiss the Johnson Lawsuit and the motion was fully briefed on April 24, 2104. In October 2013, a similar lawsuit was filed by another plaintiff in the same Chancery Court (the Dent Lawsuit), alleging similar breaches against several of the same defendants named in the Johnson lawsuit, in addition to a former member of the Company’s board of directors. In January 2014, the plaintiffs and defendants in the Dent Lawsuit agreed to stay that case in favor of proceedings in the aforementioned Johnson Lawsuit. In August 2014, the Company and the other
F-34
defendants entered into a non-binding memorandum of understanding with respect to a settlement of the claims raised in the Johnson Lawsuit. On August 22, 2014, the parties notified the Federal Court of the proposed settlement, and the Federal Court agreed that the parties would no longer be subject to pending deadlines in the current scheduling order. On September 2, 2014, in light of the proposed settlement, defendants filed a motion to withdraw their motion to dismiss without prejudice to renew that motion later. The Federal Court granted the motion. The parties submitted the proposed settlement stipulation and related papers to the Federal Court for approval on October 9, 2014, and filed additional papers in support of settlement on December 3, 2014 and March 20, 2015. The stipulation was preliminarily approved by the Federal Court on April 30, 2015 and remains subject to final approval by the Federal Court. The stipulation of settlement generally provides for the following: (1) the effectuation of a merger that will result in exchange of $26.00 in cash for each share of Series B and C preferred stock outstanding; (2) the establishment of a $6 million fund to be distributed pursuant to a plan of allocation to sellers of the Series B and C preferred stock; and (3) an award of $4 million in counsel fees, subject to approval by the Federal Court. Therefore, during the year ended December 31, 2014, the Company accrued $24.25 million related to the agreement which is included in accounts payable and accrued liabilities in the accompanying consolidated balance sheets and in contingent loss on litigation settlement in the consolidated statements of operations and comprehensive loss. The Company anticipates funding the settlement with cash on hand or, if necessary, funding from Whitehall. The Company expects that the settlement of the Johnson Lawsuit, if approved, will result in the release of those claims asserted in the Dent Lawsuit. Ongoing defense costs will be expensed as incurred.
As of December 31, 2014, all of the wholly owned hotels and hotels owned through the Company’s 3% interest in Senior Mezz are operated under franchise agreements and are licensed as Hampton Inn (43 hotels), Residence Inn (25), Courtyard (17), Hyatt Place (15), Homewood Suites (10), SpringHill Suites (7), Hilton Garden Inn (3), Fairfield Inn & Suites (2), Holiday Inn (1), Embassy Suites (1), Holiday Inn Express (1) and TownePlace Suites (1).
The franchise agreements generally require the payment of fees based on a percentage of hotel room revenue. Under the franchise agreements, the Company is periodically required to make capital improvements to the hotels in order for them to meet the franchisors’ brand standards. Additionally, under certain loan covenants, the Company is obligated to fund 4% to 5% of total hotel revenues to a separate room renovation account for the ongoing replacement or refurbishment of furniture, fixtures and equipment at the hotels.
As of December 31, 2014, Whitehall had guaranteed up to $6,495,000 of the Company’s obligations under the franchise agreements with certain franchisors.
The Company maintains property insurance coverage for catastrophic losses such as hurricanes, earthquakes or floods. For such catastrophic losses, the Company may have higher deductibles or increased self-insurance risk if certain criteria are met, ultimately increasing the potential risk of loss.
In September 2007, a putative class action lawsuit was filed in the Circuit Court of Shelby County, Tennessee (the Circuit Court) on behalf of the former Series B and Series C preferred shareholders of Equity Inns alleging breaches of fiduciary duty against Equity Inns’ former directors. This complaint does not name Equity Inns or any corporate entity as a defendant. In February 2008, the Circuit Court denied the defendants’ motion to dismiss the complaint. In April 2010, the Circuit Court granted the plaintiffs’ motion for class certification, which was ultimately appealed and vacated by the Tennessee Court of Appeals and remanded back to the Circuit Court. During the second quarter of 2012, the plaintiffs filed a second amended complaint and a new motion for class certification. In April 2013, the Circuit Court granted the new motion and certified a class and three subclasses. The defendants appealed the Circuit Court’s ruling, and in May 2014 the Tennessee Court of Appeals vacated the Circuit Court’s order certifying a class and remanded the case to the Circuit Court for further proceedings consistent with its opinion. The Company does not believe that the disposition of such legal proceedings and disputes will have a material adverse effect on the financial position, continuing operations or cash flows of the Company.
F-35
15. SUMMARIZED FINANCIAL INFORMATION ON SENIOR MEZZ :
The following tables summarize the condensed consolidated balance sheet as of December 31, 2014 and the condensed consolidated statement of operations for the period from April 10, 2014 to December 31, 2014 of Senior Mezz (in thousands):
| December 31, 2014 |
||||
| Investments in real estate, net |
$ | 1,040,039 | ||
| Other assets |
134,395 | |||
|
|
|
|||
| Total assets |
$ | 1,174,434 | ||
|
|
|
|||
| Notes payable |
$ | 976,000 | ||
| Other liabilities |
34,458 | |||
|
|
|
|||
| Total liabilities |
1,010,458 | |||
| Members’ equity |
159,056 | |||
| Non-controlling interest |
4,920 | |||
|
|
|
|||
| Total liabilities and equity |
$ | 1,174,434 | ||
|
|
|
|||
| Period ended December 31, 2014 |
||||
| Total hotel revenues |
$ | 278,733 | ||
| Total operating expenses |
294,074 | |||
|
|
|
|||
| Operating loss |
(15,341 | ) | ||
| Interest expense |
(31,990 | ) | ||
| Other, net |
(227 | ) | ||
|
|
|
|||
| Net loss |
(47,558 | ) | ||
| Net loss attributable to non-controlling interests |
1,429 | |||
|
|
|
|||
| Net loss attributable to the controlling interests |
$ | (46,129 | ) | |
|
|
|
|||
16. SUBSEQUENT EVENTS :
In January 2015, the action commenced in September 2007 against Equity Inns’ former directors was voluntarily dismissed.
On February 27, 2015, 116 hotel assets, of which 20 were owned by the Company, were sold to affiliates of ARC Hospitality for a combined purchase price of $1.808 billion, of which $347 million related to the Company.
F-36
In the sale, the Company received approximately $22.2 million in cash subject to a post-closing adjustment to reflect actual proration of certain operating items. The Company’s subsidiaries were issued preferred equity interests with an initial capital balance of approximately $99.8 million in a newly-formed Delaware limited liability company, ARC Hospitality Portfolio II Holdco, LLC, which is the indirect owner of the 20 hotels sold by the Company.
Also in the sale, Senior Mezz received approximately $106.0 million in cash subject to a post-closing adjustment to reflect actual proration of certain operating items. Senior Mezz was issued preferred equity interests with an initial capital balance of approximately $347.3 million in a newly-formed Delaware limited liability company, ARC Hospitality Portfolio I Holdco, LLC, which is the indirect owner of the 96 hotels sold by Senior Mezz.
The buyers assumed approximately $903.9 million of existing mezzanine and mortgage indebtedness of Senior Mezz which indebtedness is secured by the 96 hotels sold by Senior Mezz. Selling costs totaled approximately $46.8 million, of which $18.3 million related to the Company, and the carrying value of the Company’s hotels at the time of the sale was approximately $240.2 million.
W2007 Equity LP, WNT and Whitehall, an affiliate of GS Group, GS and GSMC, engaged GS and Deutsche Bank Securities Inc. (DB) to provide advisory services in connection with a potential sale or other transaction relating to the 126 hotels. As a result of that engagement, upon consummation of the sale of the Portfolio, GS and DB were paid, in the aggregate, an advisory fee of 1.10% of the aggregate consideration paid to the Sellers. GS and DB split the advisory fee 60% and 40%, respectively, resulting in a payment of $12.0 million to GS of which $2.3 million was paid by the Company and is included in selling costs described above.
On March 25, 2015, subsidiaries of Senior Mezz entered into an agreement to sell its remaining 10 hotels for $100 million. The agreement was terminated by the purchasers on May 6, 2015 in accordance with their rights under the agreement (ARC Hospitality had previously elected to exclude the same hotels from its transaction). On June 8, 2015, subsidiaries of Senior Mezz entered into a reinstatement and amendment to the terminated contract, which among other things, reinstated the contract for nine of the remaining hotels, amended the purchase price to $85 million and scheduled closing for July 23, 2015. There can be no assurance as to whether or when the transaction will close, as to the actual proceeds that will be realized if it does close or as to what the assets might ultimately sell for in an alternate transaction if the pending transaction does not close. Even if the transaction does close, there can be no assurance as to when a distribution from such sale proceeds will be received by the Company. While the subsidiaries of Senior Mezz intend to sell the one remaining hotel not currently under contract to be sold, there can be no assurance as to whether or when that hotel will be sold, the form of consideration which may be received in respect of that hotel or whether the consideration which may be received in respect of that hotel will be greater or less than the purchase price allocated to that hotel in the terminated sale agreement. Even if a transaction for the one remaining hotel not currently under contract to be sold does occur, there can be no assurance as to when a distribution from such sale proceeds will be received by the Company.
In connection with the settlement of the Johnson Lawsuit, on May 10, 2015, Grace Acquisition I entered into an agreement and plan of merger (the Merger Agreement) with W2007 Grace II, LLC (Parent), W2007 Grace Acquisition II, Inc. (Merger Sub), and, solely for the purposes of certain payment obligations thereunder, PFD Holdings and Whitehall, pursuant to which Grace Acquisition I will be merged with and into Merger Sub, with Merger Sub surviving as a wholly owned subsidiary of Parent (the Settlement Merger). Completion of the Settlement Merger is subject to numerous conditions including, but not limited to: (i) the approval of the Merger Agreement by the affirmative vote of a majority of all the votes entitled to be cast by the holders of Grace Acquisition I’s outstanding capital stock; (ii) the approval of the amendment to Grace Acquisition I’s amended and restated charter contemplated in the Merger Agreement; (iii) holders of no more than 7.5% of the outstanding shares of the preferred stock delivering (and not withdrawing) written notice of their intent to demand payment, if the Settlement Merger is effectuated, pursuant to Section 48-23-202 of the Tennessee Business Corporation Act; and (iv) the final approval and entry of a final and non-appealable order and judgment of a Stipulation and Agreement of Settlement dated October 8, 2014, as supplemented December 4, 2014, by the Federal Court in the Johnson Lawsuit (the Final Approval Condition). The Settlement Merger may not be completed prior to the satisfaction or, other than with respect to the Final Approval Condition which may not be waived by the Company, waiver of the conditions to closing.
F-37
17. QUARTERLY FINANCIAL DATA (unaudited) :
| 2014 Quarter Ended | ||||||||||||||||
| 31-Mar | 30-Jun | 30-Sep | 31-Dec | |||||||||||||
| (in thousands) | ||||||||||||||||
| Total revenue |
$ | 107,429 | $ | 33,233 | $ | 20,763 | $ | 18,202 | ||||||||
| Total operating expenses |
95,779 | 34,906 | 18,078 | 19,132 | ||||||||||||
| Operating income (loss) |
11,650 | (1,673 | ) | 2,685 | (930 | ) | ||||||||||
| Net loss attributable to the Company |
(219 | ) | (24,402 | ) | (774 | ) | (1,885 | ) | ||||||||
| 2013 Quarter Ended | ||||||||||||||||
| 31-Mar | 30-Jun | 30-Sep | 31-Dec | |||||||||||||
| (in thousands) | ||||||||||||||||
| Total revenue |
$ | 100,247 | $ | 114,854 | $ | 112,944 | $ | 100,506 | ||||||||
| Total operating expenses |
92,222 | 98,213 | 102,167 | 116,866 | ||||||||||||
| Operating income (loss) |
8,025 | 16,641 | 10,777 | (16,360 | ) | |||||||||||
| Net loss attributable to the Company |
(461 | ) | (129 | ) | (320 | ) | (892 | ) | ||||||||
| 2012 Quarter Ended | ||||||||||||||||
| 31-Mar | 30-Jun | 30-Sep | 31-Dec | |||||||||||||
| (in thousands) | ||||||||||||||||
| Total revenue |
$ | 98,560 | $ | 109,412 | $ | 106,662 | $ | 95,213 | ||||||||
| Total operating expenses |
89,332 | 94,407 | 118,566 | 157,555 | ||||||||||||
| Operating income (loss) |
9,228 | 15,005 | (11,904 | ) | (62,342 | ) | ||||||||||
| Net loss attributable to the Company |
(579 | ) | (121 | ) | (632 | ) | (503 | ) | ||||||||
F-38
SCHEDULE III
W2007 Grace Acquisition I, Inc.
SCHEDULE III - REAL ESTATE AND ACCUMULATED DEPRECIATION
December 31, 2014
(dollars in thousands)
| Initial cost | Costs capitalized subsequent to acquisition (1) |
Gross carrying amount at close of period |
||||||||||||||||||||||||||||||||||||||||||||
| Hotel property |
Location | Encum- brances |
Land and improve- ments |
FF&E and buildings and improve- ments |
Land and improve- ments |
FF&E and buildings and improve- ments |
Land and improve- ments |
FF&E and buildings and improve- ments |
Total | Accumu- lated depreci- ation |
Acquisit- ion date |
Life upon which depreciation is computed |
||||||||||||||||||||||||||||||||||
| Courtyard |
Carlsbad, CA | 13,687 | 4,581 | 29,150 | (987 | ) | (10,009 | ) | 3,594 | 19,141 | 22,735 | (2,761 | ) | 10/2007 | 3 - 39 years | |||||||||||||||||||||||||||||||
| Courtyard |
Dalton, GA | 4,341 | 1,566 | 8,969 | 461 | 1,220 | 2,027 | 10,189 | 12,216 | (2,551 | ) | 10/2007 | 3 - 39 years | |||||||||||||||||||||||||||||||||
| Courtyard |
Houston, TX | 16,787 | 4,534 | 22,921 | (906 | ) | (7,677 | ) | 3,628 | 15,244 | 18,872 | (4,594 | ) | 10/2007 | 3 - 39 years | |||||||||||||||||||||||||||||||
| Hampton Inn |
Alcoa, TN | 2,595 | 1,676 | 6,415 | (1,157 | ) | (1,791 | ) | 519 | 4,624 | 5,143 | (2,198 | ) | 10/2007 | 3 - 39 years | |||||||||||||||||||||||||||||||
| Hampton Inn |
Austin, TX | 2,899 | 2,173 | 8,532 | 421 | 2,788 | 2,594 | 11,320 | 13,914 | (4,199 | ) | 10/2007 | 3 - 39 years | |||||||||||||||||||||||||||||||||
| Hampton Inn |
College Station, TX | 3,559 | 2,026 | 7,330 | 369 | 3,075 | 2,395 | 10,405 | 12,800 | (3,954 | ) | 10/2007 | 3 - 39 years | |||||||||||||||||||||||||||||||||
| Hampton Inn |
East Lansing, MI | 4,815 | 1,649 | 7,396 | 367 | 2,033 | 2,016 | 9,429 | 11,445 | (3,360 | ) | 10/2007 | 3 - 39 years | |||||||||||||||||||||||||||||||||
| Hampton Inn |
Indianapolis, IN | 5,293 | 2,144 | 11,759 | (1,471 | ) | (4,973 | ) | 673 | 6,786 | 7,459 | (2,560 | ) | 10/2007 | 3 - 39 years | |||||||||||||||||||||||||||||||
| Hampton Inn |
Milford, CT | 4,546 | 2,665 | 6,199 | (670 | ) | (623 | ) | 1,995 | 5,576 | 7,571 | (1,636 | ) | 10/2007 | 3 - 39 years | |||||||||||||||||||||||||||||||
| Hampton Inn |
Naperville, IL | 5,833 | 2,494 | 14,727 | (681 | ) | (4,154 | ) | 1,813 | 10,573 | 12,386 | (2,362 | ) | 10/2007 | 3 - 39 years | |||||||||||||||||||||||||||||||
| Hampton Inn |
Orlando, FL | 9,931 | 3,198 | 17,555 | (282 | ) | (5,400 | ) | 2,916 | 12,155 | 15,071 | (3,114 | ) | 10/2007 | 3 - 39 years | |||||||||||||||||||||||||||||||
| Hampton Inn |
Urbana, IL | 9,542 | 2,386 | 15,031 | 779 | 3,104 | 3,165 | 18,135 | 21,300 | (4,807 | ) | 10/2007 | 3 - 39 years | |||||||||||||||||||||||||||||||||
| Hilton Garden Inn |
Louisville, KY | 5,656 | 2,007 | 11,327 | 557 | 2,346 | 2,564 | 13,673 | 16,237 | (4,169 | ) | 10/2007 | 3 - 39 years | |||||||||||||||||||||||||||||||||
| Hilton Garden Inn |
Rio Rancho, NM | 3,726 | 2,234 | 13,278 | (195 | ) | (1,938 | ) | 2,039 | 11,340 | 13,379 | (2,936 | ) | 10/2007 | 3 - 39 years | |||||||||||||||||||||||||||||||
| Homewood Suites |
Augusta, GA | 5,831 | 1,623 | 8,916 | 448 | 1,983 | 2,071 | 10,899 | 12,970 | (3,250 | ) | 10/2007 | 3 - 39 years | |||||||||||||||||||||||||||||||||
| Homewood Suites |
Orlando, FL | 15,878 | 5,938 | 33,829 | (739 | ) | (4,624 | ) | 5,199 | 29,205 | 34,404 | (4,037 | ) | 10/2007 | 3 - 39 years | |||||||||||||||||||||||||||||||
| Homewood Suites |
Seattle, WA | 24,739 | 5,330 | 37,204 | 1,906 | 2,226 | 7,236 | 39,430 | 46,666 | (10,286 | ) | 10/2007 | 3 - 39 years | |||||||||||||||||||||||||||||||||
| Residence Inn |
Jacksonville, FL | 4,644 | 1,872 | 10,023 | (336 | ) | (3,641 | ) | 1,536 | 6,382 | 7,918 | (1,798 | ) | 10/2007 | 3 - 39 years | |||||||||||||||||||||||||||||||
| SpringHill Suites |
Asheville, NC | 4,779 | 1,887 | 10,800 | (156 | ) | (2,919 | ) | 1,731 | 7,881 | 9,612 | (2,393 | ) | 10/2007 | 3 - 39 years | |||||||||||||||||||||||||||||||
| TownePlace Suites |
Savannah, GA | 5,566 | 1,400 | 9,039 | (211 | ) | (2,597 | ) | 1,189 | 6,442 | 7,631 | (1,934 | ) | 10/2007 | 3 - 39 years | |||||||||||||||||||||||||||||||
|
|
|
|
|
|
|
|
|
|
|
|
|
|
|
|
|
|
|
|||||||||||||||||||||||||||||
| 154,647 | 53,383 | 290,400 | (2,483 | ) | (31,571 | ) | 50,900 | 258,829 | 309,729 | (68,899 | ) | |||||||||||||||||||||||||||||||||||
|
|
|
|
|
|
|
|
|
|
|
|
|
|
|
|
|
|
|
|||||||||||||||||||||||||||||
| (1) | Costs capitalized subsequent to acquisition include reductions of asset value due to impairments. |
F-39
W2007 Grace Acquisition I, Inc.
SCHEDULE III - REAL ESTATE AND ACCUMULATED DEPRECIATION
December 31, 2013
(dollars in thousands)
| Initial cost | Costs capitalized subsequent to acquisition (1) |
Gross carrying amount at close of period |
||||||||||||||||||||||||||||||||||||||||||||
| Hotel property |
Location | Encum- brances |
Land and improve- ments |
FF&E and buildings and improve- ments |
Land and improve- ments |
FF&E and buildings and improve- ments |
Land and improve- ments |
FF&E and buildings and improve- ments |
Total | Accumulated depreciation |
Acquisition date |
Life upon which depreciation is computed |
||||||||||||||||||||||||||||||||||
| Courtyard |
Asheville, NC | — | (2) | 1,931 | 10,289 | 548 | 2,172 | 2,479 | 12,461 | 14,940 | (3,088 | ) | 10/2007 | 3 - 39 years | ||||||||||||||||||||||||||||||||
| Courtyard |
Athens, GA | — | (2) | 1,678 | 8,658 | (622 | ) | (2,027 | ) | 1,056 | 6,631 | 7,687 | (1,393 | ) | 10/2007 | 3 - 39 years | ||||||||||||||||||||||||||||||
| Courtyard |
Bowling Green, KY | — | (2) | 1,744 | 10,369 | 536 | 1,970 | 2,280 | 12,339 | 14,619 | (2,903 | ) | 10/2007 | 3 - 39 years | ||||||||||||||||||||||||||||||||
| Courtyard |
Carlsbad, CA | 14,186 | 4,581 | 29,150 | (987 | ) | (10,099 | ) | 3,594 | 19,051 | 22,645 | (1,794 | ) | 10/2007 | 3 - 39 years | |||||||||||||||||||||||||||||||
| Courtyard |
Dallas, TX | — | (2) | — | 23,699 | 1,208 | 4,286 | 1,208 | 27,985 | 29,193 | (7,202 | ) | 10/2007 | 3 - 39 years | ||||||||||||||||||||||||||||||||
| Courtyard |
Dalton, GA | 4,499 | 1,566 | 8,969 | 461 | 1,065 | 2,027 | 10,034 | 12,061 | (2,106 | ) | 10/2007 | 3 - 39 years | |||||||||||||||||||||||||||||||||
| Courtyard |
Elmhurst, IL | — | (2) | 2,967 | 14,495 | (2,248 | ) | (7,774 | ) | 719 | 6,721 | 7,440 | (1,752 | ) | 10/2007 | 3 - 39 years | ||||||||||||||||||||||||||||||
| Courtyard |
Gainesville, FL | — | (2) | 2,080 | 11,743 | 592 | 1,639 | 2,672 | 13,382 | 16,054 | (3,240 | ) | 10/2007 | 3 - 39 years | ||||||||||||||||||||||||||||||||
| Courtyard |
Houston, TX | 17,125 | 4,534 | 22,921 | (906 | ) | (7,764 | ) | 3,628 | 15,157 | 18,785 | (3,727 | ) | 10/2007 | 3 - 39 years | |||||||||||||||||||||||||||||||
| Courtyard |
Jacksonville, FL | — | (2) | 2,185 | 11,647 | (1,057 | ) | (5,372 | ) | 1,128 | 6,275 | 7,403 | (1,463 | ) | 10/2007 | 3 - 39 years | ||||||||||||||||||||||||||||||
| Courtyard |
Knoxville, TN | — | (2) | 1,812 | 11,157 | 562 | 1,168 | 2,374 | 12,325 | 14,699 | (2,605 | ) | 10/2007 | 3 - 39 years | ||||||||||||||||||||||||||||||||
| Courtyard |
Lexington, KY | — | (2) | 1,902 | 11,297 | 578 | 2,200 | 2,480 | 13,497 | 15,977 | (3,080 | ) | 10/2007 | 3 - 39 years | ||||||||||||||||||||||||||||||||
| Courtyard |
Louisville, KY | — | (2) | 3,974 | 18,668 | 950 | 3,842 | 4,924 | 22,510 | 27,434 | (4,979 | ) | 10/2007 | 3 - 39 years | ||||||||||||||||||||||||||||||||
| Courtyard |
Mobile, AL | — | (2) | — | 10,802 | 221 | (6,487 | ) | 221 | 4,315 | 4,536 | (569 | ) | 10/2007 | 3 - 39 years | |||||||||||||||||||||||||||||||
| Courtyard |
Orlando, FL | — | (2) | 2,213 | 15,391 | (129 | ) | (3,737 | ) | 2,084 | 11,654 | 13,738 | (2,157 | ) | 10/2007 | 3 - 39 years | ||||||||||||||||||||||||||||||
| Courtyard |
Sarasota, FL | — | (2) | 1,971 | 11,122 | (1,469 | ) | (7,468 | ) | 502 | 3,654 | 4,156 | (1,324 | ) | 10/2007 | 3 - 39 years | ||||||||||||||||||||||||||||||
| Courtyard |
Tallahassee, FL | — | (2) | 1,987 | 12,595 | (626 | ) | (3,920 | ) | 1,361 | 8,675 | 10,036 | (767 | ) | 10/2007 | 3 - 39 years | ||||||||||||||||||||||||||||||
| Embassy Suites |
Orlando, FL | — | (2) | 6,545 | 34,333 | 1,539 | 2,400 | 8,084 | 36,733 | 44,817 | (10,753 | ) | 10/2007 | 3 - 39 years | ||||||||||||||||||||||||||||||||
| Fairfield Inn & Suites |
Atlanta, GA | — | (2) | 2,098 | 13,294 | (395 | ) | (4,132 | ) | 1,703 | 9,162 | 10,865 | (1,307 | ) | 10/2007 | 3 - 39 years | ||||||||||||||||||||||||||||||
| Fairfield Inn & Suites |
Dallas, TX | — | (2) | 2,140 | 9,758 | 505 | 2,798 | 2,645 | 12,556 | 15,201 | (2,593 | ) | 10/2007 | 3 - 39 years | ||||||||||||||||||||||||||||||||
| Hampton Inn |
Addison, TX | — | (2) | 2,227 | 7,791 | 379 | 3,357 | 2,606 | 11,148 | 13,754 | (4,180 | ) | 10/2007 | 3 - 39 years | ||||||||||||||||||||||||||||||||
| Hampton Inn |
Albany, NY | — | (2) | 3,163 | 16,907 | 827 | 1,409 | 3,990 | 18,316 | 22,306 | (4,503 | ) | 10/2007 | 3 - 39 years | ||||||||||||||||||||||||||||||||
| Hampton Inn |
Alcoa, TN | 2,685 | 1,676 | 6,415 | (1,157 | ) | (1,954 | ) | 519 | 4,461 | 4,980 | (1,756 | ) | 10/2007 | 3 - 39 years | |||||||||||||||||||||||||||||||
| Hampton Inn |
Austin, TX | 3,000 | 2,173 | 8,532 | 421 | 2,695 | 2,594 | 11,227 | 13,821 | (3,555 | ) | 10/2007 | 3 - 39 years | |||||||||||||||||||||||||||||||||
| Hampton Inn |
Beckley, WV | — | (2) | 2,028 | 11,705 | 595 | 3,115 | 2,623 | 14,820 | 17,443 | (4,064 | ) | 10/2007 | 3 - 39 years | ||||||||||||||||||||||||||||||||
| Hampton Inn |
Birmingham, AL | — | (2) | — | 16,833 | 865 | (3,990 | ) | 865 | 12,843 | 13,708 | (3,180 | ) | 10/2007 | 3 - 39 years | |||||||||||||||||||||||||||||||
| Hampton Inn |
Boca Raton, FL | — | (2) | 2,320 | 14,677 | (644 | ) | (6,934 | ) | 1,676 | 7,743 | 9,419 | (2,440 | ) | 10/2007 | 3 - 39 years | ||||||||||||||||||||||||||||||
| Hampton Inn |
Charleston, SC | — | (2) | 2,104 | 10,347 | (1,041 | ) | (3,836 | ) | 1,063 | 6,511 | 7,574 | (2,159 | ) | 10/2007 | 3 - 39 years | ||||||||||||||||||||||||||||||
| Hampton Inn |
Chattanooga, TN | — | (2) | 2,254 | 3,062 | 145 | 1,531 | 2,399 | 4,593 | 6,992 | (1,445 | ) | 10/2007 | 3 - 39 years | ||||||||||||||||||||||||||||||||
| Hampton Inn |
College Station, TX | 3,683 | 2,026 | 7,330 | 369 | 3,001 | 2,395 | 10,331 | 12,726 | (3,325 | ) | 10/2007 | 3 - 39 years | |||||||||||||||||||||||||||||||||
| Hampton Inn |
Colorado Springs, CO | — | (2) | 1,528 | 5,497 | (982 | ) | (1,093 | ) | 546 | 4,404 | 4,950 | (2,119 | ) | 10/2007 | 3 - 39 years | ||||||||||||||||||||||||||||||
| Hampton Inn |
Columbus, GA | — | (2) | 1,976 | 3,719 | (610 | ) | 31 | 1,366 | 3,750 | 5,116 | (1,152 | ) | 10/2007 | 3 - 39 years | |||||||||||||||||||||||||||||||
| Hampton Inn |
Deerfield Beach, FL | — | (2) | 2,515 | 14,784 | (464 | ) | (6,553 | ) | 2,051 | 8,231 | 10,282 | (1,889 | ) | 10/2007 | 3 - 39 years | ||||||||||||||||||||||||||||||
| Hampton Inn |
Dublin, OH | — | (2) | 2,162 | 9,118 | (969 | ) | (2,429 | ) | 1,193 | 6,689 | 7,882 | (1,887 | ) | 10/2007 | 3 - 39 years | ||||||||||||||||||||||||||||||
| Hampton Inn |
East Lansing, MI | 4,912 | 1,649 | 7,396 | 367 | 1,999 | 2,016 | 9,395 | 11,411 | (2,844 | ) | 10/2007 | 3 - 39 years | |||||||||||||||||||||||||||||||||
| Hampton Inn |
Fayetteville, NC | — | (2) | 1,930 | 5,414 | (406 | ) | (668 | ) | 1,524 | 4,746 | 6,270 | (979 | ) | 10/2007 | 3 - 39 years | ||||||||||||||||||||||||||||||
| Hampton Inn |
Gastonia, NC | — | (2) | 1,673 | 6,716 | 321 | 2,072 | 1,994 | 8,788 | 10,782 | (2,773 | ) | 10/2007 | 3 - 39 years | ||||||||||||||||||||||||||||||||
| Hampton Inn |
Glen Burnie, MD | — | (2) | — | 7,399 | 97 | (3,317 | ) | 97 | 4,082 | 4,179 | (1,498 | ) | 10/2007 | 3 - 39 years | |||||||||||||||||||||||||||||||
| Hampton Inn |
Grand Rapids, MI | — | (2) | 1,430 | 7,409 | 382 | 1,469 | 1,812 | 8,878 | 10,690 | (2,156 | ) | 10/2007 | 3 - 39 years | ||||||||||||||||||||||||||||||||
| Hampton Inn |
Gurnee, IL | — | (2) | 2,244 | 10,724 | 538 | 3,977 | 2,782 | 14,701 | 17,483 | (3,942 | ) | 10/2007 | 3 - 39 years | ||||||||||||||||||||||||||||||||
| Hampton Inn |
Indianapolis, IN | 5,477 | 2,144 | 11,759 | (1,502 | ) | (5,034 | ) | 642 | 6,725 | 7,367 | (1,906 | ) | 10/2007 | 3 - 39 years | |||||||||||||||||||||||||||||||
| Hampton Inn |
Kansas City, MO | — | (2) | 2,385 | 10,405 | 512 | 3,013 | 2,897 | 13,418 | 16,315 | (3,724 | ) | 10/2007 | 3 - 39 years | ||||||||||||||||||||||||||||||||
| Hampton Inn |
Madison Heights, MI | — | (2) | 2,163 | 9,017 | (642 | ) | (1,436 | ) | 1,521 | 7,581 | 9,102 | (2,858 | ) | 10/2007 | 3 - 39 years | ||||||||||||||||||||||||||||||
| Hampton Inn |
Maryland Heights, MO | — | (2) | 1,971 | 7,497 | 375 | 3,176 | 2,346 | 10,673 | 13,019 | (3,492 | ) | 10/2007 | 3 - 39 years | ||||||||||||||||||||||||||||||||
| Hampton Inn |
Memphis, TN | — | (2) | 2,532 | 12,739 | 626 | 1,129 | 3,158 | 13,868 | 17,026 | (3,373 | ) | 10/2007 | 3 - 39 years | ||||||||||||||||||||||||||||||||
| Hampton Inn |
Milford, CT | 4,704 | 2,665 | 6,199 | (670 | ) | (754 | ) | 1,995 | 5,445 | 7,440 | (1,229 | ) | 10/2007 | 3 - 39 years | |||||||||||||||||||||||||||||||
| Hampton Inn |
Morgantown, WV | — | (2) | 2,062 | 12,765 | 651 | 3,428 | 2,713 | 16,193 | 18,906 | (4,420 | ) | 10/2007 | 3 - 39 years | ||||||||||||||||||||||||||||||||
| Hampton Inn |
Naperville, IL | 6,034 | 2,494 | 14,727 | (130 | ) | (2,150 | ) | 2,364 | 12,577 | 14,941 | (3,205 | ) | 10/2007 | 3 - 39 years | |||||||||||||||||||||||||||||||
| Hampton Inn |
Norfolk, VA | — | (2) | — | 10,865 | 199 | (3,762 | ) | 199 | 7,103 | 7,302 | (1,258 | ) | 10/2007 | 3 - 39 years | |||||||||||||||||||||||||||||||
| Hampton Inn |
Northville, MI | — | (2) | 2,120 | 9,854 | (572 | ) | (2,305 | ) | 1,548 | 7,549 | 9,097 | (2,623 | ) | 10/2007 | 3 - 39 years | ||||||||||||||||||||||||||||||
| Hampton Inn |
Orlando, FL | 10,131 | 3,198 | 17,555 | (282 | ) | (5,463 | ) | 2,916 | 12,092 | 15,008 | (2,515 | ) | 10/2007 | 3 - 39 years | |||||||||||||||||||||||||||||||
| Hampton Inn |
Overland Park, KS | — | (2) | 2,235 | 11,126 | (1,314 | ) | (4,895 | ) | 921 | 6,231 | 7,152 | (1,929 | ) | 10/2007 | 3 - 39 years | ||||||||||||||||||||||||||||||
| Hampton Inn |
Palm Beach Gardens, FL | — | (2) | 3,017 | 20,628 | (959 | ) | (11,585 | ) | 2,058 | 9,043 | 11,101 | (2,978 | ) | 10/2007 | 3 - 39 years | ||||||||||||||||||||||||||||||
| Hampton Inn |
Peabody, MA | — | (2) | 2,006 | 10,044 | 504 | 2,912 | 2,510 | 12,956 | 15,466 | (3,217 | ) | 10/2007 | 3 - 39 years | ||||||||||||||||||||||||||||||||
| Hampton Inn |
Pickwick Dam, TN | — | (2) | 702 | 2,051 | 103 | 1,391 | 805 | 3,442 | 4,247 | (892 | ) | 10/2007 | 3 - 39 years | ||||||||||||||||||||||||||||||||
| Hampton Inn |
Scranton, PA | — | (2) | 2,407 | 9,696 | 499 | 3,362 | 2,906 | 13,058 | 15,964 | (3,454 | ) | 10/2007 | 3 - 39 years | ||||||||||||||||||||||||||||||||
| Hampton Inn |
State College, PA | — | (2) | 2,141 | 11,746 | 577 | 1,722 | 2,718 | 13,468 | 16,186 | (3,198 | ) | 10/2007 | 3 - 39 years | ||||||||||||||||||||||||||||||||
| Hampton Inn |
Urbana, IL | 9,734 | 2,386 | 15,031 | 779 | 2,949 | 3,165 | 17,980 | 21,145 | (3,968 | ) | 10/2007 | 3 - 39 years | |||||||||||||||||||||||||||||||||
| Hampton Inn |
West Columbia, SC | — | (2) | 2,144 | 9,657 | (1,151 | ) | (3,093 | ) | 993 | 6,564 | 7,557 | (2,332 | ) | 10/2007 | 3 - 39 years | ||||||||||||||||||||||||||||||
| Hampton Inn |
West Palm Beach, FL | — | (2) | 2,490 | 20,815 | (512 | ) | (12,474 | ) | 1,978 | 8,341 | 10,319 | (2,047 | ) | 10/2007 | 3 - 39 years | ||||||||||||||||||||||||||||||
| Hampton Inn |
Westlake, OH | — | (2) | 1,790 | 6,918 | 352 | 3,171 | 2,142 | 10,089 | 12,231 | (2,638 | ) | 10/2007 | 3 - 39 years | ||||||||||||||||||||||||||||||||
| Hampton Inn & Suites |
Boynton Beach, FL | — | (2) | 3,852 | 29,321 | (949 | ) | (15,632 | ) | 2,903 | 13,689 | 16,592 | (4,001 | ) | 10/2007 | 3 - 39 years | ||||||||||||||||||||||||||||||
| Hampton Inn & Suites |
Franklin, TN | — | (2) | 2,888 | 17,758 | 917 | 3,172 | 3,805 | 20,930 | 24,735 | (5,067 | ) | 10/2007 | 3 - 39 years | ||||||||||||||||||||||||||||||||
F-40
| Hilton Garden Inn |
Louisville, KY | 5,862 | 2,007 | 11,327 | 557 | 2,250 | 2,564 | 13,577 | 16,141 | (3,460 | ) | 10/2007 | 3 - 39 years | |||||||||||||||||||||||||||||||||
| Hilton Garden Inn |
Rio Rancho, NM | 3,866 | 2,234 | 13,278 | (194 | ) | (2,351 | ) | 2,040 | 10,927 | 12,967 | (2,213 | ) | 10/2007 | 3 - 39 years | |||||||||||||||||||||||||||||||
| Hilton Garden Inn |
Round Rock, TX | — | (2) | 4,016 | 10,474 | 499 | 1,855 | 4,515 | 12,329 | 16,844 | (3,706 | ) | 10/2007 | 3 - 39 years | ||||||||||||||||||||||||||||||||
| Holiday Inn |
Mt. Pleasant, SC | — | (2) | 3,460 | 12,581 | (876 | ) | (2,004 | ) | 2,584 | 10,577 | 13,161 | (2,418 | ) | 10/2007 | 3 - 39 years | ||||||||||||||||||||||||||||||
| Holiday Inn Express |
Miami, FL | — | (2) | 1,726 | 9,265 | (423 | ) | (2,918 | ) | 1,303 | 6,347 | 7,650 | (2,092 | ) | 10/2007 | 3 - 39 years | ||||||||||||||||||||||||||||||
| Homewood Suites |
Augusta, GA | 5,949 | 1,623 | 8,916 | 448 | 1,210 | 2,071 | 10,126 | 12,197 | (2,765 | ) | 10/2007 | 3 - 39 years | |||||||||||||||||||||||||||||||||
| Homewood Suites |
Chicago, IL | — | (2) | 9,554 | 47,258 | 2,402 | 2,211 | 11,956 | 49,469 | 61,425 | (10,960 | ) | 10/2007 | 3 - 39 years | ||||||||||||||||||||||||||||||||
| Homewood Suites |
Germantown, TN | — | (2) | 1,924 | 10,006 | (664 | ) | (1,753 | ) | 1,260 | 8,253 | 9,513 | (2,525 | ) | 10/2007 | 3 - 39 years | ||||||||||||||||||||||||||||||
| Homewood Suites |
Orlando, FL | 16,457 | 5,938 | 33,829 | 1,673 | 2,727 | 7,611 | 36,556 | 44,167 | (9,088 | ) | 10/2007 | 3 - 39 years | |||||||||||||||||||||||||||||||||
| Homewood Suites |
Peabody, MA | — | (2) | 1,696 | 10,138 | 508 | 1,063 | 2,204 | 11,201 | 13,405 | (2,528 | ) | 10/2007 | 3 - 39 years | ||||||||||||||||||||||||||||||||
| Homewood Suites |
Phoenix, AZ | — | (2) | — | 18,963 | 951 | (8,867 | ) | 951 | 10,096 | 11,047 | (3,118 | ) | 10/2007 | 3 - 39 years | |||||||||||||||||||||||||||||||
| Homewood Suites |
San Antonio, TX | — | (2) | 2,786 | 16,826 | 833 | 1,647 | 3,619 | 18,473 | 22,092 | (4,833 | ) | 10/2007 | 3 - 39 years | ||||||||||||||||||||||||||||||||
| Homewood Suites |
Seattle, WA | 25,237 | 5,330 | 37,204 | 1,906 | 2,173 | 7,236 | 39,377 | 46,613 | (8,815 | ) | 10/2007 | 3 - 39 years | |||||||||||||||||||||||||||||||||
| Homewood Suites |
Sharonville, OH | — | (2) | 1,997 | 3,328 | 149 | 1,910 | 2,146 | 5,238 | 7,384 | (2,002 | ) | 10/2007 | 3 - 39 years | ||||||||||||||||||||||||||||||||
| Homewood Suites |
Windsor Locks, CT | — | (2) | 2,857 | 14,684 | (643 | ) | (1,626 | ) | 2,214 | 13,058 | 15,272 | (2,166 | ) | 10/2007 | 3 - 39 years | ||||||||||||||||||||||||||||||
| Hyatt Place |
Albuquerque, NM | — | (2) | 2,170 | 13,296 | 687 | 3,815 | 2,857 | 17,111 | 19,968 | (4,908 | ) | 10/2007 | 3 - 39 years | ||||||||||||||||||||||||||||||||
| Hyatt Place |
Baton Rouge, LA | — | (2) | 1,985 | 21,753 | (48 | ) | (3,617 | ) | 1,937 | 18,136 | 20,073 | (3,199 | ) | 10/2007 | 3 - 39 years | ||||||||||||||||||||||||||||||
| Hyatt Place |
Birmingham, AL | — | (2) | 1,828 | 12,831 | (137 | ) | (1,334 | ) | 1,691 | 11,497 | 13,188 | (2,370 | ) | 10/2007 | 3 - 39 years | ||||||||||||||||||||||||||||||
| Hyatt Place |
Bloomington, MN | — | (2) | 2,178 | 19,123 | 31 | (5,548 | ) | 2,209 | 13,575 | 15,784 | (4,024 | ) | 10/2007 | 3 - 39 years | |||||||||||||||||||||||||||||||
| Hyatt Place |
Blue Ash, OH | — | (2) | 1,039 | 12,126 | (610 | ) | (5,341 | ) | 429 | 6,785 | 7,214 | (2,909 | ) | 10/2007 | 3 - 39 years | ||||||||||||||||||||||||||||||
| Hyatt Place |
Columbus, OH | — | (2) | 1,469 | 12,535 | 664 | 4,198 | 2,133 | 16,733 | 18,866 | (5,074 | ) | 10/2007 | 3 - 39 years | ||||||||||||||||||||||||||||||||
| Hyatt Place |
Franklin, TN | — | (2) | 1,658 | 18,579 | 966 | 3,738 | 2,624 | 22,317 | 24,941 | (5,955 | ) | 10/2007 | 3 - 39 years | ||||||||||||||||||||||||||||||||
| Hyatt Place |
Glen Allen, VA | — | (2) | 1,523 | 16,424 | (764 | ) | (8,890 | ) | 759 | 7,534 | 8,293 | (2,969 | ) | 10/2007 | 3 - 39 years | ||||||||||||||||||||||||||||||
| Hyatt Place |
Indianapolis, IN | — | (2) | 1,510 | 11,845 | 611 | 4,043 | 2,121 | 15,888 | 18,009 | (4,964 | ) | 10/2007 | 3 - 39 years | ||||||||||||||||||||||||||||||||
| Hyatt Place |
Las Vegas, NV | — | (2) | 3,910 | 51,594 | 174 | (29,329 | ) | 4,084 | 22,265 | 26,349 | (6,721 | ) | 10/2007 | 3 - 39 years | |||||||||||||||||||||||||||||||
| Hyatt Place |
Linthicum Heights, MD | — | (2) | 2,038 | 24,872 | 477 | (7,327 | ) | 2,515 | 17,545 | 20,060 | (4,579 | ) | 10/2007 | 3 - 39 years | |||||||||||||||||||||||||||||||
| Hyatt Place |
Memphis, TN | — | (2) | 1,697 | 11,087 | 571 | 3,816 | 2,268 | 14,903 | 17,171 | (4,601 | ) | 10/2007 | 3 - 39 years | ||||||||||||||||||||||||||||||||
| Hyatt Place |
Miami, FL | — | (2) | 2,230 | 15,006 | (1,010 | ) | (5,180 | ) | 1,220 | 9,826 | 11,046 | (3,065 | ) | 10/2007 | 3 - 39 years | ||||||||||||||||||||||||||||||
| Hyatt Place |
Overland Park, KS | — | (2) | 1,497 | 15,328 | (29 | ) | (5,323 | ) | 1,468 | 10,005 | 11,473 | (3,576 | ) | 10/2007 | 3 - 39 years | ||||||||||||||||||||||||||||||
| Hyatt Place |
Tampa, FL | — | (2) | 2,062 | 20,589 | (89 | ) | (8,552 | ) | 1,973 | 12,037 | 14,010 | (3,987 | ) | 10/2007 | 3 - 39 years | ||||||||||||||||||||||||||||||
| Residence Inn |
Boise, ID | — | (2) | 2,167 | 12,129 | (399 | ) | (3,183 | ) | 1,768 | 8,946 | 10,714 | (2,588 | ) | 10/2007 | 3 - 39 years | ||||||||||||||||||||||||||||||
| Residence Inn |
Chattanooga, TN | — | (2) | 1,947 | 9,756 | 508 | 2,122 | 2,455 | 11,878 | 14,333 | (3,251 | ) | 10/2007 | 3 - 39 years | ||||||||||||||||||||||||||||||||
| Residence Inn |
Colorado Springs, CO | — | (2) | 1,924 | 10,379 | (636 | ) | (4,071 | ) | 1,288 | 6,308 | 7,596 | (1,171 | ) | 10/2007 | 3 - 39 years | ||||||||||||||||||||||||||||||
| Residence Inn |
Eagan, MN | — | (2) | 2,648 | 13,324 | (399 | ) | (3,194 | ) | 2,249 | 10,130 | 12,379 | (2,767 | ) | 10/2007 | 3 - 39 years | ||||||||||||||||||||||||||||||
| Residence Inn |
El Segundo, CA | — | (2) | 4,789 | 30,344 | 1,561 | 2,648 | 6,350 | 32,992 | 39,342 | (7,900 | ) | 10/2007 | 3 - 39 years | ||||||||||||||||||||||||||||||||
| Residence Inn |
Ft Myers, FL | — | (2) | 1,905 | 13,231 | (1,015 | ) | (6,280 | ) | 890 | 6,951 | 7,841 | (2,165 | ) | 10/2007 | 3 - 39 years | ||||||||||||||||||||||||||||||
| Residence Inn |
Jacksonville, FL | 4,814 | 1,872 | 10,023 | (336 | ) | (3,688 | ) | 1,536 | 6,335 | 7,871 | (1,463 | ) | 10/2007 | 3 - 39 years | |||||||||||||||||||||||||||||||
| Residence Inn |
Knoxville, TN | — | (2) | 1,552 | 10,977 | 614 | 2,140 | 2,166 | 13,117 | 15,283 | (3,140 | ) | 10/2007 | 3 - 39 years | ||||||||||||||||||||||||||||||||
| Residence Inn |
Lexington, KY | — | (2) | 2,031 | 15,220 | 777 | 1,462 | 2,808 | 16,682 | 19,490 | (3,946 | ) | 10/2007 | 3 - 39 years | ||||||||||||||||||||||||||||||||
| Residence Inn |
Macon, GA | — | (2) | 1,661 | 8,892 | (294 | ) | (1,828 | ) | 1,367 | 7,064 | 8,431 | (2,375 | ) | 10/2007 | 3 - 39 years | ||||||||||||||||||||||||||||||
| Residence Inn |
Mobile, AL | — | (2) | — | 8,021 | 449 | (2,639 | ) | 449 | 5,382 | 5,831 | (1,486 | ) | 10/2007 | 3 - 39 years | |||||||||||||||||||||||||||||||
| Residence Inn |
Monmouth Junction, NJ | — | (2) | 3,885 | 18,618 | (1,504 | ) | (5,717 | ) | 2,381 | 12,901 | 15,282 | (3,008 | ) | 10/2007 | 3 - 39 years | ||||||||||||||||||||||||||||||
| Residence Inn |
Oklahoma City, OK | — | (2) | 2,657 | 14,060 | (880 | ) | (4,162 | ) | 1,777 | 9,898 | 11,675 | (1,859 | ) | 10/2007 | 3 - 39 years | ||||||||||||||||||||||||||||||
| Residence Inn |
Omaha, NE | — | (2) | 1,835 | 9,241 | (847 | ) | (2,632 | ) | 988 | 6,609 | 7,597 | (1,954 | ) | 10/2007 | 3 - 39 years | ||||||||||||||||||||||||||||||
| Residence Inn |
Portland, OR | — | (2) | 3,948 | 22,802 | (1,702 | ) | (8,299 | ) | 2,246 | 14,503 | 16,749 | (1,970 | ) | 10/2007 | 3 - 39 years | ||||||||||||||||||||||||||||||
| Residence Inn |
San Diego, CA | — | (2) | 3,068 | 19,387 | (369 | ) | (7,074 | ) | 2,699 | 12,313 | 15,012 | (2,625 | ) | 10/2007 | 3 - 39 years | ||||||||||||||||||||||||||||||
| Residence Inn |
Sarasota, FL | — | (2) | 1,823 | 12,028 | (460 | ) | (4,939 | ) | 1,363 | 7,089 | 8,452 | (1,797 | ) | 10/2007 | 3 - 39 years | ||||||||||||||||||||||||||||||
| Residence Inn |
Savannah, GA | — | (2) | 1,656 | 8,471 | (344 | ) | (2,255 | ) | 1,312 | 6,216 | 7,528 | (1,632 | ) | 10/2007 | 3 - 39 years | ||||||||||||||||||||||||||||||
| Residence Inn |
Somers Point, NJ | — | (2) | 2,787 | 16,004 | (1,426 | ) | (8,249 | ) | 1,361 | 7,755 | 9,116 | (1,015 | ) | 10/2007 | 3 - 39 years | ||||||||||||||||||||||||||||||
| Residence Inn |
Tallahassee, FL | — | (2) | 1,706 | 10,908 | (328 | ) | (3,657 | ) | 1,378 | 7,251 | 8,629 | (2,151 | ) | 10/2007 | 3 - 39 years | ||||||||||||||||||||||||||||||
| Residence Inn |
Tampa, FL | — | (2) | 2,378 | 13,174 | (766 | ) | (5,563 | ) | 1,612 | 7,611 | 9,223 | (1,756 | ) | 10/2007 | 3 - 39 years | ||||||||||||||||||||||||||||||
| Residence Inn |
Tampa, FL | — | (2) | 1,880 | 10,325 | (716 | ) | (5,138 | ) | 1,164 | 5,187 | 6,351 | (1,657 | ) | 10/2007 | 3 - 39 years | ||||||||||||||||||||||||||||||
| Residence Inn |
Tinton Falls, NJ | — | (2) | — | 15,728 | 368 | (8,427 | ) | 368 | 7,301 | 7,669 | (1,097 | ) | 10/2007 | 3 - 39 years | |||||||||||||||||||||||||||||||
| Residence Inn |
Tucson, AZ | — | (2) | 3,192 | 17,491 | (1,574 | ) | (8,944 | ) | 1,618 | 8,547 | 10,165 | (1,976 | ) | 10/2007 | 3 - 39 years | ||||||||||||||||||||||||||||||
| Residence Inn |
Williston, VT | — | (2) | 1,996 | 11,954 | (691 | ) | (4,362 | ) | 1,305 | 7,592 | 8,897 | (1,543 | ) | 10/2007 | 3 - 39 years | ||||||||||||||||||||||||||||||
| SpringHill Suites |
Asheville, NC | 4,954 | 1,887 | 10,800 | (156 | ) | (2,941 | ) | 1,731 | 7,859 | 9,590 | (1,975 | ) | 10/2007 | 3 - 39 years | |||||||||||||||||||||||||||||||
| SpringHill Suites |
Grand Rapids, MI | — | (2) | 1,333 | 7,289 | 377 | 1,652 | 1,710 | 8,941 | 10,651 | (2,108 | ) | 10/2007 | 3 - 39 years | ||||||||||||||||||||||||||||||||
| SpringHill Suites |
Houston, TX | — | (2) | 2,045 | 8,020 | (1,167 | ) | (2,006 | ) | 878 | 6,014 | 6,892 | (1,531 | ) | 10/2007 | 3 - 39 years | ||||||||||||||||||||||||||||||
| SpringHill Suites |
Lexington, KY | — | (2) | 2,133 | 11,732 | 596 | 1,234 | 2,729 | 12,966 | 15,695 | (2,545 | ) | 10/2007 | 3 - 39 years | ||||||||||||||||||||||||||||||||
| SpringHill Suites |
Round Rock, TX | — | (2) | 2,949 | 7,174 | 368 | 2,287 | 3,317 | 9,461 | 12,778 | (2,844 | ) | 10/2007 | 3 - 39 years | ||||||||||||||||||||||||||||||||
| SpringHill Suites |
San Antonio, TX | — | (2) | — | 13,227 | 686 | (6,466 | ) | 686 | 6,761 | 7,447 | (1,935 | ) | 10/2007 | 3 - 39 years | |||||||||||||||||||||||||||||||
| SpringHill Suites |
San Diego, CA | — | (2) | 3,624 | 21,401 | (311 | ) | (6,676 | ) | 3,313 | 14,725 | 18,038 | (3,007 | ) | 10/2007 | 3 - 39 years | ||||||||||||||||||||||||||||||
| TownePlace Suites |
Savannah, GA | 5,677 | 1,400 | 9,039 | (210 | ) | (2,570 | ) | 1,190 | 6,469 | 7,659 | (1,523 | ) | 10/2007 | 3 - 39 years | |||||||||||||||||||||||||||||||
|
|
|
|
|
|
|
|
|
|
|
|
|
|
|
|
|
|
|
|||||||||||||||||||||||||||||
| 158,986 | 283,398 | 1,736,539 | (5,901 | ) | (255,235 | ) | 277,497 | 1,481,304 | 1,758,801 | (378,322 | ) | |||||||||||||||||||||||||||||||||||
|
|
|
|
|
|
|
|
|
|
|
|
|
|
|
|
|
|
|
| (1) | Costs capitalized subsequent to acquisition include reductions of asset value due to impairments. |
| (2) | Hotel is collateral for the GE Mortgage which has a balance of $955,266 at December 31, 2013. |
F-41
Notes:
| Year Ended December 31, | ||||||||||||||||||||
| 2014 | 2013 | 2012 | 2011 | 2010 | ||||||||||||||||
| (a) The changes in total cost of investments in real estate are as follows (note 1): |
||||||||||||||||||||
| Balance at the beginning of the year |
$ | 1,772,054 | $ | 1,890,906 | $ | 1,969,409 | $ | 1,946,279 | $ | 2,009,095 | ||||||||||
| Additions to investments in real estate |
10,239 | 19,429 | 42,535 | 41,688 | 52,326 | |||||||||||||||
| Sales/disposals |
— | (95,335 | ) | (7,546 | ) | (13,070 | ) | |||||||||||||
| Impairment charges |
(17,251 | ) | (42,946 | ) | (113,492 | ) | (5,488 | ) | (115,142 | ) | ||||||||||
| Transfer to Senior Mezz |
(1,455,313 | ) | — | — | ||||||||||||||||
|
|
|
|
|
|
|
|
|
|
|
|||||||||||
| Balance at the end of the year |
$ | 309,729 | $ | 1,772,054 | $ | 1,890,906 | $ | 1,969,409 | $ | 1,946,279 | ||||||||||
|
|
|
|
|
|
|
|
|
|
|
|||||||||||
| (b) The changes in accumulated depreciation and amortization of investments in real estate are as follows (note 1): |
||||||||||||||||||||
| Balance at the beginning of the year |
$ | (379,957 | ) | $ | (328,484 | ) | $ | (271,446 | ) | $ | (191,435 | ) | $ | (125,654 | ) | |||||
| Depreciation |
(33,095 | ) | (85,951 | ) | (89,170 | ) | (82,340 | ) | (79,163 | ) | ||||||||||
| Amortization |
(73 | ) | (262 | ) | (284 | ) | (305 | ) | (135 | ) | ||||||||||
| Sales/disposals |
— | 19,450 | 5,639 | 1,629 | ||||||||||||||||
| Impairment charges |
8,215 | 15,290 | 26,777 | 1,005 | 13,517 | |||||||||||||||
| Transfer to Senior Mezz |
336,011 | — | ||||||||||||||||||
|
|
|
|
|
|
|
|
|
|
|
|||||||||||
| Balance at the end of the year |
$ | (68,899 | ) | $ | (379,957 | ) | $ | (328,484 | ) | $ | (271,446 | ) | $ | (191,435 | ) | |||||
|
|
|
|
|
|
|
|
|
|
|
|||||||||||
Note 1: Cost and accumulated depreciation and amortization above includes below market ground leases which are not included in Schedule III.
F-42