Attached files
| file | filename |
|---|---|
| EXCEL - IDEA: XBRL DOCUMENT - Cornerstone Building Brands, Inc. | Financial_Report.xls |
| EX-31.1 - EXHIBIT 31.1 - Cornerstone Building Brands, Inc. | v411958_ex31-1.htm |
| EX-32.1 - EXHIBIT 32.1 - Cornerstone Building Brands, Inc. | v411958_ex32-1.htm |
| EX-31.2 - EXHIBIT 31.2 - Cornerstone Building Brands, Inc. | v411958_ex31-2.htm |
| EX-10.1 - EXHIBIT 10.1 - Cornerstone Building Brands, Inc. | v411958_ex10-1.htm |
| EX-10.2 - EXHIBIT 10.2 - Cornerstone Building Brands, Inc. | v411958_ex10-2.htm |
| EX-32.2 - EXHIBIT 32.2 - Cornerstone Building Brands, Inc. | v411958_ex32-2.htm |
UNITED STATES
SECURITIES AND EXCHANGE COMMISSION
Washington, D.C. 20549
FORM 10-Q
| (Mark One) | |
| x | QUARTERLY REPORT PURSUANT TO SECTION 13 OR 15(d) OF THE SECURITIES EXCHANGE ACT OF 1934 |
For the quarterly period ended May 3, 2015
or
| ¨ | TRANSITION REPORT PURSUANT TO SECTION 13 OR 15(d) OF THE SECURITIES EXCHANGE ACT OF 1934 |
For the transition period from to
Commission file number: 1-14315

NCI BUILDING SYSTEMS, INC.
(Exact name of registrant as specified in its charter)
| Delaware | 76-0127701 |
| (State or other jurisdiction of incorporation or organization) |
(I.R.S. Employer Identification No.) |
| 10943 North Sam Houston Parkway West, Houston, TX |
77064 |
| (Address of principal executive offices) | (Zip Code) |
(281) 897-7788
(Registrant’s telephone number, including area code)
(Former name, former address and former fiscal year, if changed since last report)
Indicate by check mark whether the registrant (1) has filed all reports required to be filed by Section 13 or 15(d) of the Securities Exchange Act of 1934 during the preceding 12 months (or for such shorter period that the registrant was required to file such reports), and (2) has been subject to such filing requirements for the past 90 days. Yes x No ¨
Indicate by check mark whether the registrant has submitted electronically and posted on its corporate Web site, if any, every Interactive Data File required to be submitted and posted pursuant to Rule 405 of Regulation S-T (§232.405 of this chapter) during the preceding 12 months (or for such shorter period that the registrant was required to submit and post such files). x Yes ¨ No
Indicate by check mark whether the registrant is a large accelerated filer, an accelerated filer, a non-accelerated filer, or a smaller reporting company. See the definitions of “large accelerated filer,” “accelerated filer” and “smaller reporting company” in Rule 12b-2 of the Exchange Act.
| Large accelerated filer | ¨ | Accelerated filer | x |
| Non-accelerated filer | ¨ (Do not check if a smaller reporting company) | Smaller reporting company | ¨ |
Indicate by check mark whether the registrant is a shell company (as defined in Rule 12b-2 of the Exchange Act). ¨ Yes x No
APPLICABLE ONLY TO CORPORATE ISSUERS
Indicate the number of shares outstanding of each of the issuer’s classes of common stock, as of the latest practicable date.
Common Stock, $.01 par value - 73,807,877 shares as of June 1, 2015.
TABLE OF CONTENTS
| i |
PART I — FINANCIAL INFORMATION
Item 1. Unaudited Consolidated Financial Statements.
NCI BUILDING SYSTEMS, INC.
(In thousands, except share data)
| May 3, 2015 | November 2, 2014 | |||||||
| (Unaudited) | ||||||||
| ASSETS | ||||||||
| Current assets: | ||||||||
| Cash and cash equivalents | $ | 25,276 | $ | 66,651 | ||||
| Restricted cash | 980 | — | ||||||
| Accounts receivable, net | 141,895 | 136,923 | ||||||
| Inventories, net | 159,681 | 131,497 | ||||||
| Deferred income taxes | 21,998 | 21,447 | ||||||
| Income tax receivable | 7,438 | — | ||||||
| Prepaid expenses and other | 33,045 | 22,773 | ||||||
| Investments in debt and equity securities, at market | 5,786 | 5,549 | ||||||
| Assets held for sale | 6,261 | 5,690 | ||||||
| Total current assets | 402,360 | 390,530 | ||||||
| Property, plant and equipment, net | 270,003 | 244,714 | ||||||
| Goodwill | 198,169 | 75,226 | ||||||
| Intangible assets, net | 131,141 | 44,923 | ||||||
| Deferred financing costs, net | 12,051 | 3,290 | ||||||
| Total assets | $ | 1,013,724 | $ | 758,683 | ||||
| LIABILITIES AND STOCKHOLDERS’ EQUITY | ||||||||
| Current liabilities: | ||||||||
| Current portion of long-term debt | $ | 2,384 | $ | 2,384 | ||||
| Note payable | 1,713 | 418 | ||||||
| Accounts payable | 120,913 | 118,164 | ||||||
| Accrued compensation and benefits | 51,631 | 50,666 | ||||||
| Accrued interest | 7,844 | 1,820 | ||||||
| Other accrued expenses | 79,728 | 72,259 | ||||||
| Total current liabilities | 264,213 | 245,711 | ||||||
| Long-term debt, net | 461,765 | 233,003 | ||||||
| Deferred income taxes | 23,129 | 20,219 | ||||||
| Other long-term liabilities | 21,550 | 13,208 | ||||||
| Total long-term liabilities | 506,444 | 266,430 | ||||||
| Stockholders’ equity: | ||||||||
| Common stock, $.01 par value, 100,000,000 shares authorized; 74,148,452 and 73,769,095 shares issued at May 3, 2015 and November 2, 2014, respectively; 73,824,140 and 73,530,295 shares outstanding at May 3, 2015 and November 2, 2014, respectively | 741 | 737 | ||||||
| Additional paid-in capital | 636,165 | 630,297 | ||||||
| Accumulated deficit | (379,358 | ) | (371,550 | ) | ||||
| Accumulated other comprehensive income (loss), net | (8,739 | ) | (8,739 | ) | ||||
| Treasury stock, at cost (324,312 and 238,800 shares at May 3, 2015 and November 2, 2014, respectively) | (5,742 | ) | (4,203 | ) | ||||
| Total stockholders’ equity | 243,067 | 246,542 | ||||||
| Total liabilities and stockholders’ equity | $ | 1,013,724 | $ | 758,683 | ||||
See accompanying notes to consolidated financial statements.
| 1 |
NCI BUILDING SYSTEMS, INC.
CONSOLIDATED STATEMENTS OF OPERATIONS
(In thousands, except per share data)
(Unaudited)
| Fiscal Three Months Ended | Fiscal Six Months Ended | |||||||||||||||
May 3, 2015 | May 4, 2014 | May 3, 2015 | May 4, 2014 | |||||||||||||
| Sales | $ | 360,147 | $ | 305,800 | $ | 683,073 | $ | 616,466 | ||||||||
| Cost of sales, excluding gain on insurance recovery | 284,258 | 246,527 | 535,045 | 498,955 | ||||||||||||
| Gain on insurance recovery | — | (324 | ) | — | (1,311 | ) | ||||||||||
| Gross profit | 75,889 | 59,597 | 148,028 | 118,822 | ||||||||||||
| Engineering, selling, general and administrative expenses | 73,035 | 64,097 | 135,904 | 125,477 | ||||||||||||
| Intangible asset amortization | 4,375 | 1,013 | 5,868 | 2,026 | ||||||||||||
| Strategic development and acquisition related costs | 628 | — | 2,357 | — | ||||||||||||
| Restructuring costs | 1,468 | — | 2,945 | — | ||||||||||||
| Income (loss) from operations | (3,617 | ) | (5,513 | ) | 954 | (8,681 | ) | |||||||||
| Interest income | 32 | 24 | 39 | 50 | ||||||||||||
| Interest expense | (8,312 | ) | (3,059 | ) | (12,299 | ) | (6,185 | ) | ||||||||
| Foreign exchange gain (loss) | (10 | ) | 262 | (1,411 | ) | (439 | ) | |||||||||
| Other income, net | 332 | 324 | 332 | 529 | ||||||||||||
| Loss before income taxes | (11,575 | ) | (7,962 | ) | (12,385 | ) | (14,726 | ) | ||||||||
| Benefit from income taxes | (4,087 | ) | (3,057 | ) | (4,577 | ) | (5,563 | ) | ||||||||
| Net loss | $ | (7,488 | ) | $ | (4,905 | ) | $ | (7,808 | ) | $ | (9,163 | ) | ||||
| Loss per common share: | ||||||||||||||||
| Basic | $ | (0.10 | ) | $ | (0.07 | ) | $ | (0.11 | ) | $ | (0.13 | ) | ||||
| Diluted | $ | (0.10 | ) | $ | (0.07 | ) | $ | (0.11 | ) | $ | (0.13 | ) | ||||
| Weighted average number of common shares outstanding: | ||||||||||||||||
| Basic | 73,133 | 72,838 | 73,102 | 73,177 | ||||||||||||
| Diluted | 73,133 | 72,838 | 73,102 | 73,177 | ||||||||||||
See accompanying notes to consolidated financial statements.
| 2 |
NCI BUILDING SYSTEMS, INC.
CONSOLIDATED STATEMENTS OF COMPREHENSIVE LOSS
(In thousands)
(Unaudited)
| Fiscal Three Months Ended | Fiscal Six Months Ended | |||||||||||||||
May 3, 2015 | May 4, 2014 | May 3, 2015 | May 4, 2014 | |||||||||||||
| Comprehensive loss: | ||||||||||||||||
| Net loss | $ | (7,488 | ) | $ | (4,905 | ) | $ | (7,808 | ) | $ | (9,163 | ) | ||||
| Other comprehensive income (loss), net of tax: | ||||||||||||||||
| Foreign exchange translation gains (losses) and other, net of taxes(1) | 264 | 44 | — | (221 | ) | |||||||||||
| Other comprehensive income (loss) | 264 | 44 | — | (221 | ) | |||||||||||
| Comprehensive loss | $ | (7,224 | ) | $ | (4,861 | ) | $ | (7,808 | ) | $ | (9,384 | ) | ||||
| (1) | Foreign exchange translation losses and other are presented net of taxes of $0 in both the three months ended May 3, 2015 and May 4, 2014 and $0 in both the six months ended May 3, 2015 and May 4, 2014. |
See accompanying notes to the consolidated financial statements.
| 3 |
NCI BUILDING SYSTEMS, INC.
CONSOLIDATED STATEMENTS OF STOCKHOLDERS’ EQUITY
(In thousands, except share data)
(Unaudited)
| Accumulated | ||||||||||||||||||||||||||||||||
| Additional | Other | |||||||||||||||||||||||||||||||
| Common Stock | Paid-In | Accumulated | Comprehensive | Treasury Stock | Stockholders’ | |||||||||||||||||||||||||||
| Shares | Amount | Capital | Deficit | Loss | Shares | Amount | Equity | |||||||||||||||||||||||||
| Balance, November 2, 2014 | 73,769,095 | $ | 737 | $ | 630,297 | $ | (371,550 | ) | $ | (8,739 | ) | (238,800 | ) | $ | (4,203 | ) | $ | 246,542 | ||||||||||||||
| Treasury stock purchases | — | — | –– | — | — | (85,512 | ) | (1,539 | ) | (1,539 | ) | |||||||||||||||||||||
| Issuance of restricted stock | 339,357 | 3 | (3 | ) | — | — | — | — | — | |||||||||||||||||||||||
| Stock options exercised | 40,000 | 1 | 353 | — | — | — | — | 354 | ||||||||||||||||||||||||
| Excess tax benefits from share-based compensation arrangements | — | — | 384 | — | — | — | — | 384 | ||||||||||||||||||||||||
| Foreign exchange translation loss and other, net of taxes | — | — | — | — | — | — | — | — | ||||||||||||||||||||||||
| Share-based compensation | — | — | 5,134 | — | — | — | — | 5,134 | ||||||||||||||||||||||||
| Net loss | — | — | — | (7,808 | ) | — | — | — | (7,808 | ) | ||||||||||||||||||||||
| Balance, May 3, 2015 | 74,148,452 | $ | 741 | $ | 636,165 | $ | (379,358 | ) | $ | (8,739 | ) | (324,312 | ) | $ | (5,742 | ) | $ | 243,067 | ||||||||||||||
See accompanying notes to the consolidated financial statements.
| 4 |
NCI BUILDING SYSTEMS, INC.
CONSOLIDATED STATEMENTS OF CASH FLOWS
(In thousands)
(Unaudited)
| Fiscal Six Months Ended | ||||||||
| May 2, 2015 | May 4, 2014 | |||||||
| Cash flows from operating activities: | ||||||||
| Net loss | $ | (7,808 | ) | $ | (9,163 | ) | ||
| Adjustments to reconcile net loss to net cash used in operating activities: | ||||||||
| Depreciation and amortization | 23,497 | 17,708 | ||||||
| Deferred financing cost amortization | 118 | 592 | ||||||
| Share-based compensation expense | 5,134 | 5,742 | ||||||
| Gain on insurance recovery | — | (1,311 | ) | |||||
| Gain on sale of property, plant and equipment | (26 | ) | — | |||||
| (Recovery of) provision for doubtful accounts | (129 | ) | 585 | |||||
| Provision for (benefit from) deferred income taxes | 5,506 | (5,884 | ) | |||||
| Excess tax benefits from share-based compensation arrangements | (384 | ) | (760 | ) | ||||
| Changes in operating assets and liabilities, net of acquisition: | ||||||||
| Accounts receivable | 30,268 | 25,132 | ||||||
| Inventories | 1,660 | (14,140 | ) | |||||
| Income tax receivable | (6,373 | ) | (2 | ) | ||||
| Prepaid expenses and other | (176 | ) | 862 | |||||
| Accounts payable | (25,044 | ) | (43,610 | ) | ||||
| Accrued expenses | (28,910 | ) | (7,051 | ) | ||||
| Other, net | (634 | ) | 47 | |||||
| Net cash used in operating activities | (3,301 | ) | (31,253 | ) | ||||
| Cash flows from investing activities: | ||||||||
| Acquisition, net of cash acquired | (247,123 | ) | — | |||||
| Capital expenditures | (9,307 | ) | (10,004 | ) | ||||
| Proceeds from sale of property, plant and equipment | 26 | — | ||||||
| Proceeds from insurance | –– | 1,311 | ||||||
| Net cash used in investing activities | (256,404 | ) | (8,693 | ) | ||||
| Cash flows from financing activities: | ||||||||
| Proceeds from stock options exercised | 354 | — | ||||||
| Issuance of debt | 250,000 | — | ||||||
| Payments on term loan | (21,239 | ) | (1,196 | ) | ||||
| Payments on note payable | (417 | ) | (547 | ) | ||||
| Proceeds from Amended ABL Facility | — | 47,000 | ||||||
| Payments on Amended ABL Facility | — | (47,000 | ) | |||||
| Payment of financing costs | (8,879 | ) | (75 | ) | ||||
| Excess tax benefits from share-based compensation arrangements | 384 | 760 | ||||||
| Purchase of treasury stock | (1,539 | ) | (23,743 | ) | ||||
| Net cash provided by (used in) financing activities | 218,664 | (24,801 | ) | |||||
| Effect of exchange rate changes on cash and cash equivalents | (334 | ) | (221 | ) | ||||
| Net decrease in cash and cash equivalents | (41,375 | ) | (64,968 | ) | ||||
| Cash and cash equivalents at beginning of period | 66,651 | 77,436 | ||||||
| Cash and cash equivalents at end of period | $ | 25,276 | $ | 12,468 | ||||
See accompanying notes to consolidated financial statements.
| 5 |
NCI BUILDING SYSTEMS, INC.
NOTES TO CONSOLIDATED FINANCIAL STATEMENTS
MAY 3, 2015
(Unaudited)
NOTE 1 — SUMMARY OF SIGNIFICANT ACCOUNTING POLICIES
Basis of Presentation
The accompanying unaudited consolidated financial statements for NCI Building Systems, Inc. (together with its subsidiaries, unless otherwise indicated, the “Company,” “NCI,” “we,” “us” or “our”) have been prepared in accordance with generally accepted accounting principles for interim financial information and with the instructions to Form 10-Q and Article 10 of Regulation S-X. Accordingly, they do not include all of the information and footnotes required by generally accepted accounting principles for complete financial statements. In the opinion of management, the unaudited consolidated financial statements included herein contain all adjustments, which consist of normal recurring adjustments, necessary to fairly present our financial position, results of operations and cash flows for the periods indicated. Operating results for the fiscal three and six month periods ended May 3, 2015 are not necessarily indicative of the results that may be expected for the fiscal year ending November 1, 2015. Our sales and earnings are subject to both seasonal and cyclical trends and are influenced by general economic conditions, interest rates, the price of steel relative to other building materials, the level of nonresidential construction activity, roof repair and retrofit demand and the availability and cost of financing for construction projects.
For further information, refer to the consolidated financial statements and footnotes thereto included in our Annual Report on Form 10-K for the fiscal year ended November 2, 2014 filed with the Securities and Exchange Commission (the “SEC”) on December 22, 2014.
Reporting Periods
We use a four-four-five week calendar each quarter with our fiscal year end being on the Sunday closest to October 31. The year end for fiscal 2015 is November 1, 2015.
Reclassifications
Certain reclassifications have been made to prior period amounts to conform to the current presentation. The net effect of these reclassifications was not material to our consolidated financial statements.
Revenue Recognition
We recognize revenues when the following conditions are met: persuasive evidence of an arrangement exists, delivery has occurred or services have been rendered, the price is fixed or determinable, and collectability is reasonably assured. Generally, these criteria are met at the time product is shipped or services are complete. A portion of our revenue, exclusively within our engineered building systems segment, includes multiple-element revenue arrangements due to multiple deliverables. Each deliverable is generally determined based on customer-specific manufacturing and delivery requirements.
Because the separate deliverables have value to the customer on a stand-alone basis, they are typically considered separate units of accounting. A portion of the entire job order value is allocated to each unit of accounting. Revenue allocated to each deliverable is recognized upon shipment. We use estimated selling price (“ESP”) based on underlying cost plus a reasonable margin to determine how to separate multiple-element revenue arrangements into separate units of accounting, and how to allocate the arrangement consideration among those separate units of accounting. We determine ESP based on our normal pricing and discounting practices.
Our sales arrangements do not include a general right of return of the delivered product(s). In certain cases, the cancellation terms of a job order provide us with the opportunity to bill for certain incurred costs. In those instances, revenue is not recognized until all revenue recognition criteria is met, including reasonable assurance of collectability.
In our metal coil coating segment, our revenue activities broadly consist of cleaning, treating, painting and packaging various flat rolled metals as well as slitting and/or embossing the metal. We enter into two types of sales arrangements with our customers: toll processing sales and package sales. The primary distinction between these two arrangements relates to ownership of the underlying metal coil during treatment. In toll processing arrangements, we do not maintain ownership of the underlying metal coil during treatment and only recognize revenue for the toll processing activities, typically, cleaning, painting, slitting, embossing and packaging. In package sales arrangements, we have ownership of the metal coil during treatment and recognize revenue on both the toll processing activities and the sale of the underlying metal coil. Under either arrangement, revenue and the related direct and indirect costs are recognized when all of the recognition criteria are met, which is generally when the products are shipped to the customer.
| 6 |
NOTE 2 — ACQUISITION
On January 16, 2015, NCI Group, Inc., a wholly-owned subsidiary of the Company, and Steelbuilding.com, LLC, a wholly owned subsidiary of NCI Group, Inc., completed the acquisition of CENTRIA (the “CENTRIA Acquisition”), a Pennsylvania general partnership (“CENTRIA”), pursuant to the terms of the Interest Purchase Agreement, dated November 7, 2014 (“Interest Purchase Agreement”) with SMST Management Corp., a Pennsylvania corporation, Riverfront Capital Fund, a Pennsylvania limited partnership, and CENTRIA. NCI acquired all of the general partnership interests of CENTRIA in exchange for $255.8 million in cash. The purchase price is subject to a post-closing adjustment to net working capital as provided in the Interest Purchase Agreement. The purchase price was funded through the issuance of $250.0 million of new indebtedness. See Note 13 — Long-Term Debt and Note Payable. CENTRIA is now a wholly-owned subsidiary of NCI.
Accordingly, the results of CENTRIA’s operations from January 16, 2015 are included in our consolidated financial statements. For the period from January 16, 2015 to May 3, 2015, CENTRIA contributed revenue and operating income (loss) of $61.9 million and $(3.9) million, respectively. CENTRIA is a leader in the design, engineering and manufacturing of architectural insulated metal panel (“IMP”) wall and roof systems and a provider of integrated coil coating services for the nonresidential construction industry. CENTRIA operates four production facilities in the United States and a manufacturing facility in China.
We report on a fiscal year that ends on the Sunday closest to October 31. CENTRIA previously reported on a calendar year that ended December 31. The unaudited pro forma financial information in the table below was prepared based on financial information for CENTRIA for the calendar months of November through April in each respective period prior to the acquisition, which correlates to the three and six month periods corresponding to our fiscal period. The unaudited pro forma financial information for the fiscal three and six months ended May 3, 2015 and May 4, 2014 give effect to the transaction as if it had occurred at the beginning of the earliest fiscal period presented.
This unaudited pro forma financial information does not necessarily represent what would have occurred if the transaction had taken place on the dates presented and should not be taken as representative of our future consolidated results of operations. The unaudited pro forma financial information includes adjustments for interest expense to match the new capital structure and amortization expense for identified intangibles. In addition, acquisition related costs and $16.1 million of transaction costs incurred by the seller are excluded from the unaudited pro forma financial information. We expect to realize operating synergies from supply chain optimization, cost reductions, alignment of purchase terms and logistics and pricing optimization. The pro forma information does not reflect these potential synergies or expense reductions.
The following table shows our unaudited pro forma financial information for the three and six month periods ended May 3, 2015 and May 4, 2014 (in thousands, expect per share amounts):
| Unaudited Pro Forma | ||||||||||||||||
| Fiscal Three Months Ended | Fiscal Six Months Ended | |||||||||||||||
May 3, 2015 | May 4, 2014 | May 3, 2015 | May 4, 2014 | |||||||||||||
| Sales | $ | 360,147 | $ | 359,290 | $ | 727,560 | $ | 720,485 | ||||||||
| Net income (loss) | (7,101 | ) | (8,709 | ) | (10,947 | ) | (15,136 | ) | ||||||||
| Income (loss) per common share | ||||||||||||||||
| Basic | (0.10 | ) | (0.12 | ) | (0.15 | ) | (0.21 | ) | ||||||||
| Diluted | $ | (0.10 | ) | $ | (0.12 | ) | $ | (0.15 | ) | $ | (0.21 | ) | ||||
The following table summarizes the estimated fair values of the assets acquired and liabilities assumed as part of the CENTRIA Acquisition as of January 16, 2015. The fair value of all assets acquired and liabilities assumed are preliminary and the final determination of any required acquisition method adjustments will be made upon the completion of our fair value assessments. As a result, the initial purchase price allocations may be adjusted for changes in estimates of the fair value of assets acquired and liabilities assumed.
| (In thousands) | January 16, 2015 | |||
| Current assets | $ | 80,114 | ||
| Property, plant and equipment | 34,127 | |||
| Intangible assets | 92,030 | |||
| Assets acquired | $ | 206,271 | ||
| Current liabilities | $ | 65,173 | ||
| Other liabilities | 8,312 | |||
| Liabilities assumed | $ | 73,485 | ||
| Fair value of net assets acquired | $ | 132,786 | ||
| Total consideration paid | 255,841 | |||
| Goodwill | $ | 123,055 | ||
| 7 |
The amount allocated to intangible assets was attributed to the following categories (in thousands):
| Useful Lives | ||||||
| Backlog | $ | 7,000 | 9 months | |||
| Trade names | 15,620 | 15 years | ||||
| Customer lists and relationships | 69,410 | 20 years | ||||
| $ | 92,030 | |||||
These intangible assets are amortized on a straight-line basis.
The excess of the purchase price over the fair values of assets acquired and liabilities assumed was allocated to goodwill. We currently include the results of the CENTRIA Acquisition in the metal components segment. However, we are currently evaluating our management reporting presentation, which may result in changes to our operating segment presentation in future periods. Goodwill of $123.1 million was recorded in our metal components segment. Additionally, because the entity acquired was treated as a partnership for tax purposes, the tax basis of the acquired assets and liabilities have been adjusted to their fair value and goodwill will be deductible for tax purposes.
For all of our intangibles, including those recently acquired as part of the CENTRIA Acquisition and from prior acquisitions, the weighted average estimated useful life is 17.7 years. We recognized $5.9 million in amortization expense for all intangibles during the six months ended May 3, 2015. Total accumulated amortization was $26.4 million at May 3, 2015. We expect to recognize amortization expense over the next five fiscal years as follows (in millions):
| May 4, 2015 to November 1, 2015 | $ | 8,001 | ||
| 2016 | 7,428 | |||
| 2017 | 7,428 | |||
| 2018 | 7,428 | |||
| 2019 | 7,428 |
NOTE 3 — ACCOUNTING PRONOUNCEMENTS
Adopted Accounting Pronouncements
In July 2013, the FASB issued ASU 2013-11, Income Taxes (Topic 740): Presentation of Unrecognized Tax Benefit When a Net Operating Loss Carryforward, A Similar Tax Loss, or a Tax Credit Carryforward Exists (A Consensus of the FASB Emerging Issues Task Force). ASU 2013-11 requires an entity to present an unrecognized tax benefit as a reduction of a deferred tax asset for a net operating loss carryforward, or similar tax loss or tax credit carryforward, rather than as a liability when the uncertain tax position would reduce the net operating loss or other carryforward under the tax law of the applicable jurisdiction and the entity intends to use the deferred tax asset for that purpose. We adopted ASU 2013-11 prospectively for our first quarter in fiscal 2015. The adoption of ASU 2013-11 did not have a material impact on our consolidated financial statements.
Recent Accounting Pronouncements
In April 2014, the FASB issued ASU 2014-08, Presentation of Financial Statements (Topic 205) and Property, Plant, and Equipment (Topic 360): Reporting Discontinued Operations and Disclosures of Disposals of Components of an Entity. ASU 2014-08 changes the requirement for reporting discontinued operations. A disposal of a component of an entity or a group of components of an entity will be required to be reported in discontinued operations if the disposal represents a strategic shift that has or will have a major effect on an entity’s operations and financial results when the entity or group of components of an entity meets the criteria to be classified as held for sale or when it is disposed of by sale or other than by sale. The update also requires additional disclosures about discontinued operations, a disposal of an individually significant component of an entity that does not qualify for discontinued operations presentation in the financial statements, and an entity’s significant continuing involvement with a discontinued operation. This update is effective prospectively for our first quarter in fiscal 2016. Early adoption is permitted, but only for disposals (or classifications as held for sale) that have not been reported in previously issued financial statements. We are currently evaluating the potential impact of this authoritative guidance on our consolidated financial statements.
| 8 |
In May 2014, the FASB issued ASU 2014-09, Revenue from Contracts with Customers (Topic 606). ASU 2014-09 supersedes the revenue recognition requirements in ASC Topic 605, Revenue Recognition, and most industry-specific guidance. The core principle of the guidance is that an entity should recognize revenue to depict the transfer of promised goods or services to customers in an amount that reflects the consideration to which the entity expects to be entitled in exchange for those goods or services. This guidance is effective for our first quarter in fiscal 2018 under either full or modified retrospective adoption. Early application is not permitted. We are currently assessing the potential effects of these changes to our consolidated financial statements.
In June 2014, the FASB issued ASU 2014-12, Accounting for Share-Based Payments When the Terms of an Award Provide That a Performance Target Could Be Achieved after the Requisite Service Period. ASU 2014-12 requires that a performance target that affects vesting and could be achieved after the requisite service period be treated as a performance condition. A reporting entity should apply existing guidance in FASB Accounting Standards Codification 718, Compensation — Stock Compensation, as it relates to such awards. ASU 2014-12 is effective for our first quarter in fiscal 2017, with early adoption permitted. We do not expect that the adoption of this guidance will have a material impact on our consolidated financial statements.
In January 2015, the FASB issued ASU 2015-01, Income Statement — Extraordinary and Unusual Items (Subtopic 225-20): Simplifying Income Statement Presentation by Eliminating the Concept of Extraordinary Items. ASU 2015-01 eliminates from U.S. GAAP the concept of extraordinary items. The guidance is effective for our fiscal year ended October 29, 2017. A reporting entity may apply the amendments prospectively. We do not expect that the adoption of this guidance will have a material impact on our consolidated financial statements.
In April 2015, the FASB issued ASU 2015-03, Interest — Imputation of Interest (Subtopic 835-30): Simplifying the Presentation of Debt Issuance Costs. ASU 2015-03 requires debt issuance costs related to a recognized debt liability be presented in the balance sheet as a direct deduction from the carrying amount of the related debt liability instead of being presented as a separate asset. In circumstances where the costs are incurred before the debt liability is recorded, the costs will be reported on the balance sheet as an asset until the debt liability is recorded. Debt disclosures will include the face amount of the debt liability and the effective interest rate. The update requires retrospective application and is effective for our fiscal year ended October 29, 2017. Early adoption is permitted for financial statements that have not been previously issued. We do not expect that the adoption of this guidance will have a material impact on our consolidated financial statements.
In April 2015, the FASB issued ASU 2015-05, Intangibles — Goodwill and Other — Internal-Use Software (Subtopic 350-40): Customer's Accounting for Fees Paid in a Cloud Computing Arrangement. ASU 2015-05 provides guidance to customers about whether a cloud computing arrangement includes a software license. If a cloud computing arrangement includes a software license, the guidance specifies that the customer should account for the software license element of the arrangement consistent with the acquisition of other software licenses. ASU 2015-05 further specifies that the customer should account for a cloud computing arrangement as a service contract if the arrangement does not include a software license. The guidance is effective for our fiscal year ended October 29, 2017. We are currently assessing the impact of this guidance on our consolidated financial statements.
NOTE 4 —RESTRUCTURING
During the first quarter of fiscal 2015, we approved a plan to consolidate our three engineered buildings systems manufacturing facilities in Tennessee, closing the Caryville facility. We have incurred severance and facility costs at the Caryville facility of approximately $1.6 million during the first six months of fiscal 2015. We completed the closing of the Caryville facility during March 2015. In addition, during the first half of fiscal 2015, we incurred severance related costs of $1.2 million, $0.1 million and $0.2 million in the metal components segment, engineered building systems segment and metal coil coating segment, respectively, primarily in an effort to streamline our management and manufacturing structure to better serve our customers. The following table summarizes our restructuring plan costs and charges related to the restructuring plan during the fiscal six months ended May 3, 2015 (in thousands):
| Fiscal Three Months Ended | ||||||||||||||||||||
| February 1, 2015 | May 3, 2015 | Cost Incurred To Date | Remaining Anticipated Cost | Total Anticipated Cost | ||||||||||||||||
| General severance | $ | 606 | $ | 764 | $ | 1,370 | $ | –– | $ | 1,370 | ||||||||||
| Plant closing severance | $ | 871 | $ | 704 | $ | 1,575 | $ | 25 | $ | 1,600 | ||||||||||
| Total restructuring costs | $ | 1,477 | $ | 1,468 | $ | 2,945 | $ | 25 | $ | 2,970 | ||||||||||
| 9 |
The following table summarizes our restructuring liability and cash payments made related to the restructuring plan (in thousands):
| General Severance | Plant
Closing Severance | Total | ||||||||||
| Balance at February 1, 2015 | $ | –– | $ | 999 | $ | 999 | ||||||
| Costs incurred | 1,124 | 300 | 1,424 | |||||||||
| Cash payments | (1,598 | ) | (1,238 | ) | (2,836 | ) | ||||||
| Accrued severance(1) | 880 | –– | 880 | |||||||||
| Balance at May 3, 2015 | $ | 406 | $ | 61 | $ | 467 | ||||||
| (1) | During the second quarter of fiscal 2015, we entered into transition and separation agreements with certain executive officers. Each terminated executive officer is entitled to severance benefit payments issuable in two installments. The termination benefits were measured initially at the separation date based on the fair value of the liability as of the termination date, and recognized ratably over the future service period. |
NOTE 5 — GAIN ON INSURANCE RECOVERY
On August 6, 2013, our metal coil coating segment facility in Jackson, Mississippi experienced a fire caused by an exhaust fan failure that damaged the roof and walls of two curing ovens. The ovens were repaired and operations resumed in September 2013. During the three and six month periods ended May 4, 2014, we received $0.3 million and $1.3 million, respectively, which have been separately stated as “Gain on insurance recovery” on our consolidated statement of operations. These insurance proceeds were used to purchase and install assets to rebuild the roof and walls of the affected assets. The new assets were capitalized and depreciated over their estimated useful life of 10 years.
NOTE 6 — RESTRICTED CASH
We have entered into a cash collateral agreement with PNC Bank to backstop existing CENTRIA letters of credit until they expire. The restricted cash is held in a bank account with PNC Bank as the secured party. As of May 3, 2015, we had restricted cash in the amount of approximately $1.0 million as collateral related to our letters of credit for international projects with CENTRIA, exclusive of letters of credit under our Amended ABL Facility. See Note 13 — Long-Term Debt to the consolidated financial statements for more information on the material terms of our Amended ABL Facility. Restricted cash as of May 3, 2015 is classified as current as the underlying letters of credit expire within one year of the respective balance sheet date. Any renewal or replacement of the CENTRIA letters of credit is expected to occur under our Amended ABL Facility.
NOTE 7 — INVENTORIES
The components of inventory are as follows (in thousands):
| May 3, 2015 | November 2, 2014 | |||||||
| Raw materials | $ | 110,430 | $ | 93,367 | ||||
| Work in process and finished goods | 49,251 | 38,130 | ||||||
| $ | 159,681 | $ | 131,497 | |||||
NOTE 8 — ASSETS HELD FOR SALE
We record assets held for sale at the lower of the carrying value or fair value less costs to sell. The following criteria are used to determine if property is held for sale: (i) management has the authority and commits to a plan to sell the property; (ii) the property is available for immediate sale in its present condition; (iii) there is an active program to locate a buyer and the plan to sell the property has been initiated; (iv) the sale of the property is probable within one year; (v) the property is being actively marketed at a reasonable sale price relative to its current fair value; and (vi) it is unlikely that the plan to sell will be withdrawn or that significant changes to the plan will be made.
In determining the fair value of the assets less cost to sell, we considered factors including current sales prices for comparable assets in the area, recent market analysis studies, appraisals and any recent legitimate offers. If the estimated fair value less cost to sell of an asset is less than its current carrying value, the asset is written down to its estimated fair value less cost to sell. During the second quarter of fiscal 2015, we reclassified $0.6 million of property, plant and equipment to assets held for sale related to an idled facility because the facility met the above criteria. The carrying value of assets held for sale (representing idled facilities) is $6.3 million and $5.7 million at May 3, 2015 and November 2, 2014, respectively, and these amounts are included in the engineered building systems segment. All of these assets continue to be actively marketed for sale at May 3, 2015.
Due to uncertainties in the estimation process, it is reasonably possible that actual results could differ from the estimates used in our historical analyses. Our assumptions about property sales prices require significant judgment because the current market is highly sensitive to changes in economic conditions. We calculated the estimated fair values of assets held for sale based on current market conditions and assumptions made by management, which may differ from actual results and may result in additional impairments if market conditions deteriorate.
| 10 |
NOTE 9 — SHARE-BASED COMPENSATION
Our 2003 Long-Term Stock Incentive Plan (“Incentive Plan”) is an equity-based compensation plan that allows us to grant a variety of types of awards, including stock options, restricted stock, restricted stock units, stock appreciation rights, performance share units (“PSUs”), phantom stock awards, long-term incentive awards with performance conditions (“Performance Share Awards”) and cash awards. As of May 3, 2015 and May 4, 2014, and for all periods presented, our share-based awards under this plan have consisted of restricted stock grants, PSUs and stock option grants, none of which can be settled through cash payments, and Performance Share Awards. Both our stock options and restricted stock awards are subject only to vesting requirements based on continued employment at the end of a specified time period and typically vest over three to four years or earlier upon death, disability or a change of control. However, our annual restricted stock awards issued prior to December 15, 2013 also vest upon attainment of age 65 and, only in the case of certain special one-time restricted stock awards, a portion vest on termination without cause or for good reason, as defined by the agreements governing such awards. Restricted stock awards issued after December 15, 2013 do not vest upon attainment of age 65, as provided by the agreements governing such awards. The vesting of our Performance Share Awards is described below.
In December 2014, we granted long-term incentive awards with a three-year performance period to our senior executives (“2014 Executive Awards”). 40% of the value of the long-term incentive awards will consist of time-based restricted stock and 60% of the value of the award will consist of PSUs. The restricted stock is time-vesting based on continued employment, with two-thirds of the restricted stock vesting on December 15, 2016 and one-third vesting on December 15, 2017. The PSUs vest based on the achievement of performance goals and continued employment, with one-half of the award vesting on December 15, 2016 and the remaining one-half vesting on December 15, 2017. The PSU performance goals will be based on three metrics: (1) cumulative free cash flow (weighted 40%); (2) cumulative earnings per share (weighted 40%); and (3) total shareholder return (weighted 20%), in each case during the performance period. The number of shares that may be received on vesting of the PSUs will depend upon the satisfaction of the performance goals, up to a maximum of 200% of the target number of the PSUs. The PSUs vest pro rata if an executive’s employment terminates prior to the end of the performance period due to death, disability, or termination by NCI without cause or by the executive for good reason. If an executive’s employment terminates for any other reason prior to the end of the performance period, all outstanding unvested PSUs, whether earned or unearned, are forfeited and cancelled. If a change in control of NCI occurs prior to the end of the performance period, the PSU payout is calculated and paid assuming that the maximum benefit had been achieved. If an executive’s employment terminates due to death or disability while any of the restricted stock is unvested, then all of the unvested restricted stock shall become vested. If an executive’s employment is terminated by NCI without cause or after reaching normal retirement age, the unvested restricted stock is forfeited. If a change in control of NCI occurs prior to the end of the performance period, the restricted stock fully vests.
The fair value of the 2014 Executive Awards is based on the Company’s stock price as of the date of grant. A portion of the compensation cost of the 2014 Executive Awards is based on the probable outcome of the performance conditions associated with the respective shares, as determined by management. During the six months ended May 3, 2015, we granted PSUs with a fair value of approximately $3.7 million.
The fair value of restricted stock awards classified as equity awards is based on the Company’s stock price as of the date of grant. During the six months ended May 3, 2015 and May 4, 2014, we granted time-based restricted stock awards with a fair value of $6.5 million, representing 376,955 shares, and $2.6 million, representing 147,424 shares, respectively.
Also in December 2014, we granted Performance Share Awards to our key employees that will be paid 50% in cash and 50% in stock (“2014 Key Employee Awards”). The final number of 2014 Key Employee Awards earned for these awards granted in December 2014 will be based on the achievement of free cash flow and earnings per share targets over a three-year performance period. These 2014 Key Employee Awards cliff vest three years from the date of grant and will be earned based on the performance against the pre-established targets for the requisite service period. The 2014 Key Employee Awards also vest earlier upon death, disability or a change of control. However, a portion of the awards may vest on termination without cause or after reaching normal retirement age prior to the vesting date, as defined by the agreements governing such awards. The fair value of the 2014 Key Employee Awards is based on the Company’s stock price as of the date of grant. Compensation cost is recorded based on the probable outcome of the performance conditions associated with the respective shares, as determined by management. During the six months ended May 3, 2015 we granted 2014 Key Employee Awards with an equity fair value of $1.5 million and a cash value of $1.7 million.
During the six month periods ended May 3, 2015 and May 4, 2014, we recorded stock-based compensation expense for all awards of $5.1 million and $5.7 million, respectively. During the six month periods ended May 3, 2015 and May 4, 2014, we granted 10,543 and 5,058 stock options, respectively, and the grant-date fair value of options granted during the six month periods ended May 3, 2015 and May 4, 2014 was $7.91 and $9.09, respectively. There were 40,000 options exercised during the six months ended May 3, 2015. Cash received from the option exercises was $0.4 million during the three months ended May 3, 2015. The actual tax benefit realized for the tax deductions from option exercises totaled $0.1 million for the six months ended May 3, 2015.
| 11 |
NOTE 10 — LOSS PER COMMON SHARE
Basic earnings (loss) per common share is computed by dividing net income (loss) allocated to common shares by the weighted average number of common shares outstanding. Diluted earnings per common share, if applicable, considers the dilutive effect of common stock equivalents. The reconciliation of the numerator and denominator used for the computation of basic and diluted earnings (loss) per common share is as follows (in thousands, except per share data):
| Fiscal Three Months Ended | Fiscal Six Months Ended | |||||||||||||||
| May 3, 2015 | May 4, 2014 | May 3, 2015 | May 4, 2014 | |||||||||||||
| Numerator for Basic and Diluted Loss Per Common Share(1) | ||||||||||||||||
| Net loss | $ | (7,488 | ) | $ | (4,905 | ) | $ | (7,808 | ) | $ | (9,163 | ) | ||||
| Denominator for Basic and Diluted Loss Per Common Share | ||||||||||||||||
| Weighted average common shares outstanding for basic and diluted loss per share | 73,133 | 72,838 | 73,102 | 73,177 | ||||||||||||
| Basic and Diluted loss per common share | $ | (0.10 | ) | $ | (0.07 | ) | $ | (0.11 | ) | $ | (0.13 | ) | ||||
| (1) | Participating securities consist of the unvested restricted Common Stock related to our Incentive Plan. These participating securities do not have a contractual obligation to share in losses; therefore, no losses were allocated in the three and six months ended May 3, 2015 and May 4, 2014. The Unvested Common Stock related to our Incentive Plan will be allocated earnings when applicable. |
We calculate earnings (loss) per share using the “two-class” method, whereby unvested share-based payment awards that contain non-forfeitable rights to dividends or dividend equivalents are “participating securities” and, therefore, these participating securities are treated as a separate class in computing earnings (loss) per share. There was no income amount attributable to unvested restricted stock for both the three and six month periods ended May 3, 2015 and May 4, 2014, as the unvested restricted stock does not contractually share in the net losses. However, in periods of net income allocated to common shares, a portion of this income will be allocable to the unvested restricted stock.
For the three and six month periods ended May 3, 2015 and May 4, 2014, all outstanding options, PSUs and Performance Share Awards were anti-dilutive and, therefore, not included in the diluted loss per common share calculation.
NOTE 11 — WARRANTY
We sell weathertightness warranties to our customers for protection from leaks in our roofing systems related to weather. These warranties range from two years to 20 years. We sell two types of warranties, standard and Single Source™, and three grades of coverage for each. The type and grade of coverage determines the price to the customer. For standard warranties, our responsibility for leaks in a roofing system begins after 24 consecutive leak-free months. For Single Source™ warranties, the roofing system must pass our inspection before warranty coverage will be issued. Inspections are typically performed at three stages of the roofing project: (i) at the project start-up; (ii) at the project mid-point; and (iii) at the project completion. These inspections are included in the cost of the warranty. If the project requires or the customer requests additional inspections, those inspections are billed to the customer. Upon the sale of a warranty, we record the resulting revenue as deferred revenue, which is included in other accrued expenses in our consolidated balance sheets.
The following table represents the rollforward of our acquired accrued warranty obligation and deferred warranty revenue activity for each of the fiscal six months ended (in thousands):
| Fiscal Six Months Ended | ||||||||
| May 3, 2015 | May 4, 2014 | |||||||
| Beginning balance | $ | 23,685 | $ | 22,673 | ||||
| Warranties sold | 1,158 | 1,578 | ||||||
| Revenue recognized | (1,432 | ) | (1,001 | ) | ||||
| Other(1) | 2,357 | –– | ||||||
| Ending balance | $ | 25,768 | $ | 23,250 | ||||
| (1) | Represents the preliminary fair value of accrued warranty obligations in the amount of $2.4 million assumed in the CENTRIA Acquisition. CENTRIA offers weathertightness warranties to certain customers. Weathertightness warranties are offered in various configurations for terms from five to twenty years, prorated or non-prorated and on both a dollar limit or no dollar limit basis, as required by the buyer. These warranties are available only if certain conditions, some of which relate to installation, are met. |
| 12 |
NOTE 12 — DEFINED BENEFIT PLANS
RCC Pension Plan — With the acquisition of Robertson-Ceco II Corporation (“RCC”) on April 7, 2006, we assumed a defined benefit plan (the “RCC Pension Plan”). Benefits under the RCC Pension Plan are primarily based on years of service and the employee’s compensation. The RCC Pension Plan is frozen and, therefore, employees do not accrue additional service benefits. Plan assets of the RCC Pension Plan are invested in broadly diversified portfolios of government obligations, mutual funds, stocks, bonds, fixed income securities and master limited partnerships. In accordance with ASC 805, we quantified the projected benefit obligation and fair value of the plan assets of the RCC Pension Plan and recorded the difference between these two amounts as an assumed liability.
The following table sets forth the components of the net periodic benefit cost (in thousands):
| Fiscal Six Months Ended May 3, 2015 | ||||
| Interest cost | $ | 966 | ||
| Expected return on assets | (1,102 | ) | ||
| Prior service cost amortization | (5 | ) | ||
| Unrecognized net loss | 721 | |||
| Net periodic benefit cost | $ | 580 | ||
During the six months ended May 3, 2015, we contributed $0.5 million to the RCC Pension Plan. We expect to contribute an additional $0.7 million to the RCC Pension Plan for the remainder of fiscal 2015.
CENTRIA Benefit Plans — As a result of the CENTRIA Acquisition on January 16, 2015, we assumed noncontributory defined benefit plans covering certain hourly employees (the “CENTRIA Benefit Plans”). Benefits under the CENTRIA Benefit Plans are calculated based on fixed amounts for each year of service rendered. CENTRIA has historically sponsored postretirement medical and life insurance plans that cover certain of its employees and their spouses. The contributions to the plans by retirees vary from none to 25% of the total premiums paid. Plan assets of the CENTRIA Benefit Plans are invested in broadly diversified portfolios of equity mutual funds, international equity mutual funds, bonds, mortgages and other funds.
Currently, our policy is to fund the CENTRIA Benefit Plans as required by minimum funding standards of the Internal Revenue Code.
In accordance with ASC Topic 805, Business Combinations, we are in the process of remeasuring the projected benefit obligation and fair value of the plan assets of the CENTRIA Benefit Plans. The difference between these two amounts will be recorded as an assumed liability in the allocation of the purchase price. We have preliminarily used the December 31, 2014 actuarial reports to estimate the fair value of the projected benefit obligation and plan assets. The recognition of the net pension asset or liability in the allocation of the purchase price eliminates any previously unrecognized gain or loss and prior service cost. Actuarial assumptions below are based on the December 31, 2014 actuarial report.
The following table sets forth the preliminary funded status of the CENTRIA Benefit Plans and the amounts recognized in the condensed consolidated balance sheet (in thousands):
| Pension Benefits | Other Benefits | |||||||
| December 31, 2014 | December 31, 2014 | |||||||
| Fair value of assets | $ | 14,137 | $ | –– | ||||
| Benefit obligation | 14,427 | 8,153 | ||||||
| Funded status and net amount recognized | $ | (290 | ) | $ | (8,153 | ) | ||
| 13 |
Actuarial assumptions used for the CENTRIA Benefit Plans were as follows:
| Pension Benefits | Other Benefits | |||||||
| December 31, 2014 | December 31, 2014 | |||||||
| Assumed discount rate | 3.85 | % | 3.50 | % | ||||
| Expected rate of return on plan assets | 7.75 | % | N/A | |||||
The CENTRIA Benefit Plans weighted-average asset allocations by asset category are as follows:
| December 31, 2014 | ||||
| Equity mutual funds | 83 | % | ||
| Debt securities | 17 | % | ||
| Total | 100 | % | ||
We expect the following benefit payments to be made, which reflect expected future service, as appropriate (in thousands):
| Years Ended December 31 | Pension Benefits | Other Benefits | ||||||
| 2015 | $ | 764 | $ | 675 | ||||
| 2016 | 702 | 646 | ||||||
| 2017 | 699 | 694 | ||||||
| 2018 | 738 | 722 | ||||||
| 2019 | 780 | 678 | ||||||
| Thereafter | 4,263 | 2,600 | ||||||
Employer contributions – Since January 16, 2015, we have not contributed to the CENTRIA Benefit Plans but currently expect to contribute $0.6 million in fiscal 2015 to fund the CENTRIA Benefit Plans.
In addition to the CENTRIA Benefit Plans, CENTRIA contributes to a multi-employer plan, Steelworkers Pension Trust. The minimum required annual contribution to this plan is $0.3 million and the current contract expires on June 1, 2016. If we were to withdraw our participation from this multi-employer plan, we would have a complete withdrawal liability in the amount of $0.7 million.
NOTE 13 — LONG-TERM DEBT AND NOTE PAYABLE
Debt is comprised of the following (in thousands):
| May 3, | November 2, | |||||||
| 2015 | 2014 | |||||||
| Credit Agreement, due June 2019 (variable interest, at 4.25% on May 3, 2015 and November 2, 2014) | $ | 214,149 | $ | 235,387 | ||||
| 8.25% senior notes, due January 2023 | 250,000 | –– | ||||||
| Amended Asset-Based lending facility, due June 2019 (interest at 4.00% on May 3, 2015 and 4.75% on November 2, 2014) | –– | –– | ||||||
| Current portion of long-term debt | (2,384 | ) | (2,384 | ) | ||||
| Total long-term debt, less current portion | $ | 461,765 | $ | 233,003 | ||||
8.25% Senior Notes Due January 2023
On January 16, 2015, the Company issued $250.0 million in aggregate principal amount of 8.25% senior notes due 2023 (the “Notes”) to fund the CENTRIA Acquisition. Interest on the Notes accrues at the rate of 8.25% per annum and is payable semi-annually in arrears on January 15 and July 15, commencing on July 15, 2015. The Notes are guaranteed on a senior unsecured basis by all of the Company’s existing and future domestic subsidiaries that guarantee the Company’s obligations (including by reason of being a borrower under the senior secured asset-based revolving credit facility on a joint and several basis with the Company or a guarantor subsidiary) under the senior secured credit facilities. The Notes are unsecured senior indebtedness and rank equally in right of payment with all of the Company’s existing and future senior indebtedness and senior in right of payment to all of its future subordinated obligations. In addition, the Notes and guarantees are structurally subordinated to all existing and future indebtedness and other liabilities of the Company’s non-guarantor subsidiaries.
| 14 |
The Company may redeem the Notes at any time prior to January 15, 2018, at a price equal to 100% of the principal amount thereof, plus accrued and unpaid interest, if any, to the redemption date, plus the applicable make-whole premium. On or after January 15, 2018, the Company may redeem all or a part of the Notes at redemption prices (expressed as percentages of principal amount thereof) equal to 106.188% for the twelve-month period beginning on January 15, 2018, 104.125% for the twelve-month period beginning on January 15, 2019, 102.063% for the twelve-month period beginning on January 15, 2020 and 100.000% for the twelve-month period beginning on January 15, 2021 and at any time thereafter, plus accrued and unpaid interest, if any, to the applicable redemption date of the Notes. In addition, prior to January 15, 2018, the Company may redeem the Notes in an aggregate principal amount equal to up to 40.0% of the original aggregate principal amount of the Notes with funds in an equal aggregate amount not exceeding the aggregate proceeds of one or more equity offerings, at a redemption price of 108.250%, plus accrued and unpaid interest, if any, to the applicable redemption date of the Notes. The Company incurred $9.2 million in transaction costs related to this issuance, which will be amortized over 8 years.
Credit Agreement
On June 22, 2012, in connection with the acquisition of Metl-Span LLC (the “Metl-Span Acquisition”), a Texas limited liability company, the Company entered into a Credit Agreement among the Company, as Borrower, Credit Suisse AG, Cayman Islands Branch, as Administrative Agent and Collateral Agent (the “Term Agent”), and the lenders party thereto. The Credit Agreement provided for a term loan credit facility in an aggregate principal amount of $250.0 million.
The Credit Agreement contains a number of covenants that, among other things, will limit or restrict the ability of the Company and its subsidiaries to dispose of assets, incur additional indebtedness, make dividends and other restricted payments, create liens securing indebtedness, engage in mergers and other fundamental transactions, enter into restrictive agreements, amend certain documents in respect of other indebtedness, change the nature of their business and engage in certain transactions with affiliates.
On June 24, 2013, the Company entered into Amendment No. 1 (the “Amendment”) to its existing Credit Agreement (the “Credit Agreement”), dated as of June 22, 2012, between the Company, as borrower, and Credit Suisse AG, Cayman Islands Branch, as administrative agent and collateral agent and the other financial institutions party thereto from time to time (the “Term Loan Facility”), primarily to extend the maturity date and reduce the interest rate applicable to all of the outstanding term loans under the Term Loan Facility.
Pursuant to the Amendment, the maturity date of $238 million of outstanding term loans (the “Initial Term Loans”) was extended and such loans were converted into a new tranche of term loans (the “Tranche B Term Loans”) that will mature on June 24, 2019 and, prior to such date, will amortize in nominal quarterly installments equal to one percent of the aggregate initial principal amount thereof per annum. Pursuant to the Amendment, the Tranche B Term Loans will bear interest at a floating rate measured by reference to, at the Company’s option, either (i) an adjusted LIBOR not less than 1.00% plus a borrowing margin of 3.25% per annum or (ii) an alternate base rate plus a borrowing margin of 2.25% per annum. At both May 3, 2015 and November 2, 2014, the interest rate on the term loan under the Credit Agreement was 4.25%. Overdue amounts will bear interest at a rate that is 2% higher than the rate otherwise applicable.
The Tranche B Term Loans are secured by the same collateral and guaranteed by the same guarantors as the Initial Term Loans under the Term Loan Facility. Voluntary prepayments of the Tranche B Term Loans are permitted at any time, in minimum principal amounts, without premium or penalty, subject to a 1.00% premium payable in connection with certain repricing transactions within the first six months.
Pursuant to the Amendment, the Company will no longer be subject to a financial covenant requiring the Company to maintain a specified consolidated secured debt to EBITDA leverage ratio for specified periods. The Amendment also includes certain other changes to the Term Loan Facility.
Subject to certain exceptions, the term loan under the Amendment will be subject to mandatory prepayment in an amount equal to:
| • | the net cash proceeds of (1) certain asset sales, (2) certain debt offerings, and (3) certain insurance recovery and condemnation events; and |
| • | 50% of annual excess cash flow (as defined in the Amendment), subject to reduction to 0% if specified leverage ratio targets are met. |
| 15 |
Amended ABL Facility
On May 2, 2012, the Company entered into an Amended Asset-Based Lending Facility (“Amended ABL Facility”) to (i) permit the Metl-Span Acquisition, the entry by the Company into the Credit Agreement and the incurrence of debt thereunder and the repayment of existing indebtedness under NCI’s existing term loan, (ii) increase the amount available for borrowing thereunder to $150 million (subject to a borrowing base), (iii) increase the amount available for letters of credit thereunder to $30 million, and (iv) extend the final maturity thereunder to May 2, 2017.
On November 7, 2014, the Company, Steelbuilding.com, LLC (together with the Company, the “Guarantors”) and the Company’s subsidiaries NCI Group, Inc. and Robertson-Ceco II Corporation (each a “Borrower” and collectively, the “Borrowers”) entered into Amendment No. 3 to the Loan and Security Agreement (the “ABL Loan and Security Agreement”) among the Borrowers, the Guarantors, Wells Fargo Capital Finance, LLC as administrative agent and co-collateral agent, Bank of America, N.A. as co-collateral agent and syndication agent and certain other lenders under the ABL Loan and Security Agreement, in order to amend the ABL Loan and Security Agreement to (i) permit the CENTRIA Acquisition, (ii) permit the entry by the Company into documentation with respect to certain debt financing to be incurred in connection with the CENTRIA Acquisition and the incurrence of debt with respect thereto, (iii) extend the maturity date to June 24, 2019, (iv) decrease the applicable margin with respect to borrowings thereunder and (v) make certain other amendments and modifications to provide greater operational and financial flexibility.
Borrowing availability under the Amended ABL Facility is determined by a monthly borrowing base collateral calculation that is based on specified percentages of the value of qualified cash, eligible inventory and eligible accounts receivable, less certain reserves and subject to certain other adjustments. At May 3, 2015 and November 2, 2014, the Company’s excess availability under the Amended ABL Facility was $114.8 million and $135.4 million, respectively. At both May 3, 2015 and November 2, 2014, the Company had no revolving loans outstanding under the Amended ABL Facility. In addition, at May 3, 2015 and November 2, 2014, standby letters of credit related to certain insurance policies totaling approximately $9.3 million and $8.1 million, respectively, were outstanding but undrawn under the Amended ABL Facility.
The Amended ABL Facility contains a number of covenants that, among other things, limit or restrict the Company’s ability to dispose of assets, incur additional indebtedness, incur guarantee obligations, engage in sale and leaseback transactions, prepay other indebtedness, modify organizational documents and certain other agreements, create restrictions affecting subsidiaries, make dividends and other restricted payments, create liens, make investments, make acquisitions, engage in mergers, change the nature of our business and engage in certain transactions with affiliates.
The Amended ABL Facility includes a minimum fixed charge coverage ratio of one to one, which will apply if we fail to maintain a specified minimum borrowing capacity. The minimum level of borrowing capacity as of May 3, 2015 and November 2, 2014 was $17.2 million and $20.3 million, respectively. Although the Amended ABL Facility did not require any financial covenant compliance, at May 3, 2015 and November 2, 2014, NCI’s fixed charge coverage ratio as of those dates, which is calculated on a trailing twelve month basis, was 5.24:1.00 and 3.46:1.00, respectively. These ratios include the pro forma impact of the CENTRIA Acquisition.
Loans under the Amended ABL Facility bear interest, at NCI’s option, as follows:
| (1) | Base Rate loans at the Base Rate plus a margin. The margin ranges from 1.50% to 2.00% depending on the quarterly average excess availability under such facility, and |
| (2) | LIBOR loans at LIBOR plus a margin. The margin ranges from 2.50% to 3.00% depending on the quarterly average excess availability under such facility. |
At May 3, 2015 and November 2, 2014, the interest rate on the Amended ABL Facility was 4.00% and 4.75%, respectively. During an event of default, loans under the Amended ABL Facility will bear interest at a rate that is 2% higher than the rate otherwise applicable. “Base Rate” is defined as the higher of the Wells Fargo Bank, N.A. prime rate and the overnight Federal Funds rate plus 0.5% and “LIBOR” is defined as the applicable London Interbank Offered Rate adjusted for reserves.
Deferred Financing Costs
At May 3, 2015 and November 2, 2014, the unamortized balance in deferred financing costs related to the Credit Agreement, the Amended ABL Facility and the Notes was $12.1 million and $3.3 million, respectively.
Insurance Note Payable
As of May 3, 2015 and November 2, 2014, the Company had an outstanding note payable in the amount of $1.7 million and $0.4 million, respectively, related to financed insurance premiums. Insurance premium financings are generally secured by the unearned premiums under such policies.
| 16 |
NOTE 14 — CD&R FUNDS
On August 14, 2009, the Company entered into an Investment Agreement (as amended, the “Investment Agreement”), by and between the Company and Clayton, Dubilier & Rice Fund VIII, L.P. (“CD&R Fund VIII”), pursuant to which the Company agreed to issue and sell to CD&R Fund VIII, and CD&R Fund VIII agreed to purchase from the Company, for an aggregate purchase price of $250 million (less reimbursement to CD&R Fund VIII or direct payment to its service providers of up to $14.5 million in the aggregate of transaction expenses and a deal fee, paid to Clayton, Dubilier & Rice, Inc., the manager of CD&R Fund VIII, of $8.25 million), 250,000 shares of convertible preferred stock (the “Convertible Preferred Stock” and shares thereof, the “Preferred Shares”). Pursuant to the Investment Agreement, on October 20, 2009 (the “Closing Date”), the Company issued and sold to CD&R Fund VIII and Clayton, Dubilier & Rice Friends & Family Fund VIII, L.P. (collectively, the “CD&R Funds”), and the CD&R Funds purchased from the Company, an aggregate of 250,000 Preferred Shares, representing approximately 39.2 million shares of Common Stock or 68.4% of the voting power and Common Stock of the Company on an as-converted basis as of the Closing Date (such purchase and sale, the “CD&R Equity Investment”).
In connection with the consummation of the CD&R Equity Investment, on October 19, 2009, the Company filed the Certificate of Designations of the Convertible Preferred Stock (the “Certificate of Designations”) setting forth the terms, rights, powers, and preferences, and the qualifications, limitations and restrictions thereof, of the Convertible Preferred Stock.
On May 14, 2013, the CD&R Funds, the holders of 339,293 Preferred Shares, delivered a formal notice requesting the conversion (“Conversion”) of all of their Preferred Shares into shares of the Company’s Common Stock. In connection with the Conversion request, we issued the CD&R Funds 54,136,817 shares of our Common Stock, representing 72.4% of the Common Stock of the Company then outstanding. Under the terms of the Preferred Shares, no consideration was required to be paid by the CD&R Funds to the Company in connection with the Conversion of the Preferred Shares. As a result of the Conversion, the CD&R Funds no longer have rights to default dividends as specified in the Certificate of Designations. The Conversion on May 14, 2013 eliminated all the outstanding Convertible Preferred Stock and increased stockholders’ equity by nearly $620.0 million, returning the Company’s stockholders’ equity to a positive balance during our third quarter of fiscal 2013.
On January 15, 2014, the CD&R Funds completed a registered underwritten offering, in which the CD&R Funds offered 8.5 million shares of Common Stock at a price to the public of $18.00 per share (the “Secondary Offering”). The underwriters also exercised their option to purchase 1.275 million additional shares of Common Stock. The aggregate offering price for the 9.775 million shares sold in the Secondary Offering was approximately $167.6 million, net of underwriting discounts and commissions. The CD&R Funds received all of the proceeds from the Secondary Offering and no shares in the Secondary Offering were sold by NCI or any of its officers or directors (although certain of our directors are affiliated with the CD&R Funds). In connection with this Secondary Offering, we incurred approximately $0.8 million in expenses, which were included in engineering, selling, general and administrative expenses in the consolidated statement of operations for the six months ended May 4, 2014. At May 3, 2015 and November 2, 2014, the CD&R Funds owned 58.6% and 58.8%, respectively, of the voting power and Common Stock of the Company.
On January 6, 2014, the Company entered into an agreement with the CD&R Funds to repurchase 1.15 million shares of its Common Stock at the price per share equal to the price per share paid by the underwriters to the CD&R Funds in the underwritten offering (the “Stock Repurchase”). The Stock Repurchase, which was completed at the same time as the Secondary Offering, represented a private, non-underwritten transaction between NCI and the CD&R Funds that was approved and recommended by the Affiliate Transactions Committee of NCI’s board of directors. Following completion of the Stock Repurchase, NCI canceled the shares repurchased from the CD&R Funds, resulting in a $19.7 million decrease in both additional paid in capital and treasury stock.
NOTE 15 — FAIR VALUE OF FINANCIAL INSTRUMENTS AND FAIR VALUE MEASUREMENTS
Fair Value of Financial Instruments
The carrying amounts of cash and cash equivalents, restricted cash, trade accounts receivable and accounts payable approximate fair value as of May 3, 2015 and November 2, 2014 because of the relatively short maturity of these instruments. The fair values of the remaining financial instruments not currently recognized at fair value on our consolidated balance sheets at the respective fiscal period ends were (in thousands):
| May 3, 2015 | November 2, 2014 | |||||||||||||||
| Carrying | Carrying | |||||||||||||||
| Amount | Fair Value | Amount | Fair Value | |||||||||||||
| Credit Agreement, due June 2019 | $ | 214,149 | $ | 213,613 | $ | 235,387 | $ | 230,091 | ||||||||
| 8.25% senior notes, due January 2023 | 250,000 | 265,625 | — | — | ||||||||||||
| 17 |
The fair value of the Credit Agreement and the Notes were based on recent trading activities of comparable market instruments which are level 2 inputs.
Fair Value Measurements
ASC Subtopic 820-10, Fair Value Measurements and Disclosures, requires us to use valuation techniques to measure fair value that maximize the use of observable inputs and minimize the use of unobservable inputs. These inputs are prioritized as follows:
Level 1: Observable inputs such as quoted prices for identical assets or liabilities in active markets.
Level 2: Other inputs that are observable directly or indirectly, such as quoted prices for similar assets or liabilities or market-corroborated inputs.
Level 3: Unobservable inputs for which there is little or no market data and which require us to develop our own assumptions about how market participants would price the assets or liabilities.
The following is a description of the valuation methodologies used for assets and liabilities measured at fair value. There have been no changes in the methodologies used at May 3, 2015 and November 2, 2014.
Money market: Money market funds have original maturities of three months or less. The original cost of these assets approximates fair value due to their short-term maturity.
Mutual funds: Mutual funds are valued at the closing price reported in the active market in which the mutual fund is traded.
Assets held for sale: Assets held for sale are valued based on current market conditions, prices of similar assets in similar condition and expected proceeds from the sale of the assets.
Deferred compensation plan liability: Deferred compensation plan liability is comprised of phantom investments in the deferred compensation plan and is valued at the closing price reported in the active market in which the money market, mutual fund or NCI stock phantom investments are traded.
The following table summarizes information regarding our financial assets and liabilities that are measured at fair value on a recurring basis as of May 3, 2015, segregated by the level of the valuation inputs within the fair value hierarchy utilized to measure fair value (in thousands):
| Level 1 | Level 2 | Level 3 | Total | |||||||||||||
| Assets: | ||||||||||||||||
| Short-term investments in deferred compensation plan(1): | ||||||||||||||||
| Money market | $ | 736 | $ | — | $ | — | $ | 736 | ||||||||
| Mutual funds – Growth | 808 | — | — | 808 | ||||||||||||
| Mutual funds – Blend | 2,895 | — | — | 2,895 | ||||||||||||
| Mutual funds – Foreign blend | 776 | — | — | 776 | ||||||||||||
| Mutual funds – Fixed income | — | 571 | — | 571 | ||||||||||||
| Total short-term investments in deferred compensation plan | 5,215 | 571 | — | 5,786 | ||||||||||||
| Total assets | $ | 5,215 | $ | 571 | $ | — | $ | 5,786 | ||||||||
| Liabilities: | ||||||||||||||||
| Deferred compensation plan liability | $ | — | $ | (5,637 | ) | $ | — | $ | (5,637 | ) | ||||||
| Total liabilities | $ | — | $ | (5,637 | ) | $ | — | $ | (5,637 | ) | ||||||
| (1) | Unrealized holding gains (losses) for the three months ended May 3, 2015 and May 4, 2014 were $0.3 million and $0.1 million, respectively. Unrealized holding gains (losses) for the six months ended May 3, 2015 and May 4, 2014 were $0.1 million and $0.2 million, respectively. These unrealized holding gains (losses) are primarily offset by changes in the deferred compensation plan liability. |
| 18 |
The following table summarizes information regarding our financial assets that are measured at fair value on a nonrecurring basis as of May 3, 2015, segregated by level of the valuation inputs within the fair value hierarchy utilized to measure fair value (in thousands):
| Level 1 | Level 2 | Level 3 | Total | |||||||||||||
| Assets: | ||||||||||||||||
| Assets held for sale(2) | $ | — | $ | — | $ | 2,280 | $ | 2,280 | ||||||||
| Total assets | $ | — | $ | — | $ | 2,280 | $ | 2,280 | ||||||||
| (2) | Certain assets held for sale are valued at fair value and are measured at fair value on a nonrecurring basis. Assets held for sale are reported at fair value, if, on an individual basis, the fair value of the asset is less than cost. The fair value of assets held for sale is estimated using level 3 inputs, such as broker quotes for like-kind assets or other market indications of a potential selling value which approximates fair value. |
The following table summarizes information regarding our financial assets and liabilities that are measured at fair value on a recurring basis as of November 2, 2014, segregated by level of the valuation inputs within the fair value hierarchy utilized to measure fair value (in thousands):
| Level 1 | Level 2 | Level 3 | Total | |||||||||||||
| Assets: | ||||||||||||||||
| Short-term investments in deferred compensation plan(1): | ||||||||||||||||
| Money market | $ | 731 | $ | — | $ | — | $ | 731 | ||||||||
| Mutual funds – Growth | 791 | — | — | 791 | ||||||||||||
| Mutual funds – Blend | 2,743 | — | — | 2,743 | ||||||||||||
| Mutual funds – Foreign blend | 723 | — | — | 723 | ||||||||||||
| Mutual funds – Fixed income | — | 561 | — | 561 | ||||||||||||
| Total short-term investments in deferred compensation plan | $ | 4,988 | $ | 561 | $ | — | $ | 5,549 | ||||||||
| Total assets | $ | 4,988 | $ | 561 | $ | — | $ | 5,549 | ||||||||
| Liabilities: | ||||||||||||||||
| Deferred compensation plan liability | $ | — | $ | (6,093 | ) | $ | — | $ | (6,093 | ) | ||||||
| Total liabilities | $ | — | $ | (6,093 | ) | $ | — | $ | (6,093 | ) | ||||||
The following table summarizes information regarding our financial assets that are measured at fair value on a nonrecurring basis as of November 2, 2014, segregated by level of the valuation inputs within the fair value hierarchy utilized to measure fair value (in thousands):
| Level 1 | Level 2 | Level 3 | Total | |||||||||||||
| Assets: | ||||||||||||||||
| Assets held for sale(3) | $ | — | $ | — | $ | 2,280 | $ | 2,280 | ||||||||
| Total assets | $ | — | $ | — | $ | 2,280 | $ | 2,280 | ||||||||
| (3) | Certain assets held for sale are valued at fair value and are measured at fair value on a nonrecurring basis. Assets held for sale are reported at fair value, if, on an individual basis, the fair value of the asset is less than cost. The fair value of assets held for sale is estimated using level 3 inputs, such as broker quotes for like-kind assets or other market indications of a potential selling value which approximates fair value. |
| 19 |
NOTE 16 — OPERATING SEGMENTS
Operating segments are defined as components of an enterprise that engage in business activities and by which discrete financial information is available that is evaluated on a regular basis by the chief operating decision maker to make decisions about how to allocate resources to the segment and assess the performance of the segment. We have three operating segments: metal coil coating; metal components; and engineered building systems. All operating segments operate primarily in the nonresidential construction market. Sales and earnings are influenced by general economic conditions, the level of nonresidential construction activity, metal roof repair and retrofit demand and the availability and terms of financing available for construction. Products of our operating segments use similar basic raw materials. The metal coil coating segment consists of cleaning, treating, painting and slitting continuous steel coils before the steel is fabricated for use by construction and industrial users. The metal components segment products include metal roof and wall panels, doors, metal partitions, metal trim, insulated panels and other related accessories. Metl-Span is included in the metal components segment. The engineered building systems segment includes the manufacturing of main frames, Long Bay® Systems and value-added engineering and drafting, which are typically not part of metal components or metal coil coating products or services. The operating segments follow the same accounting policies used for our consolidated financial statements. We currently include the results of the CENTRIA Acquisition in the metal components segment. However, we are currently evaluating our management reporting presentation, which may result in changes to our operating segment presentation in future periods.
We evaluate a segment’s performance based primarily upon operating income before corporate expenses. Intersegment sales are recorded based on standard material costs plus a standard markup to cover labor and overhead and consist of (i) hot-rolled, light gauge painted and slit material and other services provided by the metal coil coating segment to both the metal components and engineered building systems segments; (ii) building components provided by the metal components segment to the engineered building systems segment; and (iii) structural framing provided by the engineered building systems segment to the metal components segment.
Corporate assets consist primarily of cash but also include deferred financing costs, deferred taxes and property, plant and equipment associated with our headquarters in Houston, Texas. These items (and income and expenses related to these items) are not allocated to the operating segments. Corporate unallocated expenses include share-based compensation expenses, and executive, legal, finance, tax, treasury, human resources, information technology, purchasing, marketing and corporate travel expenses. Additional unallocated expenses include interest income, interest expense, strategic development and acquisition related costs and other (expense) income.
| 20 |
The following table represents sales, operating income and total assets attributable to these operating segments for the periods indicated (in thousands):
| Fiscal Three Months Ended | Fiscal Six Months Ended | |||||||||||||||
| May 3, 2015 | May 4, 2014 | May 3, 2015 | May 4, 2014 | |||||||||||||
| Total sales: | ||||||||||||||||
| Metal coil coating | $ | 49,998 | $ | 54,307 | $ | 105,608 | $ | 108,574 | ||||||||
| Metal components | 221,118 | 155,085 | 393,907 | 313,278 | ||||||||||||
| Engineered building systems | 143,245 | 149,411 | 293,045 | 301,648 | ||||||||||||
| Intersegment sales | (54,214 | ) | (53,003 | ) | (109,487 | ) | (107,034 | ) | ||||||||
| Total sales | $ | 360,147 | $ | 305,800 | $ | 683,073 | $ | 616,466 | ||||||||
| External sales: | ||||||||||||||||
| Metal coil coating | $ | 22,804 | $ | 25,508 | $ | 47,208 | $ | 50,098 | ||||||||
| Metal components | 198,681 | 135,734 | 352,709 | 275,080 | ||||||||||||
| Engineered building systems | 138,662 | 144,558 | 283,156 | 291,288 | ||||||||||||
| Total sales | $ | 360,147 | $ | 305,800 | $ | 683,073 | $ | 616,466 | ||||||||
| Operating income (loss): | ||||||||||||||||
| Metal coil coating | $ | 2,397 | $ | 3,893 | $ | 6,375 | $ | 10,388 | ||||||||
| Metal components | 6,941 | 4,559 | 15,277 | 8,670 | ||||||||||||
| Engineered building systems | 2,855 | 36 | 11,574 | 1,676 | ||||||||||||
| Corporate | (15,810 | ) | (14,001 | ) | (32,272 | ) | (29,415 | ) | ||||||||
| Total operating income (loss) | $ | (3,617 | ) | $ | (5,513 | ) | $ | 954 | $ | (8,681 | ) | |||||
| Unallocated other expense | (7,958 | ) | (2,449 | ) | (13,339 | ) | (6,045 | ) | ||||||||
| Loss before income taxes | $ | (11,575 | ) | $ | (7,962 | ) | $ | (12,385 | ) | $ | (14,726 | ) | ||||
| May 3, 2015 | November 2, 2014 | |||||||
| Total assets: | ||||||||
| Metal coil coating | $ | 81,405 | $ | 84,519 | ||||
| Metal components | 410,151 | 365,874 | ||||||
| Engineered building systems | 211,871 | 209,281 | ||||||
| Corporate | 310,297 | 99,009 | ||||||
| Total assets | $ | 1,013,724 | $ | 758,683 | ||||
NOTE 17 — CONTINGENCIES
As a manufacturer of products primarily for use in nonresidential building construction, the Company is inherently exposed to various types of contingent claims, both asserted and unasserted, in the ordinary course of business. As a result, from time to time, the Company and/or its subsidiaries become involved in various legal proceedings or other contingent matters arising from claims, or potential claims. The Company insures against these risks to the extent deemed prudent by its management and to the extent insurance is available. Many of these insurance policies contain deductibles or self-insured retentions in amounts the Company deems prudent and for which the Company is responsible for payment. In determining the amount of self-insurance, it is the Company’s policy to self-insure those losses that are predictable, measurable and recurring in nature, such as claims for automobile liability and general liability. The Company regularly reviews the status of on-going proceedings and other contingent matters along with legal counsel. Liabilities for such items are recorded when it is probable that the liability has been incurred and when the amount of the liability can be reasonably estimated. Liabilities are adjusted when additional information becomes available. Management believes that the ultimate disposition of these matters will not have a material adverse effect on the Company’s results of operations, financial position or cash flows. However, such matters are subject to many uncertainties and outcomes are not predictable with assurance.
| 21 |
NCI BUILDING SYSTEMS, INC.
Item 2. Management’s Discussion and Analysis of Financial Condition and Results of Operations.
The following information should be read in conjunction with the unaudited consolidated financial statements included herein under “Item 1. Unaudited Consolidated Financial Statements” and the audited consolidated financial statements and the notes thereto and “Item 7. Management’s Discussion and Analysis of Financial Condition and Results of Operations” included in our Annual Report on Form 10-K for the fiscal year ended November 2, 2014.
FORWARD LOOKING STATEMENTS
This Quarterly Report includes statements concerning our expectations, beliefs, plans, objectives, goals, strategies, future events or performance and underlying assumptions and other statements that are not historical facts. These statements are “forward-looking statements” within the meaning of the Private Securities Litigation Reform Act of 1995. Actual results may differ materially from those expressed or implied by these statements. In some cases, our forward-looking statements can be identified by the words “anticipate,” “believe,” “continue,” “could,” “estimate,” “expect,” “forecast,” “goal,” “intend,” “may,” “objective,” “plan,” “potential,” “predict,” “projection,” “should,” “will” or other similar words. We have based our forward-looking statements on our management’s beliefs and assumptions based on information available to our management at the time the statements are made. We caution you that assumptions, beliefs, expectations, intentions and projections about future events may and often do vary materially from actual results. Therefore, we cannot assure you that actual results will not differ materially from those expressed or implied by our forward-looking statements. Accordingly, investors are cautioned not to place undue reliance on any forward-looking information, including any earnings guidance, if applicable. Although we believe that the expectations reflected in the forward-looking statements are reasonable, these expectations and the related statements are subject to risks, uncertainties, and other factors that could cause the actual results to differ materially from those projected. These risks, uncertainties, and other factors include, but are not limited to:
| • | industry cyclicality and seasonality and adverse weather conditions; |
| • | challenging economic conditions affecting the nonresidential construction industry; |
| • | volatility in the U.S. economy and abroad, generally, and in the credit markets; |
| • | our ability to service or refinance our existing debt, including the Notes, and obtain future financing; |
| • | our ability to comply with the financial tests and covenants in our existing and future debt obligations; |
| • | operational limitations or restrictions in connection with our debt; |
| • | recognition of asset impairment charges; |
| • | commodity price increases and/or limited availability of raw materials, including steel; |
| • | our ability to make strategic acquisitions accretive to earnings; |
| • | retention and replacement of key personnel; |
| • | enforcement and obsolescence of intellectual property rights; |
| • | fluctuations in customer demand; |
| • | costs related to environmental clean-ups and liabilities; |
| • | competitive activity and pricing pressure; |
| • | increases in energy prices; |
| • | the volatility of the Company’s stock price; |
| • | the dilutive effect on the Company’s common stockholders of potential future sales of the Company’s Common Stock held by our sponsor; |
| • | substantial governance and other rights held by our sponsor; |
| • | breaches of our information system security measures and damage to our major information management systems; |
| • | hazards that may cause personal injury or property damage, thereby subjecting us to liabilities and possible losses, which may not be covered by insurance; |
| • | changes in laws or regulations, including the Dodd–Frank Act; |
| • | our ability to integrate the acquisition of CENTRIA with the Company’s business and to realize the anticipated benefits of such acquisition; |
| • | costs and other effects of legal and administrative proceedings, settlements, investigations, claims and other matters; and |
| • | other risks detailed under the caption “Risk Factors” in Part II, Item 1A in our Quarterly Report on Form 10-Q for the quarterly period ended February 1, 2015 and in Part I, Item 1A in our most recent Annual Report on Form 10-K as filed with the SEC. |
A forward-looking statement may include a statement of the assumptions or bases underlying the forward-looking statement. We believe that we have chosen these assumptions or bases in good faith and that they are reasonable. However, we caution you that assumed facts or bases almost always vary from actual results, and the differences between assumed facts or bases and actual results can be material, depending on the circumstances. When considering forward-looking statements, you should keep in mind the risk factors and other cautionary statements in this report, including those described under the caption “Risk Factors” in our most recent Annual Report on Form 10-K as filed with the SEC. We expressly disclaim any obligations to release publicly any updates or revisions to these forward-looking statements to reflect any changes in our expectations unless the securities laws require us to do so.
| 22 |
OVERVIEW
NCI Building Systems, Inc. (together with its subsidiaries, unless the context requires otherwise, the “Company,” “NCI,” “we,” “us” or “our”) is one of North America’s largest integrated manufacturers and marketers of metal products for the nonresidential construction industry. We provide metal coil coating services and design, engineer, manufacture and market metal components and engineered building systems primarily for nonresidential construction use. We manufacture and distribute extensive lines of metal products for the nonresidential construction market under multiple brand names through a nationwide network of plants and distribution centers. We sell our products for both new construction and repair and retrofit applications.
Metal components offer builders, designers, architects and end-users several advantages, including lower long-term costs, longer life, attractive aesthetics and design flexibility. Similarly, engineered building systems offer a number of advantages over traditional construction alternatives, including shorter construction time, more efficient use of materials, lower construction costs, greater ease of expansion and lower maintenance costs.
We use a 52/53 week year with our fiscal year end on the Sunday closest to October 31. In fiscal 2015, our year end will be November 1, 2015 which is the Sunday closest to October 31.
We assess performance across our operating segments by analyzing and evaluating, among other indicators, gross profit, operating income and whether or not each segment has achieved its projected sales goals. In assessing our overall financial performance, we regard return on adjusted operating assets, as well as growth in earnings, as key indicators of shareholder value.
Second Fiscal Quarter
Third party sales in the metal coil coating segment were $22.8 million in the second quarter of fiscal 2015, an 11% decline from $25.5 million in the second quarter of the prior year. Total sales in the second quarter of fiscal 2015, including intercompany activity, decreased $4.3 million, or 8%, to $50.0 million from $54.3 million when compared to the same quarter in fiscal 2014. Operating income declined to $2.4 million in the second quarter of fiscal 2015 compared to $3.9 million reported in the same period last year. The volume decline and the resulting lower manufacturing leverage negatively impacted margins. The metal coil coating segment continues to diversify its customer base while improving its operating efficiencies in support of the goal of improved profitability.
The metal components segment generated $198.7 million in third-party sales during the second quarter of fiscal 2015, an increase of 46% from $135.7 million in the second quarter of fiscal 2014. Total sales in the second quarter of fiscal 2015, including intercompany sales, increased $66.0 million, or 43%, to $221.1 million from $155.1 million in the second quarter of the prior year. Operating income increased 52% to $6.9 million in the second quarter of fiscal 2015 compared to $4.6 million in the same quarter in fiscal 2014. Increased sales in our legacy single skin and insulated metal panel (IMP) products improved operating leverage for the operating segment. During the second quarter of fiscal 2015, CENTRIA contributed $53.4 million in sales and $3.1 million in operating loss, reflecting its first full quarter of results.
Third party sales in the engineered building systems segment declined 4% to $138.7 million in the second quarter of fiscal 2015 from $144.6 million in the second quarter of the prior year, primarily due to weather induced lower volumes. Total sales in the second quarter of fiscal 2015, including intercompany activity, were $143.2 million, or a decrease of 4%, from $149.4 million in the same period in fiscal 2014. Operating income increased significantly to $2.9 million in the current quarter when compared to near break even in the second quarter of fiscal 2014. The engineered building systems segment continues to benefit from strong margins led by improved project mix and commercial discipline, combined with lean manufacturing improvements.
Industry Conditions
Our sales and earnings are subject to both seasonal and cyclical trends and are influenced by general economic conditions, interest rates, the price of steel relative to other building materials, the level of nonresidential construction activity, roof repair and retrofit demand and the availability and cost of financing for construction projects. Our sales are normally lower in the first half of each fiscal year compared to the second half because of unfavorable weather conditions for construction and typical business planning cycles affecting construction.
The nonresidential construction industry is highly sensitive to national and regional macroeconomic conditions. One of the primary challenges we face is that the United States economy is recovering from a recession and historically low nonresidential construction activity, which began in the third quarter of 2008 and reduced demand for our products and adversely affected our business. In addition, the tightening of credit in financial markets over the same period adversely affected the ability of our customers to obtain financing for construction projects. As a result, we experienced decreases in orders and cancellations of orders for our products. While economic growth has remained relatively flat, nonresidential construction starts continue to be below previous cyclical troughs. The graph below shows the annual nonresidential new construction starts, measured in square feet, since 1967 as compiled and reported by McGraw-Hill:
| 23 |
McGraw-Hill Nonresidential Construction Activity
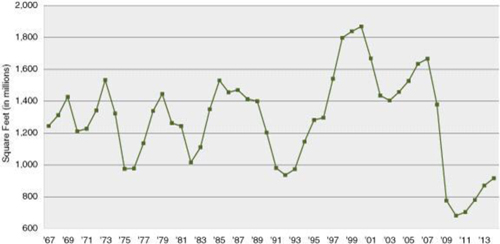
Source: McGraw-Hill
When assessing the state of the metal construction market, we review information from various industry associations, third-party research, and various government reports such as industrial production and capacity utilization. One such industry association is the Metal Building Manufacturers Association (“MBMA”), which provides summary member sales information and promotes the design and construction of metal buildings and metal roofing systems. Another is McGraw-Hill Construction Information Group (“McGraw Hill Construction”), which we review for information regarding actual and forecasted growth in various construction related industries, including the overall nonresidential construction market. McGraw-Hill Construction’s nonresidential construction forecast for calendar 2015, published in April 2015, indicates an expected increase of 10% in square footage as compared to the prior calendar year. This is consistent with the 2015 forecast published in January 2015, which also indicated an expected increase of 10% in square footage as compared to the prior calendar year. Additionally, we review the American Institute of Architects’ (“AIA”) survey for inquiry and billing activity for the industrial, commercial and institutional sectors. AIA’s architectural billing index (“ABI”) is a closely watched metric, as billings growth for architecture services generally leads to construction spending growth in the following 9 to 12 months. An ABI reading above 50 indicates an increase in month-to-month seasonally adjusted billings and a reading below 50 indicates a decrease in month-to-month seasonally adjusted billings. AIA’s ABI published for April 2015 was below 50 at 48.8 and the mixed use component of the index was at 51.8 for April 2015. The mixed use component of the index represents an improvement from January 2015, when the index was 45.1.
We normally do not maintain an inventory of steel in excess of our current production requirements. However, from time to time, we may purchase steel in advance of announced steel price increases. We can give no assurance that steel will be readily available or that prices will not continue to be volatile. While most of our sales contracts have escalation clauses that allow us, under certain circumstances, to pass along all or a portion of increases in the price of steel after the date of the contract but prior to delivery, for competitive or other reasons we may not be able to pass such price increases along. If the available supply of steel declines, we could experience price increases that we are not able to pass on to the end users, a deterioration of service from our suppliers or interruptions or delays that may cause us not to meet delivery schedules to our customers. Any of these problems could adversely affect our results of operations and financial condition. For additional discussion please see “Item 3. Quantitative and Qualitative Disclosures About Market Risk — Steel Prices.”
RESULTS OF OPERATIONS
Operating segments are defined as components of an enterprise that engage in business activities and by which discrete financial information is available that is evaluated on a regular basis by the chief operating decision maker to make decisions about how to allocate resources to the segment and assess the performance of the segment. We have three operating segments: (i) metal coil coating; (ii) metal components; and (iii) engineered building systems. All operating segments operate primarily in the nonresidential construction market. Sales and earnings are influenced by general economic conditions, the level of nonresidential construction activity, metal roof repair and retrofit demand and the availability and terms of financing available for construction. Our operating segments are vertically integrated and benefit from similar basic raw materials. The metal coil coating segment consists of cleaning, treating, painting and slitting continuous steel coils before the steel is fabricated for use by construction and industrial users. The metal components segment products include metal roof and wall panels, doors, metal partitions, metal trim, insulated panels and other related accessories. Metl-Span is included in the metal components segment. The engineered building systems segment includes the manufacturing of main frames, Long-Bay® Systems and value-added engineering and drafting, which are typically not part of metal components or metal coil coating products or services. The manufacturing and distribution activities of our segments are effectively coupled through the use of our nationwide hub-and-spoke manufacturing and distribution system, which supports and enhances our vertical integration. The operating segments follow the same accounting policies used for our consolidated financial statements. We currently include the results of the CENTRIA Acquisition in the metal components segment. However, we are currently evaluating our management reporting presentation, which may result in changes to our operating segment presentation in future periods.
| 24 |
We evaluate a segment’s performance based primarily upon operating income before corporate expenses. Intersegment sales are recorded based on standard material costs plus a standard markup to cover labor and overhead and consist of: (i) hot-rolled, light gauge painted, and slit material and other services provided by the metal coil coating segment to both the metal components and engineered building systems segments; (ii) building components provided by the metal components segment to the engineered building systems segment; and (iii) structural framing provided by the engineered building systems segment to the metal components segment.
Corporate assets consist primarily of cash but also include deferred financing costs, deferred taxes and property, plant and equipment associated with our headquarters in Houston, Texas. These items (and income and expenses related to these items) are not allocated to the operating segments. Corporate unallocated expenses include share-based compensation expenses, and executive, legal, finance, tax, treasury, human resources, information technology, purchasing, marketing and corporate travel expenses. Additional unallocated expenses include interest income, interest expense, strategic development and acquisition related costs and other (expense) income. See Note 16 — Operating Segments to the consolidated financial statements for more information on our segments.
The following table represents sales and operating income attributable to these operating segments for the periods indicated (in thousands):
| Fiscal Three Months Ended | Fiscal Six Months Ended | |||||||||||||||
| May 3, 2015 | May 4, 2014 | May 3, 2015 | May 4, 2014 | |||||||||||||
| Total sales: | ||||||||||||||||
| Metal coil coating | $ | 49,998 | $ | 54,307 | $ | 105,608 | $ | 108,574 | ||||||||
| Metal components | 221,118 | 155,085 | 393,907 | 313,278 | ||||||||||||
| Engineered building systems | 143,245 | 149,411 | 293,045 | 301,648 | ||||||||||||
| Intersegment sales | (54,214 | ) | (53,003 | ) | (109,487 | ) | (107,034 | ) | ||||||||
| Total sales | $ | 360,147 | $ | 305,800 | $ | 683,073 | $ | 616,466 | ||||||||
| External sales: | ||||||||||||||||
| Metal coil coating | $ | 22,804 | $ | 25,508 | $ | 47,208 | $ | 50,098 | ||||||||
| Metal components | 198,681 | 135,734 | 352,709 | 275,080 | ||||||||||||
| Engineered building systems | 138,662 | 144,558 | 283,156 | 291,288 | ||||||||||||
| Total sales | $ | 360,147 | $ | 305,800 | $ | 683,073 | $ | 616,466 | ||||||||
| Operating income (loss): | ||||||||||||||||
| Metal coil coating | $ | 2,397 | $ | 3,893 | $ | 6,375 | $ | 10,388 | ||||||||
| Metal components | 6,941 | 4,559 | 15,277 | 8,670 | ||||||||||||
| Engineered building systems | 2,855 | 36 | 11,574 | 1,676 | ||||||||||||
| Corporate | (15,810 | ) | (14,001 | ) | (32,272 | ) | (29,415 | ) | ||||||||
| Total operating income (loss) | $ | (3,617 | ) | $ | (5,513 | ) | $ | 954 | $ | (8,681 | ) | |||||
| Unallocated other expense | (7,958 | ) | (2,449 | ) | (13,339 | ) | (6,045 | ) | ||||||||
| Loss before income taxes | $ | (11,575 | ) | $ | (7,962 | ) | $ | (12,385 | ) | $ | (14,726 | ) | ||||
FISCAL THREE MONTHS ENDED MAY 3, 2015 COMPARED TO FISCAL THREE MONTHS ENDED MAY 4, 2014
Consolidated sales increased by 17.8%, or $54.3 million for the three months ended May 3, 2015, compared to the three months ended May 4, 2014. These results were driven by the inclusion of CENTRIA, which contributed $53.4 million of external sales during the three months ended May 3, 2015. This increase also resulted from a favorable higher margin product mix in our engineered building systems segment and higher tonnage volumes in our metal components segments, specifically for our single-skin products. These increases were partially offset by lower tonnage volumes in our metal coil coating and engineered building systems segments during the current period.
Consolidated cost of sales, excluding gain on insurance recovery increased by 15.3%, or $37.7 million for the three months ended May 3, 2015, compared to the three months ended May 4, 2014. This increase resulted from the inclusion of CENTRIA which contributed $44.6 million of cost of sales during the three months ended May 3, 2015, partially offset by lower tonnage volumes in our engineered building systems segment.
| 25 |
Consolidated gain on insurance recovery for the three months ended May 4, 2014 was $0.3 million. On August 6, 2013, our metal coil coating segment facility in Jackson, Mississippi experienced a fire caused by an exhaust fan failure that damaged the roof and walls of two curing ovens. During the fourth quarter of fiscal 2013, the ovens were repaired. We received insurance proceeds of approximately $0.3 million during the three months ended May 4, 2014 from claims submitted. These insurance proceeds have been classified as a “gain on insurance recovery” in the consolidated statement of operations. There was no corresponding amount recorded for the three months ended May 3, 2015. See Note 5 –– Gain on Insurance Recovery to the consolidated financial statements for more information.
Gross margin, including the gain on insurance recovery, was 21.1% for the three months ended May 3, 2015, compared to 19.5% for the same period in the prior year. The increase in gross margins was the result of continued commercial discipline in both the metal components and engineered building systems segments and higher margin product mix as well as the inclusion of CENTRIA.
Metal coil coating sales decreased by 7.9%, or $4.3 million, to $50.0 million in the three months ended May 3, 2015, compared to $54.3 million in the same period in the prior year. Sales to third parties for the three months ended May 3, 2015 decreased $2.7 million to $22.8 million from $25.5 million in the same period in the prior year, primarily as a result of a decrease in external tons shipped. The remaining $1.6 million represents a decrease in intersegment sales for the three months ended May 3, 2015, compared to the same period in the prior year. Metal coil coating third-party sales accounted for 6.3% of total consolidated third-party sales in the three months ended May 3, 2015, compared to 8.3% in the three months ended May 4, 2014.
Operating income of the metal coil coating segment decreased to $2.4 million in the three months ended May 3, 2015, compared to $3.9 million in the same period in the prior year. The prior year included insurance proceeds of approximately $0.3 million as noted above. The remaining $1.5 million decrease was primarily due to the lower sales to third parties as noted above and lower manufacturing leverage.
Metal components sales increased 42.6%, or $66.0 million, to $221.1 million in the three months ended May 3, 2015, compared to $155.1 million in the same period in the prior year. The results were driven in part by the inclusion of CENTRIA, which contributed $53.4 million of external sales during the three months ended May 3, 2015. This increase was also due to higher volume of single skin products shipped and higher margin product mix, primarily in our insulated metal panel products. Sales to third parties for the three months ended May 3, 2015 increased $62.9 million to $198.7 million from $135.7 million in the same period in the prior year. The remaining $3.1 million represents an increase in intersegment sales. Metal components third-party sales accounted for 55.2% of total consolidated third-party sales in the three months ended May 3, 2015, compared to 44.4% in the three months ended May 4, 2014.
Operating income of the metal components segment increased to $6.9 million in the three months ended May 3, 2015, compared to $4.6 million in the same period in the prior year. The $2.4 million increase was driven by the increased sales discussed above, as well as improved product mix.
Engineered building systems sales decreased 4.1%, or $6.2 million, to $143.2 million in the three months ended May 3, 2015, compared to $149.4 million in the same period in the prior year. This decrease resulted from weather induced lower external tons shipped, partially offset by higher sales prices as a result of improved product mix. Sales to third parties for the three months ended May 3, 2015 decreased $5.9 million to $138.7 million from $144.6 million in the same period in the prior year. The remaining $0.3 million represents a decrease in intersegment sales. Engineered building systems third-party sales accounted for 38.5% of total consolidated third-party sales in the three months ended May 3, 2015, compared to 47.3% in the three months ended May 4, 2014.
Operating income of the engineered building systems segment increased to $2.9 million in the three months ended May 3, 2015, compared to $0.04 million in the same period in the prior year. This $2.8 million increase resulted from higher sales prices noted above and lower transportation costs, partially offset by lower volumes and manufacturing inefficiencies in the three months ended May 3, 2015.
Consolidated engineering, selling, general and administrative expenses, consisting of engineering, drafting, selling and administrative costs, increased to $73.0 million in the three months ended May 3, 2015, compared to $64.1 million in the same period in the prior year. As a percentage of sales, engineering, selling, general and administrative expenses were 20.3% for the three months ended May 3, 2015, as compared to 21.0% for the three months ended May 4, 2014. The $8.9 million increase in engineering, selling and administrative expenses was primarily due to the inclusion of CENTRIA, which contributed $8.1 million of engineering, selling, general and administrative expenses during the three months ended May 3, 2015.
Consolidated intangible amortization increased to $4.4 million in the three months ended May 3, 2015, compared to $1.0 million in the same period in the prior year. This increase is directly related to the valuation of intangible assets related to the CENTRIA Acquisition on January 16, 2015. Intangible amortization amounts for the three months ended May 4, 2014 related to prior acquisitions, including Metl-Span.
| 26 |
Consolidated strategic development and acquisition related costs for the three months ended May 3, 2015 were $0.6 million. These non-operational costs are related to acquisition-related activities that support our future growth targets and performance goals and include external legal and due diligence costs incurred to pursue specific acquisition targets, including CENTRIA. There was no corresponding amount recorded for the three months ended May 4, 2014.
Consolidated restructuring charges for the three months ended May 3, 2015 were $1.5 million. In January 2015, we announced plans to consolidate our three Tennessee manufacturing facilities in our engineered building systems segment, closing the Caryville operation. Our Lexington and Elizabethton facilities, both located approximately 125 miles from Caryville, will continue to serve our family of brands within the segment. We believe the leaner footprint will maximize efficiencies and improve supply chain management while increasing the concentration of product and service capabilities at the existing facilities. We have incurred severance and facility costs at the Caryville facility of approximately $0.7 million during the second quarter of fiscal 2015. We completed the closing of the Caryville facility during March 2015. In addition, we incurred general severance costs of approximately $0.8 million, primarily in an effort to streamline our management and manufacturing structure to better serve our customers. There was no corresponding amount recorded for the three months ended May 4, 2014.
Consolidated interest expense increased to $8.3 million for the three months ended May 3, 2015, compared to $3.1 million for the same period of the prior year. On January 16, 2015, we issued $250.0 million in aggregate principal amount of 8.25% senior notes due 2023 to fund the CENTRIA Acquisition, which increased our consolidated interest expense.
Consolidated foreign exchange gain (loss), decreased to a $(0.01) million loss for the three months ended May 3, 2015, compared to a $0.3 million gain for the same period of the prior year primarily due to foreign currency losses in both Mexico and Canada related to fluctuations in the Mexican Peso and Canadian Dollar, relative to the U.S. Dollar exchange rate in the current period.
Consolidated benefit from income taxes was $4.1 million for the three months ended May 3, 2015, compared to a $3.1 million for the same period in the prior year. The effective tax rate for the three months ended May 3, 2015 was 35.3%, compared to 38.4% for the same period in the prior year. The decrease in the effective tax rate was primarily the result of an increase in the benefit related to the domestic production activities deduction and a decrease in the detriment related to non-deductible expenses.
Diluted loss per common share increased to $(0.10) per diluted common share for the three months ended May 3, 2015, compared to a loss of $(0.07) per diluted common share for the same period in the prior year. The increase in diluted loss per common share was primarily due to the $2.6 million increase in net loss resulting from the factors described above in this section.
FISCAL SIX MONTHS ENDED MAY 3, 2015 COMPARED TO FISCAL SIX MONTHS ENDED MAY 4, 2014
Consolidated sales increased by 10.8%, or $66.6 million for the six months ended May 3, 2015, compared to the six months ended May 4, 2014. These results were driven by the inclusion of CENTRIA, which contributed $61.9 million of external sales since January 16, 2015 when CENTRIA was acquired. This increase also resulted from a favorable higher margin product mix in our engineered building systems segment and higher tonnage volumes in our metal components segments, specifically for our single-skin products. These increases were partially offset by lower tonnage volumes in our engineered building systems segment during the current period.
Consolidated cost of sales, excluding gain on insurance recovery increased by 7.2%, or $36.1 million for the six months ended May 3, 2015, compared to the six months ended May 4, 2014. This increase resulted from the inclusion of CENTRIA which contributed $51.7 million of cost of sales since January 16, 2015 when CENTRIA was acquired, partially offset by lower tonnage volumes in our engineered building systems segment.
Consolidated gain on insurance recovery for the six months ended May 4, 2014 was $1.3 million. On August 6, 2013, our metal coil coating segment facility in Jackson, Mississippi experienced a fire caused by an exhaust fan failure that damaged the roof and walls of two curing ovens. During the fourth quarter of fiscal 2013, the ovens were repaired. We received insurance proceeds of approximately $1.3 million during the six months ended May 4, 2014 from claims submitted. These insurance proceeds have been classified as a “gain on insurance recovery” in the consolidated statement of operations. There was no corresponding amount recorded for the six months ended May 3, 2015. See Note 5 –– Gain on Insurance Recovery to the consolidated financial statements for more information.
Gross margin, including the gain on insurance recovery, was 21.7% for the six months ended May 3, 2015, compared to 19.3% for the same period in the prior year. The increase in gross margins was the result of continued commercial discipline in both the metal components and engineered building systems segments and higher margin product mix as well as the inclusion of CENTRIA.
| 27 |
Metal coil coating sales decreased by 2.7%, or $3.0 million, to $105.6 million in the six months ended May 3, 2015, compared to $108.6 million in the same period in the prior year. Sales to third parties for the six months ended May 3, 2015 decreased $2.9 million to $47.2 million from $50.1 million in the same period in the prior year, primarily as a result of a decrease in external tons shipped. The remaining $0.1 million represents a decrease in intersegment sales for the six months ended May 3, 2015, compared to the same period in the prior year. Metal coil coating third-party sales accounted for 6.9% of total consolidated third-party sales in the six months ended May 3, 2015, compared to 8.1% in the six months ended May 4, 2014.
Operating income of the metal coil coating segment decreased to $6.4 million in the six months ended May 3, 2015, compared to $10.4 million in the same period in the prior year. The prior year included insurance proceeds of approximately $1.3 million as noted above. The remaining decrease was primarily due to the lower sales to third parties as noted above, higher material conversion costs and unfavorable product mix.
Metal components sales increased 25.7%, or $80.6 million, to $393.9 million in the six months ended May 3, 2015, compared to $313.3 million in the same period in the prior year. The results were driven in part by the inclusion of CENTRIA, which contributed $61.9 million of external sales since January 16, 2015 when CENTRIA was acquired. This increase was also due to higher volume of single skin products shipped and higher margin product mix, primarily in our insulated metal panel products. Sales to third parties for the six months ended May 3, 2015 increased $77.6 million to $352.7 million from $275.1 million in the same period in the prior year. The remaining $3.0 million represents an increase in intersegment sales. Metal components third-party sales accounted for 51.6% of total consolidated third-party sales in the six months ended May 3, 2015, compared to 44.6% in the six months ended May 4, 2014.
Operating income of the metal components segment increased to $15.3 million in the six months ended May 3, 2015, compared to $8.7 million in the same period in the prior year. The $6.6 million increase was driven by the increased sales discussed above, as well as improved product mix.
Engineered building systems sales decreased 2.9%, or $8.6 million, to $293.0 million in the six months ended May 3, 2015, compared to $301.6 million in the same period in the prior year. This decrease resulted from a decrease in external tons shipped, partially offset by higher sales prices as a result of improved product mix. Sales to third parties for the six months ended May 3, 2015 decreased $8.1 million to $283.2 million from $291.3 million in the same period in the prior year. The remaining $0.5 million represents a decrease in intersegment sales. Engineered building systems third-party sales accounted for 41.5% of total consolidated third-party sales in the six months ended May 3, 2015, compared to 47.3% in the six months ended May 4, 2014.
Operating income of the engineered building systems segment increased to $11.6 million in the six months ended May 3, 2015, compared to $1.7 million in the same period in the prior year. This $9.9 million increase resulted from higher sales prices noted above, and lower transportation costs, partially offset by lower volumes in the six months ended May 3, 2015.
Consolidated engineering, selling, general and administrative expenses, consisting of engineering, drafting, selling and administrative costs, increased to $135.9 million in the six months ended May 3, 2015, compared to $125.5 million in the same period in the prior year. As a percentage of sales, engineering, selling, general and administrative expenses were 19.9% for the six months ended May 3, 2015, as compared to 20.4% for the six months ended May 4, 2014. The $10.4 million increase in engineering, selling and administrative expenses was primarily due to the inclusion of CENTRIA, which contributed $9.8 million of engineering, selling, general and administrative expenses since January 16, 2015 when CENTRIA was acquired.
Consolidated intangible amortization increased to $5.9 million in the six months ended May 3, 2015, compared to $2.0 million in the same period in the prior year. This increase is directly related to the valuation of intangible assets related to the CENTRIA Acquisition on January 16, 2015. Intangible amortization amounts for the six months ended May 4, 2014 related to prior acquisitions, including Metl-Span.
Consolidated strategic development and acquisition related costs for the six months ended May 3, 2015 were $2.4 million. These non-operational costs are related to acquisition-related activities that support our future growth targets and performance goals and include external legal and due diligence costs incurred to pursue specific acquisition targets, including CENTRIA. There was no corresponding amount recorded for the six months ended May 4, 2014.
Consolidated restructuring charges for the six months ended May 3, 2015 were $2.9 million. In January 2015, we announced plans to consolidate our six Tennessee manufacturing facilities in our engineered building systems segment, closing the Caryville operation. Our Lexington and Elizabethton facilities, both located approximately 125 miles from Caryville, will continue to serve our family of brands within the segment. We believe the leaner footprint will maximize efficiencies and improve supply chain management while increasing the concentration of product and service capabilities at the existing facilities. We have incurred severance and facility costs at the Caryville facility of approximately $1.6 million during the six months ended May 3, 2015. We completed the closing of the Caryville facility during March 2015. In addition, we incurred general severance costs of approximately $1.4 million, primarily in an effort to streamline our management and manufacturing structure to better serve our customers. There was no corresponding amount recorded for the six months ended May 4, 2014.
| 28 |
Consolidated interest expense increased to $12.3 million for the six months ended May 3, 2015, compared to $6.2 million for the same period of the prior year. On January 16, 2015, we issued $250.0 million in aggregate principal amount of 8.25% senior notes due 2023 to fund the CENTRIA Acquisition, which increased our consolidated interest expense.
Consolidated foreign exchange loss, increased to $1.4 million for the six months ended May 3, 2015, compared to $0.4 million for the same period of the prior year primarily due to foreign currency losses in both Mexico and Canada related to fluctuations in the Mexican Peso and Canadian Dollar, relative to the U.S. Dollar exchange rate in the current period.
Consolidated benefit from income taxes was $4.6 million for the six months ended May 3, 2015, compared to a $5.6 million benefit for the same period in the prior year. The effective tax rate for the six months ended May 3, 2015 was 37.0%, compared to 37.8% for the same period in the prior year. The decrease in the effective tax rate was primarily the result of an increase in the benefit related to the domestic production activities deduction and a decrease in the detriment related to non-deductible expenses partially offset by a true-up to the fiscal 2014 income tax provision as a result of the Tax Increase Prevention Act of 2014 that changed our fiscal 2014 tax calculation but was not signed into law until after our fiscal year had ended.
Diluted loss per common share improved to $(0.11) per diluted common share for the six months ended May 3, 2015, compared to a loss of $(0.13) per diluted common share for the same period in the prior year. The improvement in diluted loss per common share was primarily due to the $1.4 million improvement in net loss resulting from the factors described above in this section.
LIQUIDITY AND CAPITAL RESOURCES
General
Our cash and cash equivalents declined from $66.7 million to $25.3 million during the six months ended May 3, 2015. The following table summarizes our consolidated cash flows for the six months ended May 3, 2015 and May 4, 2014 (dollars in thousands):
| Fiscal Six Months Ended | ||||||||
| May 3, 2015 | May 4, 2014 | |||||||
| Net cash used in operating activities | (3,301 | ) | (31,253 | ) | ||||
| Net cash used in investing activities | (256,404 | ) | (8,693 | ) | ||||
| Net cash provided by (used in) financing activities | 218,664 | (24,801 | ) | |||||
| Effect of exchange rate changes on cash and cash equivalents | (334 | ) | (221 | ) | ||||
| Net decrease in cash and cash equivalents | (41,375 | ) | (64,968 | ) | ||||
| Cash and cash equivalents at beginning of period | 66,651 | 77,436 | ||||||
| Cash and cash equivalents at end of period | $ | 25,276 | $ | 12,468 | ||||
Operating Activities
Our business is both seasonal and cyclical and cash flows from operating activities may fluctuate during the year and from year to year due to economic conditions. We rely on cash and short-term borrowings to meet cyclical and seasonal increases in working capital needs. These needs generally rise during periods of increased economic activity or increasing raw material prices due to higher levels of inventory and accounts receivable. During economic slowdowns, or periods of decreasing raw material costs, working capital needs generally decrease as a result of the reduction of inventories and accounts receivable.
Net cash used in operating activities was $3.3 million during the six months ended May 3, 2015 compared to $31.3 million of net cash used in operating activities in the comparable period of fiscal 2014. Our primary use of cash in operating activities was for working capital needs, with net use of cash being partially offset by the improvement in the net loss over the comparable period of the prior year.
The primary driver for our decreased use of cash for working capital needs was the result of $25.0 million in our cash used for accounts payable during the six months ended May 3, 2015 compared to a use of $43.6 million in the comparable period of the prior year. Our vendor payments can significantly fluctuate based on the timing of disbursements, inventory purchases and vendor payment terms. Our days payable outstanding (“DPO”) as of May 3, 2015 increased to 36.2 days compared to 33.3 days at May 4, 2014.
| 29 |
Cash generated during the period due to changes in inventory was $1.7 million for the six months ended May 3, 2015 which was higher than the $14.1 million used to invest in inventory in the comparable period of the prior year. The increase in cash generated was driven by lower than anticipated volumes. Our days inventory on-hand (“DIO”) was 52.8 days as of May 3, 2015 as compared to 51.3 days at May 4, 2014.
Cash generated from accounts receivable was $30.3 million in the current six month period compared to $25.1 million in the comparable period of the prior year. This increase was driven by the timing of receipts and by year-over-year revenue growth but was partially offset by an increase in days sales outstanding (“DSO”) to 36.5 days as of May 3, 2015 from 33.2 days at May 4, 2014 as a result of slower timing of customer payments during the current six month period.
Investing Activities
Cash used in investing activities of $256.4 million during the six months ended May 3, 2015 was higher than the $8.7 million invested in the comparable period of the prior year and primarily attributable to the $247.1 million in purchase price, net of cash acquired, for the CENTRIA Acquisition in the current period. In the six months ended May 3, 2015, $9.3 million was used for capital expenditures predominantly related to computer software and machinery and equipment. In the six months ended May 4, 2014, $10.0 million was used for capital expenditures predominantly related to a new insulated panel system line, machinery and equipment and computer software.
Financing Activities
Cash provided by financing activities increased to $218.7 million from $24.8 million of cash used in financing activities in the comparable prior year period. The $218.7 million provided by financing activities during the six months ended May 3, 2015 was primarily attributable to the net proceeds to us of the issuance of $250.0 million in aggregate principal amount of 8.25% senior notes due 2023 to fund the CENTRIA Acquisition, partially offset by $21.2 million of payments of principal and interest on our term loan and $8.9 million of payments for financing costs. The $24.8 million of cash used in financing activities during the six months ended May 4, 2014 was primarily attributable to the purchase of Common Stock in the amount of $23.7 million paid to the CD&R Funds (as defined below) in connection with the Stock Repurchase (as defined below) and $1.2 million of payments made to reduce our outstanding term loan, partially offset by $0.8 of excess tax benefits from share-based compensation arrangements during the six months ended May 4, 2014.
We invest our excess cash in various overnight investments which are issued or guaranteed by the U.S. federal government.
CD&R Funds
The CD&R Funds own 43,211,817 of our shares as of May 3, 2015, representing approximately 58.6% of our outstanding Common Stock.
On January 15, 2014, the CD&R Funds completed a registered underwritten offering, in which the CD&R Funds offered 8.5 million shares of Common Stock at a price to the public of $18.00 per share (the “Secondary Offering”). The underwriters for the Secondary Offering also exercised their option to purchase 1.275 million additional shares of Common Stock. The aggregate offering price for the 9.775 million shares sold in the Secondary Offering was approximately $167.6 million, net of underwriting discounts and commissions. The CD&R Funds received all of the proceeds from the Secondary Offering and no shares in the Secondary Offering were sold by NCI or any of its officers or directors (although certain of our directors are affiliated with the CD&R Funds). In connection with this Secondary Offering, we incurred approximately $0.8 million in expenses, which were included in engineering, selling, general and administrative expenses in the consolidated statement of operations for fiscal 2014. At May 3, 2015 and November 2, 2014, the CD&R Funds beneficially owned 58.6% and 58.8%, respectively, of the voting power and Common Stock of the Company.
On January 6, 2014, NCI entered into an agreement with the CD&R Funds to repurchase 1.15 million shares of its Common Stock at the price per share equal to the price per share paid by the underwriters to the CD&R Funds in the underwritten offering (the “Stock Repurchase”). The Stock Repurchase, which was completed at the same time as the Secondary Offering, represented a private, non-underwritten transaction between NCI and the CD&R Funds that was approved and recommended by the Affiliate Transactions Committee of NCI’s board of directors. Following completion of the Stock Repurchase, NCI canceled the shares repurchased from the CD&R Funds, resulting in a $19.7 million decrease in both additional paid in capital and treasury stock. For a description of the CD&R Funds’ investment in our Common Stock, see Note 14 — CD&R Funds to the consolidated financial statements.
| 30 |
Debt
On January 16, 2015, the Company issued $250.0 million in aggregate principal amount of 8.25% senior notes due 2023 (the “Notes”) to fund the CENTRIA Acquisition. Interest on the Notes will accrue at the rate of 8.25% per annum and will be payable semi-annually in arrears on January 15 and July 15, commencing on July 15, 2015. The Notes are guaranteed on a senior unsecured basis by all of the Company’s existing and future domestic subsidiaries that guarantee the Company’s obligations (including by reason of being a borrower under the senior secured asset-based revolving credit facility on a joint and several basis with the Company or a guarantor subsidiary) under the senior secured credit facilities.
On June 24, 2013, the Company entered into Amendment No. 1 (the “Amendment”) to its existing Credit Agreement (the “Credit Agreement”), dated as of June 22, 2012, between NCI, as borrower, and Credit Suisse AG, Cayman Islands Branch, as administrative agent and collateral agent and the other financial institutions party thereto from time to time (the “Term Loan Facility”), primarily to extend the maturity date and reduce the interest rate applicable to all of the outstanding term loans under the Term Loan Facility. At May 3, 2015 and November 2, 2014, amounts outstanding under the Credit Agreement were $214.1 million and $235.4 million, respectively.
Pursuant to the Amendment, the maturity date of the $238 million of outstanding term loans (the “Initial Term Loans”) was extended and such loans were converted into a new tranche of term loans (the “Tranche B Term Loans”) that will mature on June 24, 2019 and, prior to such date, will amortize in nominal quarterly installments equal to one percent of the aggregate initial principal amount thereof per annum. At both May 3, 2015 and November 2, 2014, the interest rate on the term loan under our Credit Agreement was 4.25%.
In addition to our Credit Agreement, we have entered into the Amended ABL Facility which allows aggregate maximum borrowings of up to $150.0 million. Borrowing availability on the Amended ABL Facility is determined by a monthly borrowing base collateral calculation that is based on specified percentages of the value of qualified cash, eligible inventory and eligible accounts receivable, less certain reserves and subject to certain other adjustments. The Amended ABL Facility has a maturity of June 24, 2019 and includes borrowing capacity of up to $30 million for letters of credit and up to $10 million for swingline borrowings.
8.25% Senior Notes Due January 2023. On January 16, 2015, the Company issued $250.0 million in aggregate principal amount of 8.25% senior notes due 2023 to fund the CENTRIA Acquisition. Interest on the Notes will accrue at the rate of 8.25% per annum and will be payable semi-annually in arrears on January 15 and July 15, commencing on July 15, 2015. The Notes are guaranteed on a senior unsecured basis by all of the Company’s existing and future domestic subsidiaries that guarantee the Company’s obligations (including by reason of being a borrower under the senior secured asset-based revolving credit facility on a joint and several basis with the Company or a guarantor subsidiary) under the senior secured credit facilities. The Notes are unsecured senior indebtedness and rank equally in right of payment with all of the Company’s existing and future senior indebtedness and senior in right of payment to all of its future subordinated obligations. In addition, the Notes and guarantees are structurally subordinated to all existing and future indebtedness and other liabilities of the Company’s non-guarantor subsidiaries.
The Company may redeem the Notes at any time prior to January 15, 2018, at a price equal to 100% of the principal amount thereof, plus accrued and unpaid interest, if any, to the redemption date, plus the applicable make-whole premium. On or after January 15, 2018, the Company may redeem all or a part of the Notes at redemption prices (expressed as percentages of principal amount thereof) equal to 106.188% for the twelve-month period beginning on January 15, 2018, 104.125% for the twelve-month period beginning on January 15, 2019, 102.063% for the twelve-month period beginning on January 15, 2020 and 100.000% for the twelve-month period beginning on January 15, 2021 and at any time thereafter, plus accrued and unpaid interest, if any, to the applicable redemption date of the Notes. In addition, prior to January 15, 2018, the Company may redeem the Notes in an aggregate principal amount equal to up to 40.0% of the original aggregate principal amount of the Notes with funds in an equal aggregate amount not exceeding the aggregate proceeds of one or more equity offerings, at a redemption price of 108.250%, plus accrued and unpaid interest, if any, to the applicable redemption date of the Notes. The Company incurred $9.2 million in transaction costs related to this issuance which will be amortized over 8 years.
Credit Agreement. On June 22, 2012, in connection with the acquisition of Metl-Span LLC, a Texas limited liability company (the “Metl-Span Acquisition”), the Company entered into a Credit Agreement among the Company, as Borrower, Credit Suisse AG, Cayman Islands Branch, as Administrative Agent and Collateral Agent (the “Term Agent”), and the lenders party thereto. The Credit Agreement provided for a term loan credit facility in an aggregate principal amount of $250.0 million. The Credit Agreement was issued at 95% of face value, which resulted in a note discount of $12.5 million. Prior to the Amendment, the note discount was amortized over the life of the loan through May 2, 2018 using the effective interest method.
The Company’s obligations under the Credit Agreement and designated cash management arrangements and hedging agreements, if any, will be irrevocably and unconditionally guaranteed on a joint and several basis by each direct and indirect wholly owned domestic subsidiary of the Company (other than any domestic subsidiary that is a foreign subsidiary holding company or a subsidiary of a foreign subsidiary and certain other excluded subsidiaries).
| 31 |
The obligations under the Credit Agreement and the designated cash management arrangements and hedging agreements, if any, and the guarantees thereof are secured pursuant to a guarantee and collateral agreement, dated as of June 22, 2012 (the “Guarantee and Collateral Agreement”), made by the Company and other Grantors (as defined therein), in favor of the Term Agent, by (i) all of the capital stock of all direct domestic subsidiaries owned by the Company and the guarantors, (ii) up to 65% of the capital stock of certain direct foreign subsidiaries owned by the Company or any guarantor (it being understood that a foreign subsidiary holding company or a domestic subsidiary of a foreign subsidiary will be deemed a foreign subsidiary), and (iii) substantially all other tangible and intangible assets owned by the Company and each guarantor, in each case to the extent permitted by applicable law and subject to certain exceptions.
The Credit Agreement contains a number of covenants that, among other things, will limit or restrict the ability of the Company and its subsidiaries to dispose of assets, incur additional indebtedness, make dividends and other restricted payments, create liens securing indebtedness, engage in mergers and other fundamental transactions, enter into restrictive agreements, amend certain documents in respect of other indebtedness, change the nature of their business and engage in certain transactions with affiliates.
On June 24, 2013, the Company entered into the Amendment to the Credit Agreement, dated as of June 22, 2012, between NCI, as borrower, and Credit Suisse AG, Cayman Islands Branch, as administrative agent and collateral agent and the other financial institutions party thereto from time to time (the “Term Loan Facility”), primarily to extend the maturity date and reduce the interest rate applicable to all of the outstanding term loans under the Term Loan Facility. At May 3, 2015 and November 2, 2014, amounts outstanding under the Credit Agreement were $214.1 million and $235.4 million, respectively. As a result of the Amendment, in fiscal 2013, we recognized a one-time debt extinguishment charge of approximately $21.5 million related to the write-off of non-cash existing deferred issuance costs, non-cash initial debt discount write-off, pre-payment penalty and fees to the creditors.
Pursuant to the Amendment, the maturity date of the $238 million of outstanding Initial Term Loans was extended and such loans were converted into the Tranche B Term Loans that will mature on June 24, 2019 and, prior to such date, will amortize in nominal quarterly installments equal to one percent of the aggregate initial principal amount thereof per annum. Pursuant to the Amendment, the Tranche B Term Loans will bear interest at a floating rate measured by reference to, at the Company’s option, either (i) an adjusted LIBOR not less than 1.00% plus a borrowing margin of 3.25% per annum or (ii) an alternate base rate plus a borrowing margin of 2.25% per annum. At both May 3, 2015 and November 2, 2014, the interest rate on the term loan under our Credit Agreement was 4.25%. Overdue amounts will bear interest at a rate that is 2% higher than the rate otherwise applicable.
The Tranche B Term Loans are secured by the same collateral and guaranteed by the same guarantors as the Initial Term Loans under the Term Loan Facility. Voluntary prepayments of the Tranche B Term Loans are permitted at any time, in minimum principal amounts, without premium or penalty, subject to a 1.00% premium payable in connection with certain repricing transactions within the first six months.
Pursuant to the Amendment, the Company will no longer be subject to a financial covenant requiring us to maintain a specified consolidated secured debt to EBITDA leverage ratio for specified periods. The Amendment also includes certain other changes to the Term Loan Facility.
Subject to certain exceptions, the term loan under the Amendment will be subject to mandatory prepayment in an amount equal to:
| • | the net cash proceeds of (1) certain asset sales, (2) certain debt offerings, and (3) certain insurance recovery and condemnation events; and |
| • | 50% of annual excess cash flow (as defined in the Amendment), subject to reduction to 0% if specified leverage ratio targets are met. |
The Credit Agreement contains customary events of default, including non-payment of principal, interest or fees, violation of covenants, material inaccuracy of representations or warranties, cross default and cross acceleration to certain other material indebtedness, certain bankruptcy events, certain ERISA events, material invalidity of security interest, material judgments, and change of control.
The Credit Agreement also provides that the Company has the right at any time to request incremental commitments under one or more incremental term loan facilities or incremental revolving loan facilities, subject to compliance with a pro forma consolidated secured net debt to EBITDA leverage ratio. The lenders under the Credit Agreement will not be under any obligation to provide any such incremental commitments, and any such addition of or increase in commitments will be subject to pro forma compliance with customary conditions.
In connection with the execution of the Credit Agreement the Company, certain of the Company’s subsidiaries, Wells Fargo Capital Finance, LLC, as administrative agent (the “ABL Agent”) under the Company’s Amended ABL Facility (as defined below), and the Term Agent entered into an amendment (the “Intercreditor Agreement Amendment”) to the Company’s existing Intercreditor Agreement, dated as of October 20, 2009, providing for, among other things, the obligations under the Credit Agreement to become subject to the provisions of the Intercreditor Agreement.
| 32 |
Amended ABL Facility. On May 2, 2012, we entered into the Amended Asset-Based Lending Facility (the “Amended ABL Facility”) to (i) permit the acquisition, the entry by the Company into the Credit Agreement and the incurrence of debt thereunder and the repayment of existing indebtedness under NCI’s existing Term Loan, (ii) increase the amount available for borrowing thereunder to $150 million (subject to a borrowing base), (iii) increase the amount available for letters of credit thereunder to $30 million, and (iv) extend the final maturity thereunder.
On November 7, 2014, the Company, Steelbuilding.com, LLC (together with the Company, the “Guarantors”) and the Company’s subsidiaries NCI Group, Inc. and Robertson-Ceco II Corporation (each a “Borrower” and collectively, the “Borrowers”) entered into Amendment No. 3 to the Loan and Security Agreement (the “ABL Loan and Security Agreement”) among the Borrowers, the Guarantors, Wells Fargo Capital Finance, LLC as administrative agent and co-collateral agent, Bank of America, N.A. as co-collateral agent and syndication agent and certain other lenders under the ABL Loan and Security Agreement, in order to amend the ABL Loan and Security Agreement to (i) permit the CENTRIA Acquisition, (ii) permit the entry by the Company into documentation with respect to certain debt financing to be incurred in connection with the CENTRIA Acquisition and the incurrence of debt with respect thereto, (iii) extend the maturity date to June 24, 2019, (iv) decrease the applicable margin with respect to borrowings thereunder and (v) make certain other amendments and modifications to provide greater operational and financial flexibility.
The Amended ABL Facility provides for an asset-based revolving credit facility which allows aggregate maximum borrowings by NCI Group, Inc. and Robertson-Ceco II Corporation of up to $150.0 million. Borrowing availability under the Amended ABL Facility is determined by a monthly borrowing base collateral calculation that is based on specified percentages of the value of qualified cash, eligible inventory and eligible accounts receivable, less certain reserves and subject to certain other adjustments. At May 3, 2015 and November 2, 2014, our excess availability under the Amended ABL Facility was $114.8 million and $135.4 million, respectively. At both May 3, 2015 and November 2, 2014, we had no revolving loans outstanding under the Amended ABL Facility. In addition, at May 3, 2015 and November 2, 2014, standby letters of credit related to certain insurance policies totaling approximately $9.3 million and $8.1 million were outstanding but undrawn under the Amended ABL Facility.
An unused commitment fee is paid monthly on the Amended ABL Facility at an annual rate of 0.50% based on the amount by which the maximum credit exceeds the average daily principal balance of outstanding loans and letter of credit obligations. Additional customary fees in connection with the Amended ABL Facility also apply.
The obligations of the borrowers under the Amended ABL Facility are guaranteed by the Company and each direct and indirect domestic subsidiary of the Company (other than any domestic subsidiary that is a foreign subsidiary holding company or a subsidiary of a foreign subsidiary that is insignificant) that is not a borrower under the Amended ABL Facility. The obligations of the Company under certain specified bank products agreements are guaranteed by each borrower and each other direct and indirect domestic subsidiary of the Company and the other guarantors. These guarantees are made pursuant to a guarantee agreement, dated as of October 20, 2009, entered into by the Company and each other guarantor with Wells Fargo Capital Finance, LLC (formerly known as Wells Fargo Foothill, LLC), as administrative agent. In connection with the Metl-Span Acquisition, Metl-Span became a borrower under the ABL Facility, and the Company, certain subsidiaries of the Company, and the ABL Agent entered into an amendment (the “ABL Guaranty Amendment”) to the Company’s existing Guaranty Agreement, dated as of October 20, 2009, providing for, among other things, the guarantee of the obligations of Metl-Span under the Amended ABL Facility.
The obligations under the Amended ABL Facility, and the guarantees thereof, are secured by a first priority lien on our accounts receivable, inventory, certain deposit accounts, associated intangibles and certain other specified assets of the Company and a second priority lien on the assets securing the term loan under the Credit Agreement on a first-lien basis, in each case subject to certain exceptions.
The Amended ABL Facility contains a number of covenants that, among other things, limit or restrict our ability to dispose of assets, incur additional indebtedness, incur guarantee obligations, engage in sale and leaseback transactions, prepay other indebtedness, modify organizational documents and certain other agreements, create restrictions affecting subsidiaries, make dividends and other restricted payments, create liens, make investments, make acquisitions, engage in mergers, change the nature of our business and engage in certain transactions with affiliates.
Under the Amended ABL Facility, a “Dominion Event” occurs if either an event of default is continuing or excess availability falls below certain levels, during which period, and for certain periods thereafter, the administrative agent may apply all amounts in the Company’s, the borrowers’ and the other guarantors’ concentration accounts to the repayment of the loans outstanding under the Amended ABL Facility, subject to the Intercreditor Agreement and certain specified exceptions. In addition, during such Dominion Event, we are required to make mandatory payments on our Amended ABL Facility upon the occurrence of certain events, including the sale of assets and the issuance of debt, in each case subject to certain limitations and conditions set forth in the Amended ABL Facility.
| 33 |
The Amended ABL Facility includes a minimum fixed charge coverage ratio of one to one, which will apply if we fail to maintain a specified minimum borrowing capacity. The minimum level of borrowing capacity as of May 3, 2015 and November 2, 2014 was $17.2 million and $20.3 million, respectively. Although our Amended ABL Facility did not require any financial covenant compliance, at May 3, 2015 and November 2, 2014, our fixed charge coverage ratio as of those dates, which is calculated on a trailing twelve month basis, was 5.24:1.00 and 3.46:1.00, respectively. These ratios include the pro forma impact of the CENTRIA Acquisition.
Loans under the Amended ABL Facility bear interest, at our option, as follows:
| (1) | Base Rate loans at the Base Rate plus a margin. “Base Rate” is defined as the higher of the Wells Fargo Bank, N.A. prime rate and the overnight Federal Funds rate plus 0.5% and “LIBOR” is defined as the applicable London Interbank Offered Rate adjusted for reserves. The margin ranges from 1.50% to 2.00% depending on the quarterly average excess availability under such facility, and |
| (2) | LIBOR loans at LIBOR plus a margin. The margin ranges from 2.50% to 3.00% depending on the quarterly average excess availability under such facility. |
At May 3, 2015 and November 2, 2014, the interest rate on our Amended ABL Facility was 4.00% and 4.75%, respectively. During an event of default, loans under the Amended ABL Facility will bear interest at a rate that is 2% higher than the rate otherwise applicable.
Cash Flow
We periodically evaluate our liquidity requirements, capital needs and availability of resources in view of inventory levels, expansion plans, debt service requirements and other operating cash needs. To meet our short- and long-term liquidity requirements, including payment of operating expenses and repaying debt, we rely primarily on cash from operations. Beyond cash generated from operations, most of our Amended ABL Facility is undrawn with $114.8 million available at May 3, 2015 and $25.3 million of cash at May 3, 2015. However, we have in the past, sought to raise additional capital.
We expect that, for the next 12 months, cash generated from operations and our Amended ABL Facility will be sufficient to provide us the ability to fund our operations, provide the increased working capital necessary to support our strategy and fund planned capital expenditures of between approximately $17 million and $21 million for the remainder of fiscal 2015 and expansion when needed.
In the past, we have used available funds to repurchase shares of our Common Stock under our stock repurchase program. Although we did not purchase any Common Stock during the second quarter of fiscal 2015 under our stock repurchase program, we did withhold shares of restricted stock to satisfy minimum tax withholding obligations arising in connection with the vesting of awards of restricted stock related to our 2003 Long-Term Stock Incentive Plan.
On January 6, 2014, NCI entered into an agreement with the CD&R Funds to repurchase 1.15 million shares of its Common Stock at the price per share equal to the price per share paid by the underwriters to the CD&R Funds in the underwritten offering (the “Stock Repurchase”). The Stock Repurchase, which was completed at the same time as the Secondary Offering, represented a private, non-underwritten transaction between NCI and the CD&R Funds that was approved and recommended by the Affiliate Transactions Committee of NCI’s board of directors. Following completion of the Stock Repurchase, NCI canceled the shares repurchased from the CD&R Funds.
Our corporate strategy seeks potential acquisitions that would provide additional synergies in our metal coil coating, metal components and engineered building systems segments. From time to time, we may enter into letters of intent or agreements to acquire assets or companies in these business lines. The consummation of these transactions could require substantial cash payments and/or issuance of additional debt. See “— Acquisition of CENTRIA” below.
The Company may repurchase or otherwise retire the Company’s debt and take other steps to reduce the Company’s debt or otherwise improve the Company’s financial position. These actions could include open market debt repurchases, negotiated repurchases, other retirements of outstanding debt and opportunistic refinancing of debt. The amount of debt that may be repurchased or otherwise retired, if any, will depend on market conditions, trading levels of the Company’s debt, the Company’s cash position, compliance with debt covenants and other considerations. Affiliates of the Company may also purchase the Company’s debt from time to time, through open market purchases or other transactions. In such cases, the Company’s debt may not be retired, in which case the Company would continue to pay interest in accordance with the terms of the debt, and the Company would continue to reflect the debt as outstanding in its consolidated balance sheets.
| 34 |
We have entered into a cash collateral agreement with PNC Bank to backstop existing CENTRIA letters of credit until they expire. The restricted cash is held in a bank account with PNC Bank as the secured party. As of May 3, 2015, we had restricted cash in the amount of approximately $1.0 million as collateral related to our letters of credit for international projects with CENTRIA, exclusive of letters of credit under our Amended ABL Facility. Any renewal or replacement of the CENTRIA letters of credit is expected to occur under our Amended ABL Facility.
Acquisition of CENTRIA
On January 16, 2015, NCI Group, Inc., a wholly-owned subsidiary of the Company, and Steelbuilding.com, LLC. a wholly owned subsidiary of NCI Group, Inc., completed the acquisition of CENTRIA (the “CENTRIA Acquisition”), a Pennsylvania general partnership (“CENTRIA”), pursuant to the terms of the Interest Purchase Agreement, dated November 7, 2014 (“Interest Purchase Agreement”) with SMST Management Corp., a Pennsylvania corporation, Riverfront Capital Fund, a Pennsylvania limited partnership, and CENTRIA. NCI acquired all of the general partnership interests of CENTRIA in exchange for $255.8 million in cash. The purchase price is subject to a post-closing adjustment to net working capital as provided in the Interest Purchase Agreement. The purchase price was funded through the issuance of $250.0 million of net indebtedness. CENTRIA is now an indirect, wholly-owned subsidiary of NCI.
Accordingly, the results of CENTRIA’s operations from January 16, 2015 are included in our consolidated financial statements. CENTRIA is a leader in the design, engineering and manufacturing of architectural insulated metal panel (“IMP”) wall and roof systems and a provider of integrated coil coating services for the nonresidential construction industry. CENTRIA operates four production facilities in the United States and a manufacturing facility in China. See Note 2 — Acquisition to the consolidated financial statements for more information on the CENTRIA Acquisition.
NON-GAAP MEASURES
Set forth below are certain non-GAAP measures which include “adjusted” operating income (loss), adjusted EBITDA, adjusted net income (loss) per diluted common share and “adjusted” net income (loss) applicable to common shares. We define adjusted EBITDA as net income (loss) before interest expense, income tax expense (benefit) and depreciation and amortization, adjusted for items broadly consisting of selected items which management does not consider representative of our ongoing operations and certain non-cash items of the Company. Such measurements are not prepared in accordance with U.S. GAAP and should not be construed as an alternative to reported results determined in accordance with U.S. GAAP. Management believes the use of such non-GAAP measures on a consolidated and operating segment basis assists investors in understanding the ongoing operating performance by presenting the financial results between periods on a more comparable basis. You are encouraged to evaluate these adjustments and the reasons we consider them appropriate for supplemental analysis. In evaluating these measures, you should be aware that in the future we may incur expenses that are the same as, or similar to, some of the adjustments in these non-GAAP measures. In addition, certain financial calculations under our Credit Agreement, Amended ABL Facility and the Notes are based on similar non-GAAP measures. The non-GAAP information provided is unique to the Company and may not be consistent with the methodologies used by other companies. The following tables reconcile adjusted operating income (loss) to operating income (loss) for the periods indicated (in thousands):
| For the Three Months Ended May 3, 2015 | ||||||||||||||||||||
| Metal Coil Coating | Metal Components | Engineered Building Systems | Corporate | Consolidated | ||||||||||||||||
| Operating income (loss), GAAP basis | $ | 2,397 | $ | 6,941 | $ | 2,855 | $ | (15,810 | ) | $ | (3,617 | ) | ||||||||
| Restructuring charges | 254 | 629 | 792 | (207 | ) | 1,468 | ||||||||||||||
| Strategic development and acquisition related costs | –– | –– | –– | 628 | 628 | |||||||||||||||
| Short lived acquisition method related fair value adjustments | –– | 3,109 | –– | –– | 3,109 | |||||||||||||||
| Adjusted operating income (loss) | $ | 2,651 | $ | 10,679 | $ | 3,647 | $ | (15,389 | ) | $ | 1,588 | |||||||||
| For the Three Months Ended May 4, 2014 | ||||||||||||||||||||
| Engineered | ||||||||||||||||||||
| Metal Coil | Metal | Building | ||||||||||||||||||
| Coating | Components | Systems | Corporate | Consolidated | ||||||||||||||||
| Operating income (loss), GAAP basis | $ | 3,893 | $ | 4,559 | $ | 36 | $ | (14,001 | ) | $ | (5,513 | ) | ||||||||
| Gain on insurance recovery | (324 | ) | –– | –– | –– | (324 | ) | |||||||||||||
| Secondary offering costs | –– | –– | –– | 50 | 50 | |||||||||||||||
| Adjusted operating income (loss) | $ | 3,569 | $ | 4,559 | $ | 36 | $ | (13,951 | ) | $ | (5,787 | ) | ||||||||
| 35 |
| For the Six Months Ended May 3, 2015 | ||||||||||||||||||||
| Engineered | ||||||||||||||||||||
| Metal Coil | Metal | Building | ||||||||||||||||||
| Coating | Components | Systems | Corporate | Consolidated | ||||||||||||||||
| Operating income (loss), GAAP basis | $ | 6,375 | $ | 15,277 | $ | 11,574 | $ | (32,272 | ) | $ | 954 | |||||||||
| Restructuring charges | 254 | 1,237 | 1,661 | (207 | ) | 2,945 | ||||||||||||||
| Strategic development and acquisition related costs | –– | –– | –– | 2,357 | 2,357 | |||||||||||||||
| Short lived acquisition method related fair value adjustments | –– | 4,081 | –– | –– | 4,081 | |||||||||||||||
| Adjusted operating income (loss) | $ | 6,629 | $ | 20,595 | $ | 13,235 | $ | (30,122 | ) | $ | 10,337 | |||||||||
| For the Six Months Ended May 4, 2014 | ||||||||||||||||||||
| Engineered | ||||||||||||||||||||
| Metal Coil | Metal | Building | ||||||||||||||||||
| Coating | Components | Systems | Corporate | Consolidated | ||||||||||||||||
| Operating income (loss), GAAP basis | $ | 10,388 | $ | 8,670 | $ | 1,676 | $ | (29,415 | ) | $ | (8,681 | ) | ||||||||
| Gain on insurance recovery | (1,311 | ) | –– | –– | –– | (1,311 | ) | |||||||||||||
| Secondary offering costs | –– | –– | –– | 754 | 754 | |||||||||||||||
| Adjusted operating income (loss) | $ | 9,077 | $ | 8,670 | $ | 1,676 | $ | (28,661 | ) | $ | (9,238 | ) | ||||||||
The following tables reconcile adjusted EBITDA to Net income (loss) for the periods indicated (in thousands):
| 3rd Quarter August 3, 2014 | 4th Quarter November 2, 2014 | 1st Quarter February 1, 2015 | 2nd Quarter May 3, 2015 | Trailing 12 Months May 3, 2015 | ||||||||||||||||
| Net income (loss) | $ | 6,089 | $ | 14,259 | $ | (320 | ) | $ | (7,488 | ) | $ | 12,540 | ||||||||
| Add: | ||||||||||||||||||||
| Depreciation and amortization | 8,994 | 9,220 | 9,731 | 13,766 | 41,711 | |||||||||||||||
| Consolidated interest expense, net | 3,142 | 3,053 | 3,980 | 8,280 | 18,455 | |||||||||||||||
| Provision (benefit) for income taxes | 2,837 | 4,215 | (490 | ) | (4,087 | ) | 2,475 | |||||||||||||
| Restructuring charges | –– | –– | 1,477 | 1,759 | 3,236 | |||||||||||||||
| Strategic development and acquisition related costs | 1,486 | 3,512 | 1,729 | 628 | 7,355 | |||||||||||||||
| Short lived acquisition method inventory fair value adjustments | –– | –– | 583 | 775 | 1,358 | |||||||||||||||
| Non-cash charges: | ||||||||||||||||||||
| Stock-based compensation | 2,404 | 2,022 | 2,933 | 2,201 | 9,560 | |||||||||||||||
| Adjusted EBITDA | $ | 24,952 | $ | 36,281 | $ | 19,623 | $ | 15,834 | $ | 96,690 | ||||||||||
| 3rd Quarter | 4th Quarter | 1st Quarter | 2nd Quarter | Trailing | ||||||||||||||||
| July 28, | November 3, | February 2, | May 4, | 12 Months | ||||||||||||||||
| 2013 | 2013 | 2014 | 2014 | May 4, 2014 | ||||||||||||||||
| Net income (loss) | $ | (12,192 | ) | $ | 8,276 | $ | (4,258 | ) | $ | (4,905 | ) | $ | (13,079 | ) | ||||||
| Add: | ||||||||||||||||||||
| Depreciation and amortization | 9,066 | 9,012 | 8,767 | 8,941 | 35,786 | |||||||||||||||
| Consolidated interest expense, net | 5,130 | 3,334 | 3,100 | 3,035 | 14,599 | |||||||||||||||
| Provision (benefit) for income taxes | (9,933 | ) | 5,410 | (2,506 | ) | (3,057 | ) | (10,086 | ) | |||||||||||
| Debt extinguishment costs, net | 21,491 | –– | –– | –– | 21,491 | |||||||||||||||
| Gain on insurance recovery | –– | (1,023 | ) | (987 | ) | (324 | ) | (2,334 | ) | |||||||||||
| Unreimbursed business interruption costs | –– | 500 | –– | –– | 500 | |||||||||||||||
| Secondary offering costs | –– | –– | 704 | 50 | 754 | |||||||||||||||
| Non-cash charges: | ||||||||||||||||||||
| Stock-based compensation | 3,448 | 4,565 | 3,179 | 2,563 | 13,755 | |||||||||||||||
| Embedded derivative | (50 | ) | –– | –– | –– | (50 | ) | |||||||||||||
| Adjusted EBITDA | $ | 16,960 | $ | 30,074 | $ | 7,999 | $ | 6,303 | $ | 61,336 | ||||||||||
| 36 |
The following tables reconcile adjusted diluted income (loss) per common share to loss per diluted common share and adjusted income (loss) applicable to common shares to loss applicable to common shares for the periods indicated (in thousands):
| Fiscal Three Months Ended | Fiscal Six Months Ended | |||||||||||||||
| May 3, 2015 | May 4, 2014 | May 3, 2015 | May 4, 2014 | |||||||||||||
| Net loss per diluted common share, GAAP basis | $ | (0.10 | ) | $ | (0.07 | ) | $ | (0.11 | ) | $ | (0.13 | ) | ||||
| Gain on insurance recovery, net of taxes | –– | (0.00 | ) | –– | (0.01 | ) | ||||||||||
| Secondary offering costs, net of taxes | –– | 0.00 | –– | 0.01 | ||||||||||||
| Foreign exchange loss (gain), net of taxes | –– | 0.00 | –– | 0.00 | ||||||||||||
| Strategic development and acquisition related costs, net of taxes | 0.00 | –– | 0.02 | –– | ||||||||||||
| Restructuring charges, net of taxes | 0.01 | –– | 0.03 | –– | ||||||||||||
| Short lived acquisition method related fair value adjustments, net of taxes | 0.03 | –– | 0.03 | –– | ||||||||||||
| Adjusted net loss per diluted common share | $ | (0.06 | ) | $ | (0.07 | ) | $ | (0.03 | ) | $ | (0.13 | ) | ||||
| Fiscal Three Months Ended | Fiscal Six Months Ended | |||||||||||||||
| May 3, 2015 | May 4, 2014 | May 3, 2015 | May 4, 2014 | |||||||||||||
| Net loss applicable to common shares, GAAP basis | $ | (7,488 | ) | $ | (4,905 | ) | $ | (7,808 | ) | $ | (9,163 | ) | ||||
| Gain on insurance recovery, net of taxes | –– | (199 | ) | –– | (807 | ) | ||||||||||
| Secondary offering costs, net of taxes | –– | 31 | –– | 465 | ||||||||||||
| Foreign exchange loss (gain), net of taxes | –– | (211 | ) | –– | 325 | |||||||||||
| Strategic development and acquisition related costs, net of taxes | 387 | –– | 1,452 | –– | ||||||||||||
| Restructuring charges, net of taxes | 904 | –– | 1,814 | –– | ||||||||||||
| Short lived acquisition method related fair value adjustments, net of taxes | 1,915 | –– | 2,514 | –– | ||||||||||||
| Adjusted net loss applicable to common shares | $ | (4,282 | ) | $ | (5,284 | ) | $ | (2,028 | ) | $ | (9,180 | ) | ||||
OFF-BALANCE SHEET ARRANGEMENTS
As part of our ongoing business, we do not participate in transactions that generate relationships with unconsolidated entities or financial partnerships, such as entities often referred to as structured finance or special purpose entities (“SPEs”), which would have been established for the purpose of facilitating off-balance sheet arrangements or other contractually narrow or limited purposes. As of May 3, 2015, we were not involved in any material unconsolidated SPE transactions.
CONTRACTUAL OBLIGATIONS
In general, purchase orders issued in the normal course of business can be terminated in whole or in part for any reason without liability until the product is received.
During the six months ended May 3, 2015, we committed to a natural gas purchase obligation at volumes expected to be used and based on a market index at one of our metal coil coating facilities totaling $0.5 million over the next year. There have been no other material changes in our future contractual obligations since the end of fiscal 2014 other than the normal expiration of existing contractual obligations and the changes to our contractual obligations as a result of the CENTRIA Acquisition on January 16, 2015. See Part 2, Item 7 of our Annual Report on Form 10-K for the fiscal year ended November 2, 2014 and Part I, Item 2 of our Quarterly Report on Form 10-Q for the quarterly period ended February 1, 2015 for more information on our contractual obligations. See Note 13 — Long-Term Debt and Note Payable to the consolidated financial statements for more information on the material terms of our Notes, Credit Agreement and Amended ABL Facility.
| 37 |
CRITICAL ACCOUNTING POLICIES
Critical accounting policies are those that are most important to the portrayal of our financial position and results of operations. These policies require our most subjective judgments, often employing the use of estimates about the effect of matters that are inherently uncertain. Our most critical accounting policies include those that pertain to revenue recognition, insurance accruals, share-based compensation, income taxes, accounting for acquisitions, intangible assets and goodwill, allowance for doubtful accounts, inventory valuation, property, plant and equipment valuation, contingencies, beneficial conversion features and dividend policy and convertible preferred stock extinguishment policy, which are described in Item 7 of our Annual Report on Form 10-K for the year ended November 2, 2014.
RECENT ACCOUNTING PRONOUNCEMENTS
In April 2014, the FASB issued ASU 2014-08, Presentation of Financial Statements (Topic 205) and Property, Plant, and Equipment (Topic 360): Reporting Discontinued Operations and Disclosures of Disposals of Components of an Entity. ASU 2014-08 changes the requirement for reporting discontinued operations. A disposal of a component of an entity or a group of components of an entity will be required to be reported in discontinued operations if the disposal represents a strategic shift that has or will have a major effect on an entity’s operations and financial results when the entity or group of components of an entity meets the criteria to be classified as held for sale or when it is disposed of by sale or other than by sale. The update also requires additional disclosures about discontinued operations, a disposal of an individually significant component of an entity that does not qualify for discontinued operations presentation in the financial statements, and an entity’s significant continuing involvement with a discontinued operation. This update is effective prospectively for our first quarter in fiscal 2016. Early adoption is permitted, but only for disposals (or classifications as held for sale) that have not been reported in previously issued financial statements. We are currently evaluating the potential impact of this authoritative guidance on our consolidated financial statements.
In May 2014, the FASB issued ASU 2014-09, Revenue from Contracts with Customers (Topic 606). ASU 2014-09 supersedes the revenue recognition requirements in ASC Topic 605, Revenue Recognition, and most industry-specific guidance. The core principle of the guidance is that an entity should recognize revenue to depict the transfer of promised goods or services to customers in an amount that reflects the consideration to which the entity expects to be entitled in exchange for those goods or services. This guidance is effective for our first quarter in fiscal 2018 under either full or modified retrospective adoption. Early application is not permitted. We are currently assessing the potential effects of these changes to our consolidated financial statements.
In June 2014, the FASB issued ASU 2014-12, Accounting for Share-Based Payments When the Terms of an Award Provide That a Performance Target Could Be Achieved after the Requisite Service Period. ASU 2014-12 requires that a performance target that affects vesting and could be achieved after the requisite service period be treated as a performance condition. A reporting entity should apply existing guidance in FASB Accounting Standards Codification 718, Compensation — Stock Compensation, as it relates to such awards. ASU 2014-12 is effective for our first quarter in fiscal 2017, with early adoption permitted. We do not expect that the adoption of this guidance will have a material impact on our consolidated financial statements.
In January 2015, the FASB issued ASU 2015-01, Income Statement — Extraordinary and Unusual Items (Subtopic 225-20): Simplifying Income Statement Presentation by Eliminating the Concept of Extraordinary Items. ASU 2015-01 eliminates from U.S. GAAP the concept of extraordinary items. The guidance is effective for our fiscal year ended October 29, 2017. A reporting entity may apply the amendments prospectively. We do not expect that the adoption of this guidance will have a material impact on our consolidated financial statements.
In April 2015, the FASB issued ASU 2015-03, Interest — Imputation of Interest (Subtopic 835-30): Simplifying the Presentation of Debt Issuance Costs. ASU 2015-03 requires debt issuance costs related to a recognized debt liability be presented in the balance sheet as a direct deduction from the carrying amount of the related debt liability instead of being presented as a separate asset. In circumstances where the costs are incurred before the debt liability is recorded, the costs will be reported on the balance sheet as an asset until the debt liability is recorded. Debt disclosures will include the face amount of the debt liability and the effective interest rate. The update requires retrospective application and is effective for our fiscal year ended October 29, 2017. Early adoption is permitted for financial statements that have not been previously issued. We do not expect that the adoption of this guidance will have a material impact on our consolidated financial statements.
In April 2015, the FASB issued ASU 2015-05, Intangibles — Goodwill and Other — Internal-Use Software (Subtopic 350-40): Customer's Accounting for Fees Paid in a Cloud Computing Arrangement. ASU 2015-05 provides guidance to customers about whether a cloud computing arrangement includes a software license. If a cloud computing arrangement includes a software license, the guidance specifies that the customer should account for the software license element of the arrangement consistent with the acquisition of other software licenses. ASU 2015-05 further specifies that the customer should account for a cloud computing arrangement as a service contract if the arrangement does not include a software license. The guidance is effective for our fiscal year ended October 29, 2017. We are currently assessing the impact of this guidance on our consolidated financial statements.
| 38 |
Item 3. Quantitative and Qualitative Disclosures About Market Risk.
Steel Prices
We are subject to market risk exposure related to volatility in the price of steel. For the fiscal three months ended May 3, 2015, steel constituted approximately 69% of our cost of sales. Our business is heavily dependent on the price and supply of steel. Our various products are fabricated from steel produced by mills to forms including bars, plates, structural shapes, sheets, hot-rolled coils and galvanized or Galvalume® — coated coils1. The steel industry is highly cyclical in nature, and steel prices have been volatile in recent years and may remain volatile in the future. Steel prices are influenced by numerous factors beyond our control, including general economic conditions, domestically and internationally, the availability of raw materials, competition, labor costs, freight and transportation costs, production costs, import duties and other trade restrictions. Based on the cyclical nature of the steel industry, we expect steel prices will continue to be volatile. Although we have the ability to purchase steel from a number of suppliers, a production cutback by one or more of our current suppliers could create challenges in meeting delivery schedules to our customers. Because we have periodically adjusted our contract prices, particularly in the engineered building systems segment, we have generally been able to pass increases in our raw material costs through to our customers. The graph below shows the monthly CRU Index data for the North American Steel Price Index over the historical five-year period. The CRU North American Steel Price Index has been published by the CRU Group since 1994 and we believe this index appropriately depicts the volatility we have experienced in steel prices. The index, based on a CRU survey of industry participants, is now commonly used in the settlement of physical and financial contracts in the steel industry. The prices surveyed are purchases for forward delivery, according to lead time, which will vary. For example, the January index would likely approximate our fiscal March steel purchase deliveries based on current lead-times. The volatility in this steel price index is comparable to the volatility we experience in our average cost of steel.
| 1 | Galvalume® is a registered trademark of Biec International, Inc. |
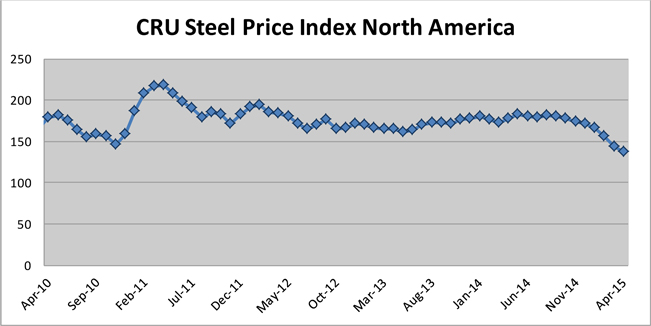
Source: www.crugroup.com
We normally do not maintain an inventory of steel in excess of our current production requirements. However, from time to time, we may purchase steel in advance of announced steel price increases. In addition, it is our current practice to purchase all steel inventory that has been ordered but is not in our possession. Therefore, our inventory may increase if demand for our products declines. We can give no assurance that steel will remain available or that prices will not continue to be volatile.
With steel accounting for approximately 69% of our cost of sales for the fiscal six months ended May 3, 2015, a one percent change in the cost of steel would have resulted in a pre-tax impact on cost of sales of approximately $3.7 million for the six months ended May 3, 2015, if such costs were not passed on to our customers. The impact to our financial results of operations would be significantly dependent on the competitive environment and the costs of other alternative building products, which could impact our ability to pass on these higher costs.
| 39 |
Other Commodity Risks
In addition to market risk exposure related to the volatility in the price of steel, we are subject to market risk exposure related to volatility in the price of natural gas. As a result, we occasionally enter into both index-priced and fixed-price contracts for the purchase of natural gas. We have evaluated these contracts to determine whether the contracts are derivative instruments. Certain contracts that meet the criteria for characterization as a derivative instrument may be exempted from hedge accounting treatment as normal purchases and normal sales and, therefore, these forward contracts are not marked to market. At May 3, 2015, all of our contracts for the purchase of natural gas met the scope exemption for normal purchases and normal sales.
Interest Rates
We are subject to market risk exposure related to changes in interest rates on our Credit Agreement and the Amended ABL Facility. These instruments bear interest at an agreed upon percentage point spread from either the prime interest rate or LIBOR. Under our Credit Agreement, we may, at our option, fix the interest rate for certain borrowings based on a spread over LIBOR for 30 days to six months. At May 3, 2015, we had $214.1 million outstanding under our Credit Agreement. Based on this balance, an immediate change of one percent in the interest rate would cause a change in interest expense of approximately $2.1 million on an annual basis. The fair value of our Credit Agreement, due June 2019, at May 3, 2015 was approximately $213.6 million compared to the face value of $214.1 million. The fair value of our Credit Agreement at November 2, 2014 was approximately $230.1 million compared to the face value of $235.4 million. The fair value of the Notes, due January 2023, at May 3, 2015 was approximately $265.6 million compared to the face value of $250.0 million.
See Note 13 — Long-Term Debt and Note Payable to the consolidated financial statements for more information on the material terms of our long-term debt.
Foreign Currency Exchange Rates
We are exposed to the effect of exchange rate fluctuations on the U.S. dollar value of foreign currency denominated operating revenue and expenses. The functional currency for our Mexico operations is the U.S. dollar. Adjustments resulting from the re-measurement of the local currency financial statements into the U.S. dollar functional currency, which uses a combination of current and historical exchange rates, are included in net income (loss) in the current period. Net foreign currency re-measurement gains (losses) for the three month period ended May 3, 2015 was $(0.3) million and $(1.2) million for the six month period ending May 3, 2015. Net foreign currency re-measurement losses for the three and six month periods ended May 4, 2014 was insignificant and $(0.2) million, respectively.
The functional currency for our Canada operations is the Canadian dollar. Translation adjustments resulting from translating the functional currency financial statements into U.S. dollar equivalents are reported separately in accumulated other comprehensive income in stockholders’ equity. The net foreign currency exchange gains (losses) included in net income (loss) for the three month period ended May 3, 2015 and May 4, 2014 was $0.3 million and $0.2 million, respectively. The net foreign currency exchange gains (losses) included in net income (loss) for the six month period ended May 3, 2015 and May 4, 2014 was $(0.3) million and $(0.3) million, respectively. The net foreign currency translation adjustment, net of tax, and included in other comprehensive income (loss) for the three month period ended May 3, 2015 and May 4, 2014 was $0.3 million and insignificant, respectively. The net foreign currency translation adjustment, net of tax, and included in other comprehensive income (loss) for the six month period ended May 3, 2015 and May 4, 2014 was insignificant and $(0.2) million, respectively.
With the CENTRIA Acquisition, we now have operations in China and will be exposed to fluctuations in the foreign currency exchange rate between the U.S. dollar and Chinese Yuan. The functional currency for our China operations is the Chinese Yuan.
Item 4. Controls and Procedures.
Disclosure Controls and Procedures
Our management, with the participation of our chief executive officer and chief financial officer, evaluated the effectiveness of our disclosure controls and procedures as of May 3, 2015. The term “disclosure controls and procedures,” as defined in Rules 13a-15(e) and 15d-15(e) under the Exchange Act, means controls and other procedures of a company that are designed to ensure that information required to be disclosed by a company in the reports that it files or submits under the Exchange Act is recorded, processed, summarized and reported, within the time periods specified in the SEC’s rules and forms. Disclosure controls and procedures include, without limitation, controls and procedures designed to ensure that information required to be disclosed by a company in the reports that it files or submits under the Exchange Act is accumulated and communicated to the company’s management, including its principal executive and principal financial officers, as appropriate to allow timely decisions regarding the required disclosure. Management recognizes that any controls and procedures, no matter how well designed and operated, can provide only reasonable assurance of achieving their objectives and management necessarily applies its judgment in evaluating the cost-benefit relationship of possible controls and procedures. Management believes that our disclosure controls and procedures are designed to provide reasonable assurance of achieving their objectives and based on the evaluation of our disclosure controls and procedures as of May 3, 2015, our chief executive officer and chief financial officer concluded that, as of such date, our disclosure controls and procedures were effective at such reasonable assurance level.
| 40 |
Internal Control over Financial Reporting
The SEC’s rules permit the exclusion of an assessment of the effectiveness of a registrant’s disclosure controls and procedures as they relate to its internal controls over financial reporting for an acquired business during the first year following such acquisition, if among other circumstances and factors there is not adequate time between the acquisition date and the date of assessment. As previously noted in this Form 10-Q, we completed the CENTRIA Acquisition, on January 16, 2015. CENTRIA represents approximately 5.6% of our total assets as of May 3, 2015 and 9.1% and 50.0% of revenues and net income (loss), respectively, for the six month period then ended. The CENTRIA Acquisition had a material impact on internal control over financial reporting. Management’s assessment and conclusion on the effectiveness of the Company’s disclosure controls and procedures as of May 3, 2015 excluded an assessment of the internal control over financial reporting of CENTRIA.
We are now in the process of integrating CENTRIA’s operations including internal controls and processes. We are in the process of extending to CENTRIA our Section 404 compliance program under the Sarbanes-Oxley Act of 2002 and the applicable rules and regulations under such Act.
Except for the CENTRIA Acquisition, there has been no change in our internal control over financial reporting (as defined in Rules 13a-15(f) and 15d-15(f) under the Exchange Act) during our most recent fiscal quarter that has materially affected, or is reasonably likely to materially affect, our internal control over financial reporting.
| 41 |
NCI BUILDING SYSTEMS, INC.
See Part I, Item 1, “Unaudited Consolidated Financial Statements”, Note 17, which is incorporated herein by reference.
In addition to the other information set forth in this Quarterly Report on Form 10-Q, you should carefully consider the factors discussed in Part I, Item 1A, “Risk Factors” in our Annual Report on Form 10-K for the year ended November 2, 2014 and the factors discussed in Part II, Item 1A, “Risk Factors” in our Quarterly Report on Form 10-Q for the quarterly period ended February 1, 2015. The risks disclosed in our previous Annual Report on Form 10-K, Quarterly Report on Form 10-Q and information provided elsewhere in this report, could materially adversely affect our business, financial condition or results of operations. Additional risks and uncertainties not currently known or we currently deem to be immaterial may materially adversely affect our business, financial condition or results of operations. We believe there have been no material changes in our risk factors from those disclosed in our Annual Report on Form 10-K for the fiscal year ended November 2, 2014 and in our Quarterly Report on Form 10-Q for the quarterly period ended February 1, 2015.
Item 2. Unregistered Sales of Equity Securities and Use of Proceeds.
The following table shows our purchases of our Common Stock during the second quarter of fiscal 2015:
ISSUER PURCHASES OF EQUITY SECURITIES
| Period | (a) Total Number of Shares Purchased(1) | (b) Average Price Paid per Share (or Unit) | (c) Total Number of Shares Purchased as Part of Publicly Announced Plans or Programs | (d) Maximum Number of Shares that May Yet be Purchased Under the Plans or Programs(2) | ||||||||||||
| February 2, 2015 to March 1, 2015 | 490 | 18.26 | — | 129,218 | ||||||||||||
| March 2, 2015 to March 29, 2015 | 541 | $ | 16.84 | — | 129,218 | |||||||||||
| March 30, 2015 to May 3, 2015 | 273 | 16.35 | — | 129,218 | ||||||||||||
| Total | 1,304 | $ | 17.27 | — | 129,218 | |||||||||||
| (1) | Represents shares of restricted stock that were withheld to satisfy minimum tax withholding obligations arising in connection with the vesting of awards of restricted stock. The required withholding is calculated using the closing sales price on the previous business day prior to the vesting date as reported by the NYSE. |
| (2) | Our board of directors has authorized a stock repurchase program. Subject to applicable federal securities law, such purchases may occur, if at all, at times and in amounts that we deem appropriate. Shares repurchased are usually retired. On May 48, 2007, we publicly announced that our board of directors authorized the repurchase of an additional 0.2 million shares of our Common Stock. There is no time limit on the duration of the program. At May 3, 2015, there were 129,218 shares of Common Stock remaining authorized for repurchase under the program. |
Exhibits
Those exhibits required to be filed by Item 601 of Regulation S-K are listed in the Index to Exhibits immediately preceding the exhibits filed herewith and such listing is incorporated herein by reference.
| 42 |
SIGNATURES
Pursuant to the requirements of the Securities Exchange Act of 1934, the registrant has duly caused this report to be signed on its behalf by the undersigned thereunto duly authorized.
| NCI BUILDING SYSTEMS, INC. | ||
| (Registrant) | ||
| Date: June 5, 2015 | By: | /s/ Mark E. Johnson |
| Mark E. Johnson | ||
| Executive Vice President, | ||
| Chief Financial Officer and Treasurer | ||
Index to Exhibits
| *10.1 | Transition and Separation Agreement, dated April 8, 2015, by and among NCI Group, Inc., NCI Building Systems, Inc. and Mark W. Dobbins. | |
| *10.2 | Transition and Separation Agreement, dated April 10, 2015, by and between NCI Group, Inc., NCI Building Systems, Inc. and Bradley D. Robeson. | |
| *31.1 | Rule 13a-14(a)/15d-14(a) Certifications (Section 302 of the Sarbanes-Oxley Act of 2002). | |
| *31.2 | Rule 13a-14(a)/15d-14(a) Certifications (Section 302 of the Sarbanes-Oxley Act of 2002). | |
| **32.1 | Certifications pursuant to Section 1350 of Chapter 63 of Title 18 of the United States Code (Section 906 of the Sarbanes-Oxley Act of 2002). | |
| **32.2 | Certifications pursuant to Section 1350 of Chapter 63 of Title 18 of the United States Code (Section 906 of the Sarbanes-Oxley Act of 2002). | |
| *101.INS | XBRL Instance Document | |
| *101.SCH | XBRL Taxonomy Extension Schema Document | |
| *101.CAL | XBRL Taxonomy Extension Calculation Linkbase Document | |
| *101.DEF | XBRL Taxonomy Definition Linkbase Document | |
| *101.LAB | XBRL Taxonomy Extension Label Linkbase Document | |
| *101.PRE | XBRL Taxonomy Extension Presentation Linkbase Document |
| * | Filed herewith |
| ** | Furnished herewith |