Attached files
| file | filename |
|---|---|
| 8-K - 8-K - Voya Financial, Inc. | d937495d8k.htm |
| EX-99.1 - EX-99.1 - Voya Financial, Inc. | d937495dex991.htm |
 Voya Financial
2015 Investor Day
June 2, 2015
Exhibit 99.2 |
 Darin Arita
Senior Vice President, Investor Relations
Introduction |
 This
presentation
and
the
remarks
made
orally
contain
forward-looking
statements.
Forward-looking
statements
include
statements
relating
to
future
developments
in
our
business
or
expectations
for
our
future
financial
performance
and
any
statement
not
involving
a
historical
fact.
Forward-looking
statements
use
words
such
as
“anticipate,”
“believe,”
“estimate,”
“expect,”
“intend,”
“plan,”
“projected”,
“target,”
and
other
words
and
terms
of
similar
meaning
in
connection
with
a
discussion
of
future
operating
or
financial
performance.
In
particular,
our
2018
Adjusted
ROE
and
Adjusted
ROC
targets,
and
all
other
statements
about
our
financial
targets
and
expectations,
are
forward-looking
statements.
Actual
results,
performance
or
events
may
differ
materially
from
those
projected
in
any
forward-looking
statement
due
to,
among
other
things,
(i)
general
economic
conditions,
particularly
economic
conditions
in
our
core
markets,
(ii)
performance
of
financial
markets,
including
emerging
markets,
(iii)
the
frequency
and
severity
of
insured
loss
events,
(iv)
mortality
and
morbidity
levels,
(v)
persistency
and
lapse
levels,
(vi)
interest
rates,
(vii)
currency
exchange
rates,
(viii)
general
competitive
factors,
(ix)
changes
in
laws
and
regulations,
including
those
relating
to
the
use
and
accreditation
of
captive
reinsurance
entities
and
those
made
pursuant
to
the
Dodd-Frank
Wall
Street
Reform
and
Consumer
Protection
Act
or
the
U.S.
Department
of
Labor’s
proposed
rules
and
exemptions
pertaining
to
the
fiduciary
status
of
providers
of
investment
advice
and
(x)
changes
in
the
policies
of
governments
and/or
regulatory
authorities.
Factors
that
may
cause
actual
results
to
differ
from
those
in
any
forward-looking
statement
also
include
those
described
in
“Risk
Factors,”
“Management’s
Discussion
and
Analysis
of
Results
of
Operations
and
Financial
Condition—Trends
and
Uncertainties”
and
“Business—Closed
Blocks—Closed
Block
Variable
Annuity”
in
our
Annual
Report
on
Form
10-K
for
the
year
ended
December
31,
2014
as
filed
with
the
Securities
and
Exchange
Commission
(“SEC”)
on
February
27,
2015,
and
our
Quarterly
Report
on
Form
10-Q
for
the
three
months
ended March 31, 2015, as filed with the SEC on May 8, 2015.
This
presentation
and
the
remarks
made
orally
contain
certain
non-GAAP
financial
measures.
Non-GAAP
measures
include
Operating
Earnings,
Adjusted
Operating
Earnings,
Ongoing
Business
Adjusted
Operating
Earnings,
Ongoing
Business
Adjusted
Operating
Return
on
Equity,
Adjusted
Operating
Return
on
Capital,
Ongoing
Business
Adjusted
Return
on
Capital,
Operating
Margin,
and
debt-to-capital
ratio.
Information
regarding
these
and
other
non-GAAP
financial
measures,
including
reconciliations
to
the
most
directly
comparable
GAAP
financial
measures,
is
provided
in
our
quarterly
earnings
press
releases
and
in
our
quarterly
investor
supplements,
all
of
which
are
available
at
the
Investor
Relations
section of Voya Financial’s website at investors.voya.com.
Forward-Looking and Other Cautionary Statements
3 |
 Agenda
4
Topic
Presenter
Welcome
Darin Arita
State of the Company and Forward Vision
Rod Martin
ROE / ROC Walk and Incremental Investments
Alain Karaoglan
Capital Generation and Management
Ewout Steenbergen
Q&A with Martin, Karaoglan, and Steenbergen
Annuities / Retirement
Q&A with Nelson
Alain Karaoglan / Charles Nelson
Break
Investment Management
Q&A with Becker
Jeff Becker
Insurance Solutions
Q&A with Smith
Mike Smith
Closing Remarks
Rod Martin
General Q&A
All Speakers
Cocktail Reception |
 Rod
Martin Chairman and Chief Executive Officer
State of the Company
and Forward Vision |
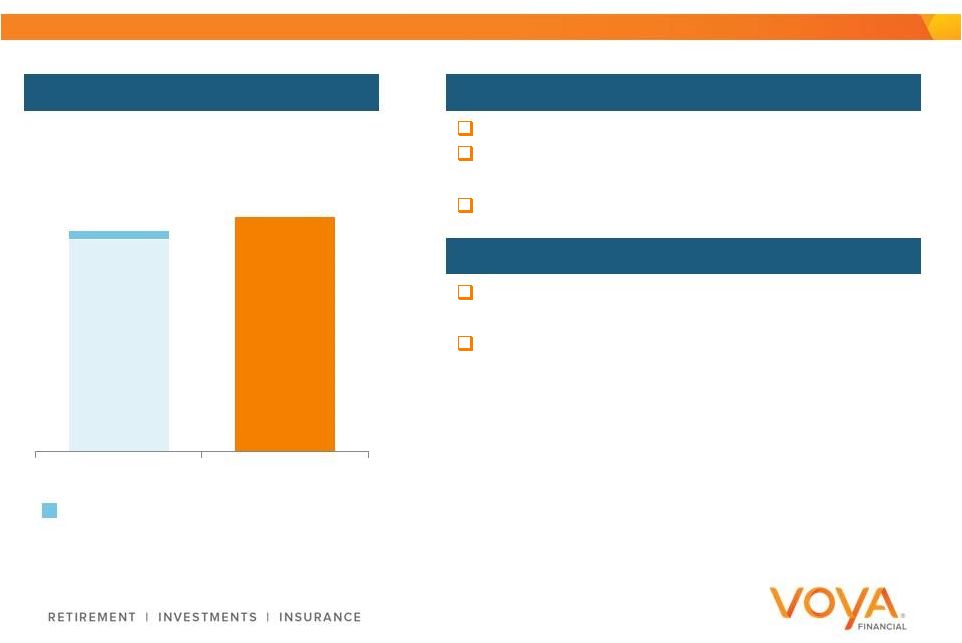
 Financial Update Announced Today
6
13.5%
$750
million
14.5%
to
Revised 2018 Ongoing Business
Adjusted Operating ROE Target
Additional Share Repurchase
Authorization |
 Investor Day Overall Key Takeaways
7
Team Delivered on the IPO Plan and Remains Focused on Execution
Strong and Experienced Leadership
Each Business has a Strong Value Proposition that Together can
Differentiate Voya’s Value Proposition |
 CEO Key
Themes 8
Evolving to Deliver Greater Value for Customers and Shareholders
2
1
Management Team has Executed Since IPO |
 ROE
target met two years ahead of schedule Significant Progress as a Public
Company 9
Capital generation and share repurchases
Rebrand
Independent Board
Public float increased
Credit ratings upgrade |
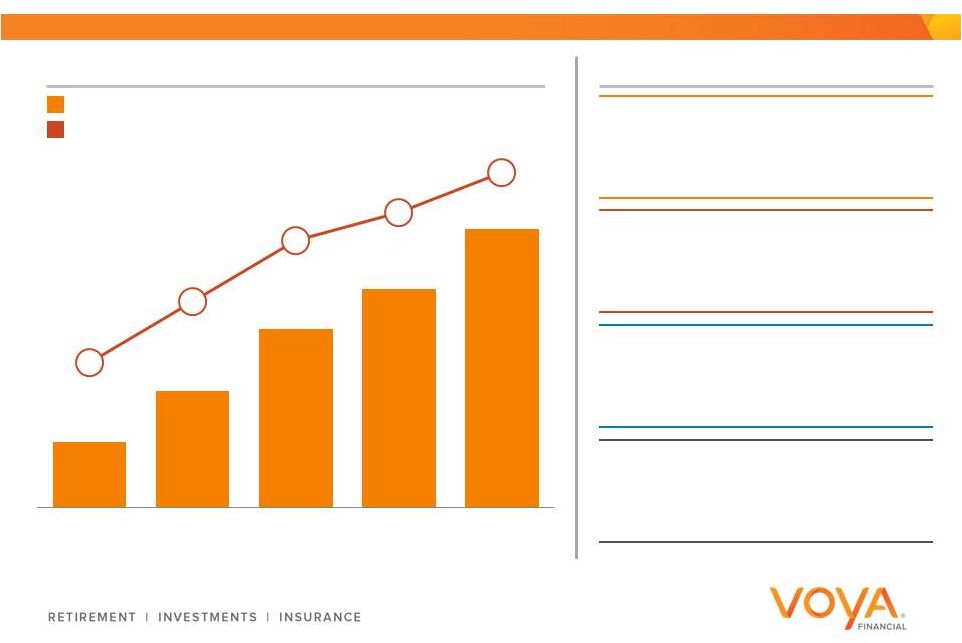
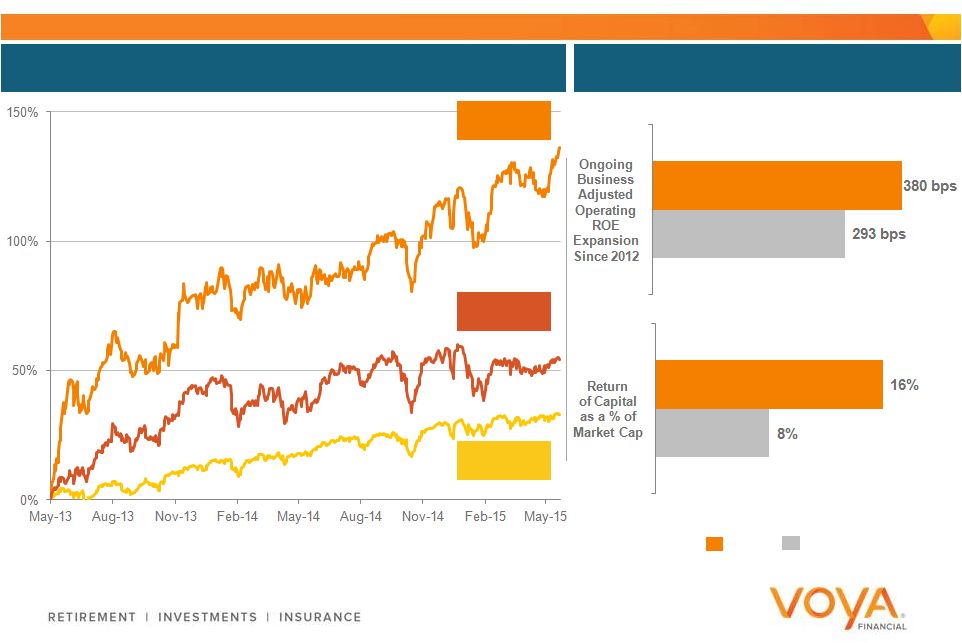 Significant Value Created for Shareholders
10
Voya Stock Performance Since IPO
Recent Financial Performance
Source: Bloomberg as of 5/26/2015
1.
Peers include AMP, LNC, MET, PFG, PRU
2.
Adjusts for items not expected to recur and excludes closed blocks
3.
Estimated
4.
Measured by cumulative share repurchase and dividends as a percentage of average
equity market value since 1/1/2014 VOYA
+135%
Peers
+52%¹
S&P 500
+32%
4
Peers
1
Voya
2
3 |
 CEO
Key Themes 11
Evolving to Deliver Greater Value for Customers and Shareholders
2
1
Management Team has Executed since IPO |
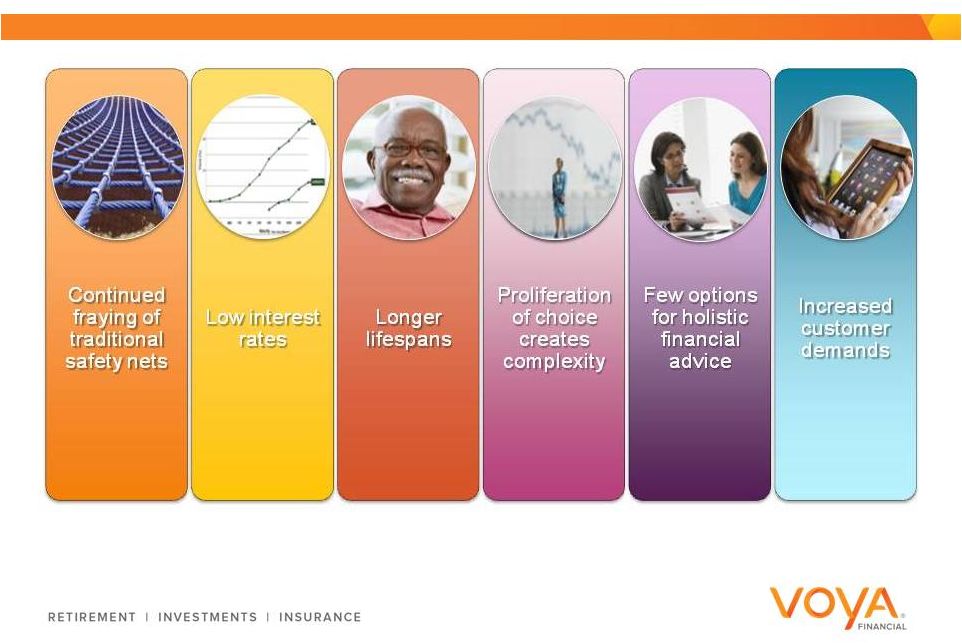 Opportunity to Grow as Individual Retirement Needs and
Demands Continue to Increase
12 |
 by 2018
Current
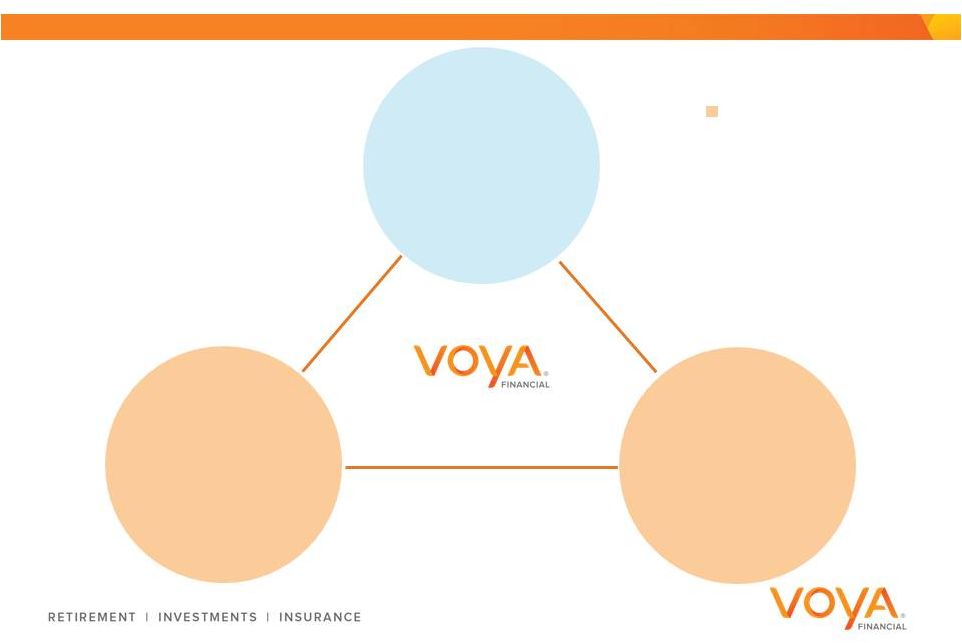
Evolving to Meet Increasing Individual Needs and Demands
13
Each business has its
own view of the
customer
Customer at the center
Complex IT
infrastructure
Simplified IT
infrastructure
Basic data analytics
capabilities
Advanced data
analytics capabilities
Product focus
Solutions focus |
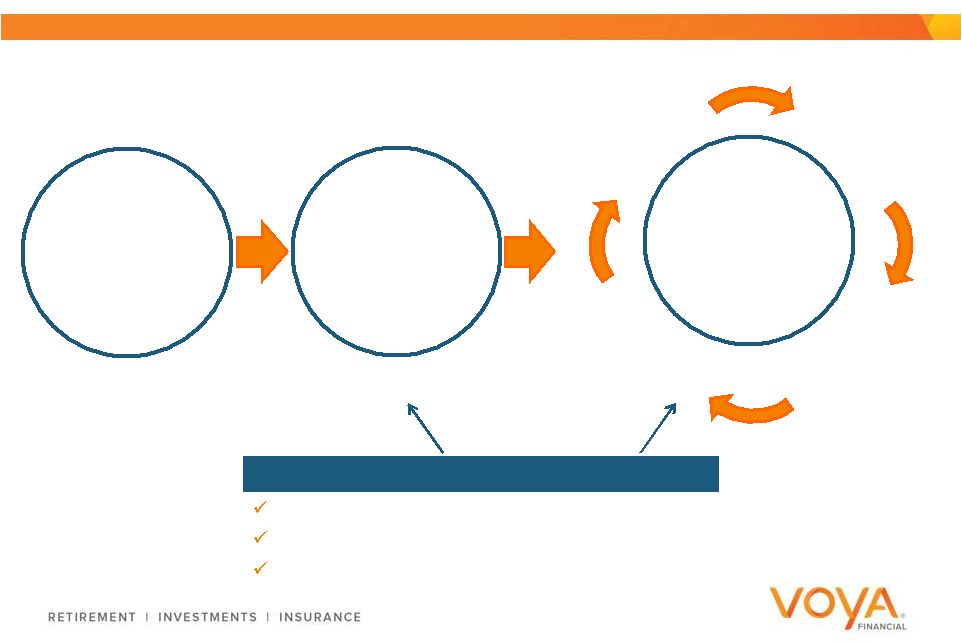 14
Our metrics remain in place
Risk-adjusted returns
Distributable cash flow
Sales at or above target IRRs
Empower
Employees
Enhance Value
via Continuous
Improvement
Front-line
Problem
Solving
Remove
Silos
Improve
Customer
Experience
Top-line focus
Ongoing Cultural Transformation Enables Value Creation
Value Creation
Focus |
 Customer Benefits: Next Generation Experiences and Solutions
15
Voya as a
Lifetime
Partner
Simple,
Actionable,
and
Tailored
Solutions
Effortless
Experience |
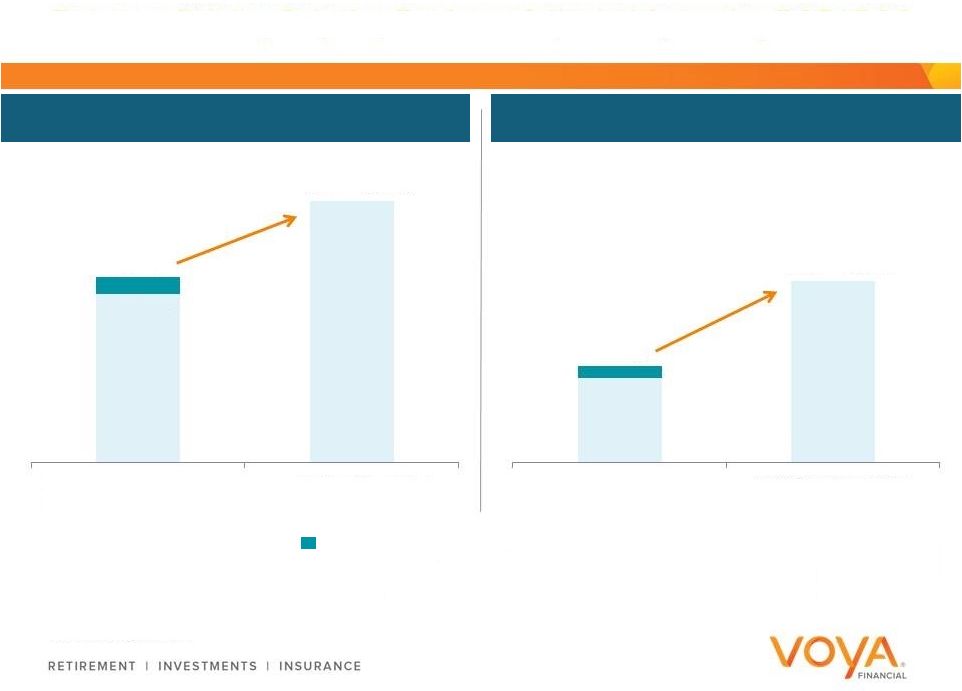
 Shareholder Benefits: Multiple Drivers for Increased Value
16
Expanded
ROE
Accelerated
Earnings
Growth
Increased
Free Cash
Flow
Differentiated
Value
Proposition
$350
million
Incremental
Investment |
 CEO
Key Themes 17
Evolving to Deliver Greater Value for Customers and Shareholders
2
1
Management Team has Executed since IPO |
 Alain Karaoglan
Chief Operating Officer
Chief Executive Officer, Retirement and Investment Solutions
ROE / ROC Walk and
Incremental
Investments |
 COO
Key Themes 19
Growth and Margin Initiatives are Key Return on Equity Drivers
2
1
Same Formula for Success
3
Incremental Investments will Increase Capabilities and Efficiency
|
 Used
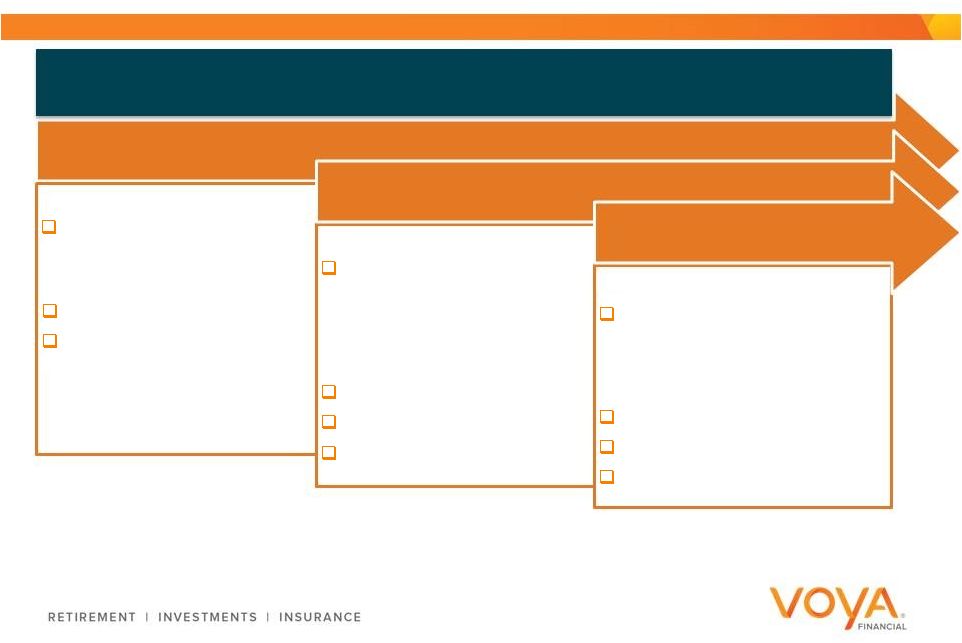
IPO Blueprint to Form New ROC / ROE Improvement Plan 20
1
2
3
Collaborate with key members and partners responsible for initial
ROC / ROE walk
Analyzed strengths and areas of improvement by business
Created ROC walk by business |
 Continued Execution of Return on Equity Improvement
21
Each business and
function contributes to
the ROE progression
Each initiative targets
one of three categories:
Growth, Margin, Capital
More than 20 strategic
initiatives
monitored
and
actively tracked
2018 Ongoing
Business
Adjusted
Operating ROE
Target of
13.5 –
14.5% |
 COO
Key Themes 22
Growth and Margin Initiatives are Key Return on Equity Drivers
2
1
Same Formula for Success
3
Incremental Investments will Increase Capabilities and Efficiency
|
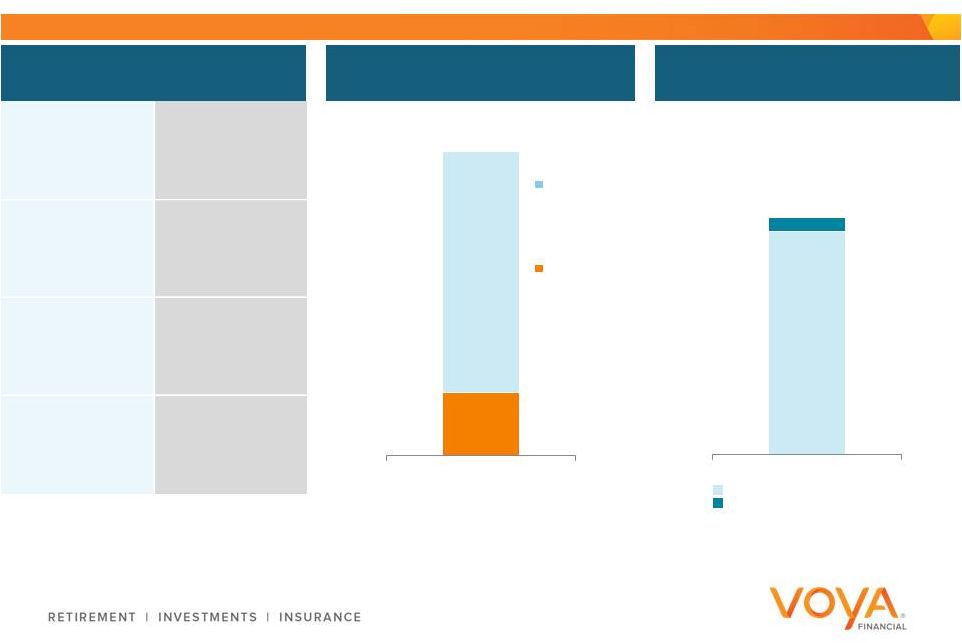
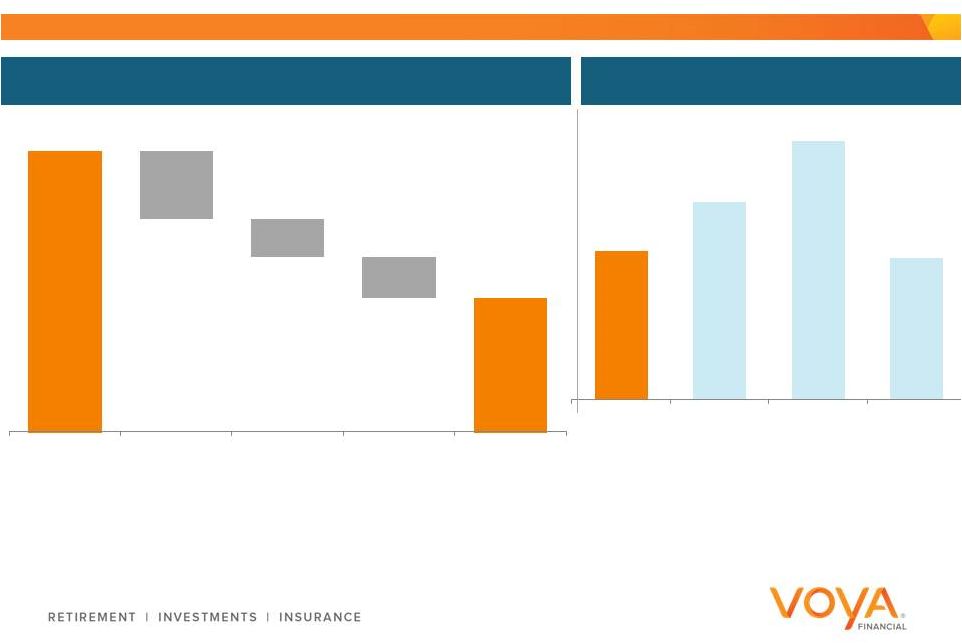
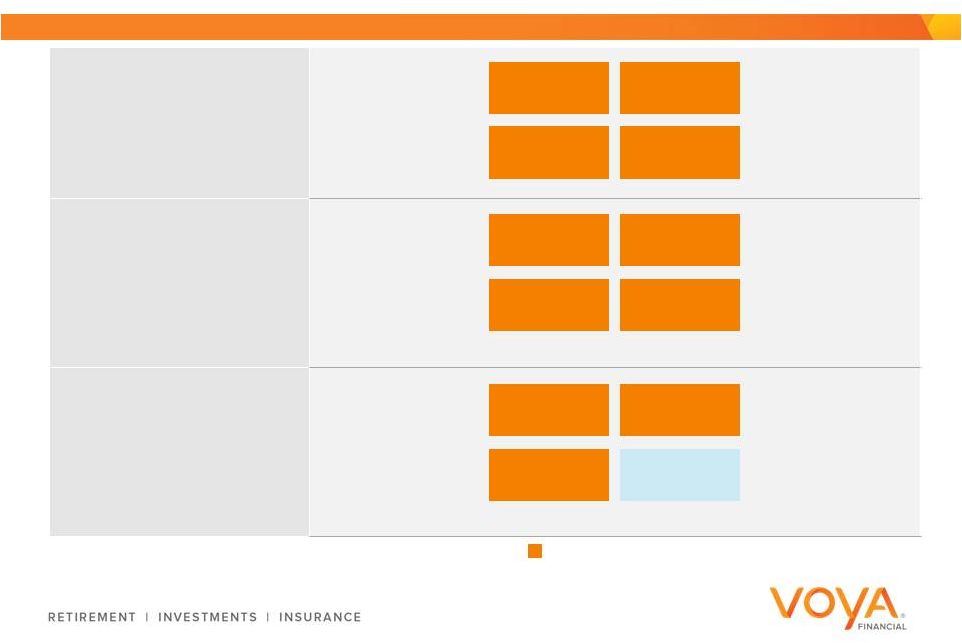
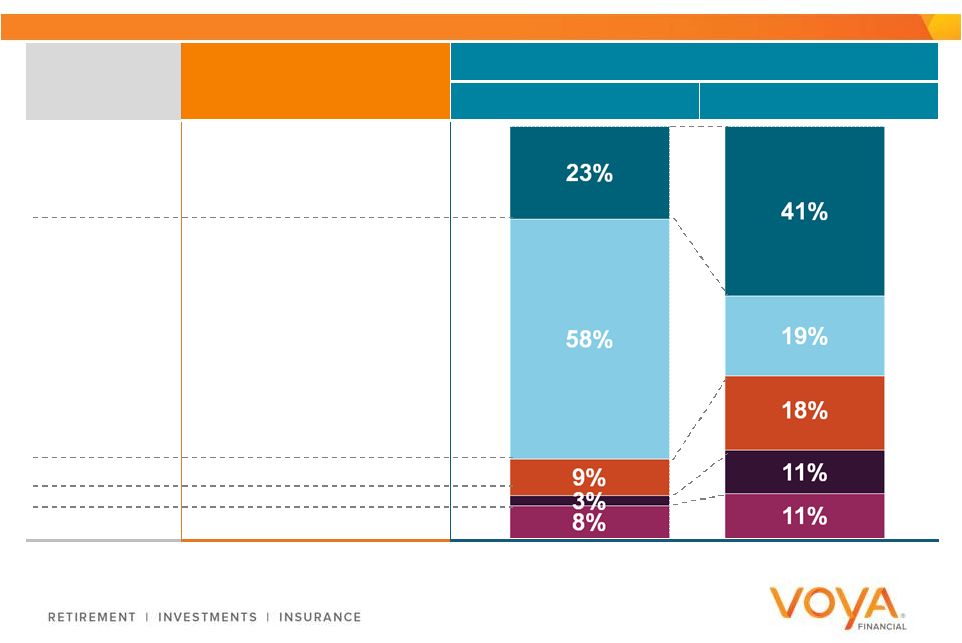
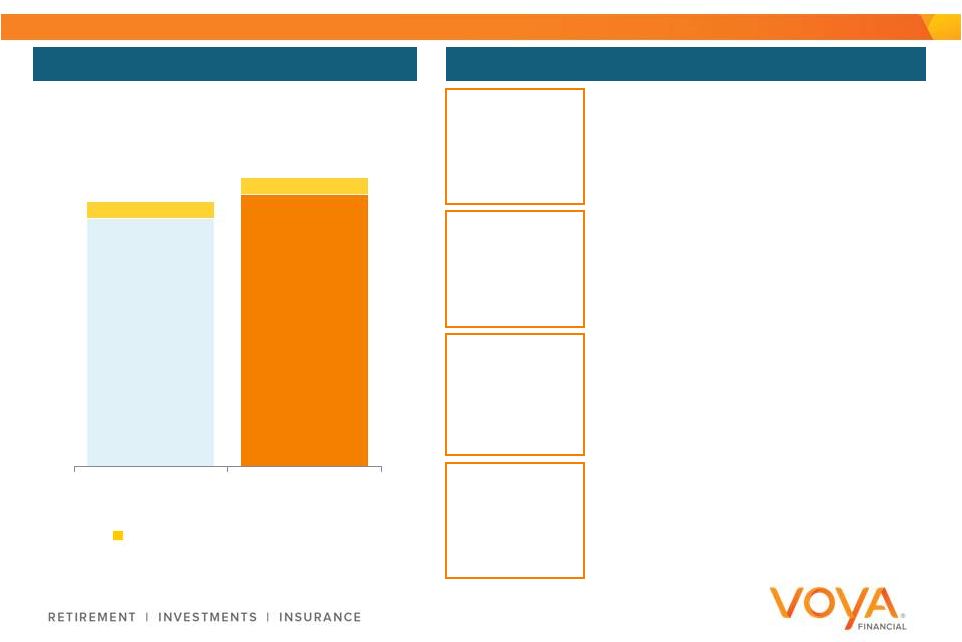
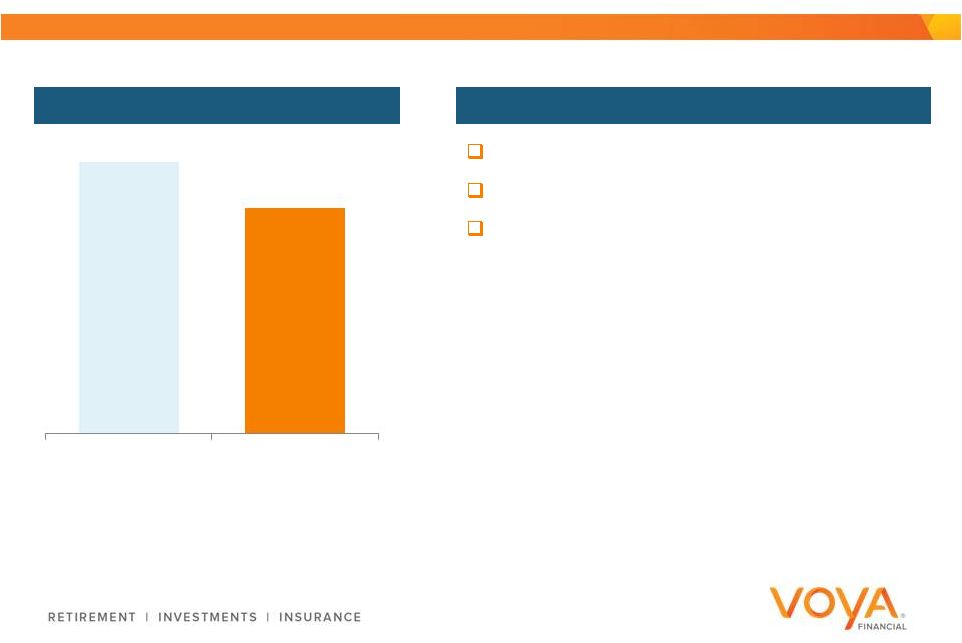
 Focus
on Driving Ongoing Business Adjusted Operating ROE / ROC Ongoing
Business Adjusted
Operating ROE Goal
Ongoing
Business Adjusted
Operating ROC Goal
23
13.5 –
14.5%
11.5 –
12.5%
12.1%
9.9%
Items that we do not expect to recur at the same levels
1.
Ongoing Business includes Retirement, Annuities, Investment Management, Individual
Life, and Employee Benefits segments 2.
Ongoing
Business
adjusted
operating
earnings
is
calculated
using
the
operating
earnings
(loss)
before
income
taxes
for
the
Ongoing
Business,
excluding
DAC/VOBA
unlocking,
and
the
gain
on
a
reinsurance
recapture in 2014. Ongoing Business adjusted operating ROE is then calculated by
dividing the after-tax adjusted operating earnings (loss) (using a pro forma effective tax rate of 32% effective with 1Q’15 and 35%
for all prior periods and applying a pro forma allocation of interest expense) by
the average capital allocated to the Ongoing Business reflecting an allocation of pro forma debt. Assumes debt-to-capital ratio of 25%
for all periods presented, and reflects the actual weighted average pre-tax
interest rate for all periods 3.
We calculate Ongoing Business adjusted operating return on capital by dividing
Ongoing Business adjusted operating earnings before interest and after income taxes by average capital
allocated to the Ongoing Business
11.7%
9.6%
2014 Ongoing Business
Adjusted Operating ROE
2018 Target Ongoing
Business Adjusted
Operating ROE
2014 Ongoing Business
Adjusted Operating ROC
2018 Target Ongoing
Business Adjusted
Operating ROC
3
2
1
1 |
 Growth
Margin
Capital
Initiatives
Category
Approx.
150 –
180bps
Approx.
40 –
60bps
Interest Rate Impact
1
Approx.
(70) –
(90)bps
Ongoing Operating
ROC Improvement
2
Total –
Ongoing Operating ROC Improvement by 2018
2
Approx.
150 –
250bps
1.
Consists of lower expected investment income due to lower portfolio yields compared
to 2014 levels in Retirement and Insurance Solutions, and expected lower net margin (investment income less credited interest)
compared to 2014 levels in Annuities
2.
Target improvement over the period of 2015 to 2018; management best estimate of
contributions from initiatives total 150-250 bps Expand Retirement
Distribution Reach
Grow Employee Benefits Mid-
market and Private Exchange
Continue to Grow Investment
Management
Leverage Cross-market
Relationships
Continue to Manage Crediting
Rates
Consolidate IT Platforms
Streamline Operations
Through Process Digitization
Migrate to Cloud Environment
In-force Management
Reinsurance Transactions
Clear Initiatives to Improve Ongoing Business Adjusted Operating
ROC
24
Approx.
50 –
80bps |
 COO
Key Themes 25
Growth and Margin Initiatives are Key Return on Equity Drivers
2
1
Same Formula for Success
3
Incremental Investments will Increase Capabilities and Efficiency
|
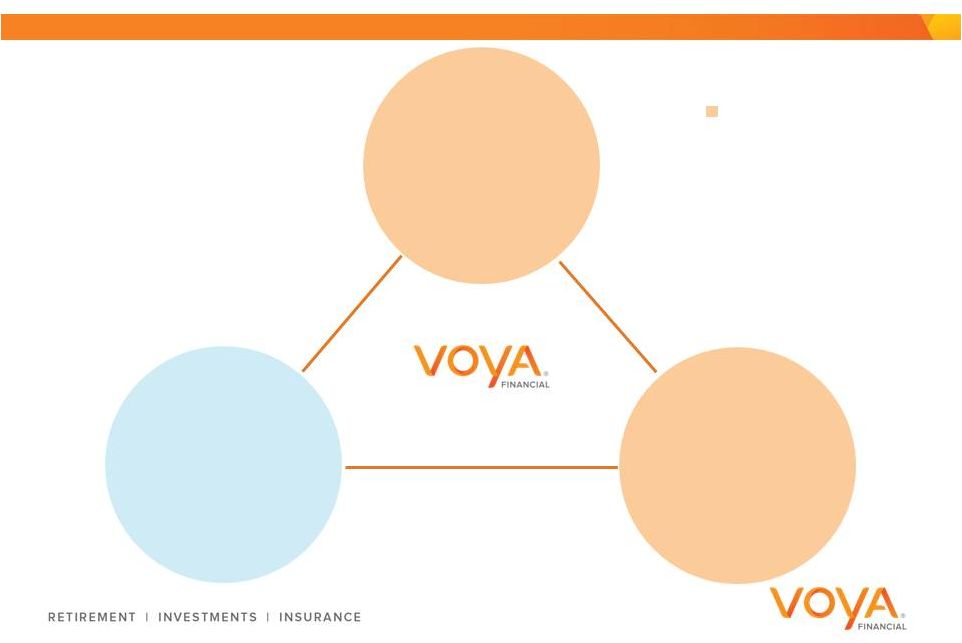
 Incremental Investments to Increase Growth and Reduce Cost
Ongoing Business Adjusted Operating
ROE target of 13.5-14.5% by 2018
Ongoing Business
Initiatives
Digital &
Analytics
Cross-
enterprise
IT
Simplification
26
$350 million Incremental Investment
Ongoing Investment |
 by 2018
Current
IT Simplification Will be a Key Enabler
27
Overlapping systems and
applications
Customer servicing
conducted across multiple
platforms
Older infrastructure expensive
to maintain
Streamlined systems and
fewer applications
Customer servicing
coordinated on a common
platform
Simplified infrastructure
reduces cost
Complex technology
infrastructure
Simplified IT platform |
 Digital and Analytics Creating Efficiency and Growth
28
Partial digitization
Basic data insights
Product development and
strategy mostly reside within
business silos
End-to-end digitization
Data-driven culture centered
on customer
Integrate solutions with a
common view
Emerging Capabilities
Effortless Experience
by 2018
Current |
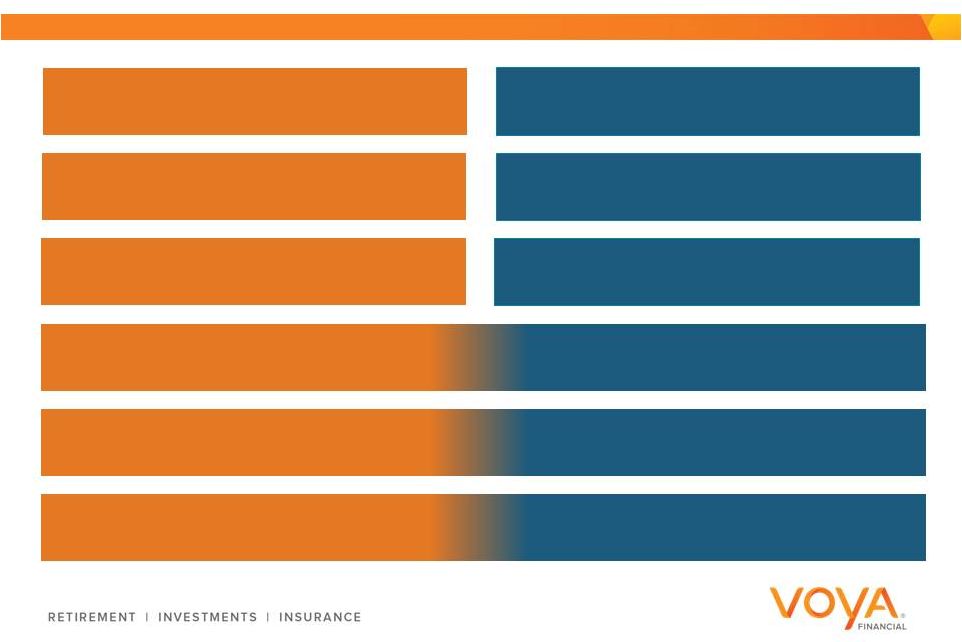
 Cross-Enterprise Initiatives Will Leverage Our Capabilities and Create
Differentiated Solutions
29
Limited cross-enterprise
collaboration
Focus on products
Businesses have individual
view of customer
Enhanced institutional
coordination
Focus on solutions
Enterprise view of customer
by 2018
Current |
 COO
Key Themes 30
Growth and Margin Initiatives are Key Return on Equity Drivers
2
1
Same Formula for Success
3
Incremental Investments will Increase Capabilities and Efficiency
|
 Ewout Steenbergen
Chief Financial Officer
Capital Generation and
Management |
 CFO
Key Themes 32
Diligent Stewards of Capital
2
1
Potential for Greater Free Cash Flow Generation
3
Quality of Earnings Offers Potential Upside |
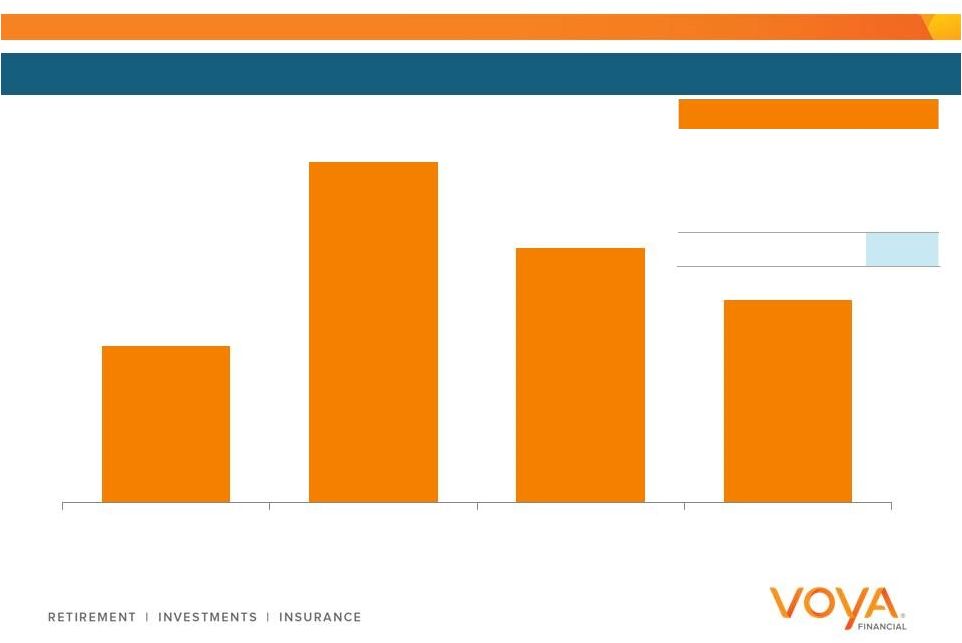 Majority of $350 Million
Investment Expected to Occur in the First Three Years
33
Investments
by
Year
($
millions)
1
Aggregate Breakdown
IT Simplification
$120
Digital & Analytics
160
Cross-enterprise
70
Total
$350
$50-70
$110-130
$80-100
$60-80
1.
Projected.
Includes
only
$350
million
incremental
investments
to
be
allocated
to
Corporate
segment
2015
2016
2017
2018 |
 Key
Assumptions for ROC and ROE Improvement Plan 34
Plan Assumptions
Equity Market
Return
7.5%
equity
market
growth
Interest Rates
Forward curve for the 2015-2018 period as of December 31, 2014
Leverage
25% target debt-to-capital ratio
Capital
Slight capital increase
Tax
32% effective tax rate for Ongoing Business operating earnings
1.
Excludes dividends
1 |
 Manageable Impact of Low Interest Rates on ROE and Capital
35
Impact of Flat 10-Year Treasury at
2%
Through
2018
1
2015 -
2018
Ongoing Business Adjusted
Operating Earnings Annual
Impact
(%)
(1) –
(5) %
RBC Ratio Cumulative Impact
(RBC percentage points)
(10) –
(60) points
1.
Treasury curve as of December 31, 2014. Financial impact before $350 million
incremental investment |
 Retirement, Investment Management, and Employee Benefits
Generate Significant Free Cash Flow
36
Projected Free Cash Flow Conversion by Segment
1,3
Retirement
65-75%
Annuities
40-50%
Investment Management
90-100%
Individual Life
45-55%
Employee Benefits
70-80%
Ongoing
Business
2
75-85%
1.
Segment ratios based on projected segment distributable cash flow after-tax
divided by projected segment GAAP operating earnings after-tax; using 32% tax rate
2.
Ongoing Business ratio based on projected Ongoing Business distributable cash flow
after-tax divided by projected Consolidated GAAP operating earnings after-tax and after-
interest expense; using 32% tax rate
3.
Assumes no impairments factored into analysis. Does not include the effect of $350
million of incremental investments. |
 Free
Cash Flow Ratio Can Increase Over Time 37
1.
Distributable cash flow after-tax divided by Consolidated GAAP operating
earnings after-tax and after-interest expense using a 32% tax rate
2.
Based on difference between actual tax payments and implied taxes on distributable
cash flow divided by Consolidated GAAP operating earnings after-tax and after-interest
expense using a 32% tax rate
Free Cash Flow Conversion Components
2015
2018
Total
Ongoing
Business
1
75-85%
75-85%
Corporate
and
Closed
Blocks
1
(20)-(30)%
(15)-(25)%
Tax
Asset
Utilization
Benefit
2
10-15%
20-30%
Total Free Cash Flow Conversion
60-70%
80-90%
Projected |
 CFO
Key Themes 38
Diligent Stewards of Capital
2
1
Potential for Greater Free Cash Flow Generation
3
Quality of Earnings Offers Potential Upside |
 Strong
Capital Position 39
1. Pro forma based on actual RBC ratio of 547% at March 31, 2015, adjusted to give effect to $819 million of ordinary dividends upstreamed to Voya
Financial, Inc. in May 2015 2.
Estimated combined RBC ratio primarily for our four principal U.S. insurance
subsidiaries 3.
Pro forma based on actual ratio as of March 31, 2015, adjusted to give effect to $72
million of share repurchases during 2Q’15. Based on U.S. GAAP capital (adjusted to exclude minority interest and AOCI), and ignores the 100% and 25% equity treatment afforded to subordinated debt by S&P and Moody’s, respectively
4. Holding company liquidity includes cash, cash equivalents, and short-term investments. Pro forma based on actual holding company liquidity as of March 31, 2015, adjusted to give effect to $819 million of ordinary dividends upstreamed to Voya Financial, Inc. in May 2015, $21 million of external interest payments in May 2015, $72 million of share repurchases
during 2Q’15, and repayment of net inter-company borrowings of $499
million to/from operating companies
5. Target of 24-month holding company liquidity of $450 million 6. Authorization expires June 30, 2016 Repurchase Authorization ($ million) Holding Co. Working Capital Above Target 4,5 Estimated Statutory Surplus in Excess of 425% RBC Level 1,2 $1,150 $239 5/26/15 5/26/15 Pro Forma Excess Capital ($ million) $911 $750 $58 Key Capital Metrics RBC ratio 1,2 489% Debt-to-Capital ratio 3 22.0% Holding Company liquidity 1,4 $689 million Off-balance sheet capacity $500 million of nominal contingent capital $808 Remaining capacity on prior authorization New share repurchase authorization 6 |
 Deploy
Excess Capital Prudently 40
Share
repurchases
Dividends
Bolt-on M&A |
 CFO
Key Themes 41
Diligent Stewards of Capital
2
1
Potential for Greater Free Cash Flow Generation
3
Quality of Earnings Offers Potential Upside |
 Implied
Ongoing Business Price-to-Earnings Ratio is Below Peers With Minimal
Variable Annuities Earnings and Similar Business Mix 42
Implied Ongoing Stock Price
Ongoing P/E Peer Comparison
1. As of 5/26/2015 2. Based on sell-side analyst consensus estimates 3. Based on holding company liquidity in excess of $450 million target, estimated statutory surplus in excess of 425% RBC, $21 million of external
interest payment in May 2015, and most recent broker estimate of value of
common stock warrants held by ING Group 4.
Blended price-to-forward earnings of peers with less than 15% of pre-tax
operating earnings from variable annuities with living benefit guarantees, including AMP and PFG 5. Blended price-to-forward earnings of peers including AMG, AB, BLK, EV, FII, BEN, IVZ, JNS, LM, TROW, and WDR
6. Blended price-to-forward earnings of peers including LNC, MET and PRU 1 2 2 3 4 5 6 $45.77 $6.24 $3.49 $3.74 $32.30 Current Voya Stock Price Excess Implied Ongoing Business 9.5 x 12.6 x 16.5 x 9.0 x Voya Retirement and Investment Management Companies Investment Management VA Companies Insurance and Companies DTA CBVA Capital |
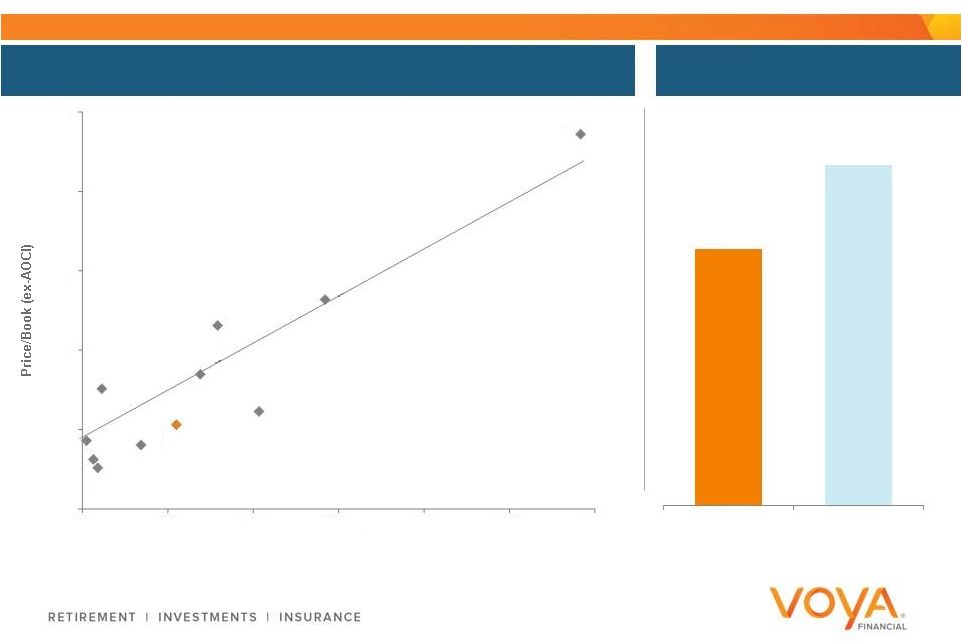 1.
Current stock price adjusted for DTA, CBVA, excess capital (which has been reduced
by the full after-tax amount of $350 million of incremental investments), and residual debt. Assumes 25% debt-to-capitalization
ratio; residual debt based on allocated interest expense and peer forward multiple.
ROE based on consensus analyst estimates. 2.
Price-to-book value = adjusted operating equity value divided by equity
allocated to Ongoing Business 3.
Based on regression
.
43
2015E Return on Equity (ex-AOCI)
Current Price-to-Book Value Over ROE
Implied Ongoing Price-to-Book Value is Below Regression
Implied Ongoing Price-to-
Book Value
3
2
1.47 x
1.23 x
AMP
LNC
MET
PFG
PRU
UNM
SFG
RGA
TMK
PRI
VOYA Implied
Ongoing
Business
1
0.7
1.2
1.7
2.2
2.7
3.2
10%
12%
14%
16%
18%
20%
22%
Implied Ongoing
P/B Multiple
P/B Multiple Based
on 2015E ROE |
 CFO
Key Themes 44
Diligent Stewards of Capital
2
1
Potential for Greater Free Cash Flow Generation
3
Quality of Earnings Offers Potential Upside |
 Alain Karaoglan
Chief Operating Officer
Chief Executive Officer, Retirement and Investment Solutions
Annuities |
 Annuities Key Themes
46
Enhanced Product Solutions to Drive Return on Capital
2
1
Dependable Solutions Partner for a Diverse Distribution Network
3
Positioned to Meet the Income Needs of Customers |
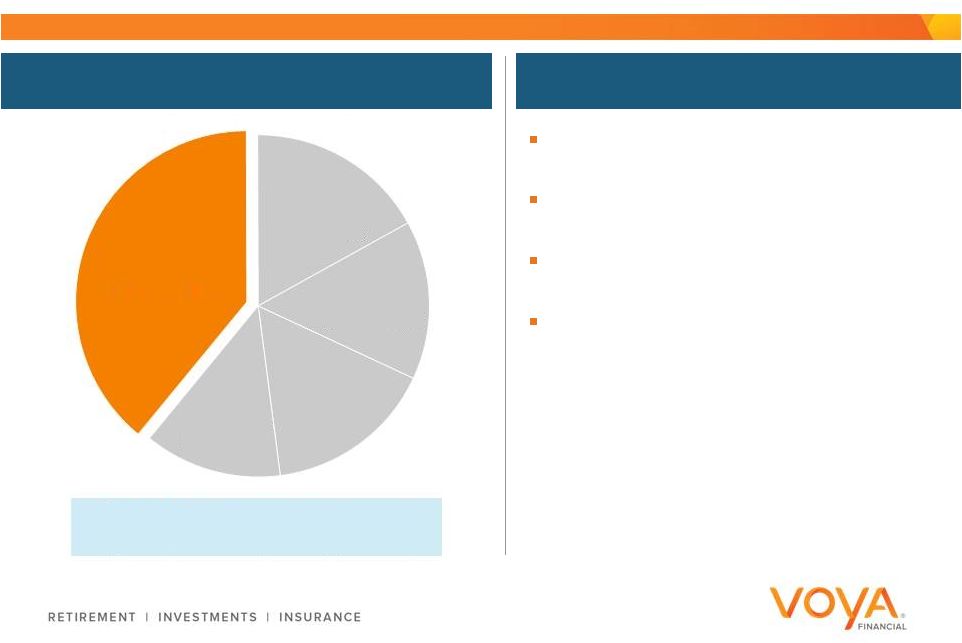
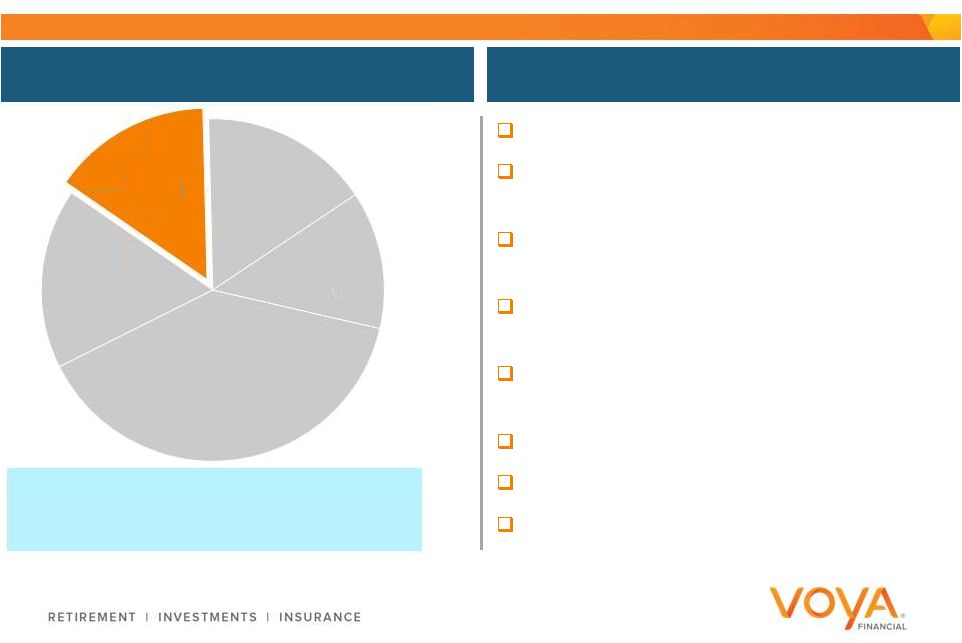
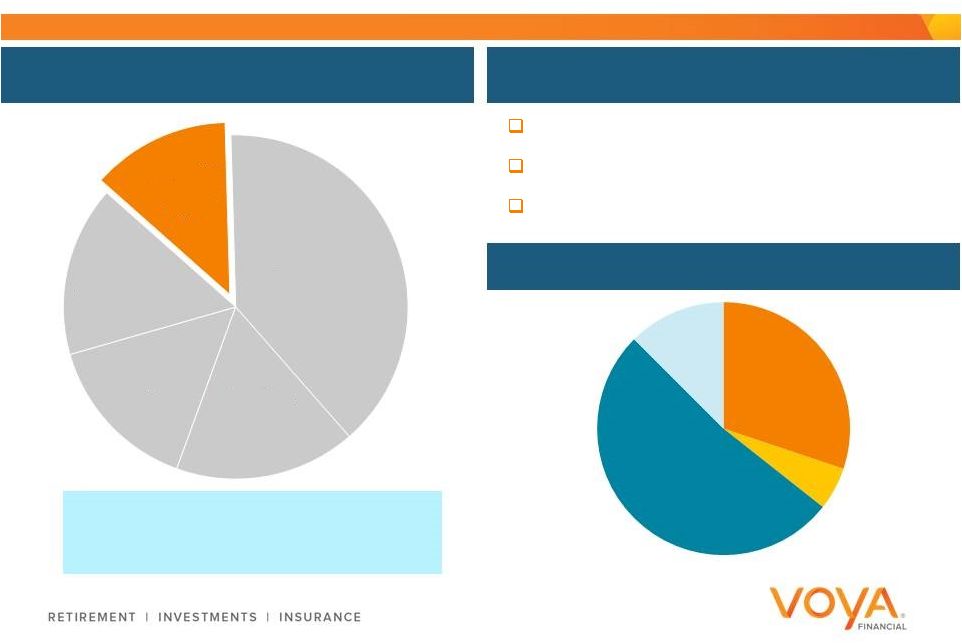
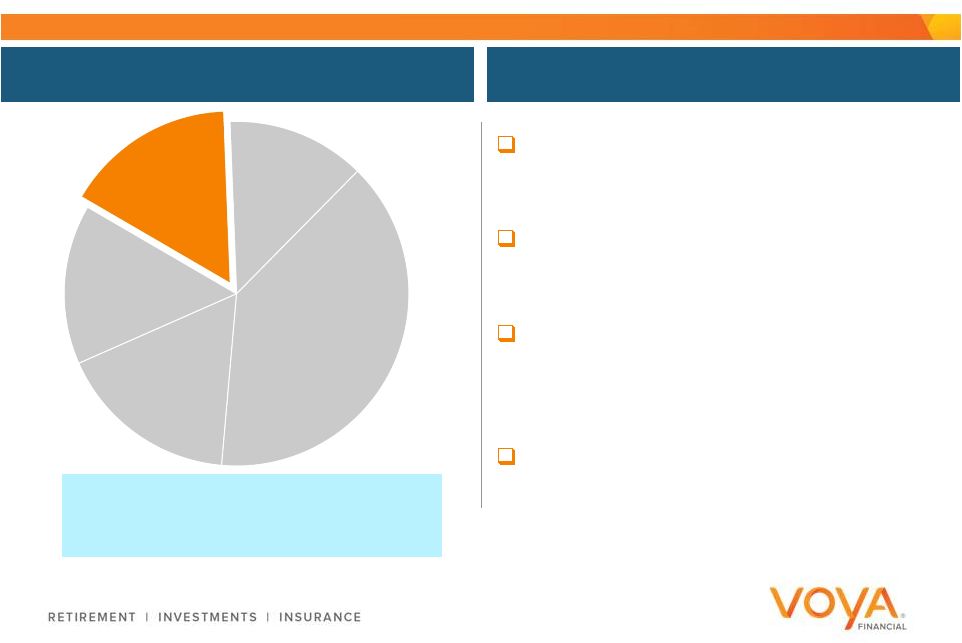
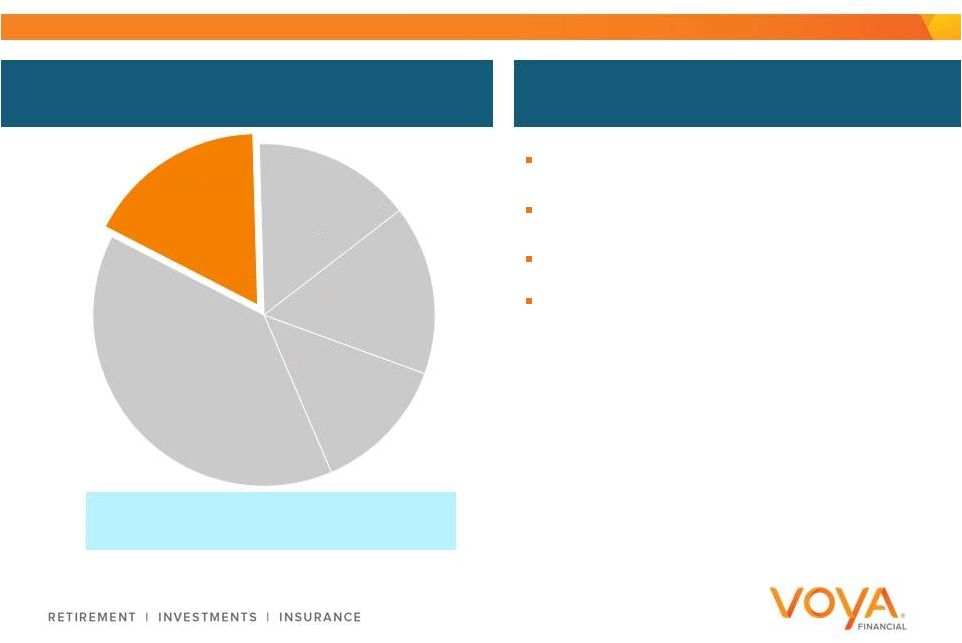 Diverse Distribution
Leveraging Expansive Product Portfolio 1Q’15 TTM Adjusted Operating Earnings
Pre-Tax Contribution
160,000 potential producers
$27 billion AUM
400,000 policies
Comprehensive solution set
–
Fixed Indexed Annuities (FIA)
–
Investment-Only Variable
Annuities
–
Single Premium Immediate
Annuities (SPIA)
–
Mutual Fund Custodial Accounts
Business Highlights
47
$243
million
in
TTM
Annuities
adjusted operating earnings
1.
Trailing twelve months
2.
Annuities AUM as of 3/31/15. Includes Mutual Fund Custodial
3.
Annuities policy count as of 12/31/14
Employee
Benefits
Retirement
Annuities
17%
Investment
Management
Individual
Life
1
2
3 |
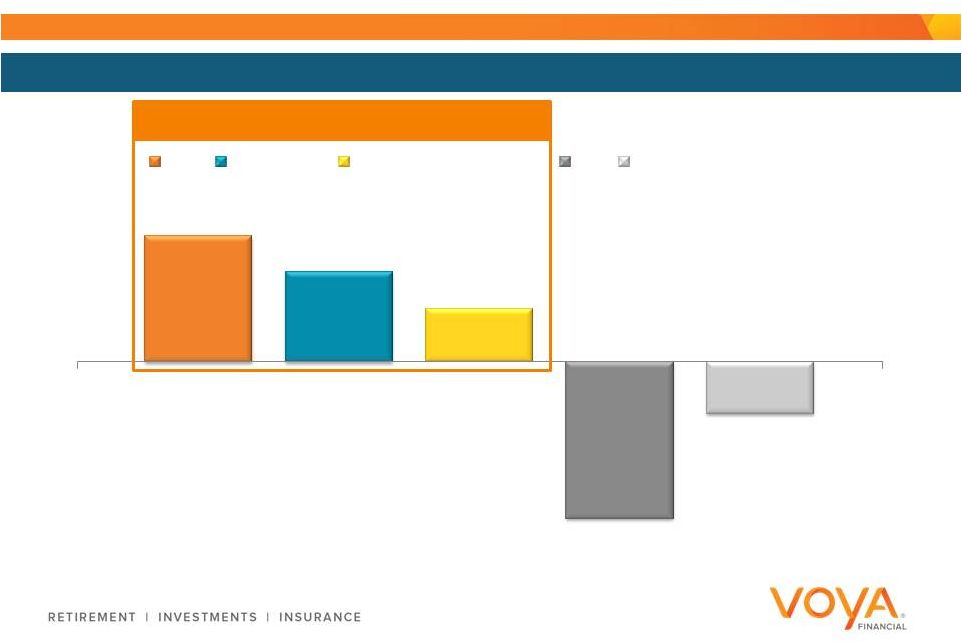 Focused on the Fastest Growing Areas
Voya’s Growth Focus
Historical Industry Sales Growth By Product (CAGR 2008 –
2014)
Source: LIMRA -
US Individual Annuity Industry Sales Report from 2008-2014
48
10.5%
7.5%
4.4%
-13.0%
-4.3%
FIA
SPIA/DIA
Investment
-Only VA
FA
VA (w GLB) |
 Comprehensive
Solution Set
High Touch,
Accommodative Service
Value-Added
Support Tools
Diverse Distribution Channels
Hybrid / External
Wholesale Model
Reputable Brand
and Staying
Power
Value Delivered
49
High Touch Service and Support with Comprehensive Solutions
|
 Independent Agents
Independent Broker/Dealers
Strategic Alliances
Voya Financial Advisors
Banks
2012
Attracting and Growing a Diverse Distribution Network
National Marketing Organizations
Independent Agents
Independent Broker/Dealers
Voya Financial Advisors
Banks
Today
Direct
National Marketing Organizations
50
Distribute wider range of
registered and non-registered
solutions through:
Distribute primarily non-registered
solutions through: |
 Annuities Key Themes
51
Enhanced Product Solutions to Drive Return on Capital
2
1
Dependable Solutions Partner for a Diverse Distribution Network
3
Positioned to Meet the Income Needs of Customers |
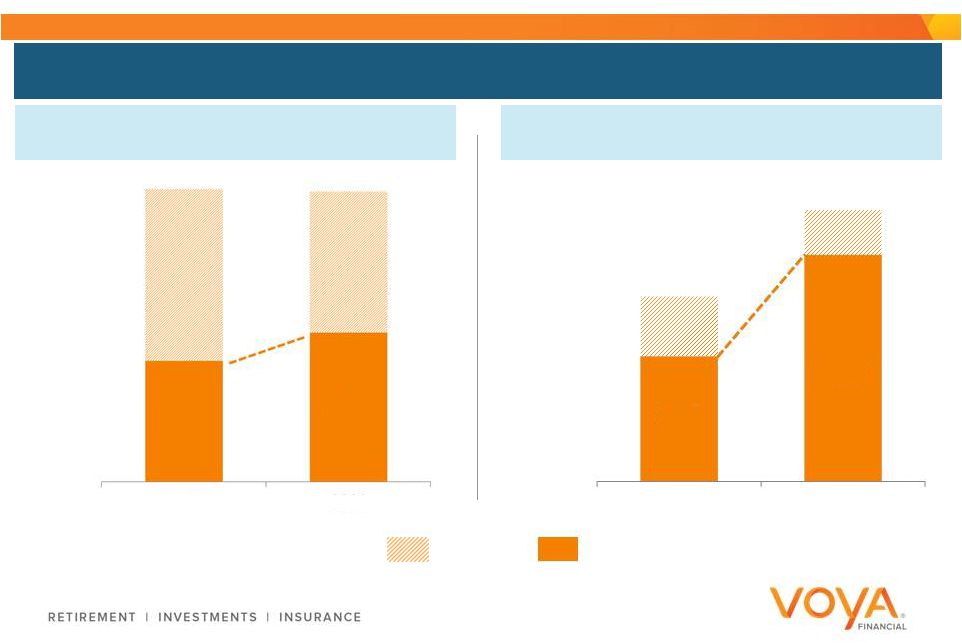
 9.0%
8.6%
Growth is the Biggest Driver Of Return on Capital
Continued product development / expansion
Continued growth of less capital-intensive
mutual fund custodial product
Expand distribution to underserved markets
Continued management of credited rates /
investment spread
Continued run-off of Annual Reset /
Multi-Year Guarantee Annuity block
Adjusted Operating ROC
Growth
Margin
9.5–10.5%
Items we do not expect to recur at the same levels
52
FY'14
2018 Target |
 Launched 1Q’15
Enhancing Product Solutions is Key to Return on Capital Expansion
Developing Solutions to Meet Evolving Customer Needs
Launched 1Q’15
Expected Launch 3Q’15
53
PotentialPLUS
WealthBuilder Plus
Accumulation
Some downside protection
Indexed withdrawal benefit
rider provides enhanced
guaranteed income
potential
Accumulation
Income
Protection
Non-Qualified complement to
our Mutual Fund Custodial
product
Accumulation
Tax-deferral
Liquidity
Preferred Advantage
Provides increased
accumulation potential
Structured Annuity
Needs Addressed:
Fixed Indexed Annuity
Needs Addressed:
Investment-Only VA
Needs Addressed: |
 Annuities Key Themes
54
Enhanced Product Solutions to Drive Return on Capital
2
1
Dependable Solutions Partner for a Diverse Distribution Network
3
Positioned to Meet the Income Needs of Customers |
 Annuities Helps Customers Invest and Protect
55
Denotes value delivered to
customer by Annuities
Plan
Invest
Protect |
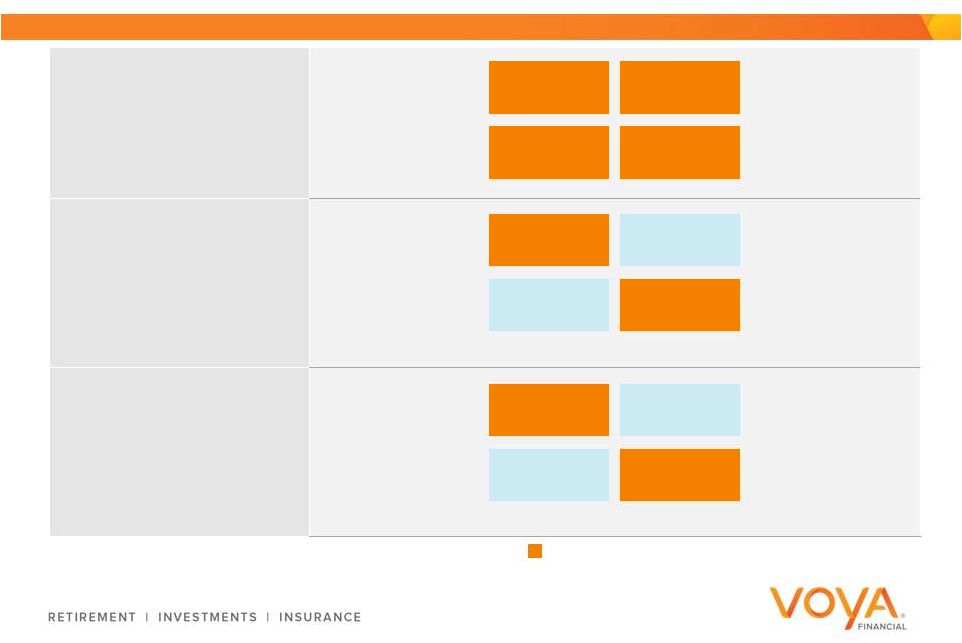
 Annuities Works Across All of Voya to Deliver Income Solutions
Common Business Areas
Individual
Retail Intermediary
Retirement
Individual Life
Employee
Benefits
Investment
Management
56
Joint Solutions
with Annuities
Markets in Common
with Annuities
Intersecting Distribution
with Annuities
Retirement
Individual Life
Investment
Management
Employee
Benefits
Retirement
Individual Life
Investment
Management
Employee
Benefits |
 Opportunity to Develop Joint Income Solutions
Single Premium
Immediate Annuity
Voya Annuities
Target Payment Fund
Voya Investment
Management
Joint Retirement Income Solution
57
Flexibility to choose desired allocations
Guaranteed lifetime income
Additional growth generated by fund performance
Liquidity
Beneficiaries access to residual funds
Packaged solution integrated with
myOrangeMoney provides:
|
 Annuities Key Themes
58
Enhanced Product Solutions to Drive Return on Capital
2
1
Dependable Solutions Partner for a Diverse Distribution Network
3
Positioned to Meet the Income Needs of Customers |
 Charlie Nelson
Chief Executive Officer, Retirement
Retirement |
 Retirement Key Themes
60
Growth Initiatives to Drive Return on Capital Expansion
2
1
Making it Simpler to be Ready for Retirement
3
Leveraging the Broader Enterprise for Customer Solutions
|
 61
1Q’15 TTM Adjusted Operating Earnings
Pre-Tax Contribution
Business Highlights
$314 billion AUM and AUA
1
Over 46,000 sponsors
Nearly 5 million participants
Multiple segments and markets
–
Corporate, Tax Exempt, IRA
–
Small, Mid, Large, Mega
Markets
–
Full service, Recordkeeping,
Retail Wealth Management
Large Retirement Provider With a Broad Customer Portfolio
1.
As of March 31, 2015
$550
million
in
TTM
Retirement
adjusted pre-tax operating earnings
Individual
Life
Employee
Benefits
Retirement
39%
Annuities
Investment
Management |
 62
Potential for Growth Across All Defined Contribution Markets
Markets
Voya
Financial
®
Share
Of Industry DC Assets
Industry
Defined
Contribution
1
Assets
Profit Pool
Small/Mid
Corporate
2
Government
Healthcare
Education
Large/Mega
Corporate
4%
5%
6%
8%
10%
1.
Sterling Resources Custom Analysis, May 2015 (Based on 2013 Data)
2.
Plans with $100 million or less in AUM/AUA
3.
Plans with $100 million or more in AUM/AUA
3 |
 63
Making It Simpler to be Ready for Retirement
Ease of Access: Digital, Phone, Affiliated and Non-
Affiliated Advisors
Expansive Footprint Across 50 States
Complementary Advisor Business Model
Small to Mega Multi-Segment Capabilities and Expertise
|
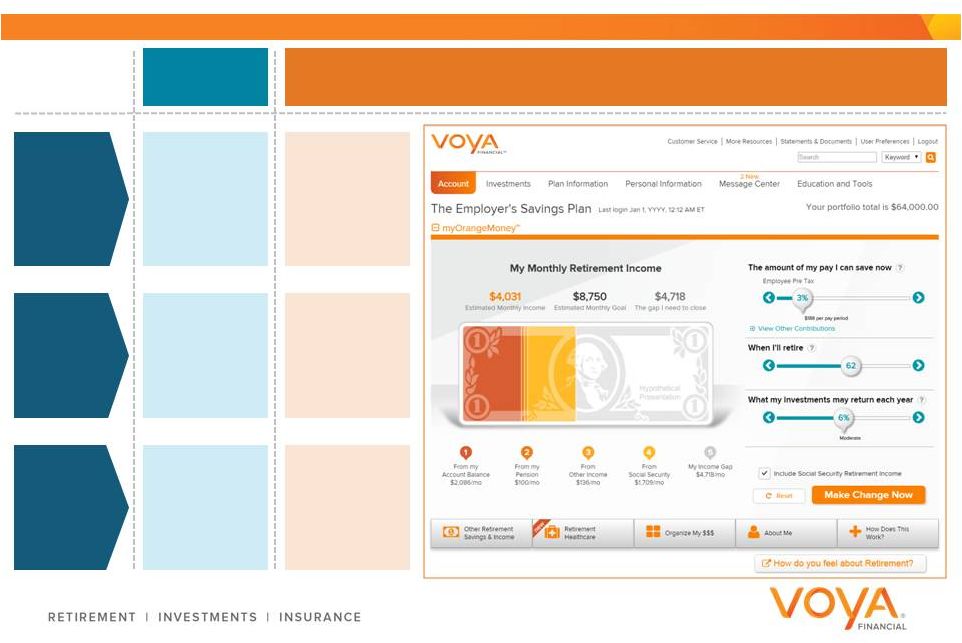 myOrangeMoney
TM
Industry
Method
Context
Account
Balance
Retirement
Income
Content
Seamlessly
Integrated
Action
Delayed /
No Action
Instant
64
Ease of Access is Revolutionized by Voya Retirement Income
Digital Solutions
Manually
Entered |
 |
 Retirement Key Themes
66
Growth Initiatives to Drive Return on Capital Expansion
2
1
Making it Simpler to be Ready for Retirement
3
Leveraging the Broader Enterprise for Customer Solutions
|
 Enhancing distribution and market reach
Leveraging cross-market relationships
Advancing retirement focused solutions
Target client engagements that align with our
value proposition
Technology investments
Continuous management of in-force block
Growth
Margin
Items we do not expect to recur at the same levels
Adjusted Operating ROC
67
Retirement
Target
of
11
-
12%
Return
on
Capital
by
2018
9.2%
8.9%
11–12%
FY'14
2018 Target |
 Drive Asset Growth: New Plan Sales, Retention, Account Optimization
68
Enhancing Distribution Reach is Key to Return on Capital Expansion
Distribution channels
Internal sales and servicing staff
Affiliated / non-affiliated advisors
Strengthening data analytics
Optimizing customer engagement
and action
Expanding product suite
Advancing Productivity
Furthering Breadth and Depth |
 Retirement Key Themes
69
Growth Initiatives to Drive Return on Capital Expansion
2
1
Making it Simpler to be Ready for Retirement
3
Leveraging the Broader Enterprise for Customer Solutions
|
      Retirement Helps Customers Plan, Invest, and Protect
70
Denotes value delivered to customer by
Retirement
Plan
Invest
Protect |
 Multiple Opportunities to Leverage the Broader Enterprise For
Cross-Market Solutions
71
Joint Solutions
with Retirement
Markets in Common
with Retirement
Intersecting Distribution
with Retirement
Common Business Areas
Individual
Institutional
Retail Intermediary
Institutional
Annuities
Investment
Management
Individual Life
Employee
Benefits
Annuities
Investment
Management
Individual Life
Employee
Benefits
Annuities
Investment
Management
Individual Life
Employee
Benefits
Annuities
Investment
Management
Individual Life
Employee
Benefits
Annuities
Investment
Management
Individual Life
Employee
Benefits |
 72
Aging Demographic
Regulatory Changes
“DB-ing”
DC Plans
Demand
drivers
create
opportunity
for
lifetime
retirement
income
solutions
Delivered With Advice & Guidance
Workplace and
Personal Savings
Voya Retirement
Retirement Income
Voya Annuities
Increasing Opportunity to Deliver Retirement Income |
 Retirement Key Themes
73
Growth Initiatives to Drive Return on Capital Expansion
2
1
Making it Simpler to be Ready for Retirement
3
Leveraging the Broader Enterprise for Customer Solutions
|
 Jeff Becker
Chief Executive Officer, Investment Management
Investment
Management |
 Investment Management Key Themes
75
Asset Growth is the Primary Driver Behind Increasing Margins
and Earnings
2
1
Reliable Investing is Investment Management’s Core Proposition
3
Product Solutions Address Customer Needs Across Life Stages
|
 Full Service,
Multi-Asset Investment Manager 1Q’15 TTM Adjusted Operating Earnings
Pre-Tax Contribution
$209 billion AUM
1
Over 900 employees and 200 investment
professionals
Top 20 manager of U.S. institutional tax
exempt
assets
2
Top 20 manager of U.S. institutional tax
exempt
Defined
Contribution
assets
2
#26 manager of open-end mutual funds and
variable
portfolios
3
Equities, fixed income, alternatives
Multi-asset solutions
Retail, institutional, and retirement
Business Highlights
1.
As of March 31, 2015
2.
Pensions & Investments Magazine, Money Manager Directory (based on 401(k), 403(b), 457 and DB
assets as of December 31, 2014) 3.
SimFund MF, SimFund VP, excludes ETFs and Money Market Funds as identified by SimFund (March 31,
2015) 76
$207
million
in
TTM
Investment
Management
adjusted
operating
earnings
Retirement
Annuities
Individual
Life
Employee
Benefits
Investment
Management
15% |
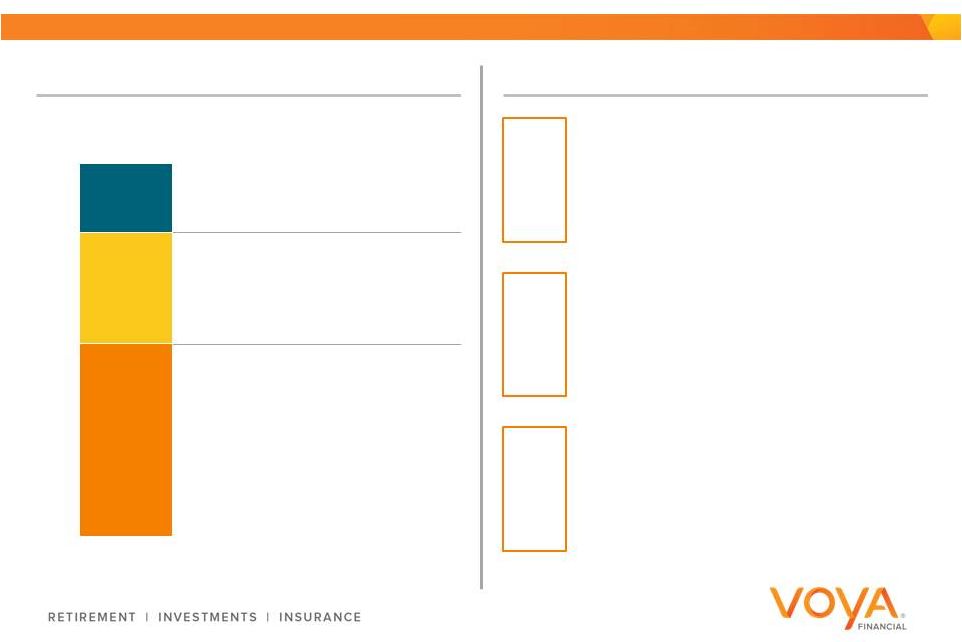 Data Source: McKinsey & Company
YE2013 AUM = $29.8 trillion
Defined Contribution
Retail
Institutional (excl. Defined
Contribution)
18%
52%
30%
US Industry Assets by Market Segment
Key Growth Segments
Defined Contribution Investment Only
is the fastest growing component of the
Defined Contribution market
2
1
3
toward individual responsibility and Baby
Boomer retirements
Investment Management Well Positioned In Key Growth Segments
77
Insurance Outsourcing
a strong growth
component of Institutional
Retail Segment
growth driven by trend |
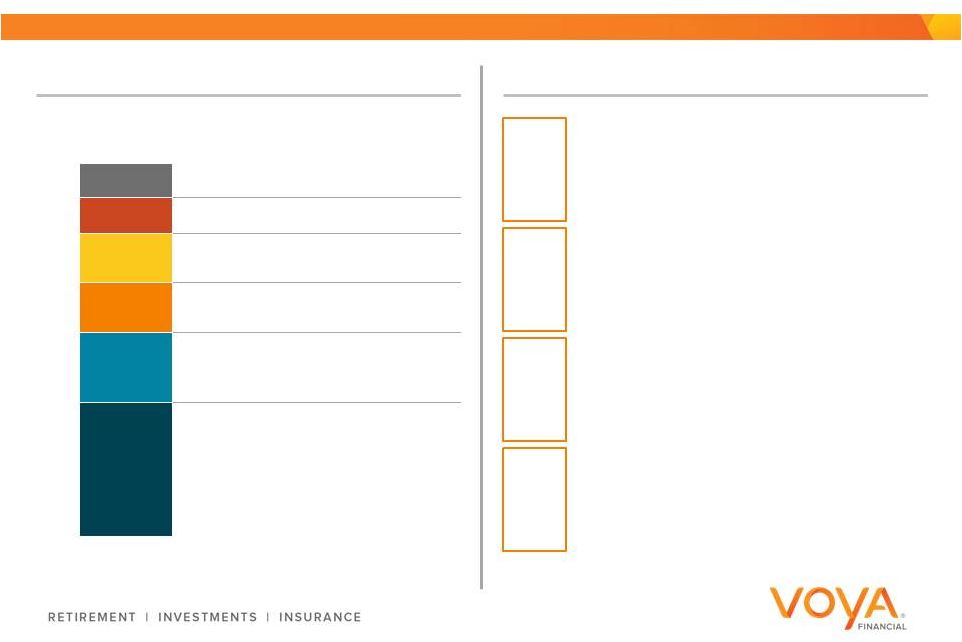 Investment Management Well Positioned In Key Asset Classes
YE2013 AUM = $29.8 trillion
Money Market
Active Equity
Passive
9%
36%
13%
US Industry Assets by Strategy
Key Asset Classes
Specialized active Fixed Income and
Equity
in strong demand
2
Multi-Asset Solutions
driving DC growth,
capturing vast majority of flows
1
4
Passive, Smart Beta, & ETF strategies,
increasing flows and market share
Balanced / Multi-Asset
10%
Alternatives
13%
Active Fixed Income
19%
3
Alternative and Private Assets
moving to “Main Street”
78
Data Source: McKinsey & Company |
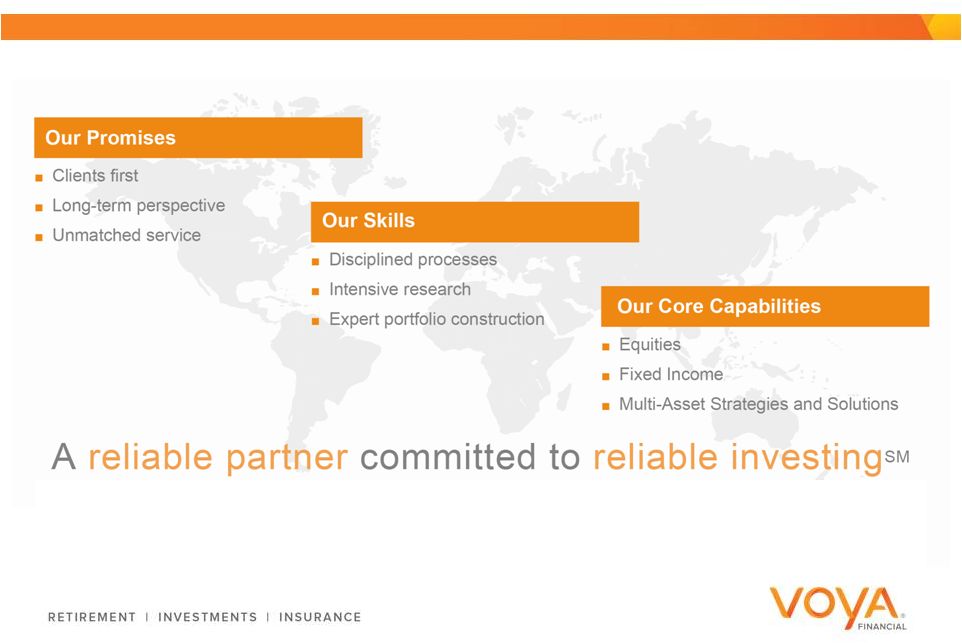 Stewardship and Service Guide Investment Management
79 |
 Reliable Investing is Foundational to Investment Management
Team-oriented approach based in
deep research
Risk-aware portfolio construction
Consistent, disciplined, and
repeatable investment processes
Core Tenets
Reliable
investment
performance
More consistency
Strong upside /
downside capture
How We View Success
Unconstrained investment thinking
Long-term perspective
80 |
 Reliable
Investing
Delivered
Through
Five
Scaled
Platforms
Multi-Asset
Strategies &
Solutions
Private Equity
Fixed
Income
Public
Equity
Senior
Loans
Assets
$119
billion
2
Assets
$20 billion
Assets
$30 billion
3
Assets
$50 billion
Assets
$7 billion
(Pomona Capital)
Average
CIO
experience
4
30 years
81
1.
Voya IM assets of $209 billion as reported in Voya Financial, Inc. SEC filings,
include approximately $8 billion in Real Estate and $5 billion in other assets including those sub-advised
through the Voya family of funds and the Multi-Asset Strategies and Solutions
product offerings 2.
Total Fixed Income assets include proprietary insurance general account assets
totaling $79 billion as reported in Voya Financial, Inc. SEC filings 3.
The Multi-Asset team AUM are included in other categories shown on the page,
and / or are managed by external entities 4.
Total years in industry
Data as of March 31, 2015
1 |
 Strong
Investment Track Records Over Time %
of
IM
1
assets
outperforming
either
benchmark
or
peer
median
5-year
returns
100%
92%
64%
99%
Fixed Income
Senior Loan
Public Equity
Multi-Asset
82%
As of 1Q’15
Total Firm
82
1.
Excludes Pomona Private Equity. Metrics presented measure each investment product based on (i) rank
above the median of its peer category within Morningstar (mutual funds) or eVestment
(institutional composites) for unconstrained and fully-active investment products; or (ii) outperformance against its benchmark index for
“index-like”, rules-based, risk-constrained, or client-specific investment
products |
 Strong
Outperformance with Less Risk Over Time 91%
of Voya IM-managed Mutual Fund and Variable
Portfolio assets had investment returns
that beat
their
ten-year
Morningstar
category
average
1
81%
of Voya IM-managed Mutual Fund and Variable
Portfolio assets have had less risk
than
their
ten-year
Morningstar
category
average
1
83
1.
All data sourced from Morningstar as of March 31, 2015, including monthly total return and standard
deviation data for both Morningstar category averages and Voya IM Mutual Funds and Variable
Portfolios. Investment Return metric defined as the asset-weighted % of IM-managed Mutual Fund and Variable Portfolio assets with
higher total returns than the applicable Morningstar category average. Risk metric defined as the
asset-weighted % of IM-managed Mutual Fund and Variable Portfolio assets with lower
standard deviations than the applicable Morningstar category average |
 Investment Management Key Themes
84
Asset Growth is the Primary Driver Behind Increasing Margins
and Earnings
2
1
Reliable Investing is Investment Management’s Core Proposition
3
Product Solutions Address Customer Needs Across Life Stages
|
 Franchise at Scale Poised for Future Earnings Growth
Earnings & Margin Expansion
Operating Earnings Before Income Tax ($, million)
Operating Margin, including capital
Key Drivers, 2011-2014
Commercial
AUM Growth
Average Annual
Expense Growth
Cumulative Net
Flows
Average Annual
Revenue Growth
$47+
billion
2%
$27+
billion
10%
1
1
85
1.
Excludes gain from Lehman Recovery
$50
$88
$135
$165
$210
2010
2011
2012
2013
2014
11.0%
17.8%
24.6%
27.7%
32.1% |
 Key
Initiatives to Achieve 2018 Financial Targets Key Initiatives
Operating Margin
33.0-35.0%
Client
Segments
•
Defined Contribution Investment Only /
Sub-advisory / 529
•
Intermediary retirement strategy
•
Insurance outsourcing
Specialized
Product &
Capability
Extensions
•
Unconstrained fixed income
•
Private credit
•
Concentrated equity
•
Global equity
•
Alternatives and structures
Ongoing
Infrastructure
Reinvestment
•
Sales force productivity enhancements
•
Technology & operations
•
Customer service capabilities
Enterprise
Retirement
•
Qualified Default Investment
Alternative (QDIA) options
•
Target date / Target risk strategies
•
Income solutions
86
32.1%
2014
2018
Results from investment capital |
 Investment Management Key Themes
87
Asset Growth is the Primary Driver Behind Increasing Margins
and Earnings
2
1
Reliable Investing is Investment Management’s Core Proposition
3
Product Solutions Address Customer Needs Across Life Stages
|
 Investment Management Helps Customers Plan, Invest, and Protect
Denotes value delivered to
customer by Investment
Management
88
Plan
Invest
Protect |
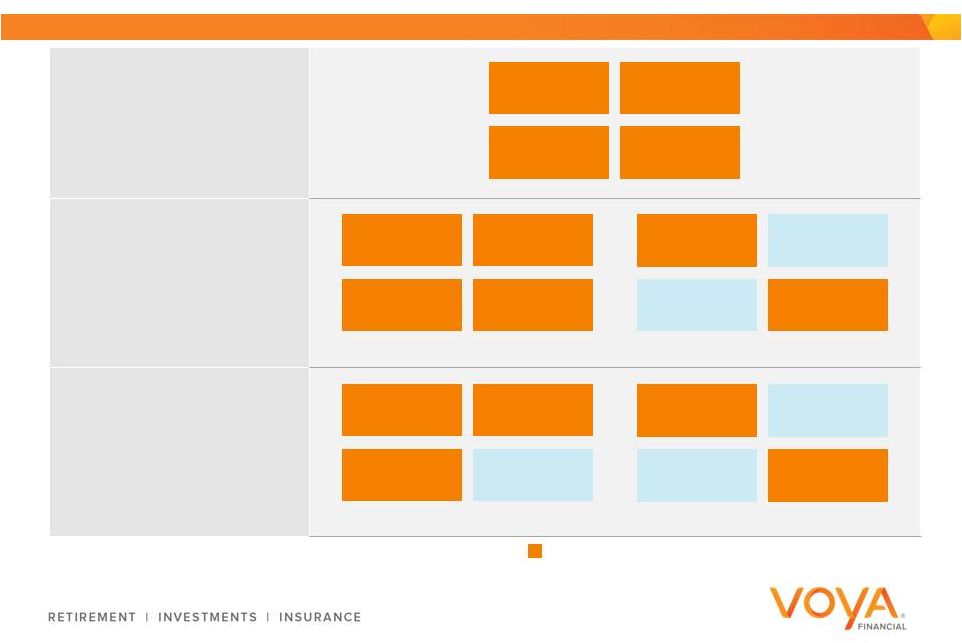 Investment Management is a Key Part of Enterprise Solutions
Common Business Areas
89
Retirement
Individual Life
Employee
Benefits
Annuities
Individual
Retirement
Individual Life
Employee
Benefits
Annuities
Institutional
Retirement
Individual Life
Employee
Benefits
Annuities
Retail Intermediary
Retirement
Individual Life
Employee
Benefits
Annuities
Institutional
Retirement
Individual Life
Employee
Benefits
Annuities
Joint Solutions
with Investment Management
Markets in Common
with Investment Management
Intersecting Distribution
with Investment Management |
 Institutional Money Management
Capital Market Structures & Transactions (CLO)
General Account Management
Advisor-led Individual Savings
Investment Management Addresses a Range of Client Needs
90
Institutional
Client Partner
Solutions
B2B
Individual
Customer
Solutions
B2B2C
Advisor-led Individual Retirement
Voya Enterprise Solutions
Insurance Outsourcing
NEW
NEW
NEW
DCIO / Sub-Advisory
529 College Savings
Custom Target Date
Being Added 2014+
Added 2009-2013
IM Foundation Pre-2009
Phased Extensions of Reliable Investing |
 Investment Management Key Themes
91
Asset Growth is the Primary Driver Behind Increasing Margins
and Earnings
2
1
Reliable Investing is Investment Management’s Core Proposition
3
Product Solutions Address Customer Needs Across Life Stages
|
 Mike Smith
Chief Executive Officer, Insurance Solutions
Insurance Solutions |
 Employee Benefits Key Themes
93
Growing Earnings at an Attractive Return on Capital
2
1
Proven Success in Mid-to-Large Employer Market
3
A More Comprehensive Employee Financial Wellness Solution
|
 1Q’15 TTM Adjusted Operating Earnings
Pre-Tax Contribution
Business
Highlights
1
94
In-force Product Mix
$177
million
in
TTM
Employee
Benefits
adjusted
operating
earnings
1.
Data as of March 31, 2015
1.6 billion of premium & fees in-force
1,600 active employers served
5.5 million individuals covered
Investment
Management
Individual Life
Employee
Benefits
13%
Retirement
Annuities
Life
30%
Disability
6%
Stop Loss
52%
Voluntary
12%
A Substantial and Balanced Book of Business |
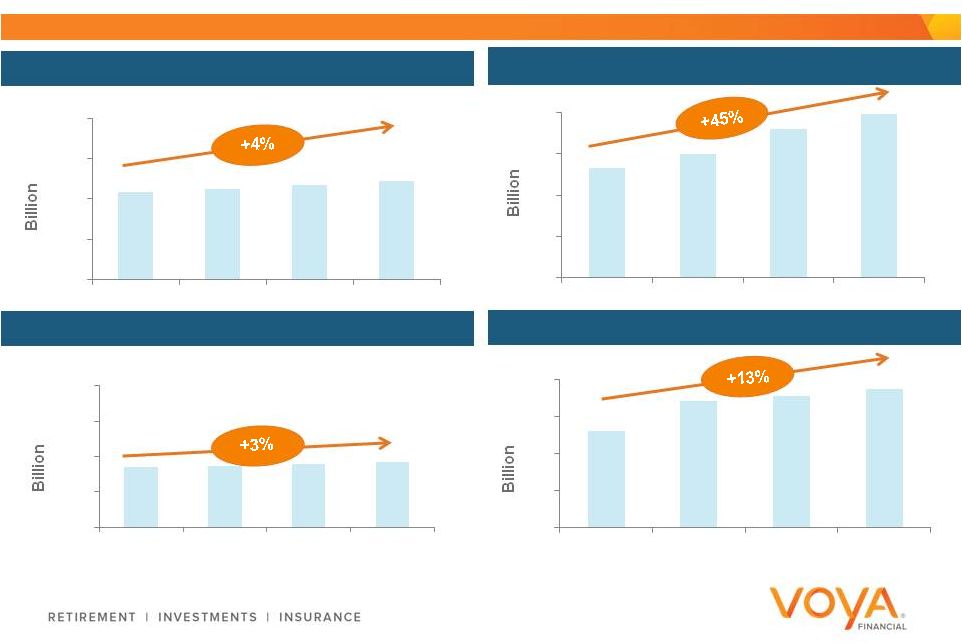 Markets Provide Combination of Growth Environments and
Mature, Stable Products
95
Group Life Industry Trend
Stop Loss Industry Trend
Group Disability
Voluntary Industry Trend
1
1.
Source: For Stop Loss, Citi Research. LIMRA US Group Life & Disability Sales
& In-force Reports; Eastbridge Consulting Voluntary $10
$3
$0
$20
$30
$40
2011
2012
2013
2014
$0
$6
$9
$12
2011
2012
2013
2014
$0
$10
$20
$30
$40
2011
2012
2013
2014
$0
$10
$20
$30
$40
2011
2012
2013
2014 |
 Experienced distribution team sells all solutions
Regional sales and service model
Long-term approach to customer relationships
Stop Loss provides differentiation
Building Long-Term Relationships with Experience and Trust
96
Highlights |
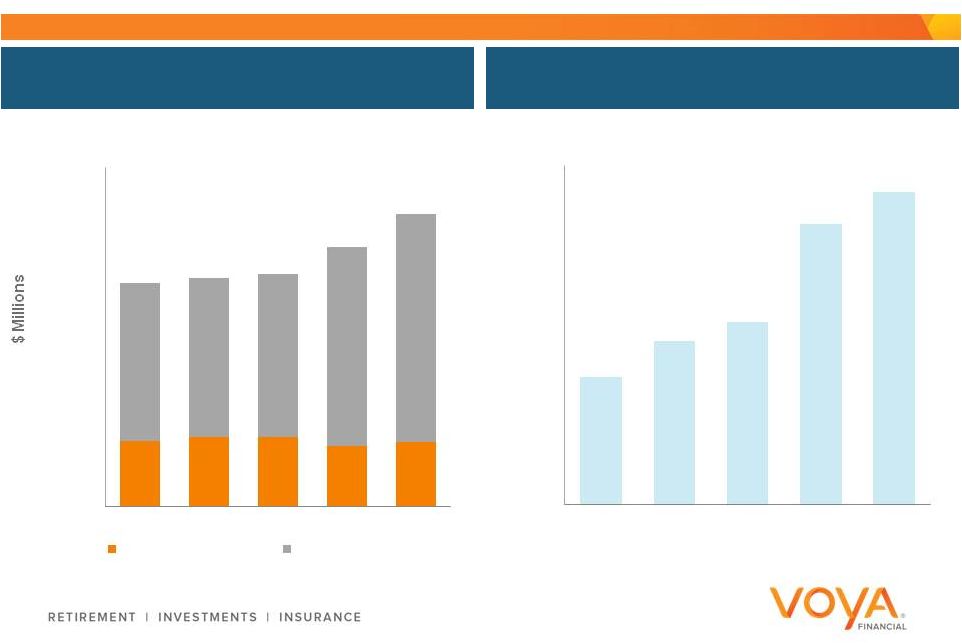 97
In-force Premium by Segment
Adjusted Operating Return on Capital
Proven Ability to Grow Profitably in the Mid and Large Employer
Markets
$-
$200
$400
$600
$800
$1,000
$1,200
$1,400
$1,600
2011
2012
2013
2014
1Q'15
<1,000 Employees
+1,000 Employees
0%
5%
10%
15%
20%
25%
30%
35%
2011
2012
2013
2014
1Q’15
TTM |
 Employee Benefits Key Themes
98
Growing Earnings at an Attractive Return on Capital
2
1
Proven Success in Mid-to-Large Employer Market
3
A More Comprehensive Employee Financial Wellness Solution
|
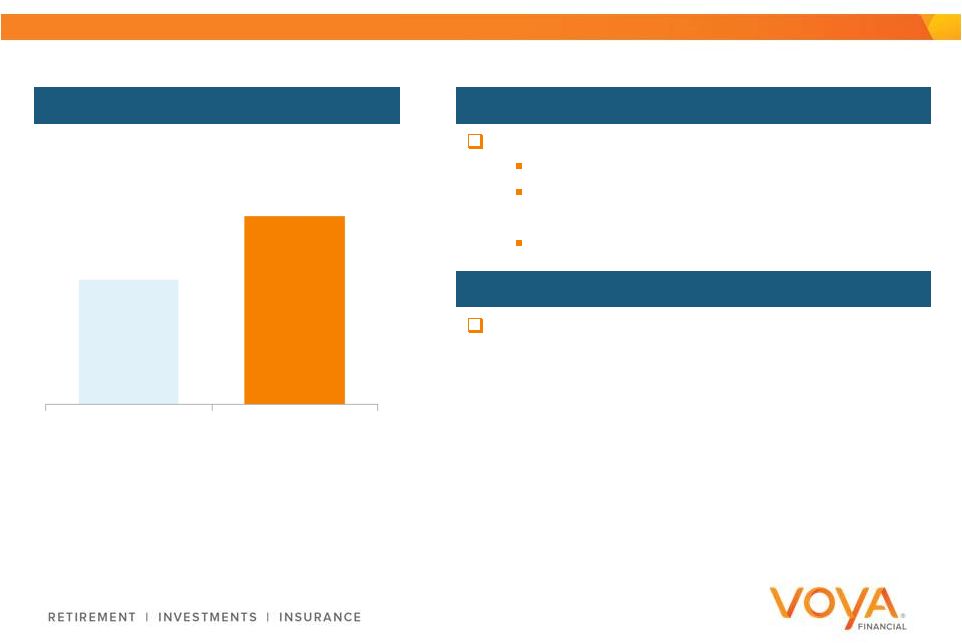
 28.9%
Mid-Market expansion
Private exchange market growth
Leveraging Stop Loss market position
Growth
23–25%
Adjusted Operating ROC
99
Growing at an Attractive Return on Capital
FY'14
2018 Target |
 MID-MARKET EXPANSION
PRIVATE EXCHANGE GROWTH
Adjusted sales incentives
Aligned model (national and local)
Profitable Growth via Mid-Market Expansion and Private Exchange
Potential
Partnered with 8 private exchanges
Leverage Stop Loss leadership
Packaged solutions
Enhanced customer experience
Selective approach -
Holistic offering
100 |
 Employee Benefits Key Themes
101
Growing Earnings at an Attractive Return on Capital
2
1
Proven Success in Mid-to-Large Employer Market
3
A More Comprehensive Employee Financial Wellness Solution
|
 102
Denotes value delivered to
customer by Employee
Benefits
Plan
Invest
Protect
Employee Benefits Helps Employers and Employees Plan and
Protect |
 103
Many Common Areas Across Organization
Joint Solutions
with Employee Benefits
Markets in Common
with Employee Benefits
Intersecting Distribution
with Employee Benefits
Retirement
Annuities
Individual Life
Investment
Management
Retirement
Annuities
Individual Life
Investment
Management
Institutional
Common Business Areas
Retirement
Annuities
Individual Life
Investment
Management
Institutional |
 104
Working with Retirement is a Significant Near-Term Opportunity
Employee Benefits
Retirement
< 5%
Note: This reflects institutions that have 200 or more covered lives or plan
participants >1,200 institutions
4.2 million covered
lives
$1.1 billion in-force
premium
>1,600 institutions
2.5 million plan
participants
>$180 billion of
assets |
 Employee Benefits Key Themes
105
Growing Earnings at an Attractive Return on Capital
2
1
Proven Success in Mid-to-Large Employer Market
3
A More Comprehensive Employee Financial Wellness Solution
|
 Individual Life Key Themes
106
In-force Management Drives Improved Returns
2
1
Focused Distribution with a Commitment to Customer Financial
Wellness
3
Range of Solutions Addresses Customer Needs Across All Life
Stages |
 A
Scale Platform with Focus 1Q’15 TTM Adjusted Operating Earnings
Pre-Tax Contribution
$473 billion insurance in-force
1.1 million policies
$98 million of sales, 57% indexed
universal life
2
Approximately 100 aligned distributors
Business
Highlights
107
$233
million
in
TTM
Individual
Life
adjusted operating earnings
1.
Data as of March 31, 2015
2.
Last 12 months
Annuities
Investment
Management
Individual
Life
16%
Employee
Benefits
Retirement
1
|
 Industry 1 ($ billions) Voya Financial ($ millions) 2014 Sales Annualized Premium Other UL IUL 108 Capturing Indexed Universal Life Growth $27.6 $49.8 $13.2 $9.9 2013 2014 $1.6 $2.0 $2.3 $1.9 2013 2014 1. LIMRA U.S. Retail Individual Life Insurance Sales Fourth Quarter 2013; LIMRA U.S. Retail Individual Life Insurance Sales Fourth Quarter 2014
|
 Customer focused
products
Customer education
Aligned Distributors focus on
customers retirement readiness
Sales tools
109
Enable Aligned Distributors to Do More for Customers |
 Voya Life Journey
“This is truly one of the most impressive attempts by a major life insurance
carrier to reach out to assist their sales force in a really meaningful
manner.” -Aligned Distribution Partner
110
New Technology Enables Customer Financial Wellness Solutions
|
 Individual Life Key Themes
111
In-force Management Drives Improved Returns
2
1
Focused Distribution with a Commitment to Customer Financial
Wellness
3
Range of Solutions Addresses Customer Needs Across All Life
Stages |
 Improve in-force profit metrics
Manage non-guaranteed elements
Reduce redundant reserve financing
cost
Digitize operational processes
Exploring opportunities to further reduce
capital usage
Margin
Capital
7.5–8.5%
Adjusted Operating ROC
112
In-force Management is the Biggest Driver of ROC Improvement
FY'14
2018 Target
5.3% |
 Individual Life Key Themes
113
In-force Management Drives Improved Returns
2
1
Focused Distribution with a Commitment to Customer Financial
Wellness
3
Range of Solutions Addresses Customer Needs Across All Life
Stages |
 Individual Life Helps Customers Plan, Invest, and Protect
114
Denotes value delivered to
customer by Individual Life
Plan
Invest
Protect |
 Individual Life Can Play a Key Role Across the Organization
115
Common Business Areas
Markets in Common
with
Individual Life
Joint
Solutions
with Individual Life
Intersecting Distribution
with
Individual Life
Individual
Retail Intermediary
Retirement
Employee
Benefits
Investment
Management
Annuities
Retirement
Employee
Benefits
Investment
Management
Annuities
Retirement
Investment
Management
Annuities
Employee
Benefits |
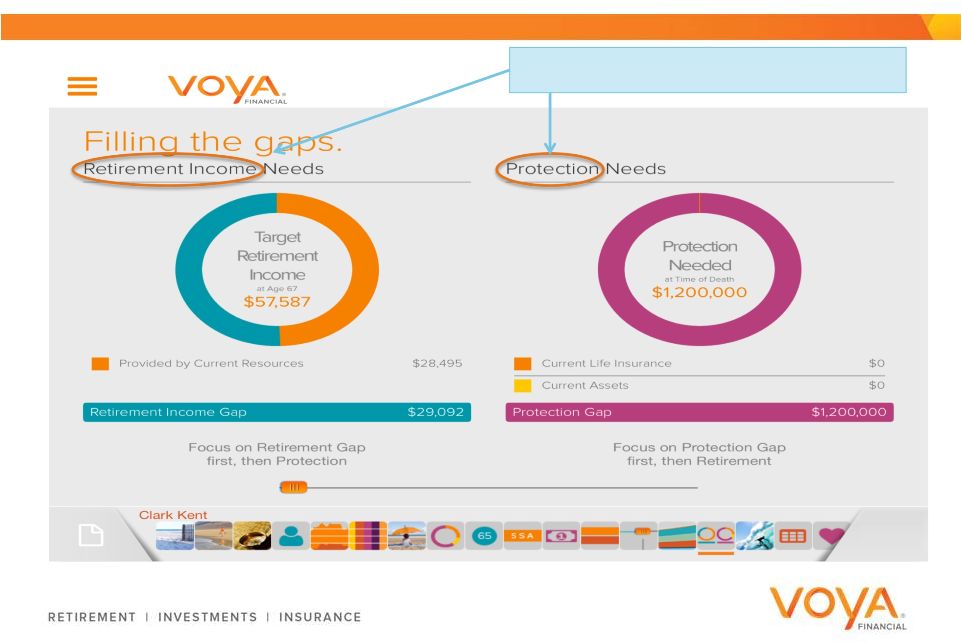 116
Voya Life Journey App Can Leverage the Enterprise Capabilities
Addressing Retirement Income and
Protection Needs |
 Individual Life Key Themes
117
In-force Management Drives Improved Returns
2
1
Focused Distribution with a Commitment to Customer Financial
Wellness
3
Range of Solutions Addresses Customer Needs Across All Life
Stages |
 Rod Martin
Chairman and Chief Executive Officer
Closing Remarks |
 Investor Day Overall Key Takeaways
119
Team Delivered on the IPO Plan and Remains Focused on Execution
Strong and Experienced Leadership
Each Business has a Strong Value Proposition that Together can
Differentiate Voya’s Value Proposition |