Attached files
| file | filename |
|---|---|
| 8-K - 8-K - ZIONS BANCORPORATION, NATIONAL ASSOCIATION /UT/ | form8-k.htm |
| EX-99.2 - EXHIBIT 99.2 - ZIONS BANCORPORATION, NATIONAL ASSOCIATION /UT/ | exhibit_92.htm |
June 1, 2015 Zions’ Path to Substantial Improvement of Profitability
Forward-Looking Statements & Peer Group Abbreviations This presentation contains statements that relate to the projected or modeled performance or condition of Zions Bancorporation and elements of or affecting such performance or condition, including statements with respect to forecasts, targets, opportunities, models, illustrations, scenarios, beliefs, plans, objectives, goals, guidance, expectations, anticipations or estimates, operational and financial initiatives and similar matters. These statements constitute forward-looking information within the meaning of the Private Securities Litigation Reform Act. Actual facts, determinations, results or achievements may differ materially from the statements provided in this presentation since such statements involve significant known and unknown risks and uncertainties. Factors that might cause such differences include, but are not limited to: competitive pressures among financial institutions; economic, market and business conditions, either nationally, internationally, or locally in areas in which Zions Bancorporation conducts its operations, being less favorable than expected; changes in the interest rate environment reducing expected interest margins; changes in debt, equity and securities markets; adverse legislation or regulatory changes; Federal Reserve reviews of our annual capital plan; Zions’ ability to execute effectively and efficiently the initiatives described in this presentation; and other factors described in Zions Bancorporation’s most recent annual and quarterly reports. In addition, the statements contained in this presentation are based on facts and circumstances as understood by management of the company on the date of this presentation, which may change in the future. Except as required by law, Zions Bancorporation disclaims any obligation to update any statements or to publicly announce the result of any revisions to any of the forward- looking statements included herein to reflect future events, developments, determinations or understandings. 2 BAC: Bank of America Corporation BBT: BB&T Corporation CMA: Comerica Incorporated C: Citigroup Inc. FITB: Fifth Third Bancorp HBAN: Huntington Bancshares Incorporated JPM: JPMorgan Chase & Co. KEY: KeyCorp MTB: M&T Bank Corporation PNC: PNC Financial Services Group, Inc. RF: Regions Financial Corporation STI: SunTrust Banks, Inc. UB: UnionBanCal Corporation USB: U.S. Bancorp WFC: Wells Fargo & Company ZION: Zions Bancorporation
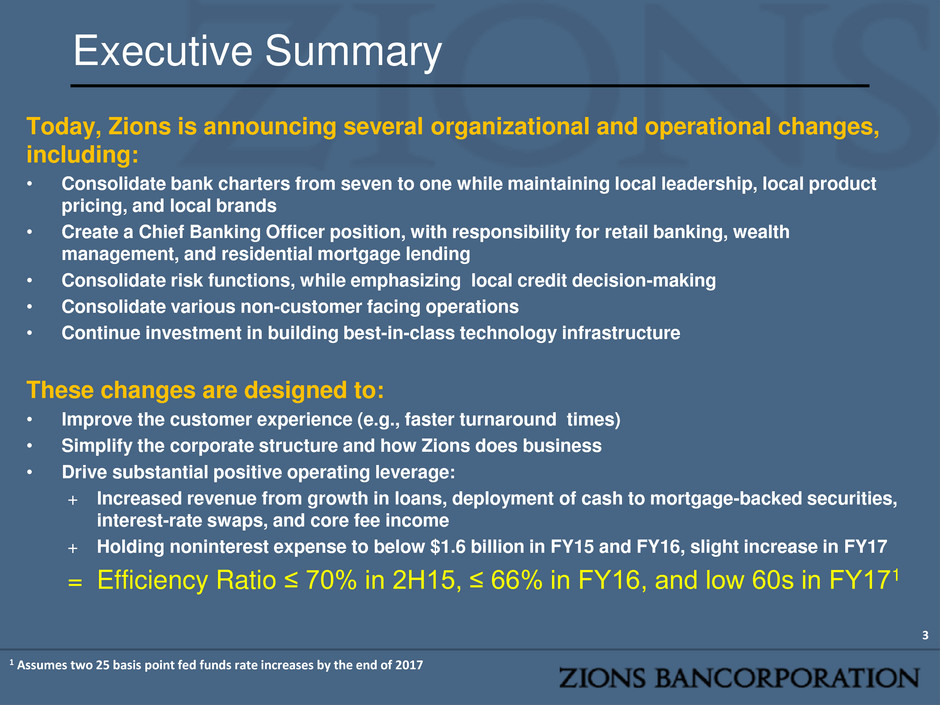
Today, Zions is announcing several organizational and operational changes, including: • Consolidate bank charters from seven to one while maintaining local leadership, local product pricing, and local brands • Create a Chief Banking Officer position, with responsibility for retail banking, wealth management, and residential mortgage lending • Consolidate risk functions, while emphasizing local credit decision-making • Consolidate various non-customer facing operations • Continue investment in building best-in-class technology infrastructure These changes are designed to: • Improve the customer experience (e.g., faster turnaround times) • Simplify the corporate structure and how Zions does business • Drive substantial positive operating leverage: + Increased revenue from growth in loans, deployment of cash to mortgage-backed securities, interest-rate swaps, and core fee income + Holding noninterest expense to below $1.6 billion in FY15 and FY16, slight increase in FY17 = Efficiency Ratio ≤ 70% in 2H15, ≤ 66% in FY16, and low 60s in FY171 3 Executive Summary 1 Assumes two 25 basis point fed funds rate increases by the end of 2017
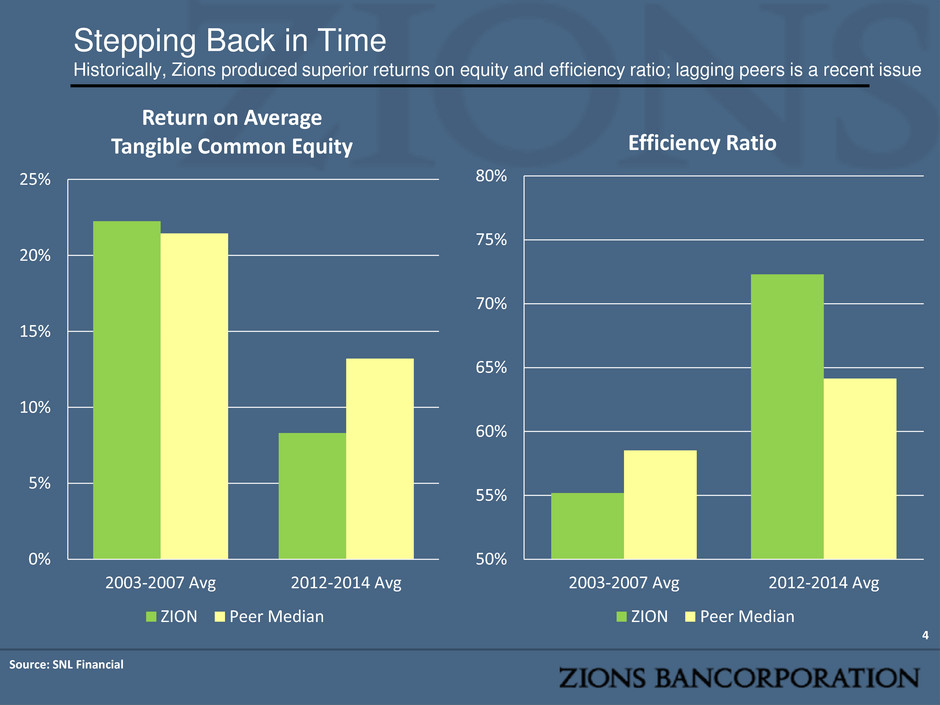
Stepping Back in Time Historically, Zions produced superior returns on equity and efficiency ratio; lagging peers is a recent issue 4 0% 5% 10% 15% 20% 25% 2003-2007 Avg 2012-2014 Avg Return on Average Tangible Common Equity ZION Peer Median 50% 55% 60% 65% 70% 75% 80% 2003-2007 Avg 2012-2014 Avg Efficiency Ratio ZION Peer Median Source: SNL Financial
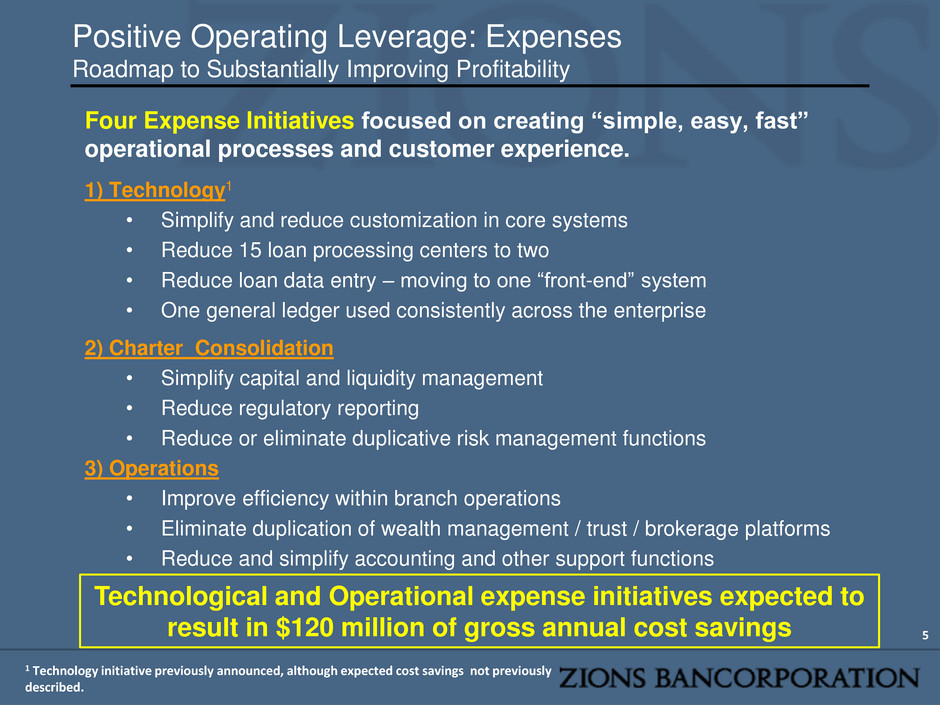
5 Positive Operating Leverage: Expenses Roadmap to Substantially Improving Profitability Four Expense Initiatives focused on creating “simple, easy, fast” operational processes and customer experience. 1) Technology1 • Simplify and reduce customization in core systems • Reduce 15 loan processing centers to two • Reduce loan data entry – moving to one “front-end” system • One general ledger used consistently across the enterprise 2) Charter Consolidation • Simplify capital and liquidity management • Reduce regulatory reporting • Reduce or eliminate duplicative risk management functions 3) Operations • Improve efficiency within branch operations • Eliminate duplication of wealth management / trust / brokerage platforms • Reduce and simplify accounting and other support functions 1 Technology initiative previously announced, although expected cost savings not previously described. Technological and Operational expense initiatives expected to result in $120 million of gross annual cost savings
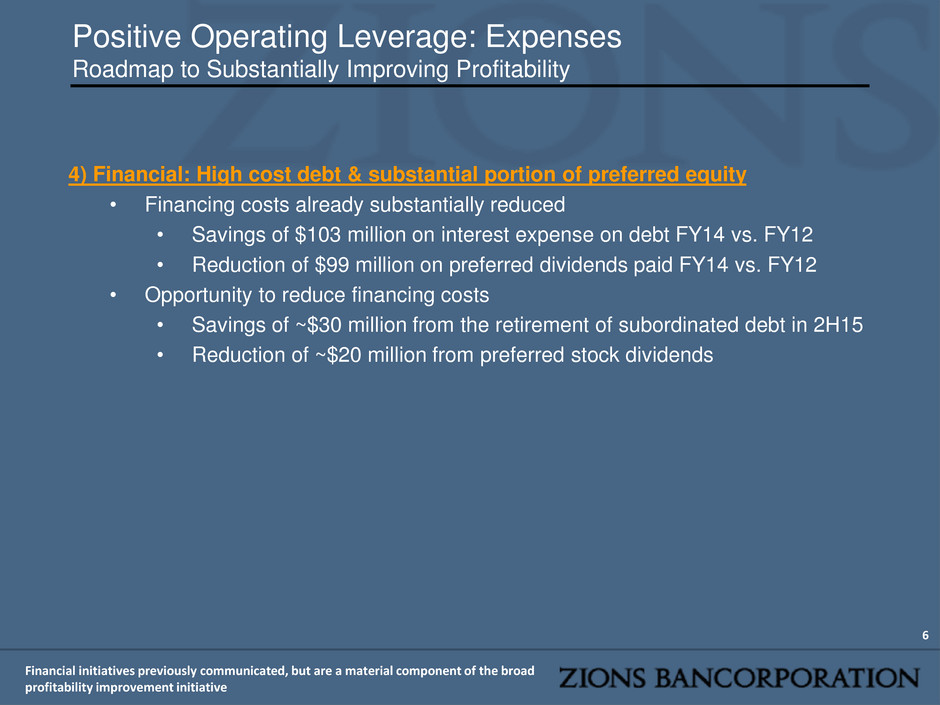
6 Positive Operating Leverage: Expenses Roadmap to Substantially Improving Profitability 4) Financial: High cost debt & substantial portion of preferred equity • Financing costs already substantially reduced • Savings of $103 million on interest expense on debt FY14 vs. FY12 • Reduction of $99 million on preferred dividends paid FY14 vs. FY12 • Opportunity to reduce financing costs • Savings of ~$30 million from the retirement of subordinated debt in 2H15 • Reduction of ~$20 million from preferred stock dividends Financial initiatives previously communicated, but are a material component of the broad profitability improvement initiative
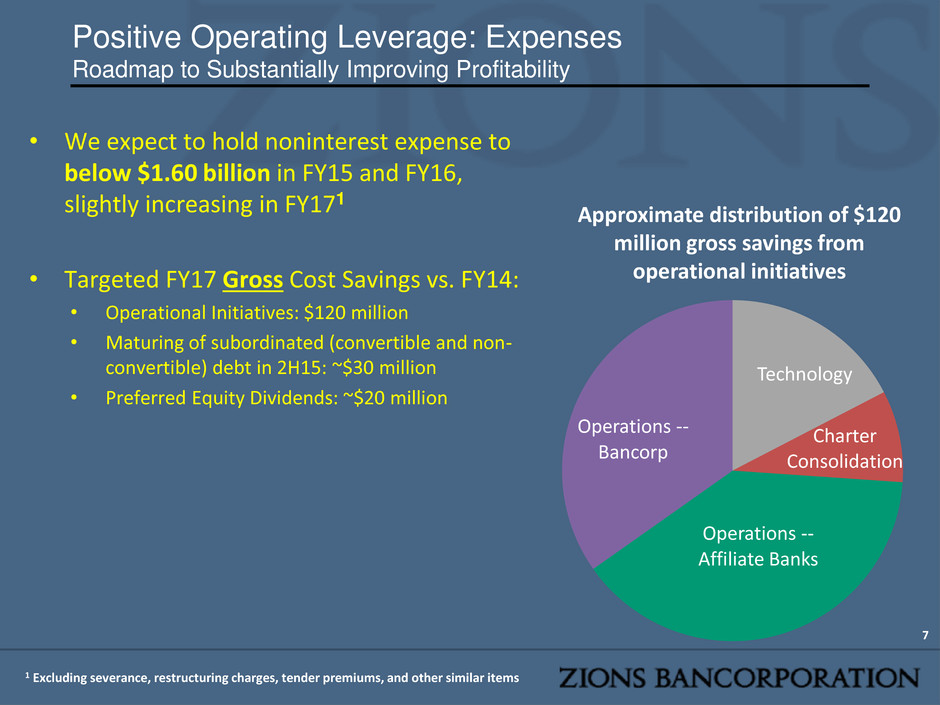
Positive Operating Leverage: Expenses Roadmap to Substantially Improving Profitability 7 • We expect to hold noninterest expense to below $1.60 billion in FY15 and FY16, slightly increasing in FY171 • Targeted FY17 Gross Cost Savings vs. FY14: • Operational Initiatives: $120 million • Maturing of subordinated (convertible and non- convertible) debt in 2H15: ~$30 million • Preferred Equity Dividends: ~$20 million Technology Charter Consolidation Operations -- Affiliate Banks Operations -- Bancorp Approximate distribution of $120 million gross savings from operational initiatives 1 Excluding severance, restructuring charges, tender premiums, and other similar items
8 Revenue Opportunities: Three Initiatives • Treasury / securities portfolio • Significantly asset sensitive – currently top decile within the industry • Capacity to add several billion dollars of mortgage-backed securities and interest-rate swaps • Expect to remain one of the more asset-sensitive U.S. banks • Fee income opportunities – newly created chief banking officer position focused on increasing fee income across retail banking, wealth management, and residential mortgage • Loan Growth: • Commercial & Industrial: Streamlined process to allow for more time spent developing business, without sacrificing credit quality • Commercial Real Estate – A natural strength of community banks, but subject to elevated losses under Fed’s CCAR model; Solution: currently developing syndication and loan sale platform • Residential: Recently completed overhaul of residential mortgage operations platform (2014), consolidated leadership of residential mortgage effort Positive Operating Leverage: Revenue Roadmap to Substantially Improving Profitability
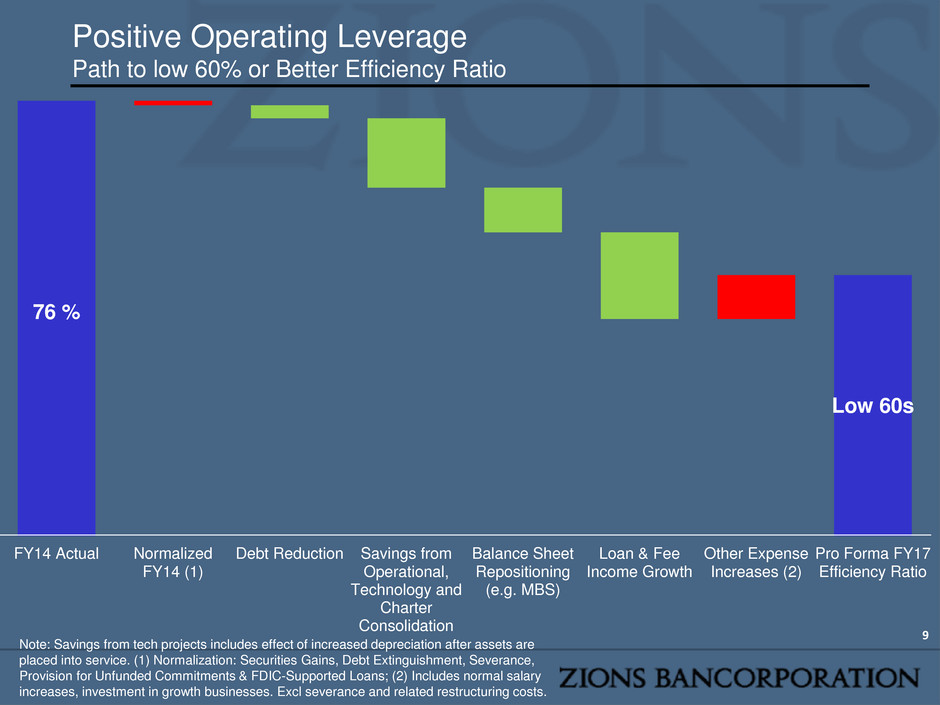
9 Positive Operating Leverage Path to low 60% or Better Efficiency Ratio 76 % Low 60s FY14 Actual Normalized FY14 (1) Debt Reduction Savings from Operational, Technology and Charter Consolidation Balance Sheet Repositioning (e.g. MBS) Loan & Fee Income Growth Other Expense Increases (2) Pro Forma FY17 Efficiency Ratio Note: Savings from tech projects includes effect of increased depreciation after assets are placed into service. (1) Normalization: Securities Gains, Debt Extinguishment, Severance, Provision for Unfunded Commitments & FDIC-Supported Loans; (2) Includes normal salary increases, investment in growth businesses. Excl severance and related restructuring costs.
10 What Remains the Same Staying Local When It Comes to the Customer Experience • Maintain local brands as currently constituted • Continue with customer-centric model (rather than silo / product- centric model) • Local CEOs remain responsible for: • Client-facing bankers • Product pricing (e.g., loan, deposit, fees) • Achievement of revenue targets • Direct expense controls • Maintain regional advisory boards of directors – strong community presence • Zions is one of only four (4) U.S. banks that have been consistently awarded more than 10 Greenwich Excellence awards since 2009, when the first survey was conducted. • 24 Greenwich Excellence Awards in 2014 • Changes outlined should not disrupt what drives Zions to be ranked by its customers among the best in U.S. banking industry
11 Conclusion • Commitment to hold noninterest expense to below $1.60 billion annually through 2016, slightly increasing and with substantial positive operating leverage in 2017 • Targeting an increase of revenue through: • Deployment of cash into MBS • Drive fee income growth • Drive loan growth • Anticipating the reduction of debt • Expecting the reduction of preferred equity • Events that may work in Zions’ favor: • Congressional or regulatory changes • Interest rates increase, likely resulting in a material increase in Return on Tangible Common Equity • Self-Help Story: Targeting to achieve low 60s efficiency ratio and a substantial improvement of Return on Tangible Common Equity without such events
12 Appendix: Potential Benefits, Offsets and Risks to Achieve Targeted Profitability • Significant Factors Included in Outlook: • Continued competitive pricing on loans • Increased salary and benefits from normal cost of living adjustments and merit increases • Investment in growth businesses • Potential Benefits Not Included in Outlook: • Congressional or regulatory changes (e.g., Shelby or Luetkemeyer bills) • Substantial increase in interest rate environment • Potential Risks Not Included in Outlook: • Further flattening of the yield curve • Emergence of significantly adverse credit environment
