Attached files
| file | filename |
|---|---|
| EXCEL - IDEA: XBRL DOCUMENT - BREEZE-EASTERN CORP | Financial_Report.xls |
| EX-23.1 - EX-23.1 - BREEZE-EASTERN CORP | bzc-ex231_201503317.htm |
| EX-31.2 - EX-31.2 - BREEZE-EASTERN CORP | bzc-ex312_201503316.htm |
| EX-31.1 - EX-31.1 - BREEZE-EASTERN CORP | bzc-ex311_201503318.htm |
| EX-32.1 - EX-32.1 - BREEZE-EASTERN CORP | bzc-ex321_201503319.htm |
SECURITIES AND EXCHANGE COMMISSION
Washington, D.C. 20549
FORM 10-K
(Mark One)
|
x |
ANNUAL REPORT PURSUANT TO SECTION 13 OR 15(d) OF THE SECURITIES EXCHANGE ACT OF 1934 |
For the fiscal year ended March 31, 2015
OR
|
¨ |
TRANSITION REPORT PURSUANT TO SECTION 13 OR 15(d) OF THE SECURITIES EXCHANGE ACT OF 1934 |
For the transition period from to
Commission file number 1-7872
BREEZE-EASTERN CORPORATION
(Exact name of registrant as specified in its charter)
|
Delaware |
|
95-4062211 |
|
(State or other jurisdiction of |
(I.R.S. employer |
|
|
|
|
|
|
35 Melanie Lane Whippany, New Jersey |
07981 |
|
|
(Address of principal executive offices) |
(Zip Code) |

Registrant’s telephone number, including area code: (973) 602-1001
Securities registered pursuant to Section 12(b) of the Act:
|
Common Stock, par value $0.01 |
|
NYSE MKT |
|
(Title of class) |
|
(Name of Exchange on Which Registered) |
Securities registered pursuant to Section 12(g) of the Act: NONE
Indicate by check mark if the registrant is a well-known seasoned issuer, as defined in Rule 405 of the Securities Act. Yes ¨ No x
Indicate by check mark if the registrant is not required to file reports pursuant to Section 13 or Section 15(d) of the Act. Yes ¨ No x
Indicate by check mark whether the registrant (1) has filed all reports required to be filed by Section 13 or 15(d) of the Securities Exchange Act of 1934 during the preceding 12 months (or for such shorter period that the registrant was required to file such reports), and (2) has been subject to such filing requirements for the past 90 days. Yes x No ¨
Indicate by check mark whether the registrant has submitted electronically and posted on its corporate Web site, if any, every Interactive Data File required to be submitted and posted pursuant to Rule 405 of Regulation S-T (§ 229.405 of this chapter) during the preceding 12 months (or for such shorter period that the registrant was required to submit and post such files). Yes x No ¨
Indicate by check mark if disclosure of delinquent filers pursuant to Item 405 of Regulation S-K is not contained herein, and will not be contained, to the best of registrant’s knowledge, in definitive proxy or information statements incorporated by reference in Part III of this Form 10-K or any amendment to this Form 10-K. x
Indicate by check mark whether the registrant is a large accelerated filer, an accelerated filer, or a non-accelerated filer, or a smaller reporting company. See definition of “large accelerated filer,” “accelerated filer” and “smaller reporting company” in Rule 12b-2 of the Exchange Act. (Check one):
|
Large accelerated filer |
|
¨ |
|
|
Accelerated filer |
|
¨ |
|
|
|
|
|
|
|||
|
Non-accelerated filer |
|
¨ |
|
|
Smaller reporting company |
|
x |
Indicate by check mark whether the registrant is a shell company (as defined in Rule 12b-2 of the Act). Yes ¨ No x
The aggregate market value of the voting common equity held by non-affiliates of the registrant on September 30, 2014 (the last business day of the registrant’s most recently completed second fiscal quarter), based on the closing price of the registrant’s common stock on the NYSE MKT (formerly NYSE Amex) on such date, was $28,747,919. Shares of common stock held by executive officers and directors have been excluded since such persons may be deemed affiliates. This determination of affiliate status is not a determination for any other purpose.
As of May 20, 2015, the registrant had 9,848,866 shares of common stock outstanding.
DOCUMENTS INCORPORATED BY REFERENCE
The registrant’s Proxy Statement for the 2015 Annual Meeting of Stockholders is incorporated by reference into Part III of this Annual Report on Form 10-K. With the exception of those portions that are specifically incorporated by reference in this Annual Report on Form 10-K, such Proxy Statement shall not be deemed filed as part of this Report or incorporated by reference herein. Such proxy statement will be filed with the Securities and Exchange Commission within 120 days of the registrant’s fiscal year ended March 31, 2015.
BREEZE-EASTERN CORPORATION
INDEX TO ANNUAL REPORT ON FORM 10-K
FOR THE YEAR ENDED MARCH 31, 2015
|
|
|
|||
|
Item 1. |
|
|
3 |
|
|
Item 1A. |
|
|
7 |
|
|
Item 1B. |
|
|
13 |
|
|
Item 2. |
|
|
13 |
|
|
Item 3. |
|
|
14 |
|
|
Item 4. |
|
|
14 |
|
|
|
|
|
||
|
Item 5. |
|
|
15 |
|
|
Item 6. |
|
|
17 |
|
|
Item 7. |
|
Management’s Discussion and Analysis of Financial Condition and Results of Operations |
|
17 |
|
Item 7A. |
|
|
27 |
|
|
Item 8. |
|
|
28 |
|
|
Item 9. |
|
Changes in and Disagreements with Accountants on Accounting and Financial Disclosure |
|
54 |
|
Item 9A. |
|
|
54 |
|
|
Item 9B. |
|
|
54 |
|
|
|
|
|
||
|
Item 10. |
|
|
55 |
|
|
Item 11. |
|
|
55 |
|
|
Item 12. |
|
Security Ownership of Certain Beneficial Owners and Management and Related Stockholder Matters |
|
55 |
|
Item 13. |
|
Certain Relationships and Related Transactions; Director Independence |
|
55 |
|
Item 14. |
|
|
55 |
|
|
|
|
|
||
|
Item 15. |
|
|
56 |
|
2
($ in Thousands Except Share Amounts)
DISCLOSURE REGARDING FORWARD-LOOKING STATEMENTS
This report contains “forward-looking statements” – that is, statements related to future, not past, events. In this context, forward-looking statements often address our expected future business and financial performance and financial condition, and often contain words such as “expect,” “anticipate,” “intend,” “plan,” “believe,” “seek,” “see,” or “will.” These forward-looking statements are not guarantees and are subject to known and unknown risks, uncertainties and assumptions about us that may cause our actual results, levels of activity, performance or achievements to be materially different from any future results, levels of activity, performance or achievements expressed or implied by such forward-looking statements.
For us, particular uncertainties that could cause our actual results to be materially different than those expressed in our forward-looking statements include: changes in business conditions, changes in applicable laws, rules and regulations affecting us in locations in which we conduct business, interest rate trends, a decline or redirection of the United States (“U.S.”) defense budget, the failure of Congress to approve a budget or continuing resolution, the termination of any contracts with the U.S. Government, changes in our sales strategy and product development plans, changes in the marketplace, developments in environmental proceedings that we are involved in, continued services of our executive management team, competitive pricing pressures, security breaches, market acceptance of our products under development, delays in the development of products, changes in spending allocation or the termination, postponement, or failure to fund one or more significant contracts by the U.S. Government or other customers, determination by us to dispose of or acquire additional assets, events impacting the U.S. and world financial markets and economies and such other factors that may be identified from time to time in our Securities and Exchange Commission (“SEC”) filings and other public announcements including those set forth under “Item 1A. Risk Factors” beginning on page 7 of this report and “Item 7 - Management’s Discussion and Analysis of Financial Condition and Results of Operations” on page 17 of this report.
All subsequent written and oral forward-looking statements attributable to us, or persons acting on our behalf, are expressly qualified in their entirety by the foregoing. Readers are cautioned not to place undue reliance on our forward-looking statements, as they speak only as of the date made. Except as required by law, we assume no duty to update or revise our forward-looking statements.
Breeze-Eastern Corporation, a Delaware corporation, designs, develops, manufactures, sells and services sophisticated engineered mission equipment for specialty aerospace and defense applications. We were originally organized in 1962 as a California corporation and reincorporated in Delaware in 1986. Unless the context otherwise requires, references to the “Company,” the “Registrant,” “Breeze-Eastern,” “we” or “us” refer to Breeze-Eastern Corporation and its consolidated subsidiaries. All references to years in this report refer to the fiscal year ended March 31 of the indicated year unless otherwise specified. This report reflects all adjustments of a normal recurring nature, which are, in the opinion of management, necessary for fair presentation of the results of operations for the periods reflected. Certain prior fiscal year amounts may have been reclassified to conform to the current fiscal year presentation.
CORE BUSINESS
Our core business is aerospace and defense products. We have long been recognized as a leading global designer, manufacturer, service provider, and supplier of mission-critical rescue hoists. We also manufacture weapons-handling systems, cargo winches, cargo hook systems and tie-down equipment. Our products are designed to be efficient and reliable in extreme operating conditions and are used to complete rescue operations and military insertion/extraction operations, move and transport cargo, and load weapons onto aircraft and ground-based launching systems. These products are sold primarily to military and civilian agencies and aerospace contractors. Our emphasis is on the engineering, assembly, testing, service, and support of our products.
PRODUCTS AND SERVICES
Our products and related services aggregate into one reportable segment. The nature of the production process (assemble, inspect, and test), customers, and product distribution are similar for all products. We sell our products through internal marketing representatives and distributors.
PRODUCTS
Products include new equipment and spare parts sales and represented approximately 77%, 72%, and 75% of our total revenues in fiscal 2015, fiscal 2014, and fiscal 2013, respectively.
3
($ in Thousands Except Share Amounts)
As a pioneer of helicopter rescue hoist technology, we continue to develop sophisticated helicopter hoist and winch systems, including systems for the current generation of Sikorsky H-60 Blackhawk and Naval Hawk, CH-53K King Stallion, Bell-Boeing V-22 Osprey, Boeing CH-47 Chinook, Airbus Helicopter Ecureuil, Dolphin, AgustaWestland AW-101 Merlin/Cormorant, Changhe Z-11, AgustaWestland A-W109, AW119 and AW139 helicopters. We also design, market, sell and service a broad line of hydraulic and electric aircraft cargo winch systems with capacities from 900 pounds to over 7,000 pounds. Sales of hoist and winch products accounted for approximately 60%, 55%, and 54% of our total revenues in fiscal 2015, fiscal 2014, and fiscal 2013, respectively.
Our external cargo hook systems are original equipment on leading military medium and heavy lift helicopters. These hook systems range from smaller 1,000-pound capacity models up to the largest 36,000-pound capacity hooks employed on the Sikorsky CH-53 Super Stallion helicopter. Our latest designs incorporate load sensing and display technology and automatic load release features. We also manufacture cargo and aircraft tie-downs which are included in this product line. Sales of cargo hook products accounted for approximately 14%, 15%, and 16% of our total revenues in fiscal 2015, fiscal 2014, and fiscal 2013, respectively.
We make static-line retrieval and cargo winches for military cargo aircraft including the Boeing C-17, Alenia C-27J, CASA CN-235, CASA C-295, and Airbus A400M.
Once our products are qualified and approved for use with a particular aircraft model, sales of products and services generally continue for the life of the aircraft model, which can be for decades. It is expensive and difficult for a second supplier’s product to become qualified and approved on the same aircraft.
Our weapons handling systems include weapons handling equipment for land-based rocket launchers and munitions hoists for loading missiles and other loads using electric power or exchangeable battery packs. We also provide actuators and specialty gear boxes for specialty weapons applications. Sales of weapons handling products accounted for approximately 3%, 2%, and 5% of our total revenues in fiscal 2015, fiscal 2014, and fiscal 2013, respectively.
SERVICES
Services include overhaul and repair and engineering sales and represented 23%, 28%, and 25% of our total revenues in fiscal 2015, fiscal 2014, and fiscal 2013, respectively.
We perform overhaul, repair, and maintenance services for all of our products. Most of these services are performed at our Whippany, New Jersey facility. We have also authorized third-party service centers around the world to perform these services. Overhaul and repair represented 21%, 25%, and 24% of our total revenues in fiscal 2015, fiscal 2014, and fiscal 2013, respectively.
In addition to performing research and development to design new products, improve existing products, and add new features to our product line, we also provide engineering services to adapt our products to customer specific needs and aircraft models on a fee-for-service basis.
We discuss segment information in Note 14 of our “Notes to Consolidated Financial Statements” contained elsewhere in this report.
MAJOR CUSTOMERS
We have four major customers: the U.S. Government, United Technologies Corporation, Airbus Defense & Space, and Finmeccanica SpA, which accounted for 19%, 16%, 16% and 12%, respectively, of the total consolidated net sales for fiscal 2015. See also the first risk factor under Risk Factors in Item 1A of this report.
GOVERNMENT SALES
Our direct sales to the U.S. Government and sales for U.S. Government and foreign government end use represented 74%, 81%, and 66% of consolidated revenue during fiscal 2015, fiscal 2014, and fiscal 2013, respectively. U.S. Government sales, both direct and indirect, are generally procured using standard government fixed price or cost reimbursable contracts. As a U.S. Government contractor, we are subject to routine audits by U.S. Government agencies.
In accordance with normal practice, contracts and orders with the U.S. Government are subject to partial or complete termination at any time, at the option of the customer. In the event of a termination for convenience by the government, there generally are provisions for recovery of our allowable incurred costs and a proportionate share of the profit or fee on the work completed, consistent with U.S. Government regulations.
4
($ in Thousands Except Share Amounts)
BACKLOG
We measure backlog by the amount of products or services that customers committed by contract to purchase as of a given date. Backlog at March 31, 2015 was $109,556 as compared with $119,464 at March 31, 2014 as shipments exceeded new orders in fiscal 2015. Approximately $57,274 of our backlog at March 31, 2015 is not scheduled for shipment during the next twelve months. For additional discussion on our backlog, see “Item 7. Management’s Discussion and Analysis of Financial Condition and Results of Operations.”
COMPONENTS, RAW MATERIALS, AND SEASONALITY
The various component parts and, to some extent, assembly of components and subsystems by subcontractors used by us to produce our products are generally available from more than one source. In those instances where only a single source for any material or part is available, such items can generally be redesigned to accommodate materials or parts made by other suppliers, although this may lead to lengthy delays and higher costs in meeting customer requirements. In some cases, we stock an adequate supply of the single source materials or parts for use until a new supplier can be approved.
In recent years, our revenues in the second half of our fiscal year have generally exceeded revenues in the first half. The timing of U.S. Government awards, availability of U.S. Government funding, and product deliveries are among the factors affecting the periods in which revenues are recorded. Management expects this trend to continue in fiscal 2016.
EMPLOYEES
As of March 31, 2015, we had 165 salaried and hourly employees, and the United Auto Workers (UAW) represented 51 hourly employees at our facility. We reached a three-year collective bargaining agreement with the UAW effective October 1, 2013. We consider our relations, with both our union and non-union employees, to be generally satisfactory.
INTERNATIONAL OPERATIONS AND SALES
We currently have no operations based outside of the United States. We had export sales of $39,050, $37,101, and $28,936 in fiscal 2015, fiscal 2014, and fiscal 2013, respectively, representing 44%, 43%, and 36% of our consolidated net sales in each of those years. The risks and profitability of international sales are generally comparable with similar products sold by us in the United States. Net export sales by geographic area and customer domicile are set forth in Note 14 of our consolidated financial statements contained elsewhere in this report.
COMPETITION
We compete in some markets with the hoist and winch business unit of the Goodrich Corporation, which was acquired by United Technologies in calendar 2012, and is part of a larger corporation that has substantially greater financial and technical resources than us. United Technologies is also our second-largest customer. We also compete in some markets for cargo hooks with Onboard Systems. Generally, competitive factors include design capabilities, product performance, delivery, and price. Our ability to compete successfully in these markets depends on our ability to develop and apply technological innovations and to expand our customer base and product lines. Technological innovation, development, and application requires significant investment and capital expenditures. While we make each investment with the intent of getting a good financial return, in some cases we may not fully recover the full investment through future sales of products or services.
RESEARCH AND DEVELOPMENT
We conduct research and development activities, primarily for developing new or improved products, under customer-sponsored contracts and for our own investment. Research and development costs, which are charged to Engineering expense when incurred, amounted to $5,344, $6,916, and $7,664 for the years ended March 31, 2015, 2014, and 2013, respectively. Customer-sponsored research and development costs are charged to cost of sales when the associated revenue is recognized and were $1,763, $1,472, and $2,119 in fiscal 2015, fiscal 2014, and fiscal 2013, respectively. We are also seeking to accelerate the development of new products with the addition of a product development center in Virginia and new strategic partners. One of the projects under development is the MissionViewTM situational awareness system. The MissionViewTM system is designed to integrate one or more new components with a rescue hoist, such as sensor systems, a camera system, and a lighted hook, with a tablet computer to provide crew members with data and information critical to the mission such as, among other things, cable load and length of cable extended, while also recording data for post-mission training. Our new products typically take a significant amount of time to develop and to obtain necessary government and other approvals. Accordingly, at this time we cannot predict when we will complete the development of the components of the
5
($ in Thousands Except Share Amounts)
MissionViewTM system, when they will be available for sale, and if they will be commercially accepted. See also Risk Factors in Item 1A of this report.
INTELLECTUAL PROPERTY
We have been one of the market leaders since the initial development of rescue hoists for use on helicopters and have continually designed and manufactured rescue hoists since the 1940’s. Our intellectual property product knowledge enables us to continually evolve mission-critical products to meet our customers’ evolving needs. We generally retain the intellectual property rights to products we develop which typically lasts for the life of the product.
REGULATORY MATTERS
Aircraft Regulation
In the United States, our commercial aircraft products are required to comply with Federal Aviation Administration regulations governing production and quality systems, airworthiness and installation approvals, repair procedures and continuing operational safety. Internationally, similar requirements exist for airworthiness, installation and operational approvals. These requirements are generally administered by the national aviation authorities of each country and, in the case of Europe, coordinated by the European Aviation Safety Agency (EASA).
Environmental Matters
We maintain compliance with federal, state, and local laws and regulations relating to materials used in production and to the discharge of wastes, and other laws and regulations relating to the protection of the environment. The costs of such compliance at our Whippany, New Jersey facility are not material to our operations.
We are subject to federal and state requirements for protection of the environment, including those for the remediation of contaminated sites relating to predecessor entities and previously-owned subsidiaries. At various times, we have been identified as a potentially responsible party pursuant to the Comprehensive Environmental Response, Compensation, and Liability Act of 1980 (CERCLA), and analogous state environmental laws, for the cleanup of contamination resulting from past releases of hazardous substances at certain former facilities and at sites to which we, among others, sent wastes in the past. CERCLA requires potentially responsible persons to pay for the cleanup of sites from which there has been a release or threatened release of hazardous substances. Courts have interpreted CERCLA to impose strict joint and several liability on all persons liable for cleanup costs. As a practical matter, however, at sites where there are multiple potentially responsible persons, the costs of cleanup typically are allocated among the parties according to a volumetric or other standard.
Where appropriate, we have sought contribution to remediation costs from other potentially responsible parties and made claims under available insurance policies. We also periodically assess the amount of reserves held for environmental liabilities for these sites based upon current information. While there is an inherent uncertainty in assessing the potential total cost to investigate and remediate a given site, we make a determination as to the reasonable cost of investigation and remediation of each site based upon the information available to us at that time. Furthermore, the remediation efforts for a particular site may take place over a number of years and therefore a significant portion of the expenses represented by these reserves may not be paid for some time. Factors that affect the actual liability for these sites include changes in federal and state environmental laws resulting in more stringent remediation requirements and actual operating results from remediation efforts which vary from estimated results.
Information concerning our specific environmental liabilities and reserves is contained in Note 13 of our “Notes to Consolidated Financial Statements” contained elsewhere in this report.
ADDITIONAL INFORMATION
We maintain a website at http://www.breeze-eastern.com. Our annual report on Form 10-K, quarterly reports on Form 10-Q, current reports on Form 8-K, and amendments to those reports, which we file with the Securities and Exchange Commission (SEC) are available on our web site, free of charge, as soon as reasonably practicable after they are electronically filed with or furnished to the SEC. Information that can be accessed through our website is not incorporated by reference in this Report and, accordingly, readers should not consider such information to be part of this Report. The reports noted above may also be obtained at the SEC’s public reference room at 100 F Street, NE, Washington, DC 20549. The SEC also maintains a web site at www.sec.gov that contains reports, proxy statements, and information regarding SEC registrants, including Breeze-Eastern.
6
($ in Thousands Except Share Amounts)
An investment in our common stock involves risk. You should carefully consider the following risk factors in addition to other information in this Annual Report on Form 10-K before purchasing our common stock. The risks and uncertainties described below are those that we currently deem to be material and that we believe are specific to our company and our industry. In addition to these risks, our business may be subject to risks currently unknown to us. If any of these or other risks actually occurs, our business may be adversely affected, the trading price of our common stock may decline and you may lose all or part of your investment.
Risks Associated with our Business and/or Industry
A substantial amount of our revenue is derived from the U.S. Government, United Technologies Corporation, Airbus Defense & Space, and Finmeccanica SpA. A termination or reduction in the volume of business with any of these customers would have a material adverse effect on our revenue and profits.
Approximately 19%, 16%, 16%, and 12% of our consolidated net sales in fiscal 2015 were to the U.S. Government (direct), United Technologies Corporation, Airbus Defense & Space, and Finmeccanica SpA. Other than sales to Finmeccanica SpA, these sales are made principally for the benefit of the military services of the U.S. Department of Defense and defense organizations of other countries and are affected by, among other things, budget authorization and appropriation processes. In the event that defense expenditures are reduced for products we manufacture or services we provide and are not offset by revenues from additional foreign sales, new programs, or products or services that we currently manufacture or provide, we may experience a reduction in our revenues and earnings and a material adverse effect on our business, financial condition, and results of operations. Further, there can be no assurance that our significant customers will continue to buy our products and services at current or increased levels. Specifically, United Technologies Corporation’s acquisition of Goodrich Corporation in 2012, which has a hoist & winch business unit, could negatively impact our sales to United Technology Corporation.
We depend heavily on government contracts that may not be fully funded or may be terminated, and the failure to receive funding or the termination of one or more of these contracts could reduce our sales and increase our costs.
Sales to the U.S. Government and its prime contractors and subcontractors represent a significant portion of our business. In fiscal 2015, sales under U.S. Government contracts represented approximately 49% of our total sales, while sales to foreign governments represented approximately 25% of our total sales. We expect that the percentage of our revenues from government contracts will continue to be substantial in the future. Government programs can be structured into a series of individual contracts. The funding of these programs is generally subject to governmental appropriations and governmental and defense priorities are subject to change. In addition, Congress may reduce expenditures for defense programs or terminate such programs at any time. A decline in government expenditures or redirection of government funding may result in a reduction in the volume of contracts awarded to us. We have resources applied to specific government contracts and if any of those contracts were terminated, we may incur substantial costs redeploying those resources.
As a U.S. Government contractor, we are subject to a number of procurement rules and regulations and any non-compliance could subject us to fines, penalties, suspension or debarment.
We must comply with and are affected by laws and regulations relating to the award, administration, and performance of U.S. Government contracts. Government contract laws and regulations affect how we conduct business with our customers and, in some instances, impose added costs on our business. A violation of specific laws and regulations could result in fines and penalties, contract termination, suspension, or debarment from bidding on future contracts. These fines and penalties could be imposed for failing to follow procurement integrity and bidding rules, employing improper billing practices or otherwise failing to follow cost accounting standards, receiving or paying kickbacks, or filing false claims. We have been, and expect to continue to be, subjected to audits by government agencies. The failure to comply with the terms of government contracts could harm our business reputation and could also result in progress payments being withheld.
Our business could be adversely affected by a negative audit by the U.S. Government.
As a U.S. Government contractor, we are subject to routine audits by U.S. Government agencies, such as the Defense Contract Audit Agency (DCAA). These agencies review a contractor’s performance under its contracts, cost structure, and compliance with applicable laws, regulations, and standards. The DCAA also reviews the adequacy of a contractor’s compliance with its internal control systems and policies, including the contractor’s purchasing, property, estimating, compensation, and management information systems. Any costs found to be improperly allocated to a specific contract will not be reimbursed or must be refunded if already reimbursed. If an audit uncovers improper or illegal activities, we may be subject to civil and criminal penalties as well as administrative sanctions, which may include termination of contracts, forfeiture of profits, suspension of payments, fines, and
7
($ in Thousands Except Share Amounts)
suspension or prohibition from doing business with the U.S. Government. In addition, we could suffer serious reputational harm if allegations of impropriety were made against us.
The U.S. Government has the right to terminate or not renew any contract with us at any time and without notice. Any such action would have a material adverse effect on our results of operations.
In some instances, laws and regulations impose terms or rights that are more favorable to the government than those typically available to commercial parties in negotiated transactions. For example, the U.S. Government may terminate any government contract and, in general, subcontracts, at its convenience as well as for default based on performance. Upon termination for convenience of a fixed-price type contract, we normally are entitled to receive the purchase price for delivered items, reimbursement for allowable costs for work-in-process, and an allowance for profit on the contract or adjustment for loss if contract completion would have resulted in a loss. Upon termination for convenience of a cost-reimbursement contract, we normally are entitled to reimbursement of allowable costs plus a portion of the fee. Such allowable costs would normally include the cost to terminate agreements with our suppliers and subcontractors. The amount of the fee recovered, if any, is related to the portion of the work accomplished prior to termination and is determined by negotiation.
A termination arising from default could expose us to liability and have a material adverse effect on our ability to compete for future contracts and orders. In addition, on those contracts for which we are teamed with others and are not the prime contractor, the U.S. Government could terminate a prime contract under which we are a subcontractor, irrespective of the quality of our services as a subcontractor.
In addition, our U.S. Government contracts typically span one or more base years and multiple option years. The U.S. Government generally has the right to not exercise option periods and may not exercise an option period if the U.S. Government is not satisfied with our performance on the contract.
The aircraft manufacturing industry is heavily regulated, and if we fail to comply with applicable requirements, our results of operations could suffer.
Governmental agencies throughout the world, including the U.S. Federal Aviation Administration, or the FAA, prescribe standards and qualification requirements for aircraft components, including virtually all aviation products. Specific regulations vary from country to country, although compliance with FAA requirements generally satisfies regulatory requirements in other countries. We include, with some of the products we sell to our aircraft manufacturing customers, documentation certifying that each part complies with applicable regulatory requirements and meets applicable standards of airworthiness established by the FAA or the equivalent regulatory agencies in other countries. In order to sell our products, we and the products we manufacture must also be certified by our individual OEM customers. If any of the material authorizations or approvals qualifying us to supply our products is revoked or suspended, then the sale of the subject product would be prohibited by law, which would have an adverse effect on our business, financial condition, and results of operations.
From time to time, the FAA or equivalent regulatory agencies in other countries propose new regulations or changes to existing regulations, which are usually more stringent than existing regulations. If these proposed regulations are adopted and enacted, we may incur significant additional costs to achieve compliance, which could have a material adverse effect on our business, financial condition, and results of operations.
Cancellations, reductions, or delays in customer orders, contracts and anticipated contracts may adversely affect our results of operations.
Our overall operating results are affected by many factors, including the timing of orders from large customers and the timing of expenditures to manufacture parts and purchase inventory in anticipation of future sales of products and services. A large portion of our operating expenses are relatively fixed. Cancellations, reductions, or delays in customer orders, contracts and anticipated contracts could have a material adverse effect on our business, financial condition, and results of operations.
We may be required to recognize a loss contract at a future date if certain events that we currently estimate are likely to occur do not, in fact, occur.
As more fully discussed under “Management’s Discussion and Analysis of Financial Condition and Results of Operations” and “Critical Accounting Policies” and in the notes to our consolidated financial statements, the earnings or losses recognized on individual contracts and the timing thereof are based on multiple estimates, including the probability of negotiating future contracts, revenues from existing contracts, costs and profitability. Although we update these estimates regularly, estimates are inherently uncertain, and our ultimate profitability on a contract may not be fully known until completion. We recognize estimated contract
8
($ in Thousands Except Share Amounts)
losses when determined, regardless of where we are in the contract cycle, and adjust contract profit estimates based on ongoing contract profitability reviews. If the estimates noted above were to change significantly, requiring us to recognize unforeseen losses, our financial condition and results of operations could be materially adversely affected.
During a period in which a contract loss is first recognized, or in a period when estimated contract profits become lower than previous estimates, income recorded on that contract in prior periods would be reversed. This could cause the profit or loss contribution from any given contract to fluctuate significantly from quarter to quarter.
Engineering product development delays or customer engineering product development contract cancellations may adversely affect our results of operations.
Our new product development requires up-front engineering research & development expenditures that impact current income and qualification units that are capitalized as intangible assets on the consolidated balance sheets if there is an existing contract or anticipated contract under a program. These engineering research & development expenditures may not result in future revenue-generating products or may not become technically viable as a result of pre-production qualification testing. These research & development expenditures are generally incurred as a part of awarded new product development for customers’ aerospace platforms. If the product being designed does not meet customer technical specifications or timely delivery needs, we may need to write-off capitalized qualification units and reimburse customers for their costs that result from our product delivery delay.
Our backlog is subject to reduction and cancellation at any time without notice, which could negatively impact our future revenues and results of operations.
Backlog represents products or services that our customers have committed by contract to purchase from us. Backlog as of March 31, 2015 was $109,556. Backlog is subject to fluctuations and is not necessarily indicative of future sales. The U.S. Government may unilaterally modify or cancel its contracts with us. In addition, under certain of our commercial contracts, our customers may unilaterally modify or terminate their orders at any time for their convenience or do so if we fail to comply with our contractual obligations. Accordingly, certain portions of our backlog can be cancelled or reduced at the option of the U.S. Government and commercial customers. Our failure to replace cancelled or reduced backlog could negatively impact our revenues and results of operations.
We are subject to competition from entities which could have a substantial impact on our business.
We compete in some markets with entities that are larger and have substantially greater financial and technical resources than us. Generally, competitive factors include design capabilities, product performance, delivery, and price. Our ability to compete successfully in such markets will depend on our ability to develop and apply technological innovations and to expand our customer base and product lines. In addition, the development and application of technological innovations may mandate an expenditure of significant capital which may not be recovered through future sales of products or services. There can be no assurance that we will continue to successfully compete in any or all of the businesses discussed above. Our failure to compete successfully or to invest in technology where there is no recovery through product sales could have a materially adverse effect on our profitability. In addition, United Technologies Corporation’s acquisition of Goodrich Corporation in 2012, which has a hoist & winch business unit, could negatively impact our sales to United Technology Corporation.
We are subject to liability under environmental laws.
Our business and facilities are subject to numerous federal, state, and local laws and regulations relating to the use, manufacture, storage, handling, and disposal of hazardous materials and other waste products. Environmental laws generally impose liability for investigation, remediation, and removal of hazardous materials and other waste products on property owners and those who dispose of materials at waste sites whether or not the waste was disposed of legally at the time in question. We are currently addressing environmental remediation at certain former facilities, and we have been named as a potentially responsible party along with other organizations in a number of environmental clean-up sites and may be named in connection with future sites. We are required to contribute to the costs of the investigation and remediation and have taken reserves in our financial statements for future costs deemed probable and estimable for these costs. Although we have estimated and reserved for future environmental investigation and remediation costs, the final resolution of these liabilities may significantly vary from our estimates and could potentially have an adverse effect on our results of operations and financial position. Our contingencies associated with environmental matters are described in Note 13 of “Notes to Consolidated Financial Statements” which is included elsewhere in this report.
9
($ in Thousands Except Share Amounts)
Our sales to foreign countries expose us to risks and adverse changes in local legal, tax, and regulatory schemes.
In fiscal 2015, 44% of our consolidated sales were to customers outside the United States. We expect international export sales to continue to contribute to our earnings for the foreseeable future. The export sales are subject in varying degrees to risks inherent in doing business outside the United States. Such risks include, without limitation:
|
· |
The possibility of unfavorable circumstances arising from host country laws or regulations; |
|
· |
Potential negative consequences from changes to significant taxation policies, laws, or regulations; |
|
· |
Changes in tariff and trade barriers and import or export licensing requirements; and |
|
· |
Political or economic instability, insurrection, civil disturbance, or war. |
Government regulations could limit our ability to sell our products outside the United States and otherwise adversely affect our business.
In fiscal 2015, approximately 41% of our sales were subject to compliance with the United States control laws and regulations. Our failure to obtain the requisite licenses, meet registration standards or comply with other government export regulations would hinder our ability to generate revenues from the sale of our products outside the United States. Compliance with these government regulations may also subject us to additional fees and operating costs. The potential absence of comparable restrictions on competitors in other countries could adversely affect our competitive position. In order to sell our products in European Union countries, we must satisfy certain technical requirements. If we are unable to comply with those requirements with respect to a significant quantity of our products, our sales in Europe would be restricted. Doing business internationally also subjects us to numerous U.S. and foreign laws and regulations, including, without limitation, regulations relating to import-export control, technology transfer restrictions, foreign corrupt practices and anti-boycott provisions. Failure by us or our sales representatives or consultants to comply with these laws and regulations could result in administrative, civil or criminal liabilities and could, in the extreme case, result in suspension or debarment from government contracts or suspension of our export privileges, which would have a material adverse effect on us.
While we believe our control systems are effective, there are inherent limitations in all control systems, and misstatements due to error or fraud may occur and not be detected.
We continue to take action to assure compliance with the internal controls, disclosure controls, and other requirements of the Sarbanes-Oxley Act of 2002. Our management, including our Chief Executive Officer and Chief Financial Officer, cannot guarantee that our internal controls and disclosure controls will prevent all possible errors or all fraud. A control system, no matter how well conceived and operated, can provide only reasonable, not absolute, assurance that the objectives of the control system are met. In addition, the design of a control system must reflect the fact that there are resource constraints, and the benefit of controls must be relative to their costs. Because of the inherent limitations in all control systems, no system of controls can provide absolute assurance that all control issues and instances of fraud, if any, within the Company have been detected. These inherent limitations include the realities that judgments in decision-making can be faulty and that breakdowns can occur because of simple error or mistake. Further, controls can be circumvented by individual acts of some persons, by collusion of two or more persons, or by management override of the controls. The design of any system of controls also is based in part upon certain assumptions about the likelihood of future events, and there can be no assurance that any design will succeed in achieving its stated goals under all potential future conditions. Over time, a control may become inadequate because of changes in conditions or the degree of compliance with policies or procedures may deteriorate. Because of inherent limitations in a cost-effective control system, misstatements due to error or fraud may occur and may not be detected.
The terms of our credit agreement may restrict our current and future operating and financial flexibility.
The credit agreement that is in effect with respect to our debt includes covenants that, among other things, restrict our ability to:
|
· |
not to spend or incur obligations to acquire fixed assets for more than $2,000 in any single fiscal year; |
|
· |
create, incur, assume or guarantee additional indebtedness, except in certain specified instances; |
|
· |
create, incur, assume or permit any liens on any asset, except in certain specified instances; |
|
· |
Merge, dissolve, liquidate, consolidate with or into another person or entity, or dispose of all or substantially all of our assets; and |
|
· |
Acquire or purchase another business or its assets unless the business or assets are in a substantially similar line of business as our current business. |
10
($ in Thousands Except Share Amounts)
Our credit agreement also contains covenants that require us to:
|
· |
maintain a tangible net worth equal to at least $22,500; |
|
· |
maintain a ratio of funded debt to EBITDA (a) at all times while EBITDA in said ratio exceeds $25,000, not exceeding 3.0:1.0, and (b) at all other times, not exceeding 2.5:1.0; and |
|
· |
maintain an interest coverage ratio of at least 3.0:1.0. |
We may be unable to comply with the covenants under our credit agreement in the future. A failure to comply with the covenants under our credit agreement could result in an event of default. In the event of a default our lender could elect to declare all borrowings, accrued and unpaid interest and other fees outstanding, due and payable, and require us to apply all of our available cash to repay these borrowings.
We conduct virtually all manufacturing operations at a single location.
Virtually all of our operations are conducted at our Whippany, New Jersey facility. Substantial impairment of this facility as a consequence of a natural disaster, work stoppage, or other event could have a material adverse effect on our operations. Our small product development center in Fredericksburg, Virginia is not able to assume the operations from the Whippany facility if the Whippany facility is substantially impaired.
We depend on component availability, subcontractor performance, and key suppliers to manufacture and deliver our products and services.
We depend upon suppliers to deliver component parts and, to some extent, to assemble components and subsystems to manufacture our products in a timely and satisfactory manner and to remain in full compliance with applicable customer terms and conditions. We are generally subject to specific procurement requirements, which may limit the suppliers and subcontractors we may utilize. In some instances, we are dependent on sole-source suppliers. If any of these suppliers or subcontractors fails to meet our needs, developing alternatives could cause delays and increase costs in meeting customer requirements. While we may enter into long-term or volume purchase agreements with certain suppliers and take other actions to ensure the availability of needed materials, components, and subsystems, we cannot be sure that such items will be available in the quantities we require, if at all. If we experience a material supplier or subcontractor problem, the ability to satisfactorily and timely meet customer obligations could be negatively impacted, which could result in reduced sales, termination of contracts, and damage to our reputation and customer relationships. We could also incur additional costs in addressing such a problem. Any of these events could have a negative impact on our results of operations and financial condition.
Our operating results and financial condition may be adversely impacted by the current worldwide economic conditions.
We currently generate operating cash flows, which combined with access to the credit markets, provides discretionary funding capacity. However, current uncertainty in the global economic conditions could impact customer demand for our products, as well as our ability to manage normal commercial relationships with our customers, suppliers, and creditors. If economic conditions deteriorate significantly, our business could be negatively impacted from reduced demand for our products or supplier or customer disruptions.
Our future growth and continued success depends upon retaining key employees.
Our success depends on our senior management personnel and our ability to attract and retain other highly qualified management personnel. We face competition for management from other companies and organizations, and therefore may not be able to retain our existing management personnel or fill new management positions or vacancies created by expansion or turnover at existing compensation levels. We have entered into employment agreements with some members of senior management and have made efforts to reduce the effect of the loss of senior management personnel through succession planning. The loss of senior managers could have a material and adverse effect on our business. In addition, competition for qualified technical personnel in our industry is intense, and management believes that our future growth and success will depend upon the ability to attract, train, and retain such personnel.
Our profitability could be negatively affected if we fail to maintain satisfactory labor relations.
Approximately one-third of our workforce is employed under a collective bargaining agreement with the United Auto Workers (UAW), which from time to time is subject to renewal and negotiation. Although historically we have had satisfactory relations with both our unionized and non-unionized employees, if we are subject to labor actions, including work stoppages or slowdowns, we may experience an adverse impact on our operating results.
11
($ in Thousands Except Share Amounts)
Our failure to adequately protect our intellectual property could have an adverse effect on our business.
Intellectual property is important to our success. We rely upon confidentiality procedures and contractual provisions to protect our business and proprietary technology. Our general policy is to enter into confidentiality agreements with our employees and consultants, and nondisclosure agreements with all other parties to whom we disclose confidential information. In certain instances, we apply for legal protection for certain of our other intellectual property. The patents, trademarks and any additional legal protection we may obtain in the future may be challenged by others or invalidated through administrative process or litigation. As a result, our means of protecting our proprietary technology and brands may be inadequate. Furthermore, despite our efforts, we may be unable to prevent third parties from infringing upon or misappropriating our intellectual property. Any such infringement or misappropriation could have a material adverse effect on our business, financial condition and results of operations.
Patent infringement claims against us or our customers, whether or not successful, may cause us to incur significant costs.
While we do not believe that our products (including products and technologies licensed from others) infringe valid intellectual property rights of any third parties, there can be no assurance that infringement or invalidity claims (or claims for indemnification resulting from infringement claims) will not be asserted against us or our customers. Damages for infringement of valid intellectual property rights of third parties could be substantial, and if determined to be willful, can be trebled. Such an outcome could have a material adverse effect on the Company’s financial condition and results of operation. Regardless of the validity or the successful assertion of any such claims, we could incur significant costs and diversion of resources with respect to the defense thereof which could have a material adverse effect on our financial condition and results of operations. If we are unsuccessful in defending any claims or actions that are asserted against us or our customers, we could seek to obtain a license under a third party’s intellectual property rights. There can be no assurance, however, that under such circumstances, a license would be available under reasonable terms or at all. The failure to obtain a license to a third party’s intellectual property rights on commercially reasonable terms could have a material adverse effect on our results of operations and financial condition.
Our business could be negatively impacted by security threats, including cyber security threats, and other disruptions.
As a defense contractor, we face various security threats, including cyber security threats to gain unauthorized access to sensitive information, threats to the security of our facility and infrastructure, and threats from terrorist acts. Although we utilize various procedures and controls to monitor these threats and mitigate our exposure to such threats, there can be no assurance that these procedures and controls will be sufficient in preventing security threats from materializing. If any of these events were to materialize, they could lead to losses of sensitive business information, critical infrastructure, personnel or capabilities, each of which is essential to our operations and the loss of which could have a material adverse effect on our reputation, financial position, results of operations, or cash flows.
Cyber security attacks in particular are evolving and include, but are not limited to, malicious software, attempts to gain unauthorized access to data, and other electronic security breaches that could lead to disruptions in mission critical systems, unauthorized release of confidential or otherwise protected information and corruption of data. These events could damage our reputation and lead to financial losses from remedial actions, loss of business or potential liability.
We use estimates when competing for contracts. Variances between actual and estimates could affect our profitability and overall financial position.
The competitive bidding process requires judgment relative to among other things, assessing risks, estimating future contract revenues and costs, and making assumptions for schedule and technical risks. Due to the size and nature of many of our contracts, the estimation of total revenues and costs at completion is complicated and subject to many variables. For example, assumptions have to be made regarding the length of time to complete the contract because costs also include expected increases in wages and prices for materials. Similarly, assumptions have to be made regarding the future impact of efficiency initiatives and cost reduction efforts. Incentives, awards, price escalations, or penalties related to performance on contracts are considered in estimating revenue and profit rates and are recorded when there is sufficient information to assess anticipated performance. Because of the significance of the judgments and estimation processes described above, it is possible that materially different amounts could be obtained if different assumptions were used or if the underlying circumstances were to change. Changes in underlying assumptions, circumstances, or estimates may have a material adverse effect upon future period financial reporting and performance.
Risks Related to our Common Stock
Our common stock is thinly traded and subject to volatility.
Although our common stock is traded on the NYSE MKT, it may remain relatively illiquid, or “thinly traded,” which can increase share price volatility and make it difficult for investors to buy or sell shares in the public market without materially affecting the
12
($ in Thousands Except Share Amounts)
quoted share price. Investors may be unable to buy or sell a certain quantity of our shares in the public market within one or more trading days. If limited trading in our stock continues, it may be difficult for holders to sell their shares in the public market at any given time at prevailing prices. We have also historically not paid a dividend.
The prevailing market price of our common stock may fluctuate significantly in response to a number of factors, some of which are beyond our control, including the following:
|
· |
Actual or anticipated fluctuations in operating results; |
|
· |
Changes in market valuations of other similarly situated companies; |
|
· |
Announcements by us or our competitors of significant technical innovations, contracts, acquisitions, strategic partnerships, joint ventures, or capital commitments; |
|
· |
Additions or departures of key personnel; |
|
· |
Future sales of common stock; |
|
· |
Any deviations in net revenues or in losses from levels expected by the investment community; |
|
· |
Trading volume fluctuations; and |
|
· |
Business pressures on any of our large shareholders resulting from their holdings in other unrelated businesses. |
Our share ownership is highly concentrated.
Our directors, officers, principal stockholders, and certain of their affiliates, beneficially own approximately 72% of our common stock and will continue to have significant influence over the outcome of all matters submitted to the stockholders for approval, including the election of our directors.
Not applicable for smaller reporting company.
The following table sets forth certain information concerning our facilities as of March 31, 2015:
|
Location |
|
Use of Premises |
|
Owned or |
|
Sq. Ft |
|
|
Whippany, New Jersey |
|
Executive offices and manufacturing plant |
|
Leased |
|
115,335 |
|
|
Fredericksburg, Virginia |
|
Product development center |
|
Leased |
|
6,527 |
|
In May, 2009, we executed a 10-year lease, at market terms, for our facility in Whippany, New Jersey. In February, 2015, we executed a 5-year lease, at market terms, for our facility in Fredericksburg, Virginia.
Our current manufacturing business is only conducted at our Whippany, New Jersey facility. Our facility in Fredericksburg, Virginia is used primarily for research and development of new products. Properties owned in Saltzburg, Pennsylvania, and Glen Head, New York were operated by one or more of our predecessor affiliates or parent company, TransTechnology Corporation, and are not used in our operations. The Saltzburg property has a zero book value. Our contingencies associated with environmental liabilities are discussed in Note 13 of the “Notes to Consolidated Financial Statements” contained elsewhere in this report
The Irvington, New Jersey property, which had a zero book value, and was previously operated by one of our predecessor affiliates, and not used in our operations, was sold in March, 2015. For additional information of the gain on the sale of the property, included in Other (income) expense on the Consolidated Statement of Operations, see “Item 7. Management’s Discussion and Analysis of Financial Condition and Results of Operations.”
The Glen Head, New York property is subject to a sale agreement at a price of $4,000. This property is carried on our books as an asset held for sale for $3,800, which includes estimated disposal costs. The buyer has indicated that its intended plan is to build residential housing on this former industrial site and has been engaged in the lengthy process of securing the necessary governmental approvals. In March 2015, we entered into an amendment to the sales contract with the buyer. The amendment provides for a potential reduction in the purchase price from zero up to $1,000 if the final governmental approvals contain certain limitations on the buyer’s
13
($ in Thousands Except Share Amounts)
ability to implement its intended development plan. The parties are obligated to close under the sales contract upon receipt of the final governmental approvals, and we must provide the buyer with a funded remediation plan and environmental insurance at closing. However, the amendment further provides that if the governmental approvals are not secured by December 31, 2017, then at any time after that date either we or the buyer may elect to terminate the sales contract. If at any time after December 31, 2017, we terminate the sales contract for convenience, we must return to the buyer an additional liquidated amount of $750.
We are engaged in various legal proceedings incidental to our business. Our management, after taking into consideration information provided by our legal counsel, believes that except for the environmental matters described in the next paragraph, these matters will have no material effect on our consolidated financial position or the results of operations or cash flows in future periods.
We are subject to federal and state requirements for protection of the environment, including those for discharge of hazardous materials and remediation of contaminated sites. As a result, we are a party to or have our former property subject to various lawsuits or proceedings involving environmental matters. Due in part to their complexity and pervasiveness, such matters have resulted in us being involved with related legal proceedings, claims, and remediation obligations. The extent of our financial exposure cannot in all cases be reasonably estimated at this time. For information regarding these matters, including current estimates of the amounts that we believe are required for remediation or clean-up to the extent estimable, see Note 13 in the “Notes to Consolidated Financial Statements” contained elsewhere in this report.
None.
14
($ in Thousands Except Share Amounts)
|
MARKET FOR REGISTRANT’S COMMON EQUITY, RELATED STOCKHOLDER MATTERS, AND ISSUER PURCHASES OF EQUITY SECURITIES |
Our common stock, par value $0.01, is listed for trading on the NYSE MKT under the trading symbol BZC. The following table sets forth the range of high and low sale prices of our common stock as reported on the NYSE MKT for the periods indicated.
|
|
|
High |
|
|
Low |
|
||
|
Fiscal 2014 |
|
|
|
|
|
|
|
|
|
First Quarter |
|
$ |
9.30 |
|
|
$ |
8.13 |
|
|
Second Quarter |
|
|
9.92 |
|
|
|
8.65 |
|
|
Third Quarter |
|
|
9.88 |
|
|
|
9.00 |
|
|
Fourth Quarter |
|
|
9.90 |
|
|
|
9.16 |
|
|
Fiscal 2015 |
|
|
|
|
|
|
|
|
|
First Quarter |
|
$ |
13.62 |
|
|
$ |
9.44 |
|
|
Second Quarter |
|
|
12.70 |
|
|
|
10.06 |
|
|
Third Quarter |
|
|
10.78 |
|
|
|
9.70 |
|
|
Fourth Quarter |
|
|
10.33 |
|
|
|
9.65 |
|
Holders
As of May 20, 2015, the number of stockholders of record of the Company’s common stock was 1,230. On May 20, 2015, the closing sales price of a share of common stock was $10.33 per share.
Dividends
We have not paid any cash dividends on our common stock since fiscal 2001.The decision of paying future cash dividends, if any, will be reviewed periodically by our Board of Directors and will depend upon the results of operations, financial condition, contractual and legal restrictions and other factors the Board of Directors determines to be relevant at the time.
Our credit agreement for our Revolving Credit Facility does not allow us to declare or pay a cash dividend except for special dividends payable in the ordinary course of business provided that (i) no default of the loan exists or that no default would result from making such dividend, (ii) after distributing a dividend, at least $5,000 would be available for borrowing under the Revolving Credit Facility, and (iii) we would remain in compliance with the financial covenants under the credit agreement on a pro forma basis.
15
($ in Thousands Except Share Amounts)
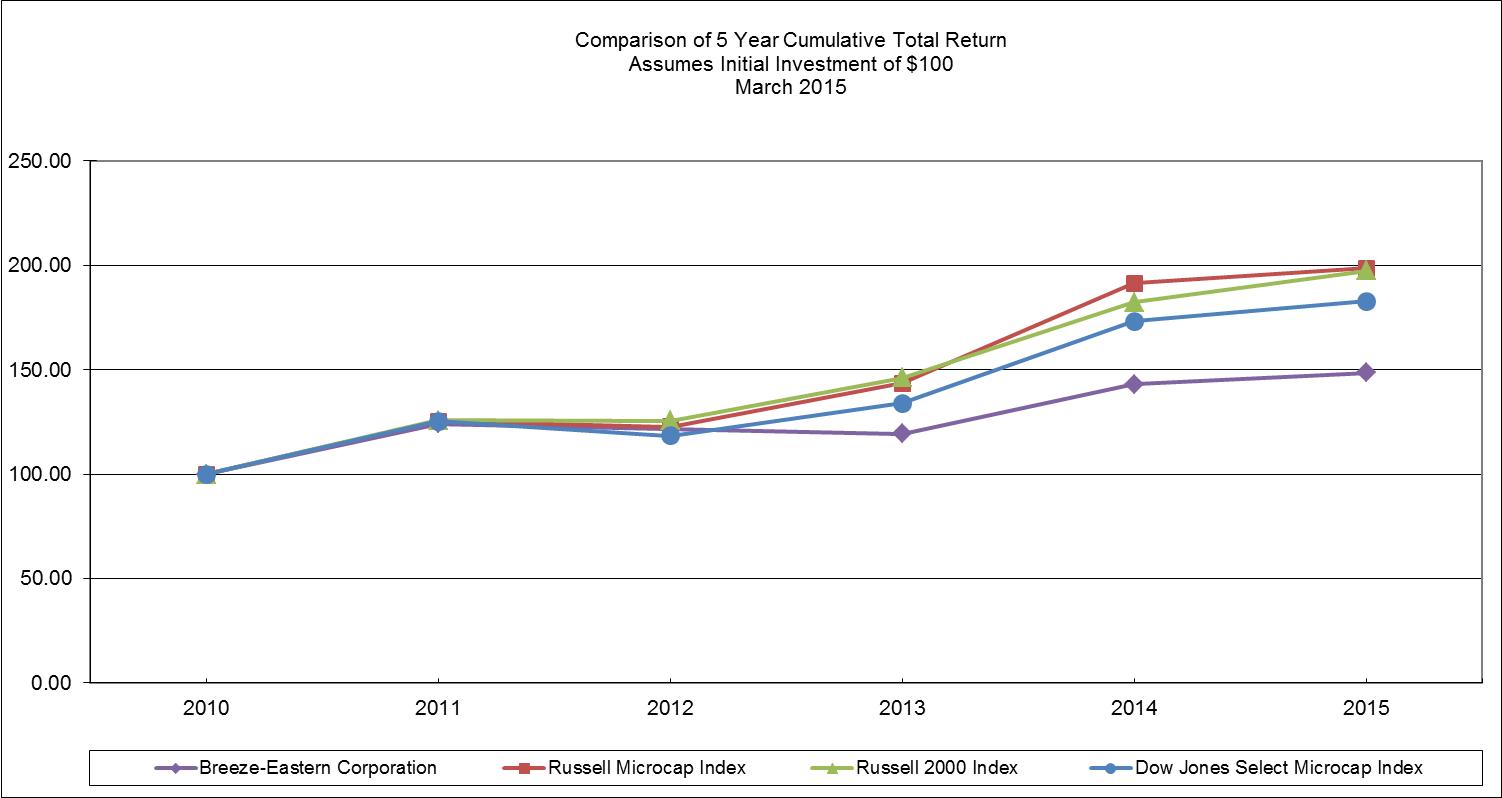
Stock Performance Graph
The following Performance Graph and related information shall not be deemed “soliciting material” or to be “filed” with the Securities and Exchange Commission, nor shall such information be incorporated by reference into any future filing under the Securities Act of 1933 or Securities Exchange Act of 1934, each as amended, except to the extent that the Company specifically incorporates such information by reference into such filing.
This stock performance graph compares the Company’s total cumulative stockholder return on its common stock during the period from April 1, 2010 through March 31, 2015, with the cumulative return on the Indexes below. The graph assumes a $100 investment on March 31, 2010.
|
|
|
Years Ended March 31, |
|
|||||||||||||||||||||
|
|
|
2010 |
|
|
2011 |
|
|
2012 |
|
|
2013 |
|
|
2014 |
|
|
2015 |
|
||||||
|
Breeze-Eastern Corporation |
|
$ |
100.00 |
|
|
$ |
124.16 |
|
|
$ |
121.56 |
|
|
$ |
119.38 |
|
|
$ |
142.97 |
|
|
$ |
148.47 |
|
|
Russell Microcap Index |
|
|
100.00 |
|
|
|
125.34 |
|
|
|
122.75 |
|
|
|
143.59 |
|
|
|
191.35 |
|
|
|
198.59 |
|
|
Russell 2000 Index |
|
|
100.00 |
|
|
|
125.79 |
|
|
|
125.56 |
|
|
|
146.03 |
|
|
|
182.39 |
|
|
|
197.37 |
|
|
Dow Jones Select Microcap Index |
|
|
100.00 |
|
|
|
125.27 |
|
|
|
118.26 |
|
|
|
134.04 |
|
|
|
173.20 |
|
|
|
182.89 |
|
16
($ in Thousands Except Share Amounts)
The following table sets forth selected financial data for the most recent five year period ended March 31, 2015. This financial data should be read together with our consolidated financial statements and related notes, Management’s Discussion and Analysis of Financial Condition and Results of Operations, and other financial data appearing elsewhere in this report.
|
|
|
Years ended March 31, |
|
|||||||||||||||||
|
|
|
2015 |
|
|
2014 |
|
|
2013 |
|
|
2012 |
|
|
2011 |
|
|||||
|
Results from Operations |
|
|
|
|
|
|
|
|
|
|
|
|
|
|
|
|
|
|
|
|
|
Net sales |
|
$ |
89,782 |
|
|
$ |
85,933 |
|
|
$ |
79,956 |
|
|
$ |
84,942 |
|
|
$ |
78,200 |
|
|
Gross profit |
|
|
34,864 |
|
|
|
31,131 |
|
|
|
32,813 |
|
|
|
35,214 |
|
|
|
30,952 |
|
|
Operating income |
|
|
12,905 |
|
|
|
9,089 |
|
|
|
8,190 |
|
|
|
7,022 |
|
|
|
9,457 |
|
|
Interest expense |
|
|
32 |
|
|
|
49 |
|
|
|
227 |
|
|
|
396 |
|
|
|
694 |
|
|
Other (income) expense-net |
|
|
(1,611) |
|
|
|
89 |
|
|
|
93 |
|
|
|
109 |
|
|
|
213 |
|
|
Net income |
|
|
14,907 |
|
|
|
5,641 |
|
|
|
4,076 |
|
|
|
3,776 |
|
|
|
5,026 |
|
|
Net income per share: |
|
|
|
|
|
|
|
|
|
|
|
|
|
|
|
|
|
|
|
|
|
Basic |
|
$ |
1.52 |
|
|
$ |
0.58 |
|
|
$ |
0.43 |
|
|
$ |
0.40 |
|
|
$ |
0.53 |
|
|
Diluted |
|
|
1.50 |
|
|
|
0.58 |
|
|
|
0.43 |
|
|
|
0.39 |
|
|
|
0.53 |
|
|
Approximate diluted shares outstanding at year-end |
|
|
9,946,000 |
|
|
|
9,704,000 |
|
|
|
9,544,000 |
|
|
|
9,490,000 |
|
|
|
9,429,000 |
|
|
Financial Position |
|
|
|
|
|
|
|
|
|
|
|
|
|
|
|
|
|
|
|
|
|
Total assets |
|
$ |
96,978 |
|
|
$ |
79,793 |
|
|
$ |
73,413 |
|
|
$ |
79,851 |
|
|
$ |
78,148 |
|
|
Working capital |
|
|
56,474 |
|
|
|
39,708 |
|
|
|
34,034 |
|
|
|
39,148 |
|
|
|
32,376 |
|
|
Long-term debt |
|
|
— |
|
|
|
— |
|
|
|
— |
|
|
|
8,215 |
|
|
|
11,500 |
|
|
Stockholders’ equity |
|
|
67,115 |
|
|
|
50,484 |
|
|
|
43,072 |
|
|
|
38,152 |
|
|
|
33,433 |
|
|
Book value per share at year end |
|
|
6.75 |
|
|
|
5.20 |
|
|
|
4.51 |
|
|
|
4.02 |
|
|
|
3.55 |
|
|
Ratios |
|
|
|
|
|
|
|
|
|
|
|
|
|
|
|
|
|
|
|
|
|
Current ratio |
|
|
4.09 |
|
|
|
3.50 |
|
|
|
3.32 |
|
|
|
3.37 |
|
|
|
3.11 |
|
This Management’s Discussion and Analysis of Financial Condition and Results of Operation and other parts of this Annual Report on Form 10-K contain forward-looking statements that involve risks and uncertainties. All forward-looking statements included in this Annual Report on Form 10-K are based on information available to us on the date hereof, and except as required by law, we assume no obligation to update any such forward-looking statements. Our actual results may differ materially from those anticipated in these forward-looking statements as a result of a number of factors, including those set forth under the caption “Risk Factors” beginning on page 6 of this report and elsewhere herein. The following should be read in conjunction with our annual consolidated financial statements, including the notes thereto, contained elsewhere in this report. All references to years in this Management’s Discussion and Analysis of Financial Condition and Results of Operations refer to the fiscal year ended March 31 of the indicated year unless otherwise specified. Forward-looking statements are discussed further in Part 1 “Disclosure Regarding Forward-Looking Statements” contained elsewhere in this report.
OVERVIEW
We design, develop, manufacture, sell, and service sophisticated engineered mission equipment for specialty aerospace and defense applications. We have long been recognized as a leading global designer, manufacturer, service provider, and supplier of mission-critical rescue hoists. We also manufacture weapons-handling systems, cargo winches, cargo hook systems and tie-down equipment. Our products are designed to be efficient and reliable in extreme operating conditions and are used to complete rescue operations and military insertion/extraction operations, move and transport cargo, and load weapons onto aircraft and ground-based launching systems.
Our primary strategy is to continue to expand our position as a market leader in the design, development, and service of sophisticated mission equipment for specialty aerospace and defense applications. We intend to maintain our position by continuing to focus on our principal customers and on geographic areas where we have developed our reputation as a premier provider of aircraft hoist and lift equipment, and by expanding both our customer base and product lines. We believe that continued spending on research and development to improve the quality of our product offerings and remaining on the leading edge of technological advances in our chosen markets is also crucial to our business. In this regard, we will continue to commit resources to product research and development. We are also seeking to accelerate the development of new products with the addition of a product development center in Virginia and new strategic partners. One of the projects under development is the MissionViewTM situational awareness system. The
17
($ in Thousands Except Share Amounts)
MissionViewTM system is designed to integrate one or more new components with a rescue hoist, such as sensor systems, a camera system, and a lighted hook, with a tablet computer to provide crew members with data and information critical to the mission such as, among other things, cable load and length of cable extended, while also recording data for post-mission training. Our new products typically take a significant amount of time to develop and to obtain necessary government and other approvals. Accordingly, at this time we cannot predict when we will complete the development of the components of the MissionViewTM system, when they will be available for sale, and if they will be commercially accepted. See also Risk Factors in Item 1A of this report.
Our business is affected by global economic and geo-political conditions. United States defense spending reductions and redirections could have a material impact on our revenues and earnings in future periods. Similarly, European government military and spending reductions could have a material impact on revenues and earnings in future periods. However, we believe that the primary military missions that drive procurement and the use of our equipment (search and rescue, special operations, and cargo delivery) will continue to get a relatively high funding priority.
We have experienced product development schedule delays and increased investment due to OEM customer extended development timetables and due to our own product development progress. Our engineering expense in fiscal 2015 was reported net of reimbursements from Airbus, and we received no reimbursements in fiscal 2013 and fiscal 2014.
CRITICAL ACCOUNTING POLICIES
Our consolidated financial statement preparation conforms to accounting principles generally accepted in the United States of America and requires us to make estimates, judgments, and assumptions. We believe that the estimates, judgments, and assumptions upon which we rely are reasonable based upon information available at the time that they are made. These estimates, judgments, and assumptions can affect the reported amounts of assets and liabilities as of the date of the financial statements, as well as the reported amounts of revenues and expenses during the periods presented. To the extent that there are material differences between these estimates, judgments, or assumptions and actual results, our financial statements will be affected. We believe the following critical accounting policies are affected by significant estimates, assumptions, and judgments used in preparing our consolidated financial statements.
Inventory. We purchase parts and materials to assemble and manufacture components for use in our products and for use by our engineering and repair and overhaul departments. The decision to purchase a set quantity of a particular material is influenced by several factors including current and projected cost, future estimated availability, production lead time, existing and projected contracts to produce certain items, and the estimated needs for our overhaul and repair business.
We value inventories using the lower of cost or market on a first-in, first-out (FIFO) basis. We reduce the carrying amount of these inventories to net realizable value based on our assessment of inventory that is considered excess or obsolete based on the historical usage. Since all of our products are produced to meet specific customer requirements, the reserve focus is on purchased and manufactured parts.
Inventory obsolescence is determined by identifying specific items based on the age of inventory and by establishing a general reserve based on annual purchases. Analyzing inventory by age showed little movement once items have aged five years, and historical trends showed that 1.1% of purchases would eventually be scrapped. Therefore, each $1,000 of inventory purchased will result in an increase of $11 in inventory reserves. Management periodically reviews this methodology to ensure it is reasonably accurate and will make future adjustments as necessary through current earnings. In fiscal 2015, 2014, and 2013, we increased the inventory obsolescence reserve by $238, $291, and $540, respectively.
Inventories are discussed further in Notes 1 and 2 of the “Notes to Consolidated Financial Statements” contained elsewhere in this report.
Qualification Units and Analysis of Contract Profitability. We capitalize as intangible assets engineering qualification units, which are pre-production product assets that are tested as part of qualifying production units for use on an aircraft. Prior to qualification testing, the pre-qualification units (materials and external testing costs) are also classified with qualification units. Engineering qualification units are ultimately expensed, as the Company amortizes qualification unit costs to expense over future equipment unit shipments.
We review qualification units and pre-qualification assets for impairment annually or whenever events or changes in circumstances indicate that the carrying amount may not be recoverable. We test qualification units and pre-qualification assets for impairment two ways. The first test is for technical obsolescence. If product development or product testing results in a design or technical change, qualification units and pre-qualification assets that become obsolete are expensed in the current period.
18
($ in Thousands Except Share Amounts)
Secondly, we analyze contracts to assess their profitability, comparing undiscounted future cash flows of existing and anticipated production contracts to the ultimate cost of production and development, including qualification units and pre-qualification assets. If the test indicates a contract was not going to produce sufficient profits to cover the cost of qualification units and pre-qualification assets, these assets would become impaired. This impairment loss would reduce the carrying amount of the related assets and we would accrue any additional losses on the contract.
In assessing anticipated production contracts, we evaluate undiscounted future cash flows that may include revenue from anticipated price increases of un-priced change orders. These revenues are included when price recovery is probable, which is based on the likelihood that the customer will qualify the unit for production, and the related production costs are identifiable and reasonable. We may also estimate the number of production units and estimated costs to complete, in continuing long-term production for delivery under existing or anticipated contracts.
As indicated above, the process of analyzing contracts may involve an assessment of the likelihood of our negotiating either future production contracts or future sales price increases. If we determine that it is probable such events will occur, the related production volume or increased pricing is included in the contract analysis. If the probable event were ultimately not to occur, a loss would be recognized at the time such determination is made which could significantly affect our results from operations.
Revenue Recognition. Revenue related to equipment sales is recognized when title and risk of loss have been transferred, collectability is reasonably assured, and pricing is fixed or determinable. Revenue related to repair and overhaul sales is recognized when the related repairs or overhaul are complete and the unit is shipped to the customer. Revenue related to contracts in which we are reimbursed for costs incurred plus an agreed upon profit are recorded as costs are invoiced.
Environmental Reserves. We provide for a best estimate of environmental liability reserves when, after consultation with counsel and other environmental consultants, we determine that a liability is both probable and estimable. In many cases, we do not fix or cap the liability for a particular site when first recorded. Factors that affect the recorded amount of the liability in future years include our participation percentage due to a settlement by, or bankruptcy of, other potentially responsible parties, a change in the environmental laws resulting in more stringent requirements, a change in the estimate of future costs that will be incurred to remediate the site, and changes in technology related to environmental remediation. Current estimated exposures related to environmental claims are discussed further in Note 13 of our “Notes to Consolidated Financial Statements” contained elsewhere in this report.
Deferred Tax Asset. See Note 5 of the “Notes to Consolidated Financial Statements” contained elsewhere in this report.
Stock-Based Compensation. See Note 9 of the “Notes to Consolidated Financial Statements” contained elsewhere in this report.
RESULTS OF OPERATIONS
The discussion of Results of Operations includes disclosure of certain non-GAAP financial measures and a comparison of such measures to the underlying GAAP measure. See the disclosure below under the heading “Non-GAAP Financial Measures” for further detail about the use of these non-GAAP measures.
19
($ in Thousands Except Share Amounts)
Fiscal 2015 Compared with Fiscal 2014
|
|
|
Fiscal Year Ended |
|
|
Increase/ |
|
||||||||||
|
|
|
March 31, |
|
|
March 31, |
|
|
$ |
|
|
% |
|
||||
|
Products |
|
$ |
68,902 |
|
|
$ |
62,234 |
|
|
$ |
6,668 |
|
|
|
10.7 |
% |
|
Services |
|
|
20,880 |
|
|
|
23,699 |
|
|
|
(2,819) |
|
|
|
(11.9) |
|
|
Net sales |
|
|
89,782 |
|
|
|
85,933 |
|
|
|
3,849 |
|
|
|
4.5 |
|
|
Products |
|
|
43,639 |
|
|
|
39,650 |
|
|
|
3,989 |
|
|
|
10.1 |
|
|
Services |
|
|
11,279 |
|
|
|
15,152 |
|
|
|
(3,873) |
|
|
|
(25.6) |
|
|
Cost of sales |
|
|
54,918 |
|
|
|
54,802 |
|
|
|
116 |
|
|
|
0.2 |
|
|
Gross profit |
|
|
34,864 |
|
|
|
31,131 |
|
|
|
3,733 |
|
|
|
12.0 |
|
|
As a % of net sales |
|
|
38.8 |
% |
|
|
36.2 |
% |
|
|
N/A |
|
|
|
2.6 |
%Pt. |
|
Selling, general, and administrative expenses |
|
|
15,352 |
|
|
|
13,880 |
|
|
|
1,472 |
|
|
|
10.6 |
|
|
Engineering expense-net |
|
|
6,607 |
|
|
|
8,162 |
|
|
|
(1,555 |
) |
|
|
(19.1 |
) |
|
Operating income |
|
|
12,905 |
|
|
|
9,089 |
|
|
|
3,816 |
|
|
|
42.0 |
|
|
Interest expense |
|
|
32 |
|
|
|
49 |
|
|
|
(17 |
) |
|
|
(34.7 |
) |
|
Other (income) expense-net |
|
|
(1,611) |
|
|
|
89 |
|
|
|
1,700 |
|
|
|
1,910.1 |
|
|
Income tax (benefit) provision |
|
|
(423) |
|
|
|
3,310 |
|
|
|
(3,733) |
|
|
|
(112.8) |
|
|
Effective tax rate |
|
|
(3.0) |
% |
|
|
37.0 |
% |
|
|
N/A |
|
|
|
(40.0) |
%Pt. |
|
Net income |
|
$ |
14,907 |
|
|
$ |
5,641 |
|
|
$ |
9,266 |
|
|
|
164.3 |
% |
Net Sales. Fiscal 2015 net sales of $89,782 increased by $3,849, or 4.5%, from net sales of $85,933 in fiscal 2014.
Product sales in fiscal 2015 were $68,902, an increase of $6,668 or 10.7%, from $62,234 in the prior fiscal year. The increase is primarily due to higher new equipment winch volume to Airbus and higher spare parts volume to the U.S. Government and to foreign governments.
Service sales in fiscal 2015 were $20,880, a decrease of $2,819, or 11.9%, from $23,699 in the prior fiscal year due to lower overhaul & repair volume to the U.S. Government partly offset by higher overhaul & repair volume to foreign governments.
The timing of U.S. Government awards, availability of U.S. Government funding, and product delivery schedules are among the factors that affect the period of recording revenues. Fiscal 2015 was consistent with recent years with revenues in the second half of the fiscal year exceeding revenues in the first half of the fiscal year; we believe fiscal 2016 revenues will be consistent with this historical pattern.
Cost of Sales. Products cost of sales of $43,639 in the fiscal 2015 were 10.1% higher than the prior fiscal year period primarily due to the increased new equipment volume. Cost of services provided of $11,279 in the fiscal 2015 were $3,873 lower than fiscal 2014 due to lower overhaul & repair volume and lower engineering volume.
Gross profit. Gross profit of $34,864 in the fiscal 2015 was $3,733, or 12.0% higher than fiscal 2014. Gross profit dollars improved primarily from higher volume and margin of spare part sales and an improvement in engineering profitability. As a percent of sales, the gross profit margin was 38.8% for the fiscal 2015 compared with 36.2% for the prior fiscal year. Gross profit as a percent of sales improved primarily due to higher margins on spare part sales, overhaul & repair, and billable engineering. Prior fiscal year gross profit was impacted negatively by $1,033 related to the termination of a spare parts distributor.
Operating Expenses. Total operating expenses were $21,959, or 24.5% of net sales, for fiscal 2015 compared with $22,042, or 25.7% of net sales, in the prior fiscal year. Selling, general and administrative “(SG&A”) expense were $15,352 in the fiscal 2015 compared with $13,880 in fiscal 2014, an increase of $1,472 partly explained by the significant reduction of the environmental liability experienced in the fiscal 2014 first quarter of $1,207 recorded for the previously-owned property in Wyoming, Illinois. A reduction of $412 in environmental liability was also recorded in the fiscal 2015 first quarter following the approval of the final remedial action plan for a portion of the Federal Labs Saltsburg, Pennsylvania site. Higher SG&A costs were also incurred as a result of executive transition costs of $678, and $240 in fiscal 2015 and fiscal 2014, respectively. Excluding for both fiscal years the benefits from the environmental reserve reduction and the executive transition cost, SG&A expense increased by $239. As a percent of sales, SG&A expense was 17.1% (16.8% excluding the environmental reserve reduction benefit and executive transition costs) in the fiscal 2015 versus 16.2% in the last fiscal year (17.3% excluding the environmental reserve reduction benefit and executive transition costs).
20
($ in Thousands Except Share Amounts)
Engineering expenses were $6,607 in fiscal 2015 compared with $8,162 in fiscal 2014. The decrease primarily resulted from lower expenses incurred for development programs, partly off-set by expenses incurred of $288 for an internal re-organization in fiscal year 2015.
Other (Income) expense-net. Other income was $1,611 for fiscal 2015 versus other expense of $89 for last fiscal year. Fiscal 2015 other income primarily represents a refund received from a real estate property tax review and assessment reduction for the Glen Head, New York property of $1,224 (classified on the consolidated balance sheets as an asset for sale) and a $503 gain realized on the sale of a property located in Irvington, New Jersey which had a zero book value and was previously operated by one of our predecessor affiliates not used in our operations.
Income tax (benefit) provision. Income tax benefit was $423 in fiscal 2015 versus a provision of $3,310 in fiscal 2014. The income tax benefit in fiscal 2015 is the result of recording a research & development tax credit of $6,293. This tax credit is related to qualifying research & development expenses incurred during fiscal 2001 through fiscal 2015. Our effective tax rate decreased to (3.0) % in fiscal 2015 from 37.0% in fiscal 2014. Excluding the research & development tax credit, our effective tax rate would have been 32.9%. Income taxes and income tax rates are discussed further in Note 5 of the “Notes to Consolidated Financial Statements” contained elsewhere in this report.
Net Income. Net income was $14,907 or $1.50 per diluted share, in fiscal 2015 compared with $5,641 or $0.58 per diluted share, in fiscal 2014. The improvement in net income was mainly due to higher volume and margins of spare sales, lower engineering expenses, a property tax refund on the Glen Head, New York property, the gain realized on the sale of an un-occupied property located in Irvington, New Jersey and the impact on the effective tax rate of a research & development tax credit. Excluding the impact on the effective tax rate of the research & development tax credit, the executive transition costs, the environmental reserve reduction, the internal re-organization costs, the real estate tax refund and the gain realized on the sale of the property, net income for fiscal 2015 would have been $8,926 or $0.90 per diluted share. Excluding the gross profit reduction associated with the termination of a distributor, the environmental reserve reduction, and the executive transition costs, net income in fiscal 2014, would have been $5,681, or $0.58 per diluted share. A reconciliation of net income for excluded items is presented under Non-U.S. GAAP Financial Measures.
New Orders. New products and services orders received during the twelve month period ended March 31, 2015 decreased by 11.5% to $79,874 compared with $90,295 during the twelve month period ended March 31, 2014. The orders received during last fiscal year included $7,140 of net increased pricing and contract scope for the Airbus A400M military transport aircraft.
Backlog. Backlog at March 31, 2015 was $109,556 compared with $119,464 at March 31, 2014 as shipments exceeded new orders by $9,908. New orders are discussed in “New Orders” above. The backlog at March 31, 2015 and 2014 includes approximately $63,394 and $70,853, respectively, for the Airbus A400M military transport aircraft which commenced shipping in the third quarter of fiscal 2014.
We measure backlog by the amount of products or services that customers committed by contract to purchase as of a given date. Backlog may vary substantially over time due to the size and timing of orders. Backlog of approximately $52,282 at March 31, 2015 is scheduled for shipment during fiscal 2016.
The book-to-bill ratio equals new orders received during a period divided by sales for the same period. Although significant cancellations of purchase orders or substantial reductions of product quantities in existing contracts seldom occur, such cancellations or reductions could substantially and materially reduce backlog. Therefore, backlog information may not represent the actual amount of shipments or sales for any future period.
A book-to-bill ratio in excess of 1.0 is potentially indicative of continued overall growth in sales. The book to bill ratio was 0.9 for fiscal 2015 and 1.1 for fiscal 2014.
21
($ in Thousands Except Share Amounts)
Fiscal 2014 Compared with Fiscal 2013
|
|
|
Fiscal Year Ended |
|
|
Increase/ |
|
||||||||||
|
|
|
March 31, |
|
|
March 31, |
|
|
$ |
|
|
% |
|
||||
|
Products |
|
$ |
62,234 |
|
|
$ |
59,765 |
|
|
$ |
2,469 |
|
|
|
4.1 |
% |
|
Services |
|
|
23,699 |
|
|
|
20,191 |
|
|
|
3,508 |
|
|
|
17.4 |
|
|
Net sales |
|
|
85,933 |
|
|
|
79,956 |
|
|
|
5,977 |
|
|
|
7.5 |
|
|
Products |
|
|
39,650 |
|
|
|
34,255 |
|
|
|
5,395 |
|
|
|
15.7 |
|
|
Services |
|
|
15,152 |
|
|
|
12,888 |
|
|
|
2,264 |
|
|
|
17.6 |
|
|
Cost of sales |
|
|
54,802 |
|
|
|
47,143 |
|
|
|
7,659 |
|
|
|
16.2 |
|
|
Gross profit |
|
|
31,131 |
|
|
|
32,813 |
|
|
|
(1,682 |
) |
|
|
(5.1 |
) |
|
As a % of net sales |
|
|
36.2 |
% |
|
|
41.0 |
% |
|
|
N/A |
|
|
|
(4.8 |
)%Pt. |
|
Selling, general, and administrative expenses |
|
|
13,880 |
|
|
|
15,246 |
|
|
|
(1,366 |
) |
|
|
(9.0 |
) |
|
Engineering expense |
|
|
8,162 |
|
|
|
9,377 |
|
|
|
(1,215 |
) |
|
|
(13.0 |
) |
|
Operating income |
|
|
9,089 |
|
|
|
8,190 |
|
|
|
899 |
|
|
|
11.0 |
|
|
Interest expense |
|
|
49 |
|
|
|
227 |
|
|
|
(178 |
) |
|
|
(78.4 |
) |
|
Other expense-net |
|
|
89 |
|
|
|
93 |
|
|
|
(4 |
) |
|
|
(0.1 |
) |
|
Income tax provision |
|
|
3,310 |
|
|
|
3,794 |
|
|
|
(484) |
|
|
|
(12.8) |
|
|
Effective tax rate |
|
|
37.0 |
% |
|
|
48.2 |
% |
|
|
N/A |
|
|
|
(11.2) |
%Pt. |
|
Net income |
|
$ |
5,641 |
|
|
$ |
4,076 |
|
|
$ |
1,565 |
|
|
|
38.4 |
% |
Net Sales. Fiscal 2014 net sales of $85,933 increased by $5,977, or 7.5%, from net sales of $79,956 in fiscal 2013.
Product sales in fiscal 2014 were $62,234, an increase of $2,469, or 4.1%, from $59,765 in fiscal 2013. The increase was primarily due to higher new equipment volume for hoists & winches to international OEMs, as we began shipping product for the Airbus A400M in the third quarter of the 2014 fiscal year. This was partly offset by lower spare parts revenue due to terminating the services of a distributor which resulted in sales returns totaling $1,538 of spare parts.
Service sales in fiscal 2014 were $23,699, an increase of $3,508, or 17.4%, from $20,191 in fiscal 2013. The increase was due to higher overhaul & repair volume of hoists & winches for the U.S. Military and higher billable engineering services.
The timing of U.S. Government awards, availability of U.S. Government funding, and product delivery schedules are among the factors that affect the period of recording revenues. Recent years reported revenues in the second half of the fiscal year exceeding revenues in the first half of the fiscal year. Fiscal 2014 continued that pattern.
Cost of Sales. Products cost of sales of $39,650 in fiscal 2014 increased 15.7% from $34,255 in the prior fiscal year primarily due to greater new equipment sales. Services costs of sales of $15,152 in fiscal 2014 were $2,264 above the prior fiscal year due to greater billable engineering services costs and to higher O&R volume.
Gross profit. Gross profit of $31,131 in fiscal 2014 was $1,682, or 5.1%, lower than $32,813 in the prior fiscal year. The reduced gross profit was due to losses on billable engineering; terminating services of a distributor, as noted above, which resulted in sales returns and related reduction in gross profit of $1,033; and a greater proportion of sales of new equipment sold to large domestic and international OEMs.
As a percent of sales, the gross profit margin was 36.2% for fiscal 2014 compared with 41.0% for fiscal 2013. Product gross profit as a percent of sales declined primarily due to a greater proportion of sales of new equipment to large OEM’s and some newly-developed products which have lower profitability. Spare parts had slightly lower margins. Services gross profit as a percent of sales declined from losses on billable engineering and a greater proportion of U.S. government volume in overhaul & repair.
Operating Expenses. Total operating expenses were $22,042 or 25.7% of net sales, in fiscal 2014 compared with $24,623, or 30.8% of net sales in the prior fiscal year. The $2,581 decrease was primarily due to $1,215 in lower engineering costs and a $1,207 environmental liability reduction in the first fiscal quarter from ending our involvement with a previously-owned property in Wyoming, Illinois.
SG&A expenses were $13,880 in fiscal 2014 compared with $15,246 in fiscal 2013, a decrease of $1,366. The decrease was primarily due to the environmental liability reduction in the fiscal first quarter and other general reductions. Lower general and administrative
22
($ in Thousands Except Share Amounts)
costs were partly offset by spending investments in customer service and marketing and higher medical benefits costs. As a percent of sales, SG&A was 16.2% in fiscal 2014 versus 19.1% in fiscal 2013. The environmental liability reduction accounted for 1.4% of sales.
Engineering expenses were $8,162 in fiscal 2014 compared with $9,377 in fiscal 2013. The $1,215 decrease was due to lower spending on product programs that are nearing the end of their development stage of certain programs.
Interest Expense. Interest expense was $49 in fiscal 2014 versus $227 in fiscal 2013. Prior-year interest included expensing deferred debt acquisition costs after pre-paying our term loan early in fiscal 2013.
Other Expense-net. Other expense was $89 in fiscal 2014 versus $93 in fiscal 2013, and mainly represents operating expenses related to the Glen Head, New York property, classified on the consolidated balance sheets as an asset for sale.
Income tax provision. Income tax expense was $3,310 in fiscal 2014 versus $3,794 in fiscal 2013. The decrease was due to a lower effective tax rate, partly offset by higher pre-tax income from lower general & administrative and engineering expenses. Our effective tax rate decreased to 37.0% in fiscal 2014 from 48.2% in fiscal 2013. The effective tax rate in fiscal 2013 was higher due to an increase in the valuation allowance for state deferred tax assets resulting from a lower state tax rate in New Jersey. Income taxes for fiscal 2014 and fiscal 2013 were computed using the effective tax rate estimated to be applicable for the full fiscal year. Income taxes and income tax rates are discussed further in Note 5 of the “Notes to Consolidated Financial Statements” contained elsewhere in this report.
Net Income. Net income was $5,641, or $0.58 per diluted share, in fiscal 2014 compared with $4,076, or $0.43 per diluted share, in fiscal 2013. The increase resulted primarily from higher pre-tax income from lower general & administrative and engineering expenses and a lower effective tax rate.
New Orders. New products and services orders received during fiscal 2014 increased 7.7% to $90,295 compared with $83,874 during fiscal 2013. The increase was due primarily to new equipment orders, partly offset by lower spare parts orders.
Orders for new equipment increased by $13,174. Significant orders received in fiscal 2014 included $7,140 of net increased pricing and contract scope for the Airbus A400M military transport aircraft and hoist and winch sales for international customers.
Backlog. Backlog at March 31, 2014 was $119,464 compared with $115,102 at March 31, 2013 as new orders exceeded shipments by $4,362. Significant new orders are discussed in “New Orders” above. The backlog at March 31, 2014 and 2013 includes approximately $70,853 and $71,070, respectively, for the Airbus A400M military transport aircraft which commenced shipping in the third quarter of fiscal 2014.
We measure backlog by the amount of products or services that customers committed by contract to purchase as of a given date. Backlog may vary substantially over time due to the size and timing of orders. Backlog of approximately $43,010 at March 31, 2014 is scheduled for shipment during fiscal 2015.
The book-to-bill ratio equals new orders received during a period divided by sales for the same period. Although significant cancellations of purchase orders or substantial reductions of product quantities in existing contracts seldom occur, such cancellations or reductions could substantially and materially reduce backlog. Therefore, backlog information may not represent the actual amount of shipments or sales for any future period.
A book-to-bill ratio in excess of 1.0 is potentially indicative of continued overall growth in sales. The book to bill ratio was 1.1 for fiscal 2014 and 1.0 for fiscal 2013.
Liquidity and Capital Resources
Our principal sources of liquidity are cash on hand, cash generated from operations, and our Revolving Credit Facility.
Our liquidity requirements depend on a number of factors, many of which are beyond our control, including the timing of production under contracts with the U.S. Government. Our working capital needs fluctuate between periods as a result of changes in program status and the timing of payments by program. Additionally, because sales are generally made on the basis of individual purchase orders, liquidity requirements vary based on the timing and volume of orders. Based on cash on hand, future cash expected to be generated from operations, and the Revolving Credit Facility, we expect to have sufficient cash to meet liquidity requirements for the next twelve months and foreseeable future.
23
($ in Thousands Except Share Amounts)
On August 26, 2013, we refinanced the Former Senior Credit Facility with a new five-year Revolving Credit Facility. The Revolving Credit Facility provides us with a $20,000 unsecured revolving line of credit with an accordion feature that, under certain conditions and circumstances may increase to $35,000. We believe we have adequate cash flow and debt availability to meet our operating needs. The Revolving Credit Facility is discussed in Note 6 of the “Notes to Consolidated Financial Statements” contained elsewhere in this report.
We are involved in environmental proceedings and potential proceedings relating to soil and groundwater contamination and other environmental matters at several of our former parent company’s facilities that were never required for our current operations. In fiscal 2016, we anticipate spending approximately $2,387 on environmental characterization and remediation costs. These costs will be charged against our environmental liability reserve and will not impact income.
Fiscal 2015 compared to Fiscal 2014
Our cash was $22,806 on March 31, 2015, compared with $6,021 on March 31, 2014, an increase of $16,785. The increase in our cash is primarily the net result of positive cash flows provided by operating activities of $16,901.
Cash flows provided by operating activities during fiscal 2015 was $16,901 and was primarily the result of current year net income of $14,907, depreciation and amortization of $2,050, stock based compensation of $1,043, a decrease in accounts receivable of $1,492 and an increase in accrued income taxes of $2,566. This was partially offset by a $3,175 increase in deferred taxes due to the recording of the research & development tax credit, a decrease in accounts payable of $921 and a decrease in other liabilities of $1,342, mainly from environmental reserves.
Cash flows used in investing activities in fiscal 2015 was $778, and was used for capital expenditures of $735 mainly for production testing, barcoding equipment, and office furniture. Spending for capitalized qualification units was $43 versus $1,520 last year as we have made progress on our qualification testing activities.
Cash flows provided by financing activities during fiscal 2015 were $662, and reflects cash received from the exercise of stock options.
Fiscal 2014 compared to Fiscal 2013
Our cash was $6,021 on March 31, 2014, compared with $6,688 on March 31, 2013, a decrease of $667.
Cash flows provided by operating activities during fiscal 2014 was $971 and was primarily the result of fiscal 2014 net income of $5,641, depreciation & amortization of $ 1,699, stock based compensation of $672, a decrease in deferred taxes of $ 2,127 and an increase in accounts payable of $1,916. This was partially offset by an $8,267 increase in accounts receivable due to higher fourth quarter sales, a $1,119 increase in inventory, and a decrease in other liabilities of $2,980, mainly due to reductions in the environmental reserves.
Cash flows used in investing activities in fiscal 2014 was $2,517, and was used for capital expenditures of $997 primarily for production test equipment and trade show equipment. Spending for capitalized qualification units was $1,520.
Cash flows provided by financing activities during fiscal 2014 were $879, primarily from cash received for the exercise of stock options.
Other Fiscal 2015 Information
Net working capital at March 31, 2015 was $56,474 versus $39,708 at March 31, 2014, an increase of $16,766. The ratio of current assets to current liabilities was 4.1:1.0 at March 31, 2015 compared with 3.5:1.0 at the beginning of fiscal 2015. The increased working capital primarily resulted from increased cash of $16,785.
Accounts receivable days outstanding were 69 days at March 31, 2015 and 63 days at March 31, 2014. The increase in days is due to customer sales mix and related payment terms. Inventory turnover was 2.5 turns at March 31, 2015 versus 2.4 turns at March 31, 2014. These accounts receivables and inventory measures are predicated on the prior twelve month historical data for sales and cost of sales, and a twelve month average for accounts receivable and inventory.
24
($ in Thousands Except Share Amounts)
CONTRACTUAL OBLIGATIONS
The following table summarizes as of March 31, 2015 our known contractual obligations in future fiscal years:
|
|
|
Payments Due By Period |
|
|||||||||||||||||
|
|
|
Total |
|
|
Less Than |
|
|
1-3 |
|
|
3-5 |
|
|
More Than |
|
|||||
|
Operating leases |
|
$ |
5,282 |
|
|
$ |
1,110 |
|
|
$ |
2,190 |
|
|
$ |
1,957 |
|
|
$ |
25 |
|
|
Purchase obligations (a) |
|
|
— |
|
|
|
— |
|
|
|
— |
|
|
|
— |
|
|
|
— |
|
|
Total |
|
$ |
5,282 |
|
|
$ |
1,110 |
|
|
$ |
2,190 |
|
|
$ |
1,957 |
|
|
$ |
25 |
|
|
(a) |
Our supplier purchase orders contain provisions allowing vendors to recover certain costs in the event of “cancellation for convenience” by us. We believe that we do not have ongoing purchase obligations with respect to our suppliers that are material in amount or that would result, individually or collectively, in a material loss exposure to us if cancelled for convenience. Furthermore, purchase obligations for capital assets and services historically have not been material in amount. |
INFLATION
Neither inflation nor deflation has had, and we do not expect it to have, a material impact upon operating results. We cannot be certain that our business will not be affected by inflation or deflation in the future.
CONTINGENCIES AND LEGACY ENVIRONMENTAL COMMITMENTS
Environmental matters - At March 31, 2015 and March 31, 2014, the aggregate environmental liability was $9,255 and $10,323, respectively. The liability is classified in other current liabilities and other long-term liabilities on the consolidated balance sheets. Separately, environmental cost-sharing with third parties of approximately $1,554 and $1,918 at March 31, 2015 and March 31, 2014, respectfully, is included in other current assets and other long term assets, net of fees to be paid to a third party relating to this arrangement. The Company’s environmental liability reserves are not reduced for any potential cost-sharing reimbursements.
In fiscal 2015 and fiscal 2014, we spent $946 and $1,487, respectively, on environmental costs. We have a detailed plan to manage our environmental exposure on each of our properties. Based on this plan, we anticipate spending approximately $2,387 on environmental matters in fiscal 2016. These costs will be charged against the environmental liability reserve and will not impact income. We perform quarterly reviews of our environmental sites and the related liabilities.
In May 2014, the Pennsylvania Department of Environmental Protection approved the final remedial action report for a portion of the Fed Labs Saltsburg, Pennsylvania site subject to the 2001 Consent Order and as a result of this approval we believe that no further on-site work is required at this portion of the site. Accordingly, we reduced the environmental reserve by $412 in the first quarter of fiscal 2015, as reflected in SG&A expense. Work is continuing at the remainder of the Fed Labs Saltzburg, Pennsylvania site.
In the fiscal first quarter of 2014, the Illinois Environmental Protection Agency issued a No Further Remediation Letter for our former Wyoming, Illinois site. As a result of this letter, we believe that we have no future obligations with respect to this site. Accordingly, we reduced the remaining environmental liability for this site by $1,207 in the first quarter of fiscal 2014, as reflected in SG&A expense.
In March 2014, we reached an agreement in principle with the U.S. Government with respect to environmental response costs for the Fed Labs site subject to the 2003 Consent Order. Under the agreement, which was formally executed in the first quarter of fiscal 2015, the U.S. Government will pay an amount equal to approximately 26% of the environmental response costs incurred prior to December 31, 2012 and 33.5% of the ongoing environmental response costs incurred thereafter. The U.S. Government cost-sharing receivable of $1,152, net of third-party fees increased other current assets and other long term assets by $793 and $359, respectively, on the consolidated balance sheets in March 2014.
Environmental matters are discussed in Note 13 of the “Notes to Consolidated Financial Statements” contained elsewhere in this report.
Litigation – Litigation is discussed in Note 13 of the “Notes to Consolidated Financial Statements” contained elsewhere in this report.
25
($ in Thousands Except Share Amounts)
RECENTLY ISSUED ACCOUNTING STANDARDS
The recent accounting pronouncements are discussed in Note 1 of the “Notes to Consolidated Financial Statements” contained elsewhere in this report.
OFF-BALANCE SHEET ARRANGEMENTS
As of March 31, 2015, we did not have any relationships with unconsolidated entities or financial partners, such as entities often referred to as structured finance or variable interest entities, established for the purpose of facilitating off-balance sheet arrangements or other contractually narrow or limited purposes. As such, we are not materially exposed to any financing, liquidity, market or credit risk that could arise if we had engaged in such relationships
NON–U.S. GAAP FINANCIAL MEASURES
In addition to disclosing financial results that are determined in accordance with Accounting Principles generally accepted in the United States of America (“U.S. GAAP”), we also disclose comparisons to non-U.S. GAAP financial measures including (i) selling, general and administrative expenses (“SG&A”) excluding the benefits from the environmental reserve reduction and executive transition costs (“Adjusted SG&A”), and (ii) net income excluding gross profit impact associated with distributor termination, executive transition costs, environmental reserve reduction, internal re-organization expenses, a real estate tax refund, a gain on the sale of a property, and the impact on the effective tax rate of the research & development tax credit (“Adjusted Net Income”). The presentation of non-U.S. GAAP financial measures is intended to enhance the usefulness of financial information by providing measures which management uses internally to evaluate our expenses and operating performance. We believe excluding the costs and benefits from certain transactions not considered by management to be part of the underlying operating business of the Company improves comparability of results among financial periods and the assessment of financial and business trends. It should be noted that the determination of whether to exclude a transaction involves judgment by management. A reconciliation of Adjusted Net Income to net income, the most directly comparable U.S. GAAP measure, for the fiscal years ended March 31, 2015 and 2014 is shown in the tables below. For Adjusted SG&A, please see the disclosure above under Operating Expenses for all the necessary information needed to reconcile Adjusted SG&A to SG&A, the most directly comparable U.S.GAAP measure, for the fiscal years ended March 31, 2015 and 2014.
Non-U.S. GAAP financial measures, including Adjusted Net Income and Adjusted SG&A, should not be viewed in isolation, are not a substitute for U.S. GAAP measures, and have limitations which include but are not limited to, excluding certain disclosed items which we do not consider to be representative of underlying business operations, but which disclosed items represent costs (benefits) to the Company.
A reader may find any one or all of these items important in evaluating our performance. Management compensates for the limitations of using non-U.S. GAAP financial measures by using them only to supplement our U.S. GAAP results to provide a more complete understanding of the factors and trends affecting our business. In evaluating these financial measures, the reader should be aware that we may incur expenses or receive benefits similar to those excluded in this presentation in the future.
26
($ in Thousands Except Share Amounts)
ADJUSTED NET INCOME RECONCILIATION
|
|
|
Fiscal Year Ended |
|
|||||
|
|
|
March 31, |
|
|
March 31, |
|
||
|
Income before income taxes |
|
$ |
14,484 |
|
|
$ |
8,951 |
|
|
Gross profit impact associated with the termination of a distributor |
|
|
— |
|
|
|
1,033 |
|
|
Executive transition costs |
|
|
678 |
|
|
|
240 |
|
|
Environmental reserve reduction |
|
|
(412) |
|
|
|
(1,207) |
|
|
Internal re-organization expenses |
|
|
288 |
|
|
|
— |
|
|
Real estate tax refund |
|
|
(1,224) |
|
|
|
— |
|
|
Gain realized on the sale of a property |
|
|
(503) |
|
|
|
— |
|
|
|
|
|
|
|
|
|
|
|
|
Adjusted income before income taxes |
|
|
13,311 |
|
|
|
9,017 |
|
|
Income tax provision (a) |
|
|
4,385 |
|
|
|
3,336 |
|
|
Adjusted net income |
|
$ |
8,926 |
|
|
$ |
5,681 |
|
|
|
|
|
|
|
|
|
|
|
|
Adjusted earnings per common share: |
|
|
|
|
|
|
|
|
|
Adjusted diluted net income per share |
|
$ |
0.90 |
|
|
$ |
0.58 |
|
|
Weighted-average diluted shares outstanding |
|
|
9,946,000 |
|
|
|
9,757,000 |
|
|
(a) |
Using the effective tax rate for fiscal 2015 of 32.9% which is the effective tax rate excluding the research & development tax credit, the related valuation allowance and provision for uncertain tax position. Fiscal 2014 uses the effective tax rate of 37.0%. |
We are exposed to various market risks, primarily changes in interest rates associated with our Revolving Credit Facility. At March 31, 2015, we had no borrowings under our Revolving Credit Facility.
At times we maintain our cash in bank deposit accounts in excess of the FDIC insured amount which is $250.
27
($ in Thousands Except Share Amounts)
INDEX TO CONSOLIDATED FINANCIAL STATEMENTS
|
Financial Statements: |
|
|
|
|
29 |
|
|
|
31 |
|
|
|
32 |
|
|
|
33 |
|
|
|
34 |
|
|
|
35 |
|
|
|
36 |
28
REPORT OF INDEPENDENT REGISTERED PUBLIC ACCOUNTING FIRM
To the Audit Committee of the
Board of Directors and Stockholders of
Breeze-Eastern Corporation
We have audited the accompanying consolidated balance sheets of Breeze-Eastern Corporation (the “Company”) as of March 31, 2015 and 2014, and the related consolidated statements of operations, comprehensive income, cash flows and stockholders’ equity for each of the years in the three-year period ended March 31, 2015. Our audits also included the consolidated financial statement schedule as of and for the years listed in the index at Item 15(a)2 on page 56. These consolidated financial statements and consolidated financial statement schedule are the responsibility of the Company’s management. Our responsibility is to express an opinion on these consolidated financial statements and consolidated financial statement schedule based on our audits.
We conducted our audits in accordance with the standards of the Public Company Accounting Oversight Board (United States). Those standards require that we plan and perform the audit to obtain reasonable assurance about whether the consolidated financial statements are free of material misstatement. An audit also includes examining, on a test basis, evidence supporting the amounts and disclosures in the consolidated financial statements, assessing the accounting principles used and significant estimates made by management, as well as evaluating the overall financial statement presentation. We believe that our audits provide a reasonable basis for our opinion.
In our opinion, the consolidated financial statements referred to above present fairly, in all material respects, the consolidated financial position of Breeze-Eastern Corporation as of March 31, 2015 and 2014, and the consolidated results of its operations and its cash flows for each of the years in the three-year period ended March 31, 2015, in conformity with accounting principles generally accepted in the United States of America. Also, in our opinion, the related consolidated financial statement schedule, when considered in relation to the basic consolidated financial statements taken as a whole presents fairly, in all material respects, the information set forth therein.
We have also audited, in accordance with the standards of the Public Company Accounting Oversight Board (United States), Breeze-Eastern Corporation’s internal control over financial reporting as of March 31, 2015, based on the criteria established in the 2013 Internal Control-Integrated Framework issued by the Committee of Sponsoring Organizations of the Treadway Commission and our report dated May 29, 2015 expressed an unqualified opinion on the effectiveness of the Company’s internal control over financial reporting.
/s/ Marcum llp
Marcum llp
Bala Cynwyd, PA
May 29, 2015
29
REPORT OF INDEPENDENT REGISTERED PUBLIC ACCOUNTING FIRM ON INTERNAL CONTROL OVER FINANCIAL REPORTING
To the Audit Committee of the
Board of Directors and Stockholders of
Breeze-Eastern Corporation
We have audited Breeze-Eastern Corporation's (the “Company”) internal control over financial reporting as of March 31, 2015, based on criteria established in the 2013 Internal Control-Integrated Framework issued by the Committee of Sponsoring Organizations of the Treadway Commission. The Company's management is responsible for maintaining effective internal control over financial reporting, and for its assessment of the effectiveness of internal control over financial reporting, included in the accompanying “Management Annual Report on Internal Control over Financial Reporting”. Our responsibility is to express an opinion on the Company's internal control over financial reporting based on our audit.
We conducted our audit in accordance with the standards of the Public Company Accounting Oversight Board (United States). Those standards require that we plan and perform the audit to obtain reasonable assurance about whether effective internal control over financial reporting was maintained in all material respects. Our audit of internal control over financial reporting included obtaining an understanding of internal control over financial reporting, assessing the risk that a material weakness exists, and testing and evaluating the design and operating effectiveness of internal control based on the assessed risk. Our audit also included performing such other procedures as we considered necessary in the circumstances. We believe that our audit provides a reasonable basis for our opinion.
A company’s internal control over financial reporting is a process designed to provide reasonable assurance regarding the reliability of financial reporting and the preparation of financial statements for external purposes in accordance with accounting principles generally accepted in the United States of America. A company's internal control over financial reporting includes those policies and procedures that (1) pertain to the maintenance of records that, in reasonable detail, accurately and fairly reflect the transactions and dispositions of the assets of the company; (2) provide reasonable assurance that transactions are recorded as necessary to permit preparation of financial statements in accordance with accounting principles generally accepted in the United States of America, and that receipts and expenditures of the company are being made only in accordance with authorizations of management and directors of the company; and (3) provide reasonable assurance regarding prevention or timely detection of unauthorized acquisition, use, or disposition of the company’s assets that could have a material effect on the financial statements.
Because of the inherent limitations, internal control over financial reporting may not prevent or detect misstatements. Also, projections of any evaluation of effectiveness to future periods are subject to the risk that controls may become inadequate because of changes in conditions, or that degree of compliance with the policies or procedures may deteriorate.
In our opinion, Breeze-Eastern Corporation maintained, in all material aspects, effective internal control over financial reporting as of March 31, 2015, based on criteria established in the 2013 Internal Control – Integrated Framework issued by the Committee of Sponsoring Organizations of the Treadway Commission.
We have also audited, in accordance with the standards of the Public Company Accounting Oversight Board (United States), the consolidated balance sheets as of March 31, 2015 and 2014, and the related consolidated statements of operations, comprehensive income, cash flows and stockholders’ equity, and the related consolidated financial statement schedule for each of the years in the three-year period ended March 31, 2015 of the Company, and our report dated May 29, 2015 expressed an unqualified opinion on those consolidated financial statements and consolidated financial statement schedule.
/s/ Marcum llp
Marcum llp
Bala Cynwyd, PA
May 29, 2015
30
(In Thousands, Except Share Amounts)
|
|
|
MARCH 31, |
|
||||||
|
ASSETS |
|
|
2015 |
|
|
2014 |
|
||
|
CURRENT ASSETS: |
|
|
|
|
|
|
|
|
|
|
Cash |
|
$ |
22,806 |
|
|
$ |
6,021 |
|
|
|
Accounts receivable (net of allowance for doubtful accounts of $568 and $323 in 2015 and 2014, respectively) |
|
|
22,334 |
|
|
|
24,191 |
|
|
|
Inventories-net |
|
|
19,427 |
|
|
|
18,909 |
|
|
|
Income tax receivable |
|
|
354 |
|
|
|
— |
|
|
|
Prepaid expenses and other current assets |
|
|
1,681 |
|
|
|
1,868 |
|
|
|
Deferred income taxes |
|
|
8,139 |
|
|
|
4,608 |
|
|
|
Total current assets |
|
|
74,741 |
|
|
|
55,597 |
|
|
|
PROPERTY: |
|
|
|
|
|
|
|
|
|
|
Machinery and equipment |
|
|
6,022 |
|
|
|
5,749 |
|
|
|
Furniture, fixtures and information systems |
|
|
8,529 |
|
|
|
8,008 |
|
|
|
Leasehold improvements |
|
|
5,709 |
|
|
|
5,709 |
|
|
|
Construction in progress |
|
|
242 |
|
|
|
301 |
|
|
|
Total |
|
|
20,502 |
|
|
|
19,767 |
|
|
|
Less accumulated depreciation and amortization |
|
|
14,804 |
|
|
|
13,435 |
|
|
|
Property – net |
|
|
5,698 |
|
|
|
6,332 |
|
|
|
OTHER ASSETS: |
|
|
|
|
|
|
|
|
|
|
Deferred income taxes |
|
|
3,821 |
|
|
|
4,197 |
|
|
|
Goodwill |
|
|
402 |
|
|
|
402 |
|
|
|
Real estate held for sale |
|
|
3,800 |
|
|
|
3,800 |
|
|
|
Qualification units and pre-qualification assets – net |
|
|
3,533 |
|
|
|
4,385 |
|
|
|
Other |
|
|
4,983 |
|
|
|
5,080 |
|
|
|
Total other assets |
|
|
16,539 |
|
|
|
17,864 |
|
|
|
TOTAL |
|
$ |
96,978 |
|
|
$ |
79,793 |
|
|
|
LIABILITIES AND STOCKHOLDERS’ EQUITY |
|
|
|
|
|
|
|
|
|
|
CURRENT LIABILITES: |
|
|
|
|
|
|
|
|
|
|
Revolving credit facility |
|
$ |
— |
|
|
$ |
— |
|
|
|
Current portion of long-term debt |
|
|
— |
|
|
|
— |
|
|
|
Accounts payable – trade |
|
|
6,521 |
|
|
|
7,442 |
|
|
|
Accrued compensation |
|
|
2,884 |
|
|
|
2,875 |
|
|
|
Accrued income taxes |
|
|
2,924 |
|
|
|
358 |
|
|
|
Other current liabilities |
|
|
5,938 |
|
|
|
5,214 |
|
|
|
Total current liabilities |
|
|
18,267 |
|
|
|
15,889 |
|
|
|
LONG-TERM DEBT PAYABLE TO BANKS |
|
|
— |
|
|
|
— |
|
|
|
OTHER LONG-TERM LIABILITIES |
|
|
11,596 |
|
|
|
13,420 |
|
|
|
COMMITMENTS AND CONTINGENCIES (Notes 12 and 13) |
|
|
— |
|
|
|
— |
|
|
|
TOTAL LIABILITIES |
|
|
29,863 |
|
|
|
29,309 |
|
|
|
STOCKHOLDERS’ EQUITY |
|
|
|
|
|
|
|
|
|
|
Preferred stock – authorized, 300,000 shares; none issued |
|
|
— |
|
|
|
— |
|
|
|
Common stock – authorized, 100,000,000 shares of $.01 par value; issued, 10,265,707 and 10,148,944 shares in 2015 and 2014, respectively |
|
|
102 |
|
|
|
101 |
|
|
|
Additional paid-in capital |
|
|
100,454 |
|
|
|
98,707 |
|
|
|
Accumulated deficit |
|
|
(26,437 |
) |
|
|
(41,344 |
) |
|
|
Accumulated other comprehensive income |
|
|
37 |
|
|
|
3 |
|
|
|
|
|
|
74,156 |
|
|
|
57,467 |
|
|
|
Less treasury stock, at cost – 450,802 and 445,067 shares in 2015 and 2014, respectively |
|
|
(7,041 |
) |
|
|
(6,983 |
) |
|
|
Total stockholders’ equity |
|
|
67,115 |
|
|
|
50,484 |
|
|
|
TOTAL |
|
$ |
96,978 |
|
|
$ |
79,793 |
|
|
See notes to consolidated financial statements.
31
CONSOLIDATED STATEMENTS OF OPERATIONS
(In Thousands, Except Share Amounts)
|
|
|
Years ended March 31, |
|
|||||||||
|
|
|
2015 |
|
|
2014 |
|
|
2013 |
|
|||
|
Net sales |
|
$ |
89,782 |
|
|
$ |
85,933 |
|
|
$ |
79,956 |
|
|
Cost of sales |
|
|
54,918 |
|
|
|
54,802 |
|
|
|
47,143 |
|
|
Gross profit |
|
|
34,864 |
|
|
|
31,131 |
|
|
|
32,813 |
|
|
Selling, general and administrative expenses |
|
|
15,352 |
|
|
|
13,880 |
|
|
|
15,246 |
|
|
Engineering expense |
|
|
6,607 |
|
|
|
8,162 |
|
|
|
9,377 |
|
|
Operating income |
|
|
12,905 |
|
|
|
9,089 |
|
|
|
8,190 |
|
|
Interest expense |
|
|
32 |
|
|
|
49 |
|
|
|
227 |
|
|
Other (income) expense – net |
|
|
(1,611 |
) |
|
|
89 |
|
|
|
93 |
|
|
Income before income taxes |
|
|
14,484 |
|
|
|
8,951 |
|
|
|
7,870 |
|
|
Income tax (benefit) provision |
|
|
(423 |
) |
|
|
3,310 |
|
|
|
3,794 |
|
|
Net income |
|
$ |
14,907 |
|
|
$ |
5,641 |
|
|
$ |
4,076 |
|
|
Earnings per common share: |
|
|
|
|
|
|
|
|
|
|
|
|
|
Basic net income per share: |
|
$ |
1.52 |
|
|
$ |
0.58 |
|
|
$ |
0.43 |
|
|
Diluted net income per share: |
|
$ |
1.50 |
|
|
$ |
0.58 |
|
|
$ |
0.43 |
|
|
Weighted-average basic shares outstanding |
|
|
9,778,000 |
|
|
|
9,643,000 |
|
|
|
9,511,000 |
|
|
Weighted-average diluted shares outstanding |
|
|
9,946,000 |
|
|
|
9,757,000 |
|
|
|
9,573,000 |
|
See notes to consolidated financial statements.
32
CONSOLIDATED STATEMENTS OF COMPREHENSIVE INCOME
(In Thousands)
|
|
|
Years ended March 31, |
|
|||||||||
|
|
|
2015 |
|
|
2014 |
|
|
2013 |
|
|||
|
Net income |
|
$ |
14,907 |
|
|
$ |
5,641 |
|
|
$ |
4,076 |
|
|
Other comprehensive income (loss): |
|
|
|
|
|
|
|
|
|
|
|
|
|
Change in funded status of the defined benefit post retirement plan, net of taxes |
|
|
34 |
|
|
|
187 |
|
|
|
(110 |
) |
|
Comprehensive income |
|
$ |
14,941 |
|
|
$ |
5,828 |
|
|
$ |
3,966 |
|
See notes to consolidated financial statements.
33
CONSOLIDATED STATEMENTS OF CASH FLOWS
(In Thousands)
|
|
|
Years ended March 31, |
|
|||||||||
|
|
|
2015 |
|
|
2014 |
|
|
2013 |
|
|||
|
Cash flows from operating activities: |
|
|
|
|
|
|
|
|
|
|
|
|
|
Net income |
|
$ |
14,907 |
|
|
$ |
5,641 |
|
|
$ |
4,076 |
|
|
Adjustments to reconcile net income to net cash provided by operating activities: |
|
|
|
|
|
|
|
|
|
|
|
|
|
Write-off of engineering project development qualification units |
|
|
82 |
|
|
|
399 |
|
|
|
398 |
|
|
Shipped qualification assets |
|
|
142 |
|
|
|
747 |
|
|
|
124 |
|
|
Depreciation and amortization |
|
|
2,050 |
|
|
|
1,699 |
|
|
|
1,475 |
|
|
Non-cash interest expense |
|
|
290 |
|
|
|
333 |
|
|
|
393 |
|
|
Stock based compensation |
|
|
1,043 |
|
|
|
672 |
|
|
|
813 |
|
|
Provision for losses on accounts receivable |
|
|
365 |
|
|
|
31 |
|
|
|
17 |
|
|
Deferred taxes-net |
|
|
(3,175 |
) |
|
|
2,127 |
|
|
|
2,462 |
|
|
Changes in assets and liabilities: |
|
|
|
|
|
|
|
|
|
|
|
|
|
(Increase) decrease in accounts receivable and other receivables |
|
|
1,492 |
|
|
|
(8,267 |
) |
|
|
3,431 |
|
|
(Increase) decrease in inventories |
|
|
(518 |
) |
|
|
(1,119 |
) |
|
|
(3,816 |
) |
|
(Increase) decrease in other assets |
|
|
(80 |
) |
|
|
(228 |
) |
|
|
(597 |
) |
|
Increase (decrease) in accounts payable |
|
|
(921 |
) |
|
|
1,916 |
|
|
|
(253 |
) |
|
Increase (decrease) in accrued income taxes |
|
|
2,566 |
|
|
|
(383 |
) |
|
|
398 |
|
|
Increase (decrease) in other liabilities |
|
|
(1,342 |
) |
|
|
(2,597 |
) |
|
|
(1,427 |
) |
|
Net cash provided by operating activities |
|
|
16,901 |
|
|
|
971 |
|
|
|
7,494 |
|
|
Cash flows from investing activities: |
|
|
|
|
|
|
|
|
|
|
|
|
|
Capital expenditures |
|
|
(735 |
) |
|
|
(997 |
) |
|
|
(458 |
) |
|
Capitalized qualification units and pre-qualification assets |
|
|
(43 |
) |
|
|
(1,520 |
) |
|
|
(2,513 |
) |
|
Net cash used in investing activities |
|
|
(778 |
) |
|
|
(2,517 |
) |
|
|
(2,971 |
) |
|
Cash flows from financing activities: |
|
|
|
|
|
|
|
|
|
|
|
|
|
Payments on long-term debt |
|
|
— |
|
|
|
— |
|
|
|
(10,679 |
) |
|
Payment of debt issue costs |
|
|
— |
|
|
|
(33 |
) |
|
|
— |
|
|
Exercise of stock options |
|
|
662 |
|
|
|
912 |
|
|
|
161 |
|
|
Net cash provided by (used in) financing activities |
|
|
662 |
|
|
|
879 |
|
|
|
(10,518 |
) |
|
Increase (decrease) in cash |
|
|
16,785 |
|
|
|
(667 |
) |
|
|
(5,995 |
) |
|
Cash at beginning of year |
|
|
6,021 |
|
|
|
6,688 |
|
|
|
12,683 |
|
|
Cash at end of year |
|
$ |
22,806 |
|
|
$ |
6,021 |
|
|
$ |
6,688 |
|
|
Supplemental information: |
|
|
|
|
|
|
|
|
|
|
|
|
|
Interest payments |
|
$ |
25 |
|
|
$ |
39 |
|
|
$ |
92 |
|
|
Income tax payments |
|
|
270 |
|
|
|
1,909 |
|
|
|
806 |
|
|
Non-cash financing activity for stock option exercise |
|
|
— |
|
|
|
— |
|
|
|
122 |
|
See notes to consolidated financial statements.
34
CONSOLIDATED STATEMENTS OF STOCKHOLDERS’ EQUITY
(In Thousands, Except Share Amounts)
|
|
|
Common Stock |
|
|
Treasury Stock |
|
|
Additional |
|
|
Accumulated |
|
|
Accumulated |
|
|
|
|
||||||||||||||
|
|
|
Shares |
|
|
Amount |
|
|
Shares |
|
|
Amount |
|
|
Capital |
|
|
Deficit |
|
|
(Loss) |
|
|
Total |
|
||||||||
|
BALANCE, MARCH 31, 2012 |
|
|
9,916,855 |
|
|
$ |
99 |
|
|
|
(426,704 |
) |
|
$ |
(6,831 |
) |
|
$ |
96,019 |
|
|
$ |
(51,061 |
) |
|
$ |
(74 |
) |
|
$ |
38,152 |
|
|
Net income |
|
|
— |
|
|
|
— |
|
|
|
— |
|
|
|
— |
|
|
|
— |
|
|
|
4,076 |
|
|
|
— |
|
|
|
4,076 |
|
|
Issuance of stock under stock option plan |
|
|
46,411 |
|
|
|
1 |
|
|
|
(14,739 |
) |
|
|
(123 |
) |
|
|
281 |
|
|
|
— |
|
|
|
— |
|
|
|
159 |
|
|
Issuance of stock under compensation and bonus plan |
|
|
23,934 |
|
|
|
— |
|
|
|
(2,235 |
) |
|
|
(18 |
) |
|
|
— |
|
|
|
— |
|
|
|
— |
|
|
|
(18 |
) |
|
Stock based compensation expense |
|
|
— |
|
|
|
— |
|
|
|
— |
|
|
|
— |
|
|
|
813 |
|
|
|
— |
|
|
|
— |
|
|
|
813 |
|
|
Other comprehensive loss |
|
|
— |
|
|
|
— |
|
|
|
— |
|
|
|
— |
|
|
|
— |
|
|
|
— |
|
|
|
(110 |
) |
|
|
(110 |
) |
|
BALANCE, MARCH 31, 2013 |
|
|
9,987,200 |
|
|
|
100 |
|
|
|
(443,678 |
) |
|
|
(6,972 |
) |
|
|
97,113 |
|
|
|
(46,985 |
) |
|
|
(184 |
) |
|
|
43,072 |
|
|
Net income |
|
|
— |
|
|
|
— |
|
|
|
— |
|
|
|
— |
|
|
|
— |
|
|
|
5,641 |
|
|
|
— |
|
|
|
5,641 |
|
|
Issuance of stock under stock option plan |
|
|
130,548 |
|
|
|
1 |
|
|
|
— |
|
|
|
— |
|
|
|
911 |
|
|
|
— |
|
|
|
— |
|
|
|
912 |
|
|
Issuance of stock under compensation and bonus plan |
|
|
31,196 |
|
|
|
— |
|
|
|
(1,389 |
) |
|
|
(11 |
) |
|
|
11 |
|
|
|
— |
|
|
|
— |
|
|
|
— |
|
|
Stock based compensation expense |
|
|
— |
|
|
|
— |
|
|
|
— |
|
|
|
— |
|
|
|
672 |
|
|
|
— |
|
|
|
— |
|
|
|
672 |
|
|
Other comprehensive income |
|
|
— |
|
|
|
— |
|
|
|
— |
|
|
|
— |
|
|
|
— |
|
|
|
— |
|
|
|
187 |
|
|
|
187 |
|
|
BALANCE, MARCH 31, 2014 |
|
|
10,148,944 |
|
|
|
101 |
|
|
|
(445,067 |
) |
|
|
(6,983 |
) |
|
|
98,707 |
|
|
|
(41,344 |
) |
|
|
3 |
|
|
|
50,484 |
|
|
Net income |
|
|
— |
|
|
|
— |
|
|
|
— |
|
|
|
— |
|
|
|
— |
|
|
|
14,907 |
|
|
|
— |
|
|
|
14,907 |
|
|
Issuance of stock under stock option plan |
|
|
88,833 |
|
|
|
1 |
|
|
|
— |
|
|
|
— |
|
|
|
661 |
|
|
|
— |
|
|
|
— |
|
|
|
662 |
|
|
Issuance of stock under compensation and bonus plan |
|
|
27,930 |
|
|
|
— |
|
|
|
(5,735 |
) |
|
|
(58 |
) |
|
|
43 |
|
|
|
— |
|
|
|
— |
|
|
|
(15 |
) |
|
Stock based compensation expense |
|
|
— |
|
|
|
— |
|
|
|
— |
|
|
|
— |
|
|
|
1,043 |
|
|
|
— |
|
|
|
— |
|
|
|
1,043 |
|
|
Other comprehensive income |
|
|
— |
|
|
|
— |
|
|
|
— |
|
|
|
— |
|
|
|
— |
|
|
|
— |
|
|
|
34 |
|
|
|
34 |
|
|
BALANCE, MARCH 31, 2015 |
|
|
10,265,707 |
|
|
$ |
102 |
|
|
|
(450,802 |
) |
|
$ |
(7,041 |
) |
|
$ |
100,454 |
|
|
$ |
(26,437 |
) |
|
$ |
37 |
|
|
$ |
67,115 |
|
See notes to consolidated financial statements.
35
Notes to Consolidated Financial Statements
($ in Thousands Except Share Amounts)
1. SUMMARY OF SIGNIFICANT ACCOUNTING POLICIES
Business – Breeze-Eastern Corporation (the “Company”) has one manufacturing facility, and one product development facility, both located in the United States. The Company designs, develops, manufactures, sells, and services a complete line of sophisticated lifting and restraining products, principally mission-critical helicopter rescue hoist and cargo hook systems, winches, and hoists for aircraft and weapons handling systems.
The Company has a fiscal year ending March 31. Accordingly, all references to years in the Notes to Consolidated Financial Statements refer to the fiscal year ended March 31 of the indicated year unless otherwise specified.
Reclassifications – The classifications of certain prior period items in the consolidated balance sheets, consolidated statements of operations, and consolidated statements of cash flows, have been changed to conform to the classification used in the current period. These reclassifications had no effect on total net income or retained earnings as previously reported.
Use of Estimates – The preparation of consolidated financial statements in conformity with accounting principles generally accepted in the United States of America (“U.S. GAAP”) requires the Company to make estimates, judgments, and assumptions. The Company believes that the estimates, judgments, and assumptions upon which it relies are reasonable based upon the information available to the Company at the time they are made. These estimates, judgments, and assumptions are based on historical experience and information that is available to management about current events and actions the Company may take in the future. These estimates, judgments, and assumptions can affect the reported amounts of assets and liabilities as of the date of the consolidated financial statements, as well as the reported amounts of revenues and expenses during the periods presented. Significant items subject to estimates, judgments, and assumptions include estimated revenue from unpriced change orders and costs to complete used to assess potential losses on contracts, the carrying value of long-lived assets; valuation allowances for receivables, inventories, and deferred tax assets; environmental liabilities; litigation contingencies; and obligations related to employee benefit plans. To the extent there are material differences between these estimates, judgments, and assumptions and actual results, the Company’s consolidated financial statements will be affected.
Principles of Consolidation – The accompanying consolidated financial statements include the accounts of the Company and its wholly owned subsidiaries. Intercompany balances and transactions are eliminated in consolidation. The consolidated financial statements include seven inactive subsidiaries which include TTERUSA, Inc., TT Connecticut Corporation, Rancho TransTechnology Corporation, Retainers, Inc., SSP Industries, TransTechnology International Corporation, and TransTechnology Germany GmbH.
Revenue Recognition – Revenue related to equipment sales is recognized when title and risk of loss have been transferred, collectability is reasonably assured, and pricing is fixed or determinable. Revenue related to repair and overhaul sales is recognized when the related repairs or overhaul are complete and the unit is shipped to the customer. Revenue related to contracts in which the Company is reimbursed for costs incurred plus an agreed upon profit are recorded as costs are invoiced.
Cash - Cash includes all cash balances and highly liquid short-term investments which mature within three months of purchase. The Company maintains its cash in bank deposit accounts which, at times, may exceed federally insured limits. The Company has not experienced any losses in such accounts, and believes it is not exposed to any significant credit risk with cash.
Allowance for doubtful accounts – The allowance for doubtful accounts is based on our assessment of the collectability of customer accounts. The allowance is determined by considering factors such as historical experience, credit quality, age of the accounts receivable balances and current economic conditions that may affect a customer’s ability to pay.
Inventories – Inventories are stated at the lower of cost or market. Cost is determined using the first-in, first-out method. Cost includes material, labor, and manufacturing overhead costs.
Inventory obsolescence is determined by identifying specific items based on the age of inventory and by establishing a general reserve based on annual purchases. Analyzing inventory by age showed little movement once items have aged five years, and historical trends showed that 1.1% of purchases would have the potential to eventually be scrapped. Accordingly, the Company uses these two factors in determining the amount of the reserve.
Property and Related Depreciation – Property is recorded at cost. Provisions for depreciation are made on a straight-line basis over the estimated useful lives of depreciable assets. Depreciation expense for the years ended March 31, 2015, 2014, and 2013 was $1,369, $1,351, and $1,392, respectively.
36
Notes to Consolidated Financial Statements
($ in Thousands Except Share Amounts)
Average useful lives for property are as follows:
|
Machinery and equipment |
|
|
3 to 10 years |
|
|
Furniture and fixtures |
|
|
3 to 10 years |
|
|
Computer hardware and software |
|
|
3 to 5 years |
|
|
Leasehold improvements |
|
|
10 years |
|
The Company classified as real estate held for sale, on the consolidated balance sheets, a property currently under sales contract located in Glen Head, New York. The parties are obligated to close under the sales contract upon receipt of the final governmental approvals, and the Company must provide the buyer with a funded remediation plan and environmental insurance at closing. The net sale proceeds are expected to be $3,800. See Note 13 for a discussion of environmental matters related to this site.
Impairment of Goodwill and Other Long-Lived Assets – Long-lived assets and certain identifiable intangibles to be held and used are reviewed by the Company for impairment annually or whenever events or changes in circumstances indicate that the carrying amount of an asset may not be recoverable. Impairment reviews for goodwill are performed by comparing the fair value to the reported carrying amount. If the carrying amount exceeds fair value, an impairment loss is recognized. Fair value is determined using quoted market prices when available or present value techniques. At March 31, 2015, the Company tested its goodwill for impairment and determined that it did not have an impairment.
Qualification Units and Analysis of Contract Profitability –The Company capitalizes as intangible assets engineering qualification units, which are pre-production product units that are tested as part of qualifying production units for use on an aircraft. Prior to qualification testing, the pre-qualification assets (materials and external testing costs) are also classified with qualification units. Engineering qualification units are ultimately expensed, as the Company amortizes qualification unit costs to expense over future equipment unit shipments. Qualification unit amortization for the years ended March 31, 2015, 2014, and 2013 was $671, $339, and $73, respectively.
The Company reviews qualification units and pre-qualification assets for impairment annually or whenever events or changes in circumstances indicate that the carrying amount may not be recoverable. The Company tests qualification units and pre-qualification assets for impairment two ways. The first test is for technical obsolescence. If product development or product testing results in a design or technical change, qualification units and pre-qualification assets that become obsolete are expensed in the current period.
During fiscal 2015, the Company had no impairment of qualification units that became technically obsolete. During fiscal 2014 and fiscal 2013, the Company expensed $399 and $106 respectively, of costs for impairment of qualification units that became technically obsolete. These amounts are included in operating expenses on the consolidated statements of operations.
Secondly, the Company analyzes contracts to assess their profitability, comparing undiscounted future cash flows of existing and anticipated production contracts to the ultimate cost of production and development, including qualification units and pre-qualification assets. If the test indicates a contract was not going to produce sufficient profits to cover the cost of qualification units and pre-qualification assets, these assets would become impaired (Level 3 valuation see Note 7). This impairment loss would reduce the carrying amount of the related assets and the Company would accrue any additional losses on the contract.
In assessing anticipated production contracts, the Company evaluates undiscounted future cash flows that may include revenue from anticipated price increases of un-priced change orders. These revenues are included when price recovery is probable, which is generally based on the likelihood that the customer will qualify the unit for production, and the related production costs are identifiable and reasonable. The Company may also estimate the number of production units and estimated costs to complete in continuing long-term production for delivery under existing or anticipated contracts.
As indicated above, the process of analyzing contracts may involve an assessment of the likelihood of the Company negotiating either future production contracts or future sales price increases. If the Company determines that it is probable such events will occur, the related production volume or increased pricing is included in the contract analysis. If the probable event were ultimately not to occur, a loss would be required to be recognized at the time such determination is made which could significantly affect the results from operations.
Accounting for Contingencies – We accrue for contingencies in accordance with Financial Accounting Standards Board (“FASB”) Accounting Standards Codification (“ASC”) Topic 450-20, “Loss Contingencies”, when it is probable that a liability or loss has been incurred and the amount can be reasonably estimated. Contingencies by their nature relate to uncertainties that require judgment both in assessing whether or not a liability or loss has been incurred and in estimating the amount of the probable loss.
37
Notes to Consolidated Financial Statements
($ in Thousands Except Share Amounts)
Environmental Reserve – The Company provides for a best estimate of environmental liability reserves upon a determination that a liability is both probable and estimable. In many cases, the Company does not fix or cap the liability for a particular site when first recorded. Factors that affect the recorded amount of the liability in future years include our participation percentage due to a settlement by, or bankruptcy of, other potentially responsible parties, a change in the environmental laws, a change in the estimate of future costs that will be incurred to remediate the site, and changes in technology related to environmental remediation.
Earnings Per Share (“EPS”) – The computation of basic EPS is based on the weighted-average number of common shares outstanding during the period. The computation of diluted earnings per share assumes the foregoing and, in addition, the exercise of all dilutive stock options using the treasury stock method.
The components of the denominator for basic earnings per common share and diluted earnings per common share are reconciled as follows:
|
|
|
2015 |
|
|
2014 |
|
|
2013 |
|
|||
|
Basic earnings per common share: |
|
|
|
|
|
|
|
|
|
|
|
|
|
Weighted-average common shares outstanding |
|
|
9,778,000 |
|
|
|
9,643,000 |
|
|
|
9,511,000 |
|
|
Diluted earnings per common share: |
|
|
|
|
|
|
|
|
|
|
|
|
|
Weighted-average common shares outstanding |
|
|
9,778,000 |
|
|
|
9,643,000 |
|
|
|
9,511,000 |
|
|
Stock options |
|
|
168,000 |
|
|
|
114,000 |
|
|
|
62,000 |
|
|
Denominator for diluted earnings per common share |
|
|
9,946,000 |
|
|
|
9,757,000 |
|
|
|
9,573,000 |
|
During the years ended March 31, 2015, 2014 and 2013, options to purchase 313,500 shares, 169,000 shares and 733,000 shares of common stock, respectively, were not included in the computation of diluted EPS because the options’ exercise prices were greater than the average market price of the common shares.
Product Warranty Costs – Equipment has a one to three year warranty for which a reserve is established using historical averages and specific program contingencies when considered necessary. Changes in the carrying amount of accrued product warranty costs included in the accompanying Consolidated Balance Sheets as of March 31, 2015 and 2014 are summarized as follows:
|
Balance at March 31, 2013 |
|
$ |
221 |
|
|
Warranty costs incurred |
|
|
(202 |
) |
|
Change in estimate to pre-existing warranties |
|
|
— |
|
|
Product warranty accrual |
|
|
265 |
|
|
Balance at March 31, 2014 |
|
|
284 |
|
|
Warranty costs incurred |
|
|
(132 |
) |
|
Change in estimate to pre-existing warranties |
|
|
— |
|
|
Product warranty accrual |
|
|
185 |
|
|
Balance at March 31, 2015 |
|
$ |
337 |
|
Research, Development, and Engineering Costs – Research and development costs, which are charged to engineering expense when incurred, amounted to $5,344, $6,916, and $7,664 for the years ended March 31, 2015, 2014, and 2013, respectively.
Shipping and Handling Costs – Costs for shipping and handling incurred by the Company for third party shippers are included in selling, general and administrative expense. These expenses for the years ended March 31, 2015, 2014 and 2013 were $267, $266, and $202, respectively.
Income Taxes – The Company applies guidance issued by the FASB under ASC 740, “Income Taxes”. Under the asset and liability method of ASC 740, deferred tax assets and liabilities are recognized for the future tax consequences attributable to differences between the consolidated financial statement carrying amounts of assets and liabilities and their respective tax bases. The Company periodically assesses recoverability of deferred tax assets and provisions for valuation allowances are made as required.
ASC 740 requires recognizing the financial statement benefit of a tax position only after determining that the relevant tax authority more-likely-than-not would sustain the position following an audit. For tax positions meeting the more-likely-than-not threshold, the amount recognized in the financial statements is the largest benefit that has a greater than 50 percent likelihood of being realized upon ultimate settlement with the relevant tax authority.
38
Notes to Consolidated Financial Statements
($ in Thousands Except Share Amounts)
Stock-Based Compensation – See Note 9.
New Accounting Standards – In April, 2015, the FASB issued Accounting Standards Update (“ASU”) No. 2015-03, Interest - Imputation of Interest (Subtopic 835-30): Simplifying the Presentation of Debt Issuance Costs. The amendments in this ASU require that debt issuance costs related to a recognized debt liability be presented in the balance sheet as a direct deduction from the carrying amount of that debt liability, consistent with debt discounts. The recognition and measurement guidance for debt issuance costs are not affected by the amendments in this ASU.
For public business entities, the amendments are effective for financial statements issued for fiscal years beginning after December 15, 2015, and interim periods within those fiscal years. For all other entities, the amendments are effective for financial statements issued for fiscal years beginning after December 15, 2015, and interim periods within fiscal years beginning after December 15, 2016.Early adoption of the amendments is permitted for financial statements that have not been previously issued.
The amendments should be applied on a retrospective basis, wherein the balance sheet of each individual period presented should be adjusted to reflect the period-specific effects of applying the new guidance. Upon transition, an entity is required to comply with the applicable disclosures for a change in an accounting principle. These disclosures include the nature of and reason for the change in accounting principle, the transition method, a description of the prior-period information that has been retrospectively adjusted, and the effect of the change on the financial statement line items (i.e., debt issuance cost asset and the debt liability). The adoption of this guidance is not expected to have a material impact on the Company’s consolidated financial position, results of operations, or cash flows.
In June 2014, the FASB issued ASU No. 2014-09, Revenue from Contracts with Customers: Topic 606. ASU 2014-09 affects any entity using U.S. GAAP that either enters into contracts with customers to transfer goods or services or enters into contracts for the transfer of nonfinancial assets unless those contracts are within the scope of other standards (e.g., insurance contracts or lease contracts). This ASU will supersede the revenue recognition requirements in Topic 605, Revenue Recognition, and most industry-specific guidance. This ASU also supersedes some cost guidance included in Subtopic 605-35, Revenue Recognition—Construction-Type and Production-Type Contracts. In addition, the existing requirements for the recognition of a gain or loss on the transfer of nonfinancial assets that are not in a contract with a customer (e.g., assets within the scope of Topic 360, Property, Plant, and Equipment, and intangible assets within the scope of Topic 350, Intangibles—Goodwill and Other) are amended to be consistent with the guidance on recognition and measurement (including the constraint on revenue) in this ASU.
The core principle of the guidance is that an entity should recognize revenue to depict the transfer of promised goods or services to customers in an amount that reflects the consideration to which the entity expects to be entitled in exchange for those goods or services. To achieve that core principle, an entity should apply the following steps: Step 1: Identify the contract(s) with a customer. Step 2: Identify the performance obligations in the contract. Step 3: Determine the transaction price. Step 4: Allocate the transaction price to the performance obligations in the contract. Step 5: Recognize revenue when (or as) the entity satisfies a performance obligation.
For a public entity, the amendments in this ASU are effective for annual reporting periods beginning after December 15, 2016 (FASB is currently considering delaying the effective date), including interim periods within that reporting period. Early application is not permitted. An entity should apply the amendments in this ASU using one of the following two methods: 1. Retrospectively to each prior reporting period 2. Retrospectively with the cumulative effect of initially applying this ASU recognized at the date of initial application. The Company is currently considering the impact that the adoption of this guidance will have on the Company’s financial position, results of operations, or cash flows.
2. INVENTORIES
Inventories at March 31 consisted of the following:
|
|
|
2015 |
|
|
2014 |
|
||
|
Finished goods |
|
$ |
1,040 |
|
|
$ |
2,751 |
|
|
Work in process |
|
|
7,515 |
|
|
|
5,932 |
|
|
Purchased and manufactured parts |
|
|
13,418 |
|
|
|
13,155 |
|
|
|
|
|
21,973 |
|
|
|
21,838 |
|
|
Reserve for slow moving and obsolescence |
|
|
(2,546 |
) |
|
|
(2,929 |
) |
|
Total |
|
$ |
19,427 |
|
|
$ |
18,909 |
|
39
Notes to Consolidated Financial Statements
($ in Thousands Except Share Amounts)
Inventory obsolescence is determined by identifying specific items based on the age of inventory and by establishing a general reserve based on annual purchases. Analyzing inventory by age showed little movement once items have aged five years, and historical trends showed that 1.1% of purchases would eventually be scrapped. Accordingly, the Company uses these two factors in determining the amount of the reserve.
3. OTHER ASSETS
Other assets at March 31 consisted of the following:
|
|
|
2015 |
|
|
2014 |
|
||
|
Obligation due from divestiture (a) |
|
$ |
3,032 |
|
|
$ |
3,479 |
|
|
Environmental receivable-net |
|
|
1,144 |
|
|
|
1,033 |
|
|
Other |
|
|
807 |
|
|
|
568 |
|
|
Total |
|
$ |
4,983 |
|
|
$ |
5,080 |
|
|
(a) |
Obligation due from divestiture represents the indemnification in favor of the Company relative to a pension plan for a discontinued operation in Germany. (See Note 10). |
4. OTHER CURRENT LIABILITIES
Other current liabilities at March 31 consisted of the following:
|
|
|
2015 |
|
|
2014 |
|
||
|
Engineering project reserves |
|
$ |
1,688 |
|
|
$ |
1,530 |
|
|
Environmental reserves-Note 13 |
|
|
2,387 |
|
|
|
1,673 |
|
|
Accrued medical benefits cost |
|
|
389 |
|
|
|
621 |
|
|
Accrued commissions |
|
|
560 |
|
|
|
618 |
|
|
Other |
|
|
914 |
|
|
|
772 |
|
|
Total |
|
$ |
5,938 |
|
|
$ |
5,214 |
|
5. INCOME TAXES
The provision for income taxes is summarized below:
|
|
|
2015 |
|
|
2014 |
|
|
2013 |
|
|||
|
Current expense: |
|
|
|
|
|
|
|
|
|
|
|
|
|
Federal |
|
$ |
2,692 |
|
|
$ |
893 |
|
|
$ |
1,080 |
|
|
State |
|
|
39 |
|
|
|
175 |
|
|
|
333 |
|
|
Total current income tax expense |
|
|
2,731 |
|
|
|
1,068 |
|
|
|
1,413 |
|
|
Deferred |
|
|
(4,432 |
) |
|
|
2,560 |
|
|
|
2,063 |
|
|
Change in valuation allowance |
|
|
1,278 |
|
|
|
(318 |
) |
|
|
318 |
|
|
Total deferred income tax expense |
|
|
(3,154 |
) |
|
|
2,242 |
|
|
|
2,381 |
|
|
Total income tax expense |
|
$ |
(423 |
) |
|
$ |
3,310 |
|
|
$ |
3,794 |
|
The consolidated effective tax rates differ from the federal statutory rates as follows:
|
|
|
2015 |
|
|
2014 |
|
|
2013 |
|
|||
|
Statutory federal rate |
|
|
35.0 |
% |
|
|
35.0 |
% |
|
|
35.0 |
% |
|
State income taxes after federal income tax |
|
|
0.4 |
|
|
|
5.0 |
|
|
|
9.3 |
|
|
Valuation allowance |
|
|
5.7 |
|
|
|
(2.3 |
) |
|
|
2.6 |
|
|
Accounting for Stock Options |
|
|
2.1 |
|
|
|
1.9 |
|
|
|
2.7 |
|
|
Research & Development credit |
|
|
(43.5 |
) |
|
|
— |
|
|
|
— |
|
|
Uncertain tax position expense |
|
|
1.9 |
|
|
|
— |
|
|
|
— |
|
|
Other |
|
|
(4.6 |
) |
|
|
(2.6 |
) |
|
|
(1.4 |
) |
|
Consolidated effective tax rate |
|
|
(3.0 |
)% |
|
|
37.0 |
% |
|
|
48.2 |
% |
40
Notes to Consolidated Financial Statements
($ in Thousands Except Share Amounts)
The following is an analysis of accumulated deferred income taxes:
|
|
|
2015 |
|
|
2014 |
|
||
|
Assets: |
|
|
|
|
|
|
|
|
|
Current: |
|
|
|
|
|
|
|
|
|
Bad debts |
|
$ |
178 |
|
|
$ |
127 |
|
|
Employee benefit accruals |
|
|
102 |
|
|
|
251 |
|
|
Environmental reserves |
|
|
864 |
|
|
|
(125 |
) |
|
Inventory |
|
|
1,353 |
|
|
|
1,158 |
|
|
State taxes |
|
|
1,699 |
|
|
|
1,812 |
|
|
Alternative minimum tax credit carryforward |
|
|
518 |
|
|
|
130 |
|
|
Research & Development credit |
|
|
2,717 |
|
|
|
— |
|
|
Warranty |
|
|
122 |
|
|
|
— |
|
|
Valuation allowance |
|
|
(453 |
) |
|
|
— |
|
|
Other |
|
|
1,039 |
|
|
|
1,255 |
|
|
Total current |
|
|
8,139 |
|
|
|
4,608 |
|
|
Noncurrent: |
|
|
|
|
|
|
|
|
|
Bad debts |
|
|
1,062 |
|
|
|
1,062 |
|
|
Employee benefit accruals |
|
|
228 |
|
|
|
396 |
|
|
Environmental reserves |
|
|
2,648 |
|
|
|
3,352 |
|
|
Inventory |
|
|
(356 |
) |
|
|
— |
|
|
Research & Development credit |
|
|
1,669 |
|
|
|
— |
|
|
Property |
|
|
(340 |
) |
|
|
(348 |
) |
|
Valuation allowance |
|
|
(1,090 |
) |
|
|
(265 |
) |
|
Total noncurrent |
|
|
3,821 |
|
|
|
4,197 |
|
|
Total net assets |
|
$ |
11,960 |
|
|
$ |
8,805 |
|
The Company has an Alternative Minimum Tax Credit of approximately $518 and is available to reduce future federal taxes. In addition, the Company has Research & Development tax credit carryforward at the federal and state level of $2,620 and $1,767 respectively that is available to reduce federal and state taxes. A valuation allowance of $1,543 exists relating to the state tax credits and other items, as it is management’s belief that it is more likely than not that a portion of these deferred assets are not realizable.
In fiscal 2014 the Company’s effective tax rate decreased primarily due to a reduction of state deferred taxes and the impact from various state tax rate adjustments. In fiscal 2015, the Company’s effective tax rate was reduced primarily as a result of the research & development tax credit. A valuation allowance was also recorded in fiscal 2015 of $1,278 relating to state tax carryforwards that have been determined to be not more likely than not realizable.
The Company performed a qualitative and quantitative analysis of the available federal and state research and development tax credit in order to determine the amount of previously unclaimed credits. The Company recorded a net benefit associated with recognition of the federal and state research and experimental tax credit of $6,293, as reflected in the current fiscal year income tax benefit. With the recognition of the benefit, the Company also recorded a liability relating to uncertain tax positions of $255.
Unrecognized Tax Benefits
A reconciliation of the beginning and ending balance of unrecognized tax benefits is as follows:
|
|
|
2015 |
|
|
2014 |
|
|
2013 |
|
|||
|
Balance April 1 |
|
|
— |
|
|
|
— |
|
|
|
— |
|
|
Increase based on tax positions taken during a prior tax period |
|
|
(249 |
) |
|
|
— |
|
|
|
— |
|
|
Increase based on tax positions taken during the current tax period |
|
|
(43 |
) |
|
|
— |
|
|
|
— |
|
|
Balance March 31 |
|
|
(292 |
) |
|
|
— |
|
|
|
— |
|
At March 31, 2015, the Company does not expect the liability for uncertain tax positions to change in the next twelve months. The entire amount would be a benefit to the tax expense in the period in which the liability is reduced.
41
Notes to Consolidated Financial Statements
($ in Thousands Except Share Amounts)
The Company is subject to taxation in the United States and various states and foreign jurisdictions. The Company’s tax years for fiscal 2012 through the present are subject to examination by the tax authorities. With few exceptions, the Company is no longer subject to United States federal, state, local or foreign examinations by tax authorities for years before fiscal 2012.
The Company policy is to recognize interest and penalties, related to unrecognized tax benefits within the income tax expense line in the accompanying consolidated statements of operations. Accrued interest and penalties, if incurred, are included within the related tax liability line in the consolidated balance sheets. During 2015, we recognized a net after tax expense in the income statement related to interest of approximately $14. We had approximately $14 (after-tax) for the payment of interest accrued in the consolidated balance sheets as of March 31, 2015.
6. LONG-TERM DEBT PAYABLE TO BANKS
Revolving Credit Facility- On August 26, 2013 the Company refinanced the Former Senior Credit Facility (as defined below) with a new five-year Revolving Credit Facility (the “Revolving Credit Facility” or “Facility”), which provides the Company with a $20,000 unsecured revolving line of credit with an accordion feature that may increase the amount to 2.5 times EBITDA (as defined in the Facility) to a maximum of $35,000. The term of the Facility is through August 26, 2018.
The Company has the option, subject to bank approval, during the five-year term of the Revolving Credit Facility, to convert the Facility to a secured credit facility which increases the borrowing limit to 3.5 times EBITDA (as defined in the Facility) up to a maximum of $35,000. As of March 31, 2015, the Company has not exercised this option.
Amounts outstanding under the Revolving Credit Facility generally accrue interest at a floating rate, adjusted monthly. The floating rate is the then-current London Interbank Offered Rate (“LIBOR”) monthly floating rate plus an applicable margin based on the Company’s ratio of funded debt to EBITDA. The Company also must pay a quarterly unused commitment fee of 0.125%. Amounts outstanding under the Revolving Credit Facility are generally due and payable on the expiration date of the Facility (August 26, 2018), and the Company can elect to prepay some or all of the outstanding balance from time to time without penalty. Up to $8,000 of the available funds can be used to support the issuance of letters of credit. During fiscal 2015, the Revolving Credit Facility had a blended interest rate of approximately 0.125%, which represents a commitment fee on the average daily unused portion of the Facility.
The Revolving Credit Facility includes customary representations and warranties and requires the Company to comply with customary covenants, including, among other things, the following financial covenants: maintain at least a specified minimum level of tangible net worth; maintain a ratio of funded debt to EBITDA not exceeding a specified amount; and maintain a ratio of EBIT (as defined in the Facility) to cash interest expense not below a specified amount.
The Revolving Credit Facility does not restrict the Company’s ability to pay cash dividends on shares of its common stock, subject to maintaining $5,000 available under the Facility after the dividend payment and complying with the financial covenants included in the Facility. In addition, the Revolving Credit Facility does not restrict the Company’s ability to acquire or purchase other businesses or their assets provided that the businesses or assets are in a line of business which is substantially similar to the Company’s current business.
As of March 31, 2015, there were no outstanding borrowings under the Facility, $702 in outstanding (standby) letters of credit, and $19,298 in unsecured revolving line of credit availability. At March 31, 2015, the Company was in compliance with the covenant provisions of the Facility.
Amortization of loan origination fees on the Revolving Credit Facility and the Former Senior Credit Facility (see below) amounted to $11, $19, and $150 for the fiscal years ended March 31, 2015, 2014 and 2013, respectively, and is included in interest expense.
Former Senior Credit Facility – Prior to August 26, 2013, the Company had a five-year, $33,000 senior credit facility consisting of a $10,000 revolving line of credit and, at the inception of the credit agreement in August 2008, a term loan totaling $23,000 (the “Former Senior Credit Facility”). In June 2012, the Company paid in full the term loan.
The Former Senior Credit Facility contained certain financial covenants which required a minimum fixed charge coverage and leverage ratios. The Former Senior Credit Facility bore interest at the “Base Rate” or LIBOR plus applicable margins based on the Company’s leverage ratio. During fiscal 2014, the Former Senior Credit Facility had a blended interest rate of approximately 0.375%, which represents a commitment fee on the average daily unused portion of the revolving line of credit. The Former Senior Credit Facility was secured by all of the Company’s assets and allowed the Company to issue letters of credit against the total borrowing capacity of the Former Senior Credit Facility.
42
Notes to Consolidated Financial Statements
($ in Thousands Except Share Amounts)
7. FAIR VALUE MEASUREMENTS
Fair value is defined as the price that would be received to sell an asset or paid to transfer a liability in an orderly transaction between market participants at the measurement date (i.e. an exit price). The accounting guidance includes a fair value hierarchy that prioritizes the inputs to valuation techniques used to measure fair value. The three levels of the fair value hierarchy are as follows:
|
· |
Level 1- Unadjusted quoted prices for identical assets or liabilities in active markets; |
|
· |
Level 2- Inputs other than quoted prices in active markets for identical assets or liabilities that are observable whether directly or indirectly for substantially the full term of the asset or liability; and |
|
· |
Level 3- Unobservable inputs for the asset or liability, which include management’s own assumptions about what the assumptions market participants would use in pricing the asset or liability, including assumptions about risk. See Note 1 under Qualification Units and Analysis of Contract Profitability for further discussion. |
For fair value measurements categorized within Level 3 of the fair value hierarchy, the Company develops unobservable inputs based on the best information and analysis available. The source of this information may include internal Company functional experts and external sources. The analysis includes internal valuation input and judgments and the significance of any unobservable inputs and data.
The carrying amount reported in the consolidated balance sheets for cash, accounts receivable, accounts payable and accrued expenses approximates fair value because of the short-term maturity of those instruments. The carrying amount for borrowings under the Revolving Credit Facility, if applicable, would approximate fair value because of the variable market interest rate charged to the Company for these borrowings.
8. OTHER LONG-TERM LIABILITIES
Other liabilities at March 31 consisted of the following:
|
|
|
2015 |
|
|
2014 |
|
||
|
Environmental reserves-Note 13 |
|
$ |
6,868 |
|
|
$ |
8,650 |
|
|
Obligation from divestiture (a) |
|
|
3,032 |
|
|
|
3,479 |
|
|
Other |
|
|
1,696 |
|
|
|
1,291 |
|
|
Total |
|
$ |
11,596 |
|
|
$ |
13,420 |
|
|
(a) |
Obligation from divestiture represents the legal liability of the Company relative to a pension plan for a discontinued operation. (See Note 10). |
9. STOCK-BASED COMPENSATION
The Company follows guidance issued by ASC 718, “Accounting for Stock-Based Compensation”. Compensation cost is recognized for all awards granted and modified based on the grant date fair value of the awards. Net income for each of the periods ended March 31, 2015, 2014, and 2013, includes $699, $424, and $446, respectively, net of tax (using the effective tax rate excluding the impact of the research & development tax credit), of stock-based compensation expense. Stock-based compensation expense is recorded in selling, general and administrative expense. Additional compensation cost will be recognized as new options are awarded. The Company has not made any material modifications to its stock-based compensation plans.
The Company maintains the 1999 Long-Term Incentive Plan (the “1999 Plan”), the 2004 Long-Term Incentive Plan (the “2004 Plan”), the 2006 Long-Term Incentive Plan (the “2006 Plan”), and the 2012 Incentive Compensation Plan (the “2012 Plan” and together with the 1999 Plan, the 2004 Plan and the 2006 Plan collectively, the “Plans”).
Under the terms of the 2012 Plan, 750,000 shares of the Company’s common stock may be granted as stock options or awarded as restricted stock to officers, non-employee directors, certain employees, and other key individuals of the Company through October 2022. Under the terms of the 2006 Plan, 500,000 shares of the Company’s common stock may be granted as stock options or awarded as restricted stock to officers, non-employee directors, and certain employees of the Company through July 2016. Under the terms of the 2004 Plan, 200,000 shares of the Company’s common stock may be granted as stock options or awarded as restricted stock to officers, non-employee directors, and certain employees of the Company through September 2014. The 1999 Plan expired in July 2009, and no further grants or awards may be made under this plan. Under the 1999 Plan, unexercised options granted in fiscal year 2006 remain outstanding.
43
Notes to Consolidated Financial Statements
($ in Thousands Except Share Amounts)
Under each of the Plans, option exercise prices equal the fair market value of the common shares at their respective grant dates. Options granted to officers and employees expire no later than 10 years after the date of the grant. In most circumstances prior to fiscal year 2014, options granted to directors, officers, and employees generally vest ratably over three years beginning one year after the date of the grant. In certain circumstances, including a change of control of the Company (as defined in the various Plans), option vesting may be accelerated.
Pursuant to the terms of an employment agreement, effective May 22, 2012, between the Company and Brad Pedersen, President and Chief Executive Officer of the Company, the Company granted to Mr. Pedersen an option to purchase 400,000 shares, which option has an exercise price of $8.10.
Pursuant to the terms of an employment agreement, effective June 16, 2014, between the Company and Serge Dupuis, Chief Financial Officer and Treasurer of the Company, the Company granted to Mr. Dupuis an option to purchase 200,000 shares, which option has a weighted average grant date fair value equal to $12.78. This option was reported in the Company’s Current Report on Form 8-K filed on June 17, 2014.
As noted above, in connection with the hiring of Serge Dupuis as the Company’s Chief Financial Officer and Treasurer, the terms of the Company’s employment offer to Mr. Dupuis included a commitment to award him an option to purchase 200,000 shares of common stock of the Company (the “Dupuis Option”). At the time of the issuance of the award, the Company and Mr. Dupuis entered into an option grant agreement indicating that the option would be subject to, and the option shares would be allocated from, the Company’s 2012 Incentive Compensation Plan (the “2012 Plan”). On July 3, 2014, the Company determined that the allocation of that number of option shares from the 2012 Plan would be in excess of the 2012 Plan’s per person, per year share limit, and, therefore, 50,000 of the option shares would need to be allocated from the Company’s 2006 Incentive Compensation Plan or the Company would need to modify the grant to be an “inducement grant” in order for the Company to fulfill its obligations to Mr. Dupuis. As a result, on July 7, 2014 the Company and Mr. Dupuis agreed to modify the terms of his award such that the number of shares allocated from the 2012 Plan in respect of the Dupuis Option is 150,000 and the remaining 50,000 shares would be allocated from and subject to the Company’s 2006 Incentive Compensation Plan.
On August 18, 2014, in connection with the hiring of Bradley Repp, Vice President of Product Development, the Company granted to Mr. Repp an option to purchase 200,000 shares of our common stock, which option has a weighted average grant date fair value equal to $10.40. This award to Mr. Repp was made outside of the Company’s stockholder approved equity incentive plans and was approved by the Incentive and Compensation Committee of the Company’s Board of Directors, as an inducement material to Mr. Repp entering into employment with the Company pursuant to Section 711(a) of the NYSE MKT Company Guide. This option was reported in the Company’s Current Report on Form 8-K filed on August 18, 2014.
The Black-Scholes option-pricing model uses dividend yield, volatility, risk-free rate, expected term, and forfeiture assumptions to value stock options and was used to value 55,000 of the total 440,000 options granted in fiscal 2015, 19,000 of the total 158,000 options granted in fiscal 2014, and 77,000 of the total 551,000 options granted in fiscal 2013. The Black-Scholes weighted-average value at each grant date per option granted in fiscal 2015 was $4.61, $3.85, and $3.72, and in fiscal 2014 was $3.03 and $3.01. In fiscal 2013, the Black-Scholes weighted average values per option granted were $3.05, $3.02, $3.02 and $2.82. Expected volatilities are based on historical volatility of the Company’s common stock and other factors, and the risk-free rate for periods within the option’s contractual life is based on the U.S. Treasury yield curve at the time of the grant. The Company uses historical data to estimate the expected option term and assumed no forfeitures because of the limited number of employees at the executive and senior management levels who receive stock options, past employment history, and current stock price projections.
The Company used the following assumptions to estimate the fair value of option grants under the Black-Scholes method:
|
|
|
Dividend |
|
|
Volatility |
|
|
Risk-free |
|
|
Expected |
|
|
Forfeiture |
|
|||||
|
2015 $4.61 value per option |
|
|
0.0 |
% |
|
|
30.0 |
% |
|
|
2.1 |
% |
|
|
7.0 |
|
|
|
0.0 |
% |
|
2015 $3.85 value per option |
|
|
0.0 |
% |
|
|
30.9 |
% |
|
|
2.2 |
% |
|
|
7.0 |
|
|
|
0.0 |
% |
|
2015 $3.72 value per option |
|
|
0.0 |
% |
|
|
30.9 |
% |
|
|
2.2 |
% |
|
|
7.0 |
|
|
|
0.0 |
% |
|
2014 $3.03 value per option |
|
|
0.0 |
% |
|
|
31.2 |
% |
|
|
1.3 |
% |
|
|
7.0 |
|
|
|
0.0 |
% |
|
2014 $3.01 value per option |
|
|
0.0 |
% |
|
|
31.2 |
% |
|
|
1.3 |
% |
|
|
7.0 |
|
|
|
0.0 |
% |
|
2013 $3.05 value per option |
|
|
0.0 |
% |
|
|
34.0 |
% |
|
|
1.2 |
% |
|
|
7.0 |
|
|
|
0.0 |
% |
|
2013 $3.02 value per option |
|
|
0.0 |
% |
|
|
35.5 |
% |
|
|
1.2 |
% |
|
|
7.0 |
|
|
|
0.0 |
% |
|
2013 $3.02 value per option |
|
|
0.0 |
% |
|
|
34.9 |
% |
|
|
1.1 |
% |
|
|
7.0 |
|
|
|
0.0 |
% |
44
Notes to Consolidated Financial Statements
($ in Thousands Except Share Amounts)
|
|
|
Dividend |
|
|
Volatility |
|
|
Risk-free |
|
|
Expected |
|
|
Forfeiture |
|
|||||
|
2013 $2.82 value per option |
|
|
0.0 |
% |
|
|
30.9 |
% |
|
|
1.3 |
% |
|
|
7.0 |
|
|
|
0.0 |
% |
The remaining 385,000 options granted in fiscal 2015 had a weighted-average value per option of $3.05, $2.49, and $2.49. The remaining 139,000 options granted in fiscal 2014 had a weighted-average value per option of $1.90 and $1.71. The remaining 474,000 options granted in fiscal 2013 had a weighted-average value per option of $1.86, $1.75, and $1.75 at the grant date. These valuations used a Monte Carlo simulation because the option vesting was based on service and market conditions. Expected volatilities are based on the historical volatility of the Company’s common stock and other factors, and the risk-free rate for periods within the contractual life of the option is based on the U.S. Treasury yield curve in effect at the time of the grant. The Company uses the option contractual life for the expected option term and assumes a forfeiture rate using historical data for Company officers who receive stock options.
The Company used the following assumptions to estimate the fair value of option grants under the Monte Carlo simulation:
|
|
|
2015 $3.05 value per |
|
|
2015 $2.49 value per |
|
|
2015 $2.49 value per |
|
|
2014 |
|
|
2014 |
|
|
2013 |
|
|
2013 |
|
|
2013 |
|
|||||
|
Dividend yield |
|
0.0 |
% |
|
0.0 |
% |
|
0.0 |
% |
|
|
0.0 |
% |
|
|
0.0 |
% |
|
|
0.0 |
% |
|
|
0.0 |
% |
|
|
0.0 |
% |
|
Volatility |
|
32.3 |
% |
|
33.7 |
% |
|
33.7 |
% |
|
|
34.9 |
% |
|
|
34.9 |
% |
|
|
34.0 |
% |
|
|
34.9 |
% |
|
|
30.1 |
% |
|
Risk-free interest rate |
|
2.6 |
% |
|
2.5 |
% |
|
2.5 |
% |
|
|
1.9 |
% |
|
|
1.9 |
% |
|
|
1.8 |
% |
|
|
1.1 |
% |
|
|
1.3 |
% |
|
Expected term of options (in years) |
|
10.0 |
|
|
10.0 |
|
|
10.0 |
|
|
|
10.0 |
|
|
|
10.0 |
|
|
|
10.0 |
|
|
|
10.0 |
|
|
|
10.0 |
|
|
Forfeiture adjustment |
|
1.4 |
% |
|
1.2 |
% |
|
1.2 |
% |
|
|
1.1 |
% |
|
|
1.8 |
% |
|
|
0.2 |
% |
|
|
0.2 |
% |
|
|
0.2 |
% |
|
Suboptimal behavior factor |
|
1.6 |
|
|
1.6 |
|
|
1.6 |
|
|
|
1.7 |
|
|
|
1.7 |
|
|
|
1.9 |
|
|
|
1.9 |
|
|
|
1.9 |
|
The following table summarizes stock option activity under all plans:
|
|
|
Number |
|
|
Aggregate |
|
|
Approximate |
|
|
Weighted- |
|
||||
|
Outstanding at March 31, 2012 |
|
|
759,577 |
|
|
$ |
800 |
|
|
|
7 |
|
|
$ |
8.17 |
|
|
Granted |
|
|
551,000 |
|
|
|
— |
|
|
|
10 |
|
|
$ |
8.07 |
|
|
Exercised |
|
|
(46,411 |
) |
|
$ |
35 |
|
|
|
— |
|
|
$ |
6.07 |
|
|
Canceled or expired |
|
|
(32,668 |
) |
|
|
— |
|
|
|
— |
|
|
$ |
8.51 |
|
|
Outstanding at March 31, 2013 |
|
|
1,231,498 |
|
|
$ |
720 |
|
|
|
7 |
|
|
$ |
8.20 |
|
|
Granted |
|
|
158,000 |
|
|
|
— |
|
|
|
10 |
|
|
$ |
8.58 |
|
|
Exercised |
|
|
(130,548 |
) |
|
$ |
253 |
|
|
|
— |
|
|
$ |
6.98 |
|
|
Canceled or expired |
|
|
(407,785 |
) |
|
|
— |
|
|
|
— |
|
|
$ |
8.84 |
|
|
Outstanding at March 31, 2014 |
|
|
851,165 |
|
|
$ |
1,516 |
|
|
|
8 |
|
|
$ |
8.15 |
|
|
Granted |
|
|
440,000 |
|
|
|
— |
|
|
|
10 |
|
|
$ |
11.45 |
|
|
Exercised |
|
|
(88,833 |
) |
|
$ |
339 |
|
|
|
— |
|
|
$ |
7.46 |
|
|
Canceled or expired |
|
|
(46,333 |
) |
|
|
— |
|
|
|
— |
|
|
$ |
8.20 |
|
|
Outstanding at March 31, 2015 |
|
|
1,155,999 |
|
|
$ |
1,480 |
|
|
|
8 |
|
|
$ |
9.26 |
|
|
Options exercisable at March 31, 2015 |
|
|
597,000 |
|
|
$ |
1,143 |
|
|
|
7 |
|
|
$ |
8.60 |
|
|
Unvested options expected to become exercisable after March 31, 2015 |
|
|
558,999 |
|
|
$ |
391 |
|
|
|
9 |
|
|
$ |
10.23 |
|
|
Shares available for future option grants at March 31, 2015 (a) |
|
|
281,376 |
|
|
|
|
|
|
|
|
|
|
|
|
|
|
(a) |
May be decreased by restricted stock grants. |
There were 440,000 and 158,000 options granted during fiscal 2015 and fiscal 2014, respectively. The weighted average grant date fair value of options issued during the year ended March 31, 2015 and 2014 was $11.45 and $8.58, respectively.
Cash received from stock option exercises during the fiscal 2015 and fiscal 2014 were approximately $662 and $912, respectively. The aggregate intrinsic value of options exercised during fiscal 2015 was approximately $339. The intrinsic value of stock options is
45
Notes to Consolidated Financial Statements
($ in Thousands Except Share Amounts)
the amount by which the market price of the stock on the date of exercise exceeded the market price of stock on the date of grant. There was no tax benefit generated to the Company from options granted prior to April 1, 2006 and exercised during fiscal 2015.
During fiscal 2015, 2014, and 2013, compensation expense associated with stock options was $820, $468, and $626, respectively, before taxes of $270, $173 and $283, respectively, and was recorded in selling, general, and administrative expense. As of March 31, 2015, there was approximately $867 of unrecognized compensation cost related to stock options granted but not yet vested that are expected to become exercisable. This cost is expected to be recognized over a weighted-average period of approximately two years.
Except as otherwise authorized by the Board of Directors, it is the general policy of the Company that the stock underlying the option grants consists of authorized and unissued shares available for distribution under the applicable Plans. Under the Plans, the Incentive and Compensation Committee of the Board of Directors (made up of independent directors) may at any time offer to repurchase a stock option that is exercisable and has not expired.
A summary of restricted stock award activity under all plans is as follows:
|
|
|
Number of |
|
|
Weighted – |
|
||
|
Non-vested at March 31, 2012 |
|
|
21,094 |
|
|
$ |
8.54 |
|
|
Granted |
|
|
23,934 |
|
|
$ |
7.52 |
|
|
Vested |
|
|
(20,903 |
) |
|
$ |
8.56 |
|
|
Cancelled |
|
|
— |
|
|
$ |
— |
|
|
Non-vested at March 31, 2013 |
|
|
24,125 |
|
|
$ |
7.51 |
|
|
Granted |
|
|
31,196 |
|
|
$ |
8.91 |
|
|
Vested |
|
|
(24,125 |
) |
|
$ |
7.51 |
|
|
Cancelled |
|
|
(1,389 |
) |
|
$ |
8.35 |
|
|
Non-vested at March 31, 2014 |
|
|
29,807 |
|
|
$ |
8.93 |
|
|
Granted |
|
|
27,930 |
|
|
$ |
10.07 |
|
|
Vested |
|
|
(22,924 |
) |
|
$ |
9.11 |
|
|
Cancelled |
|
|
(4,649 |
) |
|
$ |
9.24 |
|
|
Non-vested at March 31, 2015 |
|
|
30,164 |
|
|
$ |
8.81 |
|
Restricted stock awards are utilized both for director compensation and awards to officers and employees, and are distributed in a single grant of shares which are subject to forfeiture prior to vesting and have voting and dividend rights from the date of issuance. Other than the restricted stock granted in fiscal 2012 and fiscal 2013, outstanding restricted stock awards to officers and employees have forfeiture and transfer restrictions that lapse ratably over three years beginning one year after the date of the award. Restricted stock awards granted to officers and employees in fiscal 2012 contain forfeiture and transfer restrictions that lapse after six months.
Restricted stock awards granted to non-employee directors prior to fiscal 2012 contained forfeiture provisions that lapse after one year and transfer restrictions that lapse six months after the person ceases to be a director. In certain circumstances, including a change of control of the Company as defined in the various Plans, forfeiture lapses on restricted stock may be accelerated.
The fair value of restricted stock awards is based on the market price of the stock at the grant date and compensation cost is amortized to expense on a straight-line basis over the requisite service period as stated above. The Company expects no forfeitures during the vesting period with respect to unvested restricted stock awards granted. During fiscal 2015, 2014, and 2013, compensation expense related to restricted stock awards recorded in selling, general and administrative expenses was $223, $204, and $187, respectively, before taxes of $73, $76, and $84, respectively. As of March 31, 2015, there was approximately $168 of unrecognized compensation cost related to non-vested restricted stock awards. This cost is expected to be recognized over a period of approximately one year.
10. EMPLOYEE BENEFIT PLANS
The Company has a defined contribution plan covering all eligible employees. Contributions are based on certain percentages of an employee’s eligible compensation. Expenses related to this plan were $749, $824, and $741 in 2015, 2014, and 2013, respectively.
46
Notes to Consolidated Financial Statements
($ in Thousands Except Share Amounts)
The Company provides postretirement benefits to certain union employees from a previous plan that existed a number of years ago. The primary cost is for 6 people with medical benefits. The Company funds these benefits on a pay-as-you-go basis. The measurement date is March 31.
In February 2002, the Company’s subsidiary, Seeger-Orbis GmbH & Co. OHG, now known as TransTechnology Germany GmbH (the “Selling Company”) sold its retaining ring business in Germany to Barnes Group Inc. (“Barnes”). German law prohibits the transfer of unfunded Pension obligations which have vested for retired and former employees, so the legal responsibility for the pension plan that related to the business (the “Pension Plan”) remained with the Selling Company. At the time of the sale and subsequent to the sale, that pension liability was recorded based on the projected benefit obligation since future compensation levels will not affect the level of pension benefits. The relevant information for the Pension Plan is shown below under the caption Pension Plan. The measurement date is December 31. Barnes has entered into an agreement with the Company and its subsidiary, the Selling Company, whereby Barnes is obligated to administer and discharge the pension obligation as well as indemnify and hold the Selling Company and the Company harmless from these pension obligations. Accordingly, the Company has recorded an asset equal to the benefit obligation for the Pension Plan of $3,032 and $3,479 as of March 31, 2015 and 2014, respectively. See Notes 3 and 8. This asset is included in other long-term assets and it is restricted in use to satisfy the legal liability associated with the Pension Plan.
The following table sets forth the Pension Plan’s funded status and amounts recognized related to the Pension Plan and the postretirement benefit plan in the consolidated financial statements as of March 31:
|
|
|
Postretirement |
|
|
Pension Plan |
|
||||||||||
|
|
|
2015 |
|
|
2014 |
|
|
2015 |
|
|
2014 |
|
||||
|
Change in benefit obligation |
|
|
|
|
|
|
|
|
|
|
|
|
|
|
|
|
|
Benefit obligation at beginning of year |
|
$ |
674 |
|
|
$ |
948 |
|
|
$ |
3,479 |
|
|
$ |
3,266 |
|
|
Service cost |
|
|
— |
|
|
|
— |
|
|
|
— |
|
|
|
— |
|
|
Interest cost |
|
|
23 |
|
|
|
30 |
|
|
|
108 |
|
|
|
115 |
|
|
Actuarial (gain)/loss |
|
|
(54) |
|
|
|
(271 |
) |
|
|
500 |
|
|
|
153 |
|
|
Foreign currency exchange rate changes |
|
|
— |
|
|
|
— |
|
|
|
(783 |
) |
|
|
236 |
|
|
Benefits paid |
|
|
(25 |
) |
|
|
(33 |
) |
|
|
(272 |
) |
|
|
(291 |
) |
|
Benefit obligation at end of year |
|
|
618 |
|
|
|
674 |
|
|
|
3,032 |
|
|
|
3,479 |
|
|
Change in plan assets |
|
|
|
|
||||||||||||
|
Fair value of plan assets at beginning of year |
|
|
— |
|
|
|
— |
|
|
|
— |
|
|
|
— |
|
|
Employer contributions |
|
|
25 |
|
|
|
33 |
|
|
|
— |
|
|
|
— |
|
|
Benefits paid |
|
|
(25 |
) |
|
|
(33 |
) |
|
|
— |
|
|
|
— |
|
|
Fair value of plan assets at end of year |
|
|
— |
|
|
|
— |
|
|
|
— |
|
|
|
— |
|
|
Under funded status at end of year |
|
$ |
(618 |
) |
|
$ |
(674 |
) |
|
$ |
(3,032 |
) |
|
$ |
(3,479 |
) |
Amounts recognized in the consolidated balance sheets consist of:
|
|
|
Postretirement |
|
|
Pension Plan |
|
||||||||||
|
|
|
2015 |
|
|
2014 |
|
|
2015 |
|
|
2014 |
|
||||
|
Current liabilities |
|
$ |
60 |
|
|
$ |
82 |
|
|
$ |
— |
|
|
$ |
— |
|
|
Noncurrent liabilities |
|
|
558 |
|
|
|
592 |
|
|
|
3,032 |
|
|
|
3,479 |
|
|
Total Liabilities |
|
$ |
618 |
|
|
$ |
674 |
|
|
$ |
3,032 |
|
|
$ |
3,479 |
|
Amounts recognized in accumulated other comprehensive income consist of:
|
|
|
Postretirement |
|
|
Pension Plan |
|
||||||||||
|
|
|
2015 |
|
|
2014 |
|
|
2015 |
|
|
2014 |
|
||||
|
Net (income) loss |
|
$ |
(38 |
) |
|
$ |
16 |
|
|
$ |
— |
|
|
$ |
— |
|
The accumulated benefit obligation for the postretirement benefit plan was $618 and $674 at March 31, 2015 and 2014, respectively.
47
Notes to Consolidated Financial Statements
($ in Thousands Except Share Amounts)
The following table provides the components of the net periodic benefit cost:
|
|
|
Postretirement |
|
|
Pension Plan |
|
||||||||||
|
|
|
2015 |
|
|
2014 |
|
|
2015 |
|
|
2014 |
|
||||
|
Net periodic benefit cost |
|
|
|
|
|
|
|
|
|
|
|
|
|
|
|
|
|
Interest cost |
|
$ |
23 |
|
|
$ |
30 |
|
|
$ |
108 |
|
|
$ |
115 |
|
|
Amortization of net loss |
|
|
— |
|
|
|
30 |
|
|
|
— |
|
|
|
— |
|
|
Total net periodic benefit cost |
|
$ |
23 |
|
|
$ |
60 |
|
|
$ |
108 |
|
|
$ |
115 |
|
The estimated net loss, prior service cost, and transition obligation for the postretirement benefit plan that will be amortized from accumulated other comprehensive income into net periodic benefit cost over the next fiscal year are $0, $0, and $0, respectively.
|
|
|
Postretirement |
|
|
Pension Plan |
|
||||||||||
|
|
|
2015 |
|
|
2014 |
|
|
2015 |
|
|
2014 |
|
||||
|
(Decrease) increase in minimum liability included in accumulated other comprehensive income |
|
$ |
(38 |
) |
|
$ |
16 |
|
|
$ |
— |
|
|
$ |
— |
|
Weighted-average assumptions used to determine benefit obligations at March 31:
|
|
|
Postretirement |
|
|
Pension Plan |
|
||||||||||
|
|
|
2015 |
|
|
2014 |
|
|
2015 |
|
|
2014 |
|
||||
|
Discount rate |
|
|
3.1 |
% |
|
|
3.6 |
% |
|
|
3.5 |
% |
|
|
3.5 |
% |
Assumed health care cost trend rates for the postretirement benefit plan at March 31:
|
|
|
2015 |
|
|
2014 |
|
||
|
Health care cost trend rate assumed for next year |
|
|
9.5 |
% |
|
|
10.0 |
% |
|
Rate to which the cost trend rate is assumed to decline (the ultimate trend rate) |
|
|
6.0 |
% |
|
|
6.0 |
% |
|
Year that the rate reaches the ultimate trend rate |
|
|
2025 |
|
|
|
2024 |
|
Assumed health care cost trend rates have a significant effect on the amounts reported for the health care plans. A one-percentage-point change in assumed health care cost trend rates would have the following effects on the postretirement benefit plan:
|
|
|
1-Percentage- |
|
|
1-Percentage- |
|
||
|
Effect on total of service and interest cost |
|
$ |
2 |
|
|
$ |
2 |
|
|
Effect on postretirement benefit obligation |
|
$ |
58 |
|
|
$ |
48 |
|
The Company expects to contribute $18 to its postretirement benefit plan in fiscal 2016.
The following benefit payments, which reflect expected future service, as appropriate, are expected to be paid:
|
|
|
Postretirement |
|
|
Pension |
|
||
|
2016 |
|
$ |
61 |
|
|
$ |
235 |
|
|
2017 |
|
|
57 |
|
|
|
229 |
|
|
2018 |
|
|
54 |
|
|
|
220 |
|
|
2019 |
|
|
51 |
|
|
|
213 |
|
|
2020 |
|
|
48 |
|
|
|
205 |
|
|
Years 2021-2025 |
|
|
196 |
|
|
|
901 |
|
48
Notes to Consolidated Financial Statements
($ in Thousands Except Share Amounts)
11. CONCENTRATION OF CREDIT RISK
The Company is subject to concentration of credit risk primarily with its cash and accounts receivable. At times, the Company maintains its cash in bank deposit accounts in excess of the FDIC insured amount which is $250. The Company grants credit to certain customers who meet pre-established credit requirements, and generally requires no collateral from its customers. Estimates of potential credit losses are provided for in the Company’s consolidated financial statements and are within management’s expectations. As of March 31, 2015, the Company had no other significant concentrations of credit risk.
12. LEASES
The Company conducts all of its current manufacturing business from a leased facility, which lease expires in fiscal 2020. The Company also leases a facility which is used for research and development of new products, which lease expires in fiscal 2021. In addition, the Company leases various office equipment under operating leases, which expire at various dates through fiscal 2020. All operating leases may include renewals and escalations.
The following is a summary of rent expense under operating leases for the years ended March 31:
|
2015 |
|
$ |
1,072 |
|
|
2014 |
|
$ |
1,074 |
|
|
2013 |
|
$ |
1,113 |
|
At March 31, 2015, the Company and its subsidiaries have minimum rental commitments under non-cancelable operating leases as follows:
|
2016 |
|
$ |
1,110 |
|
|
2017 |
|
|
1,100 |
|
|
2018 |
|
|
1,090 |
|
|
2019 |
|
|
1,100 |
|
|
2020 |
|
|
857 |
|
|
Thereafter |
|
|
25 |
|
|
Total |
|
$ |
5,282 |
|
13. CONTINGENCIES AND LEGACY ENVIRONMENTAL COMMITMENTS
Environmental Matters
The Company is involved in environmental proceedings and potential proceedings relating to soil and groundwater contamination and other environmental matters at several former facilities that were never required for its current operations. These facilities were part of businesses disposed of by TransTechnology Corporation, the former parent Company. Environmental cleanup activities usually span many years, which make estimating liabilities a matter of judgment because of various factors, including changing remediation technologies, assessments of the extent of contamination, and continually evolving regulatory environmental standards. The Company considers these and other factors as well as studies and reports by external environmental consultants to estimate the amount and timing of any future costs that may be required for remediation actions. The Company follows ASC 450 in recording and disclosing environmental liabilities and records a liability for its best estimate of remediation costs. Because the Company believes it has a more-definitive best estimate of the environmental liability, the Company does not calculate a range in accordance with ASC 450.
At March 31, 2015 and 2014, the aggregate environmental liability was $9,255 and $10,323, respectively, included in other current liabilities and other long term liabilities on the consolidated balance sheets, before cost-sharing of approximately $1,554 and $1,918 at March 31, 2015 and March 31, 2014, respectfully, that is included in other current assets and other long term assets, net of third-party fees. The Company’s environmental liability reserves are not reduced for any potential cost-sharing reimbursements.
In fiscal 2015 and fiscal 2014, the Company spent $946 and $1,487, respectively, on environmental costs. These costs were charged against the environmental liability reserve and did not impact net income. The Company performs quarterly reviews of its environmental sites and the related liabilities.
The Company continues to participate in environmental assessments and remediation work at seven locations, including certain former facilities. Due to the nature of environmental remediation and monitoring work, such activities can extend for up to thirty
49
Notes to Consolidated Financial Statements
($ in Thousands Except Share Amounts)
years, depending upon the nature of the work, the hazardous substances involved, and the regulatory requirements associated with each site. The Company does not discount the recorded liabilities.
Although the Company takes great care in developing these risk assessments and future cost estimates, the actual amount of remediation costs may be different from those estimated as a result of a number of factors including but not limited to the following: changes to federal and state environmental regulations or laws; changes in local construction costs and the availability of personnel and materials; unforeseen remediation requirements that are not apparent until the work actually commences; and actual remediation expenses that differ from those estimated. The Company does not include any unasserted claims that it might have against others in determining its potential liability for such costs, and, except as noted with specific cost sharing arrangements, has no such arrangements, nor has it taken into consideration any future claims against insurance carriers that the Company may have in determining its environmental liabilities. In those situations where the Company is considered a de minimis participant in a remediation claim, the failure of the larger participants to meet their obligations could result in an increase in the Company’s liability at such a site.
There are other sites that the Company is monitoring or investigating for potential environmental liability. In some cases, although a loss may be probable, it is not possible at this time to reasonably estimate the amount of any obligation for remediation activities because of uncertainties assessing the extent of the contamination or the applicable regulatory standard.
In addition, and as disclosed below, the Company will where supported by the evidence pursue claims for contribution to site investigation and cleanup costs against other potentially responsible parties (PRPs).
Glen Head, New York
In the first quarter of fiscal 2003, the Company entered into a consent order for a former facility in Glen Head, New York, which is currently subject to a contract for sale, pursuant to which the Company developed a remediation plan for review and approval by the New York Department of Environmental Conservation (“NYDEC”). The Company was advised in fiscal 2010 that the NYDEC required additional offsite groundwater delineation studies. Based upon the characterization work performed to date and this latest request, the Company’s reserve is $3,167 for the Glen Head site at March 31, 2015. The amounts and timing of payments are subject to the approved remediation plan and additional discussions with NYDEC.
The property is classified as “held for sale” for $3,800 after allowing for certain costs. In July 2001, the Company entered into a sales contract for the Glen Head, New York property for $4,000.
The buyer has indicated that its intended plan is to build residential housing on this former industrial site and has been engaged in the lengthy process of securing the necessary governmental approvals. In March 2015, the Company and the buyer entered into an amendment to the sales contract. The amendment provides for a potential reduction in the purchase price from zero to $1,000 if the final governmental approvals contain certain limitations on the buyer’s ability to implement its intended development plan. The parties are obligated to close under the sales contract upon receipt of the final governmental approvals, and the Company must provide the buyer with a funded remediation plan and environmental insurance at closing. However, the amendment further provides that if the governmental approvals are not secured by December 31, 2017, then at any time after that date either the Company or the buyer may elect to terminate the sales contract. If at any time after December 31, 2017, we terminate the sales contract for convenience, we must return to the buyer an additional liquidated amount of $750.
Saltzburg, Pennsylvania (“Federal Labs”)
The Company sold the business previously operated at the property owned in Saltzburg, Pennsylvania. The Company presented an environmental cleanup plan during the fourth quarter of fiscal 2000 for a portion of Federal Labs site pursuant to a consent order and agreement with the Pennsylvania Department of Environmental Protection (“PaDEP”) in fiscal 1999 (“1999 Consent Order”). PaDEP approved the plan during the third quarter of fiscal 2004, and the Company paid $200 for past costs, future oversight expenses, and in full settlement of claims made by PaDEP related to the environmental remediation of the site with an additional $200 paid subsequently.
The Company concluded a second consent order with PaDEP in the third quarter of fiscal 2001 for a second portion of the Federal Labs site (“2001 Consent Order”), and concluded a third Consent Order for the remainder of the Federal Labs site in the third quarter of fiscal 2003 (“2003 Consent Order”). The Company submitted an environmental cleanup plan for the portion of the Federal Labs site covered by the 2003 Consent Order during the second quarter of fiscal 2004.
50
Notes to Consolidated Financial Statements
($ in Thousands Except Share Amounts)
In the second quarter of fiscal 2014, the Company and the PaDEP executed a first amendment to the 2003 Consent Order for additional remediation work within the site covered by the 2003 Consent Order. The Company submitted an environmental cleanup plan for this additional remediation work during the second quarter of fiscal 2014.
The Company is administering a settlement, concluded in the first quarter of fiscal 2000, under which the U.S. Government pays 50% of the ongoing direct and indirect environmental costs for a portion of the Federal Labs site subject to the 1999 Consent Order. The U.S. Government cost-sharing receivable, net of third-party fees is included in other current assets and other long term assets on the consolidated balance sheets.
The Company also concluded an agreement in the first quarter of fiscal 2006, under which the U.S. Government paid an amount equal to 45% of the estimated environmental response costs for the Federal Labs site subject to the 2001 Consent Order. In May 2014, the Pennsylvania Department of Environmental Protection (“PADEP”) approved the final remedial action report for the site subject to the 2001 Consent Order and as a result of this approval the Company believes that no further on-site work is required. Accordingly, the Company reduced the environmental reserve by $412 in June 2014.
In March 2014, the Company reached an agreement in principle with the U.S. Government with respect to environmental response costs for the Fed Labs site subject to the 2003 Consent Order. Under the agreement, which was formally executed in the first quarter of fiscal 2015, the U.S. Government will pay an amount equal to approximately 26% of the environmental response costs incurred prior to December 31, 2012 and 33.5% of the ongoing environmental response costs incurred thereafter. The U.S. Government cost-sharing receivable, net of third-party fees is included in other current assets and other long term assets on the consolidated balance sheets.
At March 31, 2015, the environmental liability reserve for the Federal Labs site was $4,153. The Company expects that remediation at this site, which is subject to the oversight of the Pennsylvania authorities, will not be completed for several years, and that monitoring costs, although expected to be incurred over twenty years, could extend for up to thirty years.
Wyoming, Illinois
In fiscal 2014, the Company completed implementation of a soil remediation project and provided final investigation and cleanup reports to the Illinois Environmental Protection Agency (“IEPA”) for its formerly-owned property in Wyoming, Illinois. In the fiscal first quarter of 2014, the IEPA issued a No Further Remediation Letter for our former Wyoming, Illinois site. As a result of this letter, we believe that we have no future environmental obligations with respect to this site. Accordingly, the Company reduced during fiscal 2014 the remaining environmental liability for this site by $1,207, reflected in SG&A expense.
There are other properties that have a combined environmental liability of $1,935 at March 31, 2015.
The environmental activity is summarized as follows:
|
Balance at March 31, 2012 |
|
$ |
13,535 |
|
|
Environmental costs incurred |
|
|
(1,245 |
) |
|
Interest accretion |
|
|
394 |
|
|
Balance at March 31, 2013 |
|
|
12,684 |
|
|
Environmental costs incurred |
|
|
(1,487 |
) |
|
Interest accretion |
|
|
333 |
|
|
Reduction of environmental reserve-Wyoming Illinois |
|
|
(1,207 |
) |
|
Balance at March 31, 2014 |
|
|
10,323 |
|
|
Environmental costs incurred |
|
|
(946 |
) |
|
Interest accretion |
|
|
290 |
|
|
Reduction of environmental reserve- Part of Federal Labs site subject to the 2001 Consent Order |
|
|
(412 |
) |
|
Balance at March 31, 2015 |
|
$ |
9,255 |
|
Litigation
Certain other claims, suits, and complaints arising in the ordinary course of business have been filed or are pending against us. We believe, after consultation with legal counsel handling these specific matters, all such matters are reserved for or adequately covered
51
Notes to Consolidated Financial Statements
($ in Thousands Except Share Amounts)
by insurance or, if not so covered, are without merit or are of such kind, or involve such amounts, as would not be expected to have a material effect on our financial position or results of operations if determined adversely against us.
14. SEGMENT AND GEOGRAPHIC INFORMATION
The Company’s products and related services aggregate into one reportable segment - sophisticated mission equipment for specialty aerospace and defense applications. The nature of the production process (assemble, inspect, and test) is similar for all products, as are the customers and distribution methods.
Net sales greater than 10% of total revenues derived from one customer are summarized as follows:
|
|
|
2015 |
|
|
2014 |
|
|
2013 |
|
|||
|
Customer A |
|
$ |
16,777 |
|
|
$ |
25,370 |
|
|
$ |
19,782 |
|
|
Customer B |
|
$ |
14,574 |
|
|
$ |
11,924 |
|
|
$ |
14,764 |
|
|
Customer C |
|
$ |
14,246 |
|
|
|
* |
|
|
|
* |
|
|
Customer D |
|
$ |
10,394 |
|
|
$ |
11,032 |
|
|
$ |
10,622 |
|
|
* |
Represents less than 10% of total revenues. |
Amounts derived from one customer greater than 10% of total accounts receivable are summarized as follows:
|
|
|
2015 |
|
|
2014 |
|
||
|
Customer 1 |
|
$ |
5,340 |
|
|
$ |
4,146 |
|
|
Customer 2 |
|
$ |
5,237 |
|
|
|
* |
|
|
Customer 3 |
|
$ |
3,522 |
|
|
|
* |
|
|
Customer 4 |
|
|
* |
|
|
$ |
2,940 |
|
|
* |
Represents less than 10% of total accounts receivable. |
Net sales by geographic location of customers are summarized as follows:
|
Location |
|
2015 |
|
|
2014 |
|
|
2013 |
|
|||
|
United States |
|
$ |
50,732 |
|
|
$ |
48,832 |
|
|
$ |
51,020 |
|
|
Germany |
|
|
13,020 |
|
|
|
4,491 |
|
|
|
216 |
|
|
Italy |
|
|
5,623 |
|
|
|
7,500 |
|
|
|
6,186 |
|
|
England |
|
|
2,904 |
|
|
|
3,225 |
|
|
|
5,420 |
|
|
Spain |
|
|
2,763 |
|
|
|
2,466 |
|
|
|
2,637 |
|
|
Other European countries |
|
|
3,990 |
|
|
|
2,154 |
|
|
|
2,588 |
|
|
Pacific and Far East |
|
|
6,366 |
|
|
|
8,888 |
|
|
|
2,651 |
|
|
Other International |
|
|
4,384 |
|
|
|
8,377 |
|
|
|
9,238 |
|
|
Total |
|
$ |
89,782 |
|
|
$ |
85,933 |
|
|
$ |
79,956 |
|
15. SUBSEQUENT EVENTS
Management has evaluated all events occurring through the date that the Consolidated Financial Statements have been issued, and has determined that all such events that are material to the Consolidated Financial Statements have been fully disclosed.
52
Notes to Consolidated Financial Statements
($ in Thousands Except Share Amounts)
16. UNAUDITED QUARTERLY FINANCIAL DATA
|
|
|
First |
|
|
Second |
|
|
Third |
|
|
Fourth |
|
|
Total |
|
|||||
|
2015 |
|
|
|
|
|
|
|
|
|
|
|
|
|
|
|
|
|
|
|
|
|
Net sales |
|
$ |
17,919 |
|
|
$ |
17,671 |
|
|
$ |
23,239 |
|
|
$ |
30,953 |
|
|
$ |
89,782 |
|
|
Gross profit |
|
|
5,566 |
|
|
|
6,985 |
|
|
|
9,844 |
|
|
|
12,469 |
|
|
|
34,864 |
|
|
Operating income (loss) |
|
|
(220 |
) (a)(b) |
|
|
1,057 |
(b)(c) |
|
|
5,195 |
(b) |
|
|
6,873 |
|
|
|
12,905 |
|
|
Net income (loss) |
|
|
(162 |
) |
|
|
640 |
|
|
|
9,044 |
(d)(e) |
|
|
5,385 |
(e)(f) |
|
|
14,907 |
|
|
Basic earnings (loss) per share: |
|
$ |
(0.02 |
) |
|
$ |
0.07 |
|
|
$ |
0.92 |
|
|
$ |
0.55 |
|
|
$ |
1.52 |
|
|
Diluted earnings (loss) per share: |
|
$ |
(0.02 |
) |
|
$ |
0.06 |
|
|
$ |
0.91 |
|
|
$ |
0.54 |
|
|
$ |
1.50 |
|
|
|
|
First |
|
|
Second |
|
|
Third |
|
|
Fourth |
|
|
Total |
|
|||||
|
2014 |
|
|
|
|
|
|
|
|
|
|
|
|
|
|
|
|
|
|
|
|
|
Net sales |
|
$ |
19,568 |
|
|
$ |
15,464 |
|
|
$ |
22,628 |
|
|
$ |
28,273 |
(g) |
|
$ |
85,933 |
|
|
Gross profit |
|
|
6,805 |
|
|
|
5,413 |
|
|
|
8,439 |
|
|
|
10,474 |
(g) |
|
|
31,131 |
|
|
Operating income (loss) |
|
|
2,253 |
(a) |
|
|
(305 |
) (b) |
|
|
2,725 |
|
|
|
4,416 |
|
|
|
9,089 |
|
|
Net income (loss) |
|
|
1,373 |
|
|
|
(217 |
) |
|
|
1,670 |
|
|
|
2,815 |
|
|
|
5,641 |
|
|
Basic earnings (loss) per share: |
|
$ |
0.14 |
|
|
$ |
(0.02 |
) |
|
$ |
0.17 |
|
|
$ |
0.29 |
|
|
$ |
0.58 |
|
|
Diluted earnings (loss) per share |
|
$ |
0.14 |
|
|
$ |
(0.02 |
) |
|
$ |
0.17 |
|
|
$ |
0.29 |
|
|
$ |
0.58 |
|
|
(a) |
Included in operating income is an environmental benefit of $412 and $1,207 in fiscal 2015 and fiscal 2014, respectively, from the reversal of an environmental reserve. See Note 13. |
|
(b) |
Included in operating income in Fiscal 2015 are Executive transition costs of $534, $59 and $85, in the first, second and third quarters, respectively. Executive transition costs of $240 are included in operating income in fiscal 2014. |
|
(c) |
Included in operating income is $288 of internal re-organization costs. |
|
(d) |
Included in net income is $1,224 from a refund received from a real estate property tax review and assessment reduction for the Glen Head, New York property. |
|
(e) |
Included in net income is a research & development tax credit of $5,020 and $1,273, in the third and fourth quarters, respectively. See Note 5. |
|
(f) |
Included in net income is a gain of $503 from the sale of a property located in Irvington, New Jersey, which had a zero book value, was previously operated by one of our predecessor affiliates, and not used in our operations. |
|
(g) |
The Company terminated a distributor contract which resulted in sales returns of $1,538 and lowered gross profit by $1,033. |
53
Not applicable.
In May 2013, the Committee of Sponsoring Organizations of the Treadway Commission (COSO) released COSO 2013, an update of its Internal Control - Integrated Framework (1992). The COSO 2013 Internal Control-Integrated Framework formalizes the principles embedded in the original COSO 1992, incorporates business and operating environment changes over the past two decades, and improves the original 1992 framework’s ease of use and application. We completed our transition to COSO 2013 in the third quarter of fiscal 2015. The transition to COSO 2013 did not have a significant impact on our underlying compliance with the applicable provisions of the Sarbanes-Oxley Act of 2002, including internal control over financial reporting and disclosure controls and procedures.
Evaluation of Disclosure Controls and Procedures
Our management has evaluated, under the supervision and with the participation of our Chief Executive Officer and Chief Financial Officer, the effectiveness of our disclosure controls and procedures (as defined in Rules 13a-15(e) or 15(d)-15(e)) as of the end of the period covered by this report pursuant to Rule 13a-15(b). Based on this evaluation, our Chief Executive Officer and Chief Financial Officer concluded that, as of March 31, 2015, our disclosure controls and procedures were effective to ensure (i) that information we are required to disclose in reports that we file or submit under the Securities Exchange Act of 1934 is recorded, processed, summarized and reported within the time periods specified in the SEC’s rules and forms, and (ii) that such information is accumulated and communicated to management, including our Chief Executive Officer and Chief Financial Officer, in order to allow timely decisions regarding required disclosure.
Management’s Annual Report on Internal Control Over Financial Reporting
Our management is responsible for establishing and maintaining adequate internal control over financial reporting and for its assessment of the effectiveness of internal control over financial reporting. Internal control over financial reporting is a process designed to provide reasonable assurance regarding the reliability of financial reporting and the preparation of financial statements for external purposes in accordance with accounting principles generally accepted in the United States of America.
Our internal control over financial reporting includes those policies and procedures that (i) pertain to the maintenance of records that, in reasonable detail, accurately and fairly reflect our transactions and dispositions of our assets; (ii) provide reasonable assurance that transactions are recorded as necessary to permit preparation of the consolidated financial statements in accordance with accounting principles generally accepted in the United States of America and that our receipts and expenditures are being made only in accordance with authorization of management and our Board of Directors; and (iii) provide reasonable assurance regarding prevention or timely detection of unauthorized acquisition, use, or disposition of our assets that could have a material adverse effect on the consolidated financial statements.
Because of its inherent limitations, internal control over financial reporting may not prevent or detect misstatements. Also, projections of any evaluation of effectiveness to future periods are subject to the risk that controls may become inadequate because of changes in conditions, or that the degree of compliance with the policies or procedures may deteriorate.
Our management assessed the effectiveness of the Company’s internal control over financial reporting as of March 31, 2015 using criteria established by the Committee of Sponsoring Organizations of the Treadway Commission in the 2013 Internal Control-Integrated Framework. Our management has concluded that our internal control over financial reporting was effective as of March 31, 2015. In addition, our independent registered public accounting firm of Marcum LLP has issued an attestation report on our internal control over financial reporting, which is included herein.
Changes in Internal Control Over Financial Reporting
There have been no changes in our internal control over financial reporting (as defined in Rule 13a-15(f) under the Securities Exchange Act of 1934, as amended) during the fiscal quarter ended March 31, 2015 that have materially affected, or are reasonably likely to materially affect, our internal control over financial reporting.
None.
54
The information required by this item will be set forth in our definitive proxy statement with respect to our 2015 annual meeting of stockholders to be filed not later than 120 days after March 31, 2015 and is incorporated herein by this reference.
The information required by this item will be set forth in our definitive proxy statement with respect to our 2015 annual meeting of stockholders to be filed not later than 120 days after March 31, 2015 and is incorporated herein by this reference.
The information required by this item will be set forth in our definitive proxy statement with respect to our 2015 annual meeting of stockholders to be filed not later than 120 days after March 31, 2015 and is incorporated herein by this reference.
The information required by this item will be set forth in our definitive proxy statement with respect to our 2015 annual meeting of stockholders to be filed not later than 120 days after March 31, 2015 and is incorporated herein by this reference.
The information required by this item will be set forth in our definitive proxy statement with respect to our 2015 annual meeting of stockholders to be filed not later than 120 days after March 31, 2015 and is incorporated herein by this reference.
55
(a) Financial Statements, Schedules, and Exhibits:
1. Financial Statements:
Consolidated Balance Sheets at March 31, 2015 and 2014
Consolidated Statements of Operations for the years ended March 31, 2015, 2014, and 2013
Consolidated Statements of Comprehensive Income for the years ended March 31, 2015, 2014, and 2013
Consolidated Statements of Cash Flows for the years ended March 31, 2015, 2014, and 2013
Consolidated Statements of Stockholders’ Equity for the years ended March 31, 2015, 2014, and 2013
Notes to Consolidated Financial Statements
Reports of Independent Registered Public Accounting Firm
2. Financial Statement Schedules
Schedule II — Consolidated Valuation and Qualifying Accounts for the years ended March 31, 2015, 2014, and 2013.
All other schedules are omitted because they are not applicable or the required information is shown in the consolidated financial statements or notes thereto.
BREEZE-EASTERN CORPORATION SCHEDULE II
CONSOLIDATED VALUATION AND QUALIFYING ACCOUNTS
FOR YEARS ENDED MARCH 31, 2015, 2014 AND 2013
($ In Thousands)
|
|
Balance |
|
|
Charged |
|
|
Charged |
|
|
|
|
|
Balance |
|
||||||
|
|
At |
|
|
to |
|
|
to |
|
|
|
|
|
At |
|
||||||
|
|
Beginning of |
|
|
Costs and |
|
|
Other |
|
|
|
|
|
End of |
|
||||||
|
Description |
|
Period |
|
|
Expenses |
|
|
Accounts |
|
|
Deductions |
|
|
Period |
|
|||||
|
2015 |
|
|
|
|
|
|
|
|
|
|
|
|
|
|
|
|
|
|
|
|
|
Allowances for doubtful accounts |
$ |
323 |
|
|
$ |
365 |
|
|
$ |
— |
|
|
$ |
120 |
|
|
$ |
568 |
|
|
|
Inventory reserves |
|
2,929 |
|
|
|
238 |
|
|
|
— |
|
|
|
621 |
|
|
|
2,546 |
|
|
|
Environmental reserves |
|
10,323 |
|
|
|
290 |
|
|
|
— |
|
|
|
1,358 |
|
|
|
9,255 |
|
|
|
Allowance for tax loss valuation |
|
265 |
|
|
|
1,278 |
|
|
|
— |
|
|
|
— |
|
|
|
1,543 |
|
|
|
2014 |
|
|
|
|
|
|
|
|
|
|
|
|
|
|
|
|
|
|
|
|
|
Allowances for doubtful accounts |
$ |
292 |
|
|
$ |
31 |
|
|
$ |
— |
|
|
$ |
— |
|
|
$ |
323 |
|
|
|
Inventory reserves |
|
3,116 |
|
|
|
291 |
|
|
|
— |
|
|
|
478 |
|
|
|
2,929 |
|
|
|
Environmental reserves |
|
12,684 |
|
|
|
333 |
|
|
|
— |
|
|
|
2,694 |
|
|
|
10,323 |
|
|
|
Allowance for tax loss valuation |
|
583 |
|
|
|
— |
|
|
|
— |
|
|
|
318 |
|
|
|
265 |
|
|
|
2013 |
|
|
|
|
|
|
|
|
|
|
|
|
|
|
|
|
|
|
|
|
|
Allowances for doubtful accounts |
$ |
283 |
|
|
$ |
17 |
|
|
$ |
— |
|
|
$ |
8 |
|
|
$ |
292 |
|
|
|
Inventory reserves |
|
2,694 |
|
|
|
540 |
|
|
|
— |
|
|
|
118 |
|
|
|
3,116 |
|
|
|
Environmental reserves |
|
13,535 |
|
|
|
394 |
|
|
|
— |
|
|
|
1,245 |
|
|
|
12,684 |
|
|
|
Allowance for tax loss valuation |
|
265 |
|
|
|
318 |
|
|
|
— |
|
|
|
— |
|
|
|
583 |
|
|
56
3. Exhibits:
The exhibits listed on the accompanying Index to Exhibits are filed as part of this report.
|
Exhibit No. |
|
Description |
|
|
|
|
|
3.1 |
|
Certificate of Incorporation of the Company (incorporated by reference to Exhibit 3.1 to the Company’s Quarterly Report on Form 10-Q for the quarter ended December 25, 2005) |
|
|
|
|
|
3.2 |
|
Certificate of Amendment to Certificate of Incorporation of the Company (incorporated by reference to Exhibit 3.1 to the Company’s current report on Form 8-K filed with the SEC on October 13, 2006) |
|
|
|
|
|
3.3 |
|
Certificate of Designation, Rights, Preferences of Series A Preferred Stock (incorporated by reference to Exhibit 3.1 to the current report on Form 8-K, filed with the SEC on July 19, 2011) |
|
|
|
|
|
3.4 |
|
Amended and Restated Bylaws of the Company (incorporated by reference to Exhibit 3.2 to the Company’s annual report on Form 10-K for the fiscal year ended March 31, 2008) |
|
|
|
|
|
3.5 |
|
Amendment No. 1 to the Amended and Restated Bylaws (incorporated by reference to Exhibit 3.1 to the Company’s current report on Form 8-K, filed with the SEC on February 2, 2012) |
|
|
|
|
|
10.1* |
|
1999 Long Term Incentive Plan (incorporated by reference to Exhibit 10.23 to the Company’s annual report on Form 10-K for the fiscal year ended March 31, 1999) |
|
|
|
|
|
10.2* |
|
2004 Long Term Incentive Plan (incorporated by reference to Annex A to the Company’s definitive proxy statement for its 2004 annual meeting of stockholders) |
|
|
|
|
|
10.3* |
|
Form of Stock Option Agreement used under the 2004 Long Term Incentive Plan (incorporated by reference to Exhibit 10.17 to the Company’s annual report on Form 10-K for the fiscal year ended March 31, 2006) |
|
|
|
|
|
10.4* |
|
Form of Restricted Stock Award Agreement used under the 2004 Long Term Incentive Plan (incorporated by reference to Exhibit 10.18 to the Company’s annual report on Form 10-K for the fiscal year ended March 31, 2006) |
|
|
|
|
|
10.5* |
|
2006 Long Term Incentive Plan of the Company (incorporated by reference to Annex A to the Company’s definitive proxy statement for its 2006 annual meeting of stockholders) |
|
|
|
|
|
10.6* |
|
Form of Stock Option Agreement under the 2006 Long Term Incentive Plan (incorporated by reference to Exhibit 10.34 to the Company’s annual report on Form 10-K for the fiscal year ended March 31, 2007) |
|
|
|
|
|
10.7* |
|
Form of Restricted Stock Award Agreement under the 2006 Long Term Incentive Plan (incorporated by reference to Exhibit 10.35 to the Company’s annual report on Form 10-K for the fiscal year ended March 31, 2007) |
|
|
|
|
|
10.8 |
|
Credit Agreement by and among the Company, as Borrower, the Guarantors that are signatories thereto, as the Guarantors, T.D. Bank, N.A, as a Lender, PNC Bank, National Association, as a Lender and the Administrative Agent for the Lenders, and PNC Capital Markets, LLC, as Arranger, dated as of August 28, 2008 and expired August 26, 2013 (incorporated by reference to Exhibit 10.1 to the Company’s current report on Form 8-K, filed with the SEC on August 29, 2008) |
|
|
|
|
|
10.9 |
|
Net Lease Agreement between the Company and 35 Melanie Lane, L.L.C., dated as of May 13, 2009 (incorporated by reference to Exhibit 10.34 to the Company’s annual report on Form 10-K for the fiscal year ended March 31, 2009) |
|
|
|
|
|
10.10 |
|
First Amendment to Credit Agreement by and among the Company, as Borrower, the Guarantors that are parties thereto, the Lenders that are Parties thereto, as the Lenders, and PNC Bank, National Association, as Administrative Agent, dated as of August 5, 2009 and expired August 26, 2013 (incorporated by reference to Exhibit 10.2 to the Company’s current report on Form 8-K, filed with the SEC on August 7, 2009) |
|
|
|
|
|
10.11* |
|
Employment Agreement between the Company and Mark D. Mishler, dated December 10, 2009 (incorporated by reference to Exhibit 10.38 to the Company’s current report on Form 8-K, filed with the SEC on January 7, 2010) |
|
|
|
|
|
10.12* |
|
Stock Option Agreement between the Company and Mark D. Mishler, dated January 6, 2010 (incorporated by reference to Exhibit 10.21 to the Company’s annual report on Form 10-K for the fiscal year ended March 31, 2010) |
|
|
|
|
|
10.13* |
|
Form of Restricted Stock Award Agreement under the 2006 Long Term Incentive Plan between the Company and the Board of Directors (incorporated by reference to Exhibit 10.22 to the Company’s annual report on Form 10-K for the fiscal year ended March 31, 2011) |
57
|
Exhibit No. |
|
Description |
|
|
|
|
|
10.14* |
|
2012 Incentive Compensation Plan (incorporated by reference to Appendix C to the Company’s definitive proxy statement for its 2012 annual meeting of stockholders) |
|
|
|
|
|
10.15* |
|
Employment Agreement, effective as of May 22, 2012, between the Company and Brad Pedersen (incorporated by reference to Exhibit 10.2 to the current report on Form 8-K, filed with the SEC on May 24, 2012) |
|
|
|
|
|
10.16* |
|
Options to purchase Common Stock of the Company, issued to Brad Pedersen on May 22, 2012 (incorporated by reference to Exhibit 10.3 to the current report on Form 8-K, filed with the SEC on May 24, 2012) |
|
|
|
|
|
10.17* |
|
Form of Indemnification Agreement (incorporated by reference to Exhibit 10.1 to the quarterly report on Form 10-Q for the quarter ended December 31, 2012) |
|
|
|
|
|
10.18 |
|
Revolving Credit Loan Agreement by and among the Company, as Borrower, and Bank of America, N.A., as Lender dated as of August 26, 2013 (incorporated by reference to Exhibit 10.1 to the Company’s current report on Form 8-K, filed with the SEC on August 28, 2013) |
|
|
|
|
|
10.19* |
|
Offer Letter by and between Breeze-Eastern Corporation and Serge Dupuis dated June 16, 2014 (incorporated by reference to Exhibit 10.1 to the current report on Form 8-K, filed with the SEC on June 17, 2014) |
|
|
|
|
|
10.20* |
|
Amendment to Stock Option Agreement by and between Breeze-Eastern Corporation and Serge Dupuis executed and effective July 7, 2014 (incorporated by reference to Exhibit 10.2 to the quarterly report on Form 10-Q for the quarter ended June 30, 2014) |
|
|
|
|
|
10.21* |
|
Options to purchase Common Stock of the Company, issued to Bradley Alan Repp on August 18, 2014 (incorporated by reference to Item 8.01 to the current report on Form 8-K, filed with the SEC on August 18, 2014) |
|
|
|
|
|
10.22* |
|
Amendment to Employment Letter by and between Breeze-Eastern Corporation and James D. Cashel dated October 10, 2014 (incorporated by reference to Exhibit 99.1 to the current report on Form 8-K, filed with the SEC on October 14, 2014) |
|
|
|
|
|
21.1 |
|
Subsidiaries of the Company (incorporated by reference to Exhibit 21.1 to the Company’s annual report on Form 10-K for the fiscal year ended March 31, 2010) |
|
|
|
|
|
23.1** |
|
Consent of Independent Registered Public Accounting Firm |
|
|
|
|
|
31.1** |
|
Certification of Chief Executive Officer pursuant to Sarbanes-Oxley Act of 2002 Section 302 |
|
|
|
|
|
31.2** |
|
Certification of Chief Financial Officer pursuant to Sarbanes-Oxley Act of 2002 Section 302 |
|
|
|
|
|
32.1** |
|
Certification of Chief Executive Officer and Chief Financial Officer Pursuant to Sarbanes Oxley Act of 2002 Section 906 |
|
|
|
|
|
101.INS*** |
|
XBRL Instance Document |
|
|
|
|
|
101.SCH*** |
|
XBRL Taxonomy Extension Schema Document |
|
|
|
|
|
101.CAL*** |
|
XBRL Taxonomy Extension Calculation Linkbase Document |
|
|
|
|
|
101.DEF*** |
|
XBRL Taxonomy Extension Definition Linkbase Document |
|
|
|
|
|
101.LAB*** |
|
XBRL Taxonomy Extension Label Linkbase Document |
|
|
|
|
|
101.PRE*** |
|
XBRL Taxonomy Extension Presentation Linkbase Document |
* Management contract or compensatory plan or arrangement
**Filed herewith
*** We have attached the following documents formatted in XBRL (Extensible Business Reporting Language) as Exhibit 101 to this report: (i) Consolidated Statements of Operations for the years ended March 31, 2015, 2014, and 2013 (ii) Consolidated Statements of Comprehensive Income for the years ended March 31, 2015, 2014, and 2013, (iii) Consolidated Balance Sheets at March 31, 2015, and 2014, (iv) Consolidated Statements of Cash Flows for the years ended March 31, 2015, 2014, and 2013, (v) Consolidated Statements of Shareholders’ Equity for the years ended March 31, 2015, 2014, and 2013 and (vi) the Notes to the Consolidated Financial Statements
58
SIGNATURES
Pursuant to the requirements of Section 13 or 15(d) of the Securities Exchange Act of 1934, the registrant has duly caused this Report to be signed on its behalf by the undersigned, thereunto duly authorized.
|
|
|
|
|
BREEZE-EASTERN CORPORATION |
|
|
||||
|
Date: May 29, 2015 |
|
By: |
|
/s/ Brad Pedersen |
|
|
|
|
|
Brad Pedersen |
|
|
|
|
|
President and Chief Executive Officer |
|
|
|
|
|
|
|
|
|
By: |
|
/s/ Serge Dupuis |
|
|
|
|
|
Serge Dupuis |
|
|
|
|
|
Chief Financial Officer and |
|
|
|
|
|
Treasurer |
Pursuant to the requirements of the Securities Exchange Act of 1934, this report has been signed below by the following persons on behalf of the registrant and in the capacities and on the dates indicated.
|
Signature |
|
Title |
|
Date |
|
|
|
|
|
|
|
/s/ Robert J. Kelly |
|
Chairman of the Board of Directors |
|
May 29, 2015 |
|
Robert J. Kelly |
|
|
|
|
|
|
|
|
||
|
/s/ Serge Dupuis |
|
Chief Financial Officer and Treasurer |
|
May 29, 2015 |
|
Serge Dupuis |
|
(Principal Financial and Accounting Officer) |
|
|
|
|
|
|
|
|
|
|
|
|
||
|
/s/ Brad Pedersen |
|
President & Chief Executive Officer |
|
May 29, 2015 |
|
Brad Pedersen |
|
(Principal Executive Officer) Director |
|
|
|
|
|
|
||
|
/s/ Nelson Obus |
|
Director |
|
May 29, 2015 |
|
Nelson Obus |
|
|
|
|
|
|
|
|
||
|
/s/ William J. Recker |
|
Director |
|
May 29, 2015 |
|
William J. Recker |
|
|
|
|
|
|
|
|
||
|
/s/ William M. Shockley |
|
Director |
|
May 29, 2015 |
|
William M. Shockley |
|
|
|
|
|
|
|
|
||
|
/s/ Charles A. Vehlow |
|
Director |
|
May 29, 2015 |
|
Charles A. Vehlow |
|
|
|
|
|
|
|
|
||
|
/s/ Frederick Wasserman |
|
Director |
|
May 29, 2015 |
|
Frederick Wasserman |
|
|
|
|
59