Attached files
| file | filename |
|---|---|
| EXCEL - IDEA: XBRL DOCUMENT - HAEMONETICS CORP | Financial_Report.xls |
| EX-32.2 - EXHIBIT 32.2 - CFO CERTIFICATION - HAEMONETICS CORP | hae20150328exh322.htm |
| EX-32.1 - EXHIBIT 32.1 - CEO CERTIFICATION - HAEMONETICS CORP | hae20150328exh321.htm |
| EX-31.1 - EXHIBIT 31.1 - CEO CERTIFICATION - HAEMONETICS CORP | hae20150328exh311.htm |
| EX-21.1 - EXHIBIT 21.1 - SUBSIDIARIES OF THE COMPANY - HAEMONETICS CORP | hae20150328exh211.htm |
| EX-31.2 - EXHIBIT 31.2 - CFO CERTIFICATION - HAEMONETICS CORP | hae20150328exh312.htm |
| EX-23.1 - EXHIBIT 23.1 - CONSENT OF INDEPENDENT REGISTERED PUBLIC ACCOUNTING FIRM - HAEMONETICS CORP | hae20150328exh231.htm |
| EX-10.AP - EXHIBIT 10.AP 2005 LONG-TERM INCENTIVE COMPENSATION PLAN PERFORMANCE SHARE UNIT - HAEMONETICS CORP | hae20150328exh10ap.htm |
UNITED STATES SECURITIES AND EXCHANGE COMMISSION
Washington, D.C. 20549
Form 10-K
ANNUAL REPORT PURSUANT TO SECTION 13 OR 15(d)
OF THE SECURITIES EXCHANGE ACT OF 1934
For the fiscal year ended March 28, 2015
Commission file number 001-14041
HAEMONETICS CORPORATION
(Exact name of registrant as specified in its charter)
Massachusetts | 04-2882273 | |
(State or other jurisdiction of incorporation or organization) | (I.R.S. Employer Identification No.) | |
400 Wood Road, Braintree, Massachusetts 02184-9114 (Address of principal executive offices) | (781) 848-7100 (Registrant’s telephone number) | |
Securities registered pursuant to Section 12(b) of the Act:
(Title of Each Class) | (Name of Exchange on Which Registered) | |
Common stock, $.01 par value per share | New York Stock Exchange | |
Securities registered pursuant to Section 12(g) of the Act:
None
Indicate by check mark whether the registrant is a well-known seasoned issuer, as defined in Rule 405 of the Securities Act. Yes þ No o
Indicate by check mark whether the registrant is not required to file reports pursuant to Section 13 or 15(d) of the Act. Yes o No þ
Indicate by check mark whether the registrant (1.) has filed all reports required to be filed by Section 13 or 15(d) of the Securities Exchange Act of 1934 during the preceding 12 months (or for such shorter period that the registrant was required to file such reports) (2.) has been subject to the filing requirements for at least the past 90 days. Yes þ No o
Indicate by check mark whether the registrant has submitted electronically and posted on its corporate Web site, if any, every Interactive Data File required to be submitted and posted pursuant to Rule 405 of Regulation S-T (§ 232.405 of this chapter) during the preceding 12 months (or for such shorter period that the registrant was required to submit and post such files). Yes þ No o
Indicate by check mark if disclosure of delinquent filers pursuant to Item 405 of Regulation S-K is not contained herein, and will not be contained, to the best of registrant’s knowledge, in definitive proxy or information statements incorporated by reference in Part III of this Form 10-K or any amendment to this form 10-K. þ
Indicate by check mark whether the registrant is a large accelerated filer, an accelerated filer, a non-accelerated filer, or a smaller reporting company. See the definitions of “large accelerated filer,” “accelerated filer” and “smaller reporting company” in Rule 12b-2 of the Exchange Act. (Check one):
Large accelerated filer þ | Accelerated filer o | Non-accelerated filer o | Smaller reporting company o | |||
(Do not check if a smaller reporting company) | ||||||
Indicate by check mark whether the registrant is a shell company (as defined in Rule 12b-2 of the Exchange Act.). Yes o No þ
The aggregate market value of the voting and non-voting common equity held by non-affiliates of the registrant (assuming for these purposes that all executive officers and directors are “affiliates” of the registrant) as of September 27, 2014, the last business day of the registrant’s most recently completed second fiscal quarter was $1,777,275,792 (based on the closing sale price of the registrant’s common stock on that date as reported on the New York Stock Exchange).
The number of shares of $0.01 par value common stock outstanding as of April 25, 2015 was 51,682,698.
Documents Incorporated By Reference
Portions of the definitive proxy statement for our Annual Meeting of Shareholders to be held on July 21, 2015 are incorporated by reference in Part III of this report.
TABLE OF CONTENTS
Page Number | ||
Item 1. | ||
Item 1A. | ||
Item 1B. | ||
Item 2. | ||
Item 3. | ||
Item 4. | ||
Item 4A. | ||
Item 5. | ||
Item 6. | ||
Item 7. | ||
Item 7A. | ||
Item 8. | ||
Item 9. | ||
Item 9A. | ||
Item 9B. | ||
Item 10. | ||
Item 11. | ||
Item 12. | ||
Item 13. | ||
Item 14. | ||
Item 15. | ||
ITEM 1. BUSINESS
Company Overview
Haemonetics is a global healthcare company dedicated to providing innovative blood management solutions to our customers. Our comprehensive portfolio of integrated devices, information management, and consulting services offers blood management solutions for each facet of the blood supply chain, helping improve clinical outcomes and reduce costs for blood and plasma collectors, hospitals, and patients around the world. Our products and services help prevent a transfusion to a patient who does not need one and provide the right blood product, at the right time, in the right dose to the patient who does. When used in this report, the terms “we,” “us,” “our” and “the Company” mean Haemonetics.
Blood and its components (plasma, platelets, and red cells) have many vital - and frequently life-saving - clinical applications. Plasma is used for patients with major blood loss and is manufactured into pharmaceuticals to treat a variety of illnesses and hereditary disorders such as hemophilia. Red cells treat trauma patients or patients undergoing surgery with high blood loss, such as open heart surgery or organ transplant. Platelets treat cancer patients undergoing chemotherapy. Blood is essential to a modern healthcare system.
Haemonetics is committed to helping our customers create and maintain a safe and efficient blood supply chain. Specifically, we develop and market a wide range of blood collection and processing systems used with plasma and blood donors that collect and process blood into its components using both manual and automated methods. We also develop and market a variety of systems to hospitals that automate the cleaning and reinfusion of a surgical patient's own blood, automate the tracking and distribution of blood in the hospital, and enhance blood diagnostics. We also sell information technology platforms to promote efficient and compliant operations for all of our customer groups. Finally, we provide consulting services to reduce costs and improve operating efficiencies in blood management. By better understanding our customers' needs, we are creating comprehensive blood management solutions for blood collectors and healthcare systems in approximately 100 countries around the world.
Haemonetics was founded in 1971 as a medical device company — a pioneer and market leader in developing and manufacturing automated blood component collection devices and surgical blood salvage devices. In May 1991, we completed an initial public offering and to this day remain an independent company.
In 2012, we entered the market for manual whole blood collections with the acquisition of Pall Corporation’s blood collection, filtration and processing product lines. This acquisition provides access to whole blood markets, manual collection and control over filter manufacturing.
Market and Products
Product Lines
We serve three customer segments: manufacturers of plasma derived pharmaceuticals, blood collectors, and hospitals. We report revenues for multiple product lines under four global product categories: Plasma, Blood Center, Hospital, and Software Solutions. “Plasma” includes plasma collection devices and disposables. “Blood Center” includes blood collection and processing devices and disposables. “Hospital” includes surgical blood salvage and blood demand diagnostic devices and disposables. “Software Solutions” includes information technology platforms and consulting services provided to all three markets. Although we address our customers' needs through multiple product lines, we manage our business as five operating segments based primarily on geography; North America Plasma, North America Blood Center and Hospital, Europe, Asia Pacific and Japan. However, for financial reporting purposes we aggregate our five operating segments into one reportable segment as they are economically similar.
The financial information required for segments is included herein in Note 15 of the financial statements, entitled Segment Information.
1
• | Plasma |
The Plasma Collection Market for Fractionation — Human plasma is collected and processed by bio-pharmaceutical companies into therapeutic and diagnostic products that aid in the treatment of immune diseases and coagulation disorders. While plasma is also used to aid patients with extreme blood loss, such as trauma victims, bio-pharmaceutical companies solely focus on plasma's pharmaceutical uses. Automated plasma collection technology allows for the safe and efficient collection of plasma. We manufacture and market automated plasma collection devices and respective disposables, but do not make plasma-derived pharmaceuticals.
Many bio-pharmaceutical companies are vertically integrated in all components of their business and thus are now collecting and fractionating the plasma required to manufacture their pharmaceuticals. This vertical integration paved the way for highly efficient plasma supply chain management and the plasma industry leverages information technology to manage operations from the point of plasma donation to fractionation to the production of the final product.
Haemonetics' Plasma Products — Our portfolio of products and services is designed to support multiple facets of plasma collector operations. We have a long-standing commitment to understanding our customers' collection and fractionation processes. As a result, we deliver product quality and reliability; design equipment that is durable, dependable, and easy to use; comprehensive training and support, and strong business continuity practices.
Historically, plasma for fractionation was collected manually, which was time-consuming, labor-intensive, produced relatively poor yields, and posed risk to donors. Today, the vast majority of plasma collections worldwide are performed using automated collection technology because it is safer and more cost-effective. With our PCS® brand automated plasma collection technology, more plasma can be collected during any one donation event because the other blood components are returned to the donor through the sterile disposable sets used for the plasma donation procedure.
We offer “one stop shopping” to our plasma collection customers, enabling them to source from us the full range of products necessary for plasma collection and storage, including PCS® brand plasma collection equipment and disposables, plasma collection containers, and intravenous solutions. We also offer a robust portfolio of integrated information technology platforms for plasma customers to manage their donors, operations, and supply chain. Our products automate the donor interview and qualification process; streamline the workflow process in the plasma center; provide the controls necessary to evaluate donor suitability; determine the ability to release units collected; and manage unit distribution. With our software solutions, plasma collectors can manage processes across the plasma supply chain, react quickly to business changes, and identify opportunities to reduce costs.
Our plasma disposables product line represented 35.1%, 31.1%, and 30.1% of our total revenue in fiscal 2015, 2014 and 2013, respectively.
• | Blood Center |
The Blood Collection Market for Transfusion — There are millions of blood donations throughout the world every year that produce blood products for transfusion to surgical, trauma, or chronically ill patients. Patients typically receive only the blood components necessary to treat a particular clinical condition: for example, red cells to surgical patients, platelets to cancer patients, and plasma to trauma victims.
Platelet therapy is frequently used to alleviate the effects of chemotherapy and help patients with bleeding disorders. Red cells are often transfused to patients to replace blood lost during surgery. Red cells are also transfused to patients with blood disorders, such as sickle cell anemia or aplastic anemia. Plasma, in addition to its role in creating life-saving pharmaceuticals, is frequently transfused to trauma victims and to replace blood volume lost during surgery.
The demand for blood varies across the world. While overall we expect total demand to remain stable, demand in individual markets can vary greatly. Highly populated emerging market countries are seeing demand growth as they expand healthcare coverage. As greater numbers of people gain access to more advanced medical treatment, demand for blood components, plasma-derived drugs, and surgical procedures increases. In more mature markets, the development of less invasive, lower blood loss procedures and better blood management has offset the demand increases from aging populations. This is particularly true in the United States, where we saw collections decline by approximately 10% in fiscal 2015 and we expect this trend to moderate in fiscal 2016.
Most donations worldwide are manual whole blood donations. In this process, whole blood is collected from the donor and then transported to a laboratory where it is separated into its components: red cells, platelets and/or plasma.
2
In addition to manual collections, there is a significant market for automated component blood collections. In this procedure, the blood separation process is automated and occurs in “real-time” while a person is donating blood. In this separation method, only the specific blood component targeted is collected, and the remaining components are returned to the blood donor. Automated blood component collection allows significantly more of the targeted blood component to be collected during a donation event, especially red cells where our automated system supports collection of two units from eligible donors.
Haemonetics’ Blood Center Products — Today, Haemonetics offers automated blood component and manual whole blood collection systems to blood collection centers to collect blood products efficiently and cost effectively.
We market the MCS® (Multicomponent Collection System) brand apheresis equipment which is designed to collect specific blood components integrated from the donor. Utilizing the MCS® automated platelet collection protocols, blood centers collect one or more therapeutic “doses” of platelets during a single donation. The MCS® two-unit protocol or double red cell collection device helps blood collectors optimize the collection of red cells by automating the blood separation function, eliminating the need for laboratory processing, and enabling the collection of two units of red cells from a single donor thus maximizing the amount of red cells collected per eligible donor and helping to mitigate red cell shortages in countries where this problem exists. Blood collectors can also use the MCS® system to collect one unit of red cells and a "jumbo" (double) unit of plasma, or one unit of red cells and one unit of platelets from a single donor. The MCS® plasma protocol, which provides the possibility of collecting 600-800ml of plasma for either transfusion to patients or for use by the pharmaceutical industry, completes the comprehensive portfolio of different blood component collection options on this device.
With the whole blood acquisition, Haemonetics now also offers a portfolio of products for manual whole blood collection and processing. The assets acquired provide us with filter technology and manufacturing capability as well as a broad portfolio of manual collection, filtration and processing products. Haemonetics' portfolio of disposable whole blood collection and component storage sets offer flexibility in collecting a unit of whole blood and the subsequent production and storage of the red blood cell, platelet, and/or plasma products, including options for in-line or dockable filters for leukoreduction of any blood component. In addition, our innovative AcrodoseSM product line provides a closed system for the pooling, storage, and bacteria testing of leukoreduced whole blood derived platelet concentrates, an AcrodoseSM Platelet, that is “transfusion ready” for the hospital. Use of Acrodose platelets lowers hospital handling costs by eliminating the need for pooling and bacteria testing at the hospital.
With the ACP® (Automated Cell Processor) brand, Haemonetics offers a small bench-top solution to automate the washing and freezing of red cell components in the lab. The automated red cell washing procedure removes plasma proteins within the red cell units to provide a safer product for transfusion to frequently transfused patients, neonates, or patients with a history of transfusion reactions. The automated glycerolization and deglycerolization steps are required to prepare red cells for frozen storage. Freezing the red cell units can expand the shelf life of these products up to 10 years. Customers utilize this technology to implement strategic red cell inventories for catastrophe cases, storage of rare blood types, or enhanced inventory management.
Our blood center disposables product line represented 37.3%, 41.5%, and 40.1% of our total revenue in fiscal 2015, 2014 and 2013, respectively.
• | Hospital |
The Transfusion Market for Hospitals — Loss of blood is common in many surgical procedures, including open heart, trauma, transplant, vascular, and orthopedic procedures, and the need for transfusion of oxygen-carrying red cells to make up for lost blood volume is routine. Patients commonly receive donor blood, referred to as “allogeneic blood,” which carries various risks including risk of transfusion with the wrong blood type; risk of transfusion reactions including death, but more commonly chills, fevers or other side effects that can prolong a patient’s recovery; and risk of transfusion of blood with a blood-borne disease or infectious agent.
An alternative to allogeneic blood is surgical cell salvage, also known as autotransfusion, which reduces or eliminates a patient’s need for blood donated from others and ensures that the patient receives the freshest and safest blood possible — his or her own. Surgical cell salvage involves the collection of a patient’s own blood during and after surgery, for reinfusion of red cells to that patient. Blood is suctioned from the surgical site or collected from a wound or chest drain, processed and washed through a centrifuge-based system that yields concentrated red cells available for transfusion back to the patient. This process occurs in a sterile, closed-circuit, single-use consumable set that is fitted into an electromechanical device. We market our surgical blood salvage products to surgical specialists, primarily cardiovascular, orthopedic, and trauma surgeons, and to surgical suite service providers.
3
With the whole blood acquisition, Haemonetics now offers filtration products for the hospital. These filters are used during the blood transfusion process for reduction of particulate debris, fat globules and leukocytes in the blood components.
Haemonetics’ Hospital Products — Haemonetics offers a range of blood management solutions that significantly improve a hospital's systems for acquiring blood, storing it in the hospital, and dispensing it efficiently and correctly. Over the last few years, hospitals have become increasingly aware of their need to control costs and improve patient safety by managing blood more effectively. Our products and integrated solution platforms help hospitals optimize performance of blood acquisition, storage, and distribution.
Our TEG® Thrombelastograph Hemostasis Analyzer system is a blood diagnostic instrument that measures a patient's hemostasis or the ability to form and maintain blood clots. By understanding a patient’s clotting ability, clinicians can better plan for the patient’s care, deciding in advance whether to start or discontinue use of certain drugs or, determine the likelihood of the patient's need for a transfusion and which blood components will be most effective in stopping bleeding. Such planning supports better care, which can lead to lower hospital costs through a reduction in unnecessary donor blood transfusions, reduced adverse transfusion reactions, and shorter intensive care unit and hospital stays. We have launched our next generation device, the TEG 6s, in certain markets in Europe and Asia. In North America, our largest market for TEG, we will launch the TEG 6s upon receipt of the final 510(k) clearance by the FDA.
The Cell Saver® system is a surgical blood salvage system targeted to procedures that involve rapid, high-volume blood loss, such as cardiovascular surgeries. It has become the standard of care for high blood-loss surgeries. In fiscal 2012, we launched the Cell Saver® Elite® system, which is our most advanced autotransfusion option to minimize allogeneic blood use for surgeries with medium to high blood loss.
The OrthoPAT® surgical blood salvage system is targeted to orthopedic procedures, such as hip and knee replacements, which involve slower, lower volume blood loss that often occurs well after surgery. The system is designed to remain with the patient following surgery, to recover blood and produce a washed red cell product for autotransfusion. Its Quick-Connect feature permits customers to utilize the blood processing set selectively, depending on the patient's need.
Our hospital disposables product line represented 13.7%, 13.3%, and 14.7% of our total revenue in fiscal 2015, 2014 and 2013, respectively.
• | Software Solutions |
Haemonetics' Software Products and Services — We have a suite of integrated software solutions for improving efficiencies and helping ensure donor and patient safety. This includes solutions for blood drive planning, donor recruitment and retention, blood collection, component manufacturing and distribution, transfusion management, and remote blood allocation. For our plasma customers, we also provide information technology platforms for managing donors and information associated with the collection of plasma products and their processing within fractionation facilities. While each Haemonetics information technology platform can be used independently, our mission to provide "Arm to Arm®" blood management solutions means they can also work together through integration to further improve process workflows. Also, the ability to evaluate information based on the integration of these systems allows customers to continually improve their business processes. Leveraging information to make more informed decisions is a significant component of Haemonetics' overall commitment to improving blood management systems globally.
Blood Management Solutions — Combining software solutions with devices, we meet our goal of offering customers powerful tools for improving blood management while driving growth of our disposables. For example, a hospital may use our consulting services to analyze its transfusion practices and recommend improvements that result in improved blood management and reduced cost. Then, the hospital can leverage our systems and services to analyze blood utilization, manage blood inventory, and potentially reduce demand for donated blood. Finally, hospitals can use our IMPACT® Online blood management business intelligence portal to monitor the results of its new blood management practices. The positive patient impact and reduced costs from this integrated blood management approach can be significant. Likewise, by understanding best practices, blood demand, and discrete patient needs, hospitals can more frequently deploy our devices for hemostasis diagnosis and cell salvage to ensure best patient care.
While each of our products, platforms, and services can be marketed individually, our blood management solutions vision is to offer integrated closed-loop solutions for blood supply chain management. Our software solutions — information technology platforms and consulting services — can be combined with our devices and sold through our plasma, blood center, and hospital sales forces.
4
Our software products help hospitals track and safely deliver stored blood products. SafeTrace Tx® is our software solution that helps manage blood product inventory, perform patient cross-matching, and manage transfusions. In addition, our BloodTrack® suite of solutions manages tracking and control of blood products from the hospital blood center through to transfusion to the patient. “Smart” refrigerators located in or near operating suites, emergency rooms, and other parts of the hospital dispense blood units with secure control and automated traceability for efficient documentation. With our more comprehensive offerings, hospitals are better able to manage processes across the blood supply chain and identify increased opportunities to reduce costs and enhance processes. We released our new BloodTrack HaemoBank, which received 510(k), CE and multi-regional clearances, in fiscal 2015 and expect that this will further expand this solution's growth in fiscal 2016.
We believe a key example of our blood management solutions is the potential to balance blood demand with supply and mitigate shortages of blood components and reduce collection costs. Our software solutions, such as our SafeTrace® and El Dorado Donor® donation and blood unit management systems, span blood center operations and automate and track operations from the recruitment of the blood donor to the disposition of the blood product. Our Hemasphere® software solution provides support for more efficient blood drive planning, and Donor Doc® and e-Donor® software help to improve recruitment and retention. Combined, our solutions help blood collectors improve the safety, regulatory compliance, and efficiency of blood collection and supply.
Our software solutions product line represented 7.9%, 7.5%, and 7.8% of our total revenue in fiscal 2015, 2014 and 2013, respectively.
Marketing/Sales/Distribution
We market and sell our products to bio-pharmaceutical companies, blood collection groups and independent blood centers, hospitals and hospital service providers, group purchasing organizations and national health organizations through our own direct sales force (including full-time sales representatives and clinical specialists) as well as independent distributors. Sales representatives target the primary decision-makers within each of those organizations.
United States
In fiscal 2015, 2014 and 2013 approximately 54.4%, 53.4%, and 51.0%, respectively, of consolidated net revenues were generated in the U.S., where we primarily use a direct sales force to sell our products. See Note 15, Segment Information, to our consolidated financial statements contained in Item 8 for additional information.
Outside the United States
In fiscal 2015, 2014 and 2013 approximately 45.6%, 46.6%, and 49.0%, respectively, of consolidated net revenues were generated through sales to non-U.S. customers. Outside the United States, we use a combination of direct sales force and distributors. See Note 15, Segment Information, to our consolidated financial statement contained in Item 8 for additional information.
Research and Development
Our research and development centers in the United States and Switzerland ensure that protocol variations are incorporated to closely match local customer requirements. In addition, our Haemonetics Software Solutions also maintains development operations in Canada and France.
Customer collaborations are also an important part of our technical strength and competitive advantage. These collaborations with customers and transfusion experts provide us with ideas for new products and applications, enhanced protocols, and potential test sites as well as objective evaluations and expert opinions regarding technical and performance issues.
The development of blood component separation products and extracorporeal blood typing and screening systems has required us to maintain technical expertise in various engineering disciplines, including mechanical, electrical, software, and biomedical engineering and material science. Innovations resulting from these various engineering efforts enable us to develop systems that are faster, smaller, and more user-friendly, or that incorporate additional features important to our customer base.
Research and development expense was $54.2 million in fiscal 2015, $54.2 million in fiscal 2014 and $44.4 million in fiscal 2013, representing approximately 5.0% - 6.0% of our net sales each year.
In fiscal 2015, research and development resources were allocated to supporting next generation plasma collection and software systems, a new TEG® Thrombelastograph Hemostasis Analyzer, and several other enhancements to our legacy product portfolios.
5
Manufacturing
Our principal manufacturing operations are located in the United States, Mexico, Scotland and Switzerland.
These include facilities in Mexico and Puerto Rico purchased in 2012 as part of our acquisition of the whole blood business from Pall Corporation.
On May 1, 2013, we announced a plan to pursue identified Value Creation and Capture (“VCC”) opportunities. These
include: (i) investment in product line extensions, next generation products and growth platforms; (ii) enhancement of commercial execution capabilities by implementing go-to-market and other strategies to enable global profitable revenue growth; and (iii) transformation of the manufacturing network to best support these commercial strategies while optimizing expense levels. Collectively, these are opportunities to position us for increased competitiveness and growth.
Our manufacturing network transformation plan, part of our larger VCC activities previously discussed, includes (i) discontinuing manufacturing activities at our Braintree, Massachusetts, Ascoli-Piceno, Italy and Bothwell, Scotland facilities, (ii) creating a technology center of excellence for product development in Braintree, Massachusetts, (iii) expanding of our current facility in Tijuana, Mexico, (iv) engaging Sanmina Corporation as a contract manufacturer to produce certain medical equipment, and (v) building a new manufacturing facility in Penang, Malaysia closer to our customers in Asia.
Our VCC initiatives are moving forward according to plan, we have engaged Sanmina Corporation to be the sole manufacturer of certain equipment, and we have commenced production in our new manufacturing facility in Penang, Malaysia and in our expanded facility in Tijuana, Mexico allowing us to consolidate the manufacturing of product formerly produced in the U.S., Italy and Scotland.
In general, our production activities occur in controlled settings or “clean room” environments. Each step of the manufacturing and assembly process is quality checked, qualified, and validated. Critical process steps and materials are documented to ensure that every unit is produced consistently and meets performance requirements. Our equipment and disposable manufacturing sites are certified to the ISO 13485 standard and to the Medical Device Directive allowing placement of the CE mark of conformity.
Plastics are the principal component of our disposable products. Contracts with our suppliers help mitigate some of the short-term effects of price volatility in this market. However, increases in the price of petroleum derivatives could result in corresponding increases in our costs to procure plastic raw materials.
Contractors manufacture some component-sets and equipment according to our specifications. We maintain important relationships with two Japanese manufacturers that produce finished disposables in Singapore, Japan, and Thailand. We have also engaged Sanmina Corporation to be the sole manufacturer of certain equipment. Certain parts and components are purchased from sole source vendors. We believe that if necessary, alternative sources of supply are available in most cases, and could be secured within a relatively short period of time. Nevertheless, an interruption in supply could temporarily interfere with production schedules and affect our operations.
Our equipment is designed in-house and assembled by us or our contracted manufacturer from components that are manufactured to our specifications. The completed instruments are programmed, calibrated, and tested to ensure compliance with our engineering and quality assurance specifications. Inspection checks are conducted throughout the manufacturing process to verify proper assembly and functionality. When mechanical and electronic components are sourced from outside vendors, those vendors must meet detailed qualification and process control requirements.
Intellectual Property
We consider our intellectual property rights to be important to our business. We rely on patent, trademark, copyright, and trade secret laws, as well as provisions in our agreements with third parties, to protect our intellectual property rights. We hold patents in the United States and many international jurisdictions on some of our machines, processes, disposables and related technologies. These patents cover certain elements of our systems, including protocols employed in our equipment and certain aspects of our processing chambers and disposables. Our patents may cover current products, products in markets we plan to enter, or products in markets we plan to license, or the patents may be defensive in that they are directed to technologies not currently embodied in our current products. We may also license patent rights from third parties that cover technologies that we plan to use in our business. To maintain our competitive position, we rely on the technical expertise and know-how of our personnel and on our patent rights. We pursue an active and formal program of invention disclosure and patent application in both the United States and foreign jurisdictions. We own various trademarks that have been registered in the United States and certain other countries.
6
Our policy is to obtain patent and trademark rights in the U.S. and foreign countries where such rights are available and we believe it is commercially advantageous to do so. However, the standards for international protection of intellectual property vary widely. We cannot assure that pending patent and trademark applications will result in issued patents and registered trademarks, that patents issued to or licensed by us will not be challenged or circumvented by competitors, or that our patents will not be determined invalid.
Competition
We have established a record of innovation and leadership in each of the areas in which we compete. To remain competitive, we must continue to develop and acquire new cost-effective products, information technology platforms, and business services. We believe that our ability to maintain a competitive advantage will continue to depend on a combination of factors. Some factors are largely within our control such as: (i) maintenance of a positive reputation among our customers, (ii) development of new products which meet our customer's needs, (iii) obtaining regulatory approvals for our products in key markets, (iv) obtaining patents which protect our innovations, (v) development and protection of proprietary know-how in important technological areas, (vi) product quality, safety and cost effectiveness and (vii) continual and rigorous documentation of clinical performance. Other factors are outside of our control. We could see changes in regulatory standards or clinical practice which favor a competitor's technology or reduce revenues in key areas of our business.
In addition, we face competition from several large, global companies with product offerings similar to ours, such as Terumo BCT, Sorin Biomedica and Fresenius SE & Co. KGaA. Terumo and Fresenius, in particular, have significantly greater financial and other resources than we do and are strong competitors in a number of our businesses. The following provides an overview of the key competitors in each of our four global product categories.
• | Plasma |
In the automated plasma collection market, we principally compete with Fresenius, which acquired Fenwal, Inc. in November 2012, on the basis of quality, reliability, ease of use, services and technical features of the collection systems, and on the long-term cost-effectiveness of equipment and disposables. In China, the market is populated by local producers of a product that is intended to be similar to ours. Recently, those competitors have expanded to markets beyond China, into European and South American countries.
• | Blood Center |
We have several competitors in the Blood Center product lines, some of which compete across all blood components and others that are more specialized.
Terumo BCT, and Fresenius are our major competitors in platelet collection. In platelet collections, there are two areas of competition - automated collection and pooled random donor. In the automated collection area, competition is based on continual performance improvement, as measured by the time and efficiency of platelet collection and the quality of the platelets collected. Each of these companies has taken a different technological approach in designing their systems for automated platelet collection. In addition to automated platelet collection offerings, we now also compete in the pooled random donor platelet segment from whole blood collections from which pooled platelets are derived with the Acrodose product or buffy coat pooling sets.
Terumo BCT and Fresenius (following its acquisition of Fenwal in 2012) are also competitors in the automated red cell collection market. However, it is important to note that most double red cell collection is done in the U.S. and less than 10% of the red cells collected in the U.S. annually are collected via automation. Therefore, we also compete with the traditional method of collecting red cells from the manual collection of whole blood. As discussed in our Company Overview, we entered the whole blood collections market during fiscal 2013 through the acquisition of the whole blood business from Pall Corporation. We compete on the basis of total cost, type-specific collection, process control, product quality, and inventory management.
Our whole blood business faces competition on the basis of quality and price. In North America, Europe and Asia-Pacific our main competitors are Fresenius, MacoPharma and Terumo BCT. We do not have significant whole blood revenues in Japan today. We have a competitive cost advantage in the supply of filtration needed for leukoreduced whole blood collection because we are vertically integrated in the production of our own filters.
In the cell processing market, competition is based on the level of automation, labor-intensiveness, and system type (open versus closed). Open systems may be weaker in good manufacturing process compliance. Moreover, blood processed through open systems has a 24-hour shelf life. With the ACP® (automated cell processor) brand,
7
Haemonetics offers a closed system cell processor which gives blood processed through it, a 14-day shelf life. We compete with Terumo BCT's open systems in this market.
• | Hospital |
Within our hospital business, in the diagnostics market, the TEG Thrombelastograph Hemostasis Analyzer is used primarily in surgical applications. One direct competitor, ROTEM, is a competitor in Europe and in the United States. Other competitive technologies include standard coagulation tests and platelet function testing. The TEG analyzer competes with other laboratory tests based on its ability to provide a complete picture of a patient's hemostasis at a single point in time, and the ability to measure the clinically relevant platelet function for an individual patient.
In the intraoperative surgical blood salvage market, competition is based on reliability, ease of use, service, support, and price. For high-volume platforms, each manufacturer's technology is similar, and our Cell Saver technology competes principally with Sorin Biomedica, Medtronic, and Fresenius.
In the perioperative surgical blood salvage market, our OrthoPAT system competes primarily against (i) non-automated processing systems whose end product is an unwashed red blood cell unit for transfusion to the patient, (ii) transfusions of donated blood and (iii) coagulation therapies such as tranexamic acid.
• | Software Solution |
In the software market, we compete with MAK Systems, Mediware, Sunquest Information Systems and applications developed internally by our customers. These companies provide software to blood and plasma collectors and to hospitals for managing donors, collections, and blood units. None of these companies competes with Haemonetics' non-software products.
Our technical staff is highly skilled, but certain competitors have substantially greater financial resources and larger technical staffing at their disposal. There can be no assurance that competitors will not direct substantial efforts and resources toward the development and marketing of products competitive with those of Haemonetics.
Significant Customers
There were no customers that accounted for greater than 10% of our net revenues in fiscal 2015 and fiscal 2014.
Government Regulation
Medical Device Regulation
The products we manufacture and market are subject to regulation by the Center of Biologics Evaluation and Research (“CBER”) and the Center of Devices and Radiological Health (“CDRH”) of the United States Food and Drug Administration (“FDA”), and other non-United States regulatory bodies.
All medical devices introduced to the United States market since 1976 are required by the FDA, as a condition of marketing, to secure either a 510(k) pre-market notification clearance or an approved premarket approval application (“PMA”). In the United States, software used to automate blood center operations and blood collections and to track those components through the system are considered by the FDA to be medical devices, subject to 510(k) pre-market notification. Intravenous solutions (blood anticoagulants and solutions for storage of red blood cells) marketed by us for use with our manual collection and automated systems requires us to obtain an approved New Drug Application (“NDA”) or Abbreviated New Drug Application (“ANDA”) from the CBER. A 510(k) pre-market clearance indicates the FDA’s agreement with an applicant’s determination that the product for which clearance is sought is substantially equivalent to another legally marketed medical device. The process of obtaining a 510(k) clearance may involve the submission of clinical data and supporting information. The process of obtaining NDA approval for solutions is likely to take much longer than 510(k) clearances because the FDA review process is more complicated.
The FDA’s Quality System regulations set forth standards for our product design and manufacturing processes, require the maintenance of certain records and provide for inspections of our facilities. There are also certain requirements of state, local and foreign governments that must be complied with in the manufacturing and marketing of our products. We maintain customer complaint files, record all lot numbers of disposable products, and conduct periodic audits to assure compliance with FDA regulations. We place special emphasis on customer training and advise all customers that device operation should be undertaken only by qualified personnel.
8
The FDA can ban certain medical devices; detain or seize adulterated or misbranded medical devices; order repair, replacement or refund of these devices; and require notification of health professionals and others with regard to medical devices that present unreasonable risks of substantial harm to the public health. The FDA may also enjoin and restrain certain violations of the Food, Drug and Cosmetic Act and the Safe Medical Devices Act pertaining to medical devices, or initiate action for criminal prosecution of such violations.
We are also subject to regulation in the countries outside the United States in which we market our products. The member states of the European Union (EU) have adopted the European Medical Device Directives, which create a single set of medical device regulations for all EU member countries. These regulations require companies that wish to manufacture and distribute medical devices in EU member countries to obtain CE Marking for their products. Outside of the EU, many of the regulations applicable to our products are similar to those of the FDA. However, the national health or social security organizations of certain countries require our products to be registered by those countries before they can be marketed in those countries.
We have complied with these regulations and have obtained such registrations where we market our products. Federal, state and foreign regulations regarding the manufacture and sale of products such as ours are subject to change. We cannot predict what impact, if any, such changes might have on our business.
Conflict Minerals
The Dodd-Frank Wall Street Reform and Consumer Protection Act imposes disclosure requirements regarding the use of "Conflict Minerals" mined from the Democratic Republic of Congo and adjoining countries in products, whether or not these products are manufactured by third parties. The conflict minerals include tin, tantalum, tungsten and gold, and their derivatives. These requirements could affect the pricing, sourcing and availability of minerals used in the manufacture of our products. There will be additional costs associated with complying with the disclosure requirements, such as costs related to determining the source of any conflict minerals used in our products. Our supply chain is complex and we may be unable to verify the origins for all metals used in our products.
Other Regulation
We are also subject to various environmental, health and general safety laws, directives and regulations both in the U.S. and abroad. Our operations, like those of other medical device companies, involve the use of substances regulated under environmental laws, primarily in manufacturing and sterilization processes. We believe that sound environmental, health and safety performance contributes to our competitive strength while benefiting our customers, shareholders and employees.
Environmental Matters
Failure to comply with international, federal and local environmental protection laws or regulations could have an adverse impact on our business or could require material capital expenditures. We continue to monitor changes in U.S. and international environmental regulations that may present a significant risk to the business, including laws or regulations relating to the manufacture or sale of products using plastics.
Employees
As of March 28, 2015, we employed the full-time equivalent of 3,383 persons assigned to the following functional areas: manufacturing, 1,913; sales and marketing, 722; general and administrative, 278; research and development, 209; and quality control and field service, 261.
Availability of Reports and Other Information
All of our corporate governance materials, including the Principles of Corporate Governance, the Business Conduct Policy and the charters of the Audit, Compensation, and Nominating and Governance Committees are published on the Investor Relations section of our website at http://phx.corporate-ir.net/phoenix.zhtml?c=72118&p=irol-IRHome. On this web site the public can also access, free of charge, our annual, quarterly and current reports and other documents filed or furnished to the Securities and Exchange Commission, or SEC, as soon as reasonably practicable after we electronically file such material with, or furnish it to, the SEC.
Cautionary Statement Regarding Forward-Looking Information
Statements contained in this report, as well as oral statements we make which are prefaced with the words “may,” “will,” “expect,” “anticipate,” “continue,” “estimate,” “project,” “intend,” “designed,” and similar expressions, are intended to identify forward looking statements regarding events, conditions, and financial trends that may affect our future plans of operations, business strategy, results of operations, and financial position. These statements are based on our current expectations and estimates as to prospective events and circumstances about which we can give no firm assurance. Further, any forward-looking
9
statement speaks only as of the date on which such statement is made, and we undertake no obligation to update any forward-looking statement to reflect events or circumstances after the date on which such statement is made. As it is not possible to predict every new factor that may emerge, forward-looking statements should not be relied upon as a prediction of our actual future financial condition or results. These forward-looking statements, like any forward-looking statements, involve risks and uncertainties that could cause actual results to differ materially from those projected or anticipated, including: the effects of disruption from the manufacturing transformation making it more difficult to maintain relationships with employees and timely deliver high quality products, unexpected expenses incurred during our VCC initiatives, technological advances in the medical field and standards for transfusion medicine, our ability to successfully implement products that incorporate such advances and standards, demand for whole blood and blood components, product quality, market acceptance, regulatory uncertainties, the ability of our contract manufacturing vendors to timely supply high quality goods, the effect of economic and political conditions, the impact of competitive products and pricing, blood product reimbursement policies and practices, foreign currency exchange rates, changes in customers’ ordering patterns including single-source tenders, the effect of industry consolidation as seen in the plasma and blood center markets, the effect of communicable diseases and the effect of uncertainties in markets outside the U.S. (including Europe and Asia) in which we operate and such other risks described under Item 1A. Risk Factors included in this report. The foregoing list should not be construed as exhaustive.
10
ITEM 1A. RISK FACTORS
In addition to the other information contained in this Annual Report and the exhibits hereto, the following risk factors should be considered carefully in evaluating our business. Our business, financial condition, cash flows or results of operations could be materially adversely affected by any of these risks. This section contains forward-looking statements. You should refer to the explanation of the qualifications and limitations on forward-looking statements at the end of Item 1 and Item 7 of this Annual Report.
If we are unable to successfully expand our product lines through internal research & development and acquisitions, our business may be materially and adversely affected.
Continued growth of our business depends on our maintaining a pipeline of profitable new products and successful improvements to our existing products. This requires accurate market analysis and carefully targeted application of intellectual and financial resources toward technological innovation or acquisition of new products. The creation and adoption of technological advances is only one step. We must also efficiently develop the technology into a product which confers a competitive advantage, represents a cost effective solution or provides improved patient care. Finally, as a part of the regulatory process of obtaining marketing clearance for new products, we conduct and participate in numerous clinical trials, the results of which may be unfavorable, or perceived as unfavorable by the market, and could have a material adverse effect on our business, financial condition or results of operations.
The risks of missteps and set backs are an inherent part of the innovation and development processes in the medical device industry.
If we are unable to successfully grow our business through business relationships and acquisitions, our business may be materially and adversely affected.
Promising partnerships and acquisitions may not be completed for reasons such as competition among prospective partners or buyers, our inability to reach satisfactory terms, or the need for regulatory approvals. Any acquisition that we complete may be dilutive to earnings and require the investment of significant resources. The economic environment may constrain our ability to access the capital needed for acquisitions and other capital investments.
A significant portion of our revenue derives from the sale of blood collection supplies. Future declines in the number of blood collection procedures may have an adverse effect on our business, financial condition and results of operations.
Sales to blood collectors represented 43.3% of our consolidated disposables revenues in fiscal 2015. In certain markets, changes in medical protocols and the development of less invasive, lower blood loss procedures has reduced the number of transfusions of red blood cells, which has in turn led to a decline in the number of blood collection procedures. This is particularly true in the United States where we saw collections decline by approximately 10% in fiscal 2014 and 2015, however we expect this trend to moderate in fiscal 2016. If we are unable to gain and maintain higher market share, lower procedure levels could result in lower net revenues and higher product costs.
Consolidation of the healthcare providers and blood collectors has increased demand for price concessions and caused the exclusion of suppliers from significant market segments, which could have an adverse effect on our business, financial condition and results of operations.
The costs of healthcare in the United States have risen significantly over the past decade. Numerous initiatives and reform by legislators, regulators and third-party payers to curb these costs has reduced reimbursement rates which is causing hospitals to consolidate into larger integrated delivery networks and group purchasing organizations in an effort to reduce administrative costs and increase purchasing power. This consolidation has resulted in greater pricing pressure on suppliers, decreased average selling prices and a greater number of sole source relationships. This pressure impacts our Hospital and Blood Center businesses.
The expansion among hospitals in the United States of group purchasing organizations, integrated delivery networks and large single accounts directly puts price pressure on our Hospital business. It also puts price pressure on our United States Blood Center customers who are also facing reduced demand for red cells. Our Blood Center customers have responded to this pressure by creating their own group purchasing organizations and resorting to single source tenders to create incentives for suppliers, including us, to significantly reduce prices.
We expect that market demand, government regulation, third-party reimbursement policies, government contracting requirements and societal pressures will continue to change the worldwide healthcare industry, resulting in further business consolidations and alliances among our customers and competitors. This may exert further downward pressure on the prices of our products and adversely impact our business, financial condition or results of operations.
11
Quality problems with our processes, goods, and services could harm our reputation for producing high-quality products and erode our competitive advantage, sales, and market share.
Quality is extremely important to us and our customers due to the serious and costly consequences of product failure. Our quality certifications are critical to the marketing success of our products and services. If we fail to meet these standards or fail to adapt to evolving standards, our reputation could be damaged, we could lose customers, and our revenue and results of operations could decline.
As approximately half of our revenue comes from outside the United States, we are subject to currency fluctuation, geopolitical risk, economic volatility, anti-corruption laws, export and import restrictions, local regulatory authorities and the laws and medical practices in foreign jurisdictions.
We do business in over 100 countries and have distributors in approximately 90 countries. This exposes us to currency fluctuation, geopolitical risk, economic volatility, anti-corruption laws, export and import restrictions, local regulatory authorities and the laws and medical practices in foreign jurisdictions.
If there are sanctions or restrictions on the flow of capital which prevent product importation or receipt of payments in Russia or China, our business could be adversely affected.
Our international operations are governed by the U.S. Foreign Corrupt Practices Act (FCPA) and other similar anti-corruption laws in other countries. Generally, these laws prohibit companies and their business partners or other intermediaries from making improper payments to foreign governments and government officials in order to obtain or retain business. Global enforcement of such anti-corruption laws has increased in recent years, including aggressive investigations and enforcement proceedings. While we have an active compliance program and various other safeguards to discourage impermissible practices, we have distributors in 90 countries, several of which are considered high risk for corruption. As a result, our global operations carry some risk of unauthorized impermissible activity on the part of one of our distributors, employees, agents or consultants. Any alleged or actual violation could subject us to government scrutiny, severe criminal or civil fines, or sanctions on our ability to export product outside the U.S., which could adversely affect our reputation and financial condition.
Export of U.S. technology or goods manufactured in the United States to some jurisdictions requires special U.S. export authorization or local market controls that may be influenced by factors, including political dynamics, outside our control.
Finally, any other significant changes in the competitive, legal, regulatory, reimbursement or economic environments of the jurisdictions in which we conduct our international business could have a material impact on our business.
An interruption in our ability to manufacture our products or an inability to obtain key components or raw materials may adversely affect our business.
Certain key products are manufactured at single locations, with limited alternate facilities. If an event occurs that results in damage to one or more of our facilities, we may be unable to manufacture the relevant products at previous levels or at all. In addition, for reasons of quality assurance or cost effectiveness, we purchase certain finished goods, components and raw materials from sole suppliers, notably JMS Co. Ltd., Kawasumi Laboratories and Sanmina Corporation. Due to the stringent regulations and requirements of the FDA and other similar non-U.S. regulatory agencies regarding the manufacture of our products, we may not be able to quickly establish additional or replacement sources for certain components or materials. A reduction or interruption in manufacturing, or an inability to secure alternative sources of raw materials or components, could have a material adverse effect on our business, results of operations, financial condition and cash flows.
If we are unable to meet our debt obligations or experience a disruption in our cash flows, it could have an adverse effect on our financial condition, results of operations, ability to complete our share repurchase program or cost of borrowing.
We have $429.4 million in debt outstanding at March 28, 2015 which was incurred to acquire the whole blood business. The obligations to pay interest and repay the borrowed amounts may restrict our ability to adjust to adverse economic conditions, our ability to fund working capital, capital expenditures, acquisition or other general corporate requirements. The interest rate on the loan is variable and subject to change based on market forces. Fluctuations in interest rates could adversely affect our profitability and cash flows.
In addition, as a global corporation we have significant cash reserves held in foreign countries. These balances may not be immediately available to repay our debt.
Our credit facilities contain financial covenants that require us to maintain specified financial ratios and make interest and principal payments. If we are unable to satisfy these covenants, we may be required to obtain waivers from our lenders and no assurance can be made that our lenders would grant such waivers on favorable terms, or at all, and we could be required to repay any borrowed amounts on short notice.
12
As a medical device manufacturer we are subject to a number of laws and regulations. Non-compliance with those laws or regulations could adversely affect our financial condition and results of operations.
The manufacture, distribution and marketing of our products are subject to regulation by the FDA and other non-United States regulatory bodies. We must obtain specific regulatory clearance prior to selling any new product or service, a process which is costly and time consuming. If we are unable to obtain the necessary regulatory clearance we will be unable to introduce new enhanced product. Our operations are also subject to continuous review and monitoring by the FDA and other regulatory authorities. Failure to substantially comply with applicable regulations could subject our products to recall or seizure by government authorities, or an order to suspend manufacturing activities. If our products were determined to have design or manufacturing flaws, this could result in their recall or seizure. Either of these situations could also result in the imposition of fines.
Many of our competitors have significantly greater financial means and resources, which may allow them to more rapidly develop new technologies and more quickly address changes in customer requirements.
Our ability to remain competitive depends on a combination of factors. Certain factors are within our control such as reputation, regulatory approvals, patents, unpatented proprietary know-how in several technological areas, product quality, safety, cost effectiveness and continued rigorous documentation of clinical performance. Other factors are outside of our control such as regulatory standards, medical standards, reimbursement policies and practices, and the practice of medicine.
Loss of a significant customer could adversely affect our business.
In fiscal 2015, although no one customer represented more than 10% of our revenues, our ten largest customers accounted for approximately 48.1% of our revenue. If any of our largest customers materially reduce their purchases from us or terminate their relationship with us for any reason, we could experience an adverse effect on our results of operations or financial condition.
We may not realize the expected benefits from our Value Creation and Capture initiatives; our plans will result in higher short-term expenses and require more cash expenditures.
In May 2013, we announced a multi-year Value Creation and Capture initiatives which is intended to reduce our manufacturing costs by changing our current manufacturing footprint and supply chain strategy. This program has reduced manufacturing costs and improved supply chain efficiency and we expect further benefits upon completion. However, there are no assurances these further cost savings or supply chain efficiencies will be achieved, and completion of the program could introduce risks such as management distraction, business disruption, and attrition beyond our planned reduction in workforce and reduced employee productivity which may reduce our revenue or increase our costs. In addition, the activities involve the relocation of several product lines to new manufacturing facilities. During these transitions, we may experience challenges in transferring production to the new locations, additional costs, or unacceptable quality. These may lead to additional working capital, warranty or inventory costs. Finally, implementing the program will result in charges and expenses that impact our operating results and increase our level of capital expenditures. We expect the investment in this program to be completed in fiscal 2016.
Current or worsening economic conditions may adversely affect our business and financial condition.
A portion of our trade accounts receivable outside the United States include sales to government-owned or supported healthcare systems in several countries, which are subject to payment delays. Payment is dependent upon the financial stability and creditworthiness of those countries’ national economies. Worsening economic conditions may lead to the rationing of care or reduced order patterns. Although, we have not incurred significant losses on government receivables to date, we continually evaluate all government receivables for potential collection risks associated with the availability of government funding and reimbursement practices. If the financial condition of customers or the countries’ healthcare systems deteriorate such that their ability to make payments is uncertain, allowances may be required in future periods.
As a global corporation, we are exposed to fluctuations in currency exchange rates, which could adversely affect our cash flows and results of operations.
International revenues and expenses account for a substantial portion of our operations and we intend to continue expanding our presence in international markets. In fiscal 2015, our international revenues accounted for 45.6% of our total revenues. The exposure to fluctuations in currency exchange rates takes different forms. Reported revenues, as well as manufacturing and operational costs denominated in foreign currencies by our international businesses, fluctuate due to exchange rate movement when translated into U.S. dollars for financial reporting purposes. Fluctuations in exchange rates could adversely affect our profitability in U.S. dollars of products and services sold by us into international markets, where payment for our products and services and related manufacturing and operational costs is made in local currencies.
13
We may record future goodwill impairment charges or other asset impairment charges, which could materially adversely impact our results of operations.
Goodwill is reviewed for impairment at least annually in accordance with ASC Topic 350, Intangibles - Goodwill and Other, or on an interim basis between annual tests when events or circumstances indicate that it is more likely than not that the fair value is less than its carrying value. We perform our annual impairment test on the first day of the fiscal fourth quarter. We first perform a qualitative test and if necessary, perform a quantitative test. The quantitative test is based on a discounted cash flow analysis or other valuation techniques, such as the market approach. We review intangible assets subject to amortization at least annually or more frequently if certain conditions arise to determine if any adverse conditions exist that would indicate that the carrying value of an asset or asset group may not be recoverable, or that a change in the remaining useful life is required. If an impairment indicator exists, we test the intangible asset for recoverability.
Goodwill impairment charges or other asset impairment charges could materially adversely impact our results of operations in the period in which they are recorded. Refer to Critical Accounting Policies within our Management's Discussion and Analysis of Financial Condition and Results of Operations contained in Item 7 of this Annual Report on Form 10-K for a discussion of key assumptions used in our testing.
We are subject to the risks associated with communicable diseases. A significant outbreak of a disease could reduce the demand for our products and affect our ability to provide our customers with products and services.
An eligible donor’s willingness to donate is affected by concerns about their personal health and safety. Concerns about communicable diseases (such as pandemic flu, SARS, or HIV) could reduce the number of donors, and accordingly reduce the demand for our products for a period of time. A significant outbreak of a disease could also affect our employees’ ability to work, which could limit our ability to produce product and service our customers.
There is a risk that the Company’s intellectual property may be subject to misappropriation in some countries.
Certain countries, particularly China, do not enforce compliance with laws that protect intellectual property (“IP”) rights with the same degree of vigor as is available under the U.S. and European systems of justice. Further, certain of the Company’s IP rights are not registered in China, or if they were, have since expired. This may permit others to produce copies of products in China that are not covered by currently valid patent registrations. There is also a risk that such products may be exported from China to other countries.
In order to aggressively protect our IP throughout the world, we have a program of patent disclosures and filings in markets where we conduct significant business. While we believe this program is reasonable and adequate, the risk of loss is inherent in litigation as different legal systems offer different levels of protection to IP, and it is still possible that even patented technologies may not be protected absolutely from infringement.
Pending and future intellectual property litigation could be costly and disruptive to us.
We operate in an industry that is susceptible to significant intellectual property litigation. This type of litigation is expensive, complex and lengthy and its outcome is difficult to predict. Patent litigation may result in adverse outcomes and could significantly divert the attention of our technical and management personnel.
The technologies that support our products are the subject of active patent prosecution.
There is a risk that one or more of our products may be determined to infringe a patent held by another party. If this were to occur we may be subject to an injunction or to payment of royalties, or both, which may adversely affect our ability to market the affected product(s). In addition, competitors may patent technological advances which may give them a competitive advantage or create barriers to entry.
We sell our products in certain emerging economies.
There are risks with doing business in emerging economies, such as Brazil, Russia, India and China. These economies tend to have less mature product regulatory systems, and more volatile financial markets. In addition, the government controlled health care system's ability to invest in our products and systems may abruptly shift due to changing government priorities or funding capacity. Our ability to sell products in these economies is dependent upon our ability to hire qualified employees or agents to represent our products locally, and our ability to obtain and maintain the necessary regulatory approvals in a less mature regulatory environment. If we are unable to retain qualified representatives or maintain the necessary regulatory approvals, we will not be able to continue to sell products in these markets. We are exposed to a higher degree of financial risk if we extend credit to customers in these economies.
14
In many of the international markets in which we do business, including certain parts of Europe, South America, the Middle East, Russia and Asia, our employees, agents or distributors offer to sell our products in response to public tenders issued by various governmental agencies.
There is additional risk in selling our products through agents or distributors, particularly in public tenders. If they misrepresent our products, do not provide appropriate service and delivery, or commit a violation of local or U.S. law, our reputation could be harmed, and we could be subject to fines, sanctions or both.
We have a complex global supply chain which includes key sole source suppliers.
We have a complex global supply chain which involves integrating key suppliers and our manufacturing capacity into a global movement of components and finished goods.
We have certain key suppliers, including JMS Co. Ltd. ("JMS"), Kawasumi Laboratories ("Kawasumi") and Sanmina Corporation, who have their own complex supply chains. JMS and Kawasumi make certain finished goods and important sub components in locations throughout Asia. We have engaged Sanmina Corporation to be the sole manufacturer of certain equipment as part of our manufacturing network optimization activities.
Any disruption to one or more of our suppliers’ production or delivery of sufficient volumes of subcomponents conforming to our specifications could disrupt or delay our ability to deliver finished products to our customers. For example, we purchase components in Asia for use in manufacturing in the United States, Puerto Rico, Mexico and Scotland. We also regularly ship finished goods from the United States, Puerto Rico, Mexico and Scotland to Europe and Asia.
Plastics are the principal component of our disposables, which are the main source of our revenues. Any change in the price, composition or availability of the plastics we purchase could adversely affect our business.
We have three risks with this key raw material: price, composition and availability.
Increases in the price of petroleum derivatives could result in corresponding increases in our costs to procure plastic raw materials. Increases in the costs of other commodities may affect our procurement costs to a lesser degree.
The composition of the plastic we purchase is also important. Today, we purchase plastics which contain phthalates, which are used to make plastic malleable. Should plastics with phthalates become unavailable due to regulatory changes, we may be required to obtain new FDA or foreign approvals for a number of products.
While we have not experienced shortages in the past, any interruption in the supply for certain plastics could have a material impact on our business by limiting our ability to manufacture and sell the products which represent a significant portion of our revenues.
Our products are made with materials which are subject to regulation by governmental agencies.
Environmental regulations may prohibit the use of certain compounds in products we market and sell in regulated markets. If we are unable to substitute suitable materials into our processes, our manufacturing operations may be disrupted. In addition, we may be obligated to disclose the origin of certain materials used in our products, including but not limited to, metals mined from locations which have been the site of human rights violations.
We are entrusted with sensitive personal information relating to surgical patients, blood donors, employees and other persons in the course of operating our business and serving our customers.
Government agencies require that we implement measures to ensure the integrity and security of such personal data and, in the event of a breach of protocol, we inform affected individuals. If our systems are not properly designed or implemented, or should suffer a breach of security or an intrusion (e.g., “hacking”) by unauthorized persons, the Company’s reputation could be harmed, and it could incur costs and liabilities to affected persons and enforcement agencies.
We rely on the proper function, availability and security of information technology systems to operate our business and to serve our customers and a cyber-attack or other breach of these systems could have a material adverse effect on our business, financial condition or results of operations.
We rely on information technology systems to process, transmit, and store electronic information in our day-to-day operations. Similar to other large multi-national companies, the size and complexity of our information technology systems makes them vulnerable to a cyber-attack, malicious intrusion, breakdown, destruction, loss of data privacy, or other significant disruption. Our information systems require an ongoing commitment of significant resources to maintain, protect, and enhance existing systems and develop new systems to keep pace with continuing changes in information processing technology, evolving systems and regulatory standards, the increasing need to protect patient and customer information, and changing customer patterns. In addition, third parties may attempt to hack into our products to obtain data relating to patients with our products or
15
our proprietary information. Any failure by us to maintain or protect our information technology systems and data integrity, including from cyber-attacks, intrusions or other breaches, could result in the unauthorized access to patient data and personally identifiable information, theft of intellectual property or other misappropriation of assets, or otherwise compromise our confidential or proprietary information and disrupt our operations. Any of these events, in turn, may cause us to lose existing customers, have difficulty preventing, detecting, and controlling fraud, have disputes with customers, physicians, and other health care professionals, be subject to legal claims and liability, have regulatory sanctions or penalties imposed, have increases in operating expenses, incur expenses or lose revenues as a result of a data privacy breach or theft of intellectual property, or suffer other adverse consequences, any of which could have a material adverse effect on our business, financial condition or results of operations.
We operate in an industry susceptible to significant product liability claims.
Our products are relied upon by medical personnel in connection with the treatment of patients and the collection of blood from donors. In the event that patients or donors sustain injury or death in connection with their condition or treatment, we, along with others, may be sued, and whether or not we are ultimately determined to be liable, we may incur significant legal expenses. These claims may be brought by individuals seeking relief on their own behalf or purporting to represent a class. In addition, product liability claims may be asserted against us in the future based on events we are not aware of at the present time.
In addition, such litigation could damage our reputation and, therefore, impair our ability to market our products, obtain professional or product liability insurance, or increase the cost of such insurance. While we believe that our current product liability insurance coverage is sufficient, there is no assurance that such coverage will be adequate to cover incurred liabilities or that we will be able to obtain acceptable product and professional liability coverage in the future.
16
ITEM 1B. UNRESOLVED STAFF COMMENTS
None.
ITEM 2. PROPERTIES
Our headquarters facility, which the Company owns, is located on 14 acres in Braintree, Massachusetts. This facility is located in a light industrial park and was constructed in the 1970s. The building is approximately 180,000 square feet, of which 70,000 square feet are devoted to manufacturing and quality control operations, 35,000 square feet to warehousing, 72,000 square feet for administrative and research, development and engineering activities.
The Company leases approximately 82,000 square foot facility in Leetsdale, Pennsylvania. This facility is used for warehousing, distribution and manufacturing operations supporting our plasma business. Annual lease expense is approximately $0.4 million for this facility.
The Company owns approximately 100,000 square feet in Draper, Utah. This facility is used for distribution and manufacturing operations supporting our plasma business. During fiscal 2015, the Company purchased this facility for $6.6 million.
The Company owns a facility in Union, South Carolina. This facility is used to manufacture sterile solutions that support our blood center and plasma businesses. The facility is approximately 69,000 square feet.
The Company leases a facility in Niles, Illinois, which performs research and manufacturing for the Company. This facility is approximately 16,000 square feet of office and manufacturing space. Annual lease expense is approximately $0.2 million.
The Company leases a facility in Fajardo, Puerto Rico that is approximately 115,000 square feet under an agreement with Pall Corporation executed in connection with the Company's acquisition of Pall's transfusion medicine business on August 1, 2012. This facility is used for production of blood filters.
The Company owns two facilities in Covina, California that occupy approximately 71,000 square feet, dedicated to manufacturing and engineering functions. The facilities also include general administration space. The Company also leases approximately 40,000 square feet of space for warehousing and logistic operations. Annual lease expense is approximately $0.3 million. These facilities are used for the production of whole blood collection kits.
The Company leases approximately 166,000 square feet in Nashville, TN. This facility is used for warehousing and distribution. Annual lease expense is approximately $0.4 million for this facility.
The Company owns a facility in Bothwell, Scotland used to manufacture disposable products for our European and Asian customers. This facility is approximately 40,000 square feet. During fiscal 2015, the Company announced it will discontinue manufacturing activities at this location as part of its VCC initiatives.
The Company owns a facility in Ascoli, Italy, used for the production of whole blood collection kits. This facility is approximately 87,000 square feet. During fiscal 2014, the Company discontinued manufacturing activities at this location as part of its VCC initiatives.
The Company leases 127,000 square feet of space in Tijuana, Mexico with an Annual lease expense of approximately $0.7 million. The Company also owns a facility in Tijuana, Mexico that is approximately 182,000 square feet. These facilities are used for the production of whole blood collection kits, blood center and hospital disposables, and intra-plant components.
The Company owns approximately 240,000 square feet of space in Penang, Malaysia used to manufacture disposable products for our European and Asian customers. The facility was completed in February, 2015. The Company leases the land on which the facility was built and the lease payments have been prepaid. The lease term of 30 years expires in 2043 with an option to renew for a period of no less than 10 years.
The Company leases approximately 26,000 square feet of office space in Signy, Switzerland. This facility is used for sales, marketing, finance and other administrative services, as well as supply chain and procurement management activities related to our manufacturing operations. Annual lease expense for this space is approximately $0.9 million.
The Company also leases administration, sales, marketing, service, and distribution facilities in locations around the world.
ITEM 3. LEGAL PROCEEDINGS
We are presently engaged in various legal actions, and although our ultimate liability cannot be determined at the present time, we believe, based on consultation with counsel, that any such liability will not materially affect our consolidated financial position or our results of operations.
17
Italian Employment Litigation
Our Italian manufacturing subsidiary is party to several actions initiated by employees of the facility in Ascoli-Piceno, Italy where we have ceased manufacturing operations. These include actions claiming (i) working conditions and minimum salaries should have been established by either a different classification under their national collective bargaining agreement or a different agreement altogether, (ii) certain solidarity agreements, which are arrangements between the Company, employees and the government to continue full pay and benefits for employees who would otherwise be terminated in times of low demand, are void, and (iii) payment of the extra time used for changing into and out of the working clothes at the beginning and end of each shift.
In addition, a union represented in the Ascoli plant has filed an action claiming that the Company discriminated against it in favor of three other represented unions by (i) interfering with an employee referendum, (ii) interfering with an employee petition to recall union representatives from office, and (iii) excluding the union from certain meetings.
Finally, we have been added as defendants on claims filed against Pall Corporation prior to our acquisition of the plant in August 2012. These claims relate to agreements to "freeze" benefit allowances for a certain period in exchange for Pall's commitments on hiring and plant investment.
As of March 28, 2015, the total amount of damages claimed by the plaintiffs in these matters is approximately $3.7 million; however, it is not possible at this point in the proceedings to accurately evaluate the likelihood or amount of any potential losses. We may receive other similar claims in the future.
ITEM 4. MINE SAFETY DISCLOSURES
None.
ITEM 4A. EXECUTIVE OFFICERS
Executive Officers of the Registrant
The information concerning our Executive Officers is as follows. Executive officers are elected by and serve at the discretion of our Board of Directors. There are no family relationships between any director or executive officer and any other director or executive officer of Haemonetics Corporation.
PETER ALLEN (age 56), President, Global Plasma joined Haemonetics in 2003 as President of the Donor Division. In March 2008, Mr. Allen was appointed Chief Marketing Officer. In October 2011, he was promoted to President of Global Plasma. Prior to joining Haemonetics, Mr. Allen was Vice President of The Aethena Group, a private equity firm providing services to the global healthcare industry. From 1998 to 2001, he held various positions including Vice President of Sales and the Oncology Business at Syncor International, a provider of radiopharmaceutical and comprehensive medical imaging services. Previously, Mr. Allen held executive level positions in sales, marketing, and operations in DataMedic, Inc., Enterprise Systems, Inc./HBOC, and Robertson Lowstuter, Inc. Mr. Allen has also worked in sales and marketing at American Hospital Supply Corporation and Baxter International, Inc.
BRIAN BURNS (age 51) Executive Vice President, Global Quality and Regulatory Affairs joined Haemonetics in January 2014. Mr. Burns most recently held the position of Senior Vice President, North America QA, RA for Fresenius Medical Corporation, Dialysis Division, where he was also the Corporate Management Representative. Brian was previously with Boston Scientific as Executive Vice President, Global QA, RA and Safety. During his tenure, he held leadership positions at the Senior Vice President and Vice President levels with accountability and expertise in global quality, CAPA, Complaints, Clinical, and Regulatory functions.
BRIAN CONCANNON (age 57) , President and Chief Executive Officer joined Haemonetics in 2003 as the President, Patient Division and was promoted to President, Global Markets in 2006. In 2007, Mr. Concannon was promoted to Chief Operating Officer and in April 2009, Mr. Concannon was promoted to President and Chief Executive Officer, and elected to the Haemonetics Board of Directors. Immediately prior to joining the Company, Mr. Concannon was the President, Northeast Region, for Cardinal Health Medical Products and Services where he was employed since 1998. From 1985 to 1998, he was employed by American Hospital Supply Corporation, Baxter Healthcare Corp and Allegiance Healthcare in a series of sales and operations management positions of increasing responsibility. He has served in leadership roles within the healthcare industry for more than 30 years. Mr. Concannon is also a member of the board of directors of CONMED Corporation since July 2013, a member of the board of directors of South Shore Health & Educational Corporation since January 2014, and is the Chairman of the Board of My Brother’s Keeper. Mr. Concannon is a 1979 graduate of West Point.
18
KENT DAVIES (age 52), Chief Operating Officer joined Haemonetics as President, Global Markets in April 2014. In April 2015, he was promoted to Chief Operating Officer. In this role, he is responsible for worldwide oversight of all of Haemonetics’ commercial operations, including product development and product management. Previously, Mr. Davies was the Chief Executive Officer of RoundTable Healthcare Partners' RoundTable III Platform Development Corporation ("RPDC") where he focused on the identification and development of new investment opportunities in the medical device market. Prior to RPDC, he held executive roles of increasing responsibility, including Chief Executive Officer of Gaymar Industries, a privately held medical device and equipment company that was acquired by Stryker Corp., Division President and corporate officer of publicly-traded Solutia, Inc., in addition to a variety of global general management, commercial, and product leadership roles with Kimberly-Clark Healthcare and 3M Healthcare, amongst a number of other successful business growth and leadership roles throughout his career. Mr. Davies holds a Bachelor of Arts degree from the University of California, Berkeley, an MBA from the University of Minnesota, and has completed advanced course work in Finance at The Wharton School at the University of Pennsylvania.
SUSAN HANLON (age 47), Vice President Finance and Chief Accounting Officer joined our Company in 2002 as Vice President and Corporate Controller. In 2004, she was promoted to Vice President Planning and Control, and in 2008, Ms. Hanlon was promoted to Vice President Finance. She presently has responsibility for Controllership, Financial Planning, Tax, and Treasury. Prior to joining Haemonetics, Ms. Hanlon was a partner with Arthur Andersen LLP in Boston.
DAVID HELSEL (age 51) Executive Vice President, Global Manufacturing joined Haemonetics as Vice President of Global Manufacturing in March 2012, and is responsible for worldwide oversight of the Company’s manufacturing and supply chain organizations. Mr. Helsel was previously with Covidien, Ltd. for 16 years, where he most recently was Vice President of Operations for the Surgical Solutions global business unit. During his tenure with Covidien, his previous roles included Vice President of Operations for the Medical Supplies segment and Global Director of Operational Excellence – Manufacturing. Mr. Helsel holds a Bachelor of Science degree in Mechanical Engineering from LeTourneau University.
SANDRA JESSE (age 62) Chief Legal Officer joined Haemonetics as Vice President, Chief Legal Officer in September 2011, and is responsible for the company’s world-wide Legal, Compliance and Corporate Audit and Controls groups. Ms. Jesse was previously the Executive Vice President and Chief Legal Officer of Blue Cross Blue Shield of Massachusetts, a Partner in the Boston law firm of Choate, Hall and Stewart, and Press Secretary for United States Congressman, Lee Hamilton. She has served on a number of Boards of Directors, including the New England Legal Foundation, Longy School of Music, Boston Harbor Island Alliance and the Landmark School. Ms. Jesse is a former President of the Boston Bar Foundation.
CHRISTOPHER LINDOP (age 57) Executive Vice President, Business Development and Chief Financial Officer joined Haemonetics in January of 2007 as Chief Financial Officer. In 2007, Mr. Lindop assumed responsibility for business development. Prior to joining Haemonetics, he was Chief Financial Officer at Inverness Medical Innovations, a rapidly growing global developer of advanced consumer and professional diagnostic products from 2003 to 2006. Prior to this, Mr. Lindop was a Partner in the Boston offices of Ernst & Young LLP and Arthur Andersen LLP.
DR. JONATHAN WHITE (age 55) Chief Science and Technology Officer joined Haemonetics in 2008 as Vice President of Research and Development. Dr. White joined Haemonetics from Pfizer where he held a number of roles including Chief Information Officer. He previously worked at McKinsey and Company in New York. Dr. White is a Fellow of the Royal College of Surgery in England.
19
PART II
ITEM 5. MARKET FOR THE REGISTRANT'S COMMON EQUITY, RELATED STOCKHOLDER MATTERS AND ISSUER PURCHASES OF EQUITY SECURITIES
Market Information
Our common stock is listed on the New York Stock Exchange under the symbol HAE. The following table sets forth for the periods indicated the high and low sales prices of such common stock, which represent actual transactions as reported by the New York Stock Exchange.
First Quarter | Second Quarter | Third Quarter | Fourth Quarter | ||||||||||||
Fiscal year ended March 28, 2015: | |||||||||||||||
Market price of Common Stock: | |||||||||||||||
High | $ | 35.73 | $ | 37.13 | $ | 39.07 | $ | 45.43 | |||||||
Low | $ | 29.86 | $ | 33.92 | $ | 33.75 | $ | 36.48 | |||||||
Fiscal year ended March 29, 2014: | |||||||||||||||
Market price of Common Stock: | |||||||||||||||
High | $ | 42.87 | $ | 45.90 | $ | 44.20 | $ | 43.60 | |||||||
Low | $ | 37.71 | $ | 39.32 | $ | 38.26 | $ | 31.80 | |||||||
Holders
There were approximately 246 holders of record of the Company’s common stock as of March 28, 2015.
Dividends
The Company has never paid cash dividends on shares of its common stock and does not expect to pay cash dividends in the foreseeable future.
20
Stock Performance
The following graph compares the cumulative 5-year total return provided to shareholders on Haemonetics Corporation’s common stock relative to the cumulative total returns of the S&P 500 index and the S&P Health Care Equipment index. An investment of $100 (with reinvestment of all dividends) is assumed to have been made in our common stock and in each of the indexes on 4/3/2010 and its relative performance is tracked through 3/28/2015.
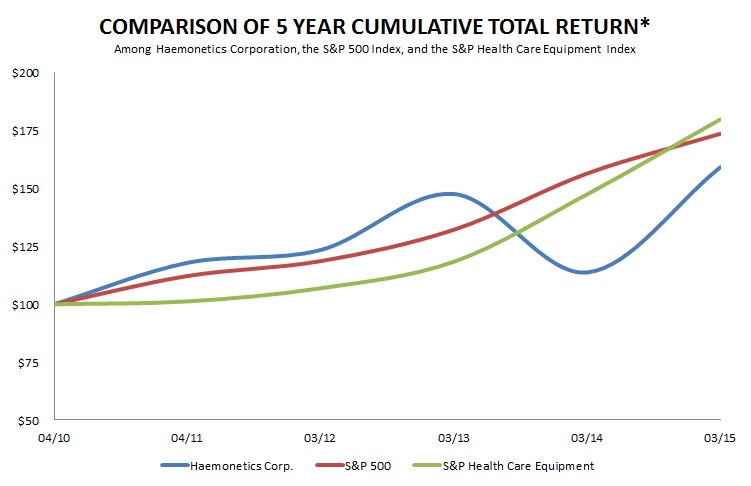
___________________________________
* | $100 invested on 4/3/2010 in stock or index, including reinvestment of dividends. Fiscal year ended March 28, 2015. | |
4/10 | 4/11 | 3/12 | 3/13 | 3/14 | 3/15 | |||||||||||||
Haemonetics Corporation | 100.00 | 117.89 | 123.41 | 147.57 | 113.74 | 156.61 | ||||||||||||
S&P 500 | 100.00 | 112.21 | 118.61 | 132.15 | 156.44 | 173.57 | ||||||||||||
S&P Health Care Equipment | 100.00 | 101.23 | 106.91 | 118.36 | 147.44 | 179.78 | ||||||||||||
Note: The stock price performance included in this graph is not necessarily indicative of future stock price performance. This graph shall not be deemed "filed" for purposes of Section18 of the Exchange Act or otherwise subject to the liabilities of that section nor shall it be deemed incorporated by reference in any filing under the Securities Act or the Exchange Act, regardless of any general incorporation language in such filing.
Unregistered Sales of Equity Securities and Use of Proceeds
None.
21
Issuer Purchases of Equity Securities
In the April 28, 2014 press release, the Company announced that its Board of Directors approved the repurchase of up to $100.0 million worth of Company shares, subject to compliance with its loan covenants. Through March 28, 2015, the Company repurchased 1,174,111 shares of its common stock for an aggregate purchase price of $39.0 million. We reflect stock repurchases in our financial statements on a “trade date” basis and as Authorized Unissued (Haemonetics is a Massachusetts company and under Massachusetts law repurchased shares are treated as authorized but unissued).
All of the purchases during the year were made under the publicly announced program and were made in the open market.
Period | Total Number of Shares Repurchased | Average Price Paid per Share including Commissions | Total Dollar Value of Shares Purchased as Part of Publicly Announced Plans or Programs | Maximum Dollar Value of Shares that May Yet be Purchased Under the Plans or Programs | |||||||||||
March 30, 2014 - April 26, 2014 | — | $ | — | $ | — | $ | 100,000,000 | ||||||||
April 27, 2014 - May 24, 2014 | 694,162 | $ | 31.81 | $ | 22,079,008 | $ | 77,920,992 | ||||||||
May 25, 2014 - June 28, 2014 | 139,595 | $ | 34.23 | $ | 4,778,988 | $ | 73,142,004 | ||||||||
June 29, 2014 - July 26, 2014 | 75,185 | $ | 35.49 | $ | 2,668,606 | $ | 70,473,398 | ||||||||
July 27, 2014 - August 23, 2014 | 63,730 | $ | 36.12 | $ | 2,302,197 | $ | 68,171,201 | ||||||||
August 24, 2014 - September 27, 2014 | 62,144 | $ | 35.55 | $ | 2,209,060 | $ | 65,962,141 | ||||||||
September 28, 2014 - October 25, 2014 | 66,089 | $ | 35.04 | $ | 2,316,065 | $ | 63,646,076 | ||||||||
October 26, 2014 - November 22, 2014 | 45,129 | $ | 36.48 | $ | 1,646,262 | $ | 61,999,814 | ||||||||
November 23, 2014 - December 27, 2014 | 19,055 | $ | 36.76 | $ | 700,422 | $ | 61,299,392 | ||||||||
December 28, 2014 - January 24, 2015 | 6,877 | $ | 36.93 | $ | 253,942 | $ | 61,045,450 | ||||||||
January 25, 2015 - February 21, 2015 | 2,145 | $ | 36.92 | $ | 79,194 | $ | 60,966,256 | ||||||||
February 22, 2015 - March 28, 2015 | — | $ | — | $ | — | $ | 60,966,256 | ||||||||
Total | 1,174,111 | $ | 33.25 | $ | 39,033,744 | ||||||||||
We expect to complete the remaining $61.0 million of purchases in fiscal 2016 and remain in compliance with all loan covenants.
22
ITEM 6. SELECTED FINANCIAL DATA
Haemonetics Corporation Five-Year Review
(In thousands, except per share and employee data) | 2015 | 2014 | 2013 | 2012 | 2011 | ||||||||||||||
Summary of Operations | |||||||||||||||||||
Net revenues | $ | 910,373 | $ | 938,509 | $ | 891,990 | $ | 727,844 | $ | 676,694 | |||||||||
Cost of goods sold | 475,955 | 470,144 | 463,859 | 358,604 | 321,485 | ||||||||||||||
Gross profit | 434,418 | 468,365 | 428,131 | 369,240 | 355,209 | ||||||||||||||
Operating expenses: | |||||||||||||||||||
Research and development | 54,187 | 54,200 | 44,394 | 36,801 | 32,656 | ||||||||||||||
Selling, general and administrative | 334,250 | 366,022 | 323,053 | 243,681 | 212,005 | ||||||||||||||
Asset write-down | 5,441 | 1,711 | 4,247 | — | — | ||||||||||||||
Total operating expenses | 393,878 | 421,933 | 371,694 | 280,482 | 244,661 | ||||||||||||||
Operating income | 40,540 | 46,432 | 56,437 | 88,758 | 110,548 | ||||||||||||||
Other (expense) income, net | (9,375 | ) | (10,031 | ) | (6,540 | ) | 740 | (467 | ) | ||||||||||
Income before provision for income taxes | 31,165 | 36,401 | 49,897 | 89,498 | 110,081 | ||||||||||||||
Provision for income taxes | 14,268 | 1,253 | 11,097 | 22,612 | 30,101 | ||||||||||||||
Net income | $ | 16,897 | $ | 35,148 | $ | 38,800 | $ | 66,886 | $ | 79,980 | |||||||||
Income per share: | |||||||||||||||||||
Basic | $ | 0.33 | $ | 0.68 | $ | 0.76 | $ | 1.32 | $ | 1.59 | |||||||||
Diluted | $ | 0.32 | $ | 0.67 | $ | 0.74 | $ | 1.30 | $ | 1.56 | |||||||||
Weighted average number of shares | 51,533 | 51,611 | 51,349 | 50,727 | 50,154 | ||||||||||||||
Common stock equivalents | 556 | 766 | 910 | 863 | 1,038 | ||||||||||||||
Weighted average number of common and common equivalent shares | 52,089 | 52,377 | 52,259 | 51,590 | 51,192 | ||||||||||||||
2015 | 2014 | 2013 | 2012 | 2011 | |||||||||||||||
Financial and Statistical Data: | |||||||||||||||||||
Working capital | $ | 381,185 | $ | 406,048 | $ | 416,866 | $ | 396,385 | $ | 340,160 | |||||||||
Current ratio | 3.0 | 2.9 | 3.3 | 4.0 | 4.1 | ||||||||||||||
Property, plant and equipment, net | $ | 321,948 | $ | 271,437 | $ | 256,953 | $ | 161,657 | $ | 155,528 | |||||||||
Capital expenditures | $ | 122,220 | $ | 73,648 | $ | 62,188 | $ | 53,198 | $ | 46,669 | |||||||||
Depreciation and amortization | $ | 86,053 | $ | 81,740 | $ | 65,481 | $ | 49,966 | $ | 48,145 | |||||||||
Total assets | $ | 1,485,417 | $ | 1,514,178 | $ | 1,461,917 | $ | 911,135 | $ | 833,264 | |||||||||
Total debt | $ | 427,891 | $ | 437,687 | $ | 480,094 | $ | 3,771 | $ | 4,879 | |||||||||
Stockholders’ equity | $ | 826,122 | $ | 837,888 | $ | 769,182 | $ | 732,631 | $ | 686,136 | |||||||||
Debt as a % of stockholders’ equity | 51.8 | % | 52.2 | % | 62.4 | % | 0.5 | % | 0.7 | % | |||||||||
Employees | 3,383 | 3,782 | 3,563 | 2,337 | 2,201 | ||||||||||||||
23
ITEM 7. MANAGEMENT'S DISCUSSION AND ANALYSIS OF FINANCIAL CONDITION AND RESULTS OF OPERATIONS
Our Business
Haemonetics is a global healthcare company dedicated to providing innovative blood management solutions to our customers. Our comprehensive portfolio of integrated devices, information management, and consulting services offers blood management solutions for each facet of the blood supply chain, helping improve patient care and reduce costs for blood and plasma collectors, hospitals, and patients around the world. Our products and services help prevent a transfusion to a patient who does not need one and provide the right blood product, at the right time, in the right dose to the patient who does.
Blood and its components (plasma, platelets, and red cells) have many vital and frequently life-saving clinical applications. Plasma is used for patients with major blood loss and is manufactured into pharmaceuticals to treat a variety of illnesses and hereditary disorders such as hemophilia. Red cells treat trauma patients or patients undergoing surgery with high blood loss, such as open heart surgery or organ transplant. Platelets treat cancer patients undergoing chemotherapy. Blood is essential to a modern healthcare system.
Recent developments
Russian Economic Conditions
Economic weakness in Russia has impacted our financial results for fiscal 2015 and we expect that our Russian business performance in fiscal 2016 will be similar to fiscal 2015. While the needs for our products in the Russian marketplace continue, the challenging macro-economic conditions in Russia have resulted in reduced government healthcare spending and, as a result, our distributors are placing fewer orders. Russia currently represents approximately 3% of our revenue and we continue to work closely with our Russian distributors to monitor market conditions and credit risk.
Declines in U.S. Blood Center Collections
Sales to U.S. blood centers of our whole blood disposables represent approximately 7% of our total revenue. The demand for these disposable products in the U.S. declined in fiscal 2014 and 2015 due to a rapid decline in demand for blood products associated with actions taken by hospitals to improve blood management techniques and protocols. We believe the decline in U.S. blood center collections of approximately 10% in fiscal 2015 will moderate in fiscal 2016. While it will continue to negatively impact red cell and whole blood revenue, the magnitude of the negative impact will be reduced.
In response to this trend, certain large U.S. blood center collection groups pursued single source vendors for whole blood collection products which required significant reductions in average selling prices in order to retain or increase our share of their business. During fiscal 2014 we entered into a multi-year agreement to supply the HemeXcel Purchasing Alliance, LLC with certain whole blood collection components during the calendar years 2014-2016. The agreement included a reduction in average selling prices which negatively impacted our financial results in fiscal 2015. In March 2014, the American Red Cross selected another exclusive supplier to provide certain whole blood products. This reduced annualized revenues by approximately $25.0 million beginning in the second quarter of fiscal 2015.
Additionally, U.S. blood collection groups are pursuing arrangements for our red cell business similar to the single source agreements pursued in whole blood. This may affect our red cell revenues in the future.
24
Value Creation and Capture Initiatives
On May 1, 2013, we committed to a plan to pursue identified Value Creation and Capture initiatives ("VCC"). These opportunities include investment in product line extensions and next generation products, enhancement of commercial capabilities and a transformation of our manufacturing network. The transformation of our manufacturing network will take place over three years and includes changes to the current manufacturing footprint and supply chain structure (the "Network Plan"). To implement the Network Plan, we are (i) discontinuing manufacturing activities at our Braintree, Massachusetts, Ascoli-Piceno, Italy and Bothwell, Scotland facilities, (ii) creating a technology center of excellence for product development in Braintree, Massachusetts, (iii) expanding our current facility in Tijuana, Mexico, (iv) engaging Sanmina Corporation as a contract manufacturer to produce certain medical equipment, and (v) building a new manufacturing facility in Penang, Malaysia closer to our customers in Asia. See the Liquidity and Capital Resources discussion of this MD&A for further discussion of the costs of these activities.
Our VCC initiatives are moving forward according to plan. We have engaged Sanmina Corporation to be the sole manufacturer of certain equipment, and we have commenced production in our new manufacturing facility in Penang, Malaysia and in our expanded facility in Tijuana, Mexico allowing us to consolidate the manufacturing of product formerly produced in the U.S., Italy and Scotland.
Market Trends
Plasma Market
Changes in demand for plasma-derived pharmaceuticals, particularly immunoglobulin (“IG”), are the key driver of plasma collection volumes in the bio-pharmaceutical market. Various factors related to the supply of plasma and the production of plasma-derived pharmaceuticals also affect collection volume, including the following:
• | Several blood collectors supply additional plasma to fractionators, and thus plasma supply can rise overall but not directly impact our plasma business. |
• | Bio-pharmaceutical companies are seeking more efficient production processes, to meet growing demand for pharmaceuticals without requiring an equivalent increase in plasma supply. |
• | Reimbursement guidelines affect the demand for end product pharmaceuticals, although off-label use of pharmaceuticals is growing, in particular for Alzheimer's treatment. |
• | Newly approved indications for, and the growing understanding and thus diagnosis of auto-immune diseases treated with plasma derived therapies increase the demand for plasma, as do longer lifespans and a growing aging patient population. |
• | Geographical expansion of biopharmaceuticals also increases demand for plasma. |
Demand for our plasma products in fiscal 2015 was particularly strong in North America as collection volumes benefited from a robust end user market for plasma-derived biopharmaceuticals with U.S. produced plasma meeting an increasing percentage of plasma volume demand worldwide.
Blood Center Market
In the blood center market, we sell products used in the collection of platelets, red cells and whole blood. Whole blood is collected from the donor and then transported to a laboratory where it is separated into its components: red cells, platelets or plasma.
Despite modest increases in the demand for platelets in Europe and Japan, improved collection efficiencies that increase the yield of platelets per collection and more efficient use of collected platelets have resulted in a flat market for automated collections and related disposables in these countries. With changes in healthcare and social security systems in emerging markets, a larger number of people are gaining access to state of the art medical treatments, which drives the demand for platelet transfusions and represent a faster growing market.
Blood management is an approach to optimizing the care of patients that may need a transfusion that includes a wide range of practices and protocols which influence the need for, and use of, blood products in hospitals. Adoption of blood management practices by hospitals, particularly in the United States, continues to gain momentum. Blood management efforts reduce the demand for red cells, which in turn can reduce the demand for our red cell and whole blood collection products.
25
As discussed in Recent Developments above, we believe the decline in U.S. blood center collections of approximately 10% in fiscal 2015 will moderate in fiscal 2016. Demand for red cells has declined in mature markets due to better blood management and the development of less invasive, lower blood loss medical procedures. However, highly populated emerging market countries are increasing their demand for blood components as they are advancing their health care coverage, and as greater numbers of people gain access to more advanced medical treatment, demand for blood components, including red cells increases directly.
Hospital Market
In the hospital market, we sell cardiovascular surgical blood salvage systems, orthopedic surgical blood salvage systems, and a blood diagnostic instrument.
Our Cell Saver surgical blood salvage system was designed as a solution for rapid, high volume blood loss procedures, such as cardiovascular surgeries. In recent years, more efficient blood use and less invasive cardiovascular surgeries have reduced demand for this device and contributed to intense competition in mature markets, while increased access to healthcare in emerging economies has provided new markets and sources of growth.
Our OrthoPAT technology is used to salvage red cells in high blood loss orthopedic procedures, including hip and knee replacement surgeries. The OrthoPAT is designed to collect, separate and wash a patient’s shed blood both during and after orthopedic surgery, such as hip and knee replacement. Recently, improved blood management practices, including the use of tranexamic acid to treat and prevent post-operative bleeding, have reduced the use of OrthoPAT.
Our TEG Thrombelastograph Hemostasis Analyzer is a diagnostic tool which provides a comprehensive assessment of a patient’s overall hemostasis. This information enables caregivers to decide the best blood-related clinical treatment for the individual patient in order to minimize blood loss. The test is expanding beyond cardiac surgery into trauma, as well as helping manage surgical timing of patients on anti-platelet medications. TEG product line sales further strengthened in fiscal 2015, with strong performance in North America and China. This product’s growth is dependent on hospitals adopting this technology in their blood management programs. We have launched our next generation device, the TEG 6s, in certain markets in Europe and Asia. In North America, our largest market for TEG, we will launch the TEG 6s upon receipt of the final 510(k) clearance.
Software Market
Our software solutions portfolio addresses many of the critical data collection and data management needs within the plasma, blood center, and hospital markets and is also a key component of our blood management solutions. In fiscal 2015, the pressures to improve efficiencies, reduce cost, and improve patient outcomes continued to be key drivers in all three markets.
In fiscal 2015, we released our Next Generation Donor Management Software, which has been favorably received by the market and purchased by two significant plasma collectors, one of which is planning global adoption.
In the blood center market for software, we currently participate most actively in the United States, where expansion to new or emerging technology platforms such as our El Dorado Software Solution Suite has been slow due to industry consolidation and the relatively high cost of migrating to new information technology platforms. This trend has limited revenue growth, but the high switching costs and recurring maintenance revenue streams from existing customers has provided relative revenue stability in this segment.
We currently participate in the hospital software market primarily in the United States and Europe. In the United States, we have experienced growth in our installed base for our hospital transfusion solution, SafeTraceTX, due to demand for reliable, proven safety systems within transfusion services. However, growth in the United States continues to be constrained due to hospital IT organization focus on the electronic medical records mandates. Revenues from BloodTrack, a blood inventory and transfusion management system, have increased in the United States and Europe recently as hospitals seek means to improve efficiencies and meet compliance guidelines for tracking and dispositioning blood components to patients. We released our new BloodTrack HaemoBank, which received 510(k), CE and multi-regional clearances, in fiscal 2015 and expect that this will further expand this solution's growth in fiscal 2016.
26
Financial Summary
(In thousands, except per share data) | March 28, 2015 | March 29, 2014 | March 30, 2013 | % Increase/(Decrease) 15 vs. 14 | % Increase/(Decrease) 14 vs. 13 | ||||||||||||
Net revenues | $ | 910,373 | $ | 938,509 | $ | 891,990 | (3.0 | )% | 5.2 | % | |||||||
Gross profit | $ | 434,418 | $ | 468,365 | $ | 428,131 | (7.2 | )% | 9.4 | % | |||||||
% of net revenues | 47.7 | % | 49.9 | % | 48.0 | % | |||||||||||
Operating expenses | $ | 393,878 | $ | 421,933 | $ | 371,694 | (6.6 | )% | 13.5 | % | |||||||
Operating income | $ | 40,540 | $ | 46,432 | $ | 56,437 | (12.7 | )% | (17.7 | )% | |||||||
% of net revenues | 4.5 | % | 4.9 | % | 6.3 | % | |||||||||||
Other (expense) income, net | $ | (9,375 | ) | $ | (10,031 | ) | $ | (6,540 | ) | (6.5 | )% | 53.4 | % | ||||
Income before taxes | $ | 31,165 | $ | 36,401 | $ | 49,897 | (14.4 | )% | (27.0 | )% | |||||||
Provision for income tax | $ | 14,268 | $ | 1,253 | $ | 11,097 | — | % | (88.7 | )% | |||||||
% of pre-tax income | 45.8 | % | 3.4 | % | 22.2 | % | |||||||||||
Net income | $ | 16,897 | $ | 35,148 | $ | 38,800 | (51.9 | )% | (9.4 | )% | |||||||
% of net revenues | 1.9 | % | 3.7 | % | 4.3 | % | |||||||||||
Earnings per share-diluted | $ | 0.32 | $ | 0.67 | $ | 0.74 | (52.2 | )% | (9.5 | )% | |||||||
Our fiscal year ends on the Saturday closest to the last day of March. Fiscal 2015, 2014 and 2013 each included 52 weeks with each quarter having 13 weeks. Fiscal 2016 will have 53 weeks.
Net revenue for fiscal 2015 decreased 3.0% compared to fiscal 2014. Without the effects of foreign exchange, net revenue decreased 1.3% compared to fiscal 2014. Revenue increases in plasma and diagnostic disposables were more than offset by declines in the whole blood disposables for the fiscal year ended March 28, 2015.
Net revenue for fiscal 2014 increased 5.2% compared to fiscal 2013. Without the effects of foreign exchange, net revenue increased 6.9% over fiscal 2013. Revenue increased due to a full year of sales from the whole blood business acquired August 1, 2012 as compared to eight months of sales in the prior year, as well as growth in our plasma and diagnostics disposable products. These increases were partially offset by declines across other product lines for the fiscal year ended March 29, 2014.
During fiscal 2015, operating income decreased 12.7% compared to fiscal 2014. Without the effects of foreign currency, operating income decreased 0.9% compared to fiscal 2014. Operating income decreased primarily due to lower whole blood disposables volume and pricing and the associated reduced manufacturing efficiency. These decreases were partially offset by reduced restructuring and transformation costs, and organizational cost savings initiatives. Restructuring and transformation costs were $66.8 million for fiscal 2015, as compared to $84.8 million for the comparative prior year period.
During fiscal 2014, operating income decreased 17.7% compared to fiscal 2013. Without the effects of foreign currency, operating income decreased 4.1% compared to fiscal 2013. Operating income decreased as gross profit growth was more than offset by higher restructuring and transformation costs and other operating expense growth associated with the whole blood acquisition. Restructuring and transformation costs were $84.8 million for the fiscal year ended March 29, 2014, as compared to $72.5 million for the comparative prior year period. Restructuring and transformation costs in fiscal 2014 are primarily associated with VCC initiatives, and in fiscal 2013 were primarily associated with the acquisition and integration of the whole blood business.
Net income decreased 51.9% during fiscal 2015. Without the effects of foreign exchange, net income decreased 20.8% for fiscal 2015. The decrease in net income was primarily attributable to an increase in tax expense and the decrease in operating income described above. The increase in tax expense is attributable to the establishment of a valuation allowance for our U.S. net deferred tax assets following three years of cumulative losses directly related to our substantial restructuring and transformation spending.
Net income decreased 9.4% during fiscal 2014. Without the effects of foreign exchange, net income decreased 3.4% for fiscal 2014. The decrease in net income was attributable to the decrease in operating income described above and additional interest expense associated with a full year of term loan borrowing following the whole blood acquisition. These were partially offset by a reduction in tax expense due to lower income before taxes and a lower income tax rate.
27
RESULTS OF OPERATIONS
Net Revenues by Geography
(In thousands) | March 28, 2015 | March 29, 2014 | March 30, 2013 | % Increase/(Decrease) 15 vs. 14 | % Increase/(Decrease) 14 vs. 13 | ||||||||||||
United States | $ | 494,788 | $ | 500,719 | $ | 454,874 | (1.2 | )% | 10.1 | % | |||||||
International | 415,585 | 437,790 | 437,116 | (5.1 | )% | 0.2 | % | ||||||||||
Net revenues | $ | 910,373 | $ | 938,509 | $ | 891,990 | (3.0 | )% | 5.2 | % | |||||||
International Operations and the Impact of Foreign Exchange
Our principal operations are in the U.S., Europe, Japan and other parts of Asia. Our products are marketed in approximately 100 countries around the world through a combination of our direct sales force and independent distributors and agents.
The percentage of revenue generated in our principle operating regions is summarized below:
March 28, 2015 | March 29, 2014 | March 30, 2013 | ||||||
United States | 54.4 | % | 53.4 | % | 51.0 | % | ||
Japan | 9.7 | % | 11.6 | % | 13.5 | % | ||
Europe | 23.7 | % | 24.0 | % | 25.2 | % | ||
Other | 12.2 | % | 11.0 | % | 10.3 | % | ||
Total | 100.0 | % | 100.0 | % | 100.0 | % | ||
International sales are generally conducted in local currencies, primarily the Japanese Yen, the Euro, the Chinese Yuan and the Australian Dollar. Our results of operations are impacted by changes in foreign exchange rates, particularly in the value of the Yen, the Euro and Australian Dollar relative to the U.S. Dollar.
We have placed foreign currency hedges to minimize the risk of currency fluctuations. For fiscal 2015 as compared to fiscal 2014, the effects of foreign exchange resulted in a 1.7% decrease in sales. The primary reason is the relative strength of the U.S. Dollar to the Japanese Yen, Euro and Australian Dollar. We expect this relative strength of the U.S. Dollar to continue to negatively impact operating income in fiscal 2016 and fiscal 2017. For fiscal 2014 as compared to fiscal 2013, the effects of foreign exchange also accounted for a 1.7% decrease in sales.
Please see section entitled “Foreign Exchange” in this discussion for a more complete explanation of how foreign currency affects our business and our strategy for managing this exposure.
Net Revenues by Product Type
(In thousands) | March 28, 2015 | March 29, 2014 | March 30, 2013 | % Increase/(Decrease) 15 vs. 14 | % Increase/(Decrease) 14 vs. 13 | ||||||||||||
Disposables | $ | 783,426 | $ | 806,834 | $ | 757,765 | (2.9 | )% | 6.5 | % | |||||||
Software solutions | 72,185 | 70,441 | 69,952 | 2.5 | % | 0.7 | % | ||||||||||
Equipment & other | 54,762 | 61,234 | 64,273 | (10.6 | )% | (4.7 | )% | ||||||||||
Net revenues | $ | 910,373 | $ | 938,509 | $ | 891,990 | (3.0 | )% | 5.2 | % | |||||||
28
Disposables Revenues by Product Type
(In thousands) | March 28, 2015 | March 29, 2014 | March 30, 2013 | % Increase/(Decrease) 15 vs. 14 | % Increase/(Decrease) 14 vs. 13 | ||||||||||||
Plasma disposables | $ | 319,190 | $ | 291,895 | $ | 268,900 | 9.4 | % | 8.6 | % | |||||||
Blood center disposables | |||||||||||||||||
Platelet | 152,588 | 156,643 | 169,602 | (2.6 | )% | (7.6 | )% | ||||||||||
Red cell | 42,700 | 42,378 | 49,733 | 0.8 | % | (14.8 | )% | ||||||||||
Whole blood | 143,905 | 190,698 | 138,436 | (24.5 | )% | 37.8 | % | ||||||||||
339,193 | 389,719 | 357,771 | (13.0 | )% | 8.9 | % | |||||||||||
Hospital disposables | |||||||||||||||||
Surgical | 62,540 | 66,876 | 73,508 | (6.5 | )% | (9.0 | )% | ||||||||||
OrthoPAT | 20,316 | 25,042 | 30,230 | (18.9 | )% | (17.2 | )% | ||||||||||
Diagnostics | 42,187 | 33,302 | 27,356 | 26.7 | % | 21.7 | % | ||||||||||
125,043 | 125,220 | 131,094 | (0.1 | )% | (4.5 | )% | |||||||||||
Total disposables revenue | $ | 783,426 | $ | 806,834 | $ | 757,765 | (2.9 | )% | 6.5 | % | |||||||
Disposables Revenue
Disposables include the Plasma, Blood Center, and Hospital product lines. Disposables revenue decreased 2.9% during fiscal 2015 and increased 6.5% during fiscal 2014. Without the effects of foreign exchange, disposables revenue decreased 1.1% and increased 8.3% for fiscal 2015 and 2014, respectively. In fiscal 2015, the decrease was primarily driven by significantly reduced whole blood disposables revenue and was partially offset by growth in plasma and diagnostic disposables revenue. In fiscal 2014, the increase was primarily due to a full year of sales from the whole blood business as compared to eight months of sales in the prior year, as well as growth in our plasma and diagnostics disposable products.
Plasma
Plasma disposables revenue increased 9.4% during fiscal 2015. Without the effects of foreign exchange, plasma disposables revenue increased 10.4% during fiscal 2015 compared to fiscal 2014. Plasma revenue increased due to higher volumes in the United States associated with end market growth for plasma-derived biopharmaceuticals and benefits from the transition to a direct sales model in Australia and New Zealand which occurred in the second quarter of fiscal 2014. We expect the demand for plasma-derived biopharmaceuticals to continue to grow in fiscal 2016 and incremental growth associated with our expanded saline solutions offering.
Plasma disposables revenue increased 8.6% during fiscal 2014. Without the effects of foreign exchange, plasma disposables revenue increased 10.3% during fiscal 2014. Plasma revenue increased due to higher volumes in the United States and the transition to a direct sales model in Australia and New Zealand.
Blood Center
Blood Center consists of disposables used to collect platelets, red cells and whole blood.
Platelet
We continue to see significant differences in demand for our platelet products in various markets depending on access to health care and adoption of certain efficient collection techniques. In emerging markets, increased access to health care continues to increase the demand for platelet transfusions, while increases in the demand for platelet transfusions in developed markets is modest. Collection efficiencies which increase the yield of platelets per collection and more efficient use of collected platelets reduce the number of collections required to meet market demand. Where we see adoption of these techniques we experience reduced demand for our products; however, not all markets have adopted these collection efficiencies at the same level.
These significant differences in platelet use and collection impact the performance of our platelet business across our different geographies. Japan recently began adoption of more efficient collection techniques which has negatively impacted revenue from platelet collection disposables, while emerging markets revenues continue to grow due to increasing use of platelets in patient care.
Platelet disposables revenue decreased 2.6% during fiscal 2015. Without the effects of foreign exchange, platelet disposable revenue increased 3.0% during fiscal 2015. Without the effect of foreign exchange, the increase was due to growth in emerging markets and the benefit of order timing in North America offset by the impact of the collection trends in Japan noted above.
29
Platelet disposables revenue decreased 7.6% during fiscal 2014. Without the effects of foreign exchange, platelet disposable revenue decreased 3.8% during fiscal 2014, due primarily to lower revenues in Canada and lower revenues in emerging markets associated with order timing and reductions of distributor inventory levels.
Red Cells and Whole Blood
Sales to U.S. blood centers represent approximately 75% of our total U.S. red cell and whole blood disposable revenue. The demand for these disposable products in the U.S. has recently declined due to a rapid reduction in demand for blood products associated with actions taken by hospitals to improve blood management techniques and protocols.
Red cell disposables revenue increased 0.8% during fiscal 2015. Without the effects of foreign exchange, red cell disposables revenue increased 0.8% during fiscal 2015. The increase was driven by North American sales due to changes in red cell collection practices and was partially offset by declines in Europe and Latin America. We have seen a modest shift in order patterns from whole blood to red cell disposables due to customer efforts to more efficiently collect red cells.
Red cell disposables revenue decreased 14.8% during fiscal 2014. Without the effects of foreign exchange, red cell disposables revenue decreased 14.3% during fiscal 2014, due to the market factors discussed above.
Whole blood revenue decreased 24.5% during fiscal 2015. Without the effect of foreign exchange, whole blood revenue decreased 24.1% during fiscal 2015, due to the loss of the American Red Cross business, lower pricing to HemeXcel, the loss of a European tender early in fiscal 2014 and macro-economic conditions in Russia. Declines in North American transfusion rates of 10% contributed approximately $8.0 million to the fiscal 2015 decline. As noted above, we expect that the rate of decline in transfusion rates in the United States will moderate in fiscal 2016.
Whole blood revenue increased 37.8% during fiscal 2014. Without the effect of foreign exchange, whole blood revenue increased 37.4% during fiscal 2014, due to a full period of sales from the whole blood business acquired August 1, 2012 as compared to eight months of sales in the prior year period. The increase was partially offset by the negative impact of the U.S. collection market, a European tender loss and a decline in contract manufacturing revenue.
Hospital
Hospital disposable revenue includes Surgical, OrthoPAT, and Diagnostics products. The hospital product line includes the following brand platforms: the Cell Saver brand, the TEG brand and the OrthoPAT brand.
Surgical
Surgical disposables revenue consists principally of the Cell Saver products. Revenue from our surgical disposables decreased 6.5% during fiscal 2015. Without the effect of foreign exchange, surgical disposables revenue decreased 3.3% during fiscal 2015. The decline in surgical revenue in developed markets, partially offset by growth in emerging markets.
Revenue from our surgical disposables decreased 9.0% during fiscal 2014. Without the effect of foreign exchange, surgical disposables revenue decreased 5.4% during fiscal 2014. Surgical revenue decreased due to the return to the market of a competitor with aggressive pricing whose operations were limited by a natural disaster in the prior year, and by a reduction in demand for surgical procedures. This decrease was partially offset by growth in emerging markets, primarily China.
OrthoPAT
Revenue from our OrthoPAT disposables decreased 18.9% during fiscal 2015. Without the effect of foreign exchange, OrthoPAT disposables revenue decreased 16.5% as better blood management has reduced orthopedic blood loss and demand for OrthoPAT disposables. Recent trends in blood management particularly the adoption of tranexamic acid to treat and prevent orthopedic post-operative blood loss have continued to reduce hospital use of OrthoPAT disposables and we expect this trend to continue.
Revenue from our OrthoPAT disposables decreased 17.2% during fiscal 2014. Without the effect of foreign exchange, OrthoPAT disposables revenue decreased 14.7% as better blood management has reduced orthopedic blood loss and demand for OrthoPAT disposables. Recent trends in blood management, particularly the adoption of tranexamic acid to treat and prevent orthopedic post-operative blood loss, have continued to reduce hospital use of OrthoPAT disposables.
Diagnostics
Diagnostics product revenue consists of the TEG products. Revenue from diagnostic products increased 26.7% during fiscal 2015. Without the effect of foreign exchange, diagnostic product revenue increased 23.4%. The revenue increase is due to continued adoption of our TEG analyzer, principally in the United States and China.
30
Revenue from our diagnostic products increased 21.7% during fiscal 2014. Without the effect of foreign exchange, diagnostic product revenue increased 20.0%. The revenue increase is due to continued adoption of our TEG analyzer, principally in the United States and China.
Other Revenues
(In thousands) | March 28, 2015 | March 29, 2014 | March 30, 2013 | % Increase/(Decrease) 15 vs. 14 | % Increase/(Decrease) 14 vs. 13 | ||||||||||||
Software solutions | $ | 72,185 | $ | 70,441 | $ | 69,952 | 2.5 | % | 0.7 | % | |||||||
Equipment and other | 54,762 | 61,234 | 64,273 | (10.6 | )% | (4.7 | )% | ||||||||||
Net other revenues | $ | 126,947 | $ | 131,675 | $ | 134,225 | (3.6 | )% | (1.9 | )% | |||||||
Software Solutions
Our software solutions revenue includes sales of our information technology software platforms and consulting services.
Software solutions revenue increased 2.5% during fiscal 2015. Without the effects of foreign exchange, software solutions revenue increased 2.9% during fiscal 2015. During fiscal 2015, software revenue increased due to strong BloodTrack sales in the U.S. and Europe.
Software solutions revenue increased 0.7% during fiscal 2014. Without the effects of foreign exchange, software solutions revenue increased 0.1% during fiscal 2014. During fiscal 2014, growth in hospital software revenue was offset by lower hosting fees associated with a large bio-pharmaceutical customer.
Equipment & Other
Our equipment and other revenues include revenue from equipment sales, repairs performed under preventive maintenance contracts or emergency service visits, spare part sales, and various service and training programs. These revenues are primarily composed of equipment sales, which tend to vary from period to period more than our disposable product line due to the timing of order patterns, particularly in our distribution markets.
Equipment and other revenue decreased 10.6% during fiscal 2015. Without the effects of currency exchange, equipment and other revenue decreased 8.7%. The decrease in revenue during fiscal 2015 is due primarily to the impact of order timing and macro-economic conditions in Russia.
Equipment and other revenue decreased 4.7% during fiscal 2014. Without the effect of currency exchange, equipment and other revenue decreased 2.0%. The decrease in revenue during fiscal 2014 is due primarily to benefits in the prior year from a competitor whose operations were limited by a natural disaster and the successful launch of the Cell Saver Elite, partially offset by higher services revenue associated with a transition to a direct sales model in Australia and New Zealand.
Gross Profit
(In thousands) | March 28, 2015 | March 29, 2014 | March 30, 2013 | % Increase/(Decrease) 15 vs. 14 | % Increase/(Decrease) 14 vs. 13 | ||||||||||||
Gross profit | $ | 434,418 | $ | 468,365 | $ | 428,131 | (7.2 | )% | 9.4 | % | |||||||
% of net revenues | 47.7 | % | 49.9 | % | 48.0 | % | |||||||||||
Our gross profit decreased 7.2% during fiscal 2015. Without the effects of foreign exchange, gross profit decreased 5.1% during fiscal 2015. Our gross profit margin percentage decreased by 220 basis points for fiscal 2015 as compared to fiscal 2014. The decrease in gross profit margin for the fiscal year ended March 28, 2015 was primarily due to price reductions in the blood collection markets, reduced manufacturing efficiency related to lower whole blood volumes and relatively higher sales from products with lower gross margins. These decreases were partially offset by cost savings from our VCC initiatives implemented during fiscal 2014 and 2015.
Our gross profit amount increased 9.4% during fiscal 2014. Without the effects of foreign exchange, gross profit increased 12.0% during fiscal 2014. Our gross profit margin percentage decreased by 190 basis points for fiscal 2014 as compared to fiscal 2013. The increase in gross profit margin for the fiscal year ended March 29, 2014 was primarily driven by lower whole blood related inventory charges. During fiscal 2013, we recorded inventory reserves associated with the removal of certain whole blood collection sets from inventory based on a quality matter detected during the year. We also recorded significant inventory step-up charges related to acquired whole blood inventory. Improvements to reported gross margin excluding the
31
inventory adjustments noted also included improvements in manufacturing efficiencies. These increases were partially offset by the impact of foreign currency.
Operating Expenses
(In thousands) | March 28, 2015 | March 29, 2014 | March 30, 2013 | % Increase/(Decrease) 15 vs. 14 | % Increase/(Decrease) 14 vs. 13 | ||||||||||||
Research and development | $ | 54,187 | $ | 54,200 | $ | 44,394 | — | % | 22.1 | % | |||||||
% of net revenues | 6.0 | % | 5.8 | % | 5.0 | % | |||||||||||
Selling, general and administrative | $ | 334,250 | $ | 366,022 | $ | 323,053 | (8.7 | )% | 13.3 | % | |||||||
% of net revenues | 36.7 | % | 39.0 | % | 36.2 | % | |||||||||||
Asset write-downs | $ | 5,441 | $ | 1,711 | $ | 4,247 | 218.0 | % | (59.7 | )% | |||||||
% of net revenues | 0.6 | % | 0.2 | % | 0.5 | % | |||||||||||
Total operating expenses | $ | 393,878 | $ | 421,933 | $ | 371,694 | (6.6 | )% | 13.5 | % | |||||||
% of net revenues | 43.3 | % | 45.0 | % | 41.7 | % | |||||||||||
Research and Development
Research and development remained flat during fiscal 2015. Without the effect of the increased restructuring and transformation costs of $2.8 million in fiscal 2015, as compared to the prior year, research and development decreased by approximately 6.0% as a result of reduced program spending related to the whole blood acquisition.
Research and development increased 22.1% during fiscal 2014. This increase includes a $3.6 million in-process research and development charge related to the acquisition of certain technology and manufacturing rights to be used in a next generation device. Excluding the impact of the in-process research and development charge, research and development was 5.4% of net revenues. Other increases are primarily due to additional staff and program spending related to the whole blood acquisition, new research initiatives and development programs.
Selling, General and Administrative
During fiscal 2015, selling, general and administrative expenses decreased 8.7%. Without the effects of foreign exchange, selling, general and administrative expenses decreased 6.4% during fiscal 2015. The decrease during fiscal 2015 is primarily related to a $20.1 million decrease in restructuring and transformation costs related to VCC initiatives. This decrease was partially offset by our increased commercial investment in plasma and emerging markets and increased variable compensation.
During fiscal 2014, selling, general and administrative expenses increased 13.3%. Without the effects of foreign exchange, selling, general and administrative expenses increased 15.0% during fiscal 2014. The increase during fiscal 2014 is primarily related to a $21.1 million increase in restructuring and transformation costs due to VCC initiatives. We also incurred incremental costs of approximately $21.0 million associated with operating the whole blood business for the entire year as compared to eight months in the prior year, of which approximately $7.0 million relates to the amortization of acquired intangible assets.
Asset Write-Down
We recorded asset write-downs of $5.4 million in fiscal 2015 associated with exit activities related to our VCC initiatives and certain research and development programs.
We recorded asset write-downs of $1.7 million in the fourth quarter of fiscal 2014 associated with exit activities related to our VCC and integration initiatives.
We recorded an asset write-down of $4.2 million in the fourth quarter of fiscal 2013 associated with exit activities related to technologies originally acquired from Arryx, Inc.
Other (expense) income, net
Other expense, net, decreased 6.5% during fiscal 2015 as compared to fiscal 2014. Interest expense from our term loan borrowings constitutes the majority of expense reported in both periods. The effective interest rate on total debt outstanding for the fiscal year ended March 28, 2015 was approximately 2.0%.
32
Taxes
March 28, 2015 | March 29, 2014 | March 30, 2013 | % Increase/(Decrease) 15 vs. 14 | % Increase/(Decrease) 14 vs. 13 | ||||||||||
Reported income tax rate | 45.8 | % | 3.4 | % | 22.2 | % | 42.4 | % | (18.8 | )% | ||||
Reported Tax Rate
We conduct business globally and as a result report our results of operations in a number of foreign jurisdictions and the United States. Historically, our reported tax rate was lower than the U.S. statutory tax rate due primarily to our jurisdictional mix of earnings as the income earned in our foreign subsidiaries is generally taxed at a lower tax rate. For the year ended March 28, 2015, the Company established a valuation allowance against a portion of its U.S. deferred tax assets that it concluded are not more-likely-than-not realizable. In fiscal 2015, we entered into a three year cumulative book loss position in the U.S. which primarily relates to ongoing restructuring and transformation spending.
The reported tax rate for the year ended March 28, 2015 was 45.8%. Our current tax rate is higher than our tax rates of 3.4% and 22.2% for the years ended March 29, 2014 and March 30, 2013, respectively. The increase in the tax rate is primarily due to the establishment of a valuation allowance against a portion of our domestic deferred tax assets that we concluded were not more-likely-than-not realizable.
33
Liquidity and Capital Resources
The following table contains certain key performance indicators we believe depict our liquidity and cash flow position:
(In thousands) | March 28, 2015 | March 29, 2014 | |||||
Cash & cash equivalents | $ | 160,662 | $ | 192,469 | |||
Working capital | $ | 381,185 | $ | 406,048 | |||
Current ratio | 3.0 | 2.9 | |||||
Net debt position (1) | $ | (267,229 | ) | $ | (245,218 | ) | |
Days sales outstanding (DSO) | 58 | 62 | |||||
Disposables finished goods inventory turnover | 4.3 | 4.2 | |||||
_______________________________________
(1) | Net debt position is the sum of cash and cash equivalents less total debt. |
As previously discussed, during fiscal 2015 and 2014 our business was negatively impacted by reductions in the demand for blood products caused by changes in blood management practices and actions taken by U.S. blood center customers in response to reductions in demand. This includes the loss of the American Red Cross whole blood contract which impacted our results beginning in the first quarter of fiscal 2015.
Our VCC initiatives require cash expenditures for plant closure costs and employee separation benefits, new plant construction and temporary increases in inventory levels as manufacturing is transitioned to new facilities. We paid $114.3 million and $72.9 million in cash related to restructuring costs, transformation costs and capital expenditures associated with the VCC initiatives during fiscal 2015 and 2014, respectively. We estimate we will spend $27.0 million to complete these initiatives in fiscal 2016.
As of March 28, 2015, we had $160.7 million in cash and cash equivalents. We currently have a credit facility which provides for a $475.0 million term loan and a $100.0 million revolving loan. The credit facility matures on July 1, 2019. At March 28, 2015, $379.4 million was outstanding under the term loan and $50.0 million was outstanding on the revolving loan. We also have $62.1 million of uncommitted operating lines of credit to fund our global operations and there are no outstanding borrowings as of March 28, 2015.
The credit facility contains covenants that limit the use of cash and require us to maintain certain financial ratios. Any failure to comply with the financial and or other operating covenants of the credit facility would prevent us from borrowing under the revolving credit facility and would constitute a default, which could result in, among other things, the amounts outstanding including all accrued interest and unpaid fees, becoming immediately due and payable. As of March 28, 2015, we were in compliance with all covenants.
Our primary sources of liquidity are cash and cash equivalents, internally generated cash flow from operations and option exercises. Although cash flow from operations will be negatively impacted by the trends noted above, we believe these sources are sufficient to fund our cash requirements over at least the next twelve months, which are primarily payments associated with VCC initiatives described above, share repurchases, capital expenditures, cash payments under the loan agreement, investments and other acquisitions. These are described in more detail in Contractual Obligations below.
34
Cash Flow Overview:
(In thousands) | March 28, 2015 | March 29, 2014 | March 30, 2013 | Increase/(Decrease) 15 vs. 14 | Increase/(Decrease) 14 vs. 13 | ||||||||||||||
Net cash provided by (used in): | |||||||||||||||||||
Operating activities | $ | 127,178 | $ | 139,524 | $ | 85,074 | $ | (12,346 | ) | $ | 54,450 | ||||||||
Investing activities | (121,768 | ) | (105,830 | ) | (596,395 | ) | 15,938 | (490,565 | ) | ||||||||||
Financing activities | (33,160 | ) | (20,700 | ) | 461,853 | 12,460 | (482,553 | ) | |||||||||||
Effect of exchange rate changes on cash and cash equivalents (1) | (4,057 | ) | 355 | (273 | ) | (4,412 | ) | 628 | |||||||||||
Net increase/(decrease) in cash and cash equivalents | $ | (31,807 | ) | $ | 13,349 | $ | (49,741 | ) | |||||||||||
(1) | The balance sheet is affected by spot exchange rates used to translate local currency amounts into U.S. dollars. In accordance with GAAP, we have eliminated the effect of foreign currency throughout our cash flow statement, except for its effect on our cash and cash equivalents. |
In fiscal 2015, the Company repurchased approximately 1.2 million shares of its common stock for an aggregate purchase price of $39.0 million. This was part of a $100.0 million share repurchase program that was announced in April 2014.
In fiscal 2014, the Company did not repurchase shares of its common stock.
In fiscal 2013, the Company repurchased approximately 1.2 million shares of its common stock for an aggregate purchase price of $50.0 million. This completed a $50.0 million share repurchase program that was announced in April 2012.
Operating Activities:
Net cash provided by operating activities was $127.2 million during fiscal 2015, a decrease of $12.3 million as compared to fiscal 2014 primarily due to lower earnings.
Net cash provided by operating activities was $139.5 million during fiscal 2014, an increase of $54.5 million as compared to fiscal 2013 primarily due to higher cash receipts associated with strong collections which more than offset increased expenditures for inventory. Additionally, initial investments in accounts receivable were required in fiscal 2013 as existing accounts receivable were not acquired in the whole blood acquisition, negatively impacting net cash provided by operating activities in the prior year.
Investing Activities:
Net cash used in investing activities was $121.8 million during fiscal 2015, an increase of $15.9 million as compared to fiscal 2014 primarily due to $122.2 million of capital expenditures including $44.9 million related to our manufacturing network transformation activities. The increase was partially offset by a reduction in acquisition related investments of $32.7 million in fiscal 2014.
Net cash used in investing activities was $105.8 million during fiscal 2014, a decrease of $490.6 million as compared to fiscal 2013 primarily due to the $535.2 million paid for the whole blood acquisition, of which $475.0 million was funded by term loan borrowings discussed above. Investing activities also included $23.1 million paid for the acquisition of Hemerus Medical, LLC, and $73.6 million of capital expenditures including $18.0 million related to our manufacturing network transformation activities.
Financing Activities:
Net cash used in financing activities was $33.2 million during fiscal 2015, an increase of $12.5 million as compared to fiscal 2014 primarily due to $39.0 million used to repurchase approximately 1.2 million shares of common stock. The increase was partially offset by reduced payments towards the term loan in fiscal 2015.
Net cash used in financing activities was $20.7 million during fiscal 2014, a decrease of $482.6 million as compared to fiscal 2013 primarily due to the $475.0 million term loan borrowed in fiscal 2013 to finance the whole blood acquisition. Financing activities included $22.8 million of proceeds from the exercise of share-based compensation, offset by $37.1 million of debt
35
repayments related to term loan repayments and an additional $5.5 million of short term debt repayments in foreign jurisdictions.
Contractual Obligations
A summary of our contractual and commercial commitments as of March 28, 2015, is as follows:
Payments Due by Period | |||||||||||||||||||
(In thousands) | Total | Less than 1 year | 1-3 years | 4-5 years | More than 5 years | ||||||||||||||
Debt | $ | 427,891 | $ | 21,522 | $ | 237,805 | $ | 168,564 | $ | — | |||||||||
Operating leases | 29,347 | 6,797 | 8,538 | 4,247 | 9,765 | ||||||||||||||
Purchase commitments* | 114,598 | 99,598 | 15,000 | — | — | ||||||||||||||
Expected retirement plan benefit payments | 15,725 | 1,735 | 3,155 | 3,342 | 7,493 | ||||||||||||||
Employee related commitments | 14,350 | 12,701 | 1,649 | — | — | ||||||||||||||
Total contractual obligations | $ | 601,911 | $ | 142,353 | $ | 266,147 | $ | 176,153 | $ | 17,258 | |||||||||
_______________________________________
* | Includes amounts we are committed to spend on purchase orders entered in the normal course of business for capital equipment and for the purpose of manufacturing our products including contract manufacturers, specifically JMS Co. Ltd., Kawasumi Laboratories and Sanmina Corporation for the manufacture of certain disposable products and equipment. The majority of our operating expense spending does not require any advance commitment. | |
The above table does not reflect our long-term liabilities associated with unrecognized tax benefits of $4.0 million recorded in accordance with ASC Topic 740, Income Taxes. We cannot reasonably make a reliable estimate of the period in which we expect to settle these long-term liabilities due to factors outside of our control, such as tax examinations.
At the closing of the whole blood acquisition, we anticipate paying an additional $15.0 million upon replication and delivery of certain manufacturing assets of Pall's filter media business to Haemonetics by 2018.
Concentration of Credit Risk
Concentrations of credit risk with respect to trade accounts receivable are generally limited due to our large number of customers and their diversity across many geographic areas. A portion of our trade accounts receivable outside the United States, however, include sales to government-owned or supported healthcare systems in several countries, which are subject to payment delays. Payment is dependent upon the financial stability and creditworthiness of those countries' national economies.
Although we have not incurred significant losses on government receivables to date, we continually evaluate all government receivables for potential collection risks associated with the availability of government funding and reimbursement practices. If the financial condition of customers or the countries' healthcare systems deteriorate such that their ability to make payments is uncertain, allowances may be required in future periods.
Contingent Commitments
In fiscal 2014, we acquired the business assets of Hemerus Medical, LLC, a company that develops innovative technologies for the collection of whole blood and processing and storage of blood components, including SOLX storage solutions. We paid $24.1 million and will pay an additional $3.0 million upon a further FDA approval of the SOLX solution for 24 hour storage of whole blood prior to processing. We will also pay up to $14.0 million based on future sales of SOLX-based products through fiscal 2025.
Legal Proceedings
We are presently engaged in various legal actions, and although our ultimate liability cannot be determined at the present time, we believe, based on consultation with counsel, that any such liability will not materially affect our consolidated financial position or our results of operations.
36
Italian Employment Litigation
Our Italian manufacturing subsidiary is party to several actions initiated by employees of the facility in Ascoli-Piceno, Italy where we have ceased manufacturing operations. These include actions claiming (i) working conditions and minimum salaries should have been established by either a different classification under their national collective bargaining agreement or a different agreement altogether, (ii) certain solidarity agreements, which are arrangements between the Company, employees and the government to continue full pay and benefits for employees who would otherwise be terminated in times of low demand, are void, and (iii) payment of the extra time used for changing into and out of the working clothes at the beginning and end of each shift.
In addition, a union represented in the Ascoli plant has filed an action claiming that the Company discriminated against it in favor of three other represented unions by (i) interfering with an employee referendum, (ii) interfering with an employee petition to recall union representatives from office, and (iii) excluding the union from certain meetings.
Finally, we have been added as defendants on claims filed against Pall Corporation prior to our acquisition of the plant in August 2012. These claims relate to agreements to "freeze" benefit allowances for a certain period in exchange for Pall's commitments on hiring and plant investment.
As of March 28, 2015, the total amount of damages claimed by the plaintiffs in these matters is approximately $3.7 million; however, it is not possible at this point in the proceedings to accurately evaluate the likelihood or amount of any potential losses. We may receive other similar claims in the future.
Inflation
We do not believe that inflation had a significant impact on our results of operations for the periods presented. Historically, we believe we have been able to mitigate the effects of inflation by improving our manufacturing and purchasing efficiencies, by increasing employee productivity, and by adjusting the selling prices of products. We continue to monitor inflation pressures generally and raw materials indices that may affect our procurement and production costs. Increases in the price of petroleum derivatives could result in corresponding increases in our costs to procure plastic raw materials.
Foreign Exchange
During fiscal 2015, approximately 45.6% of our sales were generated outside the U.S., generally in foreign currencies, yet our reporting currency is the U.S. Dollar. We also incur certain manufacturing, marketing and selling costs in international markets in local currency. Our primary foreign currency exposures relate to sales denominated in Euro, Japanese Yen, Chinese Yuan and Australian Dollars. We also have foreign currency exposure related to manufacturing and other operational costs denominated in Swiss Francs, British Pounds, Canadian Dollars and Mexican Pesos. The Yen, Euro, Yuan and Australian Dollar sales exposure is partially mitigated by costs and expenses for foreign operations and sourcing products denominated in foreign currencies. Since our foreign currency denominated Yen, Euro, Yuan and Australian Dollar sales exceed the foreign currency denominated costs, whenever the U.S. Dollar strengthens relative to the Yen, Euro, Yuan or Australian Dollar, there is an adverse effect on our results of operations and, conversely, whenever the U.S. Dollar weakens relative to the Yen, Euro, Yuan or Australian Dollar, there is a positive effect on our results of operations. For Swiss Francs, British Pounds, Canadian Dollars and Mexican Pesos, our primary cash flows relate to product costs or costs and expenses of local operations. Whenever the U.S. Dollar strengthens relative to these foreign currencies, there is a positive effect on our results of operations. Conversely, whenever the U.S. Dollar weakens relative to these currencies, there is an adverse effect on our results of operations.
We have a program in place that is designed to mitigate our exposure to changes in foreign currency exchange rates. That program includes the use of derivative financial instruments to minimize, for a period of time, the unforeseen impact on our financial results from changes in foreign exchange rates. We utilize forward foreign currency contracts to hedge the anticipated cash flows from transactions denominated in foreign currencies, primarily Japanese Yen and Euro, and to a lesser extent Swiss Francs, British Pounds, Australian Dollars, Canadian Dollars and Mexican Pesos. This does not eliminate the volatility of foreign exchange rates, but because we generally enter into forward contracts one year out, rates are fixed for a one-year period, thereby facilitating financial planning and resource allocation.
These contracts are designated as cash flow hedges. The final impact of currency fluctuations on the results of operations is dependent on the local currency amounts hedged and the actual local currency results.
37
Presented below are the spot rates for our Euro, Japanese Yen, Australian Dollar, Canadian Dollar, British Pound, Swiss Franc and Mexican Peso cash flow hedges that settled during fiscal years 2013, 2014 and 2015 or are presently outstanding. These hedges cover our long foreign currency positions that result from our sales designated in Euro, Japanese Yen and Australian Dollars. These hedges include our short positions associated with costs incurred in Canadian Dollars, British Pounds, Swiss Francs and Mexican Pesos. The table shows how the strengthening or weakening of the spot rates associated with those hedge contracts versus the spot rates in the contracts that settled in the prior comparable period affects our results favorably or unfavorably. The table assumes a consistent notional amount for hedge contracts in each period presented.
First Quarter | Favorable / (Unfavorable) | Second Quarter | Favorable / (Unfavorable) | Third Quarter | Favorable / (Unfavorable) | Fourth Quarter | Favorable / (Unfavorable) | |||||||||||||||||
Sales Hedges | ||||||||||||||||||||||||
Euro - Hedge Spot Rate (USD per Euro) | ||||||||||||||||||||||||
FY13 | 1.43 | 15 | % | 1.42 | 9 | % | 1.36 | — | % | 1.32 | (4 | )% | ||||||||||||
FY14 | 1.27 | (11 | )% | 1.25 | (12 | )% | 1.29 | (5 | )% | 1.33 | 1 | % | ||||||||||||
FY15 | 1.33 | 5 | % | 1.35 | 8 | % | 1.35 | 5 | % | 1.37 | 3 | % | ||||||||||||
FY16 | 1.35 | 2 | % | 1.29 | (4 | )% | 1.25 | (8 | )% | 1.13 | (18 | )% | ||||||||||||
Japanese Yen - Hedge Spot Rate (JPY per USD) | ||||||||||||||||||||||||
FY13 | 79.40 | 11 | % | 76.65 | 11 | % | 77.58 | 5 | % | 78.69 | 5 | % | ||||||||||||
FY14 | 79.85 | (1 | )% | 79.68 | (4 | )% | 84.32 | (9 | )% | 93.92 | (19 | )% | ||||||||||||
FY15 | 97.16 | (22 | )% | 98.18 | (23 | )% | 101.09 | (20 | )% | 102.44 | (9 | )% | ||||||||||||
FY16 | 102.05 | (5 | )% | 106.84 | (9 | )% | 118.46 | (17 | )% | 117.25 | (14 | )% | ||||||||||||
Australian Dollar - Hedge Spot Rate (USD per AUD) | ||||||||||||||||||||||||
FY14 | — | — | % | 0.92 | — | % | 0.91 | — | % | 0.92 | — | % | ||||||||||||
FY15 | 0.90 | — | % | 0.94 | 3 | % | 0.94 | 3 | % | 0.90 | (2 | )% | ||||||||||||
FY16 | 0.94 | 4 | % | 0.91 | (3 | )% | 0.85 | (10 | )% | 0.79 | (12 | )% | ||||||||||||
Operating Hedges | ||||||||||||||||||||||||
Canadian Dollar - Hedge Spot Rate (CAD per USD) | ||||||||||||||||||||||||
FY13 | 0.98 | (7 | )% | 0.99 | (4 | )% | 1.01 | 1 | % | 1.00 | 1 | % | ||||||||||||
FY14 | 1.01 | 3 | % | 1.00 | 1 | % | 1.00 | (1 | )% | 1.01 | 1 | % | ||||||||||||
FY15 | — | — | % | — | — | % | 1.08 | 8 | % | 1.09 | 8 | % | ||||||||||||
FY16 | 1.13 | — | % | 1.14 | — | % | 1.17 | 9 | % | 1.24 | 14 | % | ||||||||||||
British Pound - Hedge Spot Rate (USD per GBP) | ||||||||||||||||||||||||
FY13 | 1.62 | (8 | )% | 1.63 | (6 | )% | 1.60 | (2 | )% | 1.57 | 1 | % | ||||||||||||
FY14 | 1.59 | 2 | % | 1.55 | 5 | % | 1.52 | 5 | % | 1.54 | 2 | % | ||||||||||||
FY15 | 1.56 | 2 | % | 1.57 | (1 | )% | 1.62 | (7 | )% | 1.65 | (7 | )% | ||||||||||||
FY16 | 1.64 | (5 | )% | 1.57 | — | % | 1.57 | 3 | % | 1.53 | 7 | % | ||||||||||||
FY17 | 1.55 | 5 | % | — | — | % | — | — | % | — | — | % | ||||||||||||
Swiss Franc - Hedge Spot Rate (CHF per USD) | ||||||||||||||||||||||||
FY13 | 0.82 | (22 | )% | 0.85 | (16 | )% | 0.92 | (4 | )% | 0.92 | — | % | ||||||||||||
FY14 | 0.96 | 17 | % | 0.95 | 12 | % | 0.92 | — | % | 0.93 | 1 | % | ||||||||||||
FY15 | 0.94 | (2 | )% | 0.92 | (3 | )% | 0.90 | (2 | )% | 0.89 | (4 | )% | ||||||||||||
FY16 | 0.90 | (5 | )% | 0.95 | 3 | % | 0.94 | 4 | % | 0.92 | 3 | % | ||||||||||||
Mexican Peso - Hedge Spot Rate (MXN per USD) | ||||||||||||||||||||||||
FY14 | 12.34 | — | % | 12.35 | — | % | 12.22 | — | % | 12.20 | — | % | ||||||||||||
FY15 | 12.40 | 1 | % | 13.06 | 6 | % | 13.09 | 7 | % | 13.08 | 7 | % | ||||||||||||
FY16 | 13.10 | 6 | % | 13.07 | — | % | 13.63 | 4 | % | 14.46 | 11 | % | ||||||||||||
FY17 | 14.93 | 14 | % | — | — | % | — | — | % | — | — | % | ||||||||||||
_______________________________________
We generally place our cash flow hedge contracts on a rolling twelve month basis. |
38
Recent Accounting Pronouncements
See Note 2, Summary of Significant Accounting Policies to our consolidated financial statements contained in Item 8 of this Annual Report on Form 10-K for additional information on Standards Implemented and Standards to be Implemented.
Critical Accounting Policies
Our significant accounting policies are summarized in Note 2 of our consolidated financial statements. While all of these significant accounting policies impact our financial condition and results of operations, we view certain of these policies as critical. Policies determined to be critical are those policies that have the most significant impact on our financial statements and require management to use a greater degree of judgment and/or estimates. Actual results may differ from those estimates.
The accounting policies identified as critical are as follows:
Revenue Recognition
We recognize revenue from product sales, software and services in accordance with ASC Topic 605, Revenue Recognition and ASC Topic 985-605, Software. These standards require that revenue is recognized when persuasive evidence of an arrangement exists, product delivery, including customer acceptance, has occurred or services have been rendered, the price is fixed or determinable and collectability is reasonably assured. When more than one element such as equipment, disposables and services are contained in a single arrangement, we allocate revenue between the elements based on each element’s relative selling price, provided that each element meets the criteria for treatment as a separate unit of accounting. An item is considered a separate unit of accounting if it has value to the customer on a stand-alone basis. The selling price of the undelivered elements is determined by the price charged when the element is sold separately, which constitutes vendor specific objective evidence as defined under ASC Topic 985-605, or in cases when the item is not sold separately, by third-party evidence of selling price or by management's best estimate of selling price. For our software arrangements accounted for under the provisions of ASC 985-605, Software, we establish fair value of undelivered elements based upon vendor specific objective evidence.
We generally do not allow our customers to return products. We offer sales rebates and discounts to certain customers. We treat sales rebates and discounts as a reduction of revenue and classify the corresponding liability as current. We estimate rebates for products where there is sufficient historical information available to predict the volume of expected future rebates. If we are unable to estimate the expected rebates reasonably, we record a liability for the maximum potential rebate or discount that could be earned.
We generally recognize revenue from the sale of perpetual licenses on a percentage-of-completion basis which requires us to make reasonable estimates of the extent of progress toward completion of the contract. These arrangements most often include providing customized implementation services to our customer. We also provide other services, including in some instances hosting, technical support, and maintenance, for the payment of periodic, monthly, or quarterly fees. We recognize these fees and charges as earned, typically as these services are provided during the contract period.
Goodwill and Other Intangible Assets
Intangible assets acquired in a business combination are recorded under the purchase method of accounting at their estimated fair values at the date of acquisition. Costs associated with the application and award of patents in the U.S. and various other countries are capitalized and amortized on a straight-line basis over their estimated useful life. Goodwill represents the excess purchase price over the fair value of the net tangible and other identifiable intangible assets acquired. We amortize our other intangible assets over their estimated useful lives.
Goodwill is not amortized. Instead goodwill is reviewed for impairment at least annually in accordance with ASC Topic 350, Intangibles - Goodwill and Other, or on an interim basis between annual tests when events or circumstances indicate that it is more likely than not that the fair value of a reporting unit is less than its carrying value. We perform our annual impairment test on the first day of the fiscal fourth quarter for each of our reporting units. We first perform a qualitative test and if necessary, perform a quantitative test.
Prior to fiscal 2014, we determined we operated a single operating segment, blood management solutions, based on our chief operating decision maker ("CODM") primarily using consolidated results to make operating and strategic decisions. Our reporting units for purposes of assessing goodwill impairment prior to fiscal 2014 were medical devices and software. During fiscal 2014, our CODM utilized financial results by operating units organized primarily on geography to make operating and strategic decisions due to changes in the composition in the executive staff reporting to the CODM. Based on these changes we determined the five operating units represent operating segments as defined under ASC 280 - Segment Reporting. Following
39
this change, we determined our reporting units for purposes of assessing goodwill impairment by identifying our operating segments and assessing whether segment management regularly reviews the operating results of any components. Through this process, we concluded that our reporting units were the same as our operating segments, which are the following operating units organized based primarily on geography: North America Plasma, North America Blood Center and Hospital, Europe, Asia-Pacific and Japan. During fiscal 2014, goodwill was reallocated from the medical device and software reporting units to the new reporting units based on a relative fair value basis. For fiscal 2015, there were no changes to operating segments or reporting units for purposes of assessing goodwill impairment.
ASC 350, Intangibles - Goodwill and Other defines the fair value of a reporting unit as the price that would be received to sell the unit as a whole in an orderly transaction between market participants at the measurement date. The quantitative test is based on a discounted cash flow analysis or other valuation techniques, such as the market approach, for each reporting unit. The fair values of our reporting units in fiscal 2013 were determined using the income approach. Under the income approach, the fair value of a reporting unit is based on the present value of future cash flows using appropriate discount rates, growth rates, operating margins and future market conditions amongst others. We changed our valuation approach to assessing goodwill impairment in fiscal 2014 in connection with the change in reporting units. In fiscal 2015 and 2014, we determined the fair value of our reporting units based on the market approach. We utilized the market approach as we determined relevant comparable information was available, and accordingly such method was an appropriate alternative to the income method. Under the market approach, we estimate the fair value of our reporting units based on a combination of, a) market multiples of projected earnings before interest, taxes, depreciation and amortization (“EBITDA”) and b) market multiples of projected net revenues for each individual reporting unit. For the market approach, we use judgment in identifying the relevant comparable-company market multiples, such as recent divestitures/acquisitions, facts and circumstances surrounding the market and growth rates. Management assesses the relevance and reliability of the multiples by considering factors unique to its reporting units, including recent operating results, business plans, economic projections, anticipated future cash flows, and other data. EBITDA and revenue multiples can also be significantly impacted by future growth opportunities for the reporting unit as well as for the company itself, general market and geographic sentiment, and pending or recently completed merger transactions.
These tests showed no evidence of impairment to our goodwill for fiscal 2015, 2014 or 2013 and demonstrated that the fair value of each reporting unit exceeded the reporting unit’s carrying value in each period. During March 2014, circumstances arose that indicated a potential impairment. We performed an interim impairment test and noted that the fair value of our reporting units still exceeded their carrying values.
We review intangible assets subject to amortization at least annually or more frequently if certain conditions arise to determine if any adverse conditions exist that would indicate that the carrying value of an asset or asset group may not be recoverable, or that a change in the remaining useful life is required. Conditions indicating that an impairment exists include but are not limited to a change in the competitive landscape, internal decisions to pursue new or different technology strategies, a loss of a significant customer or a significant change in the marketplace including prices paid for our products or the size of the market for our products. During March 2014, circumstances arose that indicated a potential impairment of certain intangible assets subject to amortization. We performed the recoverability test described below for the relevant asset group and determined expected undiscounted cash flows exceeded the carrying value of the asset group.
If an impairment indicator exists, we test the intangible asset for recoverability. For purposes of the recoverability test, we group our amortizable intangible assets with other assets and liabilities at the lowest level of identifiable cash flows if the intangible asset does not generate cash flows independent of other assets and liabilities. If the carrying value of the intangible asset (asset group) exceeds the undiscounted cash flows expected to result from the use and eventual disposition of the intangible asset (asset group), we will write the carrying value down to the fair value in the period identified.
We generally calculate fair value of our intangible assets as the present value of estimated future cash flows we expect to generate from the asset using a risk-adjusted discount rate. In determining our estimated future cash flows associated with our intangible assets, we use estimates and assumptions about future revenue contributions, cost structures and remaining useful lives of the asset (asset group).
If we determine the estimate of an intangible asset's remaining useful life should be reduced based on our expected use of the asset, the remaining carrying amount of the asset is amortized prospectively over the revised estimated useful life.
40
Inventory Provisions
We base our provisions for excess, expired and obsolete inventory primarily on our estimates of forecasted net sales. A significant change in the timing or level of demand for our products as compared to forecasted amounts may result in recording additional provisions for excess, expired and obsolete inventory in the future. Additionally, uncertain timing of next-generation product approvals, variability in product launch strategies, product recalls and variation in product utilization all affect our estimates related to excess, expired and obsolete inventory.
Income Taxes
The income tax provision is calculated for all jurisdictions in which we operate. The income tax provision process involves calculating current taxes due and assessing temporary differences arising from items which are taxable or deductible in different periods for tax and accounting purposes and are recorded as deferred tax assets and liabilities. Deferred tax assets are evaluated for realizability and a valuation allowance is maintained for the portion of our deferred tax assets that are not more-likely-than-not realizable.
We file income tax returns in all jurisdictions in which we operate. We record a liability for uncertain tax positions taken or expected to be taken in income tax returns. Our financial statements reflect expected future tax consequences of such positions presuming the taxing authorities' full knowledge of the position and all relevant facts. We record a liability for the portion of unrecognized tax benefits claimed which we have determined are not more-likely-than-not realizable. These tax reserves have been established based on management's assessment as to the potential exposure attributable to our uncertain tax positions as well as interest and penalties attributable to these uncertain tax positions. All tax reserves are analyzed quarterly and adjustments are made as events occur that result in changes in judgment.
Valuation of Acquisitions
We allocate the amounts we pay for each acquisition to the assets we acquire and liabilities we assume based on their estimated fair values at the dates of acquisition, including acquired identifiable intangible assets, and purchased research and development. We base the estimated fair value of identifiable intangible assets on detailed valuations that use historical and forecasted information and market assumptions based upon the assumptions of a market participant. We allocate any excess purchase price over the fair value of the net tangible and intangible assets acquired to goodwill.
In certain acquisitions, we have earn-out arrangements or contingent consideration to provide potential future payments to the seller for achieving certain agreed-upon financial targets. We record the contingent consideration at its fair value at the acquisition date. Generally, we have entered into arrangements with contingent consideration that require payments in cash. As such, we periodically revalue the contingent consideration obligations associated with certain acquisitions to their current fair value and record the change in the fair value as contingent consideration income or expense within selling, general and administrative expense. Increases or decreases in the fair value of the contingent consideration obligations can result from changes in assumed discount periods and rates, changes in the assumed timing and amount of revenue and expense estimates, and changes in assumed probability adjustments with respect to regulatory approval. Significant judgment is employed in determining the appropriateness of these assumptions as of the acquisition date and for each subsequent period. Accordingly, future business and economic conditions, as well as changes in any of the assumptions described above, can materially impact the amount of contingent consideration income or expense we record in any given period.
Contingencies
We may become involved in various legal proceedings that arise in the ordinary course of business, including, without limitation, patent infringement, product liability and environmental matters. Accruals recorded for various contingencies including legal proceedings, self-insurance and other claims are based on judgment, the probability of losses and, where applicable, the consideration of opinions of internal and/or external legal counsel and actuarially determined estimates. When a range is established but a best estimate cannot be made, we record the minimum loss contingency amount. These estimates are often initially developed substantially earlier than the ultimate loss is known, and the estimates are reevaluated each accounting period, as additional information is available. When we are initially unable to develop a best estimate of loss, we record the minimum amount of loss, which could be zero. As information becomes known, additional loss provision is recorded when either a best estimate can be made or the minimum loss amount is increased. When events result in an expectation of a more favorable outcome than previously expected, our best estimate is changed to a lower amount.
41
Cautionary Statement Regarding Forward-Looking Information
Statements contained in this report, as well as oral statements we make which are prefaced with the words “may,” “will,” “expect,” “anticipate,” “continue,” “estimate,” “project,” “intend,” “designed,” and similar expressions, are intended to identify forward looking statements regarding events, conditions, and financial trends that may affect our future plans of operations, business strategy, results of operations, and financial position. These statements are based on our current expectations and estimates as to prospective events and circumstances about which we can give no firm assurance. Further, any forward-looking statement speaks only as of the date on which such statement is made, and we undertake no obligation to update any forward-looking statement to reflect events or circumstances after the date on which such statement is made. As it is not possible to predict every new factor that may emerge, forward-looking statements should not be relied upon as a prediction of our actual future financial condition or results. These forward-looking statements, like any forward-looking statements, involve risks and uncertainties that could cause actual results to differ materially from those projected or anticipated, including: the effects of disruption from the manufacturing transformation making it more difficult to maintain relationships with employees and timely deliver high quality products, unexpected expenses incurred during our VCC initiatives, technological advances in the medical field and standards for transfusion medicine, our ability to successfully implement products that incorporate such advances and standards, demand for whole blood and blood components, product quality, market acceptance, regulatory uncertainties, the ability of our contract manufacturing vendors to timely supply high quality goods, the effect of economic and political conditions, the impact of competitive products and pricing, blood product reimbursement policies and practices, foreign currency exchange rates, changes in customers’ ordering patterns including single-source tenders, the effect of industry consolidation as seen in the plasma and blood center markets, the effect of communicable diseases and the effect of uncertainties in markets outside the U.S. (including Europe and Asia) in which we operate and such other risks described under Item 1A. Risk Factors included in this report. The foregoing list should not be construed as exhaustive.
42
ITEM 7A. QUANTITATIVE AND QUALITATIVE DISCLOSURES ABOUT MARKET RISK
The Company’s exposures relative to market risk are due to foreign exchange risk and interest rate risk.
Foreign Exchange Risk
See the section above entitled Foreign Exchange for a discussion of how foreign currency affects our business. It is our policy to minimize, for a period of time, the unforeseen impact on our financial results of fluctuations in foreign exchange rates by using derivative financial instruments known as forward contracts to hedge anticipated cash flows from forecasted foreign currency denominated sales and costs. We do not use the financial instruments for speculative or trading activities. At March 28, 2015, we had the following significant foreign exchange contracts to hedge the anticipated foreign currency cash flows outstanding.
Hedged Currency | (BUY)/SELL Local Currency | Weighted Spot Contract Rate | Weighted Forward Contract Rate | Fair Value Gain/(Loss) | Maturity | Quarter Expected to Affect Earnings | |||||||||||
EUR | 9,499,000 | 1.354 | 1.356 | $ | 2,523,176 | Mar 2015 - May 2015 | Q1 FY16 | ||||||||||
EUR | 8,700,000 | 1.293 | 1.298 | $ | 1,768,500 | Jun 2015 - Aug 2015 | Q2 FY16 | ||||||||||
EUR | 11,450,000 | 1.246 | 1.250 | $ | 1,748,953 | Sep 2015 - Nov 2015 | Q3 FY16 | ||||||||||
EUR | 13,008,000 | 1.131 | 1.137 | $ | 533,176 | Dec 2015 - Feb 2016 | Q4 FY16 | ||||||||||
JPY | 701,018,000 | 102.10 per USD | 101.83 per USD | $ | 986,543 | Mar 2015 - May 2015 | Q1 FY16 | ||||||||||
JPY | 979,914,000 | 106.84 per USD | 106.42 per USD | $ | 944,966 | Jun 2015 - Aug 2015 | Q2 FY16 | ||||||||||
JPY | 1,229,976,000 | 118.46 per USD | 117.91 per USD | $ | 67,338 | Sep 2015 - Nov 2015 | Q3 FY16 | ||||||||||
JPY | 1,242,192,000 | 117.25 per USD | 116.56 per USD | $ | 157,349 | Dec 2015 - Feb 2016 | Q4 FY16 | ||||||||||
GBP | (602,000 | ) | 1.579 | 1.577 | $ | (51,935 | ) | Feb 2015 - Apr 2015 | Q1 FY16 | ||||||||
GBP | (1,874,000 | ) | 1.569 | 1.567 | $ | (141,298 | ) | May 2015 - Jul 2015 | Q2 FY16 | ||||||||
GBP | (1,589,000 | ) | 1.566 | 1.563 | $ | (113,125 | ) | Aug 2015 - Oct 2015 | Q3 FY16 | ||||||||
GBP | (1,264,000 | ) | 1.528 | 1.526 | $ | (43,871 | ) | Nov 2015 - Jan 2016 | Q4 FY16 | ||||||||
GBP | (340,000 | ) | 1.552 | 1.550 | $ | (19,354 | ) | Feb 2015 - Apr 2016 | Q1 FY17 | ||||||||
CHF | (5,189,000 | ) | 0.90 per USD | 0.89 per USD | $ | (392,208 | ) | Apr 2015 - Jun 2015 | Q1 FY16 | ||||||||
CHF | (5,439,000 | ) | 0.95 per USD | 0.94 per USD | $ | (82,370 | ) | Jul 2015 - Sep 2015 | Q2 FY16 | ||||||||
CHF | (5,103,000 | ) | 0.94 per USD | 0.93 per USD | $ | (113,002 | ) | Oct 2015 - Dec 2015 | Q3 FY16 | ||||||||
CHF | (4,689,000 | ) | 0.92 per USD | 0.90 per USD | $ | (252,731 | ) | Jan 2016 - Mar 2016 | Q4 FY16 | ||||||||
CAD | (1,333,000 | ) | 1.13 per USD | 1.14 per USD | $ | (105,925 | ) | Apr 2015 - Jun 2015 | Q1 FY16 | ||||||||
CAD | (1,611,000 | ) | 1.14 per USD | 1.15 per USD | $ | (117,024 | ) | Jul 2015 - Sep 2015 | Q2 FY16 | ||||||||
CAD | (1,483,000 | ) | 1.18 per USD | 1.18 per USD | $ | (68,843 | ) | Oct 2015 - Dec 2015 | Q3 FY16 | ||||||||
CAD | (1,326,000 | ) | 1.25 per USD | 1.25 per USD | $ | (4,595 | ) | Jan 2016 - Mar 2016 | Q4 FY16 | ||||||||
MXN | (12,750,000 | ) | 12.99 per USD | 13.27 per USD | $ | (118,655 | ) | Feb 2015 - Apr 2015 | Q1 FY16 | ||||||||
MXN | (40,240,000 | ) | 13.07 per USD | 13.36 per USD | $ | (360,073 | ) | May 2015 - Jul 2015 | Q2 FY16 | ||||||||
MXN | (42,679,000 | ) | 13.63 per USD | 13.90 per USD | $ | (274,061 | ) | Aug 2015 - Oct 2015 | Q3 FY16 | ||||||||
MXN | (45,630,000 | ) | 14.46 per USD | 14.76 per USD | $ | (125,057 | ) | Nov 2015 - Jan 2016 | Q4 FY16 | ||||||||
MXN | (14,299,000 | ) | 14.93 per USD | 15.29 per USD | $ | (11,117 | ) | Feb 2016 - Apr 2016 | Q1 FY17 | ||||||||
AUD | 1,835,000 | 0.938 | 0.919 | $ | 259,896 | Jan 2015 - Mar 2015 | Q1 FY16 | ||||||||||
AUD | 2,634,000 | 0.911 | 0.891 | $ | 304,346 | Apr 2015 - Jun 2015 | Q2 FY16 | ||||||||||
AUD | 2,700,000 | 0.849 | 0.830 | $ | 156,488 | Jul 2015 - Sep 2015 | Q3 FY16 | ||||||||||
AUD | 2,559,000 | 0.792 | 0.777 | $ | 24,312 | Oct 2015 - Dec 2015 | Q4 FY16 | ||||||||||
$ | 7,079,799 | ||||||||||||||||
We estimate the change in the fair value of all forward contracts assuming both a 10% strengthening and weakening of the U.S. dollar relative to all other major currencies. In the event of a 10% strengthening of the U.S. dollar, the change in fair value of all forward contracts would result in a $7.8 million increase in the fair value of the forward contracts; whereas a 10% weakening of the U.S. dollar would result in a $8.1 million decrease in the fair value of the forward contracts.
43
Interest Rate Risk
Our exposure to changes in interest rates is associated with borrowings on our Credit Agreement, all of which is variable rate debt. All other long-term debt is at fixed rates. Total outstanding debt under our Credit Facilities for the fiscal year ended March 28, 2015 was $429.4 million with an interest rate of 1.563% based on prevailing Adjusted LIBOR rates. An increase of 100 basis points in Adjusted LIBOR rates would result in additional annual interest expense of $4.3 million. On December 21, 2012, we entered into interest rate swap agreements to effectively convert $250.0 million of borrowings from a variable rate to a fixed rate. The interest rate swaps qualify for hedge accounting treatment as cash flow hedges.
44
Report of Independent Registered Public Accounting Firm
The Board of Directors and Stockholders of Haemonetics Corporation
We have audited the accompanying consolidated balance sheets of Haemonetics Corporation and subsidiaries as of March 28, 2015 and March 29, 2014, and the related consolidated statements of income, comprehensive (loss) income, shareholders' equity and cash flows for each of the three years in the period ended March 28, 2015. Our audits also included the financial statement schedule listed in the Index at Item 15(a). These financial statements and schedule are the responsibility of the Company's management. Our responsibility is to express an opinion on these financial statements and schedule based on our audits.
We conducted our audits in accordance with the standards of the Public Company Accounting Oversight Board (United States). Those standards require that we plan and perform the audit to obtain reasonable assurance about whether the financial statements are free of material misstatement. An audit includes examining, on a test basis, evidence supporting the amounts and disclosures in the financial statements. An audit also includes assessing the accounting principles used and significant estimates made by management, as well as evaluating the overall financial statement presentation. We believe that our audits provide a reasonable basis for our opinion.
In our opinion, the financial statements referred to above present fairly, in all material respects, the consolidated financial position of Haemonetics Corporation and subsidiaries at March 28, 2015 and March 29, 2014, and the consolidated results of their operations and their cash flows for each of the three years in the period ended March 28, 2015, in conformity with U.S. generally accepted accounting principles. Also, in our opinion, the related financial statement schedule, when considered in relation to the basic financial statements taken as a whole, presents fairly, in all material respects, the information set forth therein.
We also have audited, in accordance with the standards of the Public Company Accounting Oversight Board (United States), Haemonetics Corporation and subsidiaries' internal control over financial reporting as of March 28, 2015, based on criteria established in Internal Control-Integrated Framework issued by the Committee of Sponsoring Organizations of the Treadway Commission (2013 framework) and our report dated May 22, 2015 expressed an unqualified opinion thereon.
/s/ Ernst & Young LLP
Boston, Massachusetts
May 22, 2015
45
ITEM 8. FINANCIAL STATEMENTS AND SUPPLEMENTARY DATA
HAEMONETICS CORPORATION AND SUBSIDIARIES
CONSOLIDATED STATEMENTS OF INCOME
(In thousands, except per share data)
Year Ended | |||||||||||
March 28, 2015 | March 29, 2014 | March 30, 2013 | |||||||||
Net revenues | $ | 910,373 | $ | 938,509 | $ | 891,990 | |||||
Cost of goods sold | 475,955 | 470,144 | 463,859 | ||||||||
Gross profit | 434,418 | 468,365 | 428,131 | ||||||||
Operating expenses: | |||||||||||
Research and development | 54,187 | 54,200 | 44,394 | ||||||||
Selling, general and administrative | 334,250 | 366,022 | 323,053 | ||||||||
Asset write-down | 5,441 | 1,711 | 4,247 | ||||||||
Total operating expenses | 393,878 | 421,933 | 371,694 | ||||||||
Operating income | 40,540 | 46,432 | 56,437 | ||||||||
Other (expense) income, net | (9,375 | ) | (10,031 | ) | (6,540 | ) | |||||
Income before provision for income taxes | 31,165 | 36,401 | 49,897 | ||||||||
Provision for income taxes | 14,268 | 1,253 | 11,097 | ||||||||
Net income | $ | 16,897 | $ | 35,148 | $ | 38,800 | |||||
Net income per share - basic | $ | 0.33 | $ | 0.68 | $ | 0.76 | |||||
Net income per share - diluted | $ | 0.32 | $ | 0.67 | $ | 0.74 | |||||
Weighted average shares outstanding | |||||||||||
Basic | 51,533 | 51,611 | 51,349 | ||||||||
Diluted | 52,089 | 52,377 | 52,259 | ||||||||
The accompanying notes are an integral part of these consolidated financial statements.
46
HAEMONETICS CORPORATION AND SUBSIDIARIES
CONSOLIDATED STATEMENTS OF COMPREHENSIVE (LOSS) INCOME
(In thousands)
Year Ended | |||||||||||
March 28, 2015 | March 29, 2014 | March 30, 2013 | |||||||||
Net income | $ | 16,897 | $ | 35,148 | $ | 38,800 | |||||
Other comprehensive loss: | |||||||||||
Impact of defined benefit plans, net of tax | (4,331 | ) | 481 | (820 | ) | ||||||
Foreign currency translation adjustment | (23,710 | ) | (935 | ) | (4,705 | ) | |||||
Unrealized gain on cash flow hedges, net of tax | 11,371 | 5,001 | 4,594 | ||||||||
Reclassifications into earnings of cash flow hedge gains, net of tax | (6,464 | ) | (8,570 | ) | (2,746 | ) | |||||
Other comprehensive loss | (23,134 | ) | (4,023 | ) | (3,677 | ) | |||||
Comprehensive (loss) income | $ | (6,237 | ) | $ | 31,125 | $ | 35,123 | ||||
The accompanying notes are an integral part of these consolidated financial statements.
47
HAEMONETICS CORPORATION AND SUBSIDIARIES
CONSOLIDATED BALANCE SHEETS
(In thousands, except per share data)
March 28, 2015 | March 29, 2014 | ||||||
ASSETS | |||||||
Current assets: | |||||||
Cash and cash equivalents | $ | 160,662 | $ | 192,469 | |||
Accounts receivable, less allowance of $1,749 at March 28, 2015 and $1,676 at March 29, 2014 | 145,827 | 164,603 | |||||
Inventories, net | 211,077 | 197,661 | |||||
Deferred tax asset, net | 12,608 | 14,144 | |||||
Prepaid expenses and other current assets | 40,103 | 54,099 | |||||
Total current assets | 570,277 | 622,976 | |||||
Property, plant and equipment, net | 321,948 | 271,437 | |||||
Intangible assets, net | 244,588 | 271,159 | |||||
Goodwill | 334,310 | 336,768 | |||||
Deferred tax asset, long term | 3,023 | 1,184 | |||||
Other long-term assets | 11,271 | 10,654 | |||||
Total assets | $ | 1,485,417 | $ | 1,514,178 | |||
LIABILITIES AND STOCKHOLDERS’ EQUITY | |||||||
Current liabilities: | |||||||
Notes payable and current maturities of long-term debt | $ | 21,522 | $ | 45,630 | |||
Accounts payable | 48,425 | 53,562 | |||||
Accrued payroll and related costs | 51,115 | 54,913 | |||||
Accrued taxes | 3,819 | 3,113 | |||||
Other current liabilities | 64,211 | 59,710 | |||||
Total current liabilities | 189,092 | 216,928 | |||||
Long-term debt, net of current maturities | 406,369 | 392,057 | |||||
Long-term deferred tax liability | 32,097 | 29,664 | |||||
Other long-term liabilities | 31,737 | 37,641 | |||||
Stockholders’ equity: | |||||||
Common stock, $0.01 par value; Authorized — 150,000,000 shares; Issued and outstanding — 51,670,969 shares at March 28, 2015 and 52,041,189 shares at March 29, 2014 | 517 | 520 | |||||
Additional paid-in capital | 426,964 | 402,611 | |||||
Retained earnings | 420,365 | 433,347 | |||||
Accumulated other comprehensive (loss) income | (21,724 | ) | 1,410 | ||||
Total stockholders’ equity | 826,122 | 837,888 | |||||
Total liabilities and stockholders’ equity | $ | 1,485,417 | $ | 1,514,178 | |||
The accompanying notes are an integral part of these consolidated financial statements.
48
HAEMONETICS CORPORATION AND SUBSIDIARIES
CONSOLIDATED STATEMENT OF STOCKHOLDERS’ EQUITY
(In thousands, except per share data)
Common Stock | Additional Paid-in | Retained | Accumulated Other Comprehensive | Total Stockholders’ | ||||||||||||||||||
Shares | Par Value | Capital | Earnings | Income/(Loss) | Equity | |||||||||||||||||
Balance, March 31, 2012 | 50,604 | $ | 506 | $ | 322,232 | $ | 400,783 | $ | 9,110 | $ | 732,631 | |||||||||||
Employee stock purchase plan | 151 | 1 | 4,141 | — | — | 4,142 | ||||||||||||||||
Exercise of stock options and related tax benefit | 1,398 | 14 | 35,801 | — | — | 35,815 | ||||||||||||||||
Stock-based compensation adjustment related to acquisition | — | — | 504 | — | — | 504 | ||||||||||||||||
Shares repurchased | (1,236 | ) | (12 | ) | (8,607 | ) | (41,384 | ) | — | (50,003 | ) | |||||||||||
Issuance of restricted stock, net of cancellations | 115 | 1 | — | — | — | 1 | ||||||||||||||||
Stock compensation expense | — | — | 10,969 | — | — | 10,969 | ||||||||||||||||
Net income | — | — | — | 38,800 | — | 38,800 | ||||||||||||||||
Other comprehensive loss | — | — | — | — | (3,677 | ) | (3,677 | ) | ||||||||||||||
Balance, March 30, 2013 | 51,032 | $ | 510 | $ | 365,040 | $ | 398,199 | $ | 5,433 | $ | 769,182 | |||||||||||
Employee stock purchase plan | 161 | 2 | 5,227 | — | — | 5,229 | ||||||||||||||||
Exercise of stock options and related tax benefit | 740 | 7 | 19,263 | — | — | 19,270 | ||||||||||||||||
Issuance of restricted stock, net of cancellations | 108 | 1 | — | — | — | 1 | ||||||||||||||||
Stock compensation expense | — | — | 13,081 | — | — | 13,081 | ||||||||||||||||
Net income | — | — | — | 35,148 | — | 35,148 | ||||||||||||||||
Other comprehensive loss | — | — | — | — | (4,023 | ) | (4,023 | ) | ||||||||||||||
Balance, March 29, 2014 | 52,041 | $ | 520 | $ | 402,611 | $ | 433,347 | $ | 1,410 | $ | 837,888 | |||||||||||
Employee stock purchase plan | 183 | 2 | 4,761 | — | — | 4,763 | ||||||||||||||||
Exercise of stock options and related tax benefit | 500 | 5 | 14,640 | — | — | 14,645 | ||||||||||||||||
Shares repurchased | (1,174 | ) | (11 | ) | (9,143 | ) | (29,879 | ) | — | (39,033 | ) | |||||||||||
Issuance of restricted stock, net of cancellations | 121 | 1 | — | — | — | 1 | ||||||||||||||||
Stock compensation expense | — | — | 14,095 | — | — | 14,095 | ||||||||||||||||
Net income | — | — | — | 16,897 | — | 16,897 | ||||||||||||||||
Other comprehensive loss | — | — | — | — | (23,134 | ) | (23,134 | ) | ||||||||||||||
Balance, March 28, 2015 | 51,671 | $ | 517 | $ | 426,964 | $ | 420,365 | $ | (21,724 | ) | $ | 826,122 | ||||||||||
The accompanying notes are an integral part of these consolidated financial statements.
49
HAEMONETICS CORPORATION AND SUBSIDIARIES
CONSOLIDATED STATEMENTS OF CASH FLOWS
(In thousands)
Year Ended | |||||||||||
March 28, 2015 | March 29, 2014 | March 30, 2013 | |||||||||
Cash Flows from Operating Activities: | |||||||||||
Net income | $ | 16,897 | $ | 35,148 | $ | 38,800 | |||||
Adjustments to reconcile net income to net cash provided by operating activities: | |||||||||||
Non-cash items: | |||||||||||
Depreciation and amortization | 86,053 | 81,740 | 65,481 | ||||||||
Amortization of financing costs | 1,013 | 1,505 | 1,139 | ||||||||
Stock compensation expense | 14,095 | 13,081 | 10,969 | ||||||||
Deferred tax expense | 4,230 | (202 | ) | 589 | |||||||
Purchased in process research and development | — | 3,569 | — | ||||||||
Loss on sale of property, plant and equipment | 42 | 293 | 351 | ||||||||
Unrealized (gain)/loss from hedging activities | 1,558 | (128 | ) | 700 | |||||||
Changes in fair value of contingent consideration | (2,918 | ) | 45 | — | |||||||
Asset write-down | 5,877 | 2,587 | 4,247 | ||||||||
Change in operating assets and liabilities: | |||||||||||
Decrease/(increase) in accounts receivable, net | 8,835 | 6,154 | (38,080 | ) | |||||||
Increase in inventories | (16,932 | ) | (12,684 | ) | (18,685 | ) | |||||
(Increase)/decrease in prepaid income taxes | 10,662 | 1,175 | (4,025 | ) | |||||||
Decrease/(increase) in other assets and other long-term liabilities | (8,013 | ) | 3,176 | (6,187 | ) | ||||||
Tax benefit of exercise of stock options | 3,786 | 1,649 | 4,194 | ||||||||
Increase in accounts payable and accrued expenses | 1,993 | 2,416 | 25,581 | ||||||||
Net cash provided by operating activities | 127,178 | 139,524 | 85,074 | ||||||||
Cash Flows from Investing Activities: | |||||||||||
Capital expenditures on property, plant and equipment | (122,220 | ) | (73,648 | ) | (62,188 | ) | |||||
Proceeds from sale of property, plant and equipment | 452 | 488 | 1,968 | ||||||||
Acquisition of Whole Blood Business | — | — | (535,175 | ) | |||||||
Acquisition of Hemerus | — | (23,124 | ) | (1,000 | ) | ||||||
Other acquisitions | — | (9,546 | ) | — | |||||||
Net cash used in investing activities | (121,768 | ) | (105,830 | ) | (596,395 | ) | |||||
Cash Flows from Financing Activities: | |||||||||||
Payments on long-term real estate mortgage | (1,048 | ) | (964 | ) | (886 | ) | |||||
Net (decrease)/increase in short-term loans | 843 | (5,521 | ) | 7,446 | |||||||
Term loan borrowings | — | — | 475,000 | ||||||||
Repayment of term loan borrowings | (8,531 | ) | (37,063 | ) | — | ||||||
Debt issuance costs | (1,013 | ) | — | (5,467 | ) | ||||||
Proceeds from employee stock purchase plan | 4,763 | 5,229 | 4,142 | ||||||||
Proceeds from exercise of stock options | 9,290 | 15,224 | 27,517 | ||||||||
Excess tax benefit on exercise of stock options | 1,569 | 2,395 | 4,101 | ||||||||
Share repurchase | (39,033 | ) | — | (50,000 | ) | ||||||
Net cash (used in)/provided by financing activities | (33,160 | ) | (20,700 | ) | 461,853 | ||||||
Effect of exchange rates on cash and cash equivalents | (4,057 | ) | 355 | (273 | ) | ||||||
Net Increase/(Decrease) in Cash and Cash Equivalents | (31,807 | ) | 13,349 | (49,741 | ) | ||||||
Cash and Cash Equivalents at Beginning of Year | 192,469 | 179,120 | 228,861 | ||||||||
Cash and Cash Equivalents at End of Year | $ | 160,662 | $ | 192,469 | $ | 179,120 | |||||
Non-cash Investing and Financing Activities: | |||||||||||
Transfers from inventory to fixed assets for placement of Haemonetics equipment | $ | 7,458 | $ | 10,584 | $ | 21,677 | |||||
Supplemental Disclosures of Cash Flow Information: | |||||||||||
Interest paid | $ | 8,497 | $ | 8,942 | $ | 5,910 | |||||
Income taxes paid | $ | 11,211 | $ | 7,261 | $ | 13,178 | |||||
The accompanying notes are an integral part of these consolidated financial statements
50
HAEMONETICS CORPORATION AND SUBSIDIARIES
NOTES TO CONSOLIDATED FINANCIAL STATEMENTS
1. DESCRIPTION OF THE BUSINESS AND BASIS OF PRESENTATION
Haemonetics is a global healthcare company dedicated to providing innovative blood management solutions for our customers — plasma collectors, blood collectors, and hospitals. Anchored by our strong brand name in medical device systems for the transfusion industry, we also provide information technology platforms and value added services to provide customers with business solutions which support improved care for patients and efficiency in the blood supply chain.
Our systems automate the collection and processing of donated blood; perform blood diagnostics; salvage and process surgical patient blood; and dispense blood within the hospital. These systems include devices and single-use, proprietary disposable sets that operate only on our specialized equipment. Our manual blood collection and filtration systems enable the manual collection of all blood components while detecting bacteria, thus reducing the risks of infection through transfusion. Our blood processing systems allow users to collect and process only the blood component(s) they target — plasma, platelets, or red blood cells — increasing donor and patient safety as well as collection efficiencies. Our blood diagnostics system assesses the likelihood of a patient’s blood loss allowing clinicians to make informed decisions about a patient’s treatment as it relates to blood loss in surgery. Our surgical blood salvage systems collect blood lost by a patient in surgery, clean the blood, and make it available for reinfusion to the patient, in this way giving the patient the safest blood possible — his or her own. Our blood distribution systems are “smart” refrigerators located throughout hospitals which automate the storage, inventory tracking, and dispositioning of blood in key blood use areas.
Our information technology platforms are used by blood and plasma collectors to improve the safety and efficiency of blood collection logistics by eliminating previously manual functions at not-for-profit blood centers and commercial plasma centers which are operated by our bio-pharmaceutical customers. Our platforms are also used by hospitals to enable hospital administrators to monitor and measure blood management practices and to manage processes within transfusion services. Our information technology platforms allow all customers to better manage processes across the blood supply chain, comply with regulatory requirements, and identify increased opportunities to reduce costs.
On November 30, 2012 we completed a two-for-one split of our common stock in the form of a stock dividend. Unless otherwise indicated, all common stock shares and per share information referenced within the Consolidated Financial Statements have been retroactively adjusted to reflect the stock split. The exercise price of each outstanding option has also been proportionately and retroactively adjusted for all periods presented. Par value per share and authorized shares were however not affected by the stock split.
The accompanying consolidated financial statements have been prepared in accordance with U.S. generally accepted accounting principles (“U.S. GAAP”). The accompanying consolidated financial statements present separately our financial position, results of operations, cash flows, and changes in shareholders’ equity. All amounts presented, except per share amounts, are stated in thousands of U.S. dollars, unless otherwise indicated.
We consider events or transactions that occur after the balance sheet date but prior to the issuance of the financial statements to provide additional evidence relative to certain estimates or to identify matters that require additional disclosure. Subsequent events have been evaluated, and there were no material items that arose after the balance sheet date but prior to the issuance of the financial statements that would be considered recognized subsequent events.
2. SUMMARY OF SIGNIFICANT ACCOUNTING POLICIES
Fiscal Year
Our fiscal year ends on the Saturday closest to the last day of March. Fiscal years 2015, 2014 and 2013 each includes 52 weeks with each quarter having 13 weeks.
Principles of Consolidation
The accompanying consolidated financial statements include all accounts including those of our subsidiaries. All significant intercompany accounts and transactions have been eliminated in consolidation.
51
HAEMONETICS CORPORATION AND SUBSIDIARIES
NOTES TO CONSOLIDATED FINANCIAL STATEMENTS — (Continued)
Use of Estimates
The preparation of financial statements in conformity with GAAP requires us to make estimates and assumptions that affect the reported amounts of assets and liabilities and disclosure of contingent assets and liabilities at the date of the financial statements and the reported amounts of revenues and expenses during the reporting period. Actual results could vary from the amounts derived from our estimates and assumptions.
Reclassifications
Certain reclassifications have been made to prior years' amounts to conform to the current year's presentation.
Contingencies
We may become involved in various legal proceedings that arise in the ordinary course of business, including, without limitation, patent infringement, product liability and environmental matters. Accruals recorded for various contingencies including legal proceedings, self-insurance and other claims are based on judgment, the probability of losses and, where applicable, the consideration of opinions of internal and/or external legal counsel and actuarially determined estimates. When a range is established but a best estimate cannot be made, we record the minimum loss contingency amount. These estimates are often initially developed substantially earlier than the ultimate loss is known, and the estimates are reevaluated each accounting period, as additional information is available. When we are initially unable to develop a best estimate of loss, we record the minimum amount of loss, which could be zero. As information becomes known, additional loss provision is recorded when either a best estimate can be made or the minimum loss amount is increased. When events result in an expectation of a more favorable outcome than previously expected, our best estimate is changed to a lower amount.
Revenue Recognition
Our revenue recognition policy is to recognize revenues from product sales, software and services in accordance with ASC Topic 605, Revenue Recognition, and ASC Topic 985-605, Software. These standards require that revenues are recognized when persuasive evidence of an arrangement exists, product delivery, including customer acceptance, has occurred or services have been rendered, the price is fixed or determinable and collectability is reasonably assured. We may have multiple contracts with the same customer and each contract is typically treated as a separate arrangement. When more than one element such as equipment, disposables, and services are contained in a single arrangement, we allocate revenue between the elements based on each element’s relative selling price, provided that each element meets the criteria for treatment as a separate unit of accounting. An item is considered a separate unit of accounting if it has value to the customer on a stand-alone basis. The selling price of the undelivered elements is determined by the price charged when the element is sold separately, or in cases when the item is not sold separately, by third-party evidence of selling price or by management's best estimate of selling price. For our software arrangements accounted for under the provisions of ASC 985-605, Software, we establish fair value of undelivered elements based upon vendor specific objective evidence.
Product Revenues
Product sales consist of the sale of our disposable blood component collection and processing sets and the related equipment. On product sales to end customers, revenue is recognized when both the title and risk of loss have transferred to the customer as determined by the shipping terms and all obligations have been completed. For product sales to distributors, we recognize revenue for both equipment and disposables upon shipment of these products to our distributors. Our standard contracts with our distributors state that title to the equipment passes to the distributors at point of shipment to a distributor’s location. The distributors are responsible for shipment to the end customer along with installation, training and acceptance of the equipment by the end customer. Payments from distributors are not contingent upon resale of the product.
Software Revenues
Our software solutions business provides support to our plasma, blood collection and hospital customers. We provide information technology platforms and technical support for donor recruitment, blood and plasma testing laboratories, and for efficient and compliant operations of blood and plasma collection centers. For plasma customers, we also provide information technology platforms for managing distribution of plasma from collection centers to plasma fractionation facilities. For hospitals, we provide solutions to help improve patient safety, reduce cost and ensure compliance.
Our software solutions revenues also include revenue from software sales which includes per collection or monthly subscription fees for the license and support of the software as well as hosting services. A significant portion of our software
52
HAEMONETICS CORPORATION AND SUBSIDIARIES
NOTES TO CONSOLIDATED FINANCIAL STATEMENTS — (Continued)
sales are perpetual licenses typically accompanied with significant implementation service fees related to software customization as well as other professional and technical service fees.
We generally recognize revenue from the sale of perpetual licenses on a percentage-of-completion basis which requires us to make reasonable estimates of the extent of progress toward completion of the contract. These arrangements most often include providing customized implementation services to our customer. We also provide other services, including in some instances hosting, technical support, and maintenance, for the payment of periodic, monthly, or quarterly fees. We recognize these fees and charges as earned, typically as these services are provided during the contract period.
Non-Income Taxes
We are required to collect sales or valued added taxes in connection with the sale of certain of our products. We report revenues net of these amounts as they are promptly remitted to the relevant taxing authority.
We are also required to pay a medical device excise tax relating to U.S. sales of Class I, II and III medical devices. This excise tax went into effect January 1, 2013, established as part of the March 2010 U.S. healthcare reform legislation, and has been included in selling, general and administrative expenses.
Translation of Foreign Currencies
All assets and liabilities of foreign subsidiaries are translated at the rate of exchange at year-end while sales and expenses are translated at an average rate in effect during the year. The net effect of these translation adjustments is shown in the accompanying financial statements as a component of stockholders' equity. Foreign currency transaction gains and losses, including those resulting from inter-company transactions, are charged directly to earnings and included in other (expense) income, net on the consolidated statements of income. The impact of foreign exchange on long-term intercompany loans, for which repayment has not been scheduled or planned, are recorded in accumulated other comprehensive income on the consolidated balance sheet.
Cash and Cash Equivalents
Cash equivalents include various instruments such as money market funds, U.S. government obligations and commercial paper with maturities of three months or less at date of acquisition. Cash and cash equivalents are recorded at cost, which approximates fair market value. As of March 28, 2015, our cash and cash equivalents consisted of investments in United States Government Agency and institutional money market funds.
Allowance for Doubtful Accounts
We establish a specific allowance for customers when it is probable that they will not be able to meet their financial obligation. Customer accounts are reviewed individually on a regular basis and appropriate reserves are established as deemed appropriate. We also maintain a general reserve using a percentage that is established based upon the age of our receivables and our collection history. We establish allowances for balances not yet due and past due accounts based on past experience.
Property, Plant and Equipment
Property, plant and equipment is recorded at historical cost. We provide for depreciation and amortization by charges to operations using the straight-line method in amounts estimated to recover the cost of the building and improvements, equipment, and furniture and fixtures over their estimated useful lives as follows:
Asset Classification | Estimated Useful Lives | |
Building | 30 Years | |
Building improvements | 5-20 Years | |
Plant equipment and machinery | 3-15 Years | |
Office equipment and information technology | 3-10 Years | |
Haemonetics equipment | 3-7 Years | |
53
HAEMONETICS CORPORATION AND SUBSIDIARIES
NOTES TO CONSOLIDATED FINANCIAL STATEMENTS — (Continued)
We evaluate the depreciation periods of property, plant and equipment to determine whether events or circumstances warrant revised estimates of useful lives. All property, plant and equipment are also tested for impairment whenever events or changes in circumstances indicate that their carrying amount may not be recoverable.
Our installed base of devices includes devices owned by us and devices sold to the customer. The asset on our balance sheet classified as Haemonetics equipment consists of medical devices installed at customer sites but owned by Haemonetics. Generally the customer has the right to use it for a period of time as long as they meet the conditions we have established, which among other things, generally include one or more of the following:
• | Purchase and consumption of a certain level of disposable products |
• | Payment of monthly rental fees |
• | An asset utilization performance metric, such as performing a minimum level of procedures per month per device |
Consistent with the impairment tests noted below for other intangible assets subject to amortization, we review Haemonetics equipment and their related useful lives at least once a year, or more frequently if certain conditions arise, to determine if any adverse conditions exist that would indicate the carrying value of these assets may not be recoverable. To conduct these reviews we estimate the future amount and timing of demand for disposables used with these devices, from which we generate revenues. Changes in expected demand can result in additional depreciation expense, which is classified as cost of goods sold. Any significant unanticipated changes in demand could impact the value of our devices and our reported operating results.
Leasehold improvements are depreciated over the lesser of their useful lives or the term of the lease. Maintenance and repairs are generally expensed to operations as incurred. When the repair or maintenance costs significantly extend the life of the asset, these costs may be capitalized. When equipment and improvements are sold or otherwise disposed of, the asset cost and accumulated depreciation are removed from the accounts, and the resulting gain or loss, if any, is included in the statements of income.
Goodwill and Intangible Assets
Intangible assets acquired in a business combination are recorded under the purchase method of accounting at their estimated fair values at the date of acquisition. Costs associated with the application and award of patents in the U.S. and various other countries are capitalized and amortized on a straight-line basis over their estimated useful life. Goodwill represents the excess purchase price over the fair value of the net tangible and other identifiable intangible assets acquired. We amortize our other intangible assets over their estimated useful lives.
Goodwill is not amortized. Instead goodwill is reviewed for impairment at least annually in accordance with ASC Topic 350, Intangibles - Goodwill and Other, or on an interim basis between annual tests when events or circumstances indicate that it is more likely than not that the fair value of a reporting unit is less than its carrying value. We perform our annual impairment test on the first day of the fiscal fourth quarter for each of our reporting units. We first perform a qualitative test and if necessary, perform a quantitative test.
Prior to fiscal 2014, we determined we operated a single operating segment, blood management solutions, based on our chief operating decision maker ("CODM") primarily using consolidated results to make operating and strategic decisions. Our reporting units for purposes of assessing goodwill impairment prior to fiscal 2014 were medical devices and software. During fiscal 2014, our CODM utilized financial results by operating units organized primarily on geography to make operating and strategic decisions due to changes in the composition in the executive staff reporting to the CODM. Based on these changes we determined the five operating units represent operating segments as defined under ASC 280 - Segment Reporting. Following this change, we determined our reporting units for purposes of assessing goodwill impairment by identifying our operating segments and assessing whether segment management regularly reviews the operating results of any components. Through this process, we concluded that our reporting units were the same as our operating segments, which are the following operating units organized based primarily on geography: North America Plasma, North America Blood Center and Hospital, Europe, Asia-Pacific and Japan. During fiscal 2014, goodwill was reallocated from the medical device and software reporting units to the new reporting units based on a relative fair value basis. For fiscal 2015, there were no changes to operating segments or reporting units for purposes of assessing goodwill impairment.
ASC 350, Intangibles - Goodwill and Other defines the fair value of a reporting unit as the price that would be received to sell the unit as a whole in an orderly transaction between market participants at the measurement date. The quantitative test is based on a discounted cash flow analysis or other valuation techniques, such as the market approach, for each reporting unit. The fair values of our reporting units in fiscal 2013 were determined using the income approach. Under the income approach, the fair
54
HAEMONETICS CORPORATION AND SUBSIDIARIES
NOTES TO CONSOLIDATED FINANCIAL STATEMENTS — (Continued)
value of a reporting unit is based on the present value of future cash flows using appropriate discount rates, growth rates, operating margins and future market conditions amongst others. We changed our valuation approach to assessing goodwill impairment in fiscal 2014 in connection with the change in reporting units. In fiscal 2015 and 2014, we determined the fair value of our reporting units based on the market approach. We utilized the market approach as we determined relevant comparable information was available, and accordingly such method was an appropriate alternative to the income method. Under the market approach, we estimate the fair value of our reporting units based on a combination of, a) market multiples of projected earnings before interest, taxes, depreciation and amortization (“EBITDA”) and b) market multiples of projected net revenues for each individual reporting unit. For the market approach, we use judgment in identifying the relevant comparable-company market multiples, such as recent divestitures/acquisitions, facts and circumstances surrounding the market and growth rates. Management assesses the relevance and reliability of the multiples by considering factors unique to its reporting units, including recent operating results, business plans, economic projections, anticipated future cash flows, and other data. EBITDA and revenue multiples can also be significantly impacted by future growth opportunities for the reporting unit as well as for the company itself, general market and geographic sentiment, and pending or recently completed merger transactions.
These tests showed no evidence of impairment to our goodwill for fiscal 2015, 2014 or 2013 and demonstrated that the fair value of each reporting unit exceeded the reporting unit’s carrying value in each period. During March 2014, circumstances arose that indicated a potential impairment. We performed an interim impairment test and noted that the fair value of our reporting units still exceeded their carrying values.
We review intangible assets subject to amortization at least annually or more frequently if certain conditions arise to determine if any adverse conditions exist that would indicate that the carrying value of an asset or asset group may not be recoverable, or that a change in the remaining useful life is required. Conditions indicating that an impairment exists include but are not limited to a change in the competitive landscape, internal decisions to pursue new or different technology strategies, a loss of a significant customer or a significant change in the marketplace including prices paid for our products or the size of the market for our products. During March 2014, circumstances arose that indicated a potential impairment of certain intangible assets subject to amortization. We performed the recoverability test described below for the relevant asset group and determined expected undiscounted cash flows exceeded the carrying value of the asset group.
If an impairment indicator exists, we test the intangible asset for recoverability. For purposes of the recoverability test, we group our amortizable intangible assets with other assets and liabilities at the lowest level of identifiable cash flows if the intangible asset does not generate cash flows independent of other assets and liabilities. If the carrying value of the intangible asset (asset group) exceeds the undiscounted cash flows expected to result from the use and eventual disposition of the intangible asset (asset group), we will write the carrying value down to the fair value in the period identified.
We generally calculate fair value of our intangible assets as the present value of estimated future cash flows we expect to generate from the asset using a risk-adjusted discount rate. In determining our estimated future cash flows associated with our intangible assets, we use estimates and assumptions about future revenue contributions, cost structures and remaining useful lives of the asset (asset group).
If we determine the estimate of an intangible asset's remaining useful life should be reduced based on our expected use of the asset, the remaining carrying amount of the asset is amortized prospectively over the revised estimated useful life.
Accounting for the Costs of Computer Software to be Sold, Leased, or Otherwise Marketed
ASC Topic 985-20, Software, specifies that costs incurred internally in researching and developing a computer software product should be charged to expense until technological feasibility has been established for the product. Once technological feasibility is established, all software costs should be capitalized until the product is available for general release to customers, at which point capitalized costs are amortized over their estimated useful life of five to 10 years. Technological feasibility is established when we have a detailed design of the software and when research and development activities on the underlying device, if applicable, are completed.
We review the net realizable value of capitalized assets periodically to assess the recoverability of amounts capitalized. In the future, the net realizable value may be adversely affected by the loss of a significant customer or a significant change in the market place, which could result in an impairment being recorded.
55
HAEMONETICS CORPORATION AND SUBSIDIARIES
NOTES TO CONSOLIDATED FINANCIAL STATEMENTS — (Continued)
Other Liabilities
Other liabilities represent items payable or expected to settle within the next twelve months. The items included in the fiscal year end balances were:
(In thousands) | March 28, 2015 | March 29, 2014 | |||||
VAT liabilities | $ | 4,205 | $ | 7,114 | |||
Forward contracts | 2,657 | 1,255 | |||||
Deferred revenue | 22,362 | 24,777 | |||||
All other | 34,987 | 26,564 | |||||
Total | $ | 64,211 | $ | 59,710 | |||
Research and Development Expenses
All research and development costs are expensed as incurred.
Advertising Costs
All advertising costs are expensed as incurred and are included in selling, general and administrative expenses in the consolidated statements of income. Advertising expenses were $4.5 million, $3.6 million, and $4.6 million for 2015, 2014 and 2013, respectively.
Accounting for Shipping and Handling Costs
Shipping and handling costs are included in selling, general and administrative expenses. Freight is classified in cost of goods sold when the customer is charged for freight and in selling, general and administration when the customer is not explicitly charged for freight.
Income Taxes
The income tax provision is calculated for all jurisdictions in which we operate. The income tax provision process involves calculating current taxes due and assessing temporary differences arising from items which are taxable or deductible in different periods for tax and accounting purposes and are recorded as deferred tax assets and liabilities. Deferred tax assets are evaluated for realizability and a valuation allowance is maintained for the portion of our deferred tax assets that are not more-likely-than-not realizable.
We file income tax returns in all jurisdictions in which we operate. We record a liability for uncertain tax positions taken or expected to be taken in income tax returns. Our financial statements reflect expected future tax consequences of such positions presuming the taxing authorities' full knowledge of the position and all relevant facts. We record a liability for the portion of unrecognized tax benefits claimed which we have determined are not more-likely-than-not realizable. These tax reserves have been established based on management's assessment as to the potential exposure attributable to our uncertain tax positions as well as interest and penalties attributable to these uncertain tax positions. All tax reserves are analyzed quarterly and adjustments are made. Tax reserves are reversed when the statute of limitations expires or the matter is considered effectively settled.
Derivative Instruments
We account for our derivative financial instruments in accordance with ASC Topic 815, Derivatives and Hedging (“ASC 815”) and ASC Topic 820, Fair Value Measurements and Disclosures (“ASC 820”). In accordance with ASC 815, we record all derivatives on the balance sheet at fair value. The accounting for the change in the fair value of derivatives depends on the intended use of the derivative, whether we have elected to designate a derivative as a hedging instrument for accounting purposes, and whether the hedging relationship has satisfied the criteria necessary to apply hedge accounting. In addition, ASC 815 provides that, for derivative instruments that qualify for hedge accounting, changes in the fair value are either (a) offset against the change in fair value of the hedged assets, liabilities, or firm commitments through earnings or (b) recognized in equity until the hedged item is recognized in earnings, depending on whether the derivative is being used to hedge changes in fair value or cash flows. The ineffective portion of a derivative’s change in fair value is immediately recognized in earnings. We do not use derivative financial instruments for trading or speculation purposes.
56
HAEMONETICS CORPORATION AND SUBSIDIARIES
NOTES TO CONSOLIDATED FINANCIAL STATEMENTS — (Continued)
The gains or losses on the forward foreign exchange rate contracts designated as hedges are recorded in net revenues, cost of goods sold, operating expenses and other (expense) income, net in our consolidated statements of income, depending on the nature of the underlying hedged transactions, when the underlying hedged transaction affects earnings. The cash flows related to the gains and losses are classified in the consolidated statements of cash flows as part of cash flows from operating activities. For those derivative instruments that are not designated as part of a hedging relationship we record the gains or losses in earnings currently. These gains and losses are intended to offset the gains and losses recorded on net monetary assets or liabilities that are denominated in foreign currencies. We recorded foreign currency losses of $1.1 million, $0.5 million, and $0.8 million in fiscal 2015, 2014 and 2013, respectively.
On a quarterly basis, we assess whether the cash flow hedges are highly effective in offsetting changes in the cash flow of the hedged item. We manage the credit risk of the counterparties by dealing only with institutions that we consider financially sound and consider the risk of non-performance to be remote.
Our derivative instruments do not subject our earnings or cash flows to material risk, as gains and losses on these derivatives are intended to offset losses and gains on the item being hedged. We do not enter into derivative transactions for speculative purposes and we do not have any non-derivative instruments that are designated as hedging instruments pursuant to ASC Topic 815.
Stock-Based Compensation
To calculate the grant-date fair value of our stock options we use the Black-Scholes option-pricing model and for performance share units and market stock units we use Monte Carlo Simulation models.
Valuation of Acquisitions
We allocate the amounts we pay for each acquisition to the assets acquired and liabilities assumed based on their estimated fair values at the dates of acquisition, including acquired identifiable intangible assets. We base the estimated fair value of identifiable intangible assets on detailed valuations that use historical information and market assumptions based upon the assumptions of a market participant. We allocate any excess purchase price over the fair value of the net tangible and intangible assets acquired to goodwill.
In certain acquisitions, we have earn-out arrangements or contingent consideration to provide potential future payments to the seller for achieving certain agreed-upon targets. We record the contingent consideration at its fair value at the acquisition date. Generally, we have entered into arrangements with contingent consideration that require payments in cash. As such, we periodically revalue the contingent consideration obligations associated with certain acquisitions to their current fair value and record the change in the fair value as contingent consideration income or expense within selling, general and administrative expense. These changes are recorded in selling, general and administrative expense. Increases or decreases in the fair value of the contingent consideration obligations can result from changes in assumed discount periods and rates, changes in the assumed timing and amount of revenue and expense estimates, and changes in assumed probability with respect to regulatory approval. Significant judgment is employed in determining the appropriateness of these assumptions as of the acquisition date and for each subsequent period. Accordingly, future business and economic conditions, as well as changes in any of the assumptions described above, can materially impact the amount of contingent consideration income or expense we record in any given period.
Concentration of Credit Risk and Significant Customers
Financial instruments that potentially subject the Company to concentrations of credit risk consist primarily of cash equivalents and accounts receivable. In fiscal 2015 and 2014, no one customer accounted for more than 10% of our revenues. Sales to one unaffiliated Japanese customer, the Japanese Red Cross Society, amounted to $90.1 million for fiscal 2013.
Certain other markets and industries can expose us to concentrations of credit risk. For example, in our plasma business, our sales are concentrated with several large customers. As a result, our accounts receivable extended to any one of these bio-pharmaceutical customers can be significant at any point in time. Also, a portion of our trade accounts receivable outside the United States include sales to government-owned or supported healthcare systems in several countries, which are subject to payment delays. Payment is dependent upon the financial stability and creditworthiness of those countries’ national economies. We have not incurred significant losses on government receivables. We continually evaluate all government receivables for potential collection risks associated with the availability of government funding and reimbursement practices. If the financial condition of customers or the countries’ healthcare systems deteriorate such that their ability to make payments is uncertain, allowances may be required in future periods.
57
HAEMONETICS CORPORATION AND SUBSIDIARIES
NOTES TO CONSOLIDATED FINANCIAL STATEMENTS — (Continued)
Recent Accounting Pronouncements
Standards to be Implemented
In April 2014, the Financial Accounting Standards Board (“FASB”) issued Accounting Standards Update (“ASU”) No. 2014-08, Presentation of Financial Statements (Topic 205) and Property, Plant, and Equipment (Topic 360): Reporting Discontinued Operations and Disclosures of Disposals of Components of an Entity. ASU No. 2014-08 limits the requirement to report discontinued operations to disposals of components of an entity that represent strategic shifts that have (or will have) a major effect on an entity’s operations and financial results. The amendments also require expanded disclosures concerning discontinued operations and disclosures of certain financial results attributable to a disposal of a significant component of an entity that does not qualify for discontinued operations reporting. The amendments in ASU No. 2014-08 are effective prospectively for reporting periods beginning on or after December 15, 2014, with early adoption permitted. Management does not believe that the adoption of ASU No. 2014-08 will have a material effect on our Financial Statements.
In May 2014, the FASB issued ASU No. 2014-09, Revenue from Contracts with Customers (Topic 606). ASU No. 2014-09 stipulates that an entity should recognize revenue to depict the transfer of promised goods or services to customers in an amount that reflects the consideration to which the entity expects to be entitled in exchange for those goods or services. To achieve this core principle, an entity should apply the following steps: (1) identify the contract(s) with a customer; (2) identify the performance obligations in the contract; (3) determine the transaction price; (4) allocate the transaction price to the performance obligations in the contract; and (5) recognize revenue when (or as) the entity satisfies a performance obligation. ASU No. 2014-09 will be effective for the Company retrospectively beginning April 2, 2017, with early adoption not permitted. The impact of adopting ASU No. 2014-09 on our Financial Statements is being assessed by management.
In June 2014, the FASB issued ASU No. 2014-12, Compensation—Stock Compensation (Topic 718): Accounting for Share-Based Payments When the Terms of an Award Provide That a Performance Target Could Be Achieved after the Requisite Service Period. ASU No. 2014-12 requires that a performance target that affects vesting and could be achieved after the requisite service period be treated as a performance condition. A reporting entity should apply existing guidance in ASC 718, Compensation—Stock Compensation, as it relates to such awards. ASU No. 2014-12 is effective in our first quarter of fiscal 2017 with early adoption permitted using either of two methods: (i) prospective to all awards granted or modified after the effective date; or (ii) retrospective to all awards with performance targets that are outstanding as of the beginning of the earliest annual period presented in the financial statements and to all new or modified awards thereafter, with the cumulative effect of applying ASU No. 2014-12 as an adjustment to the opening retained earnings balance as of the beginning of the earliest annual period presented in the financial statements. Management does not believe that the adoption of ASU No. 2014-12 will have a material effect on our Financial Statements.
In August 2014, the FASB issued ASU No. 2014-15, Presentation of Financial Statements—Going Concern (Subtopic 205-40): Disclosure of Uncertainties about an Entity’s Ability to Continue as a Going Concern. ASU No. 2014-15 defines management's responsibility to assess an entity's ability to continue as a going concern, and to provide related footnote disclosures in certain circumstances. This guidance will be effective for all entities in the first annual period ending after December 15, 2016; however, early adoption is permitted. Management does not believe that the adoption of ASU No. 2014-15 will have a material effect on our Financial Statements.
In January 2015, the FASB issued ASU No. 2015-01, Income Statement-Extraordinary and Unusual Items (Subtopic 225-20): Simplifying Income Statement Presentation by Eliminating the Concept of Extraordinary Items. ASU No. 2015-01 eliminates from GAAP the concept of extraordinary items. An entity will no longer be required to (1) segregate an extraordinary item from the results of ordinary operations; (2) separately present an extraordinary item on its income statement, net of tax, after income from continuing operations; and (3) disclose income taxes and earnings-per-share data applicable to an extraordinary item. ASU No. 2015-01 will be effective for fiscal years beginning after December 15, 2015. An entity may apply the amendments prospectively or retrospectively to all prior periods presented in the financial statements. Early adoption is permitted provided that the guidance is applied from the beginning of the fiscal year of adoption. Management does not believe that the adoption of ASU No. 2015-01 will have a material effect on our Financial Statements.
In February 2015, the FASB issued ASU No. 2015-02, Consolidation (Topic 810): Amendments to the Consolidation Analysis. ASU No. 2015-02 amended the process that a reporting entity must perform to determine whether it should consolidate certain types of legal entities. ASU No. 2015-02 is effective for annual periods ending after December 15, 2015, and for annual periods and interim periods thereafter with early adoption permitted. Management does not believe that the adoption of ASU No. 2015-02 will have a material effect on our Financial Statements.
58
HAEMONETICS CORPORATION AND SUBSIDIARIES
NOTES TO CONSOLIDATED FINANCIAL STATEMENTS — (Continued)
In April 2015, the FASB issued ASU No. 2015-03, Interest—Imputation of Interest (Subtopic 835-30): Simplifying the Presentation of Debt Issuance Costs. ASU No. 2015-03 requires that debt issuance costs related to a recognized debt liability be presented in the balance sheet as a direct deduction from the carrying amount of that debt liability, consistent with debt discounts. ASU No. 2015-03 is effective for annual periods beginning after December 15, 2015, and interim periods within those annual periods. Management does not believe that the adoption of ASU No. 2015-03 will have a material effect on our Financial Statements.
In April 2015, the FASB issued ASU No. 2015-04, Compensation—Retirement Benefits (Topic 715): Practical Expedient for the Measurement Date of an Employer’s Defined Benefit Obligation and Plan Assets. ASU No. 2015-04 provides a practical expedient, for an entity with a fiscal year-end that does not coincide with a month-end, that permits the entity to measure defined benefit plan assets and obligations using the month-end that is closest to the entity's fiscal year-end and apply that practical expedient consistently from year to year. ASU No. 2015-04 is effective for fiscal years beginning after December 15, 2015, and interim periods within those fiscal years. Early application is permitted. The impact of adopting ASU No. 2015-04 on our Financial Statements is being assessed by management.
In April 2015, the FASB issued ASU No. 2015-05, Intangibles—Goodwill and Other—Internal-Use Software (Subtopic 350-40): Customer’s Accounting for Fees Paid in a Cloud Computing Arrangement. ASU No. 2015-05 will help entities evaluate the accounting for fees paid by a customer in a cloud computing arrangement. ASU No. 2015-05 is effective for interim and annual periods beginning after December 15, 2015 with early adoption permitted. The impact of adopting ASU No. 2015-05 on our Financial Statements is being assessed by management.
3. ACQUISITIONS
Acquisitions were completed in fiscal 2014 and fiscal 2013. We did not complete any acquisitions in fiscal 2015.
Fiscal Year 2014 Acquisition
Hemerus Acquisition
On April 30, 2013, we completed the acquisition of certain assets of Hemerus Medical, LLC ("Hemerus"), a Minnesota based company that develops innovative technologies for the collection of whole blood and processing and storage of blood components. Hemerus has received U.S Food and Drug Administration (FDA) approval for SOLX® whole blood collection system for eight hour storage of whole blood prior to processing. Hemerus previously received Conformité Européenne or CE Mark in the European Union to market SOLX as the world's first 56-day red blood cell storage solution. We paid $24.1 million and will pay an additional $3.0 million upon a further FDA approval of the SOLX solution for 24 hour storage of whole blood prior to processing. We will also pay up to $14.0 million based on future sales of SOLX-based products through fiscal 2025.
We acquired Hemerus to complement the portfolio of whole blood collection, filtration and processing product lines we recently acquired and to bring greater efficiency and productivity to whole blood collection and processing. Hemerus manufactures and sells manual blood collection systems and filters and has operations in North America. Revenue from the sale of SOLX will be reported within the blood center disposables product line.
The assets acquired from Hemerus were recorded at fair value at the date of acquisition.
59
HAEMONETICS CORPORATION AND SUBSIDIARIES
NOTES TO CONSOLIDATED FINANCIAL STATEMENTS — (Continued)
The final purchase price allocation is as follows:
Asset class | Amounts recognized as of March 29, 2014 | |||
Acquired technology | $ | 22,800 | ||
Trade name | 1,900 | |||
Customer relationship | 600 | |||
Goodwill | 6,425 | |||
Total | $ | 31,725 | ||
The fair value of the acquired assets and liabilities are reflected in the Consolidated Balance Sheets. The acquired assets are amortized over the estimate of their useful lives on a straight-line basis. We recorded $2.5 million and $2.3 million in amortization expense relating to the acquired intangible assets for the fiscal years ended March 28, 2015 and March 29, 2014, respectively.
Goodwill represents the excess of the purchase price over the fair value of the net assets. Goodwill of $6.4 million primarily represents future economic benefits expected to arise from the work force and synergies expected to be gained from the integration of SOLX into our whole blood products. Prior to the acquisition, we had not conducted any business with Hemerus.
Contingent consideration
As described above, we will pay the sellers of the Hemerus assets up to $14.0 million based on future sales of SOLX. We recognized a liability equal to the fair value of the contingent payments we expect to make as of the acquisition date. We revalue this liability each reporting period and record necessary changes in the fair value in our consolidated statements of income. As of March 28, 2015, the maximum amount of future contingent consideration (undiscounted) that we could be required to pay related to future SOLX sales is $14.0 million. Additionally, we will pay $3.0 million upon FDA approval of the SOLX solution for 24 hour storage of whole blood prior to processing. The carrying value of this liability is $4.7 million as of March 28, 2015.
Contingent consideration liabilities are measured at fair value using projected revenues, discount rates, probabilities of payment and projected payment dates. This Level 3 fair value measurement was performed using a probability-weighted discounted cash flow analysis over a ten year period.
Increases or decreases in the fair value of our contingent consideration liability can result from changes in discount periods and rates, as well as changes in the timing and amount of revenue estimates or likelihood of earning revenue. Projected revenues are based on our most recent internal forecast and analysis.
Fiscal Year 2013 Acquisition
Whole Blood Acquisition
On August 1, 2012, we completed the acquisition from Pall Corporation (“Pall”) of substantially all of the assets relating to its blood collection, filtration, processing, storage, and re-infusion product lines, and all of the outstanding equity interest in Pall Mexico Manufacturing, S. de R.L. de C.V., a subsidiary of Pall based in Mexico pursuant to an Asset Purchase Agreement (the “Purchase Agreement”) with Pall. We refer to the acquired business as the “whole blood business.”
At the closing of the transaction, we paid a total consideration of $535.2 million in cash and $0.5 million in shares following resolution of post-closing adjustments for working capital and historical earnings levels. We anticipate paying an additional $15.0 million upon replication and delivery of certain manufacturing assets of Pall's filter media business to Haemonetics by 2018. Until that time, Pall will manufacture and sell filter media to Haemonetics under a supply agreement.
60
HAEMONETICS CORPORATION AND SUBSIDIARIES
NOTES TO CONSOLIDATED FINANCIAL STATEMENTS — (Continued)
We entered into a credit agreement on August 1, 2012 in connection with the transaction which includes a $475.0 million term loan to fund the majority of the cash paid to Pall. See Note 8 for a detailed description of the key terms and provisions of the credit agreement.
We acquired the whole blood business to provide access to the manual collection and whole blood markets and provide scope for introduction of automated solutions in those markets. The whole blood business manufactures and sells manual blood collection systems and filters and has operations in North America, Europe and Asia Pacific countries. Revenue from the sale of whole blood disposables has been reported within the blood center disposables product line since the date of acquisition.
The assets and liabilities acquired from Pall were recorded at fair value at the date of acquisition. We completed the allocation of the purchase price to the estimated fair value of the acquired assets and liabilities in June 2013 and is summarized below:
Asset class | Amounts Recognized as of March 30, 2013 | |||
(In thousands) | ||||
Inventories | $ | 49,917 | ||
Property, plant and equipment | 85,984 | |||
Intangible assets | 188,500 | |||
Other assets/liabilities, net | (6,166 | ) | ||
Goodwill | 216,940 | |||
Fair value of net assets acquired | $ | 535,175 | ||
The fair value of the acquired assets and liabilities are reflected in the Consolidated Balance Sheets. The $188.5 million of acquired intangible assets was allocated to acquired technology and customer relationships at fair values of $61.0 million and $127.5 million, respectively. The acquired intangible assets were initially amortized over their estimated useful lives of 12 years on a straight-line basis. We adopted the straight-line amortization of 12 years as it best reflected the pattern of benefits. As of March 29, 2014, the remaining estimated useful life of the customer relationship assets was adjusted to 8 years to better reflect its current pattern of benefits. We recorded $18.8 million, $15.7 million and $10.5 million in amortization expense relating to the acquired intangible assets for the fiscal years ended March 28, 2015, March 29, 2014 and March 30, 2013, respectively.
Goodwill represents the excess of the purchase price over the fair value of the net assets. Goodwill of $216.9 million represents future economic benefits expected to arise from work force at the various plants and locations and significant technological know-how in filter manufacturing. All of the goodwill is deductible for tax purposes.
Revenue for the acquired whole blood business included in our operating results was $143.9 million in fiscal 2015, $190.7 million in fiscal 2014 and $138.4 million in fiscal 2013.
The following represents the pro forma consolidated statements of income for the fiscal year ended March 30, 2013, as if the acquisition had been included in our consolidated results as beginning April 1, 2012:
(In thousands, except per share amounts) | March 30, 2013 | ||||
Net Sales | $ | 963,923 | |||
Net Income | $ | 56,540 | |||
Basic EPS | $ | 1.10 | |||
Diluted EPS | $ | 1.08 | |||
61
HAEMONETICS CORPORATION AND SUBSIDIARIES
NOTES TO CONSOLIDATED FINANCIAL STATEMENTS — (Continued)
4. PRODUCT WARRANTIES
We generally provide a warranty on parts and labor for one year after the sale and installation of each device. We also warrant our disposables products through their use or expiration. We estimate our potential warranty expense based on our historical warranty experience, and we periodically assess the adequacy of our warranty accrual and make adjustments as necessary.
(In thousands) | March 28, 2015 | March 29, 2014 | |||||
Warranty accrual as of the beginning of the year | $ | 590 | $ | 673 | |||
Warranty provision | 1,199 | 1,340 | |||||
Warranty spending | (1,258 | ) | (1,423 | ) | |||
Warranty accrual as of the end of the year | $ | 531 | $ | 590 | |||
5. INVENTORIES
Inventories are stated at the lower of cost or market and include the cost of material, labor and manufacturing overhead. Cost is determined with the first-in, first-out method.
(In thousands) | March 28, 2015 | March 29, 2014 | |||||
Raw materials | $ | 71,794 | $ | 72,508 | |||
Work-in-process | 12,462 | 7,383 | |||||
Finished goods | 126,821 | 117,770 | |||||
Total Inventory | $ | 211,077 | $ | 197,661 | |||
6. GOODWILL AND INTANGIBLE ASSETS
Goodwill
The changes in the carrying amount of goodwill for fiscal 2015 and 2014 are as follows:
(In thousands) | |||
Carrying amount as of March 30, 2013 | $ | 330,474 | |
Hemerus acquisition | 6,425 | ||
Effects of change in foreign currency exchange rates | (131 | ) | |
Carrying amount as of March 29, 2014 | $ | 336,768 | |
Effects of change in foreign currency exchange rates | (2,458 | ) | |
Carrying amount as of March 28, 2015 | $ | 334,310 | |
62
HAEMONETICS CORPORATION AND SUBSIDIARIES
NOTES TO CONSOLIDATED FINANCIAL STATEMENTS — (Continued)
Intangible Assets
Intangible assets include the value assigned to license rights and other developed technology, patents, customer contracts and relationships and trade names. The estimated useful lives for all of these intangible assets are 2 to 19 years. The gross carrying amount of intangible assets and the related accumulated amortization as of March 28, 2015 and March 29, 2014 is as follows:
(In thousands) | Gross Carrying Amount | Accumulated Amortization | Net | Weighted Average Useful Life | |||||||||
(In years) | |||||||||||||
As of March 28, 2015 | |||||||||||||
Patents | $ | 10,473 | $ | 7,373 | $ | 3,100 | 9 | ||||||
Capitalized software | 39,690 | 5,654 | 34,036 | 7 | |||||||||
Other developed technology | 124,573 | 46,474 | 78,099 | 12 | |||||||||
Customer contracts and related relationships | 195,985 | 70,440 | 125,545 | 10 | |||||||||
Trade names | 7,042 | 3,234 | 3,808 | 11 | |||||||||
Total intangibles | $ | 377,763 | $ | 133,175 | $ | 244,588 | 10 | ||||||
(In thousands) | Gross Carrying Amount | Accumulated Amortization | Net | Weighted Average Useful Life | |||||||||
(In years) | |||||||||||||
As of March 29, 2014 | |||||||||||||
Patents | $ | 9,543 | $ | 7,039 | $ | 2,504 | 9 | ||||||
Capitalized software | 31,750 | 2,414 | 29,336 | 4 | |||||||||
Other developed technology | 123,525 | 36,632 | 86,893 | 12 | |||||||||
Customer contracts and related relationships | 200,694 | 52,741 | 147,953 | 12 | |||||||||
Trade names | 7,341 | 2,868 | 4,473 | 11 | |||||||||
Total intangibles | $ | 372,853 | $ | 101,694 | $ | 271,159 | 11 | ||||||
The changes to the net carrying value of our intangible assets from March 29, 2014 to March 28, 2015 reflect investment in capitalized software and other less significant intangible assets, amortization expense and the effect of exchange rate changes in the translation of our intangible assets held by our international subsidiaries.
Aggregate amortization expense for amortized intangible assets for fiscal year 2015, 2014, and 2013 was $33.5 million, $29.2 million, and $22.1 million, respectively. Future annual amortization expense on intangible assets is estimated to be as follows:
Fiscal Year | Amount (in thousands) | |||
2016 | $ | 33,752 | ||
2017 | $ | 32,998 | ||
2018 | $ | 32,165 | ||
2019 | $ | 30,470 | ||
2020 and thereafter | $ | 104,544 | ||
7. DERIVATIVES AND FAIR VALUE MEASUREMENTS
We manufacture, market and sell our products globally. For the fiscal year ended March 28, 2015, approximately 45.6% of our sales were generated outside the U.S. in local currencies. We also incur certain manufacturing, marketing and selling costs in international markets in local currency.
Accordingly, our earnings and cash flows are exposed to market risk from changes in foreign currency exchange rates relative to the U.S. Dollar, our reporting currency. We have a program in place that is designed to mitigate our exposure to changes in foreign currency exchange rates. That program includes the use of derivative financial instruments to minimize for a period of time, the unforeseen impact on our financial results from changes in foreign exchange rates. We utilize foreign currency
63
HAEMONETICS CORPORATION AND SUBSIDIARIES
NOTES TO CONSOLIDATED FINANCIAL STATEMENTS — (Continued)
forward contracts to hedge the anticipated cash flows from transactions denominated in foreign currencies, primarily the Japanese Yen and the Euro, and to a lesser extent the Swiss Franc, Australian Dollar, British Pound Sterling, Canadian Dollar and the Mexican Peso. This does not eliminate the volatility of foreign exchange rates, but because we generally enter into forward contracts one year out, rates are fixed for a one-year period, thereby facilitating financial planning and resource allocation.
Designated Foreign Currency Hedge Contracts
All of our designated foreign currency hedge contracts as of March 28, 2015 and March 29, 2014 were cash flow hedges under ASC Topic 815, Derivatives and Hedging. We record the effective portion of any change in the fair value of designated foreign currency hedge contracts in Other Comprehensive Income in the Statement of Stockholders’ Equity until the related third-party transaction occurs. Once the related third-party transaction occurs, we reclassify the effective portion of any related gain or loss on the designated foreign currency hedge contracts to earnings. In the event the hedged forecasted transaction does not occur, or it becomes probable that it will not occur, we would reclassify the amount of any gain or loss on the related cash flow hedge to earnings at that time. We had designated foreign currency hedge contracts outstanding in the contract amount of $145.8 million as of March 28, 2015 and $157.9 million as of March 29, 2014.
During fiscal 2015, we recognized net gains of $6.5 million in earnings on our cash flow hedges, compared to recognized net gains of $8.6 million and $2.7 million during fiscal 2014 and 2013, respectively. For the fiscal year ended March 28, 2015, $12.2 million of gains, net of tax, were recorded in Accumulated Other Comprehensive Income to recognize the effective portion of the fair value of any designated foreign currency hedge contracts that are, or previously were, designated as foreign currency cash flow hedges, as compared to net gains of $3.7 million, net of tax, for the fiscal year ended March 29, 2014 and net gains of $5.1 million, net of tax, for the fiscal year ended March 30, 2013. At March 28, 2015, gains of $12.2 million, net of tax, will be reclassified to earnings within the next twelve months. All currency cash flow hedges outstanding as of March 28, 2015 mature within twelve months.
Non-designated Foreign Currency Contracts
We manage our exposure to changes in foreign currency on a consolidated basis to take advantage of offsetting transactions and balances. We use foreign currency forward contracts as a part of our strategy to manage exposure related to foreign currency denominated monetary assets and liabilities. These foreign currency forward contracts are entered into for periods consistent with currency transaction exposures, generally one month. They are not designated as cash flow or fair value hedges under ASC Topic 815. These forward contracts are marked-to-market with changes in fair value recorded to earnings. We had non-designated foreign currency hedge contracts under ASC Topic 815 outstanding in the contract amount of $45.8 million as of March 28, 2015 and $72.9 million as of March 29, 2014.
Interest Rate Swaps
On August 1, 2012, we entered into a Credit Agreement which provided for a $475.0 million term loan (“Term Loan”). Under the terms of this Credit Agreement, the Company may borrow at a spread to an index, including the LIBOR index of 1-month, 3-months, 6-months, etc. From the date of the Credit Agreement, the Company has chosen to borrow against the 1-month USD-LIBOR-BBA rounded up, if necessary, to the nearest 1/16th of 1% (“Adjusted LIBOR”). The terms of the Credit Agreement also allow us to borrow in multiple tranches. As of March 28, 2015, we have four tranches outstanding.
Accordingly, our earnings and cash flows are exposed to interest rate risk from changes in Adjusted LIBOR. Part of our interest rate risk management strategy includes the use of interest rate swaps to mitigate our exposure to changes in variable interest rates. Our objective in using interest rate swaps is to add stability to interest expense and to manage and reduce the risk inherent in interest rate fluctuations.
On December 21, 2012, we entered into two interest rate swap agreements ("the swaps"), whereby we receive Adjusted LIBOR and pay an average fixed rate of 0.68% on a total notional value of $250.0 million of debt. The interest rate swaps mature on August 1, 2017. The Company designated the interest rate swaps as a cash flow hedge of variable interest rate risk associated with $250.0 million of indebtedness. For the fiscal years ended March 28, 2015, March 29, 2014 and March 30, 2013, $0.9 million of losses, $1.3 million of gains and $0.8 million of losses, net of tax, were recorded in Accumulated Other Comprehensive Income to recognize the effective portion of the fair value of interest rate swaps that qualify as cash flow hedges, respectively.
64
HAEMONETICS CORPORATION AND SUBSIDIARIES
NOTES TO CONSOLIDATED FINANCIAL STATEMENTS — (Continued)
Fair Value of Derivative Instruments
The following table presents the effect of our derivative instruments designated as cash flow hedges and those not designated as hedging instruments under ASC Topic 815 in our consolidated statements of income for the fiscal year ended March 28, 2015.
Derivative Instruments | Amount of Gain/(Loss) Recognized in OCI (Effective Portion) | Amount of Gain/(Loss) Reclassified from OCI into Earnings (Effective Portion) | Location in Statement of Operations | Amount of Gain/(Loss) Excluded from Effectiveness Testing (*) | Location in Statement of Operations | |||||||||||
(In thousands) | ||||||||||||||||
Designated foreign currency hedge contracts, net of tax | $ | 12,249 | $ | 6,464 | Net revenues, COGS, and SG&A | $ | (170 | ) | Other income (expense), net | |||||||
Non-designated foreign currency hedge contracts | — | — | $ | 7,510 | Other income (expense) | |||||||||||
Designated interest rate swaps, net of tax | $ | (878 | ) | $ | — | Interest income (expense), net | $ | — | ||||||||
(*) | We exclude the difference between the spot rate and hedge forward rate from our effectiveness testing. | |
We did not have fair value hedges or net investment hedges outstanding as of March 28, 2015 or March 29, 2014. As of March 28, 2015, the amount recognized as a deferred tax liability for designated foreign currency hedges was $0.8 million and the amount recognized as a deferred tax asset for interest rate swap hedges was $0.1 million.
ASC Topic 815 requires all derivative instruments to be recognized at their fair values as either assets or liabilities on the balance sheet. We determine the fair value of our derivative instruments using the framework prescribed by ASC Topic 820, Fair Value Measurements and Disclosures, by considering the estimated amount we would receive or pay to sell or transfer these instruments at the reporting date and by taking into account current interest rates, currency exchange rates, current interest rate curves, interest rate volatilities, the creditworthiness of the counterparty for assets, and our creditworthiness for liabilities. In certain instances, we may utilize financial models to measure fair value. Generally, we use inputs that include quoted prices for similar assets or liabilities in active markets; quoted prices for identical or similar assets or liabilities in markets that are not active; other observable inputs for the asset or liability; and inputs derived principally from, or corroborated by, observable market data by correlation or other means. As of March 28, 2015, we have classified our derivative assets and liabilities within Level 2 of the fair value hierarchy prescribed by ASC Topic 815, as discussed below, because these observable inputs are available for substantially the full term of our derivative instruments.
The following tables present the fair value of our derivative instruments as they appear in our consolidated balance sheets as of March 28, 2015 and March 29, 2014 by type of contract and whether it is a qualifying hedge under ASC Topic 815.
(In thousands) | Location in Balance Sheet | Balance as of March 28, 2015 | Balance as of March 29, 2014 | ||||||
Derivative Assets: | |||||||||
Designated foreign currency hedge contracts | Other current assets | $ | 9,740 | $ | 2,574 | ||||
Designated interest rate swaps | Other current assets | — | 1,250 | ||||||
$ | 9,740 | $ | 3,824 | ||||||
Derivative Liabilities: | |||||||||
Designated foreign currency hedge contracts | Other current liabilities | $ | 2,499 | $ | 1,255 | ||||
Designated interest rate swaps | Other current liabilities | 159 | — | ||||||
$ | 2,658 | $ | 1,255 | ||||||
65
HAEMONETICS CORPORATION AND SUBSIDIARIES
NOTES TO CONSOLIDATED FINANCIAL STATEMENTS — (Continued)
Other Fair Value Measurements
ASC Topic 820, Fair Value Measurements and Disclosures, defines fair value, establishes a framework for measuring fair value in accordance with U.S. GAAP, and expands disclosures about fair value measurements. ASC Topic 820 does not require any new fair value measurements; rather, it applies to other accounting pronouncements that require or permit fair value measurements. In accordance with ASC Topic 820, for the fiscal years ended March 28, 2015 and March 29, 2014, we applied the requirements under ASC Topic 820 to our non-financial assets and non-financial liabilities. As we did not have an impairment of any non-financial assets or non-financial liabilities, there was no disclosure required relating to our non-financial assets or non-financial liabilities.
On a recurring basis, we measure certain financial assets and financial liabilities at fair value, including our money market funds, foreign currency hedge contracts, and contingent consideration. ASC Topic 820 defines fair value as the price that would be received to sell an asset or paid to transfer a liability in an orderly transaction between market participants at the measurement date. As such, fair value is a market-based measurement that should be determined based on assumptions that market participants would use in pricing an asset or liability. We base fair value upon quoted market prices, where available. Where quoted market prices or other observable inputs are not available, we apply valuation techniques to estimate fair value.
ASC Topic 820 establishes a three-level valuation hierarchy for disclosure of fair value measurements. The categorization of assets and liabilities within the valuation hierarchy is based upon the lowest level of input that is significant to the measurement of fair value. The three levels of the hierarchy are defined as follows:
• | Level 1 — Inputs to the valuation methodology are quoted market prices for identical assets or liabilities. |
• | Level 2 — Inputs to the valuation methodology are other observable inputs, including quoted market prices for similar assets or liabilities and market-corroborated inputs. |
• | Level 3 — Inputs to the valuation methodology are unobservable inputs based on management’s best estimate of inputs market participants would use in pricing the asset or liability at the measurement date, including assumptions about risk. |
Our money market funds carried at fair value are classified within Level 1 of the fair value hierarchy because they are valued using quoted market prices.
Fair Value Measured on a Recurring Basis
Financial assets and financial liabilities measured at fair value on a recurring basis consist of the following as of March 28, 2015 and March 29, 2014:
As of March 28, 2015 | Quoted Market Prices for Identical Assets (Level 1) | Significant Other Observable Inputs (Level 2) | Significant Unobservable Inputs (Level 3) | Total | |||||||||||
(In thousands) | (In thousands) | (In thousands) | (In thousands) | ||||||||||||
Assets | |||||||||||||||
Money market funds | $ | 119,946 | $ | — | $ | — | $ | 119,946 | |||||||
Foreign currency hedge contracts | — | 9,740 | — | 9,740 | |||||||||||
$ | 119,946 | $ | 9,740 | $ | — | $ | 129,686 | ||||||||
Liabilities | |||||||||||||||
Foreign currency hedge contracts | $ | — | $ | 2,499 | $ | — | $ | 2,499 | |||||||
Interest rate swap | — | 159 | — | 159 | |||||||||||
Contingent consideration | — | — | 4,727 | 4,727 | |||||||||||
$ | — | $ | 2,658 | $ | 4,727 | $ | 7,385 | ||||||||
66
HAEMONETICS CORPORATION AND SUBSIDIARIES
NOTES TO CONSOLIDATED FINANCIAL STATEMENTS — (Continued)
As of March 29, 2014 | Quoted Market Prices for Identical Assets (Level 1) | Significant Other Observable Inputs (Level 2) | Significant Unobservable Inputs (Level 3) | Total | |||||||||||
(In thousands) | (In thousands) | (In thousands) | (In thousands) | ||||||||||||
Assets | |||||||||||||||
Money market funds | $ | 135,378 | $ | — | $ | — | $ | 135,378 | |||||||
Forward currency hedge contracts | — | 2,574 | — | 2,574 | |||||||||||
Interest rate swap | — | 1,250 | — | 1,250 | |||||||||||
$ | 135,378 | $ | 3,824 | $ | — | $ | 139,202 | ||||||||
Liabilities | |||||||||||||||
Forward currency hedge contracts | $ | — | $ | 1,255 | $ | — | $ | 1,255 | |||||||
Contingent consideration | — | — | 7,645 | 7,645 | |||||||||||
$ | — | $ | 1,255 | $ | 7,645 | $ | 8,900 | ||||||||
For the fiscal years ended March 28, 2015 and March 29, 2014, non-designated foreign currency hedge contracts were not significant and are not disclosed separately in the above tables.
Contingent consideration
Hemerus
A description of the methods used to determine the fair value of the Level 3 liabilities is included within Note 3, Acquisitions. The table below provides a reconciliation of the beginning and ending Level 3 liabilities for the year ended March 28, 2015.
(In thousands) | Fair value measurements using significant unobservable inputs (Level 3) | |||
Contingent consideration as of March 29, 2014 | $ | 7,645 | ||
Fair value adjustment | (2,918 | ) | ||
Ending balance | $ | 4,727 | ||
The fair value adjustment to contingent consideration was a result of updated assumptions pertaining to timing and unit volumes.
Other Fair Value Disclosures
The Term Loan is carried at amortized cost and accounts receivable and accounts payable are also reported at their cost which approximates fair value.
8. NOTES PAYABLE AND LONG-TERM DEBT
Notes payable and long-term debt consisted of the following:
(In thousands) | March 28, 2015 | March 29, 2014 | |||||
Term loan, net of financing fees | $ | 426,814 | $ | 435,338 | |||
Real estate mortgage | 851 | 1,906 | |||||
Bank loans and other borrowings | 226 | 443 | |||||
Less current portion | (21,522 | ) | (45,630 | ) | |||
Long-term debt | $ | 406,369 | $ | 392,057 | |||
On August 1, 2012 in connection with the acquisition of the whole blood business, we entered into a credit agreement ("Credit Agreement") with certain lenders (together, “Lenders”) which provided for a $475.0 million term loan and a $50.0 million
67
HAEMONETICS CORPORATION AND SUBSIDIARIES
NOTES TO CONSOLIDATED FINANCIAL STATEMENTS — (Continued)
revolving loan (the “Revolving Credit Facility”), and together with the Term Loan, (the “Credit Facilities”). The Credit Facilities had a term of five years and matured on August 1, 2017.
Under the terms of this Credit Agreement, the Company may borrow at a spread to an index, including the LIBOR index of 1-month, 3-months, 6-months, etc. From the date of the Credit Agreement, the Company has chosen to borrow against the 1-month USD-LIBOR-BBA rounded up, if necessary, to the nearest 1/16th of 1%. The terms of the Credit Agreement also allow the Company to borrow in multiple tranches. The Company currently borrows in four tranches.
At closing, we borrowed the Term Loan and used the proceeds to pay Pall for the acquisition of the assets described in Note 3. Interest for the Credit Facilities was based on Adjusted LIBOR plus a range of 1.125% to 1.500% depending on the achievement of leverage ratios and customary credit terms which included financial and negative covenants. Revolving loans may be borrowed, repaid and re-borrowed to fund our working capital needs and for other general corporate purposes. The current margin of the Term Loan is 1.375% over Adjusted LIBOR and our effective interest rate inclusive of prepaid financing costs and other fees was approximately 2.0% as of March 28, 2015. The Term Loan or portions thereof may be prepaid at any time, or from time to time without penalty. Once repaid, such amount may not be re-borrowed.
On June 30, 2014, we modified our existing Credit Facilities by extending the maturity date to July 1, 2019, extending the principal repayments of the Term Loan, and modifying certain restrictive covenants to allow greater operational flexibility and enhanced near term liquidity. In addition, the amended Credit Agreement provides for a $100.0 million Revolving Credit Facility and establishes interest rates in the range of LIBOR plus 1.125% to 1.500% depending on certain conditions. At March 28, 2015, $379.4 million was outstanding under the Term Loan and $50.0 million was outstanding on the Revolving Credit Facility, both with an interest rate of 1.5625%. No additional amounts were borrowed as a result of this modification. The fair value of debt approximates its current value of approximately $429.4 million as of March 28, 2015.
Under the Credit Facilities, we are required to maintain a Consolidated Total Leverage Ratio not to exceed 3.0:1.0 and a Consolidated Interest Coverage Ratio not to be less than 4.0:1.0 during periods when the Credit Facilities are outstanding. In addition, we are required to satisfy these covenants, on a pro forma basis, in connection with any new borrowings (including any letter of credit issuances) on the Revolving Credit Facility as of the time of such borrowings. The Consolidated Interest Coverage Ratio is calculated as the Consolidated EBITDA divided by Consolidated Interest Expense while the Consolidated Total Leverage Ratio is calculated as Consolidated Total Debt divided by Consolidated EBITDA. Consolidated EBITDA includes EBITDA adjusted by non-recurring and unusual transactions specifically as defined in the Credit Facilities.
The Credit Facilities also contain usual and customary non-financial affirmative and negative covenants which include certain restrictions with respect to subsequent indebtedness, liens, loans and investments (including acquisitions), financial reporting obligations, mergers, consolidations, dissolutions or liquidation, asset sales, affiliate transactions, change of our business, capital expenditures, share repurchase and other restricted payments. These covenants are subject to important exceptions and qualifications set forth in the Credit Agreement.
Any failure to comply with the financial and operating covenants of the Credit Facilities would prevent us from being able to borrow additional funds and would constitute a default, which could result in, among other things, the amounts outstanding including all accrued interest and unpaid fees, becoming immediately due and payable. In addition, the Credit Facilities include customary events of default, in certain cases subject to customary cure periods. As of March 28, 2015, we were in compliance with the covenants.
Commitment fee
Pursuant to the Credit Agreement we are required to pay the Lenders, on the last day of each calendar quarter, a commitment fee on the unused portion of the Revolving Credit Facility. The commitment fee is subject to a pricing grid based on our Consolidated Total Leverage Ratio. The commitment fee ranges from 0.175% to 0.300%. The current commitment fee on the undrawn portion of the Revolving Credit Facility is 0.250%.
68
HAEMONETICS CORPORATION AND SUBSIDIARIES
NOTES TO CONSOLIDATED FINANCIAL STATEMENTS — (Continued)
Debt issuance costs and interest
Expenses associated with the issuance of the Term Loan were capitalized and are amortized as additional interest expense over the five years using the effective interest method. In connection with the Term Loan, we initially recorded deferred financing costs of $5.5 million and we recorded additional deferred financing costs of $1.0 million in connection with the June 30, 2014 modification, of which $2.6 million remains as a debt discount. The debt discount is netted against the $429.4 million balance, resulting in a net note payable of $426.8 million. The debt discount will also be amortized as additional interest expense over the life of the term loan.
Interest expense was $8.5 million and $8.9 million for the fiscal years ended March 28, 2015 and March 29, 2014, respectively. Accrued interest associated with our outstanding debt is included as a component of accrued expenses and other current liabilities in the accompanying consolidated balance sheets. As of March 28, 2015, accrued interest totaled $0.6 million.
Other Credit Facilities
The other debt as of March 28, 2015 includes the real estate mortgage loan of $0.9 million and short term bank borrowings of $0.2 million under operating lines of credit.
In December 2000, we entered into a $10.0 million real estate mortgage agreement (the “Mortgage Agreement”) with an investment firm. The Mortgage Agreement requires principal and interest payments of $0.1 million per month for a period of 180 months, commencing February 1, 2001. The Mortgage Agreement provides for interest to accrue on the unpaid principal balance at a rate of 8.41% per annum. Borrowings under the Mortgage Agreement, with a carrying value of approximately $0.9 million and $1.9 million as of March 28, 2015 and March 29, 2014, respectively, are secured by the land, building and building improvements at our headquarters and manufacturing facility in the U.S. There are no financial covenants in the terms and conditions of this agreement.
Maturity Profile
The maturity profile of all gross long-term debt, exclusive of debt discounts, as of March 28, 2015 is presented below:
Fiscal year (in thousands) | Mortgage Obligation | Credit Facilities | Bank loans and other borrowings | Total | ||||||||||||
2016 | $ | 851 | $ | 21,342 | $ | 144 | $ | 22,337 | ||||||||
2017 | — | 42,683 | 65 | 42,748 | ||||||||||||
2018 | — | 45,054 | 17 | 45,071 | ||||||||||||
2019 | — | 151,763 | — | 151,763 | ||||||||||||
2020 | — | 168,564 | — | 168,564 | ||||||||||||
$ | 851 | $ | 429,406 | $ | 226 | $ | 430,483 | |||||||||
69
HAEMONETICS CORPORATION AND SUBSIDIARIES
NOTES TO CONSOLIDATED FINANCIAL STATEMENTS — (Continued)
9. INCOME TAXES
Domestic and foreign income before provision for income tax is as follows:
(In thousands) | March 28, 2015 | March 29, 2014 | March 30, 2013 | ||||||||
Domestic | $ | (17,265 | ) | $ | (6,859 | ) | $ | 17,360 | |||
Foreign | 48,430 | 43,260 | 32,537 | ||||||||
Total | $ | 31,165 | $ | 36,401 | $ | 49,897 | |||||
The income tax provision contains the following components:
(In thousands) | March 28, 2015 | March 29, 2014 | March 30, 2013 | ||||||||
Current | |||||||||||
Federal | $ | 3,526 | $ | (4,896 | ) | $ | 3,795 | ||||
State | 898 | 873 | 1,324 | ||||||||
Foreign | 5,614 | 5,478 | 5,389 | ||||||||
Total current | $ | 10,038 | $ | 1,455 | $ | 10,508 | |||||
Deferred | |||||||||||
Federal | 1,227 | (1,785 | ) | 1,644 | |||||||
State | 3,215 | 207 | (229 | ) | |||||||
Foreign | (212 | ) | 1,376 | (826 | ) | ||||||
Total deferred | $ | 4,230 | $ | (202 | ) | $ | 589 | ||||
Total | $ | 14,268 | $ | 1,253 | $ | 11,097 | |||||
Our subsidiary in Puerto Rico has been granted a fifteen year tax grant which expires in 2027. Our qualification for the tax grant is dependent on the continuation of our manufacturing activities in Puerto Rico. We benefit from a reduced tax rate on our earnings in Puerto Rico under the tax grant.
Our subsidiary in Switzerland operates as a principle company for direct federal tax purposes. Operating under this structure affords our Swiss subsidiary a reduced tax rate in Switzerland. Our Swiss subsidiary also operates under a 10 year tax holiday set to expire in 2018.
Tax affected, significant temporary differences comprising the net deferred tax liability are as follows:
(In thousands) | March 28, 2015 | March 29, 2014 | |||||
Depreciation | $ | (23,733 | ) | $ | (23,658 | ) | |
Amortization | (24,038 | ) | (18,618 | ) | |||
Inventory | 6,189 | 7,371 | |||||
Hedging | 84 | 321 | |||||
Accruals, reserves and other | 15,927 | 10,368 | |||||
Net operating loss carry-forward | 5,392 | 1,507 | |||||
Stock based compensation | 10,652 | 8,757 | |||||
Tax credit carry-forward, net | 8,678 | 2,660 | |||||
Gross deferred taxes | $ | (849 | ) | $ | (11,292 | ) | |
Less valuation allowance | (16,027 | ) | (3,083 | ) | |||
Net deferred tax liability | $ | (16,876 | ) | $ | (14,375 | ) | |
The valuation allowance increased by $12.9 million during 2015, primarily due to recording a valuation allowance against domestic deferred tax assets that we have determined are not more-likely-than-not realizable. In determining the need for a valuation allowance, we have assessed the available means of recovering deferred tax assets, including the ability to carryback net operating losses, the existence of reversing temporary differences, the availability of tax planning strategies and available
70
HAEMONETICS CORPORATION AND SUBSIDIARIES
NOTES TO CONSOLIDATED FINANCIAL STATEMENTS — (Continued)
sources of future taxable income. We have also considered the ability to implement certain strategies that would, if necessary, be implemented to accelerate taxable income and use expiring deferred tax assets. We believe we are able to support the deferred tax assets recognized as of the end of the year based on all of the available evidence. The worldwide net deferred tax liability as of March 28, 2015 includes deferred tax liabilities related to amortizable goodwill, which are indefinite lived and are not considered to be a source of taxable income. As of March 28, 2015, we maintain a valuation allowance against the portion of our U.S. net deferred tax assets that are not more-likely-than-not realizable and a full valuation allowance against the net deferred tax assets of certain foreign subsidiaries.
At March 28, 2015, we have U.S. federal net operating loss carry-forwards of approximately $11.7 million, U.S. state net operating loss carry-forwards of $23.6 million, federal tax credit carry-forwards of $6.4 million and state tax credit carry-forwards of $4.0 million that are available to reduce future taxable income. A portion of the federal net operating losses are subject to an annual limitation due to the ownership change limitations set forth under Internal Revenue Code Sections 382. Certain of the aforementioned amounts have not been recognized because they relate to excess stock based compensation. At March 28, 2015, $1.5 million of the federal net operating loss carry-forwards, $4.0 million of the state net operating loss carry-forwards, none of the federal tax credit carry-forwards and none of the state tax credit carry-forwards relate to excess stock based compensation tax deductions for which the benefit will be recorded to additional paid-in capital when recognized. The federal and state net operating losses begin to expire in 2022 and 2019, respectively. The federal and state tax credits begin to expire in 2023 and 2025, respectively.
As of March 28, 2015, we have foreign net operating losses of approximately $6.6 million that are available to reduce future income. Substantially all of our foreign net operating loss carry-forwards have unlimited carryover periods.
Income taxes have not been provided on the undistributed earnings of foreign subsidiaries of approximately $300.2 million, because such earnings are considered to be indefinitely reinvested in the business. The accumulated earnings in the foreign subsidiaries are primarily utilized to fund working capital requirements as our subsidiaries continue to expand their operations, to service existing debt obligations and to fund future foreign acquisitions. We do not believe it is practicable to estimate the amount of income taxes payable on the earnings that are indefinitely reinvested in foreign operations.
The income tax provision from operations differs from tax provision computed at the 35.0% U.S. federal statutory income tax rate due to the following:
(In thousands) | March 28, 2015 | March 29, 2014 | March 30, 2013 | |||||||||||||||||
Tax at federal statutory rate | $ | 10,907 | 35.0 | % | $ | 12,739 | 35.0 | % | $ | 17,464 | 35.0 | % | ||||||||
Domestic manufacturing deduction | — | — | % | — | — | % | (504 | ) | (1.0 | )% | ||||||||||
Difference between U.S. and foreign tax | (6,929 | ) | (22.2 | )% | (10,846 | ) | (29.8 | )% | (5,584 | ) | (11.2 | )% | ||||||||
State income taxes net of federal benefit | (818 | ) | (2.6 | )% | (252 | ) | (0.7 | )% | 718 | 1.4 | % | |||||||||
Change in uncertain tax positions | (1,762 | ) | (5.7 | )% | (1,678 | ) | (4.6 | )% | (580 | ) | (1.2 | )% | ||||||||
Intercompany loan deduction | — | — | % | (2,185 | ) | (6.0 | )% | — | — | % | ||||||||||
Non-deductible expenses | 1,237 | 4.0 | % | 1,035 | 2.8 | % | 1,178 | 2.4 | % | |||||||||||
Research credits | (1,000 | ) | (3.2 | )% | (688 | ) | (1.9 | )% | (799 | ) | (1.6 | )% | ||||||||
Naked Credit | 3,826 | 12.3 | % | — | — | % | — | — | % | |||||||||||
Valuation allowance | 8,524 | 27.4 | % | 2,400 | 6.6 | % | — | — | % | |||||||||||
Other, net | 283 | 0.8 | % | 728 | 2.0 | % | (796 | ) | (1.6 | )% | ||||||||||
Income tax provision | $ | 14,268 | 45.8 | % | $ | 1,253 | 3.4 | % | $ | 11,097 | 22.2 | % | ||||||||
Unrecognized Tax Benefits
Unrecognized tax benefits represent uncertain tax positions for which reserves have been established. As of March 28, 2015, we had $7.1 million of unrecognized tax benefits, of which $2.0 million would impact the effective tax rate, if recognized. As of March 29, 2014, we had $5.6 million of unrecognized tax benefits, all of which would impact the effective tax rate, if recognized. At March 30, 2013, we had $6.9 million of unrecognized tax benefits, of which $6.7 million would impact the effective tax rate, if recognized.
71
HAEMONETICS CORPORATION AND SUBSIDIARIES
NOTES TO CONSOLIDATED FINANCIAL STATEMENTS — (Continued)
During the fiscal year ended March 28, 2015 our unrecognized tax benefits were increased by $1.5 million due primarily to tax reserve increases for prior year additions, partially offset by the release of certain previously established reserves in connection with the closure of tax statutes of limitations.
The following table summarizes the activity related to our gross unrecognized tax benefits for the fiscal years ended March 28, 2015, March 29, 2014 and March 30, 2013:
(In thousands) | March 28, 2015 | March 29, 2014 | March 30, 2013 | ||||||||
Beginning Balance | $ | 5,604 | $ | 6,930 | $ | 6,885 | |||||
Additions based upon positions related to the current year | — | — | 1,192 | ||||||||
Additions for tax positions of prior years | 3,234 | 990 | 18 | ||||||||
Settlements with taxing authorities | (338 | ) | — | (80 | ) | ||||||
Closure of statute of limitations | (1,430 | ) | (2,316 | ) | (1,085 | ) | |||||
Ending Balance | $ | 7,070 | $ | 5,604 | $ | 6,930 | |||||
As of March 28, 2015 we anticipate that the liability for unrecognized tax benefits for uncertain tax positions could change by up to $0.9 million in the next twelve months, as a result of closure of various statutes of limitations.
Our historic practice has been and continues to be to recognize interest and penalties related to Federal, state and foreign income tax matters in income tax expense. Approximately $0.7 million and $0.8 million of gross interest and penalties were accrued at March 28, 2015 and March 29, 2014, respectively and is not included in the amounts above. There was a benefit included in tax expense of $0.3 million, zero and $0.1 million for the periods ended March 28, 2015, March 29, 2014 and March 30, 2013, respectively.
We conduct business globally and, as a result, file consolidated and separate Federal, state and foreign income tax returns in multiple jurisdictions. In the normal course of business, we are subject to examination by taxing authorities throughout the world. With a few exceptions overseas, we are no longer subject to U.S. federal, state and local, or foreign income tax examinations for years before 2012.
10. COMMITMENTS AND CONTINGENCIES
We lease facilities and certain equipment under operating leases expiring at various dates through fiscal 2028. Facility leases require us to pay certain insurance expenses, maintenance costs and real estate taxes.
Approximate future basic rental commitments under operating leases as of March 28, 2015 are as follows (in thousands):
Fiscal Year Ending | |||
(In thousands) | |||
2016 | $ | 6,797 | |
2017 | 4,780 | ||
2018 | 3,758 | ||
2019 | 2,427 | ||
2020 and thereafter | 11,585 | ||
$ | 29,347 | ||
Rent expense in fiscal 2015, 2014, and 2013 was $6.3 million, $7.7 million and $7.0 million, respectively. Some of the Company's operating leases include renewal provisions, escalation clauses and options to purchase the facilities that we lease.
We are presently engaged in various legal actions, and although our ultimate liability cannot be determined at the present time, we believe, based on consultation with counsel, that any such liability will not materially affect our consolidated financial position or our results of operations.
72
HAEMONETICS CORPORATION AND SUBSIDIARIES
NOTES TO CONSOLIDATED FINANCIAL STATEMENTS — (Continued)
Italian Employment Litigation
Our Italian manufacturing subsidiary is party to several actions initiated by employees of the facility in Ascoli-Piceno, Italy where we have ceased manufacturing operations. These include actions claiming (i) working conditions and minimum salaries should have been established by either a different classification under their national collective bargaining agreement or a different agreement altogether, (ii) certain solidarity agreements, which are arrangements between the Company, employees and the government to continue full pay and benefits for employees who would otherwise be terminated in times of low demand, are void, and (iii) payment of the extra time used for changing into and out of the working clothes at the beginning and end of each shift.
In addition, a union represented in the Ascoli plant has filed an action claiming that the Company discriminated against it in favor of three other represented unions by (i) interfering with an employee referendum, (ii) interfering with an employee petition to recall union representatives from office, and (iii) excluding the union from certain meetings.
Finally, we have been added as defendants on claims filed against Pall Corporation prior to our acquisition of the plant in August 2012. These claims relate to agreements to "freeze" benefit allowances for a certain period in exchange for Pall's commitments on hiring and plant investment.
As of March 28, 2015, the total amount of damages claimed by the plaintiffs in these matters is approximately $3.7 million; however, it is not possible at this point in the proceedings to accurately evaluate the likelihood or amount of any potential losses. We may receive other similar claims in the future.
11. CAPITAL STOCK
Stock Plans
The 2005 Long-Term Incentive Compensation Plan (the “2005 Incentive Compensation Plan”) permits the award of non-qualified stock options, incentive stock options, stock appreciation rights, restricted stock, deferred stock/restricted stock units, other stock units and performance shares to the Company’s key employees, officers and directors. The 2005 Incentive Compensation Plan is administered by the Compensation Committee of the Board of Directors (the “Committee”) consisting of three independent members of our Board of Directors.
The maximum number of shares available for award under the 2005 Incentive Compensation Plan is 15,024,920. The maximum number of shares that may be issued pursuant to incentive stock options may not exceed 500,000. Any shares that are subject to the award of stock options shall be counted against this limit as one (1) share for every one (1) share issued. Any shares that are subject to awards other than stock options shall be counted against this limit as 3.26 shares for every one (1) share granted.
Each award has different terms under the 2005 Incentive Compensation Plan. Options, Restricted Stock Awards and Restricted Stock Units become exercisable, or in the case of restricted stock, the resale restrictions are released in a manner determined by the Committee, generally over a four year period for employees and one year from grant for non-employee directors, and all options expire not more than 7 years from the date of the grant. The exercise price for options granted under the 2005 Incentive Compensation Plan is determined by the Committee, but in no event shall such exercise price be less than the fair market value of the common stock at the time of the grant. Holders of market stock units are eligible to receive a share of Haemonetics’ stock for each market stock unit based on the performance of the stock through March 31, 2017. If our stock is below a minimum threshold price of $50 per share during the relevant measurement period, the holders receive no market share units. If the stock achieves certain price levels, the holders are eligible to receive up to three times the “target” amount of market share units. As a result, we may issue up to 863,046 shares at a stock price of $85 per share or higher in connection with these grants.
At March 28, 2015, there were outstanding options to purchase 3,761,666 shares, 357,547 shares of restricted stock outstanding and 287,682 market stock units outstanding under this plan and 999,243 shares available for future grant.
The Company had a long-term incentive stock option plan and a non-qualified stock option plan, (the “2000 Long-term Incentive Plan”) which permitted the issuance of a maximum of 7,000,000 shares of our common stock pursuant to incentive and non-qualified stock options granted to key employees, officers and directors. The plan was terminated in connection with the adoption of the 2005 Incentive Compensation Plan. The remaining 55,750 options outstanding under this plan were exercised in fiscal 2015 and no further options will be granted under this plan.
73
HAEMONETICS CORPORATION AND SUBSIDIARIES
NOTES TO CONSOLIDATED FINANCIAL STATEMENTS — (Continued)
The Company has an Employee Stock Purchase Plan (the “Purchase Plan”) under which a maximum of 1,400,000 shares (subject to adjustment for stock splits and similar changes) of common stock may be purchased by eligible employees. Substantially all of our full-time employees are eligible to participate in the Purchase Plan.
The Purchase Plan provides for two “purchase periods” within each of our fiscal years, the first commencing on November 1 of each year and continuing through April 30 of the next calendar year, and the second commencing on May 1 of each year and continuing through October 31 of such year. Shares are purchased through an accumulation of payroll deductions (of not less than 2% or more than 15% of compensation, as defined) for the number of whole shares determined by dividing the balance in the employee’s account on the last day of the purchase period by the purchase price per share for the stock determined under the Purchase Plan. The purchase price for shares is the lower of 85% of the fair market value of the common stock at the beginning of the purchase period, or 85% of such value at the end of the purchase period.
Stock-based compensation expense of $14.1 million, $13.1 million, and $11.0 million was recognized under ASC Topic 718, Compensation — Stock Compensation, for the fiscal year ended March 28, 2015, March 29, 2014, and March 30, 2013, respectively. The related income tax benefit recognized was $4.5 million, $4.3 million, and $3.5 million for the fiscal year ended March 28, 2015, March 29, 2014, and March 30, 2013, respectively. We recognize stock-based compensation on a straight line basis.
ASC Topic 718 requires that cash flows relating to the benefits of tax deductions in excess of stock compensation cost recognized be reported as a financing cash flow, rather than as an operating cash flow. This excess tax benefit was $1.6 million, $2.4 million, and $4.1 million for the fiscal year ended March 28, 2015, March 29, 2014, and March 30, 2013, respectively.
Stock Options
A summary of stock option activity for the fiscal year ended March 28, 2015 is as follows:
Options Outstanding (shares) | Weighted Average Exercise Price per Share | Weighted Average Remaining Life (years) | Aggregate Intrinsic Value ($000’s) | |||||||||
Outstanding at March 29, 2014 | 3,834,372 | $ | 32.93 | 4.19 | $ | 9,436 | ||||||
Granted | 592,024 | 34.87 | ||||||||||
Exercised | (500,103 | ) | 26.14 | |||||||||
Forfeited | (164,627 | ) | 38.13 | |||||||||
Outstanding at March 28, 2015 | 3,761,666 | $ | 33.90 | 4.02 | $ | 37,067 | ||||||
Exercisable at March 28, 2015 | 2,281,022 | $ | 31.57 | 2.92 | $ | 27,826 | ||||||
Vested or expected to vest at March 28, 2015 | 3,596,493 | $ | 33.73 | 3.93 | $ | 36,066 | ||||||
The total intrinsic value of options exercised was $5.6 million, $11.7 million, and $20.9 million during fiscal 2015, 2014, and 2013, respectively.
As of March 28, 2015, there was $9.2 million of total unrecognized compensation cost related to non-vested stock options. This cost is expected to be recognized over a weighted average period of 2.37 years.
The fair value was estimated using the Black-Scholes option-pricing model based on the weighted average of the high and low stock prices at the grant date and the weighted average assumptions specific to the underlying options. Expected volatility assumptions are based on the historical volatility of our common stock. The risk-free interest rate was selected based upon yields of U.S. Treasury issues with a term equal to the expected life of the option being valued. The expected life of the option was estimated with reference to historical exercise patterns, the contractual term of the option and the vesting period.
74
HAEMONETICS CORPORATION AND SUBSIDIARIES
NOTES TO CONSOLIDATED FINANCIAL STATEMENTS — (Continued)
The assumptions utilized for option grants during the periods presented are as follows:
March 28, 2015 | March 29, 2014 | March 30, 2013 | ||||||
Volatility | 22.5 | % | 24.8 | % | 26.4 | % | ||
Expected life (years) | 4.9 | 4.9 | 4.9 | |||||
Risk-free interest rate | 1.5 | % | 1.3 | % | 0.8 | % | ||
Dividend yield | 0.0 | % | 0.0 | % | 0.0 | % | ||
The weighted average grant date fair value of options to purchase one share granted during 2015, 2014, and 2013 was approximately $7.91, $10.15, and $9.76, respectively.
We have applied, based on an analysis of our historical forfeitures, an annual forfeiture rate of 8% to all unvested stock options as of March 28, 2015 and March 29, 2014, which represents the portion that we expect will be forfeited each year over the vesting period.
Employee Stock Purchase Plan
The fair values of shares purchased under the Employee Stock Purchase Plan are estimated using the Black-Scholes single option-pricing model with the following weighted average assumptions:
March 28, 2015 | March 29, 2014 | March 30, 2013 | ||||||
Volatility | 23.7 | % | 22.9 | % | 24.9 | % | ||
Expected life (months) | 6 | 6 | 6 | |||||
Risk-free interest rate | 0.1 | % | 0.1 | % | 0.2 | % | ||
Dividend Yield | 0.0 | % | 0.0 | % | 0.0 | % | ||
The weighted average grant date fair value of the six-month option inherent in the Purchase Plan was approximately $7.09, $8.25, and $8.50 during fiscal 2015, 2014, and 2013, respectively.
Performance Stock Units, Restricted Stock Units and Market Stock Units
On October 22, 2014, the Company issued a new type of equity award under its 2005 Incentive Compensation Plan, Performance Share Units, with a target award level of 129,130 shares for 14 senior executives.
The value of these Performance Share Units is based upon the Company’s total shareholder return for the period from October 1, 2014 to their vesting date of September 30, 2017 relative to the total shareholder return of the companies comprising the Standard & Poor's Health Care Equipment Index (the "Index"). These awards are conditioned upon the employees’ continued employment with the Company through the vesting date. If an employee is no longer employed by the Company at the vesting date as a result of a Qualifying Retirement, then the continued employment requirement shall cease to apply and prorated shares awarded will be determined as of the vesting date.
Total shareholder return is equal to the appreciation of the share price during a performance period, plus any dividends paid on the applicable company’s common stock. Relative total shareholder return compares the company's total shareholder return to the Index.
The actual number of shares awarded under a Performance Share Unit may range from 0% to a maximum of 200% of the target award depending upon the Company’s relative total shareholder return. If the Company’s total shareholder return for the performance period is negative, then any share payout will be capped at 100% of the target award, regardless of the Company's performance relative to the Index.
Grant date fair values for the Performance Share Units were estimated using a Monte Carlo Simulation of the Company's and the Index's stock price correlation over three-year time horizons matching the Performance Share Units performance period with a risk free rate of 0.78%, volatility of 20% and 12 months of dividend history.
75
HAEMONETICS CORPORATION AND SUBSIDIARIES
NOTES TO CONSOLIDATED FINANCIAL STATEMENTS — (Continued)
The estimated fair value, potential shares to be awarded, recognized compensation expense and future compensation expense to be recognized, including estimated forfeitures, for Performance Share Unit awards are as follows:
For Year Ended March 28, 2015 | |||||||||||||
Performance Period | Award Fair Value as of October 22, 2014 | Recognized Compensation Expense | Unrecognized Compensation Expense | Minimum Shares | Target Shares | Maximum Shares | |||||||
(Per share) | (In thousands) | (In thousands) | |||||||||||
Oct 1, 2014 - Sept 30, 2017 | $ | 35.09 | $ | 662 | $ | 3,869 | — | 129,130 | 258,260 | ||||
As of March 28, 2015, there were 287,682 market stock units outstanding. We determined the fair value of each market stock unit to be $37.42, utilizing a Monte Carlo simulation model based on an expected term of 3.7 years, a risk free rate of 0.9%, volatility of 20% and no dividends. The grant date fair value of these awards totaled $11.2 million and will be expensed evenly over the 3.7 year period through the cliff-vesting date of March 31, 2017.
As of March 28, 2015, there was $13.2 million of total unrecognized compensation cost related to non-vested restricted stock units and market stock units. This cost is expected to be recognized over a weighted average period of 2.37 years.
A summary of performance stock units, restricted stock units and market stock units activity for the fiscal year ended March 28, 2015 is as follows:
Shares | Weighted Average Market Value at Grant Date | |||||
Unvested at March 29, 2014 | 599,673 | $ | 37.70 | |||
Awarded | 351,666 | $ | 35.18 | |||
Released | (110,048 | ) | $ | 36.65 | ||
Forfeited | (66,932 | ) | $ | 37.83 | ||
Unvested at March 28, 2015 | 774,359 | $ | 36.70 | |||
12. EARNINGS PER SHARE (“EPS”)
The following table provides a reconciliation of the numerators and denominators of the basic and diluted earnings per share computations. Basic EPS is computed by dividing net income by weighted average shares outstanding. Diluted EPS includes the effect of potentially dilutive common shares. The common stock weighted average number of shares has been retroactively adjusted for the stock split.
(In thousands, except per share amounts) | March 28, 2015 | March 29, 2014 | March 30, 2013 | ||||||||
Basic EPS | |||||||||||
Net income | $ | 16,897 | $ | 35,148 | $ | 38,800 | |||||
Weighted average shares | 51,533 | 51,611 | 51,349 | ||||||||
Basic income per share | $ | 0.33 | $ | 0.68 | $ | 0.76 | |||||
Diluted EPS | |||||||||||
Net income | $ | 16,897 | $ | 35,148 | $ | 38,800 | |||||
Basic weighted average shares | 51,533 | 51,611 | 51,349 | ||||||||
Net effect of common stock equivalents | 556 | 766 | 910 | ||||||||
Diluted weighted average shares | 52,089 | 52,377 | 52,259 | ||||||||
Diluted income per share | $ | 0.32 | $ | 0.67 | $ | 0.74 | |||||
Weighted average shares outstanding, assuming dilution, excludes the impact of 1.6 million, 1.1 million and 0.5 million stock options for fiscal years 2015, 2014 and 2013, respectively, because these securities were anti-dilutive during the noted periods.
76
HAEMONETICS CORPORATION AND SUBSIDIARIES
NOTES TO CONSOLIDATED FINANCIAL STATEMENTS — (Continued)
13. PROPERTY, PLANT AND EQUIPMENT
Property and equipment consisted of the following:
(In thousands) | March 28, 2015 | March 29, 2014 | ||||||
Land | $ | 9,468 | $ | 7,168 | ||||
Building and building improvements | 118,384 | 83,439 | ||||||
Plant equipment and machinery | 220,793 | 236,539 | ||||||
Office equipment and information technology | 118,810 | 111,925 | ||||||
Haemonetics equipment | 264,307 | 262,784 | ||||||
Total | 731,762 | 701,855 | ||||||
Less: accumulated depreciation and amortization | (409,814 | ) | (430,418 | ) | ||||
Property, plant and equipment, net | $ | 321,948 | $ | 271,437 | ||||
Depreciation expense was $52.6 million, $52.6 million, and $43.4 million for fiscal 2015, 2014, and 2013, respectively.
14. RETIREMENT PLANS
Defined Contribution Plans
We have a Savings Plus Plan that is a 401(k) plan that allows our U.S. employees to accumulate savings on a pre-tax basis. In addition, matching contributions are made to the Plan based upon pre-established rates. Our matching contributions amounted to approximately $5.8 million in 2015, $6.2 million in 2014, and $4.9 million in 2013. Upon Board approval, additional discretionary contributions can also be made. No discretionary contributions were made for the Savings Plan in fiscal 2015, 2014, or 2013.
Some of our subsidiaries also have defined contribution plans, to which both the employee and the employer make contributions. The employer contributions to these plans totaled $1.0 million, $0.8 million, and $2.4 million in fiscal 2015, 2014, and 2013, respectively.
Defined Benefit Plans
ASC Topic 715, Compensation — Retirement Benefits, requires an employer to: (a) recognize in its statement of financial position an asset for a plan’s over-funded status or a liability for a plan’s under-funded status; (b) measure a plan’s assets and its obligations that determine its funded status as of the end of the employer’s fiscal year (with limited exceptions); and (c) recognize changes in the funded status of a defined benefit post retirement plan in the year in which the changes occur. Accordingly, the Company is required to report changes in its funded status in comprehensive income on its Statement of Stockholders’ Equity and Comprehensive Income.
Benefits under these plans are generally based on either career average or final average salaries and creditable years of service as defined in the plans. The annual cost for these plans is determined using the projected unit credit actuarial cost method that includes actuarial assumptions and estimates which are subject to change.
77
HAEMONETICS CORPORATION AND SUBSIDIARIES
NOTES TO CONSOLIDATED FINANCIAL STATEMENTS — (Continued)
Some of the our foreign subsidiaries have defined benefit pension plans covering substantially all full time employees at those subsidiaries. Net periodic benefit costs for the plans in the aggregate include the following components:
(In thousands) | March 28, 2015 | March 29, 2014 | March 30, 2013 | ||||||||
Service cost | $ | 2,979 | $ | 3,351 | $ | 2,759 | |||||
Interest cost on benefit obligation | 686 | 623 | 639 | ||||||||
Expected (return)/loss on plan assets | (449 | ) | (435 | ) | (413 | ) | |||||
Actuarial loss/(gain) | 107 | 88 | 196 | ||||||||
Amortization of unrecognized prior service cost | (29 | ) | 182 | (14 | ) | ||||||
Amortization of unrecognized transition obligation | 45 | 47 | 48 | ||||||||
Totals | $ | 3,339 | $ | 3,856 | $ | 3,215 | |||||
The activity under those defined benefit plans are as follows:
(In thousands) | March 28, 2015 | March 29, 2014 | |||||
Change in Benefit Obligation: | |||||||
Benefit Obligation, beginning of year | $ | (32,621 | ) | $ | (30,126 | ) | |
Service cost | (2,979 | ) | (3,351 | ) | |||
Interest cost | (686 | ) | (623 | ) | |||
Benefits paid | 4,902 | 4,474 | |||||
Actuarial (loss)/gain | (6,883 | ) | 55 | ||||
Employee and plan participants contribution | (2,978 | ) | (2,963 | ) | |||
Plan Amendments | 114 | 419 | |||||
Foreign currency changes | 564 | (506 | ) | ||||
Benefit obligation, end of year | $ | (40,567 | ) | $ | (32,621 | ) | |
Change in Plan Assets: | |||||||
Fair value of plan assets, beginning of year | $ | 19,981 | $ | 19,577 | |||
Company contributions | 2,112 | 2,241 | |||||
Benefits paid | (4,621 | ) | (4,641 | ) | |||
Gain/(Loss) on plan assets | 506 | 100 | |||||
Employee and plan participants contributions | 2,851 | 3,087 | |||||
Foreign currency changes | 2,336 | (383 | ) | ||||
Fair value of Plan Assets, end of year | $ | 23,165 | $ | 19,981 | |||
Funded Status | $ | (17,402 | ) | $ | (12,640 | ) | |
Unrecognized net actuarial loss/(gain) | 11,096 | 5,899 | |||||
Unrecognized initial obligation | 64 | 94 | |||||
Unrecognized prior service cost | (459 | ) | (422 | ) | |||
Net amount recognized | $ | (6,701 | ) | $ | (7,069 | ) | |
One of the benefit plans is funded by benefit payments made by the Company. Accordingly that plan has no assets included in the information presented above. The total liability for this plan was $9.2 million and $7.4 million as of March 28, 2015 and March 29, 2014, respectively.
The accumulated benefit obligation for all plans was $34.9 million and $30.9 million for the fiscal year ended March 28, 2015 and March 29, 2014, respectively.
The projected benefit obligation, accumulated benefit obligation, and fair value of plan assets for the pension plans with an accumulated benefit obligation in excess of plan assets were $40.6 million, $34.9 million and $23.2 million, respectively, as of
78
HAEMONETICS CORPORATION AND SUBSIDIARIES
NOTES TO CONSOLIDATED FINANCIAL STATEMENTS — (Continued)
March 28, 2015 and $32.6 million, $30.9 million and $20.0 million, respectively, as of March 29, 2014. There were no plans where the plan assets were greater than the accumulated benefit obligation as of March 28, 2015 and March 29, 2014.
The components of the change recorded in our accumulated other comprehensive income related to our defined benefit plans, net of tax, are as follows (in thousands):
Balance, March 31, 2012 | $ | (4,253 | ) |
Obligation at transition | 556 | ||
Actuarial loss | (1,237 | ) | |
Prior service cost | (139 | ) | |
Balance as of March 30, 2013 | $ | (5,073 | ) |
Obligation at transition | 172 | ||
Actuarial loss | (129 | ) | |
Prior service cost | 438 | ||
Balance as of March 29, 2014 | $ | (4,592 | ) |
Obligation at transition | (19 | ) | |
Actuarial loss | (6,198 | ) | |
Prior service cost | 1,886 | ||
Balance as of March 28, 2015 | $ | (8,923 | ) |
We expect to amortize $0.6 million from accumulated other comprehensive loss during 2016.
The weighted average rates used to determine the net periodic benefit costs and projected benefit obligations were as follows:
March 28, 2015 | March 29, 2014 | March 30, 2013 | ||||||
Discount rate | 0.93 | % | 2.02 | % | 1.97 | % | ||
Rate of increased salary levels | 1.65 | % | 1.57 | % | 1.42 | % | ||
Expected long-term rate of return on assets | 1.68 | % | 1.94 | % | 1.92 | % | ||
Assumptions for expected long-term rate of return on plan assets are based upon actual historical returns, future expectations of returns for each asset class and the effect of periodic target asset allocation rebalancing. The results are adjusted for the payment of reasonable expenses of the plan from plan assets.
We have no other material obligation for post-retirement or post-employment benefits.
Our investment policy for pension plans is to balance risk and return through a diversified portfolio to reduce interest rate and market risk. Maturities are managed so that sufficient liquidity exists to meet immediate and future benefit payment requirements.
ASC Topic 820, Fair Value Measurements and Disclosures, provides guidance for reporting and measuring the plan assets of our defined benefit pension plan at fair value as of March 28, 2015. Using the same three-level valuation hierarchy for disclosure of fair value measurements as described in Note 7, all of the assets of the Company’s plan are classified within Level 2 of the fair value hierarchy because the plan assets are primarily insurance contracts.
Expected benefit payments for both plans are estimated using the same assumptions used in determining the company’s benefit obligation at March 28, 2015. Benefit payments will depend on future employment and compensation levels, average years employed and average life spans, among other factors, and changes in any of these factors could significantly affect these estimated future benefit payments.
79
HAEMONETICS CORPORATION AND SUBSIDIARIES
NOTES TO CONSOLIDATED FINANCIAL STATEMENTS — (Continued)
Estimated future benefit payments during the next five years and in the aggregate for the five fiscal years thereafter, are as follows (in thousands):
Expected Benefit Payments | |||
Fiscal Year 2016 | $ | 1,735 | |
Fiscal Year 2017 | $ | 1,654 | |
Fiscal Year 2018 | $ | 1,502 | |
Fiscal Year 2019 | $ | 1,610 | |
Fiscal Year 2020 | $ | 1,732 | |
Fiscal Year 2021-2024 | $ | 7,493 | |
The Company's contributions for fiscal 2016 are expected to be consistent with the current year.
15. SEGMENT INFORMATION
Segment Definition Criteria
We manage a global business which designs, manufactures and markets blood management solutions. Our solutions are marketed through operating segments organized primarily on geography: North America Plasma, North America Blood Center and Hospital, Europe, Asia Pacific and Japan.
ASC 280, Segment Reporting, permits the aggregation of segments which are economically similar as well as similar in all of the following areas: (i) the nature of the products and services, (ii) the nature of the production processes, (iii) the type or class of customer for their products and services, (iv) the methods used to distribute their products or provide their services, and (v) the nature of the regulatory environment.
The Company believes aggregating the operating segments noted above is consistent with the key principles of ASC 280, based on the determination that they are economically similar. The Company believes a single reportable segment is consistent with its basic organizational structure and believes aggregation is consistent with its primary basis for decision making and accordingly does not conflict with the basic principles of ASC 280.
Enterprise Wide Disclosures About Product and Services
We have four global product families: plasma, blood center, hospital, and software solutions.
Our products include whole blood disposables, equipment devices and the related disposables used with these devices. Disposables include part of plasma, blood center, and hospital product families. Plasma consists of the disposables used to perform apheresis for the separation of whole blood components and subsequent collection of plasma to be used as a raw material for biologically derived pharmaceuticals. Blood center consists of disposables which separate whole blood for the subsequent collection of platelets, plasma, red cells, or a combination of these components for transfusion to patients as well as disposables for manual whole blood collection. Hospital consists of surgical disposables (principally the Cell Saver® autologous blood recovery system targeted to procedures that involve rapid, high volume blood loss such as cardiovascular surgeries), the OrthoPAT® orthopedic perioperative autotransfusion system designed to operate both during and after surgery to recover and wash the patient’s red cells to prepare them for reinfusion, and diagnostics products (principally the TEG® Thrombelastograph® hemostasis analyzer used to help assess a surgical patient’s hemostasis during and after surgery).
Software solutions include information technology platforms that assist blood centers, plasma centers, and hospitals to more effectively manage regulatory compliance and operational efficiency.
80
HAEMONETICS CORPORATION AND SUBSIDIARIES
NOTES TO CONSOLIDATED FINANCIAL STATEMENTS — (Continued)
Revenues from External Customers:
(In thousands) | March 28, 2015 | March 29, 2014 | March 30, 2013 | ||||||||
Disposable revenues | |||||||||||
Plasma disposables | $ | 319,190 | $ | 291,895 | $ | 268,900 | |||||
Blood center disposables | |||||||||||
Platelet | 152,588 | 156,643 | 169,602 | ||||||||
Red cell | 42,700 | 42,378 | 49,733 | ||||||||
Whole blood | 143,905 | 190,698 | 138,436 | ||||||||
339,193 | 389,719 | 357,771 | |||||||||
Hospital disposables | |||||||||||
Surgical | 62,540 | 66,876 | 73,508 | ||||||||
OrthoPAT | 20,316 | 25,042 | 30,230 | ||||||||
Diagnostics | 42,187 | 33,302 | 27,356 | ||||||||
125,043 | 125,220 | 131,094 | |||||||||
Disposables revenue | 783,426 | 806,834 | 757,765 | ||||||||
Software solutions | 72,185 | 70,441 | 69,952 | ||||||||
Equipment & other | 54,762 | 61,234 | 64,273 | ||||||||
Total revenues | $ | 910,373 | $ | 938,509 | $ | 891,990 | |||||
Enterprise Wide Disclosures About Product and Services
Year Ended (in thousands)
March 28, 2015 | United States | Other North America | Total North America | Japan | Other Asia | Total Europe | Total Consolidated | ||||||||||||||||||||
Net revenues | $ | 494,788 | $ | 9,617 | $ | 504,405 | $ | 88,298 | $ | 102,095 | $ | 215,575 | $ | 910,373 | |||||||||||||
Total Assets | $ | 810,159 | $ | 240,610 | $ | 1,050,769 | $ | 41,621 | $ | 79,084 | $ | 313,943 | $ | 1,485,417 | |||||||||||||
Long-Lived Assets | $ | 532,187 | $ | 212,548 | $ | 744,735 | $ | 9,230 | $ | 46,857 | $ | 114,318 | $ | 915,140 | |||||||||||||
March 29, 2014 | United States | Other North America | Total North America | Japan | Other Asia | Total Europe | Total Consolidated | ||||||||||||||||||||
Net revenues | $ | 500,719 | $ | 9,557 | $ | 510,276 | $ | 108,679 | $ | 94,762 | $ | 224,792 | $ | 938,509 | |||||||||||||
Total Assets | $ | 810,409 | $ | 225,998 | $ | 1,036,407 | $ | 53,207 | $ | 53,055 | $ | 371,509 | $ | 1,514,178 | |||||||||||||
Long-Lived Assets | $ | 519,396 | $ | 211,624 | $ | 731,020 | $ | 11,522 | $ | 17,269 | $ | 131,391 | $ | 891,202 | |||||||||||||
March 30, 2013 | United States | Other North America | Total North America | Japan | Other Asia | Total Europe | Total Consolidated | ||||||||||||||||||||
Net revenues | $ | 454,874 | $ | 6,851 | $ | 461,725 | $ | 120,726 | $ | 84,860 | $ | 224,679 | $ | 891,990 | |||||||||||||
Total Assets | $ | 830,754 | $ | 225,849 | $ | 1,056,603 | $ | 44,189 | $ | 41,037 | $ | 320,088 | $ | 1,461,917 | |||||||||||||
Long-Lived Assets | $ | 503,606 | $ | 209,439 | $ | 713,045 | $ | 12,977 | $ | 8,076 | $ | 117,717 | $ | 851,815 | |||||||||||||
The Long-Lived Assets reported above include Goodwill, Intangibles and Net Property, Plant and Equipment.
81
HAEMONETICS CORPORATION AND SUBSIDIARIES
NOTES TO CONSOLIDATED FINANCIAL STATEMENTS — (Continued)
16. RESTRUCTURING
On an ongoing basis, we review the global economy, the healthcare industry, and the markets in which we compete. From these reviews we identify opportunities to improve efficiencies, enhance commercial capabilities, better align our resources and offer customers better comprehensive solutions. In order to realize these opportunities, from time to time, we undertake restructuring and other initiatives to transform our business.
On May 1, 2013, we committed to a plan to pursue identified Value Creation and Capture initiatives ("VCC"). These opportunities include investment in product line extensions and next generation products, enhancement of commercial capabilities and a transformation of our manufacturing network. The transformation of our manufacturing network will take place over three years and includes changes to the current manufacturing footprint and supply chain structure (the "Network Plan"). To implement the Network Plan, we are (i) discontinuing manufacturing activities at our Braintree, Massachusetts, Ascoli-Piceno, Italy and Bothwell, Scotland facilities, (ii) creating a technology center of excellence for product development in Braintree, Massachusetts, (iii) expanding our current facility in Tijuana, Mexico, (iv) engaging Sanmina Corporation as a contract manufacturer to produce certain medical equipment, and (v) building a new manufacturing facility in Penang, Malaysia closer to our customers in Asia. See liquidity and capital resources discussion of this MD&A for further discussion of the costs of these activities.
We estimate we will incur approximately $45.0 million of restructuring and restructuring related expense and spend approximately $27.0 million to complete these initiatives in fiscal 2016.
For the year ended March 28, 2015, we incurred $36.9 million of restructuring and restructuring related charges and paid approximately $42.3 million with approximately $13.3 million payable within the next twelve months. The substantial majority of restructuring expenses have been included as a component of selling, general and administrative expense in the accompanying consolidated statements of income and comprehensive income.
The following summarizes the restructuring activity for the fiscal year ended March 28, 2015, March 29, 2014, and March 30, 2013, respectively:
(In thousands) | Balance at March 29, 2014 | Cost Incurred | Payments | Less Non-Cash Adjustments | Restructuring Accrual Balance at March 28, 2015 | ||||||||||||||
Severance and other employee costs | $ | 22,908 | $ | 19,879 | $ | (26,394 | ) | $ | — | $ | 16,393 | ||||||||
Other costs | 728 | 15,362 | (15,871 | ) | — | 219 | |||||||||||||
Accelerated depreciation | — | 1,326 | — | (1,326 | ) | — | |||||||||||||
Asset write-down | — | 296 | — | (296 | ) | — | |||||||||||||
$ | 23,636 | $ | 36,863 | $ | (42,265 | ) | $ | (1,622 | ) | $ | 16,612 | ||||||||
(In thousands) | Balance at March 30, 2013 | Cost Incurred | Payments | Less Non-Cash Adjustments | Restructuring Accrual Balance at March 29, 2014 | ||||||||||||||
Severance and other employee costs | $ | 3,089 | $ | 31,492 | $ | (11,673 | ) | $ | — | $ | 22,908 | ||||||||
Other costs | 173 | 14,254 | (13,699 | ) | — | 728 | |||||||||||||
Accelerated depreciation | — | 2,390 | — | (2,390 | ) | — | |||||||||||||
Asset write down | — | 915 | — | (915 | ) | — | |||||||||||||
$ | 3,262 | $ | 49,051 | $ | (25,372 | ) | $ | (3,305 | ) | $ | 23,636 | ||||||||
82
HAEMONETICS CORPORATION AND SUBSIDIARIES
NOTES TO CONSOLIDATED FINANCIAL STATEMENTS — (Continued)
(In thousands) | Balance at March 31, 2012 | Cost Incurred | Payments | Less Non-Cash Adjustments | Restructuring Accrual Balance at March 30, 2013 | ||||||||||||||
Severance and other employee costs | $ | 1,461 | $ | 6,214 | $ | (4,586 | ) | $ | — | $ | 3,089 | ||||||||
Facility related costs | 533 | 431 | (791 | ) | — | 173 | |||||||||||||
Asset write down | — | 4,247 | — | (4,247 | ) | — | |||||||||||||
$ | 1,994 | $ | 10,892 | $ | (5,377 | ) | $ | (4,247 | ) | $ | 3,262 | ||||||||
We deployed significant financial resources for these activities. Many of the activities necessary to complete the VCC initiatives include severance and other costs which qualify as restructuring expenses under ASC 420, Exit or Disposal Cost Obligations. We incurred $36.9 million in severance, asset write-offs and other restructuring charges in fiscal 2015. In addition, we also incurred $29.9 million of costs that do not constitute restructuring under ASC 420, which we refer to as "Transformation Costs". These costs consist primarily of expenditures directly related to our transformation activities including program management, integration and product line transfer teams, infrastructure related costs, accelerated depreciation and asset disposals.
The table below presents restructuring and transformation costs recorded in cost of goods sold, research and development, selling, general and administrative expenses and other (expense) income, net in our statements of income and comprehensive income for the periods presented. In fiscal 2015 and 2014, Transformation Costs were primarily related to our VCC initiatives. In fiscal 2013, the majority of our Transformation Costs were related to the integration of the whole blood acquisition.
Transformation costs | |||||||||||
(in thousands) | March 28, 2015 | March 29, 2014 | March 30, 2013 | ||||||||
Integration and other costs | $ | 24,061 | $ | 30,701 | $ | 60,878 | |||||
Accelerated depreciation | 930 | 4,203 | 687 | ||||||||
Asset disposal | 4,925 | 796 | — | ||||||||
Total | $ | 29,916 | $ | 35,700 | $ | 61,565 | |||||
Restructuring costs | |||||||||||
(in thousands) | March 28, 2015 | March 29, 2014 | March 30, 2013 | ||||||||
Severance and other employee costs | $ | 19,879 | $ | 31,492 | $ | 6,214 | |||||
Other costs | 15,362 | 14,254 | 431 | ||||||||
Accelerated depreciation | 1,326 | 2,390 | — | ||||||||
Asset disposal | 296 | 915 | 4,247 | ||||||||
Total | $ | 36,863 | $ | 49,051 | $ | 10,892 | |||||
Total restructuring and transformation | $ | 66,779 | $ | 84,751 | $ | 72,457 | |||||
83
HAEMONETICS CORPORATION AND SUBSIDIARIES
NOTES TO CONSOLIDATED FINANCIAL STATEMENTS — (Continued)
17. CAPITALIZATION OF SOFTWARE DEVELOPMENT COSTS
The cost of software that is developed or obtained for internal use is accounted for pursuant to ASC Topic 350, Intangibles — Goodwill and Other. Pursuant to ASC Topic 350, the Company capitalizes costs incurred during the application development stage of software developed for internal use, and expenses costs incurred during the preliminary project and the post-implementation operation stages of development. The costs capitalized for each project are included in intangible assets in the consolidated financial statements.
For costs incurred related to the development of software to be sold, leased, or otherwise marketed, the Company applies the provisions of ASC Topic 985-20, Software - Costs of Software to be Sold, Leased or Marketed, which specifies that costs incurred internally in researching and developing a computer software product should be charged to expense until technological feasibility has been established for the product. Once technological feasibility is established, all software costs should be capitalized until the product is available for general release to customers.
We capitalized $9.5 million and $6.0 million in software development costs for ongoing initiatives during the fiscal years ended March 28, 2015 and March 29, 2014, respectively. At March 28, 2015 and March 29, 2014, we have a total of $39.7 million and $31.7 million of software costs capitalized, of which $7.9 million and $15.6 million are related to in process software development initiatives, respectively. In connection with these development activities, we capitalized interest of $0.2 million and $0.4 million in fiscal 2015 and 2014, respectively. We amortize capitalized costs when the products are released for sale. During fiscal 2015, $15.7 million of capitalized costs were placed into service, compared to $10.4 million of capitalized costs placed into service during fiscal 2014. Amortization of capitalized software development cost expense was $3.2 million, $1.1 million and $0.9 million for fiscal 2015, 2014 and 2013 respectively.
18. SUMMARY OF QUARTERLY DATA (UNAUDITED)
(In thousands) | Three months ended | |||||||||||||||
Fiscal 2015 | June 28, 2014 | September 27, 2014 | December 27, 2014 | March 28, 2015 | ||||||||||||
Net revenues | $ | 224,488 | $ | 227,580 | $ | 231,827 | $ | 226,478 | ||||||||
Gross profit | $ | 106,278 | $ | 108,114 | $ | 111,661 | $ | 108,365 | ||||||||
Operating (loss) income | $ | (1,666 | ) | $ | 12,407 | $ | 18,260 | $ | 11,539 | |||||||
Net (loss) income | $ | (3,649 | ) | $ | 7,487 | $ | 15,988 | $ | (2,929 | ) | ||||||
Per share data: | ||||||||||||||||
Net (loss) Income: | ||||||||||||||||
Basic | $ | (0.07 | ) | $ | 0.15 | $ | 0.31 | $ | (0.06 | ) | ||||||
Diluted | $ | (0.07 | ) | $ | 0.14 | $ | 0.31 | $ | (0.06 | ) | ||||||
Three months ended | ||||||||||||||||
Fiscal 2014 | June 29, 2013 | September 28, 2013 | December 28, 2013 | March 29, 2014 | ||||||||||||
Net revenues | $ | 219,543 | $ | 235,755 | $ | 242,120 | $ | 241,091 | ||||||||
Gross profit | $ | 111,412 | $ | 119,884 | $ | 121,629 | $ | 115,440 | ||||||||
Operating (loss) income | $ | (6,608 | ) | $ | 23,120 | $ | 17,554 | $ | 12,366 | |||||||
Net (loss) income | $ | (7,874 | ) | $ | 16,548 | $ | 16,290 | $ | 10,184 | |||||||
Per share data: | ||||||||||||||||
Net (loss) Income: | ||||||||||||||||
Basic | $ | (0.15 | ) | $ | 0.32 | $ | 0.31 | $ | 0.20 | |||||||
Diluted | $ | (0.15 | ) | $ | 0.32 | $ | 0.31 | $ | 0.19 | |||||||
84
HAEMONETICS CORPORATION AND SUBSIDIARIES
NOTES TO CONSOLIDATED FINANCIAL STATEMENTS — (Continued)
19. ACCUMULATED OTHER COMPREHENSIVE INCOME
The following is a roll-forward of the components of Accumulated Other Comprehensive Income, net of tax, for the years ended March 28, 2015 and March 29, 2014:
(In thousands) | Foreign currency | Defined benefit plans | Net Unrealized Gain/loss on Derivatives | Total | ||||||||||||
Balance as of March 30, 2013 | $ | 4,133 | $ | (5,073 | ) | $ | 6,373 | $ | 5,433 | |||||||
Other comprehensive (loss)/income before reclassifications | (935 | ) | 223 | 5,001 | 4,289 | |||||||||||
Amounts reclassified from Accumulated Other Comprehensive Income | — | 258 | (8,570 | ) | (8,312 | ) | ||||||||||
Net current period other comprehensive (loss)/income | (935 | ) | 481 | (3,569 | ) | (4,023 | ) | |||||||||
Balance as of March 29, 2014 | $ | 3,198 | $ | (4,592 | ) | $ | 2,804 | $ | 1,410 | |||||||
Other comprehensive (loss)/income before reclassifications | (23,710 | ) | (4,410 | ) | 11,371 | (16,749 | ) | |||||||||
Amounts reclassified from Accumulated Other Comprehensive Income | — | 79 | (6,464 | ) | (6,385 | ) | ||||||||||
Net current period other comprehensive (loss)/income | (23,710 | ) | (4,331 | ) | 4,907 | (23,134 | ) | |||||||||
Balance as of March 28, 2015 | $ | (20,512 | ) | $ | (8,923 | ) | $ | 7,711 | $ | (21,724 | ) | |||||
The details about the amount reclassified from Accumulated Other Comprehensive Income for the years ended March 28, 2015 and March 29, 2014 are as follows:
(In thousands) | Amounts Reclassified from Other Comprehensive Income | Affected Line in the Statement of Income | ||||||||
Derivative instruments reclassified to income statement | Year ended March 28, 2015 | Year ended March 29, 2014 | ||||||||
Realized net gain on derivatives | $ | 6,736 | $ | 8,960 | Revenue, cost of goods sold, other income | |||||
Income tax effect | (272 | ) | (390 | ) | Provision for income taxes | |||||
Net of taxes | $ | 6,464 | $ | 8,570 | ||||||
Pension items reclassified to income statement | ||||||||||
Realized net loss on pension assets | $ | 123 | $ | 317 | Other income | |||||
Income tax effect | (44 | ) | (59 | ) | Provision for income taxes | |||||
Net of taxes | $ | 79 | $ | 258 | ||||||
ITEM 9. CHANGES IN AND DISAGREEMENTS WITH ACCOUNTANTS ON ACCOUNTING AND FINANCIAL DISCLOSURE
None.
85
ITEM 9A. CONTROLS AND PROCEDURES
Evaluation of Disclosure Controls and Procedures
As of the end of the period covered by this report, we conducted an evaluation under the supervision and with the participation of our management, including our Chief Executive Officer and Chief Financial Officer (our principal executive officer and principal financial officer, respectively) regarding the effectiveness of the design and operation of our disclosure controls and procedures as defined in Rule 13a-15 of the Securities Exchange Act of 1934 (the “Exchange Act”). Based upon that evaluation, the Chief Executive Officer and Chief Financial Officer concluded that as of the end of the period covered by this report, our disclosure controls and procedures are effective. There has been no change in our internal control over financial reporting during the fiscal year ended March 28, 2015 that has materially affected, or is reasonably likely to materially affect, our internal control over financial reporting.
Reports on Internal Control
Management’s Annual Report on Internal Control over Financial Reporting
The management of the Company is responsible for establishing and maintaining adequate internal control over financial reporting, as such term is defined in Exchange Act Rules 13a-15(f) and 15d-a5(f). The Company’s internal control system was designed to provide reasonable assurance to the Company’s management and Board of Directors regarding the preparation and fair presentation of published financial statements.
Because of its inherent limitations, internal control over financial reporting may not prevent or detect misstatements. Also, projections of any evaluation of effectiveness to future periods are subject to the risk that controls become inadequate because of changes in conditions, or that the degree of compliance with the policies or procedures may deteriorate.
The Company’s management assessed the effectiveness of its internal control over financial reporting as of March 28, 2015. In making this assessment, the management used the criteria set forth by the Committee of Sponsoring Organizations of the Treadway Commission (COSO) in Internal Control-Integrated Framework (2013 framework). Based on our assessment we believe that, as of March 28, 2015, the Company’s internal control over financial reporting is effective based on those criteria.
Ernst & Young, LLP, an independent registered public accounting firm, has issued an attestation report on the effectiveness of our internal control over financial reporting. This report, in which they expressed an unqualified opinion, is included below.
Changes in Internal Controls
There were no changes in the Company’s internal control over financial reporting that occurred during the fourth quarter of the Company’s most recently completed fiscal year that materially affected, or are reasonably likely to materially affect, the Company’s internal control over financial reporting.
86
Report of Independent Registered Public Accounting Firm
The Board of Directors and Shareholders of Haemonetics Corporation
We have audited Haemonetics Corporation and subsidiaries’ internal control over financial reporting as of March 28, 2015, based on criteria established in Internal Control-Integrated Framework issued by the Committee of Sponsoring Organizations of the Treadway Commission (2013 framework) (the COSO criteria). Haemonetics Corporation and subsidiaries’ management is responsible for maintaining effective internal control over financial reporting, and for its assessment of the effectiveness of internal control over financial reporting included in the accompanying Management’s Annual Report on Internal Control over Financial Reporting. Our responsibility is to express an opinion on the company’s internal control over financial reporting based on our audit.
We conducted our audit in accordance with the standards of the Public Company Accounting Oversight Board (United States). Those standards require that we plan and perform the audit to obtain reasonable assurance about whether effective internal control over financial reporting was maintained in all material respects. Our audit included obtaining an understanding of internal control over financial reporting, assessing the risk that a material weakness exists, testing and evaluating the design and operating effectiveness of internal control based on the assessed risk, and performing such other procedures as we considered necessary in the circumstances. We believe that our audit provides a reasonable basis for our opinion.
A company’s internal control over financial reporting is a process designed to provide reasonable assurance regarding the reliability of financial reporting and the preparation of financial statements for external purposes in accordance with generally accepted accounting principles. A company’s internal control over financial reporting includes those policies and procedures that (1) pertain to the maintenance of records that, in reasonable detail, accurately and fairly reflect the transactions and dispositions of the assets of the company; (2) provide reasonable assurance that transactions are recorded as necessary to permit preparation of financial statements in accordance with generally accepted accounting principles, and that receipts and expenditures of the company are being made only in accordance with authorizations of management and directors of the company; and (3) provide reasonable assurance regarding prevention or timely detection of unauthorized acquisition, use, or disposition of the company’s assets that could have a material effect on the financial statements.
Because of its inherent limitations, internal control over financial reporting may not prevent or detect misstatements. Also, projections of any evaluation of effectiveness to future periods are subject to the risk that controls may become inadequate because of changes in conditions, or that the degree of compliance with the policies or procedures may deteriorate.
In our opinion, Haemonetics Corporation and subsidiaries maintained, in all material respects, effective internal control over financial reporting as of March 28, 2015, based on the COSO criteria.
We also have audited, in accordance with the standards of the Public Company Accounting Oversight Board (United States), the consolidated balance sheets of Haemonetics Corporation and subsidiaries as of March 28, 2015 and March 29, 2014, and the related consolidated statements of income, comprehensive (loss) income, shareholders’ equity and cash flows for each of the three years in the period ended March 28, 2015 of Haemonetics Corporation and subsidiaries and our report dated May 22, 2015 expressed an unqualified opinion thereon.
/s/ Ernst & Young LLP
Boston, Massachusetts
May 22, 2015
87
ITEM 9B. OTHER INFORMATION
None
PART III
ITEM 10. DIRECTORS AND EXECUTIVE OFFICERS OF THE REGISTRANT AND CORPORATE GOVERNANCE
1. The information called for by Item 401 of Regulations S-K concerning our directors and the information called for by Item 405 of Regulation S-K concerning compliance with Section 16(a) of the Securities Exchange Act of 1934 required by this Item is incorporated by reference from our Proxy Statement for the Annual Meeting to be held July 21, 2015.
2. The information concerning our Executive Officers is set forth at the end of Part I hereof.
3. The balance of the information required by this item, including information concerning our Audit Committee and the Audit Committee Financial Expert and compliance with Item 407(c)(3) of S-K, is incorporated by reference from the Company’s Proxy Statement for the Annual Meeting to be held July 21, 2015. We have adopted a Code of Ethics that applies to our chief executive officer, chief financial officer and senior financial officers. The Code of Ethics is incorporated into the Company’s Code of Business Conduct located on the Company’s internet web site at http://phx.corporate-ir.net/phoenix.zhtml?c=72118&p=irol-IRHome and it is available in print to any shareholder who requests it. Such requests should be directed to our Company’s Secretary.
We intend to disclose any amendment to, or waiver from, a provision of the Code of Ethics that applies to our chief executive officer, chief financial officer or senior financial officers and that relates to any element of the Code of Ethics definition enumerated in Item 406 of Regulation S-K by posting such information on our website. Pursuant to NYSE Rule 303A.10, as amended, any waiver of the code of ethics for any executive officer or director must be disclosed within four business days by a press release, SEC Form 8-K, or internet posting.
ITEM 11. EXECUTIVE COMPENSATION
The information required by this Item is incorporated by reference from our Proxy Statement for the Annual Meeting to be held July 21, 2015. Notwithstanding the foregoing, the Compensation Committee Report included within the Proxy Statement is only being “furnished” hereunder and shall not be deemed “filed” for purposes of Section 18 of the Securities and Exchange Act of 1934.
ITEM 12. SECURITY OWNERSHIP OF CERTAIN BENEFICIAL OWNERS AND MANAGEMENT AND RELATED STOCKHOLDER MATTERS
The information required by this Item is incorporated by reference from the Company’s Proxy Statement for the Annual Meeting to be held July 21, 2015.
ITEM 13. CERTAIN RELATIONSHIPS AND RELATED TRANSACTIONS, AND DIRECTOR INDEPEDENCE
The information required by this Item is incorporated by reference from our Proxy Statement for the Annual Meeting to be held July 21, 2015.
ITEM 14. PRINCIPAL ACCOUNTING FEES AND SERVICES
The information required by this Item is incorporated by reference from our Proxy Statement for the Annual Meeting to be held July 21, 2015.
88
PART IV
ITEM 15. EXHIBITS AND FINANCIAL STATEMENT SCHEDULES
The following documents are filed as a part of this report:
A)Financial Statements are included in Part II of this report
Financial Statements required by Item 8 of this Form | |
Schedules required by Article 12 of Regulation S-X | |
All other schedules have been omitted because they are not applicable or not required.
B)Exhibits required by Item 601 of Regulation S-K are listed in the Exhibit Index beginning at page 91, which is incorporated herein by reference.
89
SIGNATURES
Pursuant to the requirements of Section 13 or 15(d) of the Securities Exchange Act of 1934, the Registrant has duly caused this report to be signed on its behalf by the undersigned, thereunto duly authorized.
HAEMONETICS CORPORATION | ||
By: | /s/ Brian Concannon | |
Brian Concannon, | ||
President and Chief Executive Officer | ||
Date : May 22, 2015
Pursuant to the requirements of the Securities Exchange Act of 1934, this report has been signed below by the following persons on behalf of the Registrant and in the capacities and on the dates indicated.
Signature | Title | Date | ||
/s/ Brian Concannon | President, Chief Executive Officer and Director | May 22, 2015 | ||
Brian Concannon | (Principal Executive Officer) | |||
/s/ Christopher Lindop | Chief Financial Officer and Executive Vice President Business Development | May 22, 2015 | ||
Christopher Lindop | (Principal Financial Officer) | |||
/s/ Susan Hanlon | Vice President Finance | May 22, 2015 | ||
Susan Hanlon | (Principal Accounting Officer) | |||
/s/ Charles Dockendorff | Director | May 22, 2015 | ||
Charles Dockendorff | ||||
/s/ Susan Bartlett Foote | Director | May 22, 2015 | ||
Susan Bartlett Foote | ||||
/s/ Ronald Gelbman | Director | May 22, 2015 | ||
Ronald Gelbman | ||||
/s/ Pedro Granadillo | Director | May 22, 2015 | ||
Pedro Granadillo | ||||
/s/ Mark Kroll | Director | May 22, 2015 | ||
Mark Kroll | ||||
/s/ Richard Meelia | Director | May 22, 2015 | ||
Richard Meelia | ||||
/s/ Ronald Merriman | Director | May 22, 2015 | ||
Ronald Merriman | ||||
/s/ Ellen Zane | Director | May 22, 2015 | ||
Ellen Zane | ||||
90
EXHIBITS FILED WITH SECURITIES AND EXCHANGE COMMISSION
Number and Description of Exhibit
1. Articles of Organization | ||
3A* | Pro forma Amended and Restated Articles of Organization of the Company reflecting Articles of Amendment dated August 23, 1993 and August 21, 2006 (filed as Exhibit 3.1 to the Company's Quarterly Report on Form 10-Q for the Quarter ended December 29, 2012 and incorporated herein by reference). | |
3B* | By-Laws of the Company, as amended through January 21, 2015 (filed as Exhibit 99.1 to the Company's Form 8-K dated January 27, 2015). | |
2. Instruments Defining the Rights of Security Holders | ||
4A* | Specimen certificate for shares of common stock (filed as Exhibit 4B to the Company's Amendment No. 1 to Form S-1 No. 33-39490 and incorporated herein by reference). | |
3. Material Contracts | ||
10A* | Lease dated July 17, 1990 between the Buncher Company and the Company of property in Pittsburgh, Pennsylvania (filed as Exhibit 10K to the Company's Form S-1 No. 33-39490 and incorporated herein by reference). | |
10B* | First Amendment to lease dated July 17, 1990, made as of July 17, 1996 between Buncher Company and the Company of property in Pittsburgh, Pennsylvania (filed as Exhibit 10AI to the Company's Form 10-Q for the quarter ended December 28, 1996 and incorporated herein by reference). | |
10C* | Second Amendment to lease dated July 17, 1990, made as of October 18, 2000 between Buncher Company and the Company for the property in Pittsburgh, Pennsylvania (filed as Exhibit 10AG to the Company's Form 10-K for the year ended March 29, 2003 and incorporated herein by reference). | |
10D* | Third Amendment to lease dated July 17, 1990, made as of March 23, 2004 between Buncher Company and the Company for the property in Pittsburgh, Pennsylvania (filed as Exhibit 10D to the Company's Form 10-K for the year ended March 30, 2013 and incorporated herein by reference). | |
10E* | Fourth Amendment to lease dated July 17, 1990, made as of March 12, 2008 between Buncher Company and the Company for the property in Pittsburgh, Pennsylvania (filed as Exhibit 10E to the Company's Form 10-K for the year ended March 30, 2013 and incorporated herein by reference). | |
10F* | Fifth Amendment to lease dated July 17, 1990, made as of October 1, 2008 between Buncher Company and the Company for the property in Pittsburgh, Pennsylvania (filed as Exhibit 10F to the Company's Form 10-K for the year ended March 30, 2013 and incorporated herein by reference). | |
10G* | Sixth Amendment to lease dated July 17, 1990 made as of January 8, 2010 between Buncher Company and the Company for the property in Pittsburgh, Pennsylvania (filed as Exhibit 10G to the Company's Form 10-K for the year ended March 30, 2013 and incorporated herein by reference). | |
10H* | Seventh Amendment to lease dated July 17, 1990, made as of March 31, 2011 between Buncher Company and the Company for the property in Pittsburgh, Pennsylvania (filed as Exhibit 10H to the Company's Form 10-K for the year ended March 30, 2013 and incorporated herein by reference). | |
10I* | Eighth Amendment to lease dated July 17, 1990, made as of February 26, 2013 between Buncher Company and the Company for the property in Pittsburgh, Pennsylvania (filed as Exhibit 10I to the Company's Form 10-K for the year ended March 30, 2013 and incorporated herein by reference). | |
10J* | Lease dated February 21, 2000 between BBVA Bancomer Servicios, S.A., as Trustee of the “Submetropoli de Tijuana” Trust and Haemonetics Mexico Manufacturing, S. de R.L. de C.V., as successor in interest to Ensatec, S.A. de C.V. with authorization of El Florido California, S.A. de C.V., for property located in Tijuana, Mexico (filed as Exhibit 10J to the Company's Form 10-K for the year ended March 30, 2013 and incorporated herein by reference). | |
10K* | Amendment to Lease dated February 21, 2000 made as of July 25, 2008 between BBVA Bancomer Servicios, S.A., as Trustee of the “Submetropoli de Tijuana” Trust Haemonetics Mexico Manufacturing, S. de R.L. de C.V., as successor in interest to Ensatec, S.A. de C.V., for property located in Tijuana, Mexico (filed as Exhibit 10K to the Company's Form 10-K for the year ended March 30, 2013 and incorporated herein by reference). | |
10L* | Extension to Lease dated February 21, 2000, made as of August 14, 2011 between PROCADEF 1, S.A.P.I. de C.V. and Haemonetics Mexico Manufacturing, S. de R.L. de C.V., as successor in interest to Ensatec, S.A. de C.V., for property located in Tijuana, Mexico (Spanish to English translation filed as Exhibit 10L to the Company's Form 10-K for the year ended March 30, 2013 and incorporated herein by reference). | |
91
10M* | Amendment Letter to Lease dated February 21, 2000, made as of August 14, 2011 between BBVA Bancomer Servicios, S.A., as Trustee of the “Submetropoli de Tijuana” Trust and Haemonetics Mexico Manufacturing, S. de R.L. de C.V., as successor in interest to Ensatec, S.A. de C.V., for property located in Tijuana, Mexico (filed as Exhibit 10M to the Company's Form 10-K for the year ended March 30, 2013 and incorporated herein by reference). | |
10N* | Notice of Assignment to Lease dated February 21, 2000, made as of February 23, 2012 between BBVA Bancomer Servicios, S.A., as Trustee of the “Submetropoli de Tijuana” Trust and Haemonetics Mexico Manufacturing, S. de R.L. de C.V., as successor in interest to Ensatec, S.A. de C.V. for property located in Tijuana, Mexico (Spanish to English translation filed as Exhibit 10N to the Company's Form 10-K for the year ended March 30, 2013 and incorporated herein by reference). | |
10O* | Note and Mortgage dated December 12, 2000 between the Company and General Electric Capital Business Asset Funding Corporation relating to the Braintree facility (filed as Exhibit 10B to the Company's Form 10-Q for the quarter ended December 30, 2000 and incorporated herein by reference). | |
10P* | Real Estate Lease Agreement dated November 2, 2002 between Haemonetics Produzione Italia S.r.l. as successor in interest to Pall Italia S.r.l and Tempera Infissi S.r.l for premises located in Ascoli, Italy (Italian to English translation filed as Exhibit 10P to the Company's Form 10-K for the year ended March 30, 2013 and incorporated herein by reference). | |
10Q* | Lease dated March 23, 2004 effective July 15, 2004 between Howard Commons Associates, LLC and Haemoscope Corporation for the property located in Niles, Illinois (filed as Exhibit 10Q to the Company's Form 10-K for the year ended March 30, 2013 and incorporated herein by reference). | |
10R* | First Amendment to Lease dated March 23, 2004 effective July 15, 2004, made as of June 10, 2004 between Howard Commons Associates, LLC and Haemoscope Corporation for the property located in Niles, Illinois (filed as Exhibit 10R to the Company's Form10-K for the year ended March 30, 2013 and incorporated herein by reference). | |
10S* | Second Amendment to Lease dated March 23, 2004 effective July 15, 2004, made as of June 5, 2007 between Cabot II - ILI W02-W03, LLC, predecessor-in interest to Howard Commons Associates, LLC and Haemoscope Corporation for the property located in Niles, Illinois (filed as Exhibit 10S to the Company's Form 10-K for the year ended March 30, 2013 and incorporated herein by reference). | |
10T* | Third Amendment to Lease dated March 23, 2004 effective July 15, 2004, made as of November 19, 2007 between Cabot II - ILI W02-W03, LLC, Haemoscope Corporation and Huron Acquisition Corporation, a wholly-owned subsidiary of the Company, as successor in interest to Haemoscope Corporation for the property located in Niles, Illinois (filed as Exhibit 10T to the Company's Form 10-K for the year ended March 30, 2013 and incorporated herein by reference). | |
10U* | Fourth Amendment to Lease dated March 23, 2004 effective July 15, 2004, made as of December 22, 2010 between Cabot II - ILI W02-W03, LLC, Haemoscope Corporation and the Company as assignee and New Tenant of the property located in Niles, Illinois (filed as Exhibit 10U to the Company's Form 10-K for the year ended March 30, 2013 and incorporated herein by reference). | |
10V* | Fifth Amendment to Lease dated March 23, 2004 effective July 15, 2004, made as of July 24, 2012 between Cabot II - ILI W02-W03, LLC and the Company of the property located in Niles, Illinois (filed as Exhibit 10V to the Company's10-K for the year ended March 30, 2013 and incorporated herein by reference). | |
10W* | Sixth Amendment to Lease dated March 23, 2004, effective July 15, 2004 made as of May 28, 2013 between Cabot II - ILI W02-W03, LLC and the Company of the property located in Niles, Illinois (filed as Exhibit 10A to the Company's Form 10-Q for the quarter ended June 28, 2014 and incorporated herein by reference). | |
10X* | Seventh Amendment to Lease dated March 23, 2004, effective July 15, 2004 made as of May 1, 2014 between Cabot II - ILI W02-W03, LLC and the Company of the property located in Niles, Illinois (filed as Exhibit 10B to the Company's Form 10-Q for the quarter ended June 28, 2014 and incorporated herein by reference). | |
10Y* | Lease Agreement effective December 3, 2007 between Mrs. Blanca Estela Colunga Santelices, by her own right, and Pall Life Sciences Mexico, S.de R.L. de C.V., for the property located in Tijuana, Mexico (Spanish to English translation filed as Exhibit 10W to the Company's Form 10-K for the year ended March 30, 2013 and incorporated herein by reference). | |
10Z* | Assignment to Lease Agreement effective December 3, 2007, made as of December 2, 2011 between Mrs. Blanca Estela Colunga Santelices, by her own right, Pall Life Sciences Mexico, S.de R.L. de C.V., (“Assignor”) and Haemonetics Mexico Manufacturing, S. de R.L. de C.V.as successor in interest to Pall Mexico Manufacturing S. de R.L. de C.V., (“Assignee”) assigned in favor of the property located in Tijuana, Mexico (filed as Exhibit 10X to the Company's Form 10-K for the year ended March 30, 2013 and incorporated herein by reference). | |
10AA* | Sublease Contract to Lease Agreement effective December 3, 2007, made as of December 3, 2011 between Haemonetics Mexico Manufacturing, S. de R.L. de C.V. as successor in interest to Pall Mexico Manufacturing, S.de R.L. de C.V., and Pall Life Sciences Mexico, S. de R.L. de C.V., for the property located in Tijuana, Mexico (filed as Exhibit 10Y to the Company's Form 10-K for the year ended March 30, 2013 and incorporated herein by reference). | |
92
10AB* | Sublease Contract to Lease Agreement effective December 3, 2007, made as of February 23, 2012 between Haemonetics Mexico Manufacturing, S. de R.L. de C.V. as successor in interest to Pall Mexico Manufacturing S. de R.L. de C.V. and Ensatec, S.A. de C.V., for the property located in Tijuana, Mexico (filed as Exhibit 10Z to the Company's Form 10-K for the year ended March 30, 2013 and incorporated herein by reference). | |
10AC* | Lease dated August 20, 2009 between Price Logistics Center Draper One, LLC and the Company for property located in Draper, Utah. (filed as Exhibit 10AA to the Company's Form 10-K for the year ended March 30, 2013 and incorporated herein by reference). | |
10AD* | Lease dated February 25, 2014 between and among 840 Business Center #2, LLC and Haemonetics Corporation for the property located in Mount Juliet, Tennessee (filed as Exhibit 10C to the Company's Form 10-Q for the quarter ended June 28, 2014 and incorporated herein by reference). | |
10AE* | Lease dated September 19, 2013 between the Penang Development Corporation ("Lessor") and Haemonetics Malaysia Sdn Bhd ("Lessee") of the property located in Penang, Malaysia (filed as Exhibit 10D to the Company's 10-Q for the quarter ended June 28, 2014 and incorporated herein by reference). | |
10AF*† | Pro Forma Haemonetics Corporation 2005 Long-Term Incentive Compensation Plan, reflecting amendments dated July 31, 2008, July 29, 2009, July 21, 20011, November 30, 2012, July 24, 2013 and January 21, 2014 (filed as Exhibit 10AE to the Company's Form 10-K for the year ended March 29, 2014 and incorporated herein by reference). | |
10AG*† | Form of Option Agreement for Non-Qualified stock options for the 2005 Long Term-Incentive Compensation Plan for Non-employee Directors (filed as Exhibit 10.1 to the Company's Form 10-Q for the quarter ended October 1, 2005 and incorporated herein by reference). | |
10AH*† | Form of Option Agreement for Non-Qualified stock options for the 2005 Long-Term Incentive Compensation Plan for Employees. (filed as Exhibit 10S to the Company's Form 10-K for the year ended March 30, 2010 and incorporated herein by reference). | |
10AI*† | Form of Option Agreement for Non-Qualified stock options for the 2005 Long-Term Incentive Compensation Plan for the Chief Executive Officer (filed as Exhibit 10.3 to the Company's Form 10-Q for the quarter ended October 1, 2005 and incorporated herein by reference). | |
10AJ*† | Form of Restricted Stock Agreement with Employees under 2005 Long-Term Incentive Compensation Plan. (filed as Exhibit 10U to the Company's Form 10-K for the year ended April 3, 20`0 and incorporated herein by reference). | |
10AK*† | Form of Amended and Restated Change in Control Agreement made effective on April 2, 2009 between the Company and Brian Concannon (filed as Exhibit 10Y to the Company's Form 10-Q for the quarter ended June 27, 2009 and incorporated herein by reference). | |
10AL*† | Form of Market Stock Unit Agreement for the 2005 Long-Term Incentive Compensation Plan (filed as Exhibit 10.3 to the Company's 8-K, dated July 26, 2013 and incorporated herein by reference). | |
10AM*† | Form of Amended and Restated Change in Control Agreement (filed as exhibit 10AK to the Company's Form 10-K, for the year-ended March 31, 2013 and incorporated herein by reference). | |
10AN*† | 2007 Employee Stock Purchase Plan (filed as Exhibit 10AS to the Company's Form 10-K for the year ended March 29, 2008 and incorporated herein by reference). | |
10AO*† | Pro Forma Amended and Restated Non-Qualified Deferred Compensation Plan as amended and restated on July 24, 2013 (filed as Exhibit 10B to the Company's Form 10-Q for the quarter ended September 27, 2014 and incorporated herein by reference). | |
10AP† | Form of Performance Share Unit Agreement for the 2005 Long-Term Incentive Compensation Plan (filed herewith). | |
10AQ* | Asset Purchase Agreement, dated as of April 28, 2012, by and between Haemonetics Corporation and Pall Corporation (filed as Exhibit 10Z to the Company's Form 10-K for the fiscal year ended March 31, 2012 and incorporated herein by reference). | |
10AR* | Credit Agreement dated as of June 30, 2014 among Haemonetics Corporation and the Lenders listed therein and JPMorgan Chase Bank, N.A. as Administrative Agent (filed as Exhibit 10.1 to the Company's Form 8-K dated July 7, 2014 and incorporated herein by reference). | |
93
4. Subsidiary Certifications and Consents | ||
21.1 | Subsidiaries of the Company. | |
23.1 | Consent of the Independent Registered Public Accounting Firm. | |
31.1 | Certification pursuant to Section 302 of Sarbanes-Oxley Act of 2002, of Brian Concannon, President and Chief Executive Officer of the Company. | |
31.2 | Certification pursuant to Section 302 of Sarbanes-Oxley of 2002, of Christopher Lindop, Executive Vice President and Chief Financial Officer of the Company. | |
32.1 | Certification Pursuant to 18 United States Code Section 1350, as adopted Pursuant to Section 906 of the Sarbanes-Oxley Act of 2002, of Brian Concannon, President and Chief Executive Officer of the Company | |
32.2 | Certification Pursuant to 18 United States Code Section 1350, as adopted Pursuant to Section 906 of the Sarbanes-Oxley Act of 2002, of Christopher Lindop, Chief Financial Officer and Executive Vice President Business Development of the Company | |
101ˆ | The following materials from Haemonetics Corporation on Form 10-K for the year ended March 30, 2013, formatted in Extensive Business Reporting Language (XBRL): (i) Consolidated Statements of Income, (ii) Consolidated Statements of Comprehensive Income (iii) Consolidated Balance Sheets, (iv) Consolidated Statement of Stockholders' Equity and Other Comprehensive Income, (v) Consolidated Statements of Cash Flows, and (vi) Notes to Consolidated Financial Statements, tagged as blocks of text. | |
* | Incorporated by reference | |
† | Agreement, plan, or arrangement related to the compensation of officers or directors | |
ˆ | In accordance with Rule 406T of Regulation S-T, the XBRL-related information in Exhibit 101 to this Form 10-K is deemed not filed or part of a registration statement or prospectus for purposes of sections 11 or 12 of the Securities Act, is deemed not filed for purposes of section 18 of the Exchange Act, and otherwise is not subject to liability under these sections. | |
94
SCHEDULE II
HAEMONETICS CORPORATION
VALUATION AND QUALIFYING ACCOUNTS
(In thousands) | Balance at Beginning of Fiscal Year | Charged to Costs and Expenses | Write-Offs (Net of Recoveries) | Balance at End of Fiscal Year | |||||||||||
For Year Ended March 28, 2015 | |||||||||||||||
Allowance for Doubtful Accounts | $ | 1,676 | $ | 399 | $ | (326 | ) | $ | 1,749 | ||||||
For Year Ended March 29, 2014 | |||||||||||||||
Allowance for Doubtful Accounts | $ | 1,727 | $ | 186 | $ | (237 | ) | $ | 1,676 | ||||||
For Year Ended March 30, 2013 | |||||||||||||||
Allowance for Doubtful Accounts | $ | 1,480 | $ | 446 | $ | (199 | ) | $ | 1,727 | ||||||
95