Attached files
| file | filename |
|---|---|
| 8-K - 8-K - Beneficial Bancorp Inc. | a15-12461_18k.htm |
Exhibit 99.1
|
|
BENEFICIAL BANCORP, INC. SHAREHOLDER PRESENTATION MAY 21, 2015 |
|
|
2 SAFE HARBOR STATEMENT Forward Looking Statements and Risk Factors This presentation may contain projections and other “forward-looking statements” within the meaning of the federal securities laws. These statements are not historical facts, rather statements based on the current expectations of Beneficial bancorp, inc. (THE “Company”) regarding its business strategies, intended results, and future performance. Forward-looking statements are preceded by terms such as “expects,” “believes,” “anticipates,” “intends” and similar expressions. Management’s ability to predict results or the effect of future plans or strategies is inherently uncertain. Factors that could affect actual results include interest rate trends, the general economic climate in the market area in which the Company operates, as well as nationwide, the Company’s ability to control costs and expenses, competitive products and pricing, loan delinquency rates, changes in federal and state legislation and regulation and other factors that may be described in the Company’s filings with the Securities and Exchange Commission, including its Annual Reports on Form 10-K and Quarterly Reports on Form 10-Q and other required filings. These factors should be considered in evaluating the forward-looking statements and undue reliance should not be placed on such statements. The Company assumes no obligation to update any forward-looking statements. This presentation includes interim and unaudited financials, which are subject to further review by the Company’s independent accountants. |
|
|
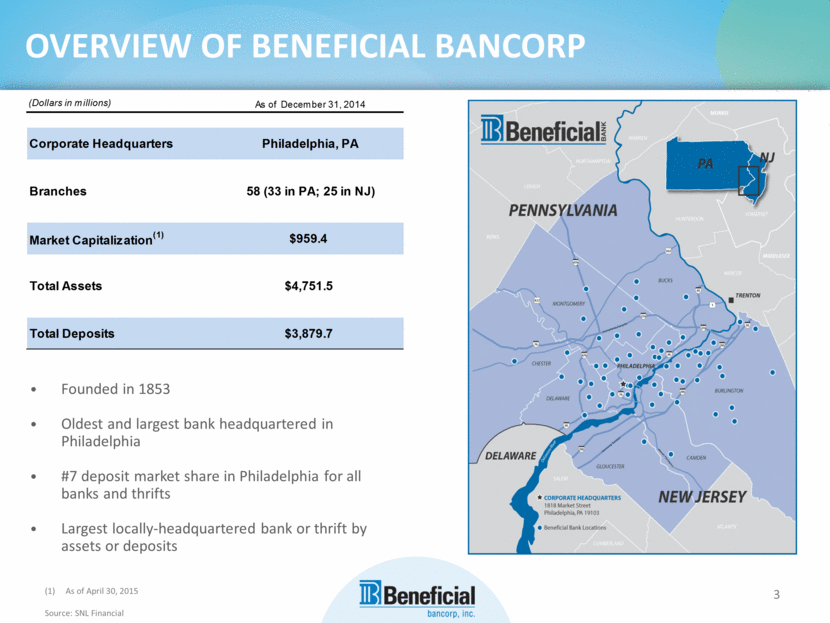
3 OVERVIEW OF BENEFICIAL BANCORP Founded in 1853 Oldest and largest bank headquartered in Philadelphia #7 deposit market share in Philadelphia for all banks and thrifts Largest locally-headquartered bank or thrift by assets or deposits As of April 30, 2015 Source: SNL Financial |
|
|
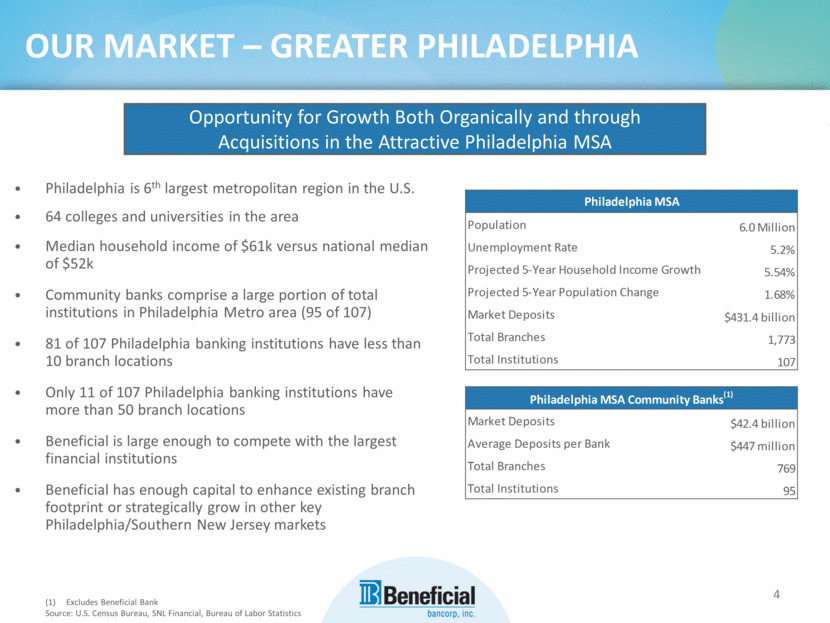
4 OUR MARKET – GREATER PHILADELPHIA Excludes Beneficial Bank Source: U.S. Census Bureau, SNL Financial, Bureau of Labor Statistics Opportunity for Growth Both Organically and through Acquisitions in the Attractive Philadelphia MSA Philadelphia is 6th largest metropolitan region in the U.S. 64 colleges and universities in the area Median household income of $61k versus national median of $52k Community banks comprise a large portion of total institutions in Philadelphia Metro area (95 of 107) 81 of 107 Philadelphia banking institutions have less than 10 branch locations Only 11 of 107 Philadelphia banking institutions have more than 50 branch locations Beneficial is large enough to compete with the largest financial institutions Beneficial has enough capital to enhance existing branch footprint or strategically grow in other key Philadelphia/Southern New Jersey markets Philadelphia MSA Population 6.0 Million Unemployment Rate 5.2% Projected 5-Year Household Income Growth 5.54% Projected 5-Year Population Change 1.68% Market Deposits $431.4 billion Total Branches 1,773 Total Institutions 107 Philadelphia MSA Community Banks(1) Market Deposits $42.4 billion Average Deposits per Bank $447 million Total Branches 769 Total Institutions 95 |
|
|
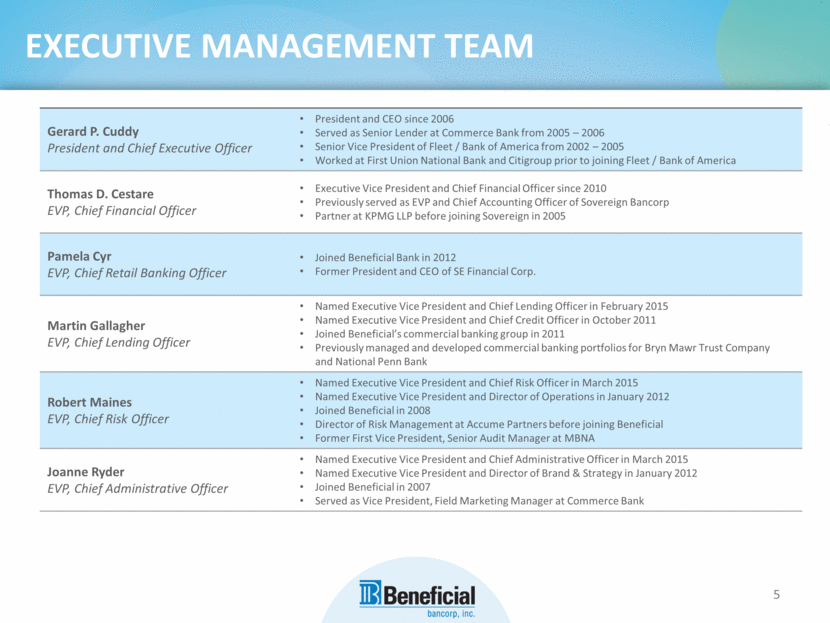
EXECUTIVE MANAGEMENT TEAM 5 Gerard P. Cuddy President and Chief Executive Officer President and CEO since 2006 Served as Senior Lender at Commerce Bank from 2005 – 2006 Senior Vice President of Fleet / Bank of America from 2002 – 2005 Worked at First Union National Bank and Citigroup prior to joining Fleet / Bank of America Thomas D. Cestare EVP, Chief Financial Officer Executive Vice President and Chief Financial Officer since 2010 Previously served as EVP and Chief Accounting Officer of Sovereign Bancorp Partner at KPMG LLP before joining Sovereign in 2005 Pamela Cyr EVP, Chief Retail Banking Officer Joined Beneficial Bank in 2012 Former President and CEO of SE Financial Corp. Martin Gallagher EVP, Chief Lending Officer Named Executive Vice President and Chief Lending Officer in February 2015 Named Executive Vice President and Chief Credit Officer in October 2011 Joined Beneficial’s commercial banking group in 2011 Previously managed and developed commercial banking portfolios for Bryn Mawr Trust Company and National Penn Bank Robert Maines EVP, Chief Risk Officer Named Executive Vice President and Chief Risk Officer in March 2015 Named Executive Vice President and Director of Operations in January 2012 Joined Beneficial in 2008 Director of Risk Management at Accume Partners before joining Beneficial Former First Vice President, Senior Audit Manager at MBNA Joanne Ryder EVP, Chief Administrative Officer Named Executive Vice President and Chief Administrative Officer in March 2015 Named Executive Vice President and Director of Brand & Strategy in January 2012 Joined Beneficial in 2007 Served as Vice President, Field Marketing Manager at Commerce Bank |
|
|
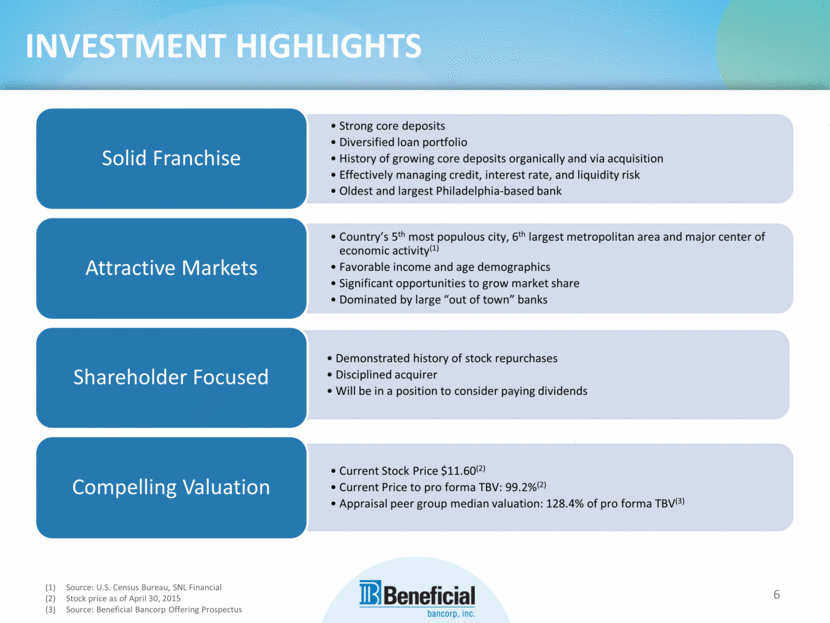
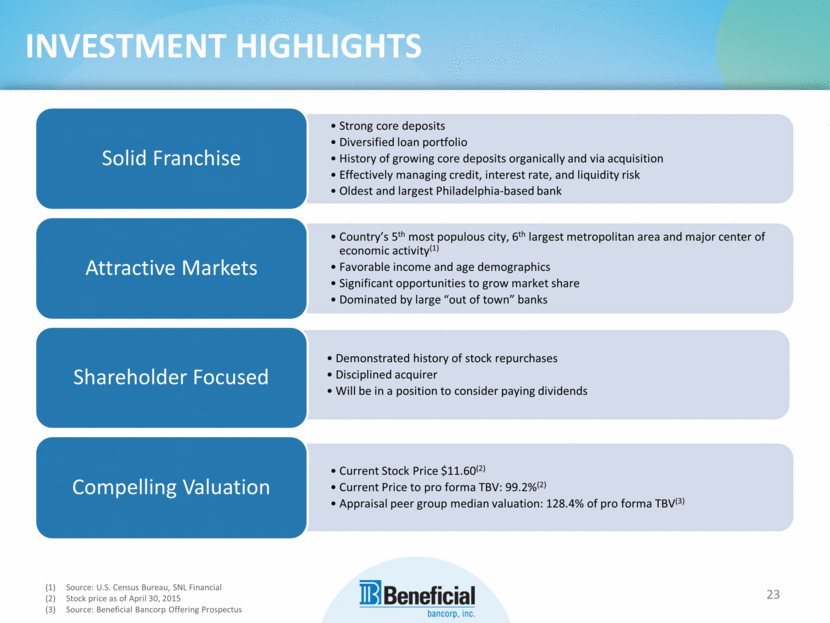
6 INVESTMENT HIGHLIGHTS Source: U.S. Census Bureau, SNL Financial Stock price as of April 30, 2015 Source: Beneficial Bancorp Offering Prospectus Strong core deposits Diversified loan portfolio History of growing core deposits organically and via acquisition Effectively managing credit, interest rate, and liquidity risk Oldest and largest Philadelphia-based bank Solid Franchise Country’s 5th most populous city, 6th largest metropolitan area and major center of feconomic activity(1) Favorable income and age demographics Significant opportunities to grow market share Dominated by large “out of town” banks Attractive Markets Demonstrated history of stock repurchases Disciplined acquirer Will be in a position to consider paying dividends Shareholder Focused Current Stock Price $11.60(2) Current Price to pro forma TBV: 99.2%(2) Appraisal peer group median valuation: 128.4% of pro forma TBV(3) Compelling Valuation |
|
|
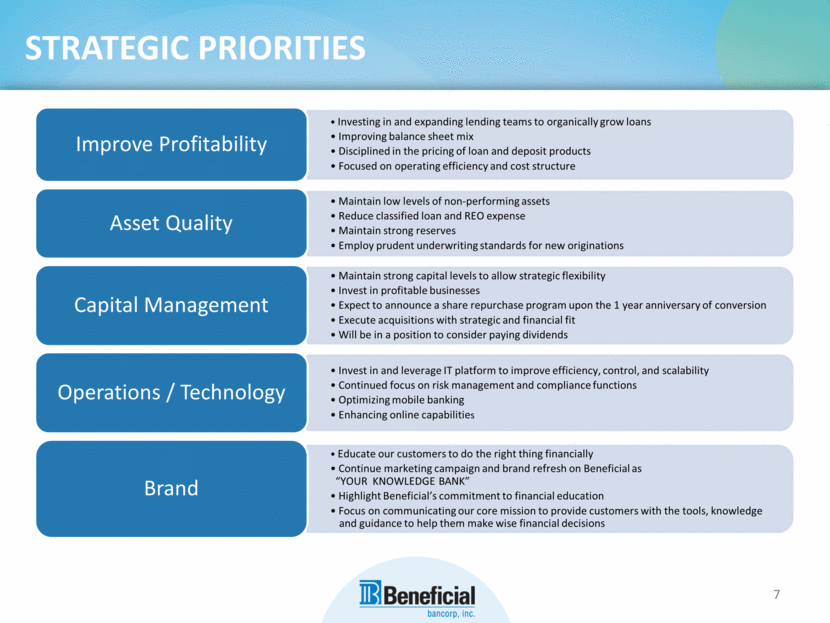
STRATEGIC PRIORITIES 7 Investing in and expanding lending teams to organically grow loans Improving balance sheet mix Disciplined in the pricing of loan and deposit products Focused on operating efficiency and cost structure Improve Profitability Maintain low levels of non-performing assets Reduce classified loan and REO expense Maintain strong reserves Employ prudent underwriting standards for new originations Asset Quality Maintain strong capital levels to allow strategic flexibility Invest in profitable businesses Expect to announce a share repurchase program upon the 1 year anniversary of conversion Execute acquisitions with strategic and financial fit Will be in a position to consider paying dividends Capital Management Invest in and leverage IT platform to improve efficiency, control, and scalability Continued focus on risk management and compliance functions Optimizing mobile banking Enhancing online capabilities Operations / Technology Educate our customers to do the right thing financially Continue marketing campaign and brand refresh on Beneficial as “YOUR KNOWLEDGEfBANK” Highlight Beneficial’s commitment to financial education Focus on communicating our core mission to provide customers with the tools, knowledge fand guidance to help them make wise financial decisions Brand |
|
|
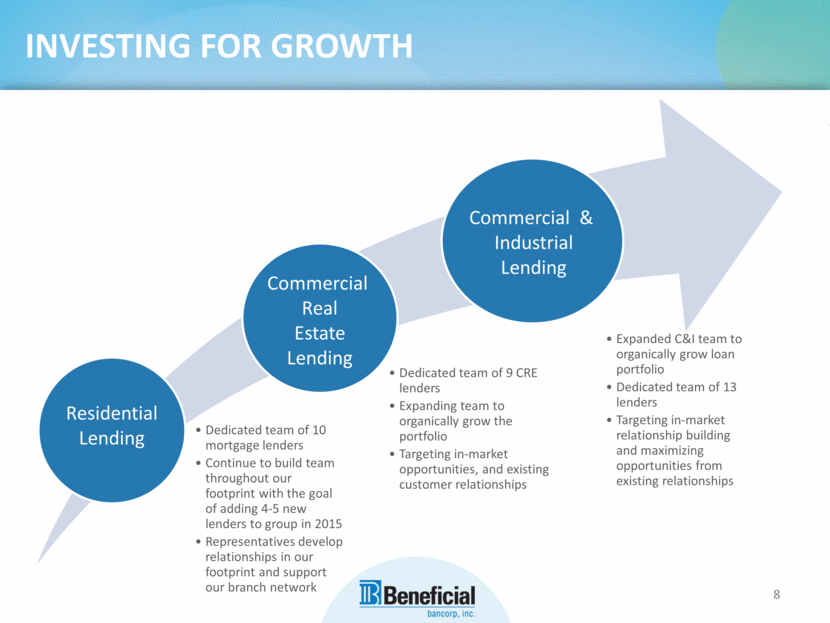
INVESTING FOR GROWTH 8 Residential Lending Commercial Real Estate Lending Commercial & Industrial Lending Dedicated team of 10 mortgage lenders Continue to build team throughout our footprint with the goal of adding 4-5 new lenders to group in 2015 Representatives develop relationships in our footprint and support our branch network Dedicated team of 9 CRE lenders Expanding team to organically grow the portfolio Targeting in-market opportunities, and existing customer relationships Expanded C&I team to organically grow loan portfolio Dedicated team of 13 lenders Targeting in-market relationship building and maximizing opportunities from existing relationships |
|
|
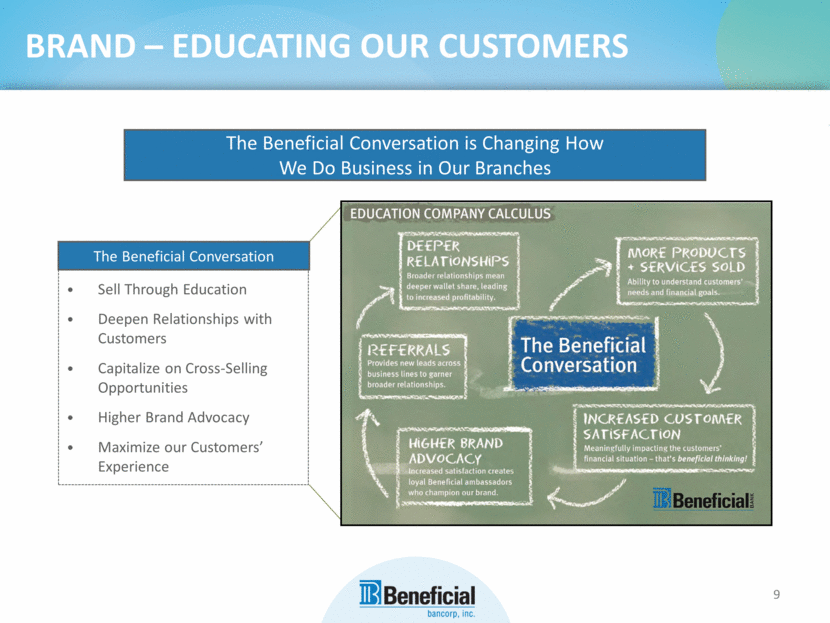
9 BRAND – EDUCATING OUR CUSTOMERS The Beneficial Conversation is Changing How We Do Business in Our Branches Sell Through Education Deepen Relationships with Customers Capitalize on Cross-Selling Opportunities Higher Brand Advocacy Maximize our Customers’ Experience The Beneficial Conversation |
|
|
10 RETAIL BANKING Align our products and services to our customers’ needs Mobile Banking – BenMobile application Bill Pay Remote Deposit Capture Strategically open new campus locations in growth markets to both relocate and consolidate existing branches Devon and Springfield campuses opened in 2013 Broomall, Maple Glen and Newtown campuses opened in 2014 Improve pricing and mix of deposits |
|
|
OFFERING RESULTS IPO Price Per Share $10.00 Current Price Per Share(1) : $11.60 Shares Offered: 50,383,817 (all from Subscription Offering) Exchange Ratio: 1.0999 Current Market Capitalization(1): $959.4 million Pro Forma-Tangible Equity/Tangible Assets: 20.7% Current Price(1)/Pro Forma Tangible Book Value: 98.6% Total Outstanding Shares 82,712,673 11 As of April 30, 2015 Source: SNL Financial |
|
|
12 CAPITAL MANAGEMENT Common Stock Repurchases Expect to announce a share repurchase program upon the 1 year anniversary of the second-step conversion History of repurchasing common stock 7.25 million shares repurchased through stock repurchase plans since initial IPO in 2007, or approximately 36% of the minority shares issued Dividends Will consider paying dividends based on financial performance and as an alternative use of capital Acquisitions Will focus on in-market and contiguous market opportunities Maintain discipline on financial hurdles including earnings accretion, tangible book value dilution, earn-back period and internal rate of return |
|
|
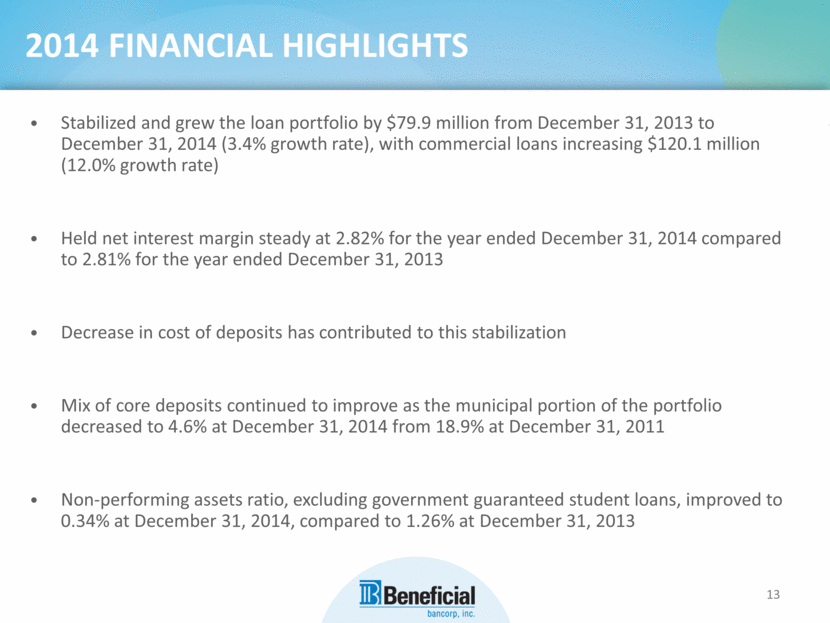
13 2014 FINANCIAL HIGHLIGHTS Stabilized and grew the loan portfolio by $79.9 million from December 31, 2013 to December 31, 2014 (3.4% growth rate), with commercial loans increasing $120.1 million (12.0% growth rate) Held net interest margin steady at 2.82% for the year ended December 31, 2014 compared to 2.81% for the year ended December 31, 2013 Decrease in cost of deposits has contributed to this stabilization Mix of core deposits continued to improve as the municipal portion of the portfolio decreased to 4.6% at December 31, 2014 from 18.9% at December 31, 2011 Non-performing assets ratio, excluding government guaranteed student loans, improved to 0.34% at December 31, 2014, compared to 1.26% at December 31, 2013 |
|
|
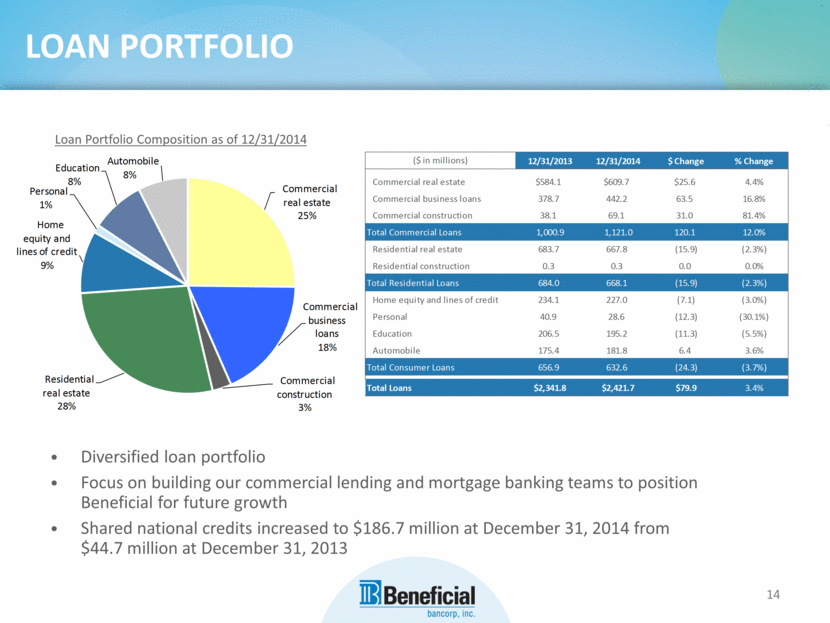
14 LOAN PORTFOLIO Diversified loan portfolio Focus on building our commercial lending and mortgage banking teams to position Beneficial for future growth Shared national credits increased to $186.7 million at December 31, 2014 from $44.7 million at December 31, 2013 Loan Portfolio Composition as of 12/31/2014 |
|
|
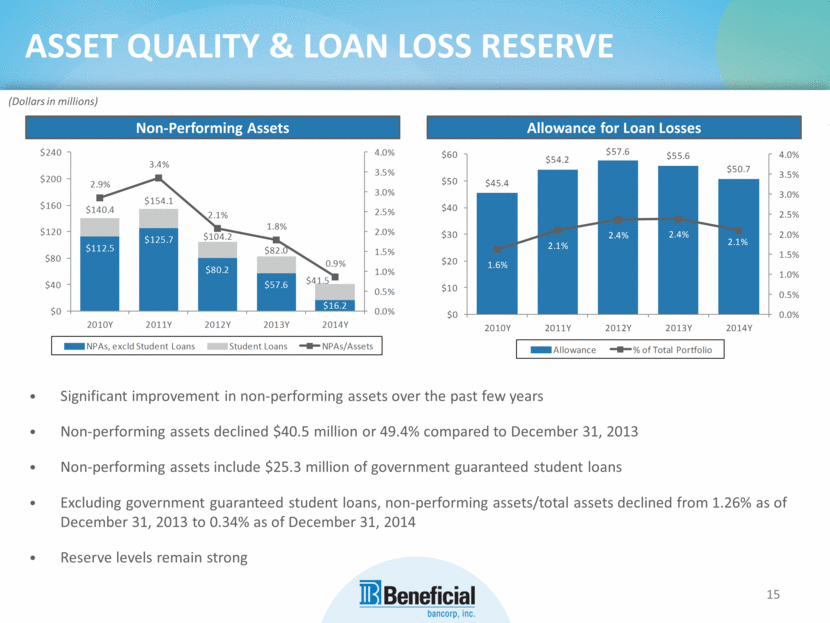
(Dollars in millions) Non-Performing Assets Allowance for Loan Losses $240 4.0% $60 $57.6 $55.6 4.0% $54.2 3.4% $50.7 3.5% 3.5% $200 $50 $45.4 2.9% 3.0% 3.0% $154.1 $160 $140.4 $40 2.1% 2.5% 2.5% 1.8% $120 2.0% $30 2.4% 2.4% 2.0% $125.7 $104.2 2.1% 2.1% $112.5 $82.0 1.5% $80 1.5% 0.9% $20 1.6% $80.2 1.0% 1.0% $40 $57.6 $41.5 0.5% $10 0.5% $16.2 $0 0.0% $0 0.0% 2010Y 2011Y 2012Y 2013Y 2014Y 2010Y 2011Y 2012Y 2013Y 2014Y NPAs, excld Student Loans Student Loans NPAs/Assets Allowance % of Total Portfolio 15 ASSET QUALITY & LOAN LOSS RESERVE Significant improvement in non-performing assets over the past few years Non-performing assets declined $40.5 million or 49.4% compared to December 31, 2013 Non-performing assets include $25.3 million of government guaranteed student loans Excluding government guaranteed student loans, non-performing assets/total assets declined from 1.26% as of December 31, 2013 to 0.34% as of December 31, 2014 Reserve levels remain strong |
|
|
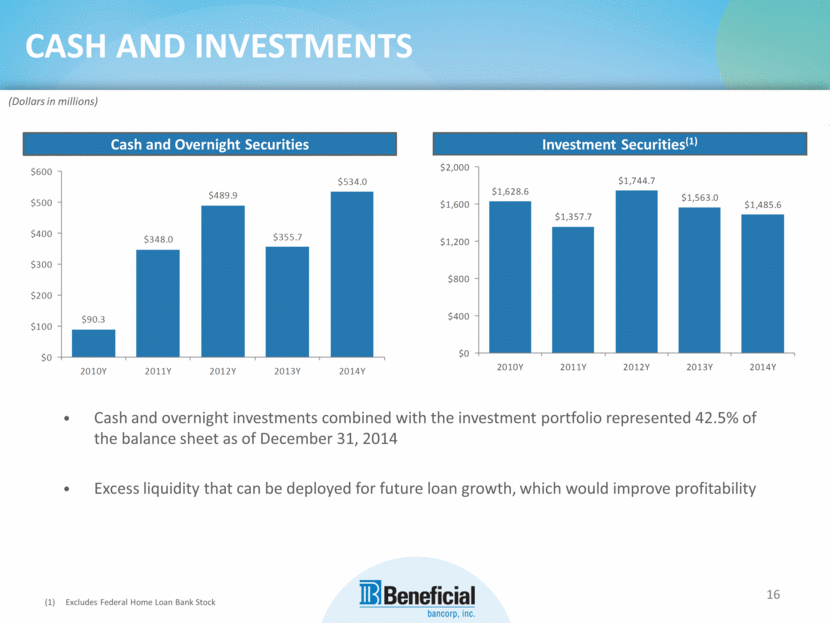
16 CASH AND INVESTMENTS Cash and overnight investments combined with the investment portfolio represented 42.5% of the balance sheet as of December 31, 2014 Excess liquidity that can be deployed for future loan growth, which would improve profitability Excludes Federal Home Loan Bank Stock Cash and Overnight Securities Investment Securities(1) (Dollars in millions) $600 $2,000 $534.0 $1,744.7 $489.9 $1,628.6 $1,563.0 $500 $1,600 $1,485.6 $1,357.7 $400 $355.7 $348.0 $1,200 $300 $800 $200 $90.3 $400 $100 $0 $0 2010Y 2011Y 2012Y 2013Y 2014Y 2010Y 2011Y 2012Y 2013Y 2014Y Estimated |
|
|
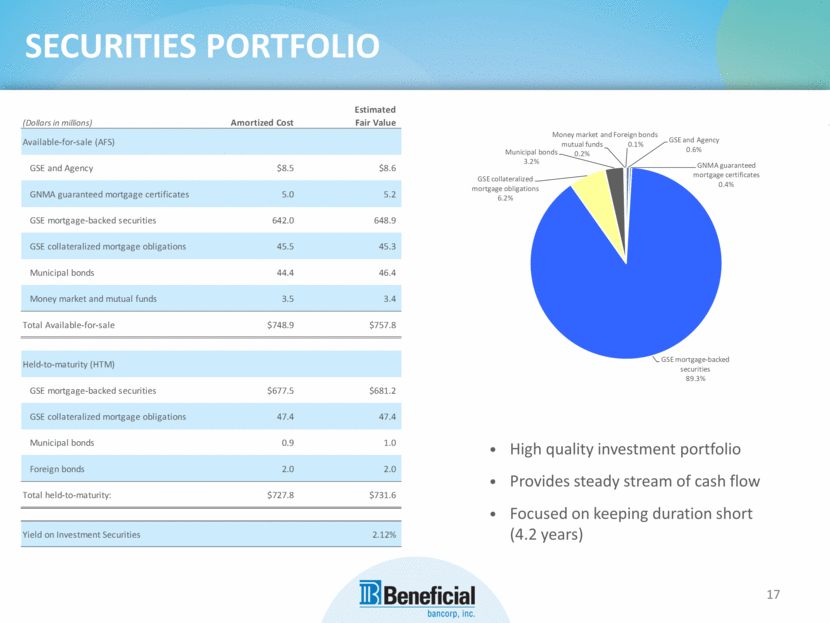
SECURITIES PORTFOLIO 17 High quality investment portfolio Provides steady stream of cash flow Focused on keeping duration short (4.2 years) (Dollars in millions) Amortized Cost Fair Value Available-for-sale (AFS) GSE and Agency $8.5 $8.6 GNMA guaranteed mortgage certificates 5.0 5.2 GSE mortgage-backed securities 642.0 648.9 GSE collateralized mortgage obligations 45.5 45.3 Municipal bonds 44.4 46.4 Money market and mutual funds 3.5 3.4 Total Available-for-sale $748.9 $757.8 Held-to-maturity (HTM) GSE mortgage-backed securities $677.5 $681.2 GSE collateralized mortgage obligations 47.4 47.4 Municipal bonds 0.9 1.0 Foreign bonds 2.0 2.0 Total held-to-maturity: $727.8 $731.6 Yield on Investment Securities 2.12% Money market and Foreign bonds GSE and Agency mutual funds 0.1% Municipal bonds 0.6% 0.2% 3.2% GNMA guaranteed mortgage certificates GSE collateralized 0.4% mortgage obligations 6.2% GSE mortgage-backed securities 89.3% |
|
|
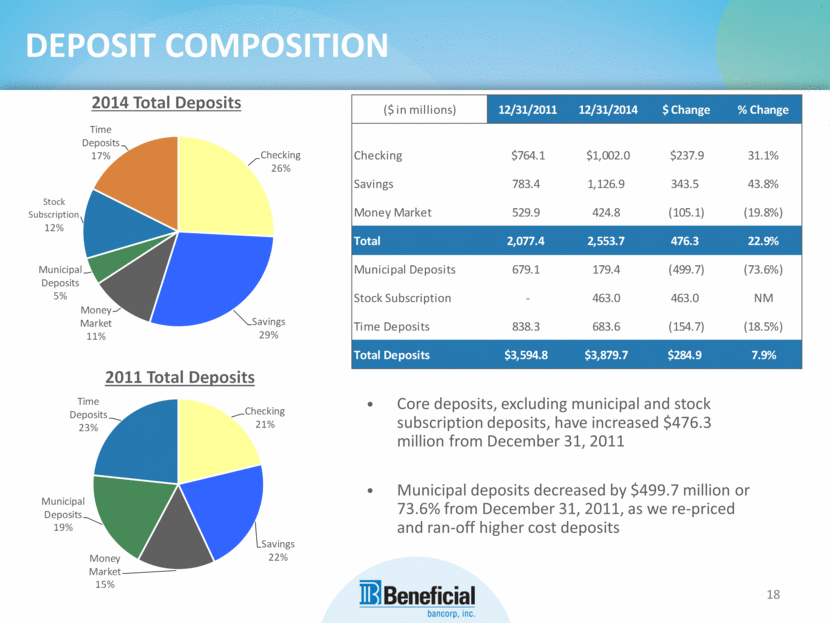
18 DEPOSIT COMPOSITION Core deposits, excluding municipal and stock subscription deposits, have increased $476.3 million from December 31, 2011 Municipal deposits decreased by $499.7 million or 73.6% from December 31, 2011, as we re-priced and ran-off higher cost deposits 2014 Total Deposits Time Deposits 17% Checking 26% Stock Subscription 12% Municipal Deposits 5% Money Market Savings 11% 29% 2011 Total Deposits Time Deposits Checking 23% 21% Municipal Deposits 19% Savings Money 22% Market 15% ($ in millions) 12/31/2011 12/31/2014 $ Change % Change Checking $764.1 $1,002.0 $237.9 31.1% Savings 783.4 1,126.9 343.5 43.8% Money Market 529.9 424.8 (105.1) (19.8%) Total 2,077.4 2,553.7 476.3 22.9% Municipal Deposits 679.1 179.4 (499.7) (73.6%) Stock Subscription - 463.0 463.0 NM Time Deposits 838.3 683.6 (154.7) (18.5%) Total Deposits $3,594.8 $3,879.7 $284.9 7.9% |
|
|
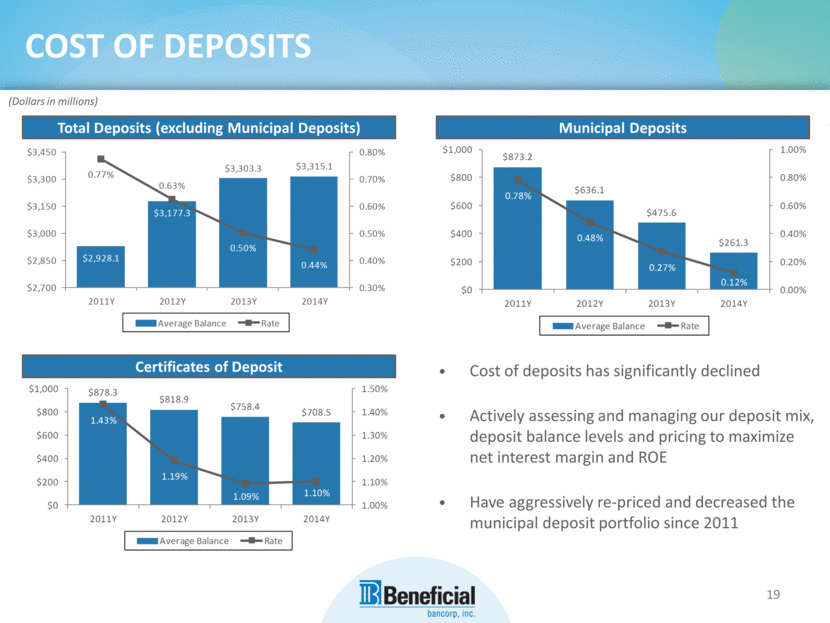
19 COST OF DEPOSITS Cost of deposits has significantly declined Actively assessing and managing our deposit mix, deposit balance levels and pricing to maximize net interest margin and ROE Have aggressively re-priced and decreased the municipal deposit portfolio since 2011 (Dollars in millions) Total Deposits (excluding Municipal Deposits) Municipal Deposits Certificates of Deposit $3,450 0.80% $1,000 1.00% $873.2 $3,303.3 $3,315.1 0.77% $800 0.80% $3,300 0.70% 0.63% $636.1 0.78% $3,150 0.60% $600 0.60% $3,177.3 $475.6 $3,000 0.50% $400 0.48% 0.40% $261.3 0.50% $2,850 $2,928.1 0.40% $200 0.20% 0.44% 0.27% 0.12% $2,700 0.30% $0 0.00% 2011Y 2012Y 2013Y 2014Y 2011Y 2012Y 2013Y 2014Y Average Balance Rate Average Balance Rate $1,000 $878.3 1.50% $818.9 $758.4 $800 $708.5 1.40% 1.43% $600 1.30% $400 1.20% 1.19% $200 1.10% 1.09% 1.10% $0 1.00% 2011Y 2012Y 2013Y 2014Y Average Balance Rate |
|
|
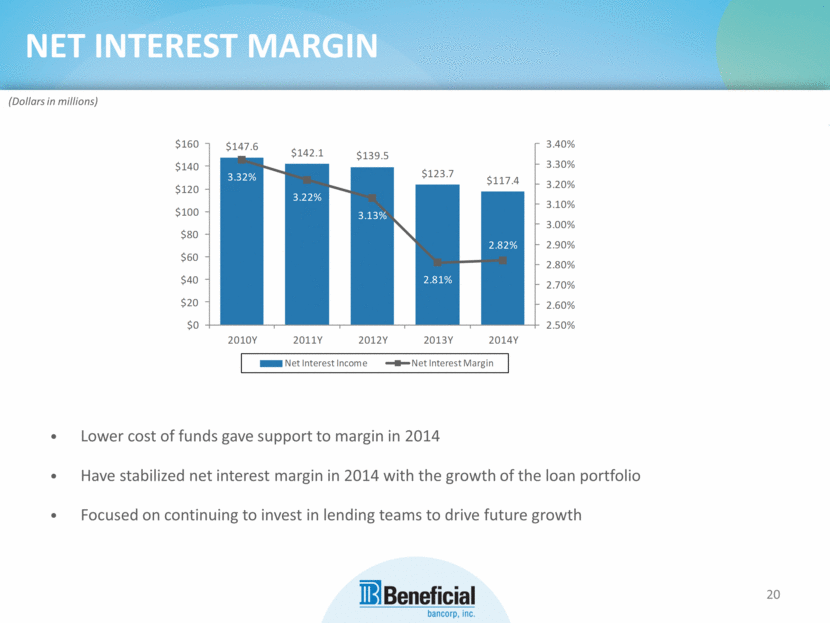
20 NET INTEREST MARGIN Lower cost of funds gave support to margin in 2014 Have stabilized net interest margin in 2014 with the growth of the loan portfolio Focused on continuing to invest in lending teams to drive future growth (Dollars in millions) $160 $147.6 3.40% $142.1 $139.5 $140 3.30% 3.32% $123.7 $117.4 3.20% $120 3.22% 3.10% $100 3.13% 3.00% $80 2.82% 2.90% $60 2.80% $40 2.81% 2.70% $20 2.60% $0 2.50% 2010Y 2011Y 2012Y 2013Y 2014Y Net Interest Income Net Interest Margin |
|
|
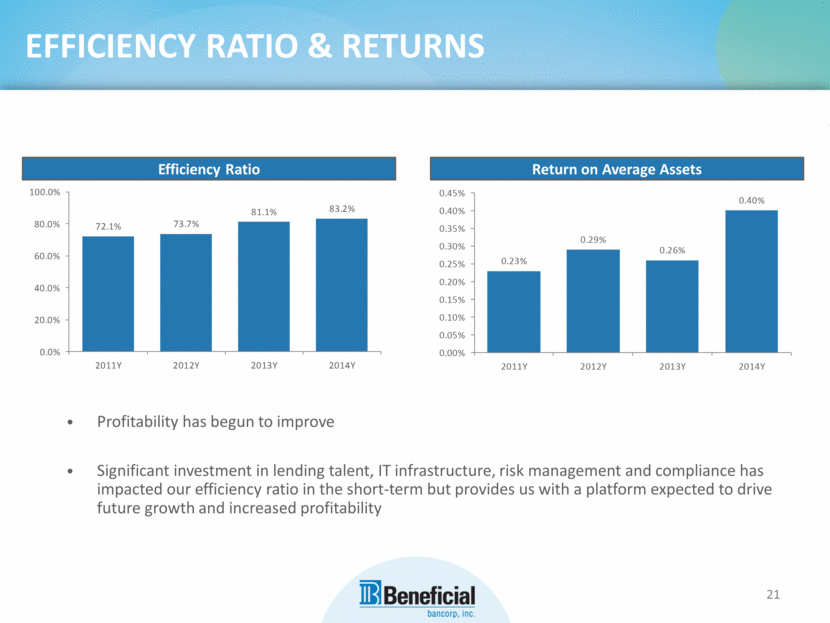
EFFICIENCY RATIO & RETURNS 21 Profitability has begun to improve Significant investment in lending talent, IT infrastructure, risk management and compliance has impacted our efficiency ratio in the short-term but provides us with a platform expected to drive future growth and increased profitability Return on Average Assets 100.0% 0.45% 0.40% 81.1% 83.2% 0.40% 80.0% 72.1% 73.7% 0.35% 0.29% 0.30% 0.26% 60.0% 0.25% 0.23% 0.20% 40.0% 0.15% 20.0% 0.10% 0.05% 0.0% 0.00% 2011Y 2012Y 2013Y 2014Y 2011Y 2012Y 2013Y 2014Y |
|
|
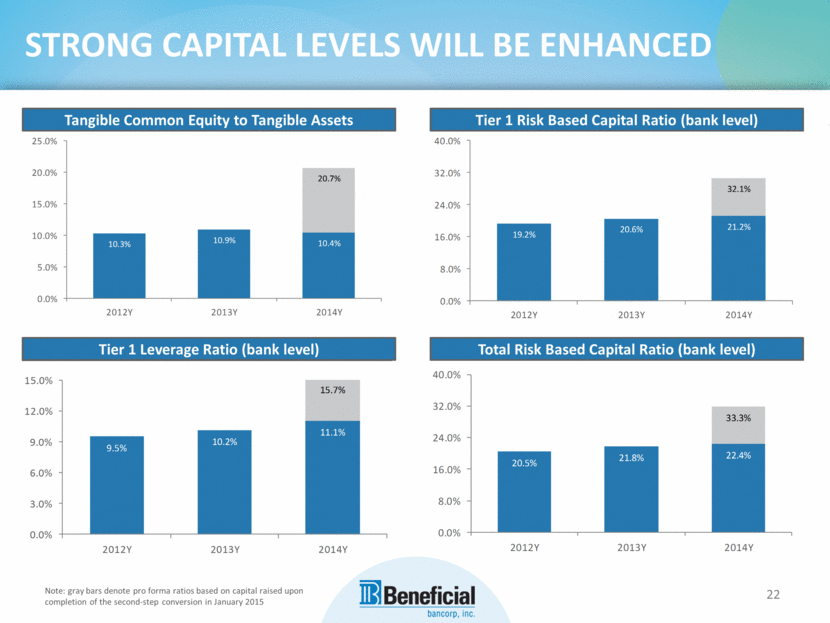
STRONG CAPITAL LEVELS WILL BE ENHANCED Note: gray bars denote pro forma ratios based on capital raised upon completion of the second-step conversion in January 2015 22 Tangible Common Equity to Tangible Assets Tier 1 Leverage Ratio (bank level) Total Risk Based Capital Ratio (bank level) Tier 1 Risk Based Capital Ratio (bank level) Tangible Common Equity to Tangible Assets Tier 1 Risk Based Capital Ratio (bank level) 25.0% 40.0% 20.0% 32.0% 20.7% 32.1% 15.0% 24.0% 20.6% 21.2% 10.0% 16.0% 19.2% 10.3% 10.9% 10.4% 5.0% 8.0% 0.0% 0.0% 2012Y 2013Y 2014Y 2012Y 2013Y 2014Y Tier 1 Leverage Ratio (bank level) Total Risk Based Capital Ratio (bank level) 40.0% 15.0% 15.7% 32.0% 12.0% 33.3% 11.1% 9.0% 10.2% 24.0% 9.5% 21.8% 22.4% 20.5% 6.0% 16.0% 3.0% 8.0% 0.0% 0.0% 2012Y 2013Y 2014Y 2012Y 2013Y 2014Y |
|
|
23 INVESTMENT HIGHLIGHTS Source: U.S. Census Bureau, SNL Financial Stock price as of April 30, 2015 Source: Beneficial Bancorp Offering Prospectus Strong core deposits Diversified loan portfolio History of growing core deposits organically and via acquisition Effectively managing credit, interest rate, and liquidity risk Oldest and largest Philadelphia-based bank Solid Franchise Country’s 5th most populous city, 6th largest metropolitan area and major center of feconomic activity(1) Favorable income and age demographics Significant opportunities to grow market share Dominated by large “out of town” banks Attractive Markets Demonstrated history of stock repurchases Disciplined acquirer Will be in a position to consider paying dividends Shareholder Focused Current Stock Price $11.60(2) Current Price to pro forma TBV: 99.2%(2) Appraisal peer group median valuation: 128.4% of pro forma TBV(3) Compelling Valuation |
|
|
APPENDIX |
|
|
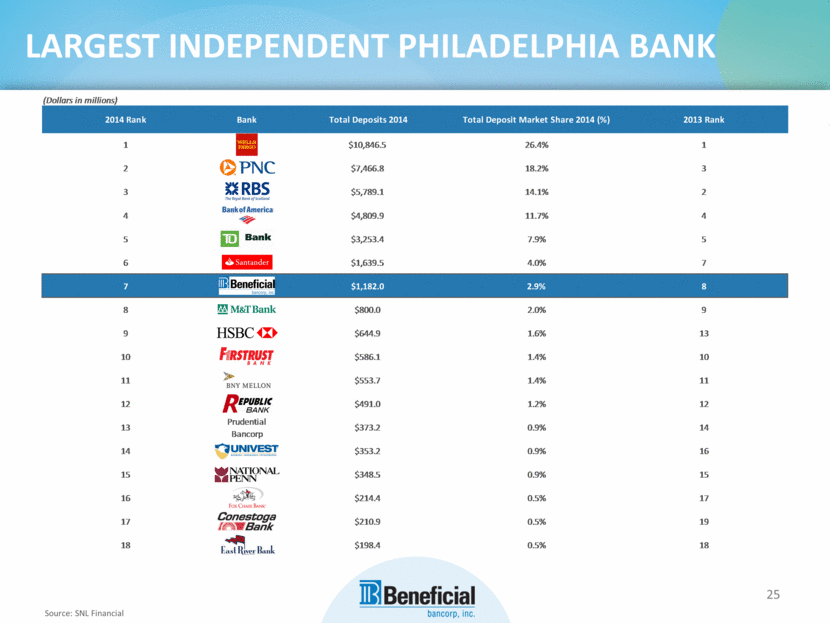
25 LARGEST INDEPENDENT PHILADELPHIA BANK Source: SNL Financial (Dollars in millions) 2014 Rank Bank Total Deposits 2014 Total Deposit Market Share 2014 (%) 2013 Rank 1 $10,846.5 26.4% 1 2 $7,466.8 18.2% 3 3 $5,789.1 14.1% 2 4 $4,809.9 11.7% 4 5 $3,253.4 7.9% 5 6 $1,639.5 4.0% 7 7 $1,182.0 2.9% 8 8 $800.0 2.0% 9 9 $644.9 1.6% 13 10 $586.1 1.4% 10 11 $553.7 1.4% 11 12 $491.0 1.2% 12 13 Prudential Bancorp $373.2 0.9% 14 14 $353.2 0.9% 16 15 $348.5 0.9% 15 16 $214.4 0.5% 17 17 $210.9 0.5% 19 18 $198.4 0.5% 18 |
|
|
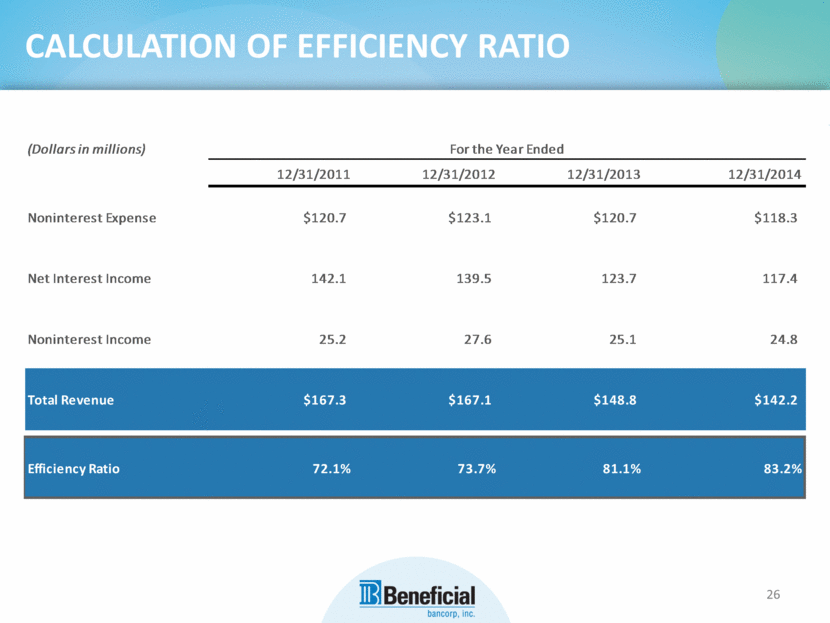
CALCULATION OF EFFICIENCY RATIO 26 (Dollars in millions) For the Year Ended 12/31/2011 12/31/2012 12/31/2013 12/31/2014 Noninterest Expense $120.7 $123.1 $120.7 $118.3 Net Interest Income 142.1 139.5 123.7 117.4 Noninterest Income 25.2 27.6 25.1 24.8 Total Revenue $167.3 $167.1 $148.8 $142.2 Efficiency Ratio 72.1% 73.7% 81.1% 83.2% |
|
|
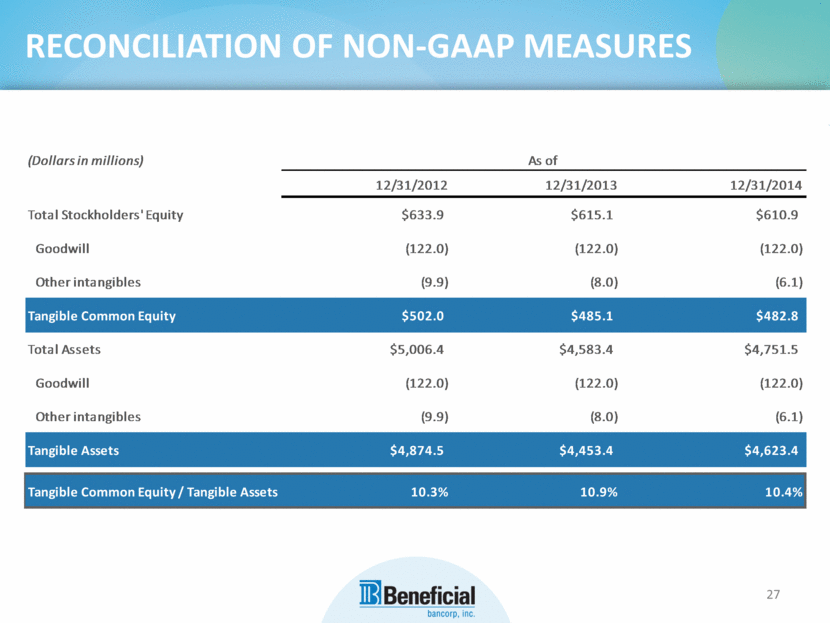
RECONCILIATION OF NON-GAAP MEASURES 27 (Dollars in millions) As of 12/31/2012 12/31/2013 12/31/2014 Total Stockholders' Equity $633.9 $615.1 $610.9 Goodwill (122.0) (122.0) (122.0) Other intangibles (9.9) (8.0) (6.1) Tangible Common Equity $502.0 $485.1 $482.8 Total Assets $5,006.4 $4,583.4 $4,751.5 Goodwill (122.0) (122.0) (122.0) Other intangibles (9.9) (8.0) (6.1) Tangible Assets $4,874.5 $4,453.4 $4,623.4 Tangible Common Equity / Tangible Assets 10.3% 10.9% 10.4% |
|
|
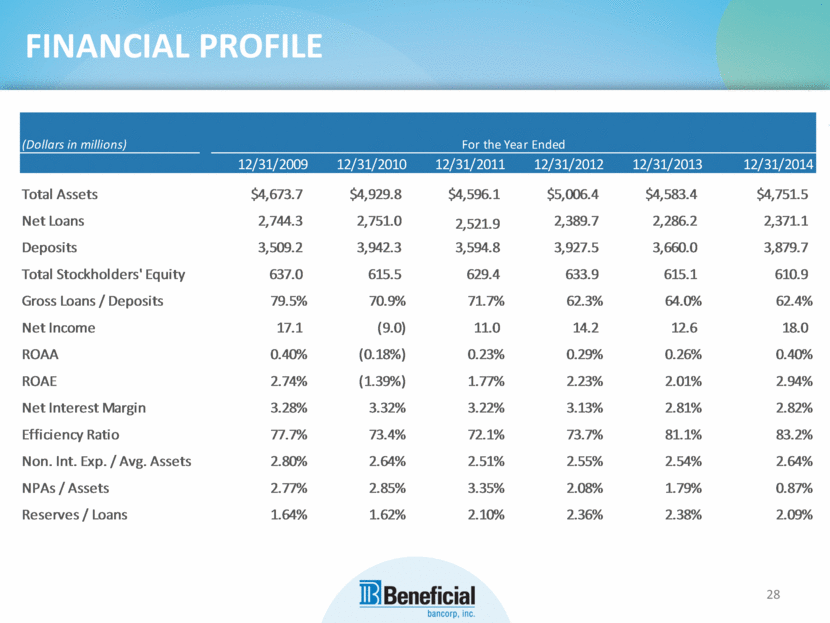
FINANCIAL PROFILE 28 (Dollars in millions) For the Year Ended 12/31/2009 12/31/2010 12/31/2011 12/31/2012 12/31/2013 12/31/2014 Total Assets $4,673.7 $4,929.8 $4,596.1 $5,006.4 $4,583.4 $4,751.5 Net Loans 2,744.3 2,751.0 2,521.9 2,389.7 2,286.2 2,371.1 Deposits 3,509.2 3,942.3 3,594.8 3,927.5 3,660.0 3,879.7 Total Stockholders' Equity 637.0 615.5 629.4 633.9 615.1 610.9 Gross Loans / Deposits 79.5% 70.9% 71.7% 62.3% 64.0% 62.4% Net Income 17.1 (9.0) 11.0 14.2 12.6 18.0 ROAA 0.40% (0.18%) 0.23% 0.29% 0.26% 0.40% ROAE 2.74% (1.39%) 1.77% 2.23% 2.01% 2.94% Net Interest Margin 3.28% 3.32% 3.22% 3.13% 2.81% 2.82% Efficiency Ratio 77.7% 73.4% 72.1% 73.7% 81.1% 83.2% Non. Int. Exp. / Avg. Assets 2.80% 2.64% 2.51% 2.55% 2.54% 2.64% NPAs / Assets 2.77% 2.85% 3.35% 2.08% 1.79% 0.87% Reserves / Loans 1.64% 1.62% 2.10% 2.36% 2.38% 2.09% |
|
|
29 |

