Attached files
| file | filename |
|---|---|
| 8-K - FORM 8-K - Sprague Resources LP | d931218d8k.htm |
 Sprague Resources LP
NAPTP Annual Investor Conference
Exhibit 99.1 |
 2
Safe Harbor
Forward-Looking Statements /Non-GAAP Measures
Some of the statements in this presentation may contain forward-looking statements within the
meaning of the safe harbor provisions of the U.S. Private Securities Litigation Reform Act of
1995. Forward-looking statements can be identified by words such as “may,” “assume,”
“forecast,” “position,” “predict,” “strategy,”
“expect,” “intend,” “plan,” “estimate,” “anticipate,” “believe,” “will,” “project,” “budget,” “potential,” or
“continue,” and similar references to future periods. However, the absence of these
words does not mean that a statement is not forward looking. Descriptions of our
objectives, goals, plans, projections, estimates, anticipated capital expenditures, cost savings, strategy for
customer retention and strategy for risk management and other statements of future events or
conditions are also forward looking statements. Forward-looking statements are
neither historical facts nor assurances of future performance. Instead, they are based only on our current
beliefs, expectations and assumptions regarding the future of our business, future plans and
strategies, projections, anticipated events and trends, the economy and other future
conditions. Our actual future results and financial condition may differ materially from those indicated in
the forward-looking statements. Therefore, you should not rely on any of these forward-looking
statements. Important factors that could cause our actual results and financial condition to
differ materially from those indicated in the forward-looking statements include, but are not limited to
a significant decrease in in a demand for refined products, natural gas or our materials handling
services in the areas we serve; derivatives legislation could impact our ability to use
derivatives to reduce the effect of commodity price risk, interest rate risk, and adversely affect our
hedging activities; and, warmer weather during winter months and non-performance by our customers,
suppliers and counterparties. Any forward-looking statement made by us in this
presentation is based only on information currently available to us and speaks only as of the
date on which it is made. We undertake no obligation to publicly update any forward-looking
statement, whether written or oral, that may be made from time to time, whether as a result of
new information, future developments or otherwise. For additional information about risks and
uncertainties that could cause actual results to differ materially from the expectations, please refer
to Sprague’s current Quarterly Report on Form 10-Q and our most recent 10-K
available in the “Investor Relations” section of our website www.spragueenergy.com.
In this presentation we refer to certain financial measures not prepared in accordance with generally accepted accounting principles, or GAAP,
including adjusted gross margin and adjusted EBITDA. For a description of how we define these
non-GAAP financial measures see “Part I, Item 2, Management’s Discussion and
Analysis of Financial Condition and Results of Operations – How Management Evaluates Our Results of
Operations.” in Sprague’s current Quarterly Report on Form 10-Q and our most recent
10-K available in the “Investor Relations” section of our website
www.spragueenergy.com. |
 |
 4
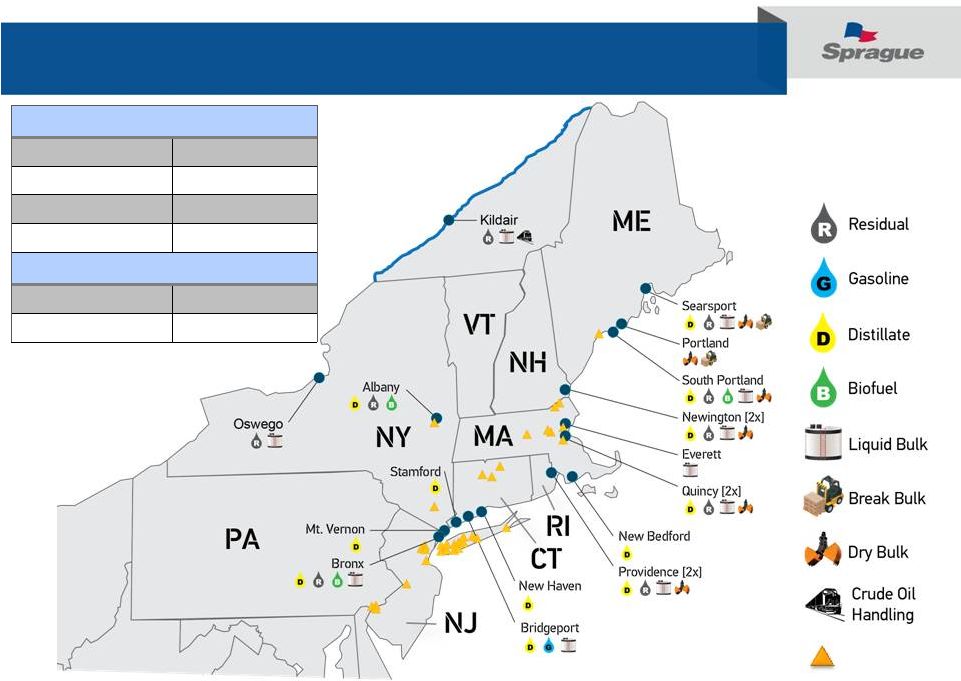
Refined Products and Materials Handling Network
(1)
Does not include ~2.1 million barrels of storage capacity (46 storage tanks)
currently out of service and not necessary for current operations
3
rd
Party
Locations
Storage Metrics
Storage Tanks:
208
Tank Capacity
(1)
:
14.1 MMbbl
18 Pads:
1,226,000 ft
2
10 Warehouses:
316,000 ft
2
Marketing Metrics
~ Volume (2014):
40 million barrels
~ Customers
3,000 |
 Natural Gas Service
Area Supply Metrics
Pipelines:
15
States/Utilities:
13/46
Marketing Metrics
~ MMBtus (2014):
54,430,000
~ Customer Accounts:
15,000
5 |
 Sprague Resources LP
(SRLP) Overview Ticker
SRLP
Exchange
NYSE
SRLP Price Per Unit on May 15, 2015
$28.06
Total Units Outstanding
21.1 million
Market Capitalization
$548 million
1Q 2015 Distribution Per Unit
$0.4725
Annualized 1Q 2015 Distribution Per Unit
$1.89
Yield as of May 15, 2015
6.74%
Distribution Growth Guidance for 2015
13.1%
2015 Adjusted EBITDA Guidance
$105 -
$120 million
1) Includes re-investment of distributions as of May 15, 2015
SRLP Total Return
(1)
Investment Highlights
Distribution Per LP Unit
6
Distribution Per LP Unit
$0.2825
$0.4125
$0.4275
$0.4425
$0.4575
$0.4725
$ / Unit
$0.4125
$0.38
$0.39
$0.40
$0.41
$0.42
$0.43
$0.44
$0.45
$0.46
$0.47
$0.48
MQD
4Q 2013*
1Q 2014
2Q 2014
3Q 2014
4Q 2014
1Q 2015
* Actual
distribution
of
$0.2825
per
unit
reflected
proration
of
minimum
quarterly
distribution
rate
for the October 30, 2013 closing of the SRLP IPO |
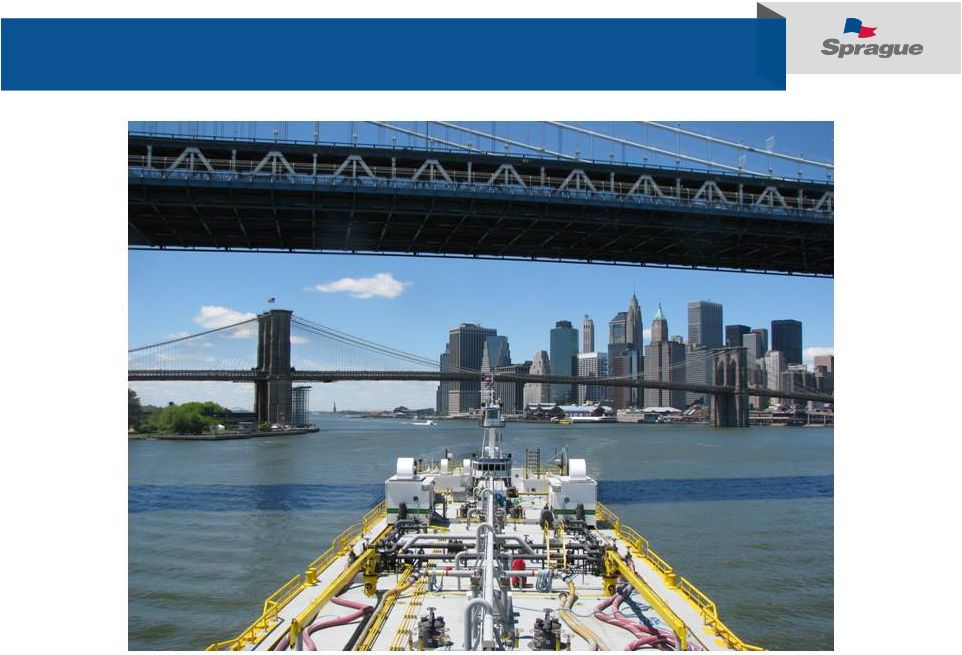
 Fee-Based
Income River Road Terminal
Sprague’s terminals integrate refined product distribution with contractual income from
materials handling services
7 |
 Fee-Based
Income Kildair Terminal
Recent expansion into crude trans-shipment / storage at our Kildair facility
8 |
 9
Converting Rack Business to Contracted Sales
•
Offers from Sprague move with market
•
Buyers contract for supply at known price
•
Volatility presents opportunity for
customers
•
Forward programs de-risk customer
business
•
“Chat”
feature promotes
communication and negotiation
•
Sprague has ability to enhance margin as
market costs shift
“Real-Time”
Wholesale Marketing
Percentage of Wholesale Volume Sold on
Sprague Real-Time Pricing Platform
Traditional Wholesale Rack Marketing
•
Multiple sellers in market
•
No commitment from buyers
•
Focus on price
•
Volatile markets make posted prices “stale”
and increase risk of hedge imbalance |
 Natural Gas Contract Margin
•
Standard pathway to meter assumed
•
Contract offer reflects market cost to supply
•
Customer signs contract –
sale is locked in
•
Supply costs are hedged
Base
contract
margin
established
2-Leg Traditional Supply
Route
10 |
 Natural Gas Margin Optimization
Schedulers have flexibility to supply gas
utilizing many pathways prior to delivery
Broad portfolio of customer accounts
enables “swaps”
Cash market volatility presents additional
opportunities
Margin Enhancement Opportunities
4-Leg Alternative Supply
Route
11 |
 Integrated Business Model
Supply
and
logistics
expertise,
coupled
with
product
and
service
innovations,
used
to
enhance returns on the asset base
Refined Products Adjusted Unit Margin ($/gallon)
Natural Gas Adjusted Unit Margin ($/MMBtu)
Representative Throughput Model
Margin
Representative Wholesale Supply
Services Margin
12 |
 Integrated Business Model
Refined Products Adjusted Unit Margin ($/gallon)
Natural Gas Adjusted Unit Margin ($/MMBtu)
Proprietary terminal marketers
Local market competitive intelligence
Control of our own supply in extreme
conditions
Superior product/service offer to customer
Management of gas from hub to burner tip
Ability to enhance margin in certain market
conditions
13 |
 Limited Commodity Exposure
•
Sprague’s Risk Policy sets authorized position limits for all commodities
handled •
Inventory is tracked daily and Risk team monitors all open positions relative to
inventory levels and sales to ensure Sprague maintains a hedged book of
business •
Outright short/long positions due to daily imbalances are minimal relative to total
volume
•
Daily VAR calculation monitored
Risk Management
Business Model’s Exposure to Commodity Price Levels
•
Agnostic to outright price levels
•
Working capital requirements reduced with lower commodity prices
•
Some bid contracts benefit from declining prices
•
Product slate continues to evolve to meet customer energy requirements
14 |
 15
Searsport Terminal –
circa 1950
Organic Growth –
Sprague’s DNA |
 Rail Transfer Pad
Nacelles
Road Salt
Pads
Clay Slurry
Rail connection to CP,
CMQ and Pan Am
Liquid
Finger
Dock
Bulk Dock
Food Grade
Warehouses
Available for Development
Blades
Hopper
Coal /
Petcoke
Third Party
Tanks
Third Party
Tanks
Third-party storage
Unloading
Blades
Organic Growth –
Sprague’s DNA
Searsport Terminal today
16 |
 Organic Growth –
Sprague’s DNA
October 2007
Kildair Terminal
17 |
 Organic Growth –
Sprague’s DNA
October 2012
Kildair Terminal
18 |
 Organic Growth –
Sprague’s DNA
Kildair Terminal
June 2014
19 |
 20
Visible Return Growth In Recent Acquisitions
•
Replacement of 3
rd
party supplier
•
Growth in assigned capacity portfolio and
associated optimization
•
Electricity brokerage platform
•
Investing expansion capital at terminal
•
Distillates / Biofuels
•
Space for Materials Handling growth
•
Cost-effective servicing of existing Sprague NYC
contractual business
•
Efficiency gains in multiple processes
Very low effective multiple on recent acquisitions |
 21
Strong Financial Performance and Growth
Adjusted EBITDA
•
Refined Products
-
19% increase in heating degree days with colder than
normal weather; benefit from recent Castle acquisition; strong margin
generation resulting in record quarter
•
Natural Gas
–
Uplift from Q4 Metromedia acquisition contributing higher
volumes; offset partially by marginally lower unit margins as a result of
decreased
volatility
in
the
Northeast
cash
markets
compared
to
a
year
ago
•
Materials Handling
–
Strong results in break bulk activity (windmills and
newsprint), benefit of crude storage and handling project at Kildair, increased
asphalt volumes; leveraging of the shared petroleum assets and workforce
Adjusted Gross Margin
Key Q1 2015 Events
Distributable Cash Flow
(1)
(1)
The presented period 2012 is pro forma per page 56 in Sprague’s S-1
Prospectus. 2013 is a pro forma calculation as presented in Sprague’s March 13, 2015 press and earnings release.
$139.4
$189.1
$245.0
$114.3
$0
$30
$60
$90
$120
$150
$180
$210
$240
$270
2012
2013
2014
2015 Q1
Refined Products
Natural Gas
Materials Handling
Other
($ millions)
$49.8
$76.2
$105.3
$63.5
$0
$20
$40
$60
$80
$100
$120
2012
2013
2014
2015 Q1
($ millions)
$29.9
$40.1
$74.9
$58.6
$0
$15
$30
$45
$60
$75
2012
2013
2014
2015 Q1
($ millions) |
 22
Distribution Growth and Coverage
•
Ratable
$0.015
per
unit
distribution
growth
by
quarter
planned
for
the
next
12 -
24 months
•
Strong
coverage
ratio
enables
Sprague
to
“naturally
delever”
by
paying
down
debt
with
excess
cash
flow
without
the
need
to
access
the
equity
markets
$0
$10
$20
$30
$40
$50
$60
$70
$80
$90
$100
2012
2013
2014
TTM March 2015
Distributions
Excess Distributable Cash Flow
($ millions)
1.0x
1.2x
2.1x
2.4x
$29.9
$40.1
$74.9
$89.5 |
 23
(in millions)
Debt
Liquidity
Acquisition Facility
$312
$88
Accordion
$200
Credit Facility, Liquidity and Leverage
•
$1.12 billion Working Capital facility (includes $120 million multicurrency Working
Capital facility) •
$400 million Acquisition facility
•
Accordions:
•
Combined Working Capital facilities -
$200 million
•
Acquisition
facility
-
$200
million
•
Maximum size is $2.0 billion (including optional contango facility of $125
million) •
Significant capacity and liquidity to finance our ongoing business requirements and
growth •
JPMorgan Chase is Administrative Agent (Syndicate of 24 Diverse Lenders)
(in millions)
Debt
Liquidity
Working Capital Facility
$416
$187
Accordion
$200
Total
Facility
Size
-
$1.52
billion
(Committed
5
years,
expiring
December
2019)
Debt and Liquidity as of March 31, 2015
1.3x
1.6x
3.0x
2.7x
Permanent
Leverage
Ratio
$0
$200
$400
$600
$800
$1,000
Q2 2014
Q3 2014
Q4 2014
Q1 2015
Acquisition Line
Working Capital Facility
$248
$392
$815
$728 |
 24
Guidance
Full Year 2015 Guidance
•
Adjusted EBITDA guidance range of $105 to $120 million
•
Assumes normal weather, market conditions and no acquisitions
•
Maintenance CapEx range of $7 million to $10 million
•
Cash Interest expense range of $23 million to $26 million
•
Distribution
growth
of
$0.0150/unit
per
quarter
for
the
next
12
–
24
months |
 Key
Investment Considerations Materials Handling is 100% fee-based,
multi-year contracts More than 50% of Refined Product sales are under
contract Natural Gas contract base margin enhanced by optimization
activities Experts in unique Northeast logistical challenges
Product and service innovation drives enhanced margins
Marketing emphasis does not translate to commodity exposure
Synergy realization from recent acquisitions
Organic growth prospects at Kildair, Bronx, and Searsport
Active acquisition market
Strong performance resulting in high coverage
Modest leverage and ample acquisition facility liquidity
Distribution growth above guidance at IPO
Terminaling,
Logistics and
Marketing
Expertise
Contract-Based
Income with
Upside Potential
Strong Capital
Position
Visible Growth
Prospects
25 |
 26
Appendix |
 27
Condensed Consolidated Balance Sheet
March 31,
December 31,
2015
2014
(Unaudited)
Assets
Current assets:
Cash and cash
equivalents…………………………………………………….
$
21,609
$
4,080
Accounts receivable,
net………………………………………………………
342,174
289,424
Inventories…………………………………………………………………….
217,912
390,555
Fair value of derivative assets.
……………………………………………….
169,298
229,890
Deferred income
taxes………………………………………………………..
961
895
Other current assets.
………………………………………………………….
50,115
52,416
Total current
assets………………………………………………………
802,069
967,260
Property, plant, and equipment, net.
………………………………………………
251,336
250,126
Assets held for sale
………………………………………………………………..
68
1,321
Intangibles, net
…………………………………………………………………….
25,585
27,626
Other assets,
net…………………………………………………………………….
26,322
30,219
Goodwill.
………………………………………………………………………….
63,288
63,288
Total assets
……………………………………………………………………
$
1,168,668
$
1,339,840
Liabilities and unitholders' equity
Current liabilities:
Accounts payable.
$
124,972
$
198,609
Accrued liabilities
……………………………………………………………
56,510
63,816
Fair value of derivative
liabilities…………………………………………….
55,685
89,176
Due to General Partner and affiliates
…………………………………………
11,969
15,340
Current portion of log-term
debt
…………………………………………….
258,678
397,214
Current portion of capital leases
……………………………………………..
1,004
1,313
Total current liabilities
………………………………………………….
508,818
765,468
Commitments and
contingencies…………………………………………………..
-
Long
-
term debt
…………………………………………………………………..
469,708
418,356
Long-term capital leases
…………………………………………………………..
4,245
5,424
Other liabilities
18,157
17,884
Due to General Partner
…………………………………………………………….
848
988
Deferred income taxes
………………………………………………………………
15,190
15,826
Total liabilities
…………………………………………………………………
1,016,966
1,223,946
Unitholders' equity:
Common unitholders
-
public (8,969,914 units and 8,777,922 units issued and
outstanding, as of March 31, 2015 and December 31, 2014,
respectively)…. 186,997
171,055
Common unitholders
-
affiliated (2,034,378 units issued and
outstanding, as of March 31, 2015 and December 31, 2014,
respectively)…. (1,908)
(5,566)
Subordinated unitholders
-
affiliated (10,071,970 units issued and outstanding)
(21,652)
(39,762)
Accumulated other comprehensive loss, net of tax
……………………………
(11,735)
(9,833)
Total unitholders'
equity………………………………………………………
151,702
115,894
Total liabilities and
unitholders'
equity…………………………………
$
1,168,668
$
1,339,840
- |
 28
Adjusted Gross Margin by Segment –
Q1 2015
Three Months Ended March 31,
2015
2014
(unaudited)
(unaudited)
($ and volumes in thousands)
Volumes:
Refined products (gallons)
726,432
588,756
Natural gas (MMBtus)
…...……………………………………………………………………………..……………
20,013
16,496
Materials handling (short
tons)………………………………………………………………………………………
585
694
Materials handling
(gallons)…………………………………………………………………………………………
74,760
66,822
Net Sales:
Refined
products…………………………………………………………………………………………………….
$
1,431,845
$
1,844,973 Natural
gas…………………………………………………………………………………………………………..
146,679
134,340
Materials
handling…………………………………………………………………………………………………..
10,184
8,079
Other
operations……………………………………………………………………………………………………..
9,650
7,307
Total net
sales……………………………………………………………………………………………………….
$
1,598,358
$
1,994,699 Adjusted Gross Margin:
(2)
Refined
products……………………………………………………………………………………………………
$
66,306
$
51,530 Natural
gas………………………………………………………………………………………………………….
34,817
35,344
Materials
handling………………………………………………………………………………………………….
10,184
8,077
Other
operations…………………………………………………………………………………………………….
2,983
1,336
Total adjusted gross
margin…………………………………………………………………………………………
$
114,290
$
96,287 Calculation of
Adjusted Gross Margin: Total net
sales………………………………………………………………………………………………………..
$
1,598,358
$
1,994,699 Less cost of products sold (exclusive of
depreciation and amortization)……………………………………………
(1,490,373)
(1,864,419)
Add: unrealized (gain) loss on
inventory……………………………………………………………………………..
3,534
(5,866)
Add: unrealized (gain) loss on natural gas transportation
contracts…………………………………………………
2,771
(28,127)
Total adjusted gross
margin………………………………………………………………………………………….
$
96,287
………………………………………………………………………………………….
$
114,290 1) On December 9, 2014, the
Partnership acquired all of the equity interests in Kildair through the acquisition of the equity interests of Kildair’s parent Sprague Canadian Properties LLC. As the
acquisition of Kildair by the Partnership represents a transfer of
entities under common control, the Consolidated and Financial Statements for the three months ended March 31, 2014, and related
information presented herein have been recast by including the
historical financial results of Kildair for all periods that were under common control.
2) Adjusted gross margin is defined as net sales less cost of products
sold (exclusive of depreciation and amortization) increased by unrealized hedging losses and decreased by unrealized hedging
gains, in each case with respect to refined products and natural gas
inventory and natural gas transportation contracts. (1)
|
 29
Adjusted Gross Margin by Segment –
YE 2014
(1)
Three Months Ended
Year Ended
December 31,
December 31,
2013
2013
2014
Predecessor
2014
Predecessor
(unaudited)
(unaudited)
($ and volumes in thousands)
($ and volumes in thousands)
Volumes:
Refined products (gallons)
475,398
399,462
1,668,240
1,472,100
Natural gas (MMBtus)
……………………………………………………………………………………………….
16,166
13,667
54,430
51,979
Materials handling (short
tons)………………………………………………………………………………………
703
529
2,663
2,145
Materials handling
(gallons)…………………………………………………………………………………………
96,474
69,678
309,834
246,708
Net Sales:
Refined
products…………………………………………………………………………………………………….
1,076,410
$
1,182,667
$
4,650,871 $
Natural
gas…………………………………………………………………………………………………………..
104,926
82,139
359,984
304,843
Materials
Handling…………………………………………………………………………………………………..
10,908
6,733
37,776
28,446
Other
operations……………………………………………………………………………………………………..
5,750
4,762
21,131
18,650
Total net
sales……………………………………………………………………………………………………….
$
$
5,069,762
$
4,683,349 Adjusted Gross Margin:
(2)
Refined
products……………………………………………………………………………………………………
$
44,153
$
36,151
$
146,021
$
114,744 Natural
gas………………………………………………………………………………………………………….
12,922
11,972
55,536
40,373
Materials
Handling………………………………………………………………………………………………….
10,925
6,730
37,811
28,430
Other
operations…………………………………………………………………………………………………….
1,660
2,178
5,599
5,547
Total adjusted gross
margin…………………………………………………………………………………………
$
$
244,967
$
189,094 Calculation of Adjusted Gross
Margin: Total net
sales………………………………………………………………………………………………………..
$
1,276,301
$
5,069,762
$
4,683,349 Less cost of products sold (exclusive of
depreciation and amortization)……………………………………………
(1,076,155)
(1,271,750)
(4,755,031)
(4,554,188)
Add: unrealized (gain) loss on
Inventory……………………………………………………………………………..
241
8,487
(11,070)
4,188
Add: unrealized (gain) loss on natural gas transportation
contracts…………………………………………………
(52,420)
43,993
(58,694)
55,745
Total adjusted gross
margin………………………………………………………………………………………….
$
57,031
$
244,967
$
189,094 1) On December 9, 2014, the
Partnership acquired all of the equity interests in Kildair through the acquisition of the equity interests of Kildair’s parent Sprague Canadian Properties LLC. As the
acquisition of Kildair by the Partnership represents a transfer of
entities under common control, the Consolidated and Combined Financial Statements and related information presented herein have
been recast by including the historical financial results of Kildair
for all periods that were under common control. 2) Adjusted
gross margin is defined as net sales less cost of products sold (exclusive of depreciation and amortization) increased by unrealized hedging losses and decreased by unrealized hedging
gains, in each case with respect to refined products and natural gas
inventory and natural gas transportation contracts.
………………………………………………………………………………………….
$
69,660 $
$
$
$
1,197,994
69,660
1,197,994
1,276,301
57,031
4,331,410 |
 30
Statement of Operations Data:
Net sales
$
1,598,358
$
1,994,699
Operating costs and expenses:
Cost of products sold (exclusive of depreciation and amortization)
1,490,373
1,864,419
Operating expenses
18,883
16,838
Selling, general and administrative
32,381
27,411
Depreciation and amortization
4,992
3,955
Total operating costs and expenses
1,546,629
1,912,623
Operating income
51,729
82,076
Other income
514
-
Interest income
112
110
Interest expense
(7,766)
(8,016)
Income before income taxes
44,589
74,170
Income tax provision
(650)
(1,038)
Net income
43,939
73,132
Adjust: Loss attributable to Kildair from January 1, 2014
through March 31, 2014
-
2,203
Limited partners’ interest in net income
$
43,939
$
75,335
Net income per limited partner unit:
Common - basic
$
2.10
$
3.74
Common - diluted
$
2.06
$
3.74
Subordinated - basic and diluted
$
2.10
$
3.74
Units used to compute net income per limited partner unit:
Common - basic
10,897,488
10,072,186
Common - diluted
11,064,510
10,073,176
Subordinated - basic and diluted
10,071,970
10,071,970
Reconciliation of net income to adjusted EBITDA:
Net income
$
43,939
$
73,132
Add/(Deduct):
Interest expense, net
7,654
7,906
Tax expense
650
1,038
Depreciation and amortization
4,992
3,955
EBITDA
$
57,235
$
86,031
Add: unrealized (gain) loss on inventory
3,534
(5,866)
Add: unrealized (gain) loss on natural gas transportation contracts
2,771
(28,127)
Adjusted EBITDA
$
63,540
$
52,038
(1)
Summary Financial Data –
Q1 2015
1) On December 9, 2014, the Partnership acquired all of the equity
interests in Kildair through the acquisition of the equity interests of Kildair’s parent Sprague Canadian Properties LLC.
As the acquisition of Kildair by the Partnership represents a transfer
of entities under common control, the Consolidated Financial Statements for the three months ended March 31, 2014,
and related information presented herein have been recast by including
the historical financial results of Kildair for all periods that were under common control.
2) EBITDA represents net income before interest, income taxes,
depreciation and amortization.
3) Adjusted EBITDA represents EBITDA increased by unrealized hedging
losses and decreased by unrealized hedging gains, in each case with respect to refined products and natural gas
inventory and natural gas transportation contracts.
(3)
(2)
Three Months Ended March 31,
2015
2014
(unaudited)
(unaudited)
($ in thousands)
………………………………………………………………………………….……….
………………………………
……………………………………………………………………………
………………………………………………………………
………………………………………………………….………
…………………………………………………….…
……………………………………………………………………………….…
…………………………………………………………………………………
…………………………………………………………………………….…
………………………………………………………………………………
…………………………………………………………………………
……………………………………………………………………….…
………………………………………………………………………………….……
…………………………………………………………………………
…………………………………………..……….………
……………………………………………………………………………..………
…………………………………………………………………
…………………………………………………………………………
…………………………………………………………
……………………………………………………………………………..………
…………………….………………………………..
…………………….………
…………………….……………………….……………………………..
|
 31
Summary Financial Data –
YE 2014
(1)
1) On December 9, 2014, the Partnership acquired all of the equity
interests in Kildair through the acquisition of the equity interests of Kildair’s parent Sprague Canadian Properties LLC.
As the acquisition of Kildair by the Partnership represents a transfer
of entities under common control, the Consolidated and Combined Financial Statements and related information
presented herein have been recast by including the historical financial
results of Kildair for all periods that were under common control.
2) Adjusted EBITDA respresents EBITDA increased by unrealized hedging
losses and decreased by unrealized hedging gains, in each case with respect
to refined products and natural gas inventory and natural gas
transportation contracts, and adjusted for bio-fuel excise tax credits.
3) Net loss per unit for three months ended and year ended December 31,
2013, is only calculated for the Partnership after the IPO as no units were outstanding prior to October 30, 2013.
(3)
…………………………………………………………………..........
…………………………………………………
…………………………………………………………
………………………………………………………
………………………………………
……………………………………….
………………………………
…………………………………………………………
…………………………………………………
…………………………………………………………
…………………………………………………………
………………………………………………
…………………………………………
……………………………………………………………….
…………………
………………………………………..…………
………………………..………
10,271,010
10,453,910
10,071,970
10,071,970
10,071,970
10,071,970
4,554,188
51,979
(2)
Three Months Ended
Year Ended
December 31,
December 31,
2014
2013
Predecessor
2014
2013
Predecessor
(unaudited)
(unaudited)
($ in thousands)
($ in thousands)
Statement of Operations Data:
Net sales
$
1,197,994 $
1,276,301 $ 5,069,762
$ 4,683,349
Operating costs and expenses:
Cost of products sold (exclusive of depreciation and
amortization)
1,076,155
1,271,750
4,755,031 Operating expenses
17,199
12,829
62,993
53,273
Selling, general and administrative
22,159
15,521
76,420
55,210
Depreciation and amortization
5,167
4,044
17,625
16,515
Total operating costs and expenses
1,120,680
1,304,144
4,912,069
4,679,186 Operating income (loss)
77,314
(27,843)
157,693
4,163
Other (expense) income
(288)
(33)
(288)
568
Interest income
168
83
569
604
Interest expense
(8,103)
(9,068)
(29,651)
(30,914) Income (loss) before
income taxes
69,091
(36,861)
128,323
(25,579) Income tax
(provision) benefit (3,503)
1,819
(5,509)
(4,259) Net income
(loss)
65,588
(35,042)
122,814
(29,838) Adjust: Predecessor (loss) income through October 29, 2013
-
(2,470)
-
2,734
Adjust: Income (loss) attributable to Kildair from October 29, 2013
through December 8th, 2014
1,977
(2,338) 4,080
(2,338) Limited partners' interest in net income (loss)
$ 63,611
$ (30,234)
$ 118,734
$ (30,234)
Net income (loss) per limited partner unit :
Common - basic
$ 3.13
$ (1.50)
$ 5.88
$ (1.50)
Common - diluted
$ 3.07
$ (1.50)
$ 5.84
$ (1.50)
Subordinated - basic and diluted
$ 3.13
$ (1.50)
$ 5.88
$ (1.50)
Units used to compute net income per limited partner unit -
Common - basic
10,071,970 10,131,928
Common - diluted
10,071,970 10,195,566
Subordinated - basic and diluted
10,071,970
10,071,970 Adjusted EBITDA (unaudited)
$ 30,014
$ 28,648
$ 105,266
$ 76,158
Other Financial and Operating Data (unaudited)
Capital expenditures
$ 5,266
$ 11,016
$
18,580
$ 28,090
Total refined products volumes sold (gallons)
475,398
399,462 1,668,240
1,472,100 Total natural gas volumes sold (MMBtus)
16,166
13,667 54,430
|
 32
($ in thousands)
Reconciliation of adjusted EBITDA to distributable cash flow:
Adjusted EBITDA
$
63,540
$
52,038
Add/(Deduct):
Cash interest expense, net
.............................................................
Cash taxes
.....................................................................................
Maintenance capital expenditures
.................................................
Elimination of expense relating to incentive compensation
and directors fees expected to be paid in common units .........
4,068
538
Other
.............................................................................................
802
41
Eliminate the effects of Kildair
-
Distributable cash flow
$
58,575
$
43,953
1) On December 9, 2014, the Partnership acquired all of the equity
interests in Kildair through the acquisition of the equity
interests of Kildair’s parent Sprague Canadian Properties LLC. As
the acquisition of Kildair by the Partnership represents a
transfer of entities under common control, the Consolidated Financial
Statements for the three months ended March 31, 2014, and
related information presented herein have been recast by including the historical financial results of Kildair for all
periods that were under common control.
2) Adjusted EBITDA represents EBITDA increased by unrealized hedging
losses and decreased by unrealized hedging gains, in each case
with respect to refined products and natural gas inventory and natural gas transportation contracts.
3) To report distributable cash flow excluding Kildair for the periods
that were under common control and prior to the Kildair
acquisition on December 9, 2014.
.......................................................................................
................................................................
...............................................................................
Adjusted EBITDA to DCF Reconciliation –
Q1 2015
(1)
(2)
(3)
(unaudited)
(unaudited)
2015
2014
Three Months Ended March 31,
(6,748)
(1,327)
(1,760)
(6,714)
(593)
(1,263)
(94) |
 33
.........................................................................................................
Adjusted
EBITDA
to
DCF
Reconciliation
–
YE
2014
(1)
1) On December 9, 2014, the Partnership acquired all of the equity
interests in Kildair through the acquisition of the equity interests of Kildair’s parent Sprague Canadian
Properties LLC. As the acquisition of Kildair by the Partnership
represents a transfer of entities under common control, the Consolidated and Combined Financial
Statements and related information presented herein have been recast by
including the historical financial results of Kildair for all periods that were under common
control.
2) The unaudited pro forma information gives effect to certain pro
forma adjustments as if they had occurred as of January 1, 2013. The adjustments are based upon
available information and certain estimates and assumptions; therefore,
actual adjustments will differ from the pro forma adjustments. Pro forma adjustments reflect the
following:
a) The pro forma adjustment for interest expense and deferred financing
fees under the new credit agreement. The calculation is based on the monthly average working
capital and acquisition facility multiplied by the decreases in the
borrowing rate of 0.50% for borrowings under the working capital facility, less the increase of
commitment fees due to the increased size of the facility.
b) The elimination of corporate overhead charges from the Parent offset
by increases in incentive compensation.
c) The adjustments to reflect the conversion of the Predecessor to a
partnership resulting in the elimination of all U.S. federal income taxes, as well as an adjustment of
income taxes in certain state jurisdictions in which the partnership
operates, and to record estimated taxes for the activities conducted by the Partnership at the applicable
state statutory rates.
3) Adjusted EBITDA respresents EBITDA increased by unrealized hedging
losses and decreased by unrealized hedging gains, in each case with respect to refined
products and natural gas inventory and natural gas transportation
contracts, and adjusted for bio-fuel excise tax credits.
4) To report distributable cash flow excluding Kildair for the periods
that were under common control and prior to the Kildair acquisition on December 9, 2014.
2014
2013
Predecessor
2014
2013
Predecessor
(unaudited)
Pro Forma
(unaudited)
(unaudited)
Pro Forma
(unaudited)
($ in thousands)
($ in thousands)
Adjusted EBITDA
$
30,014
$
28,654
$
105,266
$
76,156
Add/(Deduct):
Cash interest expense, net
......................................................................................
Cash taxes
..............................................................................................................
Maintenance capital expenditures
..........................................................................
Estimated incremental selling, general and administrative expense of
being a publicly traded partnership
................................................................................
-
-
Elimination of expense relating to incentive compensation and directors
fees expected to be paid in common units
................................................................
2,915
761
8,182
1,975
Other
......................................................................................................................
4,711
7
6,102
609
Eliminate the effects of Kildair
476
1,306
Distributable cash flow
$
21,166
$
18,173
$
74,897
$
40,063
.......................................................................................
...........................................................................................................
Reconciliation of adjusted EBITDA to distributable cash flow: (2)
(3)
(2)
(4)
(7,362)
(1,220)
(2,971)
(24,265)
(3,042)
(8,290)
(9,056)
(1,716)
(7,680)
(6,156)
(24,431)
(4,206)
(4,231)
(1,350)
(6,687)
Three Months Ended
December 31,
Year Ended
December 31, |