Attached files
| file | filename |
|---|---|
| 8-K - 8-K - OLD SECOND BANCORP INC | a15-11780_18k.htm |
Exhibit 99.1
|
|
Old Second Bancorp, Inc. ANNUAL MEETING 2015 NASDAQ: OSBC |
|
|
Call to Order |
|
|
William Skoglund Chairman wskoglund@oldsecond.com 630-906-5483 James Eccher President & CEO, OSBC President & CEO, OSNB jeccher@oldsecond.com 630-966-2433 Doug Cheatham Executive VP & Chief Financial Officer dcheatham@oldsecond.com 630-906-5484 NASDAQ: OSBC May 19, 2015 Presenters |
|
|
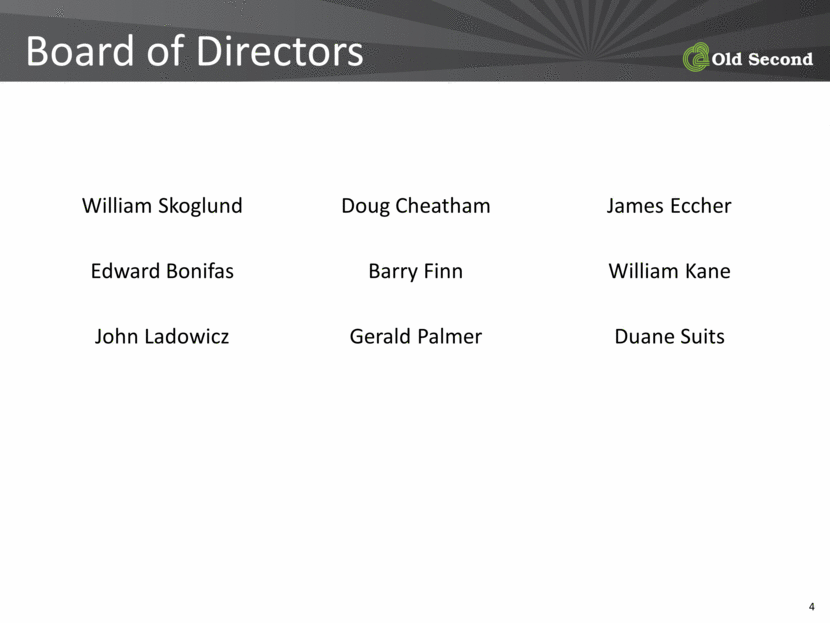
Board of Directors William Skoglund Doug Cheatham James Eccher Edward Bonifas Barry Finn William Kane John Ladowicz Gerald Palmer Duane Suits |
|
|
Appointed Proxies for Management William Kane Gerald Palmer |

|
|
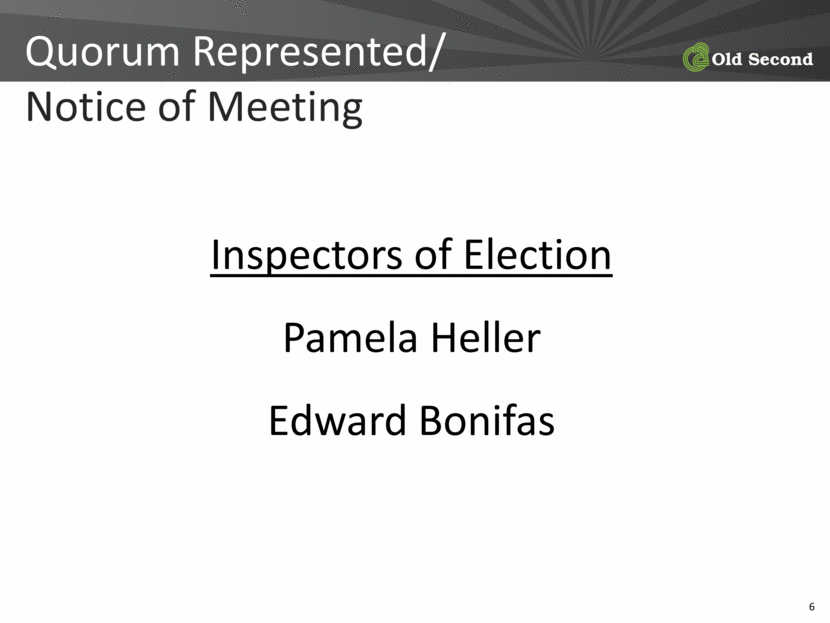
Quorum Represented/ Notice of Meeting Inspectors of Election Pamela Heller Edward Bonifas |
|
|
Minutes 2014 Annual Meeting |
|
|
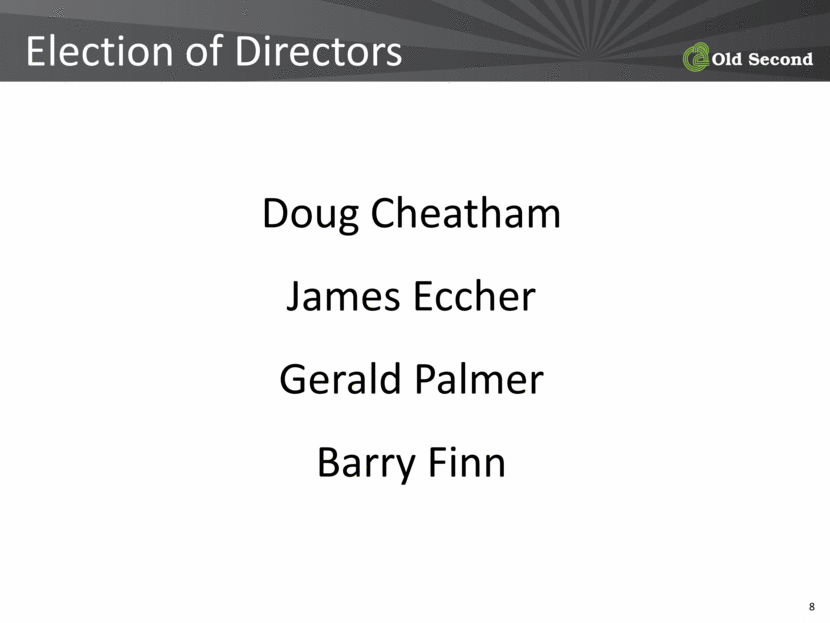
Election of Directors Doug Cheatham James Eccher Gerald Palmer Barry Finn |
|
|
Non-Binding Advisory Proposal on Old Second’s Executive Compensation |
|
|
Ratification/Approval of Plante & Moran, PLLC |
|
|
In addition to historical information, this presentation contains forward-looking statements, which are subject to certain risks and uncertainties. Forward-looking statements include information concerning possible or assumed future results of Old Second’s operations. Forward-looking statements generally include words such as believes, expects, anticipates and other similar expressions. Stockholders should note that many factors could affect the future financial results of Old Second, causing those results to differ materially from those expressed in this presentation. These factors include operating, legal and regulatory risks; economic, political and competitive forces impacting our business; risk that our analysis of these risks and forces could be incorrect and/or that the strategies developed to address them could be unsuccessful; volatility in interest rates; and other risks and uncertainties which are summarized in our SEC filings. Old Second undertakes no obligation to publicly revise or update these forward-looking statements to reflect events that arise after this presentation. Forward-looking statements |
|
|
2014 Goals How did we perform? |
|
|
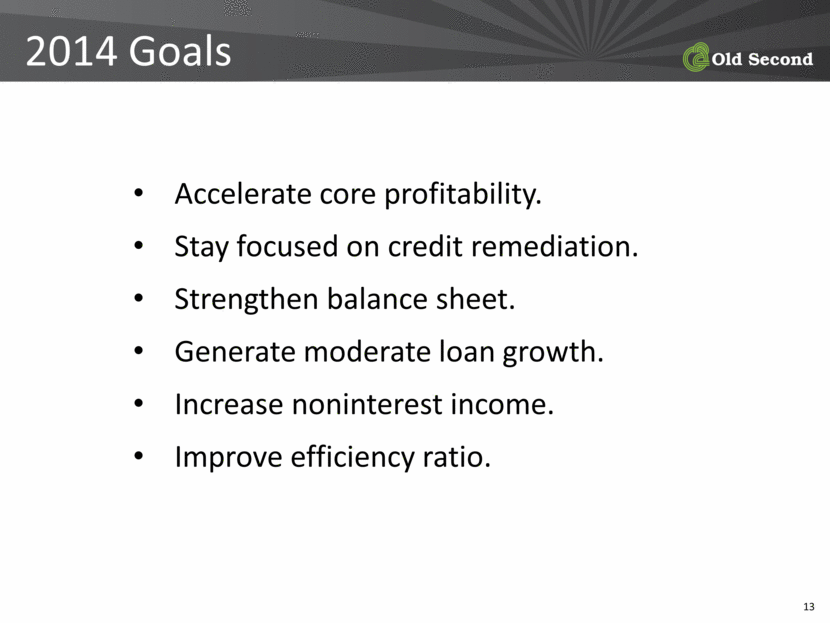
2014 Goals Accelerate core profitability. Stay focused on credit remediation. Strengthen balance sheet. Generate moderate loan growth. Increase noninterest income. Improve efficiency ratio. |
|
|
Goal #1 Accelerate core profitability |
|
|
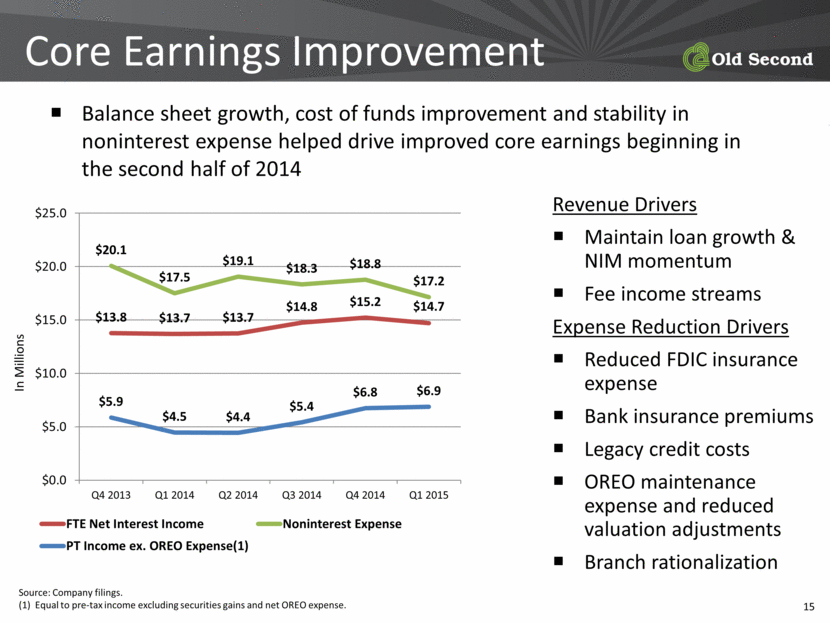
Revenue Drivers Maintain loan growth & NIM momentum Fee income streams Expense Reduction Drivers Reduced FDIC insurance expense Bank insurance premiums Legacy credit costs OREO maintenance expense and reduced valuation adjustments Branch rationalization Balance sheet growth, cost of funds improvement and stability in noninterest expense helped drive improved core earnings beginning in the second half of 2014 Source: Company filings. (1) Equal to pre-tax income excluding securities gains and net OREO expense. Core Earnings Improvement |
|
|
Goal #2 Stay focused on credit remediation |
|
|
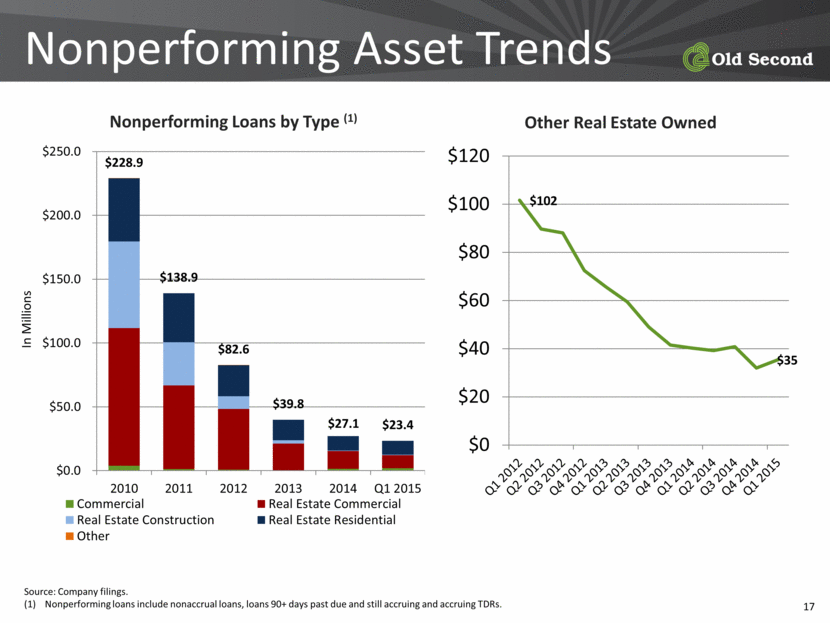
Nonperforming Asset Trends Source: Company filings. Nonperforming loans include nonaccrual loans, loans 90+ days past due and still accruing and accruing TDRs. Nonperforming Loans by Type (1) Other Real Estate Owned $228.9 $138.9 $82.6 $39.8 $27.1 $23.4 $0.0 $50.0 $100.0 $150.0 $200.0 $250.0 2010 2011 2012 2013 2014 Q1 2015 In Millions Commercial Real Estate Commercial Real Estate Construction Real Estate Residential Other $102 $35 $0 $20 $40 $60 $80 $100 $120 Q1 2012 Q2 2012 Q3 2012 Q4 2012 Q1 2013 Q2 2013 Q3 2013 Q4 2013 Q1 2014 Q2 2014 Q3 2014 Q4 2014 Q1 2015 (1) |
|
|
Goal #3 Strengthen balance sheet |
|
|
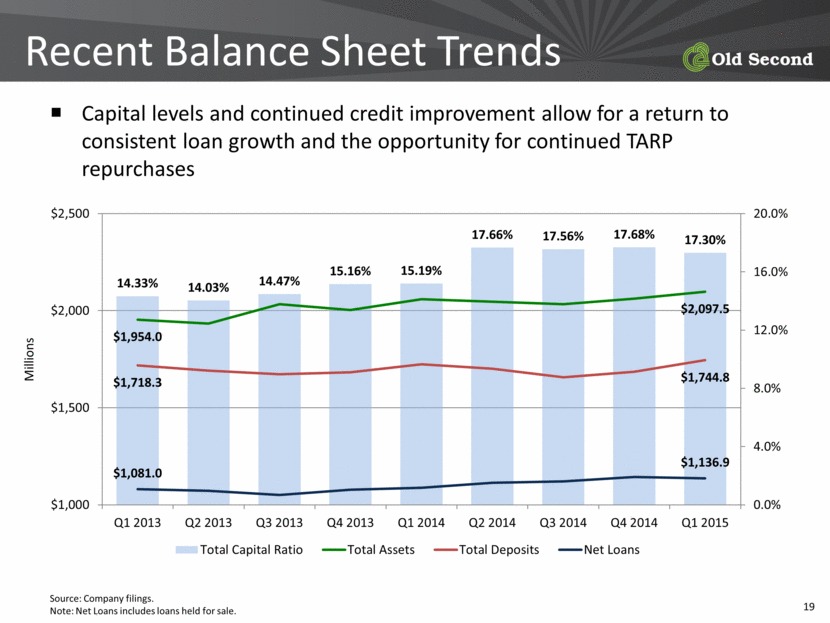
Capital levels and continued credit improvement allow for a return to consistent loan growth and the opportunity for continued TARP repurchases Source: Company filings. Note: Net Loans includes loans held for sale. Recent Balance Sheet Trends 14.33% 14.03% 14.47% 15.16% 15.19% 17.66% 17.56% 17.68% 17.30% $1,954.0 $2,097.5 $1,718.3 $1,744.8 $1,081.0 $1,136.9 0.0% 4.0% 8.0% 12.0% 16.0% 20.0% $1,000 $1,500 $2,000 $2,500 Q1 2013 Q2 2013 Q3 2013 Q4 2013 Q1 2014 Q2 2014 Q3 2014 Q4 2014 Q1 2015 Millions Total Capital Ratio Total Assets Total Deposits Net Loans |
|
|
Goal #4 Generate moderate loan growth |
|
|
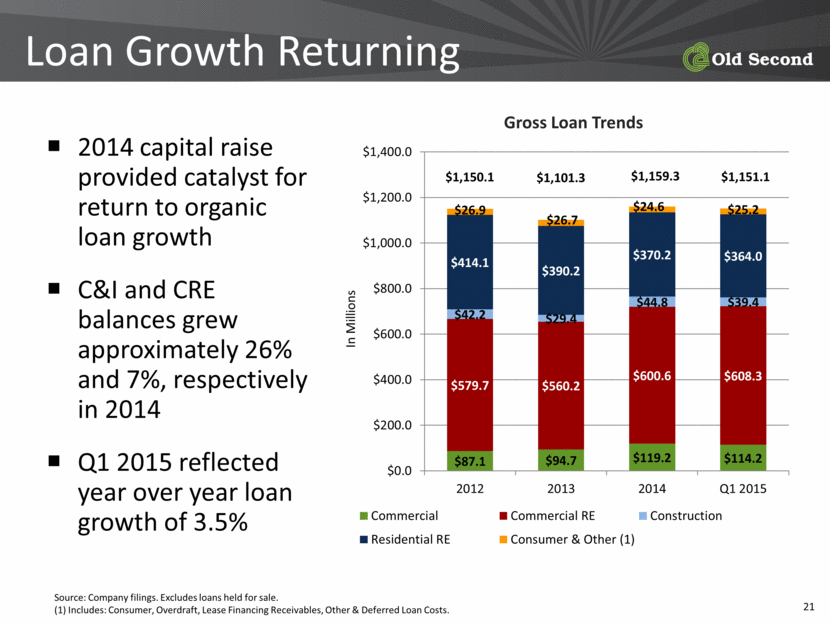
2014 capital raise provided catalyst for return to organic loan growth C&I and CRE balances grew approximately 26% and 7%, respectively in 2014 Q1 2015 reflected year over year loan growth of 3.5% Source: Company filings. Excludes loans held for sale. (1) Includes: Consumer, Overdraft, Lease Financing Receivables, Other & Deferred Loan Costs. Loan Growth Returning Gross Loan Trends $87.1 $94.7 $119.2 $114.2 $579.7 $560.2 $600.6 $608.3 $42.2 $29.4 $44.8 $39.4 $414.1 $390.2 $370.2 $364.0 $26.9 $26.7 $24.6 $25.2 $1,150.1 $1,101.3 $1,159.3 $1,151.1 $0.0 $200.0 $400.0 $600.0 $800.0 $1,000.0 $1,200.0 $1,400.0 2012 2013 2014 Q1 2015 In Millions Commercial Commercial RE Construction Residential RE Consumer & Other (1) |
|
|
Goal #5 Increase noninterest income |
|
|
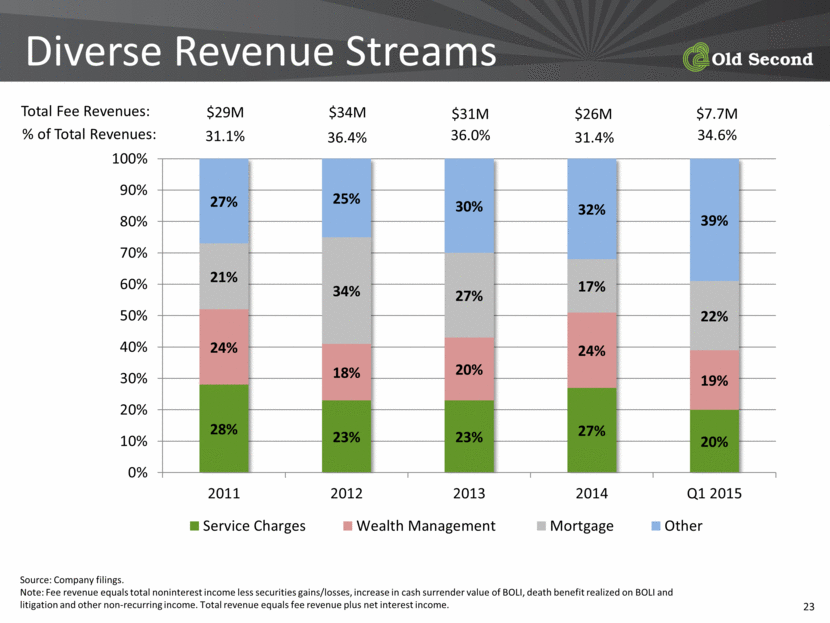
Source: Company filings. Note: Fee revenue equals total noninterest income less securities gains/losses, increase in cash surrender value of BOLI, death benefit realized on BOLI and litigation and other non-recurring income. Total revenue equals fee revenue plus net interest income. Diverse Revenue Streams $29M $34M $31M Total Fee Revenues: 31.1% 36.4% 36.0% % of Total Revenues: $7.7M 34.6% 31.4% $26M 28% 23% 23% 27% 20% 24% 18% 20% 24% 19% 21% 34% 27% 17% 22% 27% 25% 30% 32% 39% 0% 10% 20% 30% 40% 50% 60% 70% 80% 90% 100% 2011 2012 2013 2014 Q1 2015 Service Charges Wealth Management Mortgage Other |
|
|
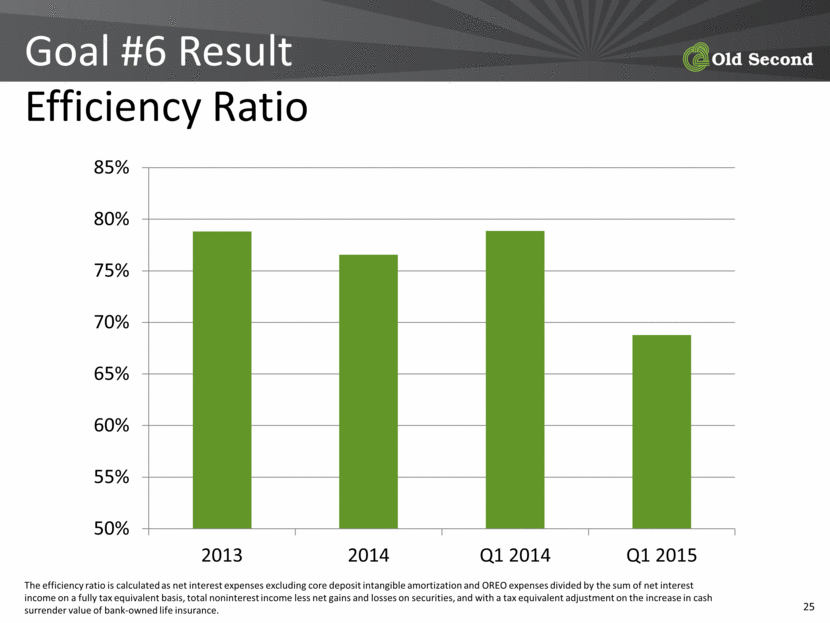
Goal #6 Improve efficiency ratio |
|
|
Goal #6 Result Efficiency Ratio The efficiency ratio is calculated as net interest expenses excluding core deposit intangible amortization and OREO expenses divided by the sum of net interest income on a fully tax equivalent basis, total noninterest income less net gains and losses on securities, and with a tax equivalent adjustment on the increase in cash surrender value of bank-owned life insurance. 50% 55% 60% 65% 70% 75% 80% 85% 2013 2014 Q1 2014 Q1 2015 |
|
|
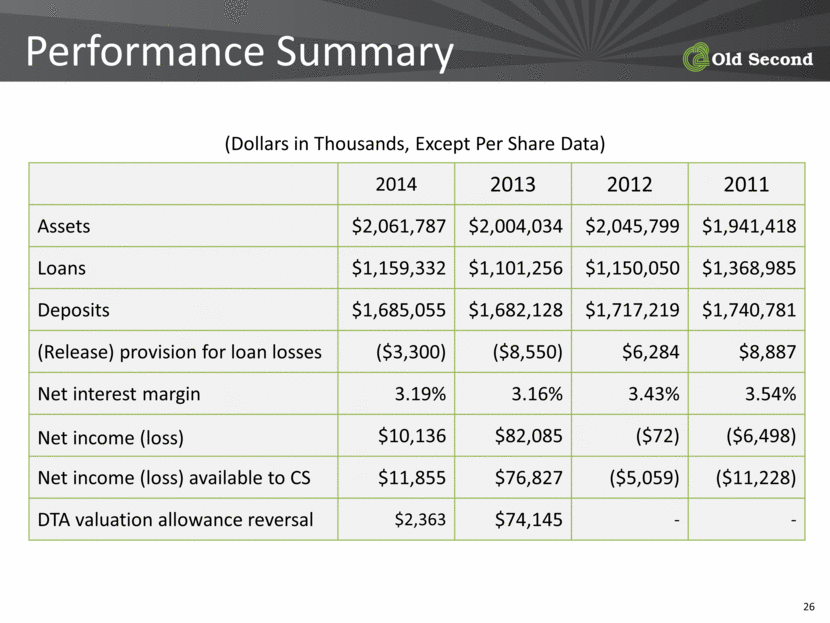
(Dollars in Thousands, Except Per Share Data) 2014 2013 2012 2011 Assets $2,061,787 $2,004,034 $2,045,799 $1,941,418 Loans $1,159,332 $1,101,256 $1,150,050 $1,368,985 Deposits $1,685,055 $1,682,128 $1,717,219 $1,740,781 (Release) provision for loan losses ($3,300) ($8,550) $6,284 $8,887 Net interest margin 3.19% 3.16% 3.43% 3.54% Net income (loss) $10,136 $82,085 ($72) ($6,498) Net income (loss) available to CS $11,855 $76,827 ($5,059) ($11,228) DTA valuation allowance reversal $2,363 $74,145 - - Performance Summary |
|
|
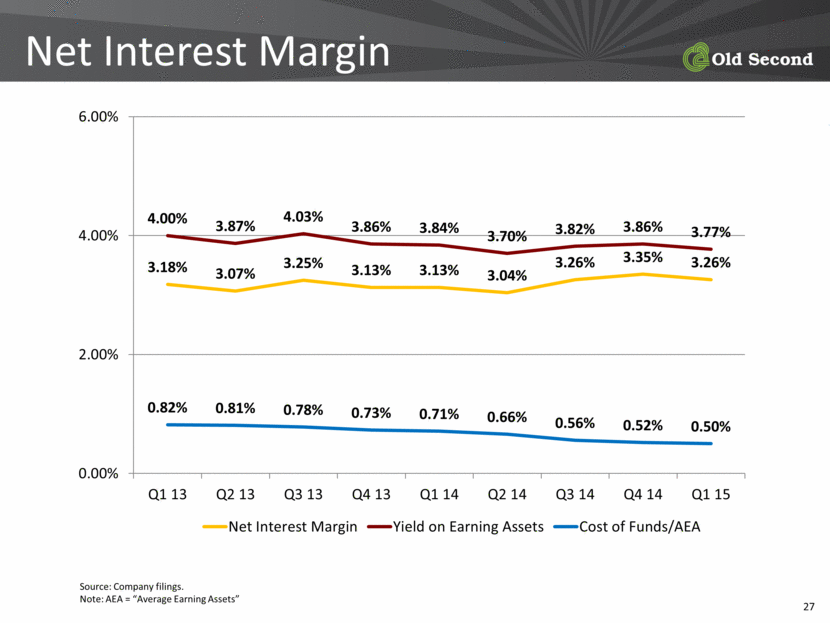
Source: Company filings. Note: AEA = “Average Earning Assets” Net Interest Margin 3.18% 3.07% 3.25% 3.13% 3.13% 3.04% 3.26% 3.35% 3.26% 4.00% 3.87% 4.03% 3.86% 3.84% 3.70% 3.82% 3.86% 3.77% 0.82% 0.81% 0.78% 0.73% 0.71% 0.66% 0.56% 0.52% 0.50% 0.00% 2.00% 4.00% 6.00% Q1 13 Q2 13 Q3 13 Q4 13 Q1 14 Q2 14 Q3 14 Q4 14 Q1 15 Net Interest Margin Yield on Earning Assets Cost of Funds/AEA |
|
|
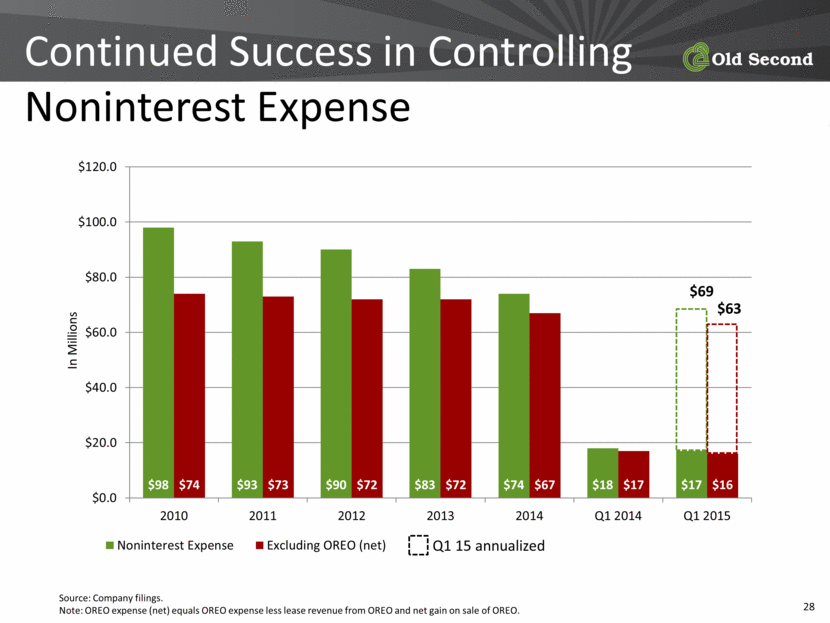
Continued Success in Controlling Noninterest Expense Source: Company filings. Note: OREO expense (net) equals OREO expense less lease revenue from OREO and net gain on sale of OREO. $69 $63 Q1 15 annualized $98 $93 $90 $83 $74 $18 $17 $74 $73 $72 $72 $67 $17 $16 $0.0 $20.0 $40.0 $60.0 $80.0 $100.0 $120.0 2010 2011 2012 2013 2014 Q1 2014 Q1 2015 In Millions Noninterest Expense Excluding OREO (net) |
|
|
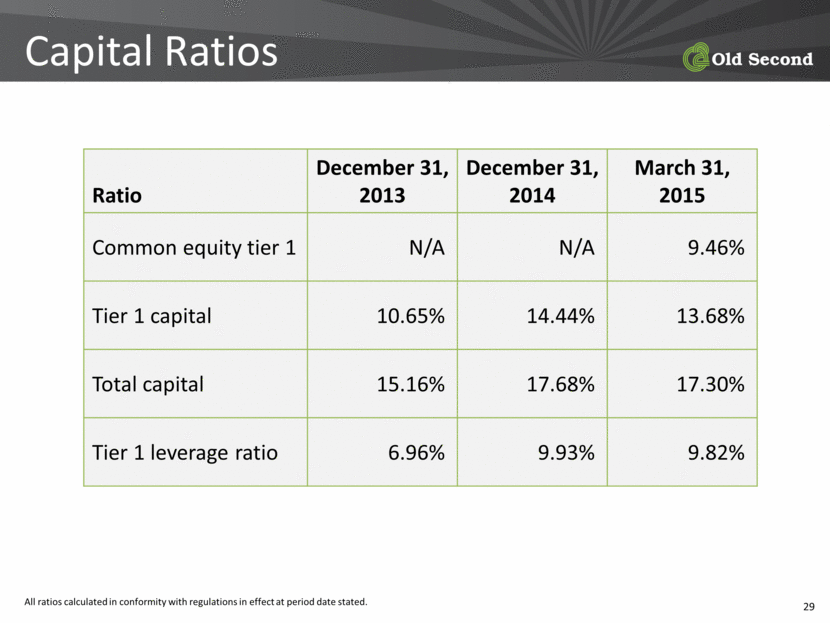
Ratio December 31, 2013 December 31, 2014 March 31, 2015 Common equity tier 1 N/A N/A 9.46% Tier 1 capital 10.65% 14.44% 13.68% Total capital 15.16% 17.68% 17.30% Tier 1 leverage ratio 6.96% 9.93% 9.82% Capital Ratios All ratios calculated in conformity with regulations in effect at period date stated. |
|
|
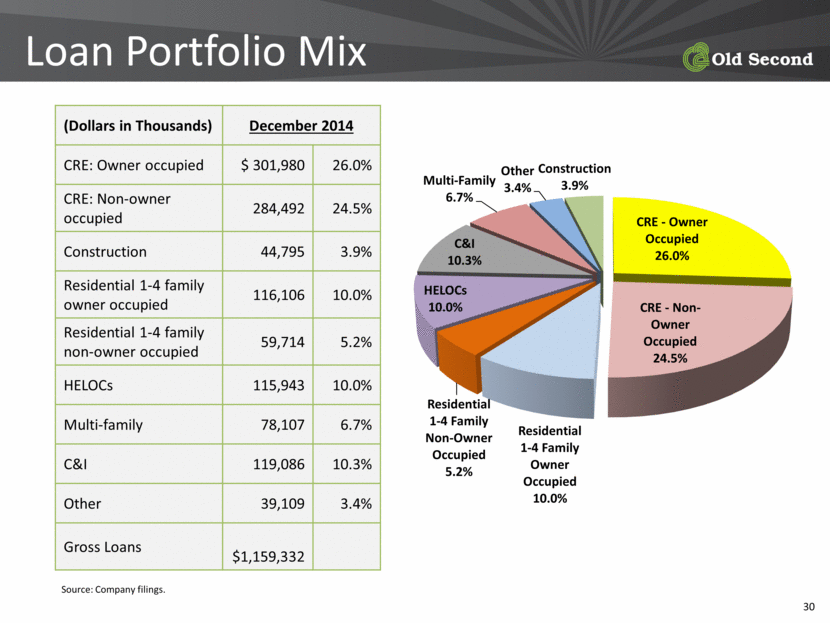
(Dollars in Thousands) December 2014 CRE: Owner occupied $ 301,980 26.0% CRE: Non-owner occupied 284,492 24.5% Construction 44,795 3.9% Residential 1-4 family owner occupied 116,106 10.0% Residential 1-4 family non-owner occupied 59,714 5.2% HELOCs 115,943 10.0% Multi-family 78,107 6.7% C&I 119,086 10.3% Other 39,109 3.4% Gross Loans $1,159,332 Source: Company filings. Loan Portfolio Mix CRE - Owner Occupied 26.0% CRE - Non - Owner Occupied 24.5% Residential 1 - 4 Family Owner Occupied 10.0% Residential 1 - 4 Family Non - Owner Occupied 5.2% HELOCs 10.0% C&I 10.3% Multi - Family 6.7% Other 3.4% Construction 3.9% |
|
|
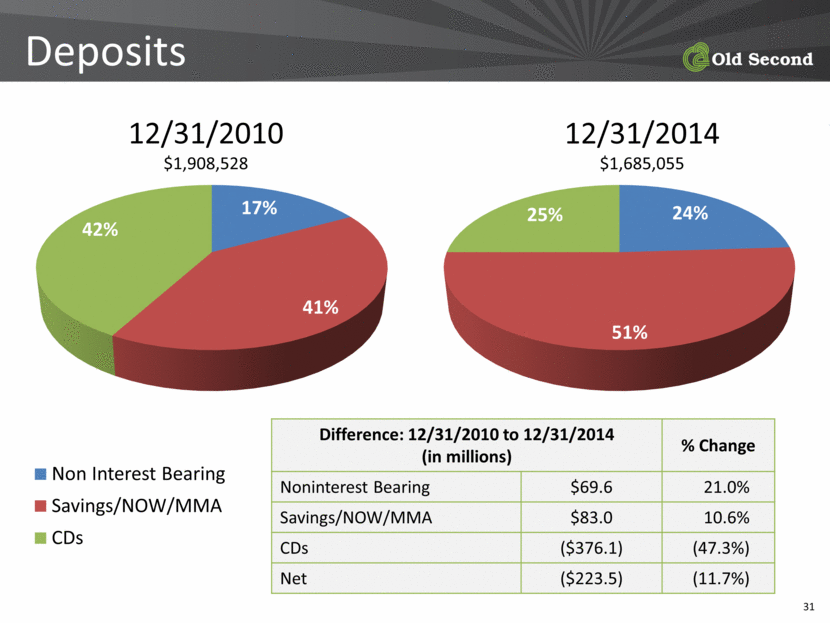
12/31/2010 $1,908,528 12/31/2014 $1,685,055 Difference: 12/31/2010 to 12/31/2014 (in millions) % Change Noninterest Bearing $69.6 21.0% Savings/NOW/MMA $83.0 10.6% CDs ($376.1) (47.3%) Net ($223.5) (11.7%) Deposits Non Interest Bearing Savings/NOW/MMA CDs 17% 41% 42% 24% 51% 25% |
|
|
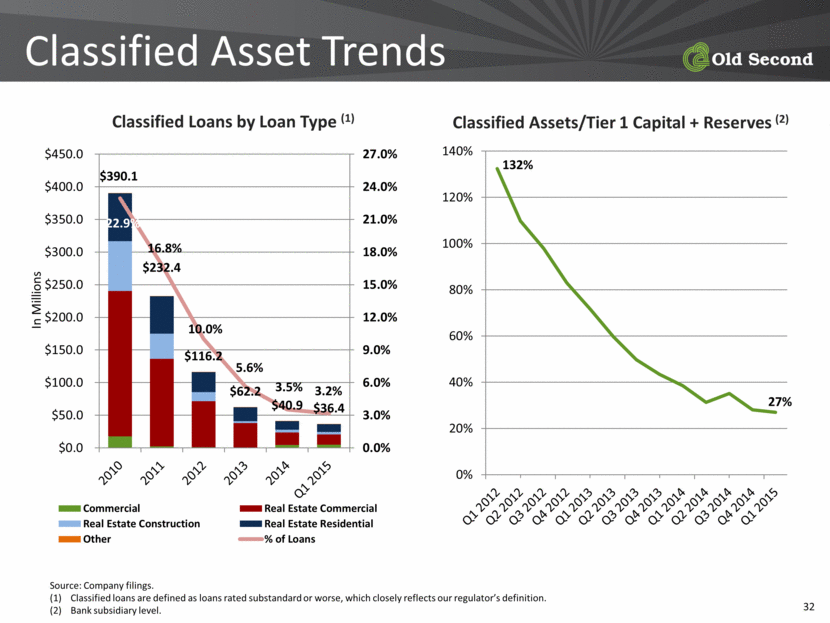
Source: Company filings. Classified loans are defined as loans rated substandard or worse, which closely reflects our regulator’s definition. Bank subsidiary level. Classified Asset Trends Classified Loans by Loan Type (1) Classified Assets/Tier 1 Capital + Reserves (2) 132% 27% 0% 20% 40% 60% 80% 100% 120% 140% |
|
|
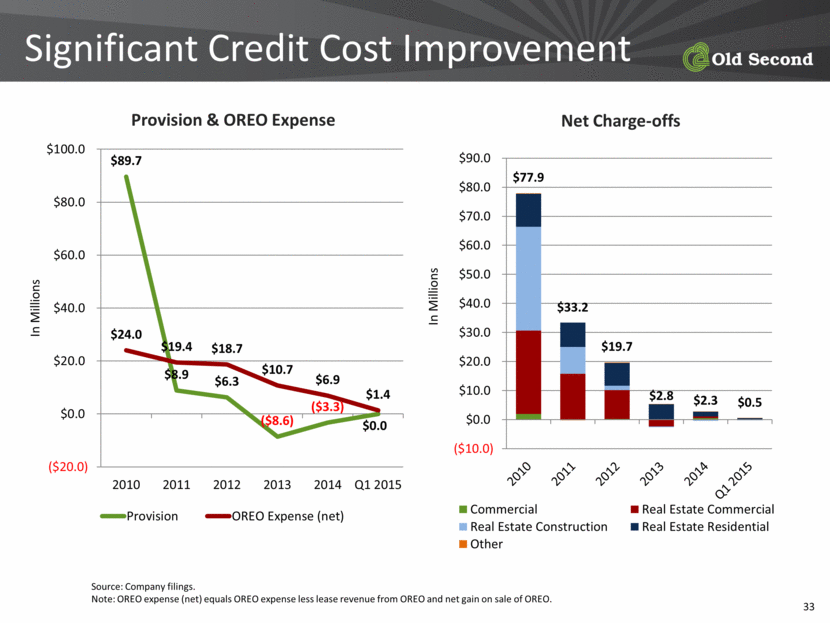
Source: Company filings. Note: OREO expense (net) equals OREO expense less lease revenue from OREO and net gain on sale of OREO. Significant Credit Cost Improvement Provision & OREO Expense Net Charge-offs $77.9 $33.2 $19.7 $2.8 $2.3 $0.5 ($10.0) $0.0 $10.0 $20.0 $30.0 $40.0 $50.0 $60.0 $70.0 $80.0 $90.0 In Millions Commercial Real Estate Commercial Real Estate Construction Real Estate Residential Other $89.7 $8.9 $6.3 ($8.6) ($3.3) $0.0 $24.0 $19.4 $18.7 $10.7 $6.9 $1.4 ($20.0) $0.0 $20.0 $40.0 $60.0 $80.0 $100.0 2010 2011 2012 2013 2014 Q1 2015 In Millions Provision OREO Expense (net) |
|
|
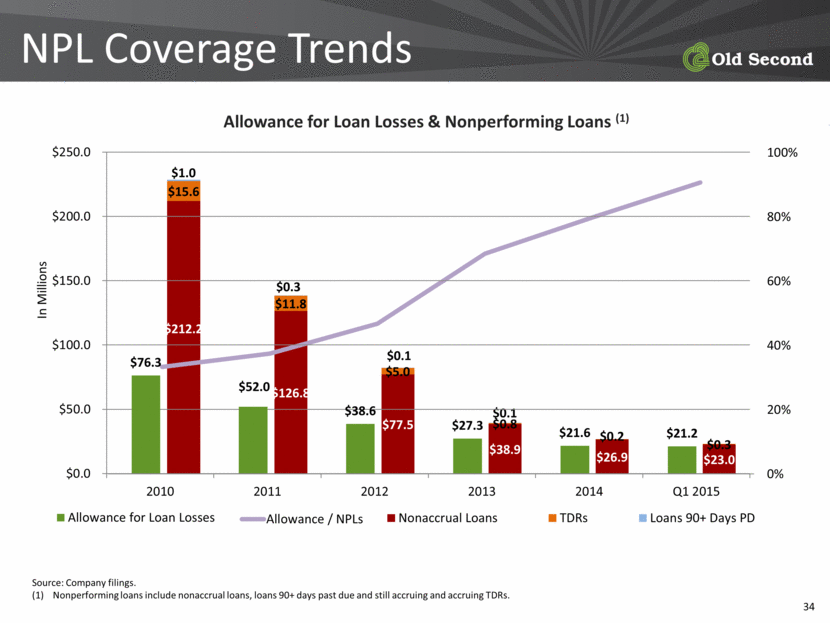
NPL Coverage Trends Source: Company filings. Nonperforming loans include nonaccrual loans, loans 90+ days past due and still accruing and accruing TDRs. Allowance for Loan Losses & Nonperforming Loans (1) $212.2 $126.8 $77.5 $38.9 $26.9 $23.0 $15.6 $11.8 $5.0 $0.8 $0.2 $0.3 $1.0 $0.3 $0.1 $0.1 Nonaccrual Loans TDRs Loans 90+ Days PD 0% 20% 40% 60% 80% 100% Allowance / NPLs $76.3 $52.0 $38.6 $27.3 $21.6 $21.2 $0.0 $50.0 $100.0 $150.0 $200.0 $250.0 2010 2011 2012 2013 2014 Q1 2015 In Millions Allowance for Loan Losses |
|
|
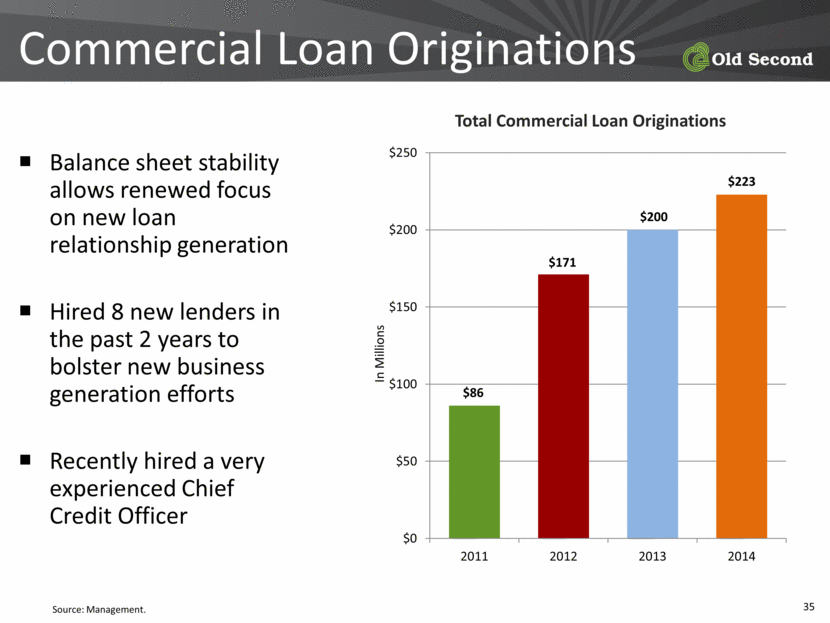
Commercial Loan Originations Balance sheet stability allows renewed focus on new loan relationship generation Hired 8 new lenders in the past 2 years to bolster new business generation efforts Recently hired a very experienced Chief Credit Officer Source: Management. Total Commercial Loan Originations $86 $171 $200 $223 $0 $50 $100 $150 $200 $250 2011 2012 2013 2014 In Millions |
|
|
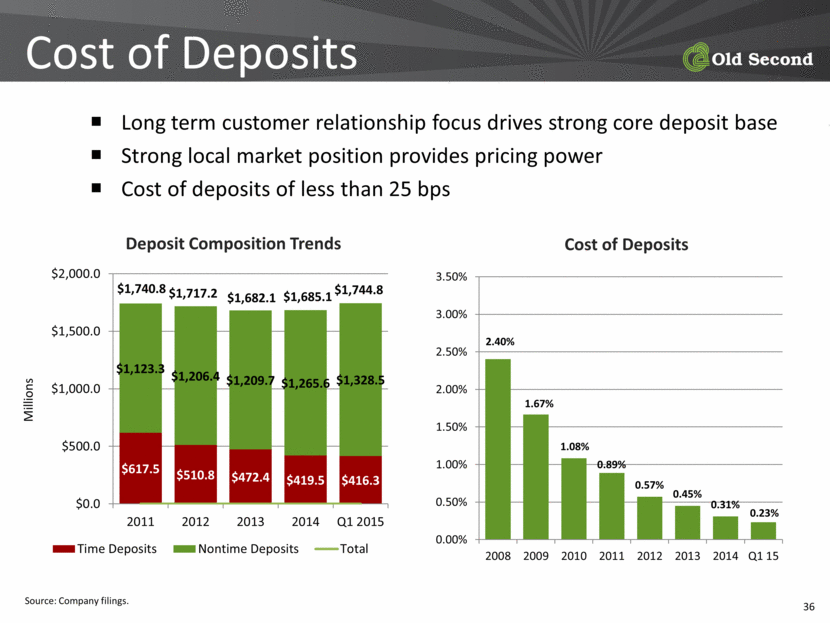
Cost of Deposits Long term customer relationship focus drives strong core deposit base Strong local market position provides pricing power Cost of deposits of less than 25 bps Source: Company filings. Deposit Composition Trends Cost of Deposits 2.40% 1.67% 1.08% 0.89% 0.57% 0.45% 0.31% 0.23% 0.00% 0.50% 1.00% 1.50% 2.00% 2.50% 3.00% 3.50% 2008 2009 2010 2011 2012 2013 2014 Q1 15 $617.5 $510.8 $472.4 $419.5 $416.3 $1,123.3 $1,206.4 $1,209.7 $1,265.6 $1,328.5 $1,740.8 $1,717.2 $1,682.1 $1,685.1 $1,744.8 $0.0 $500.0 $1,000.0 $1,500.0 $2,000.0 2011 2012 2013 2014 Q1 2015 Millions Time Deposits Nontime Deposits Total |
|
|
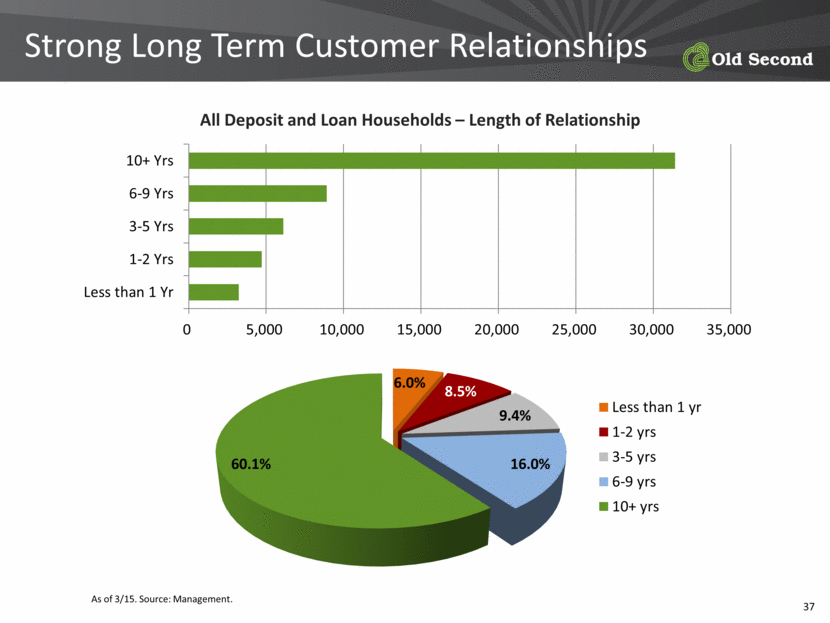
As of 3/15. Source: Management. Strong Long Term Customer Relationships All Deposit and Loan Households – Length of Relationship 0 5,000 10,000 15,000 20,000 25,000 30,000 35,000 Less than 1 Yr 1-2 Yrs 3-5 Yrs 6-9 Yrs 10+ Yrs 6.0% 8.5% 9.4% 16.0% 60.1% Less than 1 yr 1-2 yrs 3-5 yrs 6-9 yrs 10+ yrs |
|
|
2015 Objectives Generate moderate loan growth Improve efficiency Accelerate core profitability improvement Increase fee income streams Continue TARP repurchase transactions Remain focused on credit remediation |
|
|
Right size community banking franchise Strong market share in premier Chicagoland markets Attractive, long-term core deposit franchise Strong, profitable Wealth Management Group with >$1 billion in assets under management Greatly improved credit metrics Increased loan production and continued loan growth Profitable Residential Banking division Improving core profitability TARP repurchases boosting net income to common Investment Highlights |
|
|
Thank you for your attendance |