Attached files
| file | filename |
|---|---|
| 8-K - 8-K - GENOCEA BIOSCIENCES, INC. | a15-12267_18k.htm |
| EX-99.1 - EX-99.1 - GENOCEA BIOSCIENCES, INC. | a15-12267_1ex99d1.htm |
Exhibit 99.2
|
|
GEN-003 Immunotherapy for Genital Herpes Phase 2 Dose Optimization Study Top Line Results Immediate post dosing observation period 20 May 2015 |
|
|
Safe Harbor Statement This presentation contains “forward-looking” statements that are within the meaning of federal securities laws and are based on our management’s beliefs and assumptions and on information currently available to management. Forward-looking statements include information concerning our possible or assumed future results of operations, business strategies, financing plans, competitive position, industry environment, potential growth opportunities, potential market opportunities and the effects of competition. Forward-looking statements include all statements that are not historical facts and can be identified by terms such as “anticipates,” “believes,” “could,” “seeks,” “estimates,” “intends,” “may,” “plans,” “potential,” “predicts,” “projects,” “should,” “will,” “would” or similar expressions and the negatives of those terms. Forward-looking statements represent our management’s beliefs and assumptions only as of the date of this presentation. Our operations involve risks and uncertainties, many of which are outside our control, and any one of which, or combination of which, could materially affect our results of operations and whether the forward-looking statements ultimately prove to be correct. Factors that may materially affect our results of operations include, among other things, those listed in our Annual Report on Form 10-K and other filings with the Securities and Exchange Commission (“SEC”). Except as required by law, we assume no obligation to update these forward-looking statements publicly, or to update the reasons actual results could differ materially from those anticipated in the forward-looking statements, even if new information becomes available in the future. You may get copies of our Annual Report on Form 10-K, Quarterly Report on Form 10-Q and our other SEC filings for free by visiting EDGAR on the SEC website at http://www.sec.gov. 2 |
|
|
Agenda for Today’s Call Market potential for GEN-003 Phase 2 dose optimization trial Study design Top line data Dose selection Physician perspective – Dr. Peter A. Leone Development path to Phase 3 Conclusions Q&A 3 |
|
|
The Need for GEN-003 Drives Large Market Opportunity Genital herpes characterized by viral shedding, leading to disease transmission and genital lesions Oral antiviral therapy insufficient for millions Viral shedding reduced only when patients are taking medication but most use episodically Outbreaks still occur even on chronic therapy GEN-003 designed using ATLAS to direct T and B cells to fight infection by reducing viral activity GEN-003 product profile drives revenue opportunity of >$1bn in US alone 4 |
|
|
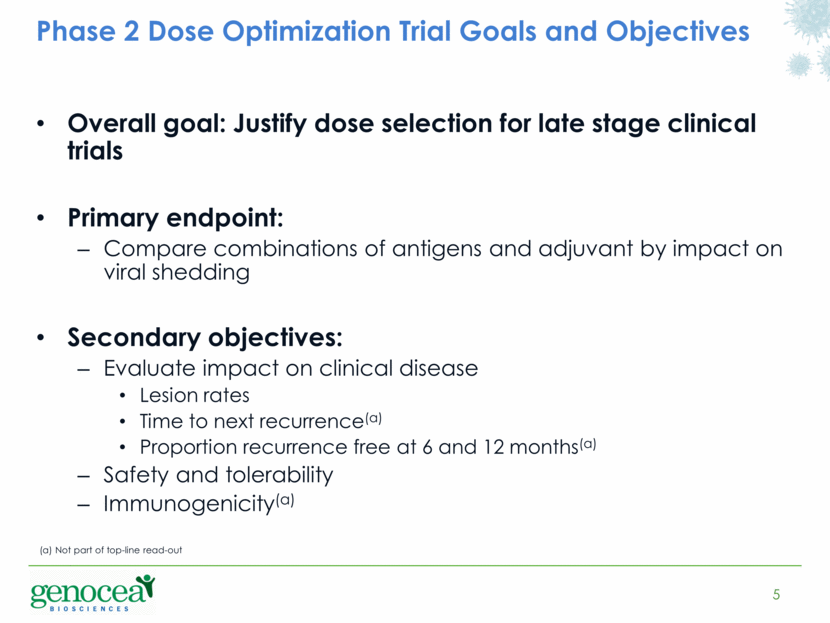
Phase 2 Dose Optimization Trial Goals and Objectives Overall goal: Justify dose selection for late stage clinical trials Primary endpoint: Compare combinations of antigens and adjuvant by impact on viral shedding Secondary objectives: Evaluate impact on clinical disease Lesion rates Time to next recurrence(a) Proportion recurrence free at 6 and 12 months(a) Safety and tolerability Immunogenicity(a) 5 (a) Not part of top-line read-out |
|
|
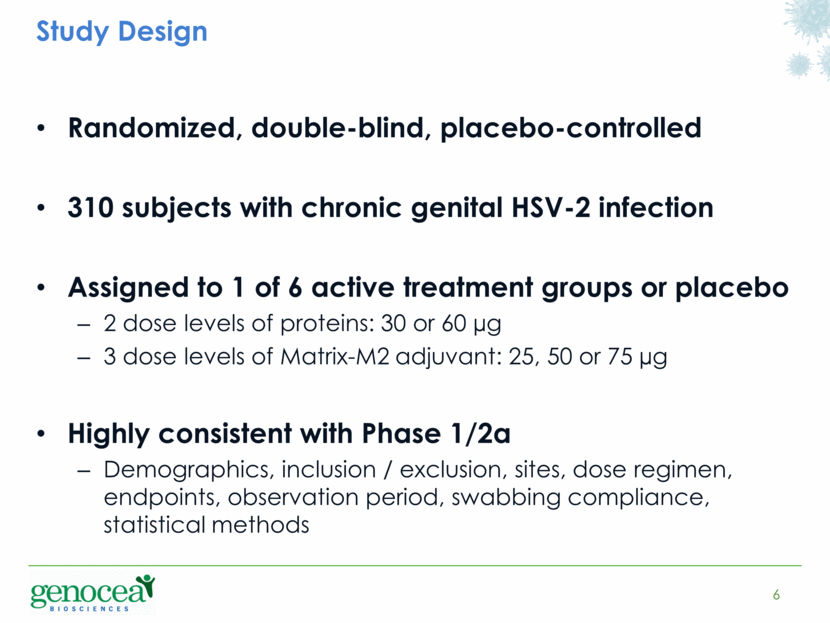
Study Design Randomized, double-blind, placebo-controlled 310 subjects with chronic genital HSV-2 infection Assigned to 1 of 6 active treatment groups or placebo 2 dose levels of proteins: 30 or 60 µg 3 dose levels of Matrix-M2 adjuvant: 25, 50 or 75 µg Highly consistent with Phase 1/2a Demographics, inclusion / exclusion, sites, dose regimen, endpoints, observation period, swabbing compliance, statistical methods 6 |
|
|
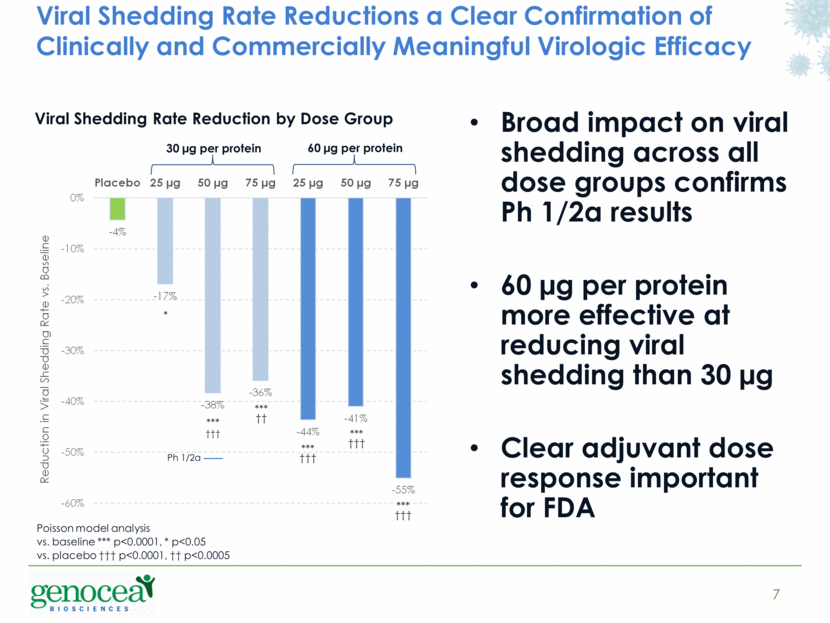
Viral Shedding Rate Reductions a Clear Confirmation of Clinically and Commercially Meaningful Virologic Efficacy 7 Broad impact on viral shedding across all dose groups confirms Ph 1/2a results 60 µg per protein more effective at reducing viral shedding than 30 µg Clear adjuvant dose response important for FDA 30 µg per protein Viral Shedding Rate Reduction by Dose Group 60 µg per protein Ph 1/2a *** ††† *** ††† *** ††† *** ††† *** †† * Poisson model analysis vs. baseline *** p<0.0001, * p<0.05 vs. placebo ††† p<0.0001, †† p<0.0005 - 4% - 17% - 38% - 36% - 44% - 41% - 55% -60% -50% -40% -30% -20% -10% 0% Placebo 25 µg 50 µg 75 µg 25 µg 50 µg 75 µg Reduction in Viral Shedding Rate vs. Baseline |
|
|
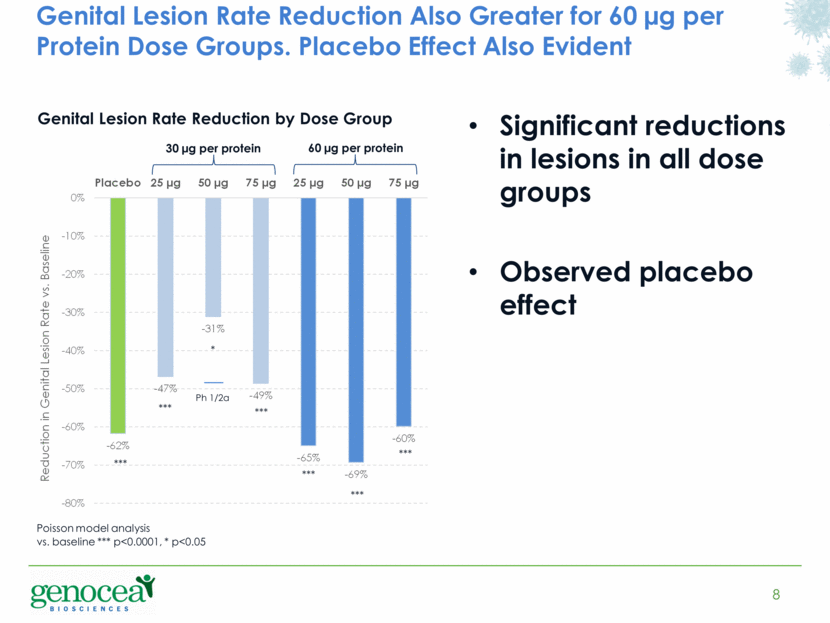
Genital Lesion Rate Reduction Also Greater for 60 µg per Protein Dose Groups. Placebo Effect Also Evident 8 Significant reductions in lesions in all dose groups Observed placebo effect 30 µg per protein Genital Lesion Rate Reduction by Dose Group 60 µg per protein Ph 1/2a *** *** *** * *** *** *** Poisson model analysis vs. baseline *** p<0.0001, * p<0.05 - 62% - 47% - 31% - 49% - 65% - 69% - 60% -80% -70% -60% -50% -40% -30% -20% -10% 0% Placebo 25 µg 50 µg 75 µg 25 µg 50 µg 75 µg Reduction in Genital Lesion Rate vs. Baseline |
|
|
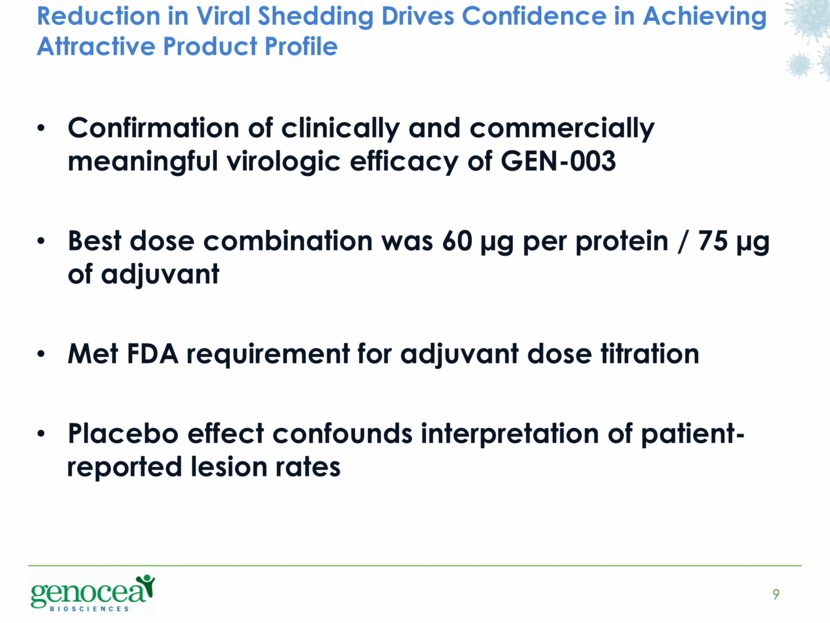
Reduction in Viral Shedding Drives Confidence in Achieving Attractive Product Profile Confirmation of clinically and commercially meaningful virologic efficacy of GEN-003 Best dose combination was 60 µg per protein / 75 µg of adjuvant Met FDA requirement for adjuvant dose titration Placebo effect confounds interpretation of patient-reported lesion rates 9 |
|
|
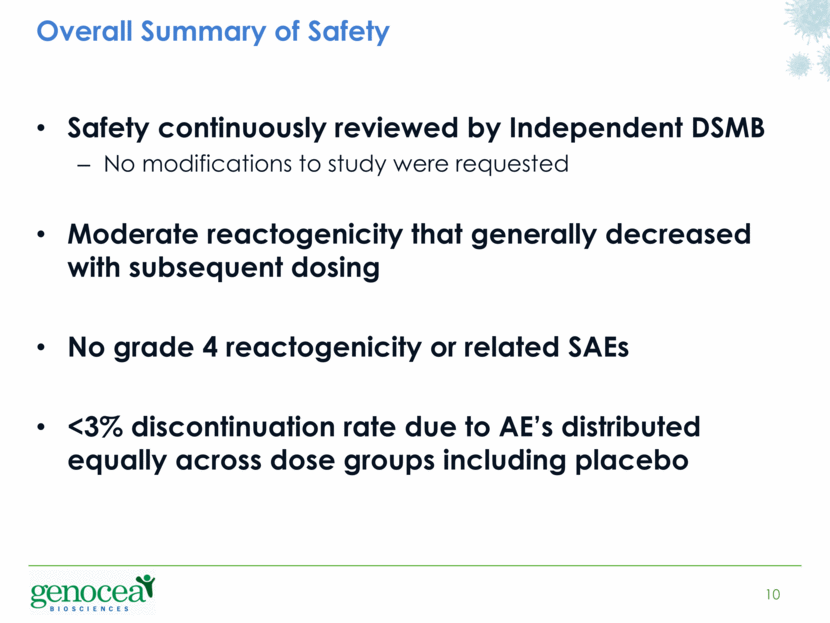
Overall Summary of Safety Safety continuously reviewed by Independent DSMB No modifications to study were requested Moderate reactogenicity that generally decreased with subsequent dosing No grade 4 reactogenicity or related SAEs <3% discontinuation rate due to AE’s distributed equally across dose groups including placebo 10 |
|
|
GEN-003 Physician Perspective Dr. Peter A. Leone Professor of Medicine and Adjunct Professor of Epidemiology at the University of North Carolina 11 |
|
|
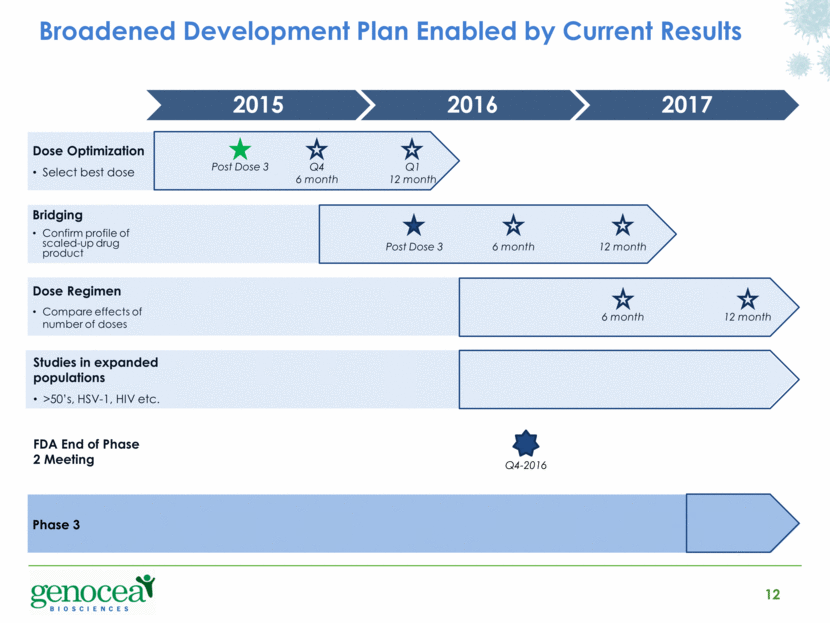
Broadened Development Plan Enabled by Current Results 12 2016 2015 Post Dose 3 Q4 6 month Q1 12 month Q4-2016 2017 Post Dose 3 6 month 12 month Dose Optimization Select best dose Bridging Confirm profile of scaled-up drug product 6 month 12 month Dose Regimen Compare effects of number of doses Studies in expanded populations >50’s, HSV-1, HIV etc. Phase 3 FDA End of Phase 2 Meeting |
|
|
Conclusions 13 GEN-003 continues to lead with a strengthened product profile Optimal dose identified and justified Reinforces confidence in >$1bn revenue opportunity for GEN-003 in US alone Clear path to FDA End of Phase 2 meeting next year and initiation of Phase 3 in 2017 |
|
|
Questions & Answers 14 |
|
|
Jonathan Poole Chief Financial Officer Phone: +1 617-876-8191 jonathan.poole@genocea.com Megan Lustig Spectrum Science Communications Phone: +1 202-955-6222 mlustig@spectrumscience.com Investor inquiries: Media inquiries: |

