Attached files
| file | filename |
|---|---|
| 8-K - FORM 8-K - Arc Logistics Partners LP | d929663d8k.htm |
Exhibit 99.1
|
|
Arc Logistics Partners LP Investor Presentation
May 2015
|
|
Cautionary Note
[Graphic Appears Here]
Forward Looking Statements
Certain statements and information in this presentation may constitute “forward-looking statements.” Certain expressions including “believe,” “intends,” “expect,” or other similar expressions are intended to identify Arc Logistics Partners LP (the “Partnership”) current expectations, opinions, views or beliefs concerning future developments and their potential effect on the Partnership. While management believes that these forward-looking statements are reasonable when made, there canbenoassurance that future developments affecting the Partnership will be those that it anticipates. The forward-looking statements involve significant risks and uncertainties (some of which are beyond the Partnership’s control) and assumptions that could cause actual results to differ materially from the Partnership’s historical experience and its present expectations or projections. Important factors that could cause actual results to differ materially from forward looking statements include but are not limited to: (i) adverse economic, capital markets and political conditions; (ii) changes in the marketplace for the Partnership’s services; (iii) changes in supply and demand of crude oil and petroleum products; (iv) actions and performance of the Partnership’s customers, vendors or competitors; (v) changes in the cost of or availability of capital; (vi) unanticipated capital expenditures in connection with the construction, repair, or replacement of the Partnership’s assets; (vii) operating hazards, unforeseen weather events or matters beyond the Partnership’s control; (viii) inability to consummate acquisitions, pending or otherwise, on acceptable terms and successfully integrate acquired businesses into the Partnership’s operations; (ix) effects of existing and future laws or governmental regulations; and (x) litigation. Additional information concerning these and other factors that could cause the Partnership’s actual results to differ from projected results can be found in the Partnership’s public periodic filings with the Securities and Exchange Commission, including the Partnership’s Annual Report on Form 10-K for the year ended December 31, 2014 and any updates thereto in the Partnership’s subsequent quarterly reports on Form 10-Q and current reports on Form 8-K. Readers are cautioned not to place undue reliance on forward-looking statements, which speak only as of the date of this presentation. The Partnership undertakes no obligation to publicly update or revise any forward-looking statements after the date they are made, whether as a result of new information, future events or otherwise.
Non-GAAP Financial Measures
The Partnership defines Adjusted EBITDA as net income before interest expense, income taxes and depreciation and amortization expense, as further adjusted for other non-cash charges and other charges that are not reflective of our ongoing operations. Adjusted EBITDA is a non-GAAP financial measure that management and external users of the Partnership’s consolidated financial statements, such as industry analysts, investors, lenders and rating agencies may use to assess (i) the performance of the Partnership’s assets without regard to the impact of financing methods, capital structure or historical cost basis of the Partnership’s assets; (ii) the viability of capital expenditure projects and the overall rates of return on alternative investment opportunities; (iii) the Partnership’s ability to make distributions; (iv) the Partnership’s ability to incur and service debt and fund capital expenditures; and (v) the Partnership’s ability to incur additional expenses. The Partnership believes that the presentation of Adjusted EBITDA provides useful information to investors in assessing its financial condition and results of operations.
The Partnership defines distributable cash flow as Adjusted EBITDA less (i) cash interest expense paid; (ii) cash income taxes paid; (iii) maintenance capital expenditures paid; and (iv) equity earnings from the Partnership’s interests in Gulf LNG Holdings Group, LLC (the “LNG Interest”); plus (v) cash distributions from the LNG Interest. Distributable cash flow is a non-GAAP financial measure that management and external users of the Partnership’s consolidated financial statements may use to evaluate whether the Partnership is generating sufficient cash flow to support distributions to its unitholders as well as measure the ability of the Partnership’s assets to generate cash sufficient to support its indebtedness and maintain its operations.
The GAAP measure most directly comparable to Adjusted EBITDA and distributable cash flow is net income. Adjusted EBITDA and distributable cash flow should not be considered as an alternative to net income. Adjusted EBITDA and distributable cash flow have important limitations as analytical tools because they exclude some but not all items that affect net income. Readers should not consider Adjusted EBITDA or distributable cash flow in isolation or as a substitute for analysis of the Partnership’s results as reported under GAAP. Additionally, because Adjusted EBITDA and distributable cash flow may be defined differently by other companies in the Partnership’s industry, its definitions of Adjusted EBITDA and distributable cash flow may not be comparable to similarly titled measures of other companies, thereby diminishing their utility. Please see the reconciliation of net income to Adjusted EBITDA and distributable cash flow in the accompanying tables.
2
|
|
Arc Logistics Overview
[Graphic Appears Here]
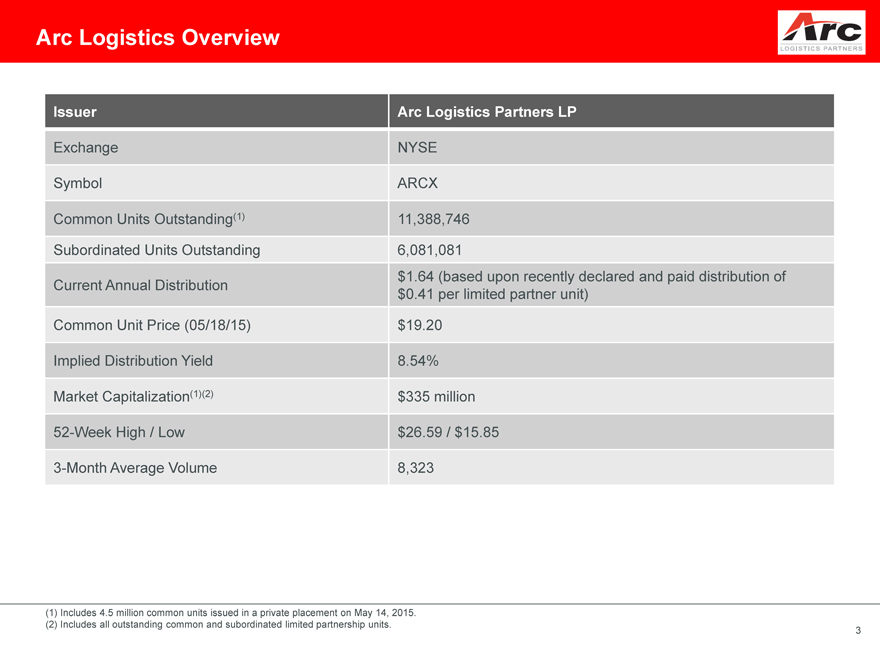
Issuer Arc Logistics Partners LP
Exchange NYSE
Symbol ARCX
Common Units Outstanding(1) 11,388,746
Subordinated Units Outstanding 6,081,081
Current Annual Distribution $1.64 (based upon recently declared and paid distribution of
$0.41 per limited partner unit)
Common Unit Price (05/18/15) $19.20
Implied Distribution Yield 8.54%
Market Capitalization(1)(2) $335 million
52-Week High / Low $26.59 / $15.85
3-Month Average Volume 8,323
(1) Includes 4.5 million common units issued in a private placement on May 14, 2015.
(2) Includes all outstanding common and subordinated limited partnership units. 3
|
|
Arc Logistics Overview
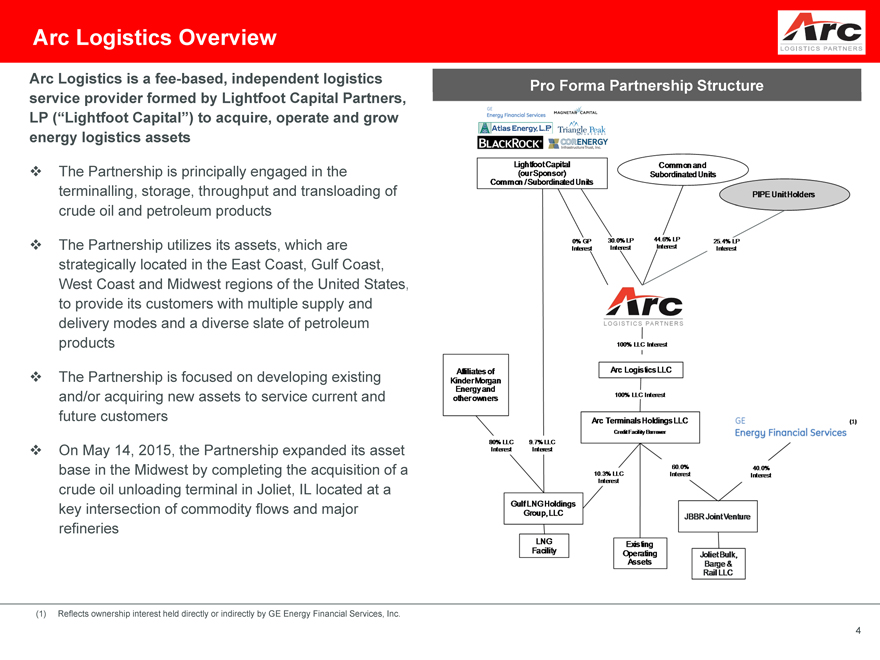
Arc Logistics is a fee-based, independent logistics Pro Forma Partnership Structure
service provider formed by Lightfoot Capital Partners,
LP (“Lightfoot Capital”) to acquire, operate and grow
energy logistics assets
[Graphic Appears Here]
The Partnership is principally engaged in the
terminalling, storage, throughput and transloading of
crude oil and petroleum products
The Partnership utilizes its assets, which are
strategically located in the East Coast, Gulf Coast,
West Coast and Midwest regions of the United States,
to provide its customers with multiple supply and
delivery modes and a diverse slate of petroleum
products
The Partnership is focused on developing existing
and/or acquiring new assets to service current and
future customers
On May 14, 2015, the Partnership expanded its asset
base in the Midwest by completing the acquisition of a
crude oil unloading terminal in Joliet, IL located at a
key intersection of commodity flows and major
refineries
(1) Reflects ownership interest held directly or indirectly by GE Energy Financial Services, Inc.
4
|
|
Investment Highlights
[Graphic Appears Here]
Arc Logistics Partners LP is a fee-based, growth-oriented, independent logistics service provider
Diversified and well positioned asset portfolio to capitalize on organic and third party growth opportunities
Stable and predictable cash flow profile
Customer driven, attractive and visible growth opportunities
Supportive sponsor group with energy industry expertise and access to capital and investment opportunities
Financial flexibility to achieve near and long-term opportunities
Experienced management team with a proven track record of growing the business
5
|
|
Growth-Oriented Partnership
[Graphic Appears Here]
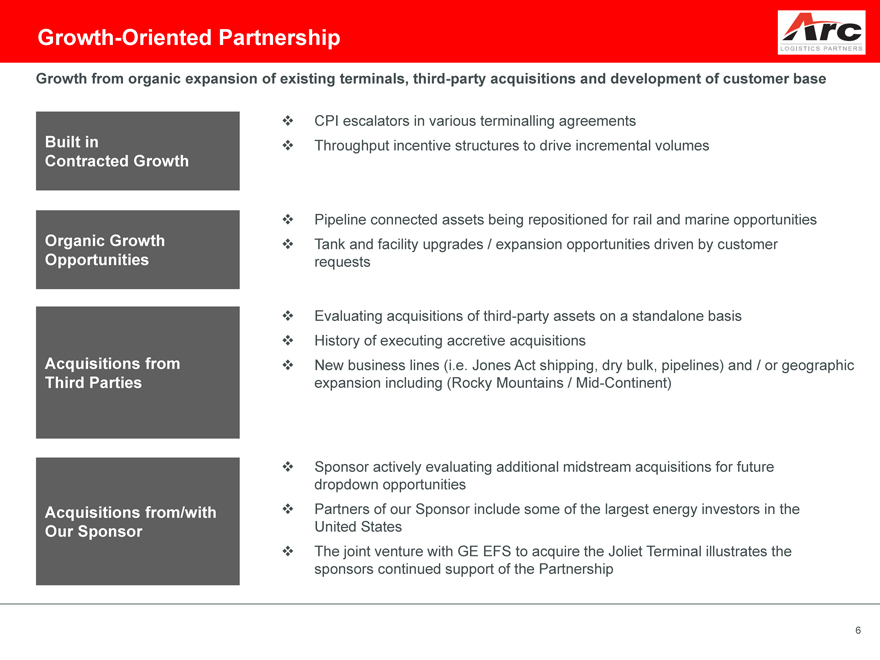
Growth from organic expansion of existing terminals, third-party acquisitions and development of customer base
Built in Contracted Growth
Organic Growth Opportunities
Acquisitions from Third Parties
Acquisitions from/with Our Sponsor
CPI escalators in various terminalling agreements
Throughput incentive structures to drive incremental volumes
Pipeline connected assets being repositioned for rail and marine opportunities
Tank and facility upgrades / expansion opportunities driven by customer
requests
Evaluating acquisitions of third-party assets on a standalone basis
History of executing accretive acquisitions
New business lines (i.e. Jones Act shipping, dry bulk, pipelines) and / or geographic
expansion including (Rocky Mountains / Mid-Continent)
Sponsor actively evaluating additional midstream acquisitions for future
dropdown opportunities
Partners of our Sponsor include some of the largest energy investors in the
United States
The joint venture with GE EFS to acquire the Joliet Terminal illustrates the
sponsors continued support of the Partnership
6
|
|
Contracted, Stable Cash Flow Profile
[Graphic Appears Here]
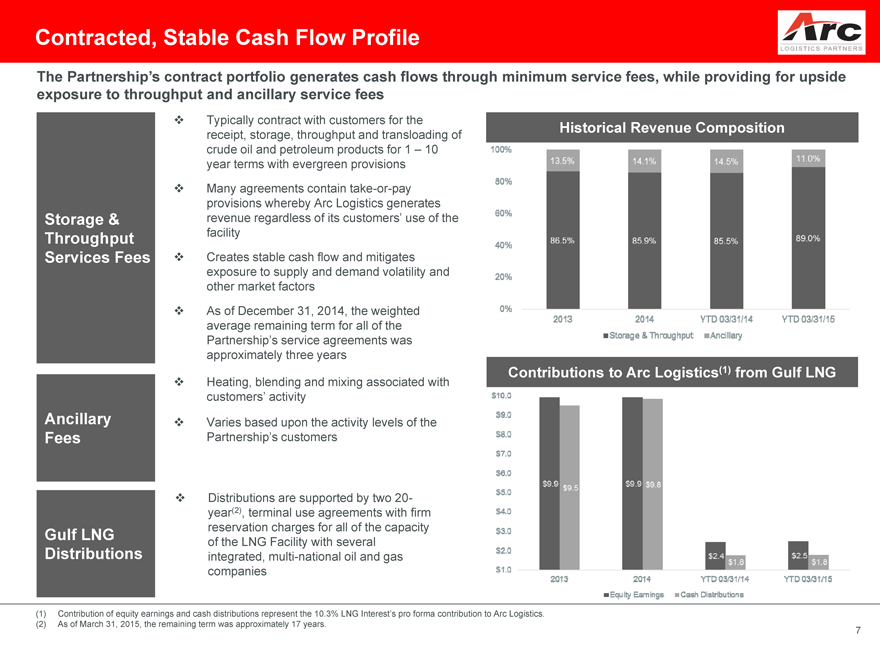
The Partnership’s contract portfolio generates cash flows through minimum service fees, while providing for upside exposure to throughput and ancillary service fees
Typically contract with customers for the
receipt, storage, throughput and transloading of Historical Revenue Composition
crude oil and petroleum products for 1 – 10
year terms with evergreen provisions
Many agreements contain take-or-pay
provisions whereby Arc Logistics generates
Storage & revenue regardless of its customers’ use of the
Throughput facility
Services Fees Creates stable cash flow and mitigates
exposure to supply and demand volatility and
other market factors
As of December 31, 2014, the weighted
average remaining term for all of the
Partnership’s service agreements was
approximately three years
Contributions to Arc Logistics(1) from Gulf LNG
Heating, blending and mixing associated with
customers’ activity
Ancillary Varies based upon the activity levels of the
Fees Partnership’s customers
Distributions are supported by two 20-
year(2), terminal use agreements with firm
Gulf LNG reservation charges for all of the capacity
of the LNG Facility with several
Distributions integrated, multi-national oil and gas
companies
(1) Contribution of equity earnings and cash distributions represent the 10.3% LNG Interest’s pro forma contribution to Arc Logistics.
(2) As of March 31, 2015, the remaining term was approximately 17 years.
7
|
|
Diversified Portfolio of Logistics Assets
[Graphic Appears Here]
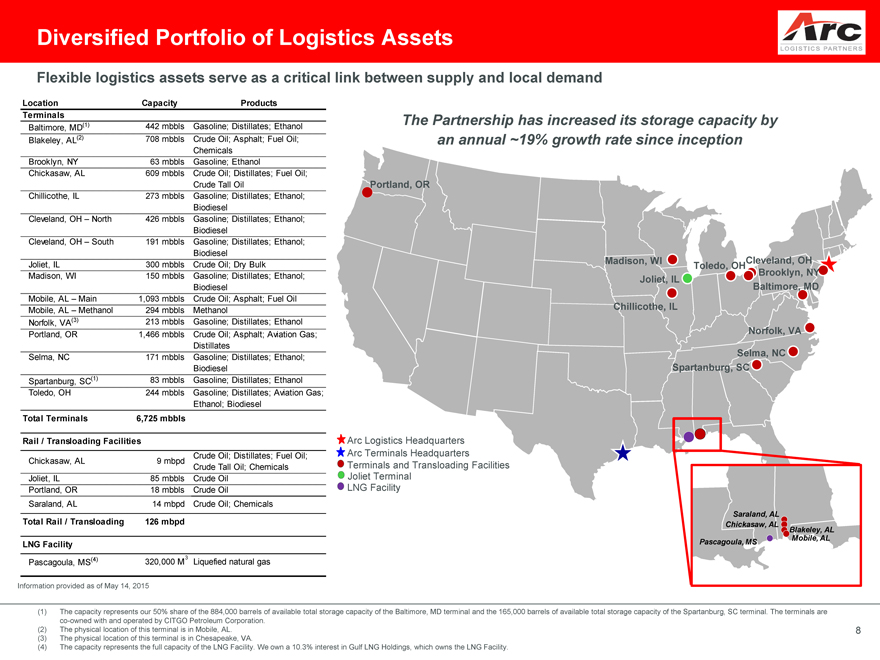
Flexible logistics assets serve as a critical link between supply and local demand
Location Capacity Products
Terminals
Baltimore, MD(1) 442 mbbls Gasoline; Distillates; Ethanol
Blakeley, AL(2) 708 mbbls Crude Oil; Asphalt; Fuel Oil;
Chemicals
Brooklyn, NY 63 mbbls Gasoline; Ethanol
Chickasaw, AL 609 mbbls Crude Oil; Distillates; Fuel Oil;
Crude Tall Oil
Chillicothe, IL 273 mbbls Gasoline; Distillates; Ethanol;
Biodiesel
Cleveland, OH – North 426 mbbls Gasoline; Distillates; Ethanol;
Biodiesel
Cleveland, OH – South 191 mbbls Gasoline; Distillates; Ethanol;
Biodiesel
Joliet, IL 300 mbbls Crude Oil; Dry Bulk
Madison, WI 150 mbbls Gasoline; Distillates; Ethanol;
Biodiesel
Mobile, AL – Main 1,093 mbbls Crude Oil; Asphalt; Fuel Oil
Mobile, AL – Methanol 294 mbbls Methanol
Norfolk, VA(3) 213 mbbls Gasoline; Distillates; Ethanol
Portland, OR 1,466 mbbls Crude Oil; Asphalt; Aviation Gas;
Distillates
Selma, NC 171 mbbls Gasoline; Distillates; Ethanol;
Biodiesel
Spartanburg, SC(1) 83 mbbls Gasoline; Distillates; Ethanol
Toledo, OH 244 mbbls Gasoline; Distillates; Aviation Gas;
Ethanol; Biodiesel
Total Terminals 6,725 mbbls
Rail / Transloading Facilities
Chickasaw, AL 9 mbpd Crude Oil; Distillates; Fuel Oil;
Crude Tall Oil; Chemicals
Joliet, IL 85 mbbls Crude Oil
Portland, OR 18 mbbls Crude Oil
Saraland, AL 14 mbpd Crude Oil; Chemicals
Total Rail / Transloading 126 mbpd
LNG Facility
The Partnership has increased its storage capacity by an annual ~19% growth rate since inception
Portland, OR
Madison, WI Cleveland, OH Toledo, OH
Brooklyn, NY Joliet, IL
Baltimore, MD
Chillicothe, IL
Norfolk, VA
Selma, NC Spartanburg, SC
Arc Logistics Headquarters Arc Terminals Headquarters Terminals and Transloading Facilities Joliet Terminal LNG Facility
Saraland, AL Chickasaw, AL
Blakeley, AL Mobile, AL
Pascagoula, MS
(4) 320,000 M3 Liquefied natural gas Pascagoula, MS
Information provided as of May 14, 2015
The capacity represents our 50% share of the 884,000 barrels of available total storage capacity of the Baltimore, MD terminal and the 165,000 barrels of available total storage capacity of the Spartanburg, SC terminal. The terminals are co-owned with and operated by CITGO Petroleum Corporation.
(2) The physical location of this terminal is in Mobile, AL.
8
|
|
The physical location of this terminal is in Chesapeake, VA.
The capacity represents the full capacity of the LNG Facility. We own a 10.3% interest in Gulf LNG Holdings, which owns the LNG Facility.
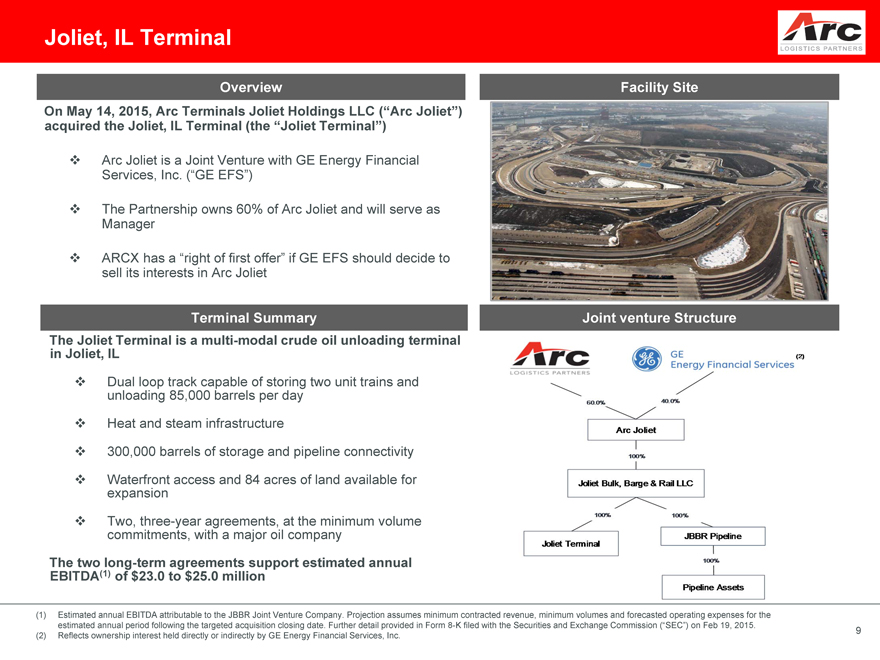
Joliet, IL Terminal
Overview
On May 14, 2015, Arc Terminals Joliet Holdings LLC (“Arc Joliet”)
acquired the Joliet, IL Terminal (the “Joliet Terminal”)
Arc Joliet is a Joint Venture with GE Energy Financial Services, Inc. (“GE EFS”)
The Partnership owns 60% of Arc Joliet and will serve as Manager
ARCX has a “right of first offer” if GE EFS should decide to sell its interests in Arc Joliet
Terminal Summary
The Joliet Terminal is a multi-modal crude oil unloading terminal
in Joliet, IL
Dual loop track capable of storing two unit trains and unloading 85,000 barrels per day
Heat and steam infrastructure
300,000 barrels of storage and pipeline connectivity
Waterfront access and 84 acres of land available for expansion
Two, three-year agreements, at the minimum volume commitments, with a major oil company
The two long-term agreements support estimated annual
EBITDA(1) of $23.0 to $25.0 million
Facility Site
Joint venture Structure
(1) Estimated annual EBITDA attributable to the JBBR Joint Venture Company. Projection assumes minimum contracted revenue, minimum volumes and forecasted operating expenses for the
estimated annual period following the targeted acquisition closing date. Further detail provided in Form 8-K filed with the Securities and Exchange Commission (“SEC”) on Feb 19, 2015.
(2) Reflects ownership interest held directly or indirectly by GE Energy Financial Services, Inc. 9
|
|
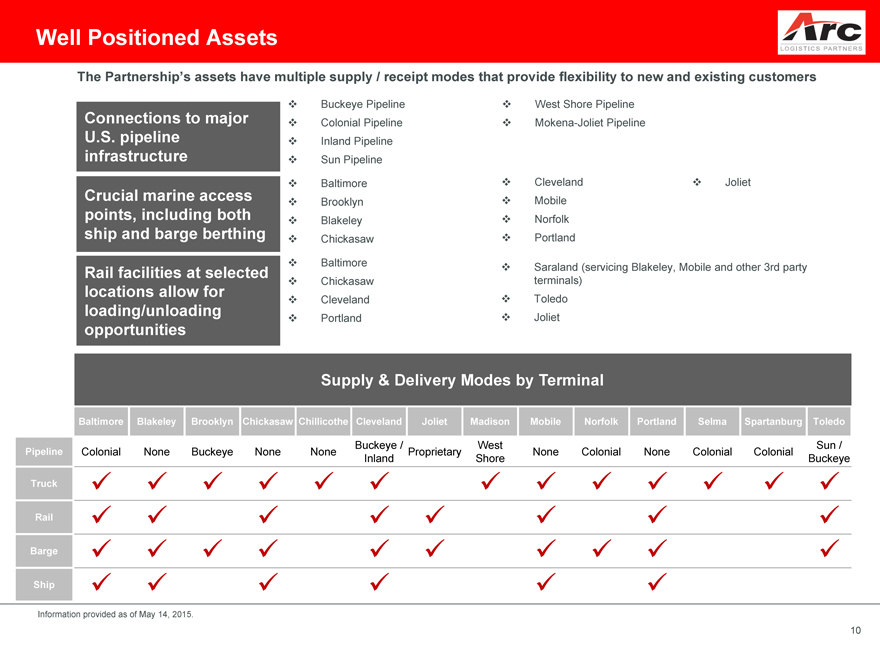
Well Positioned Assets
[Graphic Appears Here]
The Partnership’s assets have multiple supply / receipt modes that provide flexibility to new and existing customers
Connections to major U.S. pipeline infrastructure
Crucial marine access points, including both ship and barge berthing
Rail facilities at selected locations allow for loading/unloading opportunities
Buckeye Pipeline
Colonial Pipeline
Inland Pipeline
Sun Pipeline
Baltimore
Brooklyn
Blakeley
Chickasaw
Baltimore
Chickasaw
Cleveland
Portland
West Shore Pipeline
Mokena-Joliet Pipeline
Cleveland Joliet
Mobile
Norfolk
Portland
Saraland (servicing Blakeley, Mobile and other 3rd party terminals)
Toledo
Joliet
Supply &
Delivery Supply & Delivery Modes by Terminal
Moves by
Terminal
Baltimore Blakeley Brooklyn Chickasaw Chillicothe Cleveland Joliet Madison Mobile Norfolk Portland Selma Spartanburg Toledo
Buckeye / West Sun /
Pipeline Colonial None Buckeye None None Proprietary None Colonial None Colonial Colonial
Inland Shore Buckeye
Truck
Rail
Barge
Ship
Information provided as of May 14, 2015.
10
|
|
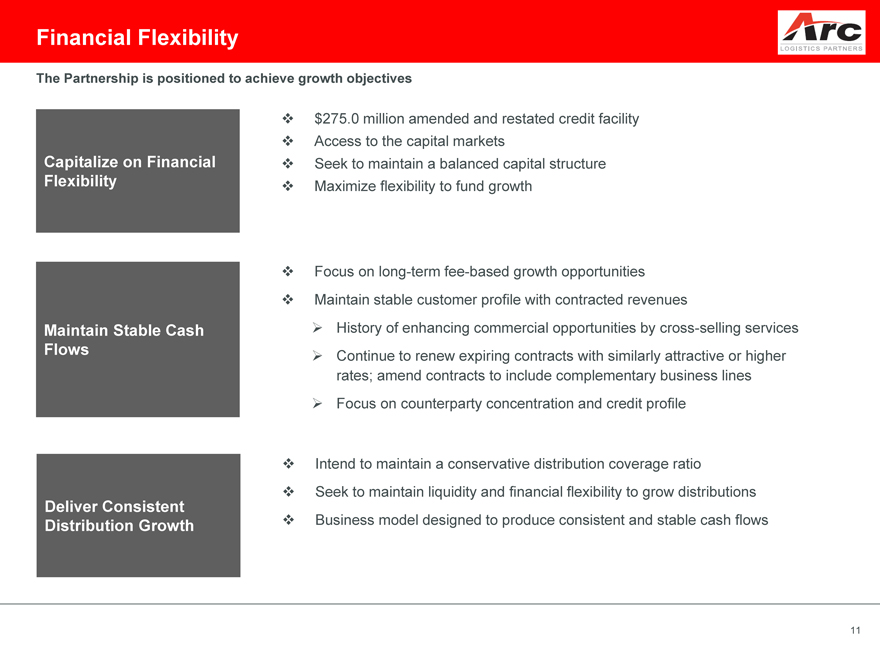
Financial Flexibility
[Graphic Appears Here]
The Partnership is positioned to achieve growth objectives
Capitalize on Financial Flexibility
Maintain Stable Cash Flows
Deliver Consistent Distribution Growth
$275.0 million amended and restated credit facility
Access to the capital markets
Seek to maintain a balanced capital structure
Maximize flexibility to fund growth
Focus on long-term fee-based growth opportunities
Maintain stable customer profile with contracted revenues
History of enhancing commercial opportunities by cross-selling services
Continue to renew expiring contracts with similarly attractive or higher
rates; amend contracts to include complementary business lines
Focus on counterparty concentration and credit profile
Intend to maintain a conservative distribution coverage ratio
Seek to maintain liquidity and financial flexibility to grow distributions
Business model designed to produce consistent and stable cash flows
11
|
|
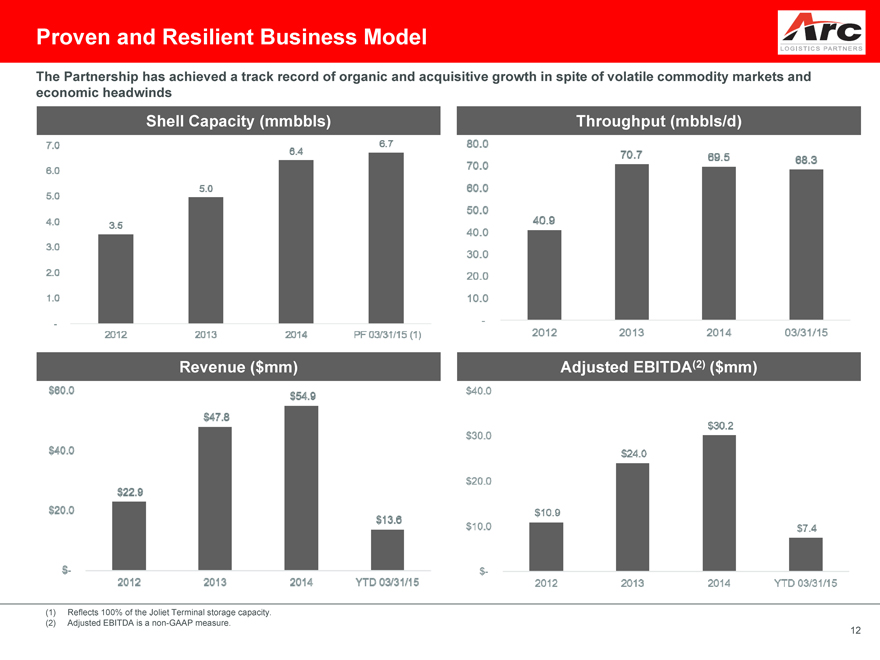
Proven and Resilient Business Model
The Partnership has achieved a track record of organic and acquisitive growth in spite of volatile commodity markets and
economic headwinds
Shell Capacity (mmbbls) Throughput (mbbls/d)
Revenue ($mm) Adjusted EBITDA(2) ($mm)
Reflects 100% of the Joliet Terminal storage capacity.
Adjusted EBITDA is a non-GAAP measure.
12
|
|
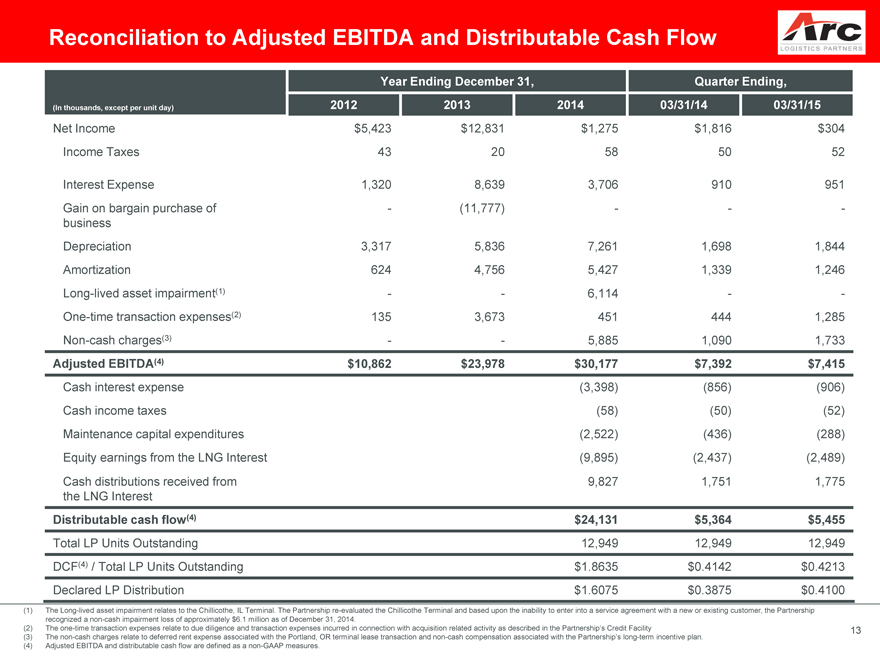
Reconciliation to Adjusted EBITDA and Distributable Cash Flow
[Graphic Appears Here]
Year Ending December 31, Quarter Ending,
(In thousands, except per unit day) 2012 2013 2014 03/31/14 03/31/15
Net Income $5,423 $12,831 $1,275 $1,816 $304
Income Taxes 43 20 58 50 52
Interest Expense 1,320 8,639 3,706 910 951
Gain on bargain purchase of -(11,777) — -
business
Depreciation 3,317 5,836 7,261 1,698 1,844
Amortization 624 4,756 5,427 1,339 1,246
Long-lived asset impairment(1) — 6,114 —
One-time transaction expenses(2) 135 3,673 451 444 1,285
Non-cash charges(3) — 5,885 1,090 1,733
Adjusted EBITDA(4) $10,862 $23,978 $30,177 $7,392 $7,415
Cash interest expense(3,398)(856)(906)
Cash income taxes(58)(50)(52)
Maintenance capital expenditures(2,522)(436)(288)
Equity earnings from the LNG Interest(9,895)(2,437)(2,489)
Cash distributions received from 9,827 1,751 1,775
the LNG Interest
Distributable cash flow(4) $24,131 $5,364 $5,455
Total LP Units Outstanding 12,949 12,949 12,949
DCF(4) / Total LP Units Outstanding $1.8635 $0.4142 $0.4213
Declared LP Distribution $1.6075 $0.3875 $0.4100
The Long-lived asset impairment relates to the Chillicothe, IL Terminal. The Partnership re-evaluated the Chillicothe Terminal and based upon the inability to enter into a service agreement with a new or existing customer, the Partnership recognized a non-cash impairment loss of approximately $6.1 million as of December 31, 2014.
(2) The one-time transaction expenses relate to due diligence and transaction expenses incurred in connection with acquisition related activity as described in the Partnership’s Credit Facility 13
(3) The non-cash charges relate to deferred rent expense associated with the Portland, OR terminal lease transaction and non-cash compensation associated with the Partnership’s long-term incentive plan.
(4) Adjusted EBITDA and distributable cash flow are defined as a non-GAAP measures.
|
|
Questions