Attached files
| file | filename |
|---|---|
| 8-K - FORM 8-K - Columbia Pipeline Partners LP | d925942d8k.htm |
Exhibit 99.1
Creating A Premier Pipeline, Midstream and Storage Company Bob Skaggs CEO Glen Kettering President Steve Smith CFO Pre-Separation Update May 14, 2015
|
|
Forward-Looking Statements This presentation contains forward-looking statements within the meaning of federal securities laws. These forward-looking statements are subject to various risks and uncertainties. Examples of forward-looking statements in this presentation include statements and expectations regarding future dividends, development projects, the separation, operating earnings growth, EBITDA growth, earnings per share growth, capital investments, net investment/rate base growth, financing needs and plans, and investment opportunities. Factors that could cause actual results to differ materially from the projections, forecasts, estimates and expectations discussed in this presentation include, among other things, changes in general economic conditions; competitive conditions in our industry; actions taken by third-party operators, processors and transporters; the demand for natural gas storage and transportation services; our ability to successfully implement our business plan; our ability to complete internal growth projects on time and on budget; the price and availability of debt and equity financing; the availability and price of natural gas to the consumer compared to the price of alternative and competing fuels; competition from the same and alternative energy sources; restrictions in our existing and any future credit facilities; capital market performance and other factors that may decrease the value of benefits plan assets; energy efficiency and technology trends; operating hazards and other risks incidental to transporting, storing and gathering natural gas; natural disasters, weather-related delays, casualty losses and other matters beyond our control; interest rates; labor relations; large customer defaults; changes in the availability and cost of capital; changes to tax status; the effects of existing and future laws and governmental regulations; the effects of future litigation; the qualification of the distribution of all of our common stock as a tax-free distribution; our ability to achieve the benefits that we expect to achieve as an independent, publicly traded company,; our dependence on NiSource to provide us with certain services following the distribution of all of our common stock; and the matters described in the “Risk Factors” sections of the Form 10 filed by Columbia Pipeline Group Inc. (“CPG”) and Form 10-K filed by Columbia Pipeline Partners LP (“CPPL”,) many of which are beyond the control of CPG and CPPL. Readers are cautioned not to place undue reliance on these forward-looking statements, which speak only as of the date of this presentation. Future earnings and other financial projections are illustrative only and do not constitute guidance by CPG and CPPL. CPG expressly disclaims any duty to update any of the forward-looking statements contained in this presentation. The previously announced separation of CPG from NiSource is subject to the satisfaction of a number of conditions, including the final approval of NiSource?s Board of Directors. There is no assurance that such separation will occur. Columbia Pipeline Group 2
|
|
Agenda Columbia Pipeline Group 1. Separation Update Bob Skaggs, CEO 2. Business Overview and Growth Strategy Glen Kettering, President 3. Financial Overview Steve Smith, CFO 4. Summary Bob Skaggs, CEO 5. Question and Answer Creating A Premier Pipeline, Midstream and Storage Company 3 Columbia Pipeline Group
|
|
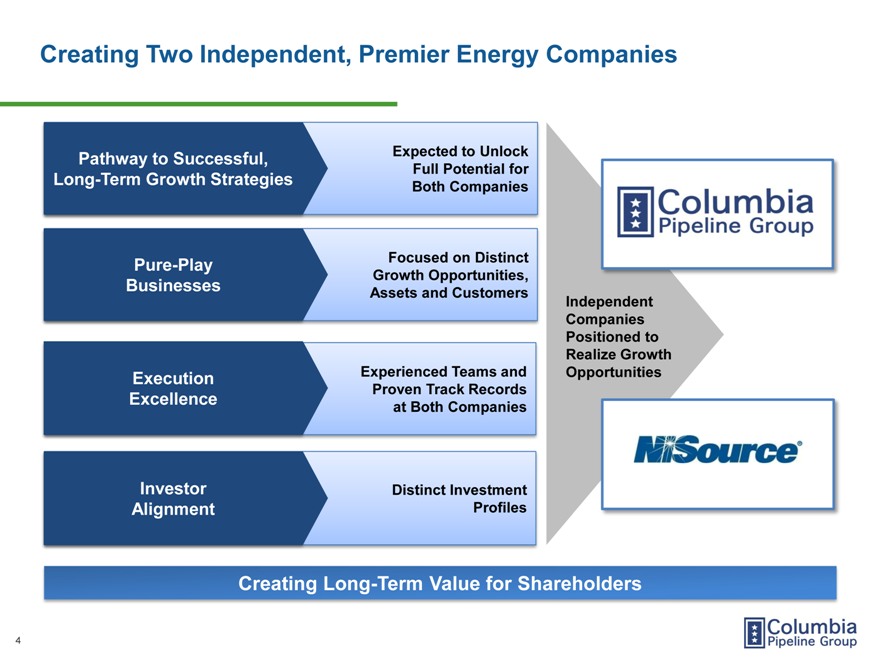
Creating Two Independent, Premier Energy Companies Pathway to Successful, Expected to Unlock Full Potential for Long-Term Growth Strategies Both Companies Pure-Play Focused on Distinct Growth Opportunities, Businesses Assets and Customers Independent Companies Positioned to Realize Growth Execution Experienced Teams and Opportunities Proven Track Records Excellence at Both Companies Investor Distinct Investment Alignment Profiles Creating Long-Term Value for Shareholders 4 NISource Columbia Pipeline Group
|
|
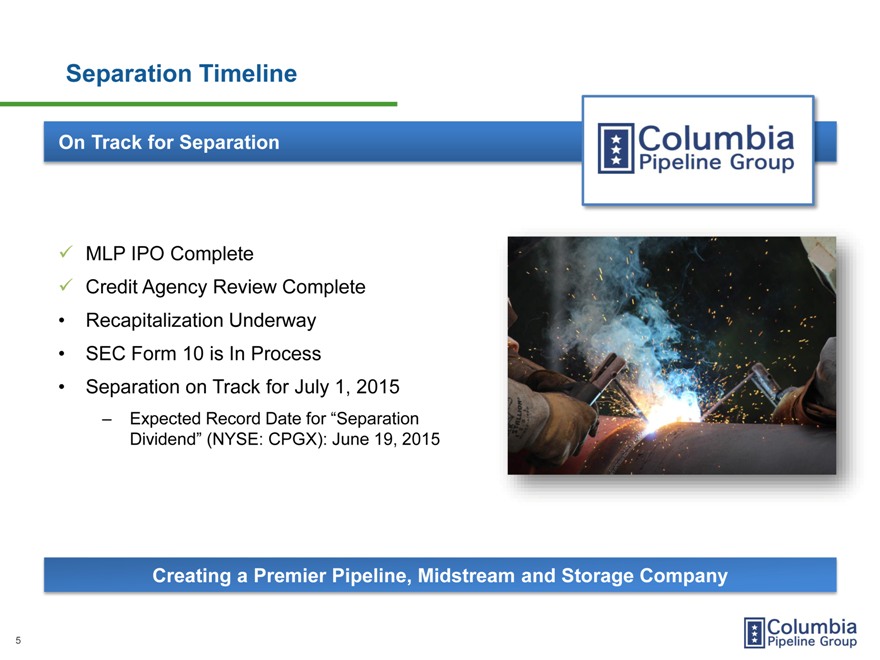
Separation Timeline On Track for Separation MLP IPO Complete Credit Agency Review Complete Recapitalization Underway SEC Form 10 is In Process Separation on Track for July 1, 2015 Expected Record Date for “Separation Dividend” (NYSE: CPGX): June 19, 2015 Creating a Premier Pipeline, Midstream and Storage Company 5 Columbia Pipeline Group
|
|
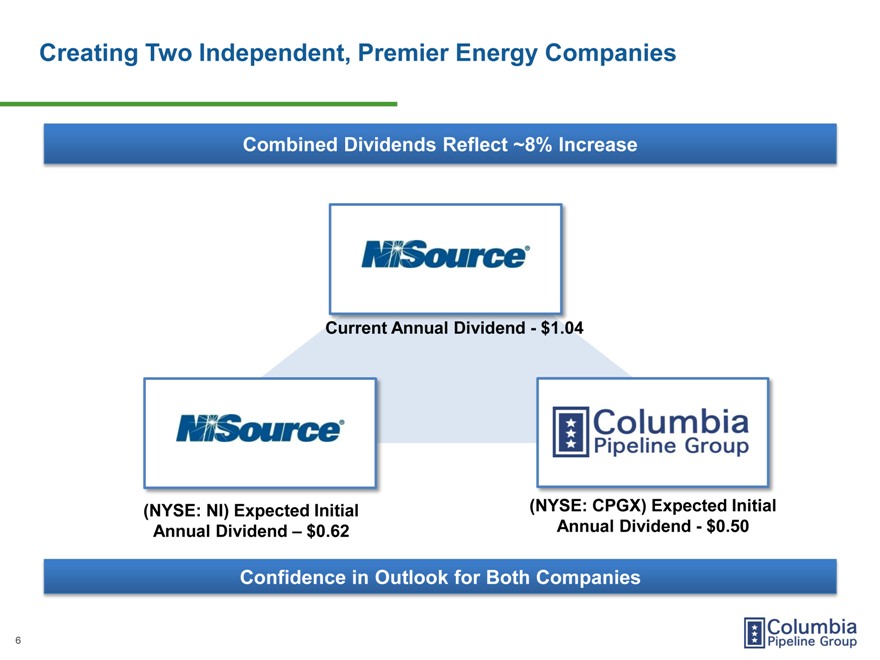
Creating Two Independent, Premier Energy Companies Combined Dividends Reflect ~8% Increase Current Annual Dividend—$1.04 (NYSE: NI) Expected Initial (NYSE: CPGX) Expected Initial Annual Dividend $0.62 Annual Dividend—$0.50 Confidence in Outlook for Both Companies Columbia Pipeline Group NISource 6
|
|
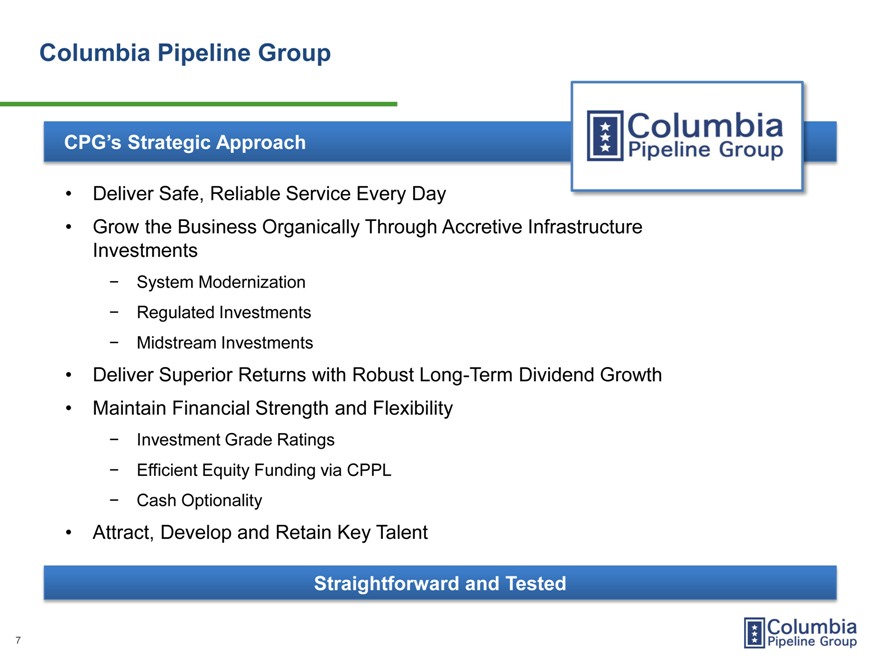
Columbia Pipeline Group CPG’s Strategic Approach Deliver Safe, Reliable Service Every Day Grow the Business Organically Through Accretive Infrastructure Investments—System Modernization—Regulated Investments—Midstream Investments Deliver Superior Returns with Robust Long-Term Dividend Growth Maintain Financial Strength and Flexibility—Investment Grade Ratings—Efficient Equity Funding via CPPL—Cash Optionality Attract, Develop and Retain Key Talent Straightforward and Tested Columbia Pipeline Group 7
|
|
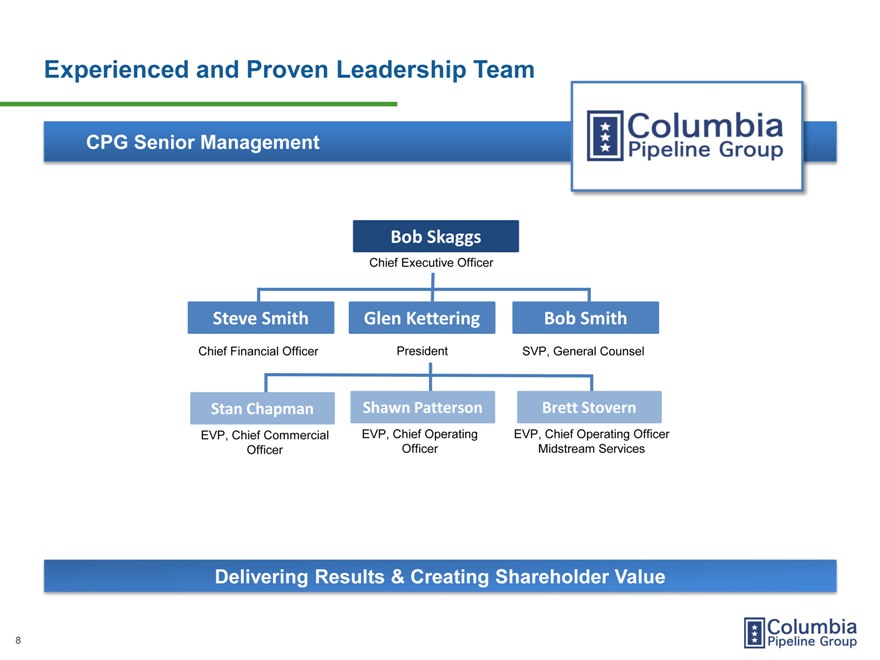
Experienced and Proven Leadership Team CPG Senior Management Bob Skaggs Chief Executive Officer Steve Smith Glen Kettering Bob Smith Chief Financial Officer President SVP, General Counsel Stan Chapman Shawn Patterson Brett Stovern EVP, Chief Commercial EVP, Chief Operating EVP, Chief Operating Officer Officer Officer Midstream Services Delivering Results & Creating Shareholder Value Columbia Pipeline Group 8
|
|
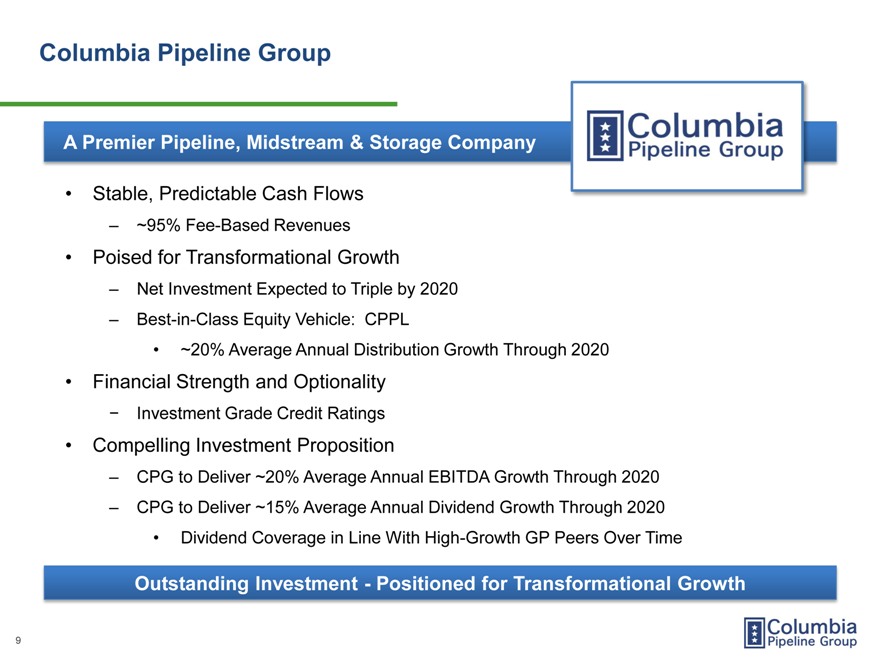
Columbia Pipeline Group A Premier Pipeline, Midstream & Storage Company Stable, Predictable Cash Flows ~95% Fee-Based Revenues Poised for Transformational Growth Net Investment Expected to Triple by 2020 Best-in-Class Equity Vehicle: CPPL ~20% Average Annual Distribution Growth Through 2020 Financial Strength and Optionality—Investment Grade Credit Ratings Compelling Investment Proposition CPG to Deliver ~20% Average Annual EBITDA Growth Through 2020 CPG to Deliver ~15% Average Annual Dividend Growth Through 2020 Dividend Coverage in Line With High-Growth GP Peers Over Time Outstanding Investment—Positioned for Transformational Growth Columbia Pipeline Group 9
|
|
Business Overview and Growth Strategy Glen Kettering President
|
|
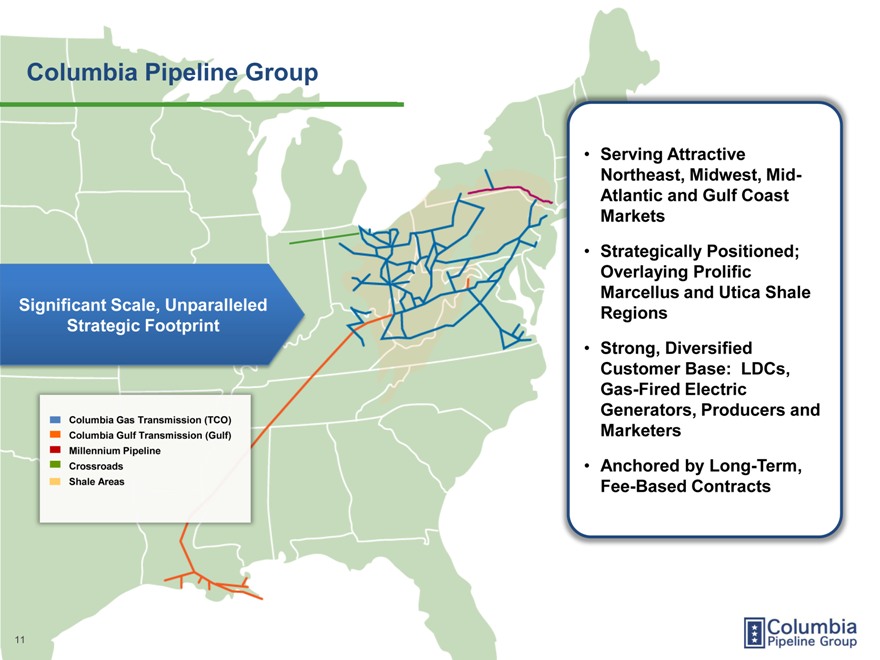
Columbia Pipeline Group Serving Attractive Northeast, Midwest, Mid-Atlantic and Gulf Coast Markets Strategically Positioned; Overlaying Prolific Marcellus and Utica Shale Significant Scale, Unparalleled Regions Strategic Footprint Strong, Diversified Customer Base: LDCs, Gas-Fired Electric Generators, Producers and Columbia Gas Transmission (TCO) Columbia Gulf Transmission (Gulf) Marketers Millennium Pipeline Crossroads Anchored by Long-Term, Shale Areas Fee-Based Contracts Columbia Pipeline Group 11
|
|
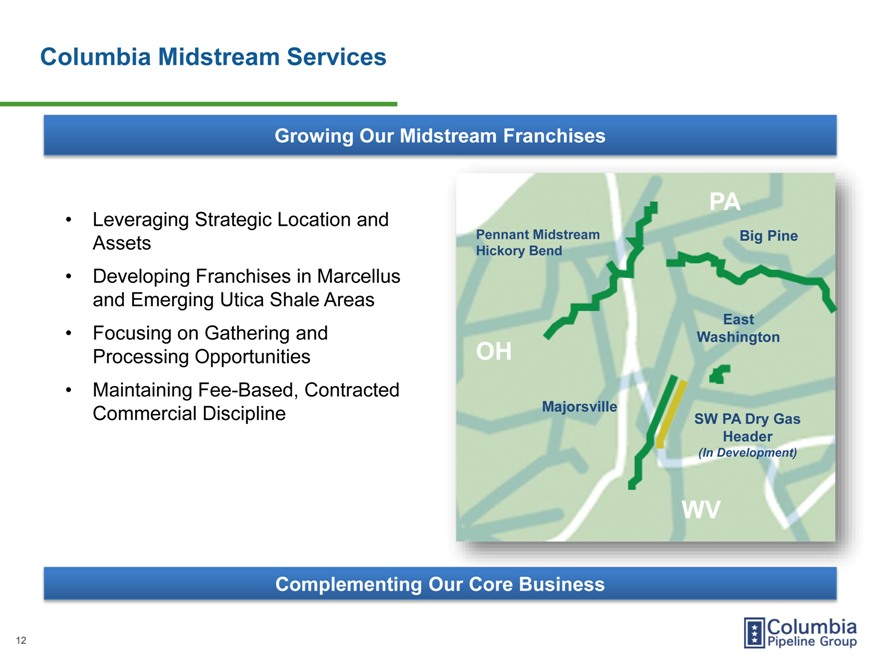
Columbia Midstream Services Growing Our Midstream Franchises PA Leveraging Strategic Location and Assets Pennant M Big Pine Hickory B Developing Franchises in Marcellus and Emerging Utica Shale Areas East Focusing on Gathering and Washington Processing Opportunities OH Maintaining Fee-Based, Contracted Commercial Discipline Majorsville SW PA Dry Gas Header (In Development) WV Complementing Our Core Business Columbia Pipeline Group 12
|
|
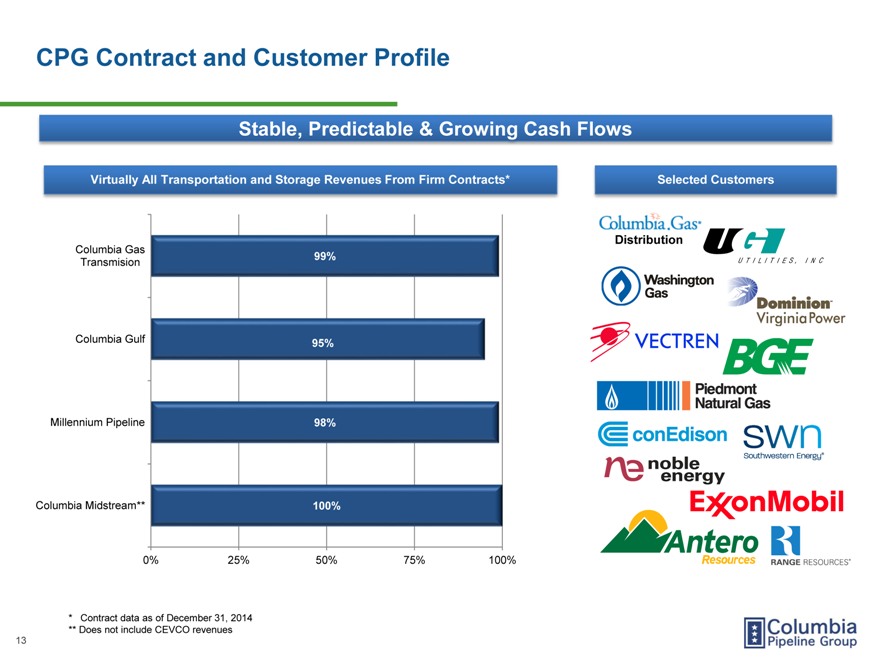
CPG Contract and Customer Profile Stable, Predictable & Growing Cash Flows Virtually All Transportation and Storage Revenues From Firm Contracts* Selected Customers Columbia Gas Distribution 99% Transmision Columbia Gulf 95% Millennium Pipeline 98% Columbia Midstream** 100% 0% 25% 50% 75% 100% * Contract data as of December 31, 2014 ** Does not include CEVCO revenues 13 Columbia Pipeline Group
|
|
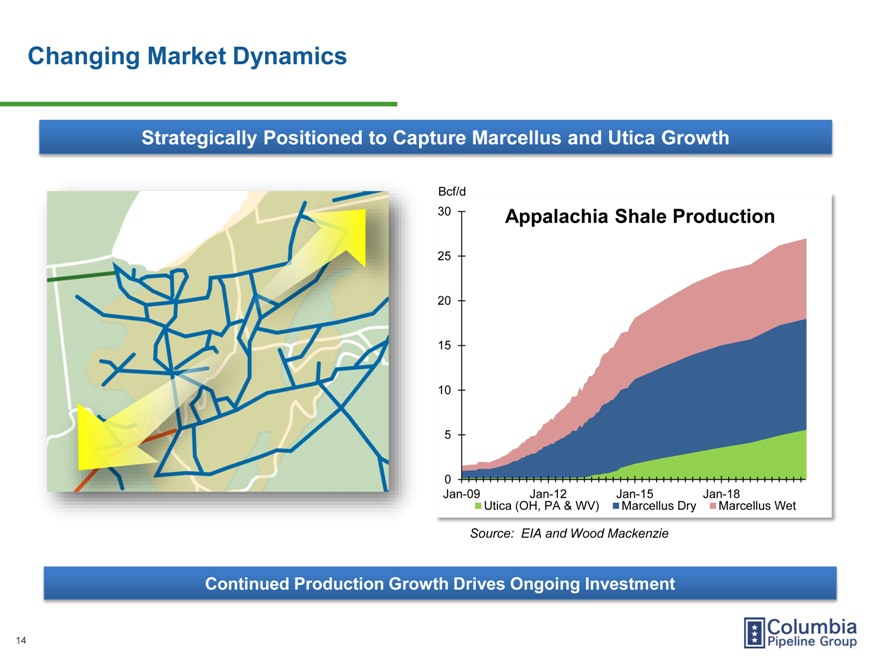
Changing Market Dynamics Strategically Positioned to Capture Marcellus and Utica Growth Bcf/d 30 Appalachia Shale Production 25 20 15 10 5 0 Jan-09 Jan-12 Jan-15 Jan-18 Utica (OH, PA & WV) Marcellus Dry Marcellus Wet Source: EIA and Wood Mackenzie Continued Production Growth Drives Ongoing Investment Columbia Pipeline Group 14
|
|
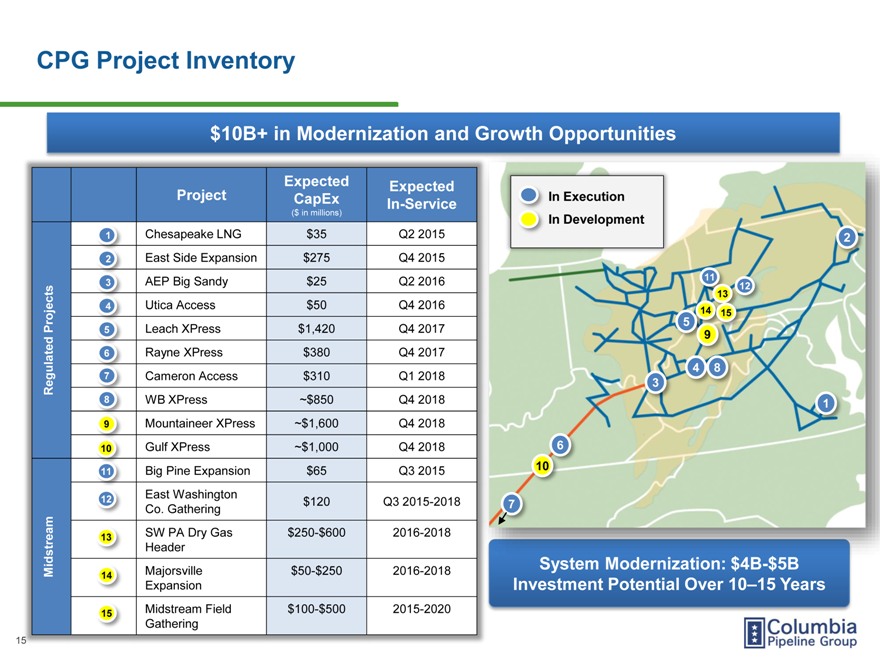
CPG Project Inventory $10B+ in Modernization and Growth Opportunities Expected Expected Project CapEx In Execution In-Service ($ in millions) In Development 1 Chesapeake LNG $35 Q2 2015 2 2 East Side Expansion $275 Q4 2015 AEP Big Sandy $25 Q2 2016 11 3 12 13 4 Utica Access $50 Q4 2016 14 15 5 Projects 5 Leach XPress $1,420 Q4 2017 9 6 Rayne XPress $380 Q4 2017 4 8 7 Cameron Access $310 Q1 2018 Regulated 3 8 WB XPress ~$850 Q4 2018 1 9 Mountaineer XPress ~$1,600 Q4 2018 10 Gulf XPress ~$1,000 Q4 2018 6 Big Pine Expansion $65 2015 10 11 Q3 12 East Washington $120 Q3 2015-2018 7 Co. Gathering 13 SW PA Dry Gas $250-$600 2016-2018 Header Midstream 14 Majorsville $50-$250 2016-2018 Expansion Investment Potential Over 1015 Years 15 Midstream Field $100-$500 2015-2020 Gathering System Modernization: $4B-$5B Investment Potential Over 10-15 Years Columbia Pipeline Group 15
|
|
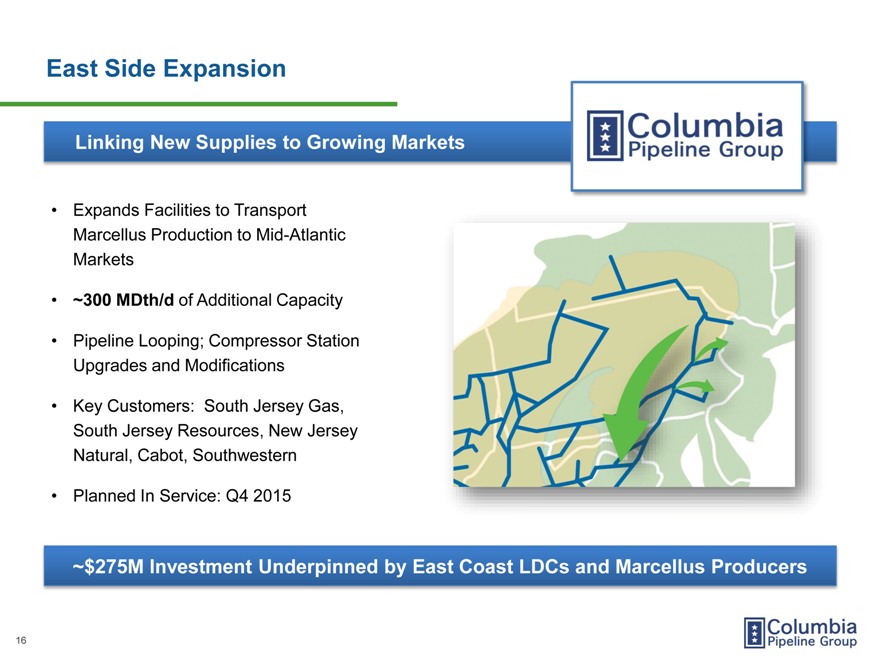
East Side Expansion Linking New Supplies to Growing Markets Expands Facilities to Transport Marcellus Production to Mid-Atlantic Markets ~300 MDth/d of Additional Capacity Pipeline Looping; Compressor Station Upgrades and Modifications Key Customers: South Jersey Gas, South Jersey Resources, New Jersey Natural, Cabot, Southwestern Planned In Service: Q4 2015 ~$275M Investment Underpinned by East Coast LDCs and Marcellus Producers 16 Columbia Pipeline Group
|
|
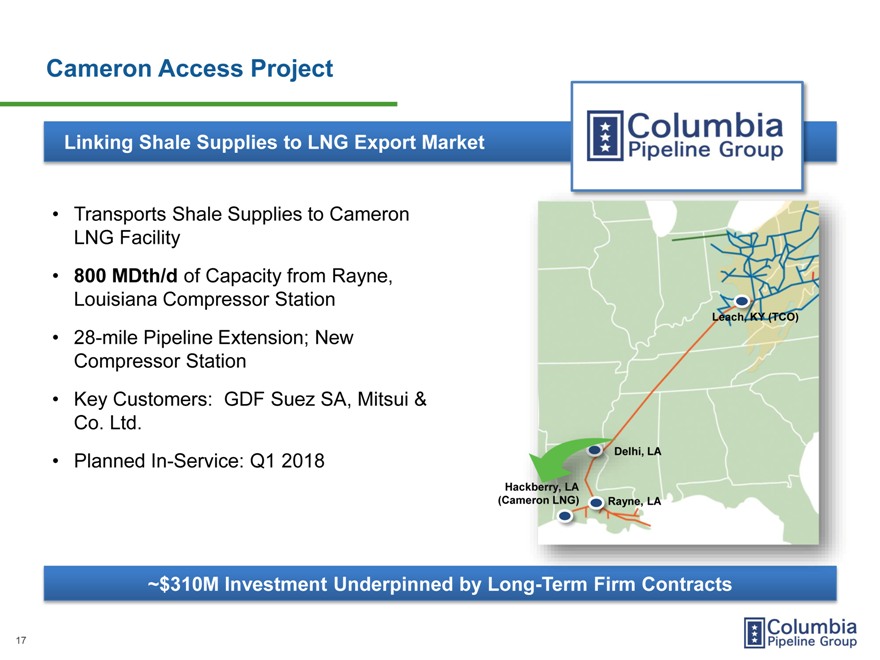
Cameron Access Project Linking Shale Supplies to LNG Export Market Transports Shale Supplies to Cameron LNG Facility 800 MDth/d of Capacity from Rayne, Louisiana Compressor Station Leach, KY (TCO) 28-mile Pipeline Extension; New Compressor Station Key Customers: GDF Suez SA, Mitsui & Co. Ltd. LA Planned In-Service: Q1 2018 LA ~$310M Investment Underpinned by Long Columbia Pipeline Group 17
|
|
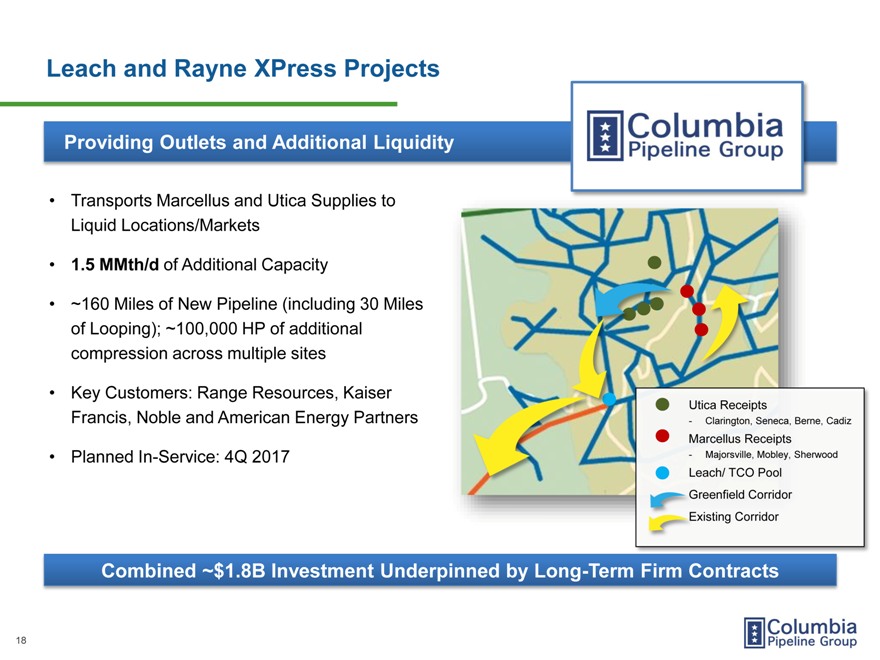
Leach and Rayne XPress Projects Providing Outlets and Additional Liquidity Transports Marcellus and Utica Supplies to Liquid Locations/Markets 1.5 MMth/d of Additional Capacity ~160 Miles of New Pipeline (including 30 Miles of Looping); ~100,000 HP of additional compression across multiple sites Key Customers: Range Resources, Kaiser Utica Receipts Francis, Noble and American Energy Partners—Clarington, Seneca, Berne, Cadiz Marcellus Receipts Planned In-Service: 4Q 2017—Majorsville, Mobley, Sherwood Leach/ TCO Pool Greenfield Corridor xisting Corridor Combined ~$1.8B Investment Underpinned by Long-Term Firm Contracts Columbia Pipeline Group 18
|
|
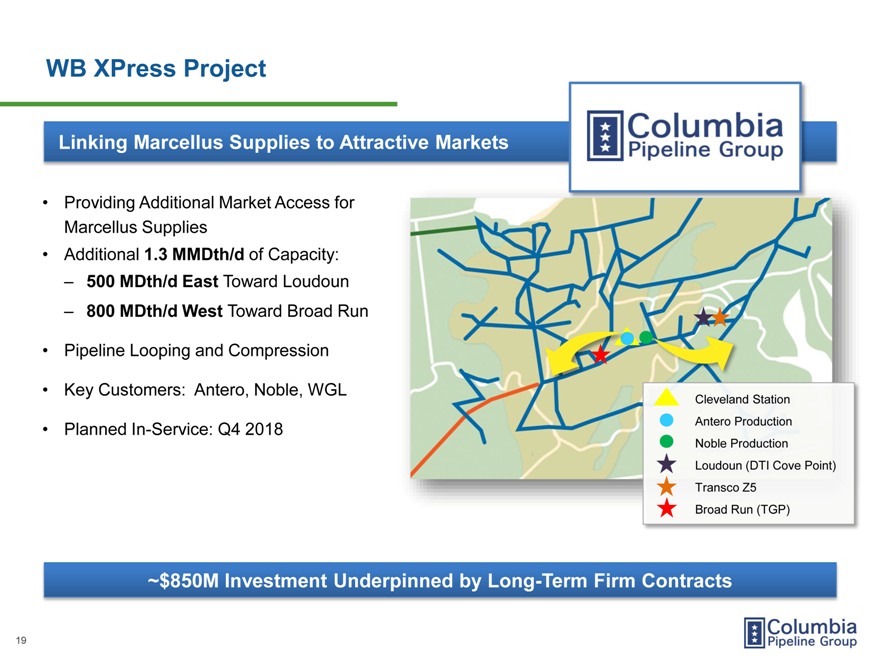
WB XPress Project Linking Marcellus Supplies to Attractive Markets Providing Additional Market Access for Marcellus Supplies Additional 1.3 MMDth/d of Capacity: 500 MDth/d East Toward Loudoun 800 MDth/d West Toward Broad Run Pipeline Looping and Compression Key Customers: Antero, Noble, WGL Cleveland Station Planned In-Service: Q4 2018 Antero Production Noble Production Loudoun (DTI Cove Point) Transco Z5 Broad Run (TGP) ~$850M Investment Underpinned by Long-Term Firm Contracts Columbia Pipeline Group 19
|
|
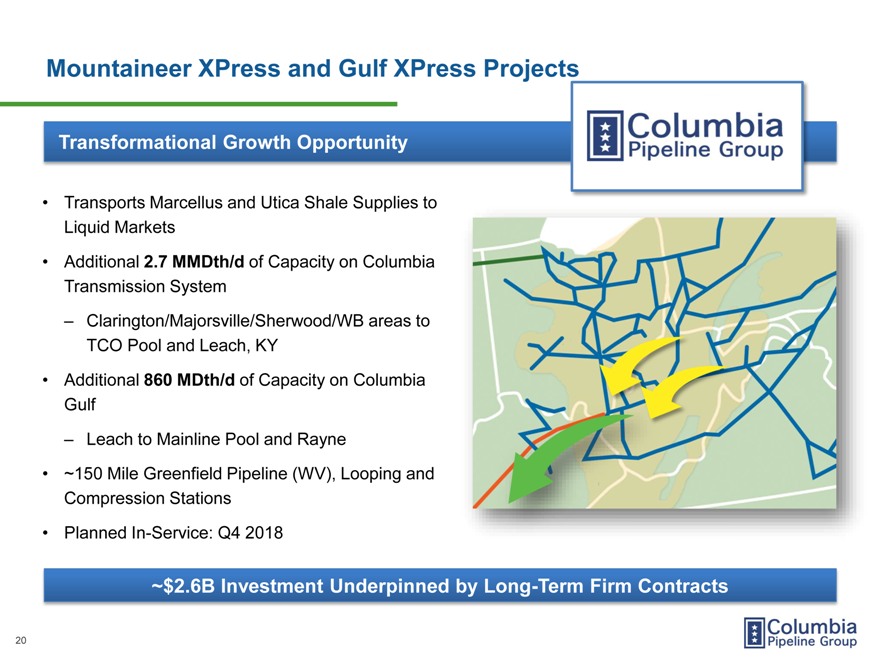
Mountaineer XPress and Gulf XPress Projects Transformational Growth Opportunity Transports Marcellus and Utica Shale Supplies to Liquid Markets Additional 2.7 MMDth/d of Capacity on Columbia Transmission System Clarington/Majorsville/Sherwood/WB areas to TCO Pool and Leach, KY Additional 860 MDth/d of Capacity on Columbia Gulf Leach to Mainline Pool and Rayne ~150 Mile Greenfield Pipeline (WV), Looping and Compression Stations Planned In-Service: Q4 2018 ~$2.6B Investment Underpinned by Long-Term Firm Contracts Columbia Pipeline Group 20 Columbia Pipeline Group
|
|
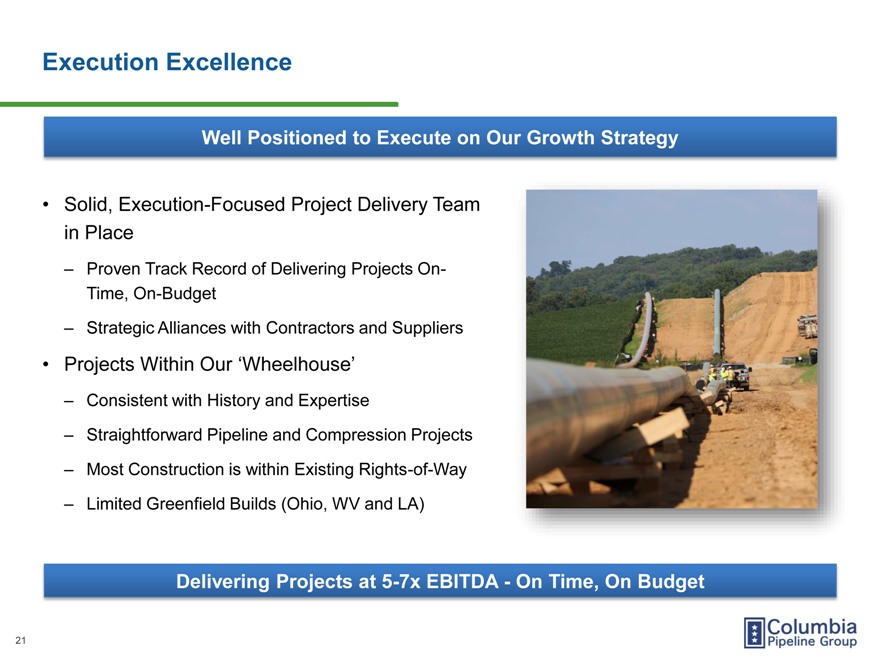
Execution Excellence Well Positioned to Execute on Our Growth Strategy Solid, Execution-Focused Project Delivery Team in Place ? Proven Track Record of Delivering Projects On-Time, On-Budget ? Strategic Alliances with Contractors and Suppliers Projects Within Our ‘Wheelhouse’ ? Consistent with History and Expertise ? Straightforward Pipeline and Compression Projects ? Most Construction is within Existing Rights-of-Way ? Limited Greenfield Builds (Ohio, WV and LA) Delivering Projects at 5-7x EBITDA—On Time, On Budget Columbia Pipeline Group 21
|
|
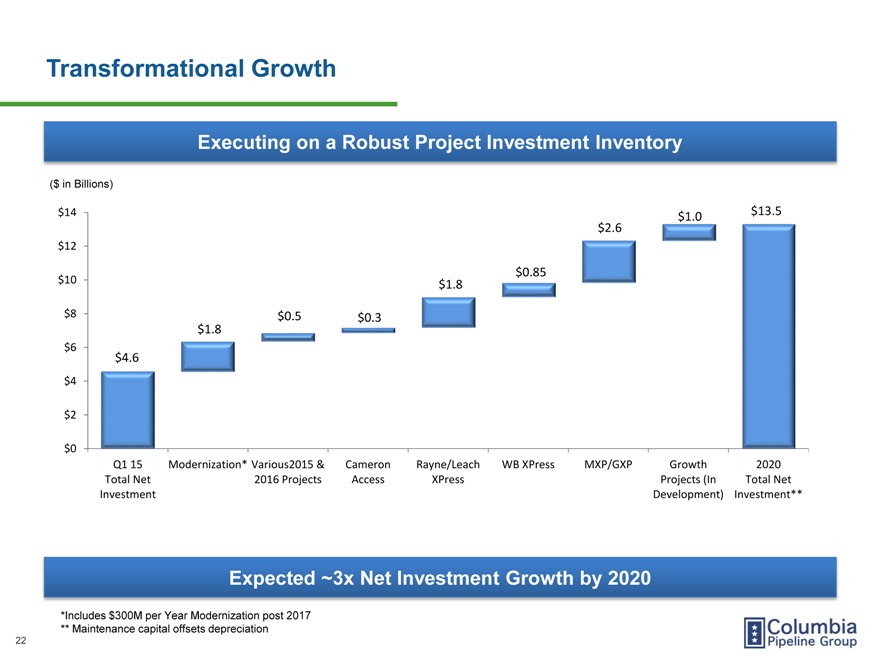
Transformational Growth Executing on a Robust Project Investment Inventory ($ in Billions) $14 $13.5 $1.0 $2.6 $12 $0.85 $10 $1.8 $8 $0.5 $0.3 $1.8 $6 $4.6 $4 $2 $0 Q1 15 Modernization* Various2015 & Cameron Rayne/Leach WB XPress MXP/GXP Growth 2020 Total Net 2016 Projects Access XPress Projects (In Total Net Investment Development) Investment** Expected ~3x Net Investment Growth by 2020 *Includes $300M per Year Modernization post 2017 ** Maintenance capital offsets depreciation Columbia Pipeline Group 22
|
|
Financial Plan Steve Smith CFO
|
|
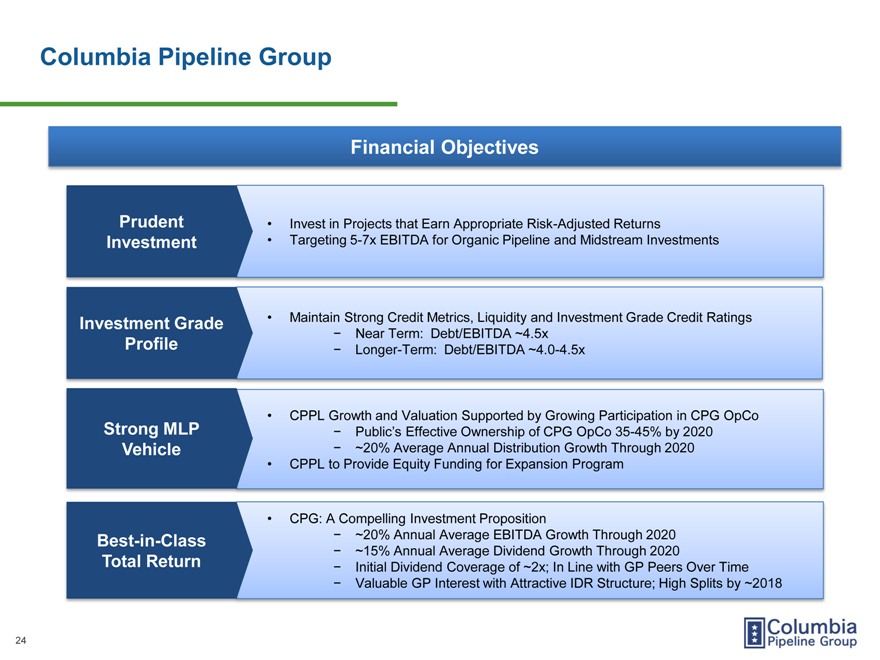
Columbia Pipeline Group Financial Objectives Prudent Invest in Projects that Earn Appropriate Risk-Adjusted Returns Investment Targeting 5-7x EBITDA for Organic Pipeline and Midstream Investments Investment Grade Maintain Strong Credit Metrics, Liquidity and Investment Grade Credit Ratings—Near Term: Debt/EBITDA ~4.5x Profile—Longer-Term: Debt/EBITDA ~4.0-4.5x Strong MLP CPPL Growth and Valuation Supported by Growing Participation in CPG OpCo—Public?s Effective Ownership of CPG OpCo 35-45% by 2020 Vehicle—~20% Average Annual Distribution Growth Through 2020 CPPL to Provide Equity Funding for Expansion Program CPG: A Compelling Investment Proposition Best-in-Class—~20% Annual Average EBITDA Growth Through 2020—~15% Annual Average Dividend Growth Through 2020 Total Return—Initial Dividend Coverage of ~2x; In Line with GP Peers Over Time—Valuable GP Interest with Attractive IDR Structure; High Splits by ~2018 Columbia Pipeline Group 24
|
|
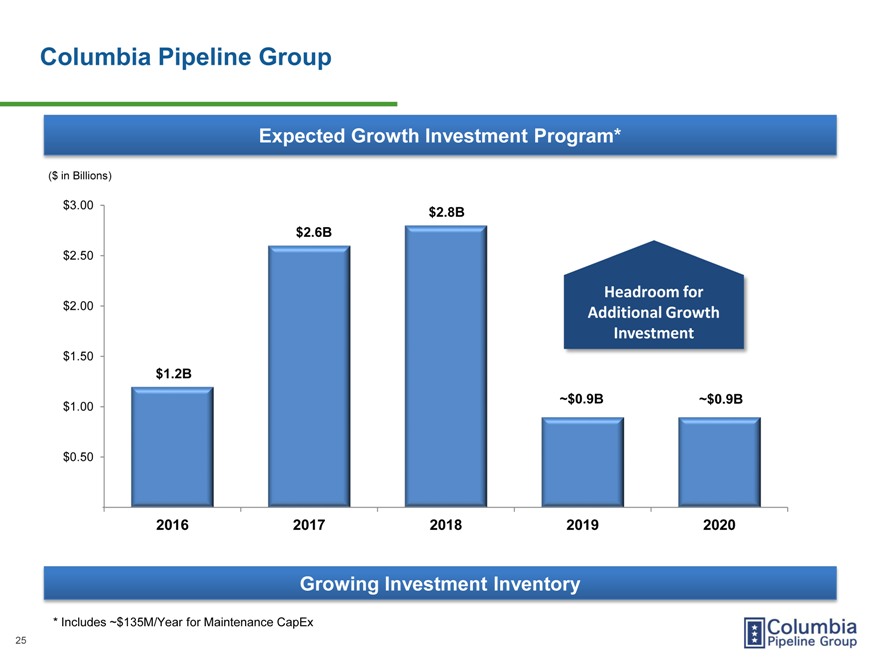
Columbia Pipeline Group Expected Growth Investment Program* ($ in Billions) $3.00 $2.8B $2.6B $2.50 Headroom for $2.00 Additional Growth Investment $1.50 $1.2B ~$0.9B ~$0.9B $1.00 $0.50 2016 2017 2018 2019 2020 Growing Investment Inventory * Includes ~$135M/Year for Maintenance CapEx 25 Columbia Pipeline Group
|
|
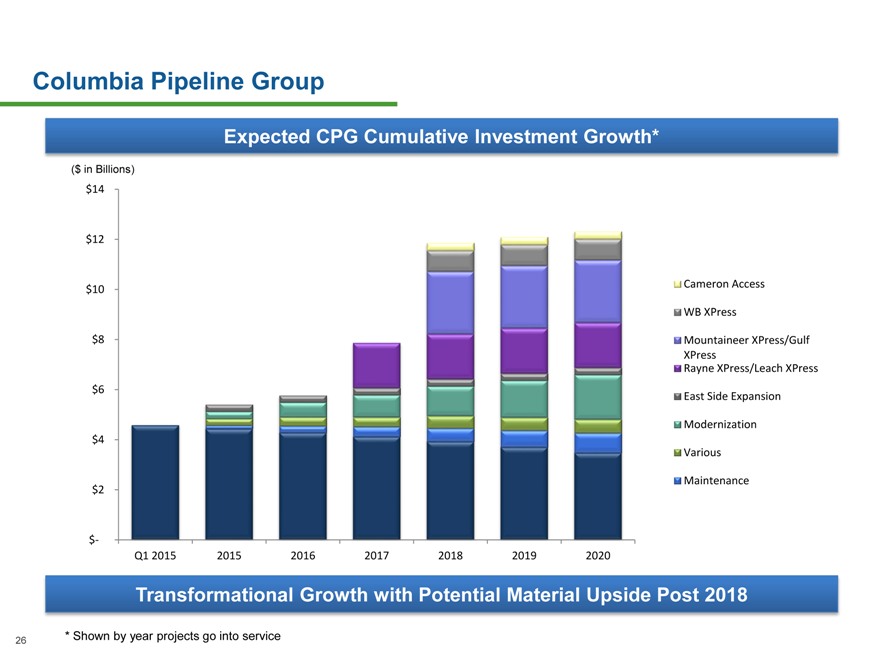
Columbia Pipeline Group Expected CPG Cumulative Investment Growth* ($ in Billions) $14 $12 Cameron Access $10 WB XPress $8 Mountaineer XPress/Gulf XPress Rayne XPress/Leach XPress $6 East Side Expansion Modernization $4 Various $2 Maintenance $- Q1 2015 2015 2016 2017 2018 2019 2020 Transformational Growth with Potential Material Upside Post 2018 26 * Shown by year projects go into service Columbia Pipeline Group
|
|
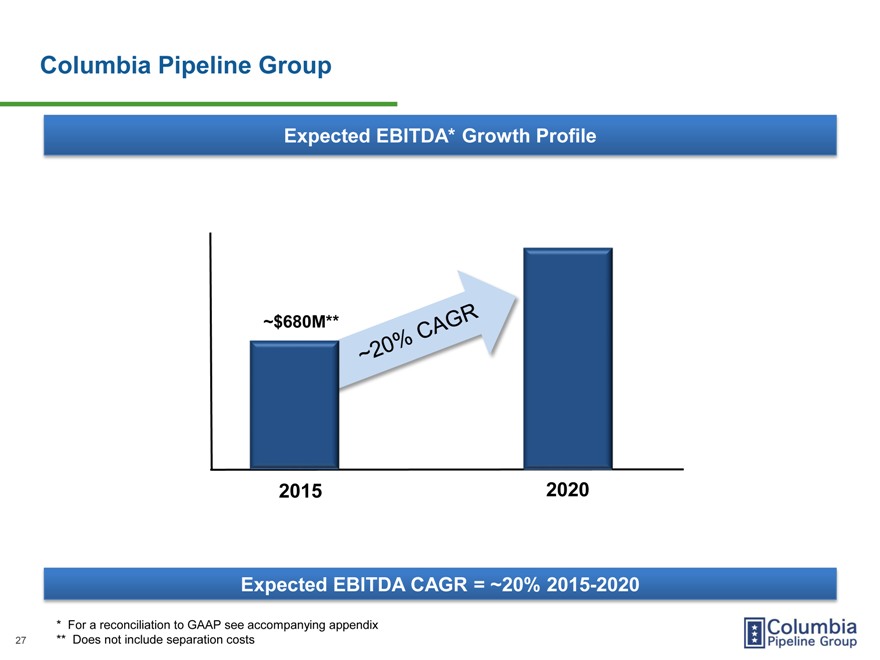
Columbia Pipeline Group Expected EBITDA* Growth Profile ~$680M** 2015 2020 Expected EBITDA CAGR = ~20% 2015-2020 `20% CAGR * For a reconciliation to GAAP see accompanying appendix 27 ** Does not include separation costs
|
|
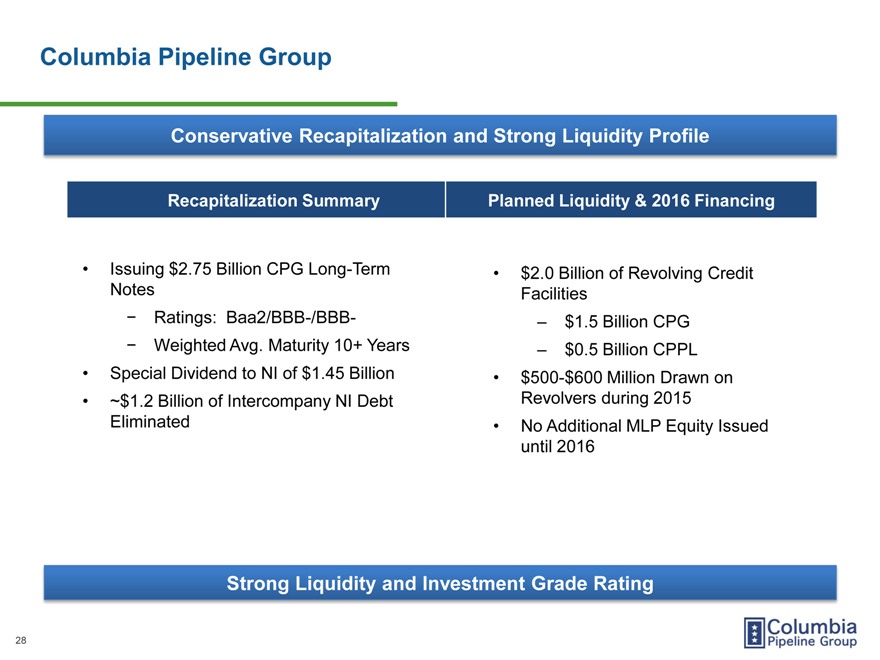
Columbia Pipeline Group Conservative Recapitalization and Strong Liquidity Profile Recapitalization Summary Planned Liquidity & 2016 Financing Issuing $2.75 Billion CPG Long-Term $2.0 Billion of Revolving Credit Notes Facilities—Ratings: Baa2/BBB-/BBB- ? $1.5 Billion CPG—Weighted Avg. Maturity 10+ Years ? $0.5 Billion CPPL Special Dividend to NI of $1.45 Billion $500-$600 Million Drawn on ~$1.2 Billion of Intercompany NI Debt Revolvers during 2015 Eliminated No Additional MLP Equity Issued until 2016 Strong Liquidity and Investment Grade Rating Columbia Pipeline Group 28
|
|
Columbia Pipeline Group Expansion Financing Plan CPPL to Provide Equity Funding ? Additional $4.0B Planned Issuances 2016-2018 Long-Term Debt Financing in Place by End of May ? Revolver Expected to be Primary Source of Short-Term Debt Funding Maintain Investment Grade Credit Ratings at CPG ? Near-Term: Debt/EBITDA ~4.5x ? Longer-Term: Debt/EBITDA ~4.0—4.5x Cash Flow and Debt Capacity Post-2018 Provides CPG Significant Optionality for: ? Growth Investments ? Dividend Increases ? Other Shareholder Initiatives Funding CPG Growth Primarily with Cash Flow and MLP Equity Columbia Pipeline Group 29
|
|
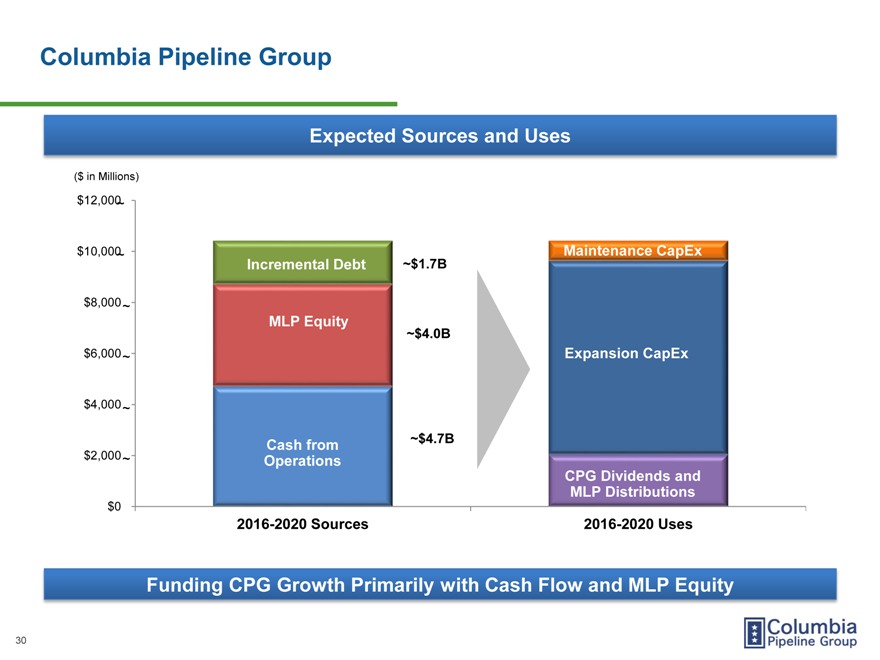
Columbia Pipeline Group Expected Sources and Uses ($ in Millions) $12,000 ~ $10,000 ~ Maintenance CapEx Incremental Debt ~$1.7B $8,000~ MLP Equity ~$4.0B $6,000~ Expansion CapEx Growth Capex $4,000~ Cash from ~$4.7B $2,000~ Operations CPG Dividends and MLP Distributions $0 2016-2020 Sources 2016-2020 Uses Funding CPG Growth Primarily with Cash Flow and MLP Equity Columbia Pipeline Group 30
|
|
Columbia Pipeline Group Summary Transformational Growth Strong Financial Plan Ample Liquidity and Investment Grade Credit Ratings Best-in-Class Equity Vehicle: CPPL—~20% Average Annual Distribution Growth Through 2020 Compelling CPG Investment Proposition ? ~20% Average Annual EBITDA Growth Through 2020 ? ~15% Average Annual Dividend Growth Through 2020 ? Valuable GP Interest; High Splits by ~2018 ? Initial Dividend Coverage of ~2x; In Line with GP Peers Over Time Compelling Investment Proposition Columbia Pipeline Group 31
|
|

Closing Remarks Bob Skaggs Chief Executive Officer
|
|
Columbia Pipeline Group A Premier Pipeline, Midstream & Storage Company Stable, Predictable and Growing Cash Flows Transformational Growth Unparalleled Strategic Footprint in Marcellus and Utica Shale Regions Experienced Leadership Team Financial Strength and Optionality Compelling Investment Proposition An Excellent Investment—Positioned for Transformational Growth Columbia Pipeline Group 33
|
|
Appendix
|
|
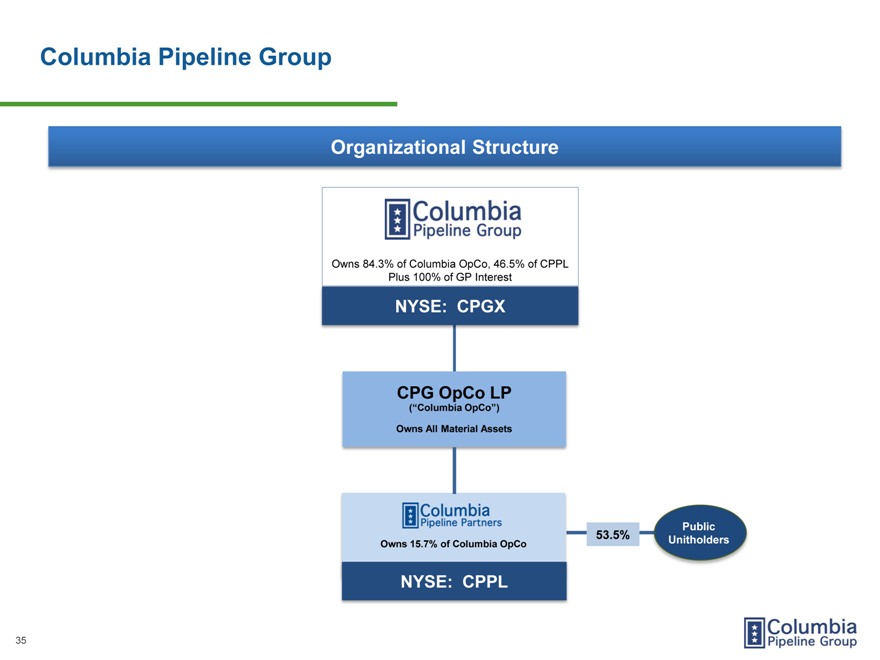
Columbia Pipeline Group Organizational Structure Owns 84.3% of Columbia OpCo, 46.5% of CPPL Plus 100% of GP Interest NYSE: CPGX CPG OpCo LP (“Columbia OpCo”) Owns All Material Assets Public Owns 15.7% of Columbia OpCo 53.5% Unitholders NYSE: CPPL Columbia Pipeline Group 35
|
|
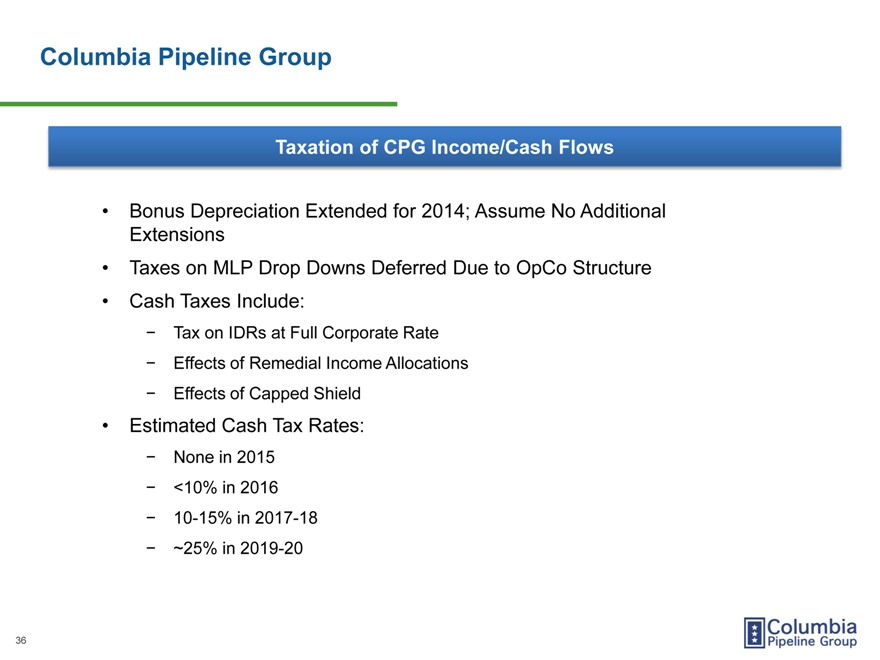
Columbia Pipeline Group Taxation of CPG Income/Cash Flows Bonus Depreciation Extended for 2014; Assume No Additional Extensions Taxes on MLP Drop Downs Deferred Due to OpCo Structure Cash Taxes Include:—Tax on IDRs at Full Corporate Rate—Effects of Remedial Income Allocations—Effects of Capped Shield Estimated Cash Tax Rates:—None in 2015—<10% in 2016—10-15% in 2017-18—~25% in 2019-20 Columbia Pipeline Group 36
|
|
Columbia Pipeline Group
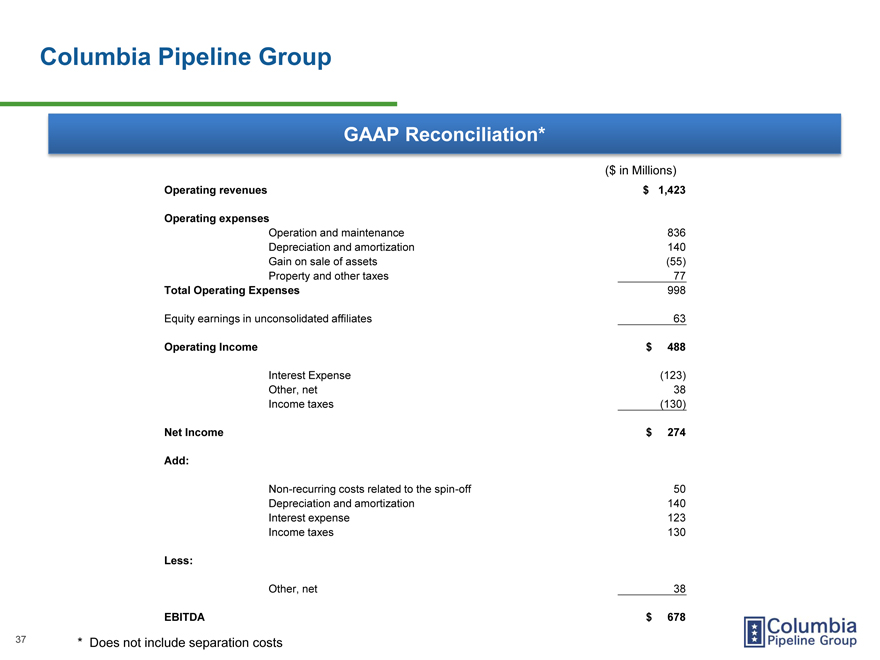
GAAP Reconciliation*
($ in Millions)
Operating revenues $ 1,423
Operating expenses
Operation and maintenance 836 Depreciation and amortization 140 Gain on sale of assets (55) Property and other taxes 77
Total Operating Expenses 998
Equity earnings in unconsolidated affiliates 63
Operating Income $ 488
Interest Expense (123) Other, net 38 Income taxes (130)
Net Income $ 274
Add:
Non-recurring costs related to the spin-off 50 Depreciation and amortization 140 Interest expense 123 Income taxes 130
Less:
Other, net 38
EBITDA $ 678
37 * Does not include separation costs
|
|
Columbia Pipeline Group Leadership Team Name & Position Background Named Chief Executive Officer of CPG in December 2014 Robert C. Skaggs Jr. Chief Executive Officer Named President of NiSource in 2004 and added the CEO responsibilities in July 2005 Prior to 2004, Skaggs was Executive Vice President, Regulated Revenue, for NiSource Skaggs joined the law department of Columbia Gas Transmission in 1981 and served in various management positions until he became President of Columbia Gas of Ohio and Columbia Gas of Kentucky in 1996 Named Chief Financial Officer of CPG in December 2014; responsible for the Columbia Stephen P. Smith Executive VP & Chief Pipeline Group?s (CPG) financial functions Financial Officer Currently NiSource CFO; Smith has held senior-level positions with American Electric Power Co. (AEP) and the Columbia Energy Group (CEG) Serves as a Director and Audit Committee member of Natural Resource Partners, L.P., a publicly traded master limited partnership principally engaged in the business of owning and managing mineral reserve properties. NRP primarily owns coal, aggregate and oil and gas reserves across the United States that generate royalty income for the partnership Named President of CPG in December 2014 Glen Kettering Serving as EVP and Group CEO for NiSource?s CPG unit since early 2014 President Prior to this position, Kettering served as Senior Vice President, Corporate Affairs, where he was responsible for leading NiSource?s investor relations, communications and federal government affairs functions He also served in a variety of legal, regulatory, commercial and executive roles, including President of Columbia Gas Transmission and Columbia Gulf Transmission 38
|
|
Columbia Pipeline Group Leadership Team Name & Position Background Stan Chapman III Named Executive Vice President and Chief Commercial Officer of CPG in December 2014; Executive VP & Chief originally joined NiSource in December 2011 Commercial Officer Prior to this position, Chapman spent nearly 23 years in various roles within the El Paso Pipeline Group where he was Vice President for Marketing, Business Development and Asset Optimization Named Executive Vice President and Chief Operating Officer of CPG in December 2014; joined Shawn Patterson CPG in 2012 and has been with NiSource for 20 years Executive VP & Chief Operating Officer Patterson is responsible for operations, engineering and project delivery across CPG He also oversees the execution of CPG?s modernization and growth programs Previously served in various operational leadership roles with NiSource Electric and Gas utilities Named Executive Vice President and Chief Operating Officer, Midstream of CPG in December 2014; originally joined CPG in 2010 Brett Stovern Executive VP & Chief Stovern brings a broad range of experience, including over 15 years of energy industry experience; Operating Officer, Midstream his background includes business development, arranging complex financial transactions and leading risk management activities Prior to his career at CPG, Stovern served as Vice President and Treasurer of AGL Resources Named Senior Vice President and General Counsel of CPG in December 2014 Robert Smith Senior VP & General Counsel Served as NiSource Corporate Secretary, VP and Deputy General Counsel beginning in September 2008 and April 2013, respectively 18 years experience in the energy industry, with significant experience in regulatory, finance, securities, governance, major transactions and general corporate law 39
|
|
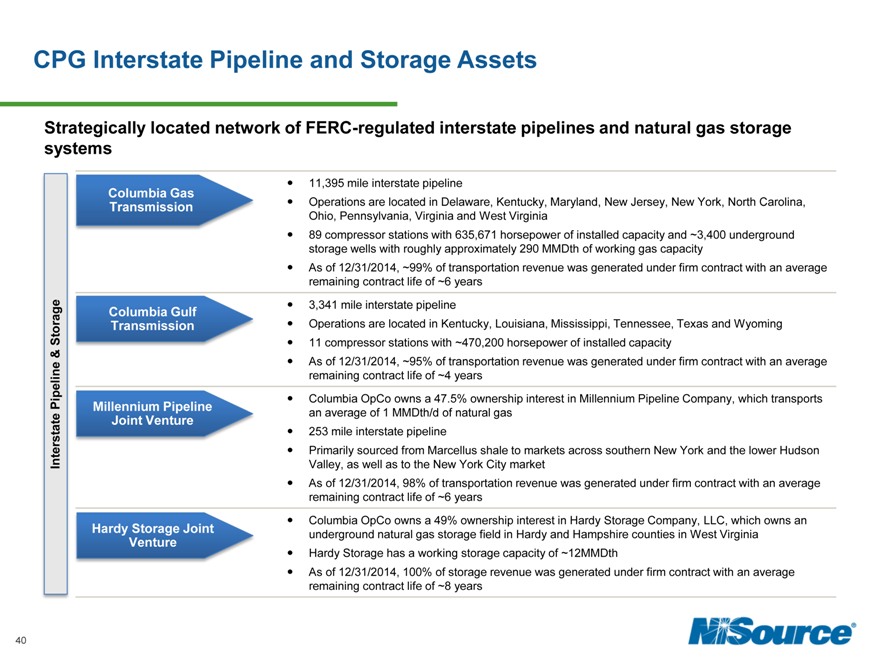
CPG Interstate Pipeline and Storage Assets Strategically located network of FERC-regulated interstate pipelines and natural gas storage systems 11,395 mile interstate pipeline Columbia Gas Transmission Operations are located in Delaware, Kentucky, Maryland, New Jersey, New York, North Carolina, Ohio, Pennsylvania, Virginia and West Virginia 89 compressor stations with 635,671 horsepower of installed capacity and ~3,400 underground storage wells with roughly approximately 290 MMDth of working gas capacity As of 12/31/2014, ~99% of transportation revenue was generated under firm contract with an average remaining contract life of ~6 years 3,341 mile interstate pipeline Columbia Gulf Storage Transmission Operations are located in Kentucky, Louisiana, Mississippi, Tennessee, Texas and Wyoming 11 compressor stations with ~470,200 horsepower of installed capacity & As of 12/31/2014, ~95% of transportation revenue was generated under firm contract with an average remaining contract life of ~4 years Pipeline Columbia OpCo owns a 47.5% ownership interest in Millennium Pipeline Company, which transports Millennium Pipeline Joint Venture an average of 1 MMDth/d of natural gas 253 mile interstate pipeline Primarily sourced from Marcellus shale to markets across southern New York and the lower Hudson Interstate Valley, as well as to the New York City market As of 12/31/2014, 98% of transportation revenue was generated under firm contract with an average remaining contract life of ~6 years Columbia OpCo owns a 49% ownership interest in Hardy Storage Company, LLC, which owns an Hardy Storage Joint underground natural gas storage field in Hardy and Hampshire counties in West Virginia Venture Hardy Storage has a working storage capacity of ~12MMDth As of 12/31/2014, 100% of storage revenue was generated under firm contract with an average remaining contract life of ~8 years NISource 40
|
|
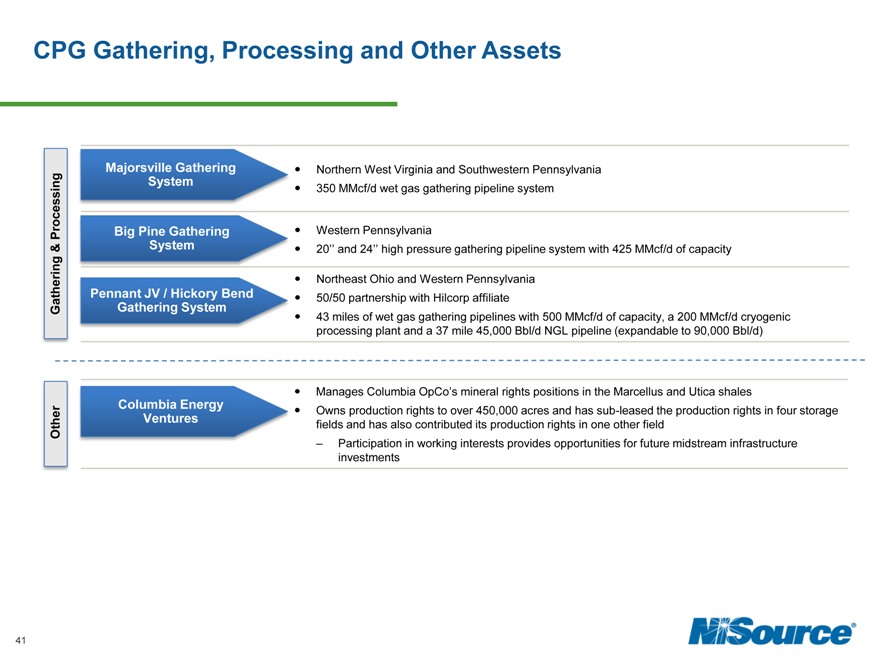
CPG Gathering, Processing and Other Assets Majorsville Gathering Northern West Virginia and Southwestern Pennsylvania System 350 MMcf/d wet gas gathering pipeline system Processing Big Pine Gathering Western Pennsylvania & System 20” and 24” high pressure gathering pipeline system with 425 MMcf/d of capacity Northeast Ohio and Western Pennsylvania Pennant JV / Hickory Bend 50/50 partnership with Hilcorp affiliate Gathering Gathering System 43 miles of wet gas gathering pipelines with 500 MMcf/d of capacity, a 200 MMcf/d cryogenic processing plant and a 37 mile 45,000 Bbl/d NGL pipeline (expandable to 90,000 Bbl/d) Manages Columbia OpCo’s mineral rights positions in the Marcellus and Utica shales Columbia Energy Owns production rights to over 450,000 acres and has sub-leased the production rights in four storage Ventures Other fields and has also contributed its production rights in one other field ? Participation in working interests provides opportunities for future midstream infrastructure investments NISource 41
|
|
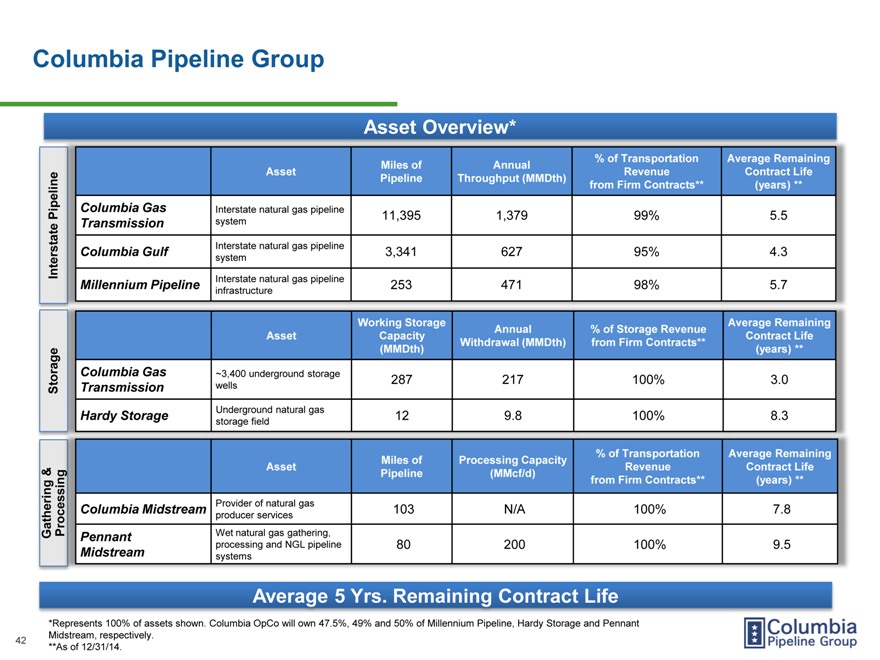
Columbia Pipeline Group Asset Overview* % of Transportation Average Remaining Miles of Annual Asset Revenue Contract Life Pipeline Throughput (MMDth) peline from Firm Contracts** (years) ** Columbia Gas Interstate natural gas pipeline Pi 11,395 1,379 99% 5.5 Transmission system Interstate natural gas pipeline Columbia Gulf 3,341 627 95% 4.3 Interstate system Interstate natural gas pipeline Millennium Pipeline 253 471 98% 5.7 infrastructure Working Storage Average Remaining Annual % of Storage Revenue Asset Capacity Contract Life Withdrawal (MMDth) from Firm Contracts** (MMDth) (years) ** Columbia Gas ~3,400 underground storage 287 217 100% 3.0 Storage Transmission wells Hardy Storage Underground natural gas 12 9.8 100% 8.3 storage field % of Transportation Average Remaining Asset Miles of Processing Capacity Revenue Contract Life & Pipeline (MMcf/d) from Firm Contracts** (years) ** Columbia Midstream Provider of natural gas 103 N/A 100% 7.8 producer services Gathering Processing Pennant Wet natural gas gathering, processing and NGL pipeline 80 200 100% 9.5 Midstream systems 42 *Represents 100% of assets shown. Columbia will own 47.5%, 49% and 50% of Millennium Pipeline, Hardy Storage and Pennant Midstream, respectively.