Attached files
| file | filename |
|---|---|
| 8-K - CURRENT REPORT - Western New England Bancorp, Inc. | wfd-8k_051315.htm |
Exhibit 99.1

W ESTFIELD F INANCIAL , I NC . NASDAQ: WFD I NVESTOR P RESENTATION
F ORWARD – LOOKING STATEMENTS Today’s presentation may contain forward - looking statements, which may be identified by the use of such words as “believe,” “expect,” “anticipate,” “should,” “planned,” “estimated” and “potential . ” Examples of forward - looking statements include, but are not limited to, estimates with respect to our financial condition and results of operation and business that are subject to various factors which could cause actual results to differ materially from these estimates . These factors include, but are not limited to : changes in the interest rate environment that reduce margins; changes in the regulatory environment; the highly competitive industry and market area in which we operate; general economic conditions, either nationally or regionally, resulting in, among other things, a deterioration in credit qua lit y; changes in business conditions and inflation; changes in credit market conditions; changes in the securities markets which affect investment management revenues; increases in Federal Deposit Insurance Corporation deposit insurance premiums and assessments could adversely affect our fina nci al condition; changes in technology used in the banking business; the soundness of other financial services institutions which may adversely affect our credit risk; certain of our intangible assets may become impaired in the future; our controls and procedures may fail or be circumvented; new line of business or new products and services, which may subject us to additional risks; changes in key management personnel which may adversely impact our operations; the effect on our operations of governmental legislation and regulation, including changes in accounting regulation or standa rds , the nature and timing of the adoption and effectiveness of new requirements under the Dodd - Frank Act, Basel guidelines, capital requirements and other applicable laws and regulations; severe weather, natural disasters, acts of war or terrorism and other external events which could significantly impact our bu sin ess; and other factors detailed from time to time in our Securities and Exchange Commission (“SEC”) filings. Any or all of our forward - looking statements in today’s presentation or in any other public statements we make may turn out to be wrong . They can be affected by inaccurate assumptions we might make or known or unknown risks and uncertainties . Consequently, no forward - looking statements can be guaranteed . We disclaim any obligation to subsequently revise any forward - looking statements to reflect events or circumstances after the date of such statements, or to reflect the occurrence of anticipated or unanticipated events . 2
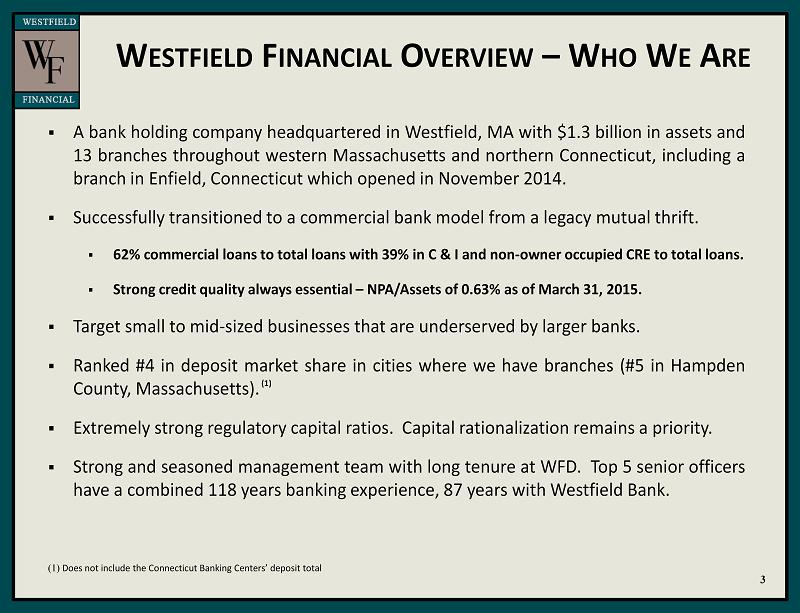
W ESTFIELD F INANCIAL O VERVIEW – W HO W E A RE ▪ A bank holding company headquartered in Westfield, MA with $ 1 . 3 billion in assets and 13 branches throughout western Massachusetts and northern Connecticut, including a branch in Enfield, Connecticut which opened in November 2014 . ▪ Successfully transitioned to a commercial bank model from a legacy mutual thrift . ▪ 62 % commercial loans to total loans with 39 % in C & I and non - owner occupied CRE to total loans . ▪ Strong credit quality always essential – NPA/Assets of 0 . 63 % as of March 31 , 2015 . ▪ Target small to mid - sized businesses that are underserved by larger banks . ▪ Ranked # 4 in deposit market share in cities where we have branches (# 5 in Hampden County, Massachusetts) . ▪ Extremely strong regulatory capital ratios . Capital rationalization remains a priority . ▪ Strong and seasoned management team with long tenure at WFD . Top 5 senior officers have a combined 118 years banking experience, 87 years with Westfield Bank . ( 1 ) Does not include the Connecticut Banking Centers’ deposit total 3 (1)
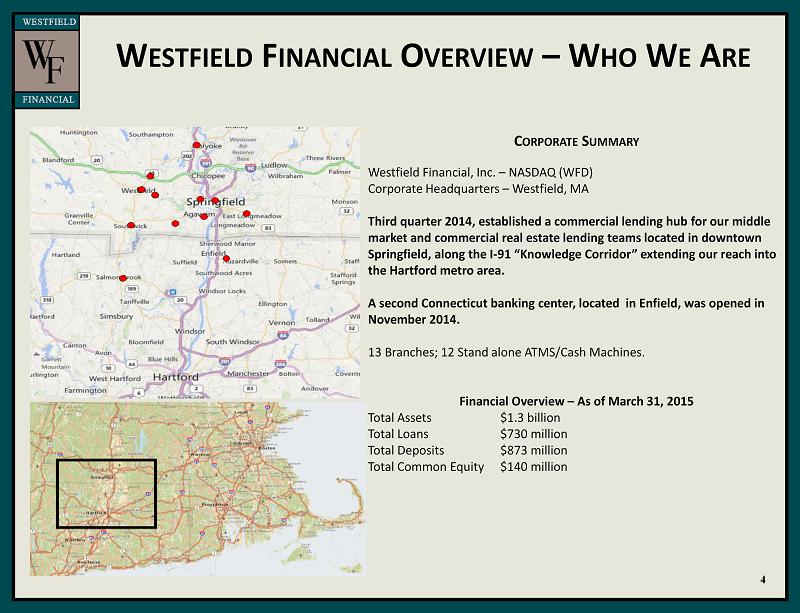
W ESTFIELD F INANCIAL O VERVIEW – W HO W E A RE C ORPORATE S UMMARY Westfield Financial, Inc. – NASDAQ (WFD) Corporate Headquarters – Westfield, MA Third quarter 2014, established a commercial lending hub for our middle market and commercial real estate lending teams located in downtown Springfield, along the I - 91 “Knowledge Corridor ” extending our reach into the Hartford metro area. A second Connecticut banking center, located in Enfield, was opened in November 2014. 13 Branches; 12 Stand alone ATMS/Cash Machines. Financial Overview – As of March 31, 2015 Total Assets $1.3 billion Total Loans $730 million Total Deposits $873 million Total Common Equity $140 million 4
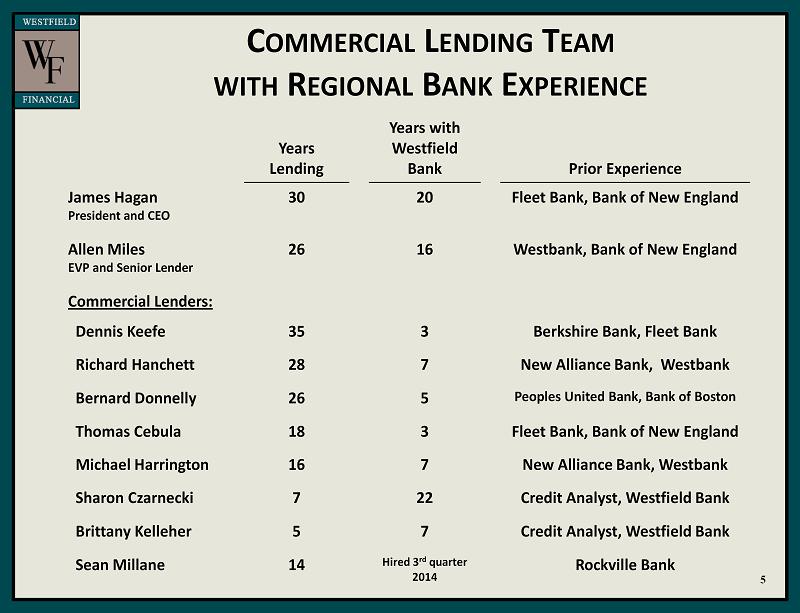
C OMMERCIAL L ENDING T EAM WITH R EGIONAL B ANK E XPERIENCE Years Lending Years with Westfield Bank Prior Experience James Hagan President and CEO 30 20 Fleet Bank, Bank of New England Allen Miles EVP and Senior Lender 26 16 Westbank, Bank of New England Commercial Lenders: Dennis Keefe 35 3 Berkshire Bank, Fleet Bank Richard Hanchett 28 7 New Alliance Bank, Westbank Bernard Donnelly 26 5 Peoples United Bank, Bank of Boston Thomas Cebula 18 3 Fleet Bank, Bank of New England Michael Harrington 16 7 New Alliance Bank, Westbank Sharon Czarnecki 7 22 Credit Analyst, Westfield Bank Brittany Kelleher 5 7 Credit Analyst, Westfield Bank Sean Millane 14 Hired 3 rd quarter 2014 Rockville Bank 5
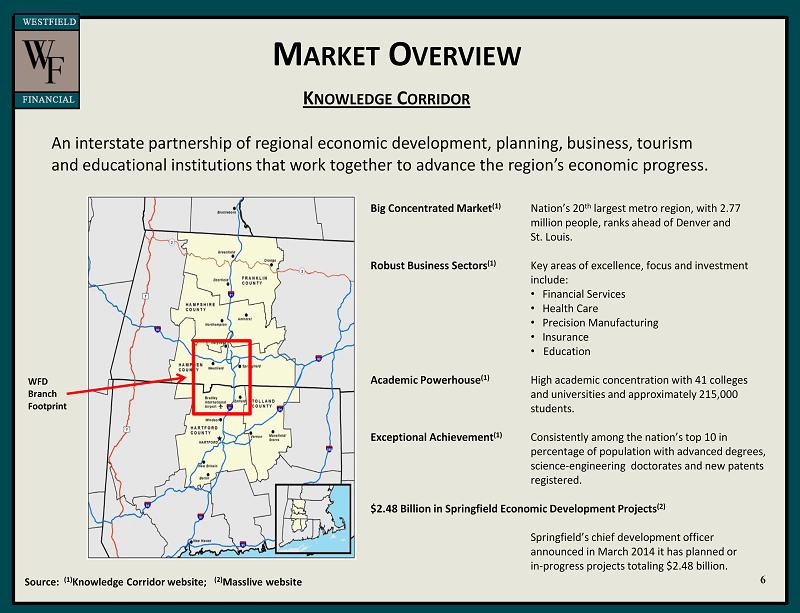
M ARKET O VERVIEW 6 Source: (1) Knowledge Corridor website; (2) Masslive website Big Concentrated Market (1) Nation’s 20 th largest metro region, with 2.77 million people, ranks ahead of Denver and St. Louis. Robust Business Sectors (1 ) Key areas of excellence, focus and investment include: • Financial Services • Health Care • Precision Manufacturing • Insurance • Education Academic Powerhouse (1) High academic concentration with 41 colleges and universities and approximately 215,000 students. Exceptional Achievement (1) Consistently among the nation’s top 10 in percentage of population with advanced degrees, science - engineering doctorates and new patents registered. $2.48 Billion in Springfield Economic Development Projects (2) Springfield’s chief development officer announced in March 2014 it has planned or in - progress projects totaling $2.48 billion. WFD Branch Footprint K NOWLEDGE C ORRIDOR An interstate partnership of regional economic development, planning, business, tourism and educational institutions that work together to advance the region’s economic progress.
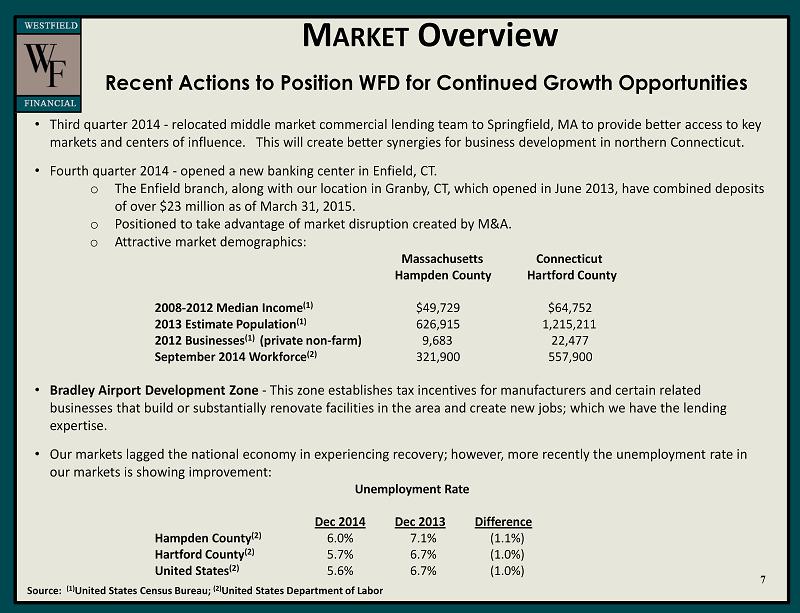
M ARKET Overview 7 Source: (1) United States Census Bureau; (2) United States Department of Labor • Third quarter 2014 - relocated middle market commercial lending team to Springfield, MA to provide better access to key markets and centers of influence. This will create better synergies for business development in northern Connecticut. • Fourth quarter 2014 - opened a new banking center in Enfield, CT. o The Enfield branch, along with our location in Granby, CT, which opened in June 2013, have combined deposits of over $23 million as of March 31, 2015. o Positioned to take advantage of market disruption created by M&A. o Attractive market demographics : Massachusetts Connecticut Hampden County Hartford County 2008 - 2012 Median Income (1 ) $ 49,729 $64,752 2013 E stimate Population (1) 626,915 1,215,211 2012 Businesses (1) (private non - farm) 9,683 22,477 September 2014 Workforce (2) 321,900 557,900 • Bradley Airport Development Zone - This zone establishes tax incentives for manufacturers and certain related businesses that build or substantially renovate facilities in the area and create new jobs; which we have the lending expertise. • Our markets lagged the national economy in experiencing recovery; however, more recently the unemployment rate in our markets is showing improvement: Unemployment Rate Dec 2014 Dec 2013 Difference Hampden County (2) 6.0% 7 .1% (1.1%) Hartford County (2) 5 .7% 6.7% ( 1 .0%) United States (2) 5.6% 6.7% ( 1.0%) Recent Actions to Position WFD for Continued Growth Opportunities
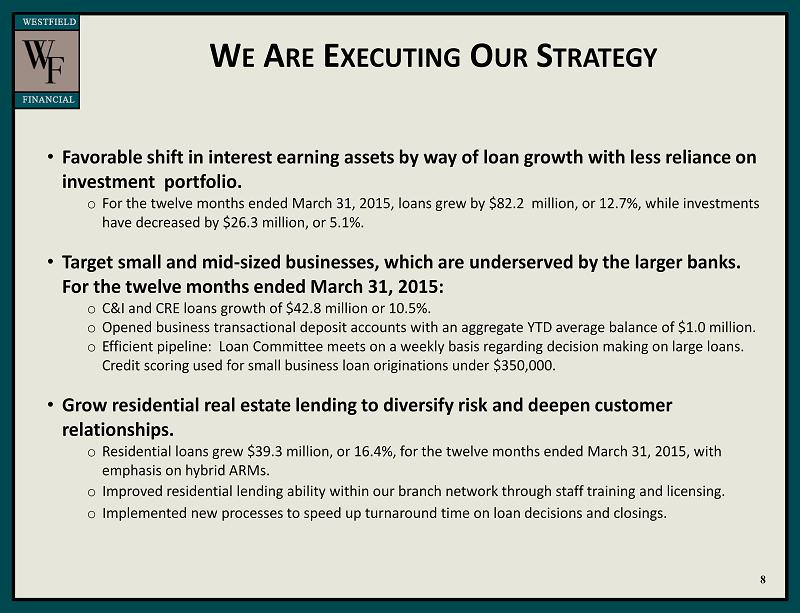
W E A RE E XECUTING O UR S TRATEGY • Favorable shift in interest earning assets by way of loan growth with less reliance on investment portfolio. o For the twelve months ended March 31, 2015, loans grew by $82.2 million, or 12.7%, while investments have decreased by $26.3 million, or 5.1%. • Target small and mid - sized businesses, which are underserved by the larger banks. For the twelve months ended March 31, 2015: o C&I and CRE loans growth of $42.8 million or 10.5%. o Opened business transactional deposit accounts with an aggregate YTD average balance of $1.0 million. o Efficient pipeline: Loan Committee meets on a weekly basis regarding decision making on large loans. Credit scoring used for small business loan originations under $350,000. • Grow residential real estate lending to diversify risk and deepen customer relationships. o Residential loans grew $39.3 million, or 16.4%, for the twelve months ended March 31, 2015, with emphasis on hybrid ARMs . o Improved residential lending ability within our branch network through staff training and licensing. o Implemented new processes to speed up turnaround time on loan decisions and closings. 8
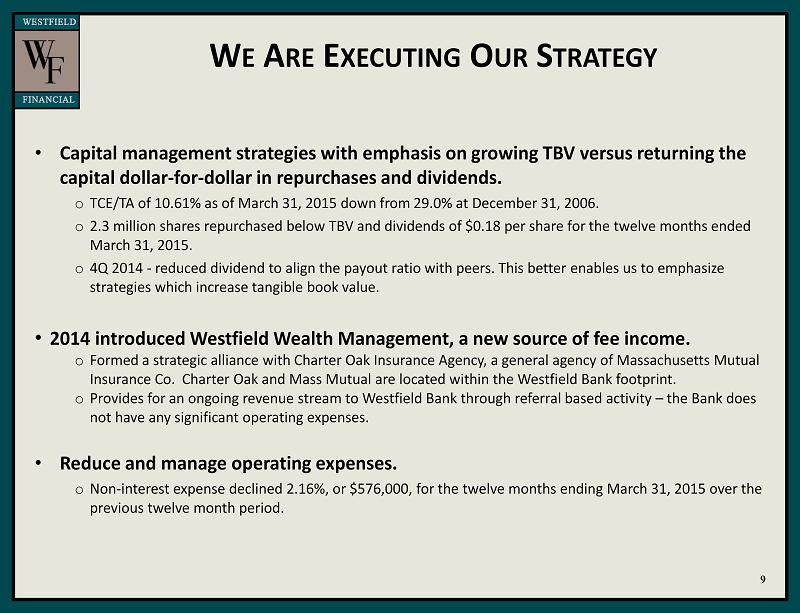
W E A RE E XECUTING O UR S TRATEGY • Capital management strategies with emphasis on growing TBV versus returning the capital dollar - for - dollar in repurchases and dividends. o TCE/TA of 10.61% as of March 31, 2015 down from 29.0% at December 31, 2006. o 2.3 million shares repurchased below TBV and dividends of $0.18 per share for the twelve months ended March 31, 2015. o 4Q 2014 - reduced dividend to align the payout ratio with peers. This better enables us to emphasize strategies which increase tangible book value. • 2014 introduced Westfield Wealth Management, a new source of fee income. o Formed a strategic alliance with Charter Oak Insurance Agency, a general agency of Massachusetts Mutual Insurance Co. Charter Oak and Mass Mutual are located within the Westfield Bank footprint. o Provides for an ongoing revenue stream to Westfield Bank through referral based activity – the Bank does not have any significant operating expenses . • Reduce and manage operating expenses. o Non - interest expense declined 2.16%, or $576,000, for the twelve months ending March 31, 2015 over the previous twelve month period. 9
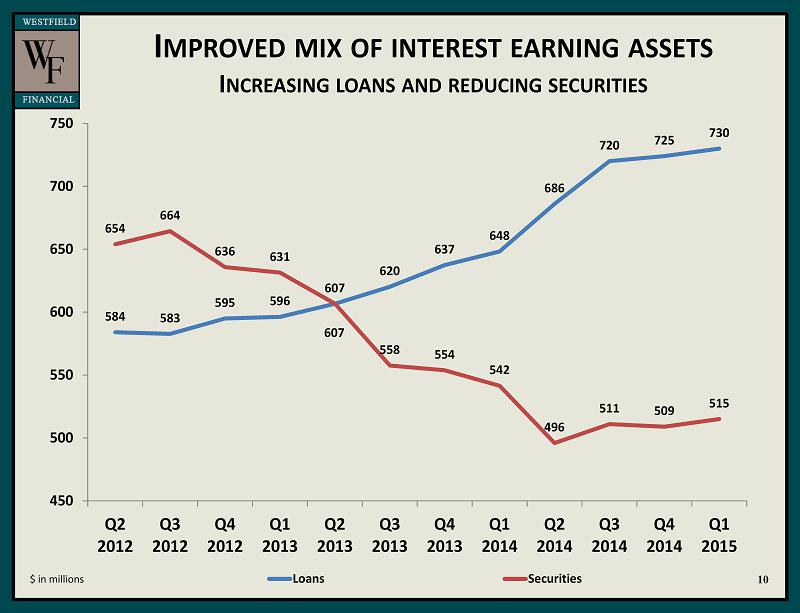
I MPROVED MIX OF INTEREST EARNING ASSETS I NCREASING LOANS AND REDUCING SECURITIES 10 $ in millions 584 583 595 596 607 620 637 648 686 720 725 730 654 664 636 631 607 558 554 542 496 511 509 515 450 500 550 600 650 700 750 Q2 2012 Q3 2012 Q4 2012 Q1 2013 Q2 2013 Q3 2013 Q4 2013 Q1 2014 Q2 2014 Q3 2014 Q4 2014 Q1 2015 Loans Securities
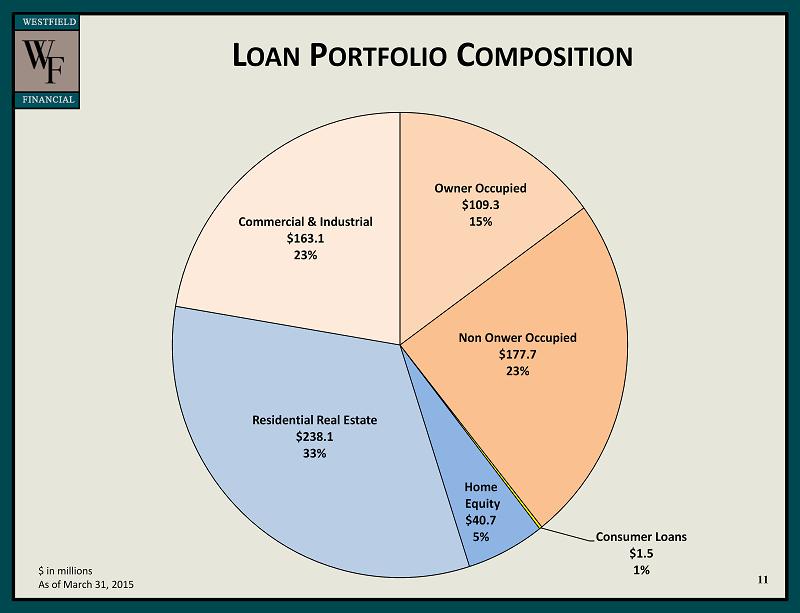
L OAN P ORTFOLIO C OMPOSITION $ in millions As of March 31, 2015 11 Owner Occupied $109.3 15% Non Onwer Occupied $177.7 23% Consumer Loans $1.5 1% Home Equity $40.7 5% Residential Real Estate $238.1 33% Commercial & Industrial $163.1 23%
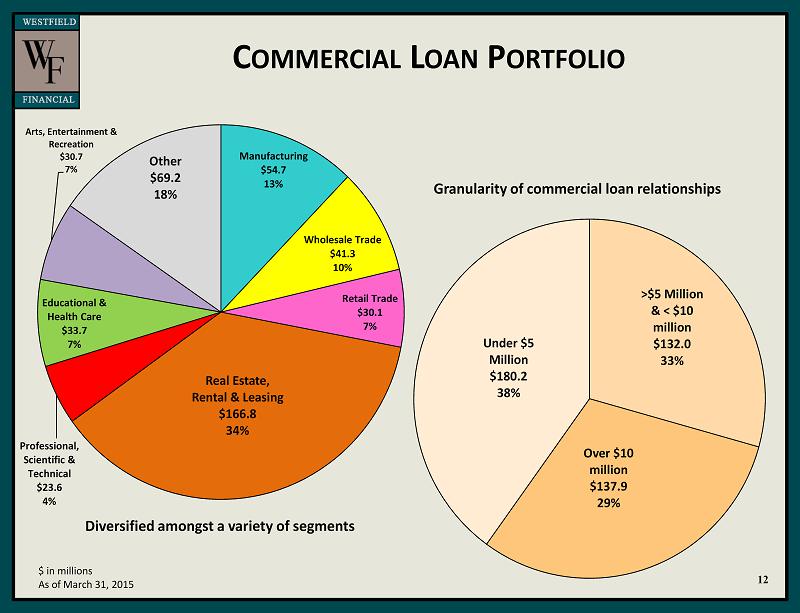
C OMMERCIAL L OAN P ORTFOLIO 12 $ in millions As of March 31, 2015 Granularity of commercial loan relationships Diversified amongst a variety of segments >$5 Million & < $10 million $132.0 33% Over $10 million $137.9 29% Under $5 Million $180.2 38% Manufacturing $54.7 13% Wholesale Trade $41.3 10% Retail Trade $30.1 7% Real Estate, Rental & Leasing $166.8 34% Professional, Scientific & Technical $23.6 4% Educational & Health Care $33.7 7% Arts, Entertainment & Recreation $30.7 7% Other $69.2 18%
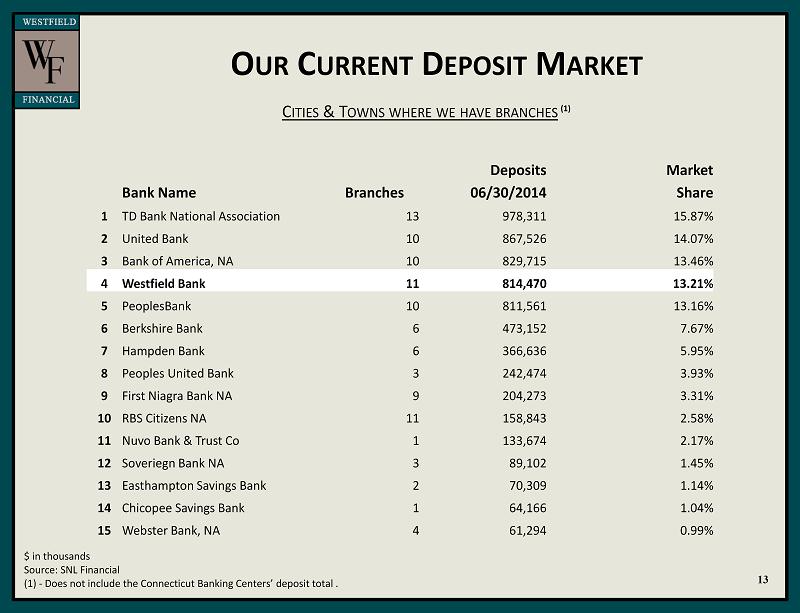
O UR C URRENT D EPOSIT M ARKET C ITIES & T OWNS WHERE WE HAVE BRANCHES $ in thousands Source: SNL Financial (1) - Does not include the Connecticut Banking Centers’ deposit total . 13 Deposits Market Bank Name Branches 06/30/2014 Share 1 TD Bank National Association 13 978,311 15.87% 2 United Bank 10 867,526 14.07% 3 Bank of America, NA 10 829,715 13.46% 4 Westfield Bank 11 814,470 13.21% 5 PeoplesBank 10 811,561 13.16% 6 Berkshire Bank 6 473,152 7.67% 7 Hampden Bank 6 366,636 5.95% 8 Peoples United Bank 3 242,474 3.93% 9 First Niagra Bank NA 9 204,273 3.31% 10 RBS Citizens NA 11 158,843 2.58% 11 Nuvo Bank & Trust Co 1 133,674 2.17% 12 Soveriegn Bank NA 3 89,102 1.45% 13 Easthampton Savings Bank 2 70,309 1.14% 14 Chicopee Savings Bank 1 64,166 1.04% 15 Webster Bank, NA 4 61,294 0.99% (1)
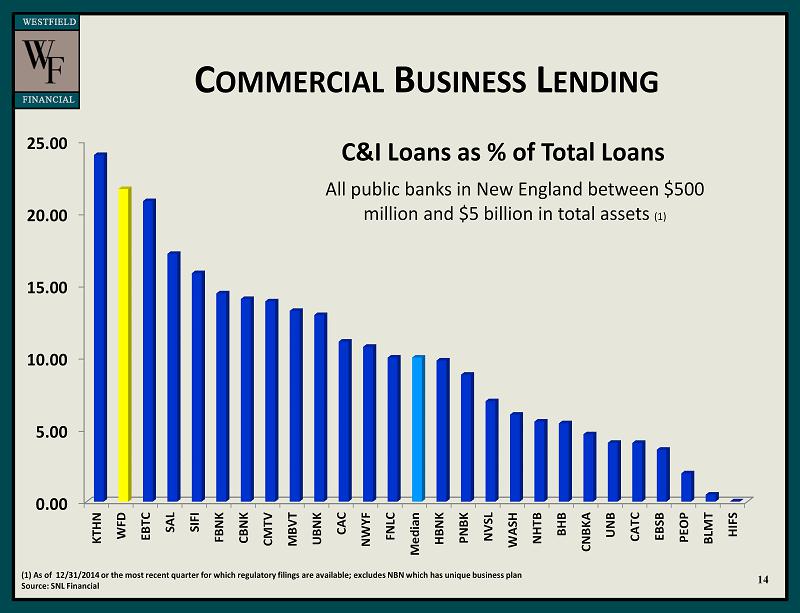
(1) As of 12/31/2014 or the most recent quarter for which regulatory filings are available ; excludes NBN which has unique business plan Source: SNL Financial C OMMERCIAL B USINESS L ENDING C&I Loans as % of Total Loans All public banks in New England between $500 million and $5 billion in total assets (1) 14 0.00 5.00 10.00 15.00 20.00 25.00 KTHN WFD EBTC SAL SIFI FBNK CBNK CMTV MBVT UBNK CAC NWYF FNLC Median HBNK PNBK NVSL WASH NHTB BHB CNBKA UNB CATC EBSB PEOP BLMT HIFS
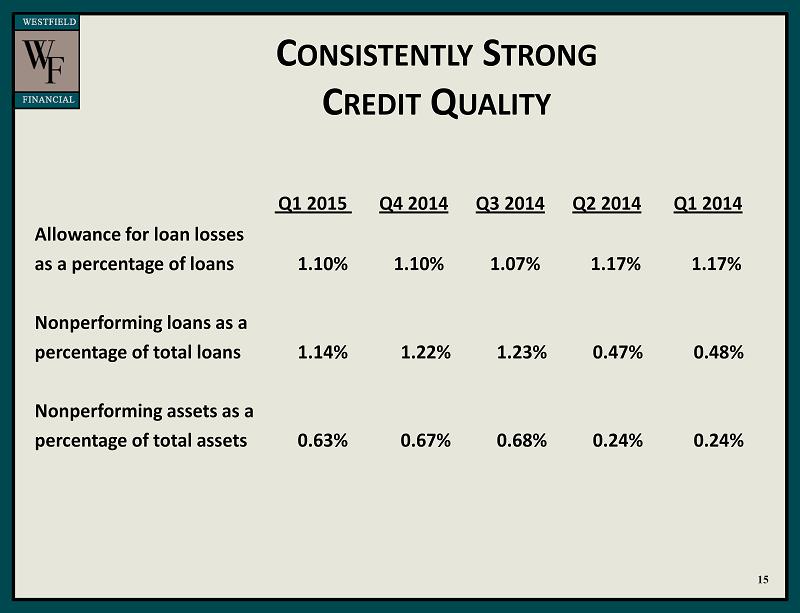
C ONSISTENTLY S TRONG C REDIT Q UALITY 15 Q1 2015 Q4 2014 Q3 2014 Q2 2014 Q1 2014 Allowance for loan losses as a percentage of loans 1.10% 1.10% 1.07% 1.17% 1.17% Nonperforming loans as a percentage of total loans 1.14% 1.22% 1.23% 0.47% 0.48% Nonperforming assets as a percentage of total assets 0.63% 0.67% 0.68% 0.24% 0.24%
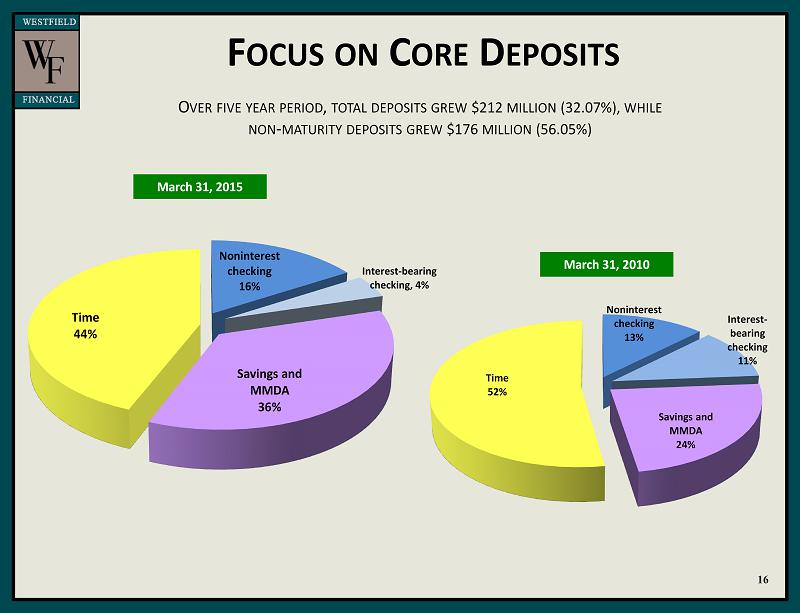
F OCUS ON C ORE D EPOSITS O VER FIVE YEAR PERIOD , TOTAL DEPOSITS GREW $212 MILLION (32.07%), WHILE N ON - MATURITY DEPOSITS GREW $176 MILLION (56.05%) March 31, 2015 March 31, 2010 16 Noninterest checking 13% Interest - bearing checking 11% Savings and MMDA 24% Time 52% Noninterest checking 16% Interest - bearing checking, 4% Savings and MMDA 36% Time 44%
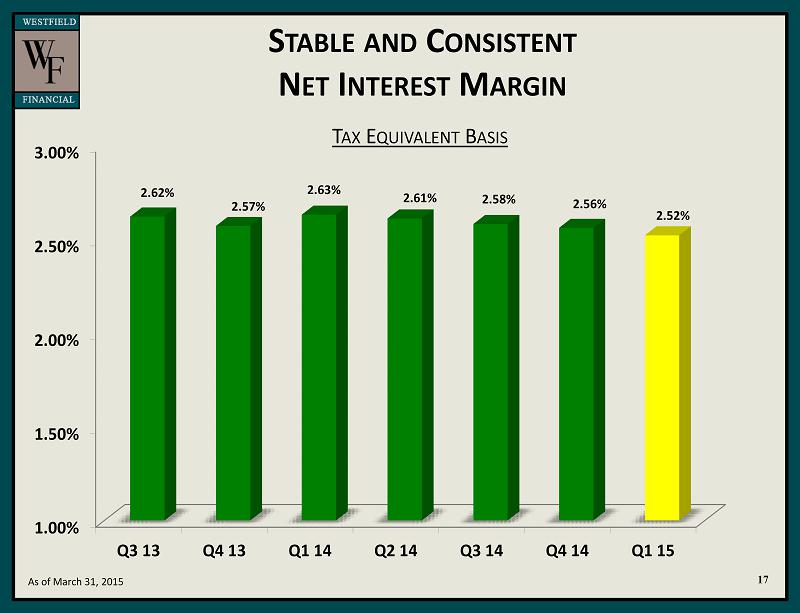
S TABLE AND C ONSISTENT N ET I NTEREST M ARGIN T AX E QUIVALENT B ASIS 17 As of March 31, 2015 1.00% 1.50% 2.00% 2.50% 3.00% Q3 13 Q4 13 Q1 14 Q2 14 Q3 14 Q4 14 Q1 15 2.62% 2.57% 2.63% 2.61% 2.58% 2.56% 2.52%
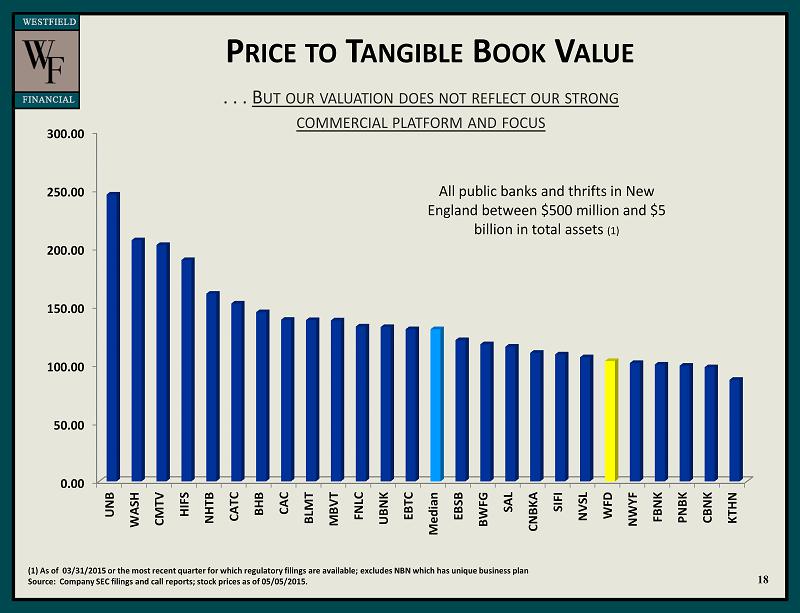
P RICE TO T ANGIBLE B OOK V ALUE (1) As of 03/31/2015 or the most recent quarter for which regulatory filings are available; excludes NBN which has unique bu sin ess plan Source: Company SEC filings and call reports; stock prices as of 05/05/2015. . . . B UT OUR VALUATION DOES NOT REFLECT OUR STRONG COMMERCIAL PLATFORM AND FOCUS All public banks and thrifts in New England between $500 million and $5 billion in total assets (1) 18 0.00 50.00 100.00 150.00 200.00 250.00 300.00 UNB WASH CMTV HIFS NHTB CATC BHB CAC BLMT MBVT FNLC UBNK EBTC Median EBSB BWFG SAL CNBKA SIFI NVSL WFD NWYF FBNK PNBK CBNK KTHN
W HY I NVEST IN W ESTFIELD F INANCIAL • Stock trading near tangible book . • Experienced, disciplined regional leadership team. • Continued opportunities for organic growth. • Expansion into demographically attractive markets. • Improving mix of interest earning assets. • High credit quality. • Balance sheet mix well positioned for rising rates. • Noninterest income opportunities from new wealth management services. 19
APPENDIX 20
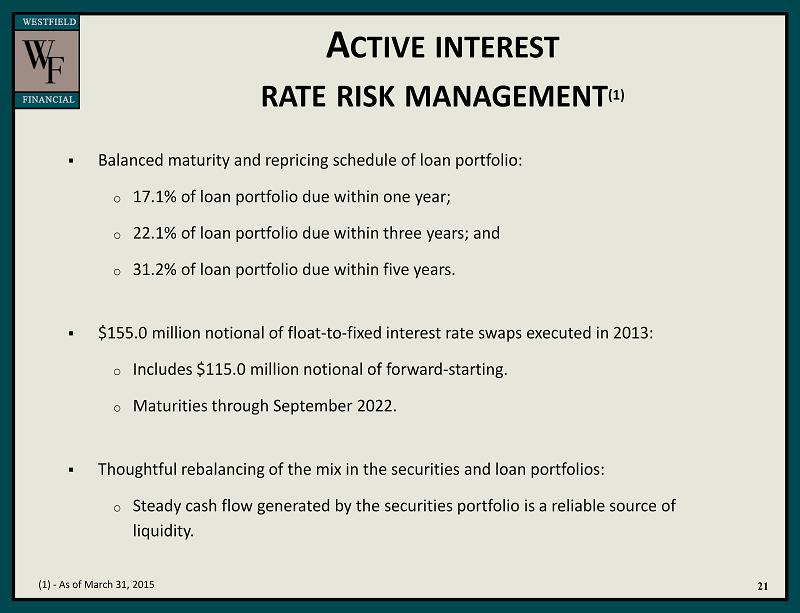
▪ Balanced maturity and repricing schedule of loan portfolio: o 17.1% of loan portfolio due within one year; o 22.1% of loan portfolio due within three years; and o 31.2% of loan portfolio due within five years. ▪ $ 155.0 million notional of float - to - fixed interest rate swaps executed in 2013: o Includes $ 115.0 million notional of forward - starting. o Maturities through September 2022 . ▪ Thoughtful rebalancing of the mix in the securities and loan portfolios: o Steady cash flow generated by the securities portfolio is a reliable source of liquidity . 21 A CTIVE INTEREST RATE RISK MANAGEMENT (1) (1) - As of March 31, 2015
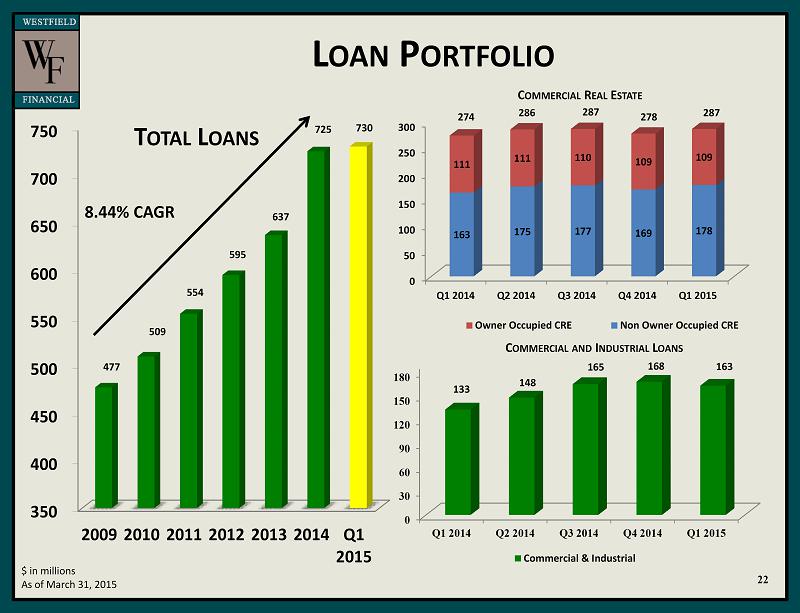
L OAN P ORTFOLIO 22 $ in millions As of March 31, 2015 274 286 287 278 C OMMERCIAL R EAL E STATE C OMMERCIAL AND I NDUSTRIAL L OANS T OTAL L OANS 8 .44% CAGR 0 30 60 90 120 150 180 Q1 2014 Q2 2014 Q3 2014 Q4 2014 Q1 2015 133 148 165 168 163 Commercial & Industrial 287 0 50 100 150 200 250 300 Q1 2014 Q2 2014 Q3 2014 Q4 2014 Q1 2015 163 175 177 169 178 111 111 110 109 109 Owner Occupied CRE Non Owner Occupied CRE 350 400 450 500 550 600 650 700 750 2009 2010 2011 2012 2013 2014 Q1 2015 477 509 554 595 637 725 730
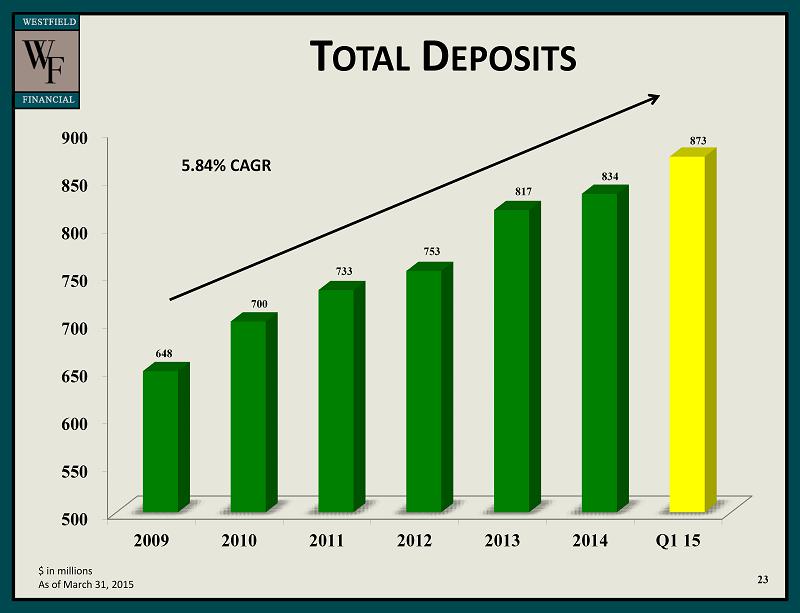
T OTAL D EPOSITS 23 $ in millions As of March 31, 2015 5.84% CAGR 500 550 600 650 700 750 800 850 900 2009 2010 2011 2012 2013 2014 Q1 15 648 700 733 753 817 834 873
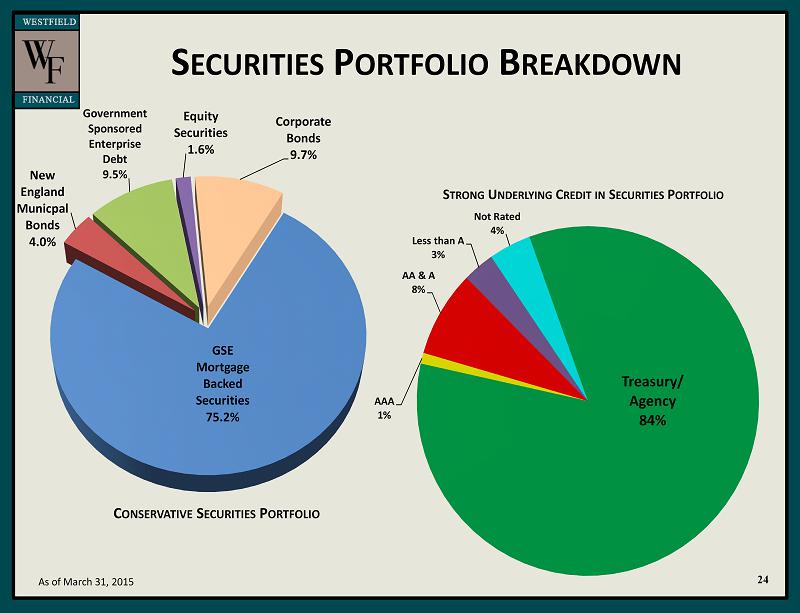
S ECURITIES P ORTFOLIO B REAKDOWN 24 As of March 31, 2015 S TRONG U NDERLYING C REDIT IN S ECURITIES P ORTFOLIO C ONSERVATIVE S ECURITIES P ORTFOLIO Treasury / Agency 84% AAA 1% AA & A 8% Less than A 3% Not Rated 4% GSE Mortgage Backed Securities 75.2% New England Municpal Bonds 4.0% Government Sponsored Enterprise Debt 9.5% Equity Securities 1.6% Corporate Bonds 9.7%
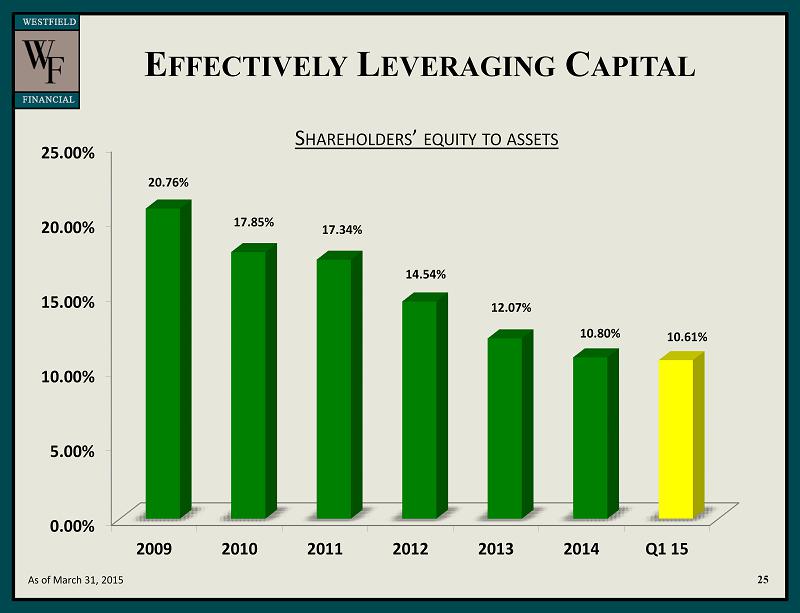
E FFECTIVELY L EVERAGING C APITAL S HAREHOLDERS ’ EQUITY TO ASSETS 25 As of March 31, 2015 0.00% 5.00% 10.00% 15.00% 20.00% 25.00% 2009 2010 2011 2012 2013 2014 Q1 15 20.76% 17.85% 17.34% 14.54% 12.07% 10.80% 10.61%
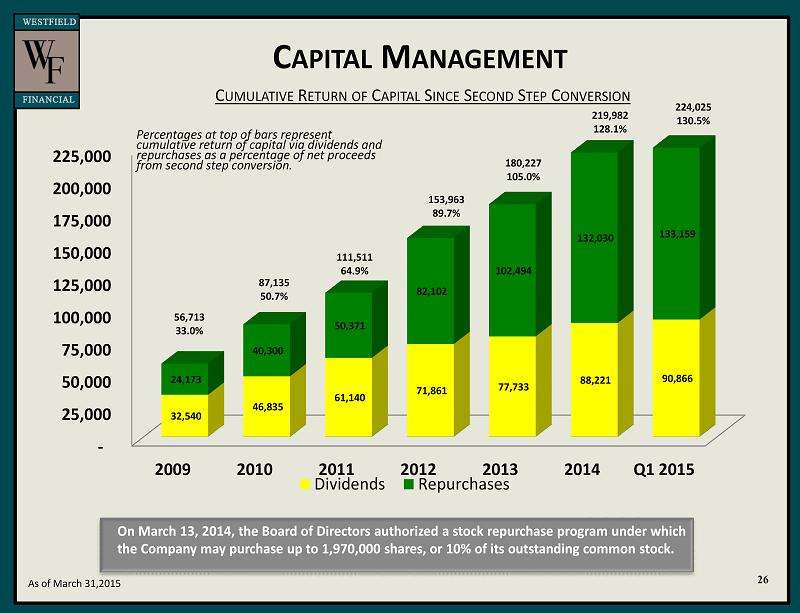
C APITAL M ANAGEMENT C UMULATIVE R ETURN OF C APITAL S INCE S ECOND S TEP C ONVERSION On March 13, 2014, the Board of Directors authorized a stock repurchase program under which the Company may purchase up to 1,970,000 shares, or 10% of its outstanding common stock. 26 56,713 33.0% 87,135 50.7% Percentages at top of bars represent cumulative return of capital via dividends and repurchases as a percentage of net proceeds from second step conversion. 111,511 64.9% 153,963 89.7% 180,227 105.0% 219,982 128.1% As of March 31,2015 224,025 130.5% - 25,000 50,000 75,000 100,000 125,000 150,000 175,000 200,000 225,000 2009 2010 2011 2012 2013 2014 Q1 2015 32,540 46,835 61,140 71,861 77,733 88,221 90,866 24,173 40,300 50,371 82,102 102,494 132,030 133,159 Dividends Repurchases
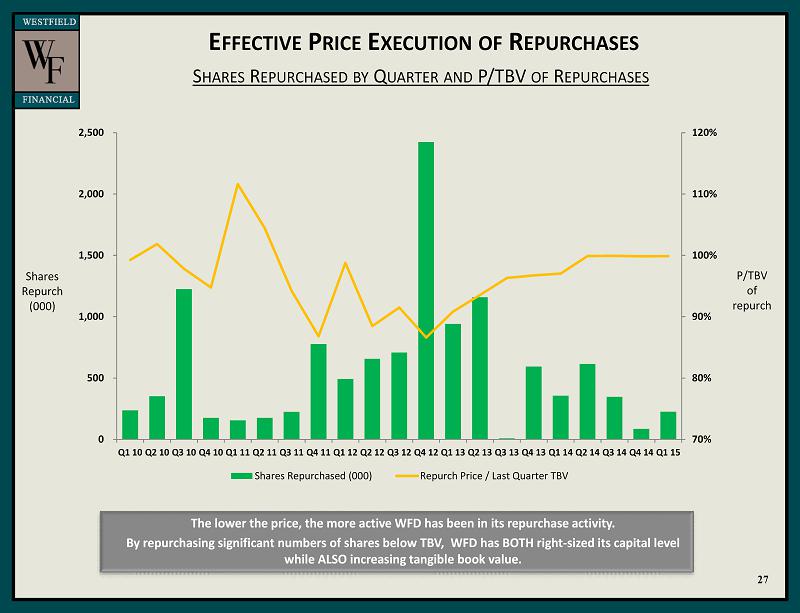
E FFECTIVE P RICE E XECUTION OF R EPURCHASES S HARES R EPURCHASED BY Q UARTER AND P/TBV OF R EPURCHASES The lower the price, the more active WFD has been in its repurchase activity. By repurchasing significant numbers of shares below TBV, WFD has BOTH right - sized its capital level while ALSO increasing tangible book value. Shares Repurch (000) P/TBV of repurch 27 70% 80% 90% 100% 110% 120% 0 500 1,000 1,500 2,000 2,500 Q1 10 Q2 10 Q3 10 Q4 10 Q1 11 Q2 11 Q3 11 Q4 11 Q1 12 Q2 12 Q3 12 Q4 12 Q1 13 Q2 13 Q3 13 Q4 13 Q1 14 Q2 14 Q3 14 Q4 14 Q1 15 Shares Repurchased (000) Repurch Price / Last Quarter TBV
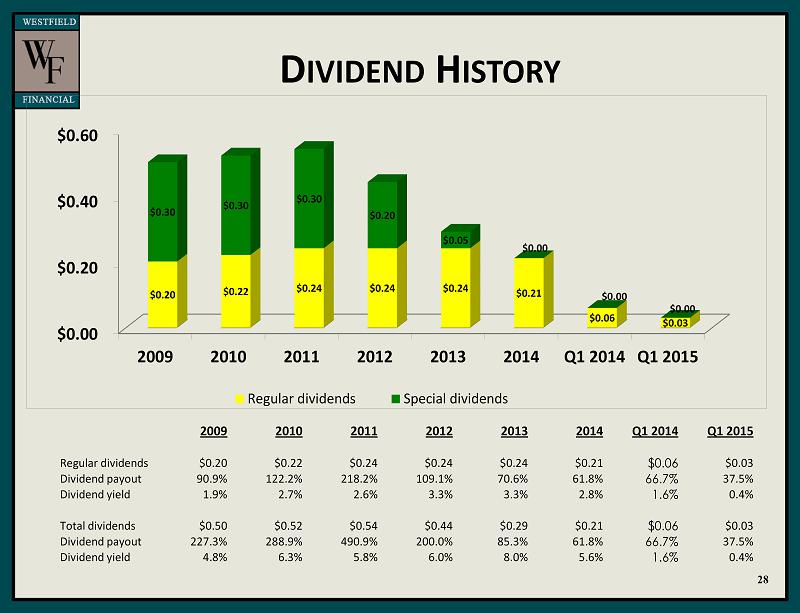
D IVIDEND H ISTORY 28 2009 2010 2011 2012 2013 2014 Q1 2014 Q1 2015 Regular dividends $0.20 $0.22 $0.24 $0.24 $0.24 $0.21 $0.06 $0.03 Dividend payout 90.9% 122.2% 218.2% 109.1% 70.6% 61.8% 66.7% 37.5% Dividend yield 1.9% 2.7% 2.6% 3.3% 3.3% 2.8% 1.6% 0.4 % Total dividends $0.50 $0.52 $0.54 $0.44 $0.29 $0.21 $0.06 $0.03 Dividend payout 227.3% 288.9% 490.9% 200.0% 85.3% 61.8% 66.7% 37.5% Dividend yield 4.8% 6.3% 5.8% 6.0% 8.0% 5.6% 1.6% 0.4% $0.00 $0.20 $0.40 $0.60 2009 2010 2011 2012 2013 2014 Q1 2014 Q1 2015 $0.20 $0.22 $0.24 $0.24 $0.24 $0.21 $0.06 $0.03 $0.30 $0.30 $0.30 $0.20 $0.05 $0.00 $0.00 $0.00 Regular dividends Special dividends
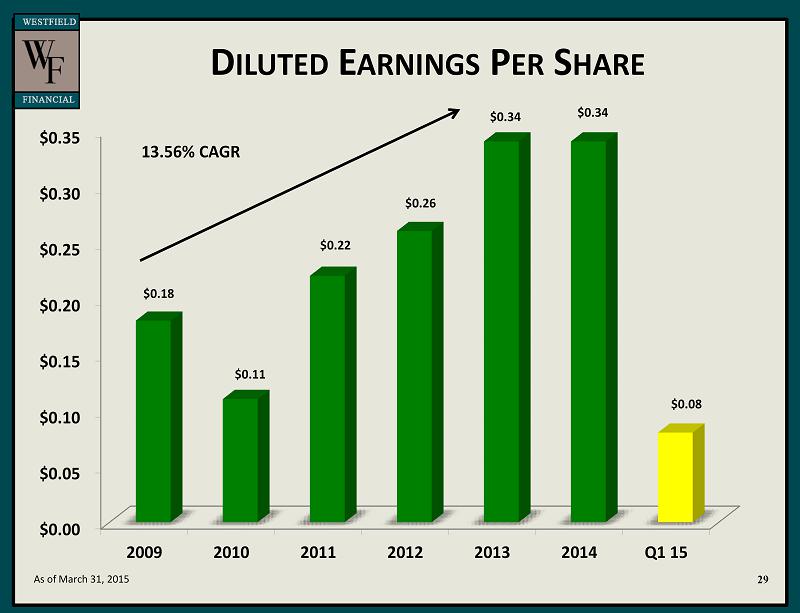
D ILUTED E ARNINGS P ER S HARE 29 As of March 31, 2015 13.56% CAGR $0.00 $0.05 $0.10 $0.15 $0.20 $0.25 $0.30 $0.35 2009 2010 2011 2012 2013 2014 Q1 15 $0.18 $0.11 $0.22 $0.26 $0.34 $0.34 $0.08
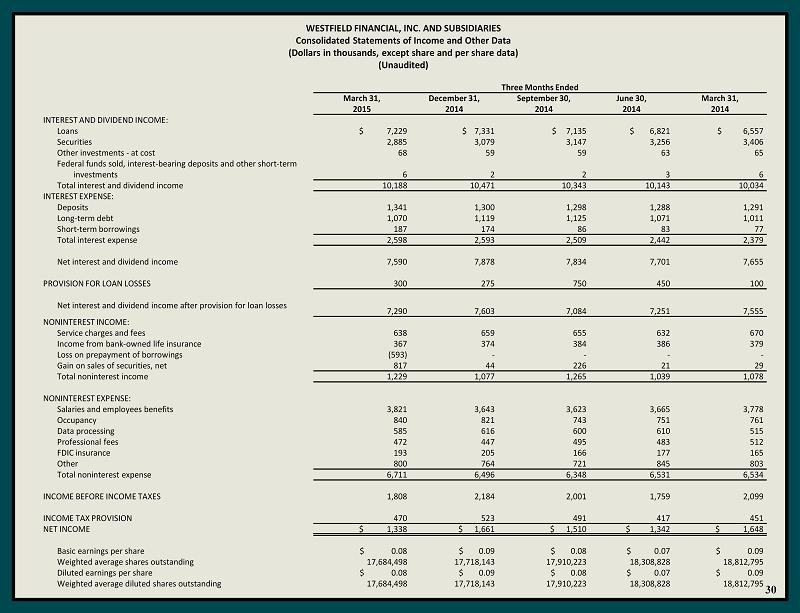
WESTFIELD FINANCIAL, INC. AND SUBSIDIARIES Consolidated Statements of Income and Other Data (Dollars in thousands, except share and per share data) (Unaudited) 30 Three Months Ended March 31, December 31, September 30, June 30, March 31, 2015 2014 2014 2014 2014 INTEREST AND DIVIDEND INCOME: Loans $ 7,229 $ 7,331 $ 7,135 $ 6,821 $ 6,557 Securities 2,885 3,079 3,147 3,256 3,406 Other investments - at cost 68 59 59 63 65 Federal funds sold, interest - bearing deposits and other short - term investments 6 2 2 3 6 Total interest and dividend income 10,188 10,471 10,343 10,143 10,034 INTEREST EXPENSE: Deposits 1,341 1,300 1,298 1,288 1,291 Long - term debt 1,070 1,119 1,125 1,071 1,011 Short - term borrowings 187 174 86 83 77 Total interest expense 2,598 2,593 2,509 2,442 2,379 Net interest and dividend income 7,590 7,878 7,834 7,701 7,655 PROVISION FOR LOAN LOSSES 300 275 750 450 100 Net interest and dividend income after provision for loan losses 7,290 7,603 7,084 7,251 7,555 NONINTEREST INCOME: Service charges and fees 638 659 655 632 670 Income from bank - owned life insurance 367 374 384 386 379 Loss on prepayment of borrowings (593) - - - - Gain on sales of securities, net 817 44 226 21 29 Total noninterest income 1,229 1,077 1,265 1,039 1,078 NONINTEREST EXPENSE: Salaries and employees benefits 3,821 3,643 3,623 3,665 3,778 Occupancy 840 821 743 751 761 Data processing 585 616 600 610 515 Professional fees 472 447 495 483 512 FDIC insurance 193 205 166 177 165 Other 800 764 721 845 803 Total noninterest expense 6,711 6,496 6,348 6,531 6,534 INCOME BEFORE INCOME TAXES 1,808 2,184 2,001 1,759 2,099 INCOME TAX PROVISION 470 523 491 417 451 NET INCOME $ 1,338 $ 1,661 $ 1,510 $ 1,342 $ 1,648 Basic earnings per share $ 0.08 $ 0.09 $ 0.08 $ 0.07 $ 0.09 Weighted average shares outstanding 17,684,498 17,718,143 17,910,223 18,308,828 18,812,795 Diluted earnings per share $ 0.08 $ 0.09 $ 0.08 $ 0.07 $ 0.09 Weighted average diluted shares outstanding 17,684,498 17,718,143 17,910,223 18,308,828 18,812,795
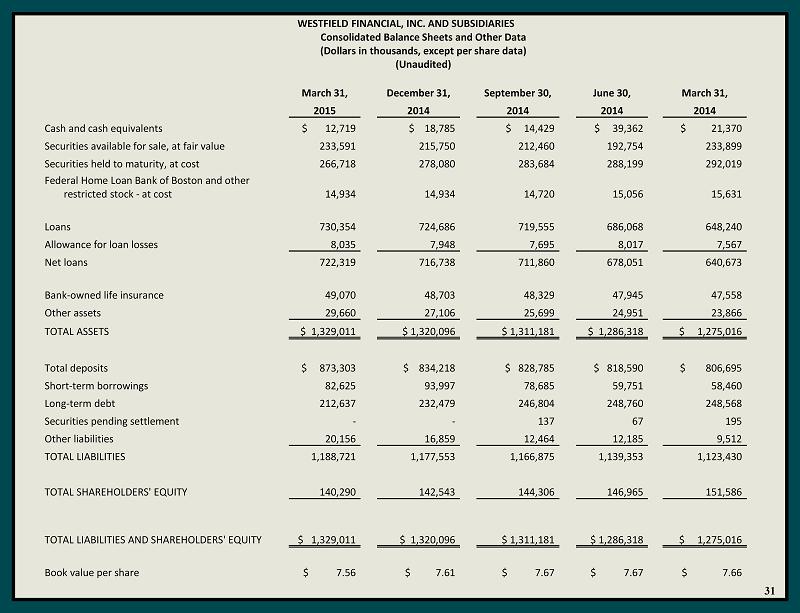
WESTFIELD FINANCIAL, INC. AND SUBSIDIARIES Consolidated Balance Sheets and Other Data (Dollars in thousands, except per share data) ( Unaudited) 31 March 31, December 31, September 30, June 30, March 31, 2015 2014 2014 2014 2014 Cash and cash equivalents $ 12,719 $ 18,785 $ 14,429 $ 39,362 $ 21,370 Securities available for sale, at fair value 233,591 215,750 212,460 192,754 233,899 Securities held to maturity, at cost 266,718 278,080 283,684 288,199 292,019 Federal Home Loan Bank of Boston and other restricted stock - at cost 14,934 14,934 14,720 15,056 15,631 Loans 730,354 724,686 719,555 686,068 648,240 Allowance for loan losses 8,035 7,948 7,695 8,017 7,567 Net loans 722,319 716,738 711,860 678,051 640,673 Bank - owned life insurance 49,070 48,703 48,329 47,945 47,558 Other assets 29,660 27,106 25,699 24,951 23,866 TOTAL ASSETS $ 1,329,011 $ 1,320,096 $ 1,311,181 $ 1,286,318 $ 1,275,016 Total deposits $ 873,303 $ 834,218 $ 828,785 $ 818,590 $ 806,695 Short - term borrowings 82,625 93,997 78,685 59,751 58,460 Long - term debt 212,637 232,479 246,804 248,760 248,568 Securities pending settlement - - 137 67 195 Other liabilities 20,156 16,859 12,464 12,185 9,512 TOTAL LIABILITIES 1,188,721 1,177,553 1,166,875 1,139,353 1,123,430 TOTAL SHAREHOLDERS' EQUITY 140,290 142,543 144,306 146,965 151,586 TOTAL LIABILITIES AND SHAREHOLDERS' EQUITY $ 1,329,011 $ 1,320,096 $ 1,311,181 $ 1,286,318 $ 1,275,016 Book value per share $ 7.56 $ 7.61 $ 7.67 $ 7.67 $ 7.66
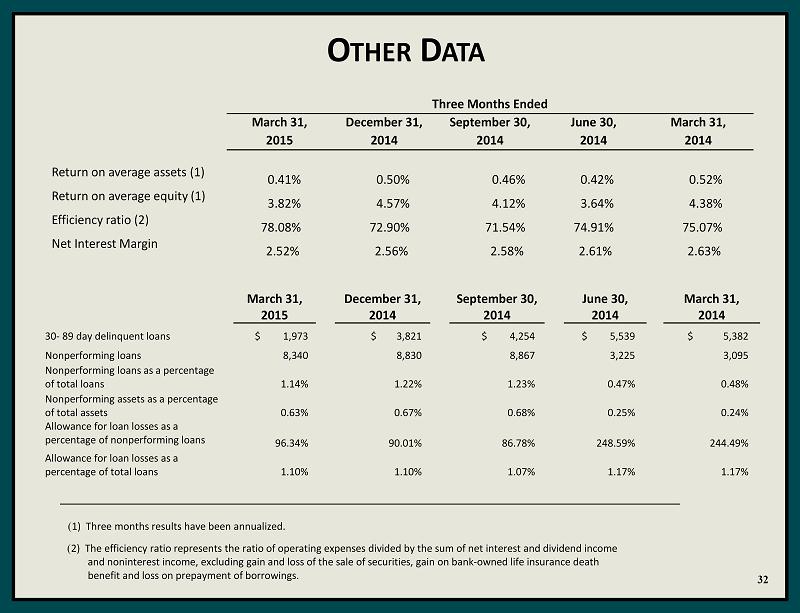
O THER D ATA 32 ( 1) Three months results have been annualized. ( 2) The efficiency ratio represents the ratio of operating expenses divided by the sum of net interest and dividend income and noninterest income, excluding gain and loss of the sale of securities, gain on bank - owned life insurance death benefit and loss on prepayment of borrowings. Three Months Ended March 31, December 31, September 30, June 30, March 31, 2015 2014 2014 2014 2014 Return on average assets (1) 0.41% 0.50% 0.46% 0.42% 0.52% Return on average equity (1) 3.82% 4.57% 4.12% 3.64% 4.38% Efficiency ratio (2) 78.08% 72.90% 71.54% 74.91% 75.07% Net Interest Margin 2.52% 2.56% 2.58% 2.61% 2.63% March 31, December 31, September 30, June 30, March 31, 2015 2014 2014 2014 2014 30 - 89 day delinquent loans $ 1,973 $ 3,821 $ 4,254 $ 5,539 $ 5,382 Nonperforming loans 8,340 8,830 8,867 3,225 3,095 Nonperforming loans as a percentage of total loans 1.14% 1.22% 1.23% 0.47% 0.48% Nonperforming assets as a percentage of total assets 0.63% 0.67% 0.68% 0.25% 0.24% Allowance for loan losses as a percentage of nonperforming loans 96.34% 90.01% 86.78% 248.59% 244.49% Allowance for loan losses as a percentage of total loans 1.10% 1.10% 1.07% 1.17% 1.17%
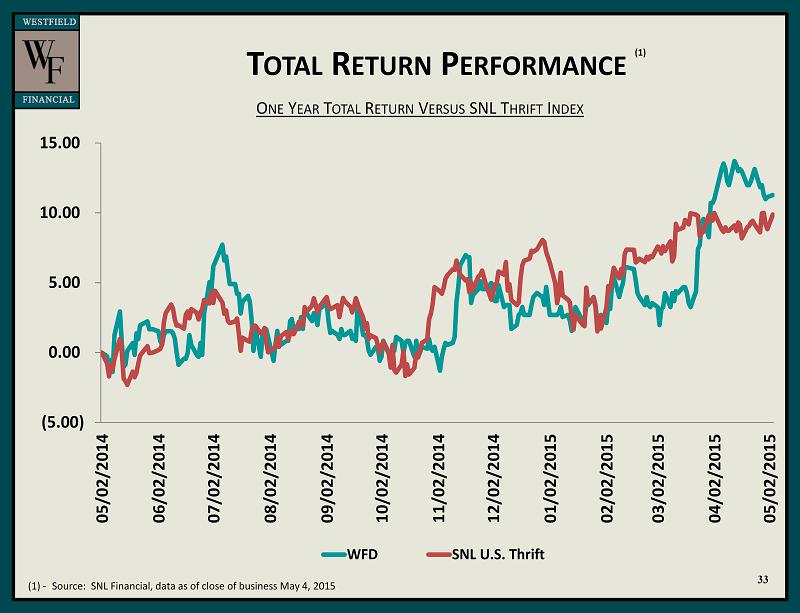
T OTAL R ETURN P ERFORMANCE O NE Y EAR T OTAL R ETURN V ERSUS SNL T HRIFT I NDEX (1) - ) Source: SNL Financial, data as of close of business May 4, 2015 . 33 (1) (5.00) 0.00 5.00 10.00 15.00 05/02/2014 06/02/2014 07/02/2014 08/02/2014 09/02/2014 10/02/2014 11/02/2014 12/02/2014 01/02/2015 02/02/2015 03/02/2015 04/02/2015 05/02/2015 WFD SNL U.S. Thrift