Attached files
| file | filename |
|---|---|
| 8-K - FORM 8-K - Atlantic Union Bankshares Corp | v410294_8k.htm |
Exhibit 99.1

Investor Presentation May/June 2015
Forward - Looking Statement Certain statements in this report may constitute “forward - looking statements” within the meaning of the Private Securities Litigation Reform Act of 1995. Forward - looking statements are statements that include projections, predictions, expectations, or beliefs about future events or results or otherwise and are not statements of historical fact. Such statements are often characterized by the use of qualified words (and their derivatives) such as “expect,” “believe,” “estimate,” “plan,” “project,” “anticipate,” “intend,” “will,” or words of similar meaning or other statements concerning opinions or judgment of the Company and its management about future events. Although the Company believes that its expectations with respect to forward - looking statements are based upon reasonable assumptions within the bounds of its existing knowledge of its business and operations, there can be no assurance that actual results, performance, or achievements of the Company will not differ materially from any future results, performance, or achievements expressed or implied by such forward - looking statements. Actual future results and trends may differ materially from historical results or those anticipated depending on a variety of factors, including, but not limited to, the effects of and changes in: general economic and bank industry conditions, the interest rate environment, legislative and regulatory requirements, competitive pressures, new products and delivery systems, inflation, changes in the stock and bond markets, accounting standards or interpretations of existing standards, mergers and acquisitions, technology, and consumer spending and savings habits. More information is available on the Company’s website, http://investors.bankatunion.com and on the Securities and Exchange Commission’s website, www.sec.gov. The information on the Company’s website is not a part of this presentation. The Company does not intend or assume any obligation to update or revise any forward - looking statements that may be made from time to time by or on behalf of the Company. 2
Company Overview • The largest community banking organization headquartered in Virginia • Holding company formed in 1993 – Banking history goes back more than 100 years • 7 whole bank and 16 branch acquisitions since 1993 • Assets of $7.4 Billion • Comprehensive financial services provider offering • Commercial and r etail banking through Union Bank & Trust • Mortgages primarily through Union Mortgage Group, LLC • Investment, wealth management and trust services • Insurance products through Union Insurance Group, LLC • Investments in 3 title agencies and payments space start - up 3
Union’s Strengths • Unique branch network across Virginia, competitive banking products and services and a loyal customer base • Well positioned for organic growth given commercial activity, household income levels and population growth in its footprint • Strong balance sheet and solid capital base • Conservative in - market lender • Experienced management team • Successful acquirer and integrator • Proven financial performance in both good and bad economic climates 4

Union Footprint 5
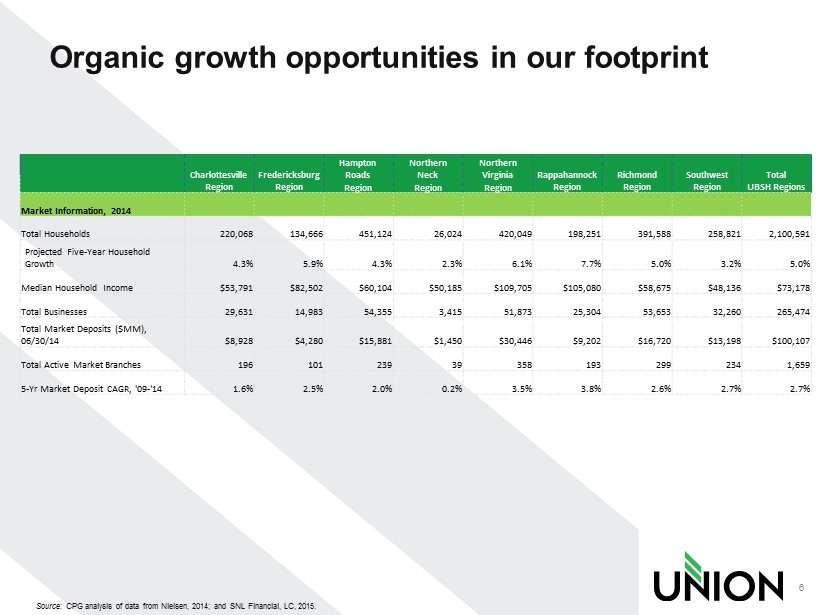
O
Source: CPG analysis of data from Nielsen, 2014; and SNL Financial, LC, 2015.
rganic growth opportunities in our footprint Charlottesville Region Fredericksburg Region Hampton Roads Region Northern Neck Region Northern Virginia Region Rappahannock Region Richmond Region Southwest Region Total UBSH Regions Market Information, 2014 Total Households 220,068 134,666 451,124 26,024 420,049 198,251 391,588 258,821 2,100,591 Projected Five - Year Household Growth 4.3% 5.9% 4.3% 2.3% 6.1% 7.7% 5.0% 3.2% 5.0% Median Household Income $53,791 $82,502 $60,104 $50,185 $109,705 $105,080 $58,675 $48,136 $73,178 Total Businesses 29,631 14,983 54,355 3,415 51,873 25,304 53,653 32,260 265,474 Total Market Deposits ($MM), 06/30/14 $8,928 $4,280 $15,881 $1,450 $30,446 $9,202 $16,720 $13,198 $100,107 Total Active Market Branches 196 101 239 39 358 193 299 234 1,659 5 - Yr Market Deposit CAGR, '09 - '14 1.6% 2.5% 2.0% 0.2% 3.5% 3.8% 2.6% 2.7% 2.7% 6
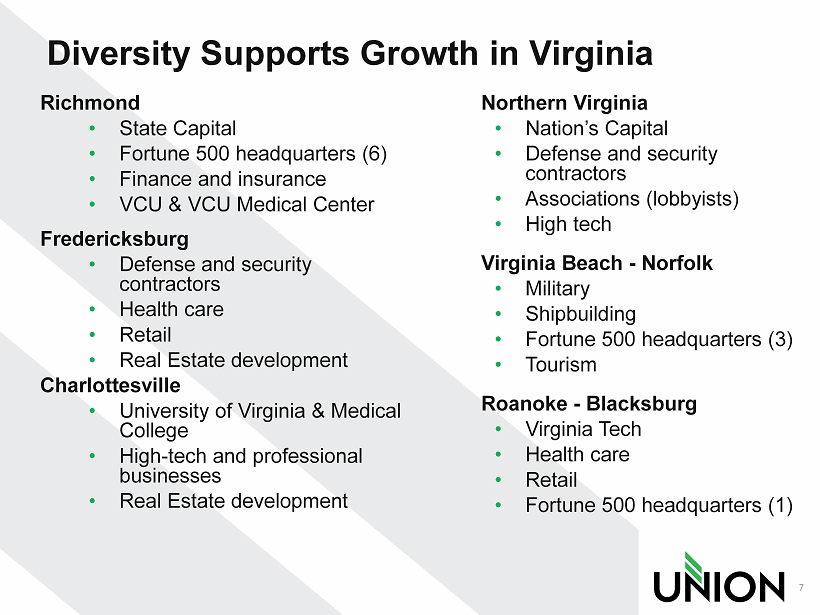
Diversity Supports Growth in Virginia Richmond • State Capital • Fortune 500 headquarters (6) • Finance and insurance • VCU & VCU Medical Center Fredericksburg • Defense and security contractors • Health care • Retail • Real Estate development Charlottesville • University of Virginia & Medical College • High - tech and professional businesses • Real Estate development Northern Virginia • Nation’s Capital • Defense and security contractors • Associations (lobbyists) • High tech Virginia Beach - Norfolk • Military • Shipbuilding • Fortune 500 headquarters (3) • Tourism Roanoke - Blacksburg • Virginia Tech • Health care • Retail • Fortune 500 headquarters (1) 7
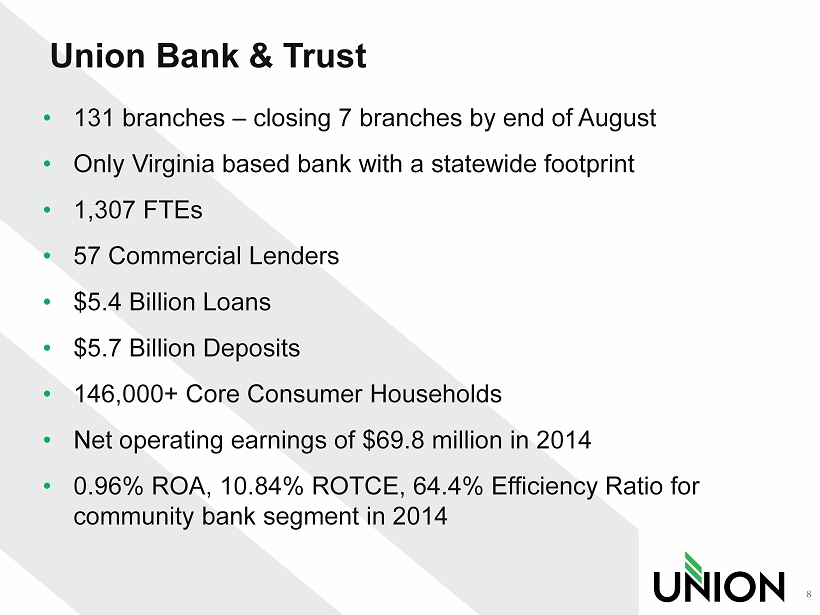
Union Bank & Trust • 131 branches – closing 7 branches by end of August • Only Virginia based bank with a statewide footprint • 1,307 FTEs • 5 7 Commercial Lenders • $5.4 Billion Loans • $5.7 Billion Deposits • 146,000+ Core Consumer Households • Net operating earnings of $69.8 million in 2014 • 0.96% ROA, 10.84% ROTCE, 64.4% Efficiency Ratio for community bank segment in 2014 8
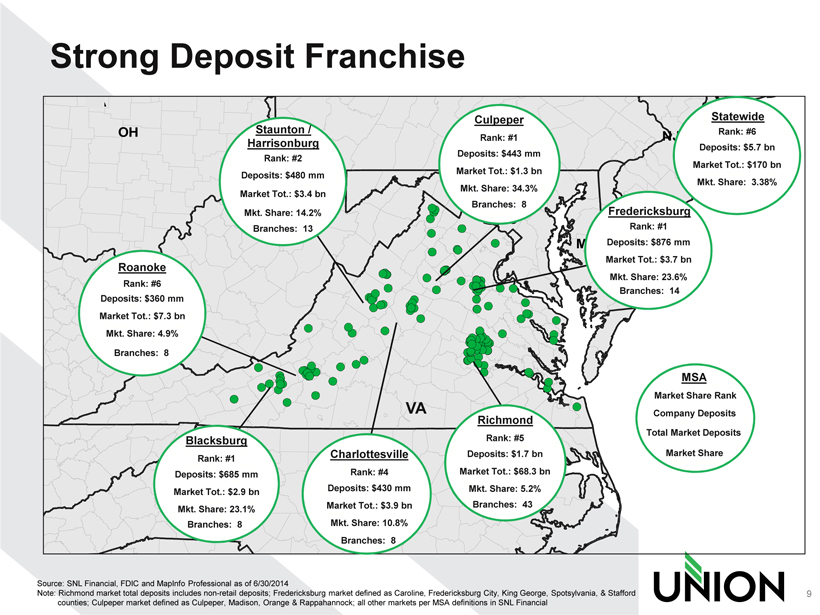
NC DC VA AL CT DE GA IL IN KY MA MD MI MS NJ NY OH RI SC TN WV Strong Deposit Franchise 9 Source: SNL Financial, FDIC and MapInfo Professional as of 6/30/2014 Note: Richmond market total deposits includes non - retail deposits; Fredericksburg market defined as Caroline, Fredericksburg Cit y, King George, Spotsylvania, & Stafford counties; Culpeper market defined as Culpeper, Madison, Orange & Rappahannock; all other markets per MSA definitions in SNL F ina ncial Richmond Rank: #5 Deposits: $1.7 bn Market Tot.: $68.3 bn Mkt. Share: 5.2% Blacksburg Rank: #1 Deposits: $685 mm Market Tot.: $2.9 bn Mkt. Share: 23.1% Staunton / Harrisonburg Rank: #2 Deposits: $480 mm Market Tot.: $3.4 bn Mkt. Share: 14.2% Culpeper Rank: #1 Deposits: $443 mm Market Tot.: $ 1 .3 bn Mkt. Share: 34.3% MSA Market Share Rank Company Deposits Total Market Deposits Market Share Roanoke Deposits: $360 mm Market Tot.: $7.3 bn Mkt. Share: 4.9% Rank : #6 Charlottesville Rank: #4 Deposits: $430 mm Market Tot.: $3.9 bn Mkt. Share: 10.8% VA Fredericksburg Rank: #1 Deposits: $876 mm Market Tot.: $3.7 bn Mkt. Share: 23.6% Branches: 8 Branches: 13 Branches: 8 Branches: 14 Branches: 43 Branches: 8 Branches: 8 Statewide Rank: #6 Deposits: $5.7 bn Market Tot.: $170 bn Mkt. Share: 3.38%
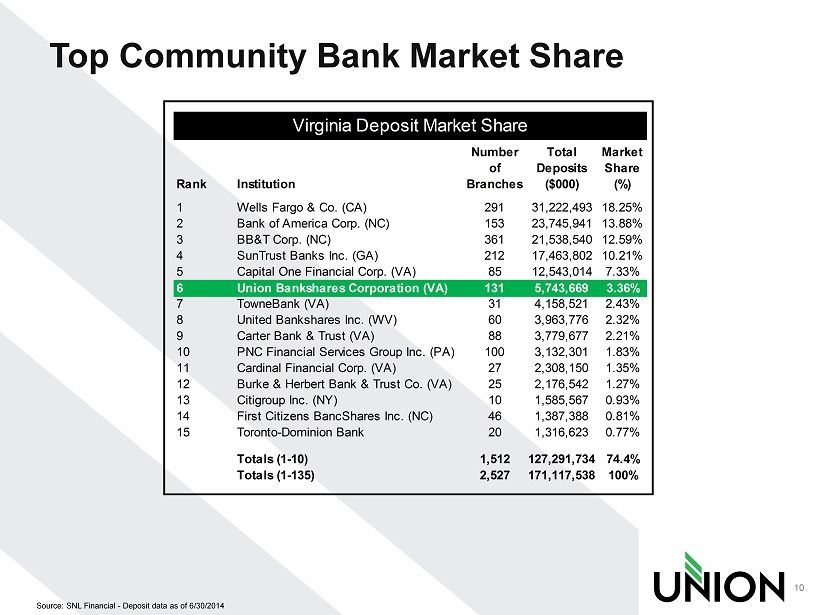
Top Community Bank Market Share 10 Source: SNL Financial - Deposit data as of 6/30/2014 Rank Institution Number of Branches Total Deposits ($000) Market Share (%) 1 Wells Fargo & Co. (CA) 291 31,222,493 18.25% 2 Bank of America Corp. (NC) 153 23,745,941 13.88% 3 BB&T Corp. (NC) 361 21,538,540 12.59% 4 SunTrust Banks Inc. (GA) 212 17,463,802 10.21% 5 Capital One Financial Corp. (VA) 85 12,543,014 7.33% 6 Union Bankshares Corporation (VA) 131 5,743,669 3.36% 7 TowneBank (VA) 31 4,158,521 2.43% 8 United Bankshares Inc. (WV) 60 3,963,776 2.32% 9 Carter Bank & Trust (VA) 88 3,779,677 2.21% 10 PNC Financial Services Group Inc. (PA) 100 3,132,301 1.83% 11 Cardinal Financial Corp. (VA) 27 2,308,150 1.35% 12 Burke & Herbert Bank & Trust Co. (VA) 25 2,176,542 1.27% 13 Citigroup Inc. (NY) 10 1,585,567 0.93% 14 First Citizens BancShares Inc. (NC) 46 1,387,388 0.81% 15 Toronto-Dominion Bank 20 1,316,623 0.77% Totals (1-10) 1,512 127,291,734 74.4% Totals (1-135) 2,527 171,117,538 100% Virginia Deposit Market Share
Union Mortgage Group • 19 offices: 16 in Virginia, 1 each in Maryland, North Carolina and South Carolina • 116 FTEs – 44 loan officers • $138.7 million in 1Q15 originations – 47% refinance • $267,000 net loss in 1Q15 • Completed a systemic change and complete platform rebuild in 2014. Work began in 2012 • Changes include: loan origination system switch; headquarters move; StellarOne integration; back office restructure to gain expense flexibility; revised commission compensation structure • Re - tooled operating platform helps recruit new sales talent and profitably grow production • Opportunities : • Expand salesforce in growth markets • Improve office space alignment with bank in primary markets • Strategically keep certain mortgage production on balance sheet for earning asset growth • Improved pipeline management and fulfillment will allow for better delivery models 11

Union Wealth Management • Trust, Asset Management, Private Banking and Brokerage services • 68 FTEs • $1.8B in AUM and AUA, the majority of which is managed assets • $2.2 million in fees generated in 1Q15 • Organic and Acquisitive growth opportunities • Expand services to existing customers • Target opportunities to cross - sell retail and commercial customers of bank • Leveraging bank brand/reputation in wealth management space 12
Uniquely Positioned To Grow • Unmatched footprint in Virginia – significant barriers for competitors to overcome • Higher lending capacity than other Virginia - based banks – larger potential customer base • Expansion opportunities in Northern Virginia and Virginia Beach • Consolidation opportunities in the current footprint • E xcess capital ready to deploy 13
2014 Financial Highlights • 2014 Operating Net Income (1) was $66.3 million and operating earnings per share were $1.44 • The Community Banking segment operating earnings were $69.8 million, or $1.52 per share • The mortgage segment reported a net loss of $3.5 million ($0.08 per share) • StellarOne was successfully integrated into Union, cost savings targets were achieved and customer attrition was lower than projected • Loan balances grew by 1.3% for the full year 2014 and 13.5% annualized in the fourth quarter to $5.3 billion • Core deposit households grew more than 5% in Union’s legacy markets for 2014 and merger related attrition from retail customers slowed as the year progressed • Deposit balances stood at $5.6 billion at year end • The full year Core Net Interest Margin of 3.93% remained strong; was 3.88% in the fourth quarter • Asset Quality remained strong • Repurchased and retired 2.3 million shares (~5%) for $56 million through April 2015 • $ 9 million repurchase capacity remaining under current $65 million Board authorization • Raised the quarterly dividend to $0.15 cents a share in August – 7% increase (1) Operating earnings exclude after tax merger relate costs of $13.7 million or $0.30/share 14
First Quarter 2015 Highlights • Net Income for the first quarter was $15.7 million and earnings per share were $0.35 • The Community Banking segment earnings were $16.0 million, or $0.36 per share • The mortgage segment reported a net loss of $0.3 million ($ 0.01 per share) • Annualized Loan growth was 3.1% driven by an increase of 7.5% in commercial loans • Loan balances now stand at $5.4 billion • Annualized deposit balances grew 2.2% to $5.7 billion • Core deposit households grew approximately 3% on an annualized basis • Core Net Interest Margin compressed by 4 basis points to 3.84% • Asset Quality remained strong as nonaccrual loans and OREO balances declined • Announced consolidation of 7 branches, saving approximately $1.9 million in expenses on a run - rate basis 15
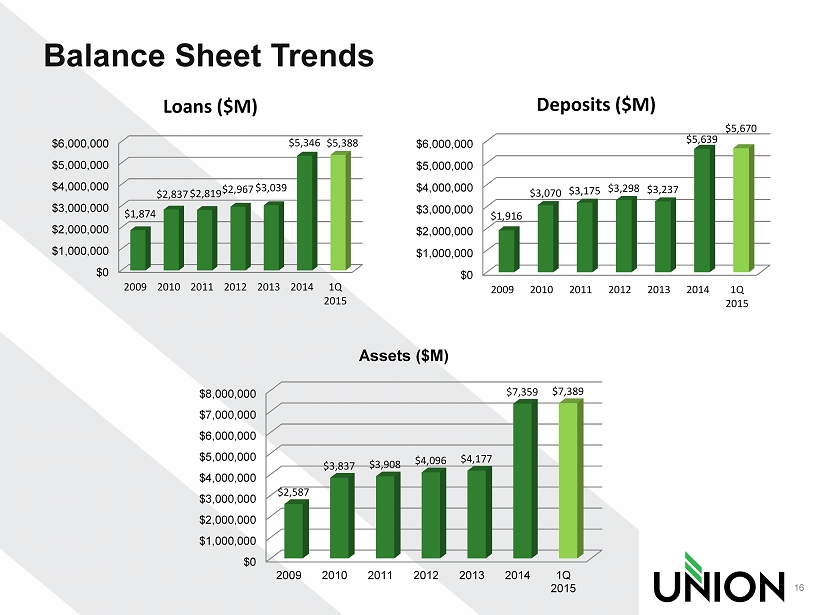
Balance Sheet Trends 16 $0 $1,000,000 $2,000,000 $3,000,000 $4,000,000 $5,000,000 $6,000,000 2009 2010 2011 2012 2013 2014 1Q 2015 $ 1,874 $ 2,837 $ 2,819 $ 2,967 $ 3,039 $ 5,346 $ 5,388 Loans ($M) $0 $1,000,000 $2,000,000 $3,000,000 $4,000,000 $5,000,000 $6,000,000 2009 2010 2011 2012 2013 2014 1Q 2015 $ 1,916 $ 3,070 $ 3,175 $ 3,298 $ 3,237 $ 5,639 $ 5,670 Deposits ($M) $0 $1,000,000 $2,000,000 $3,000,000 $4,000,000 $5,000,000 $6,000,000 $7,000,000 $8,000,000 2009 2010 2011 2012 2013 2014 1Q 2015 $ 2,587 $ 3,837 $ 3,908 $ 4,096 $ 4,177 $ 7,359 $ 7,389 Assets ($M)
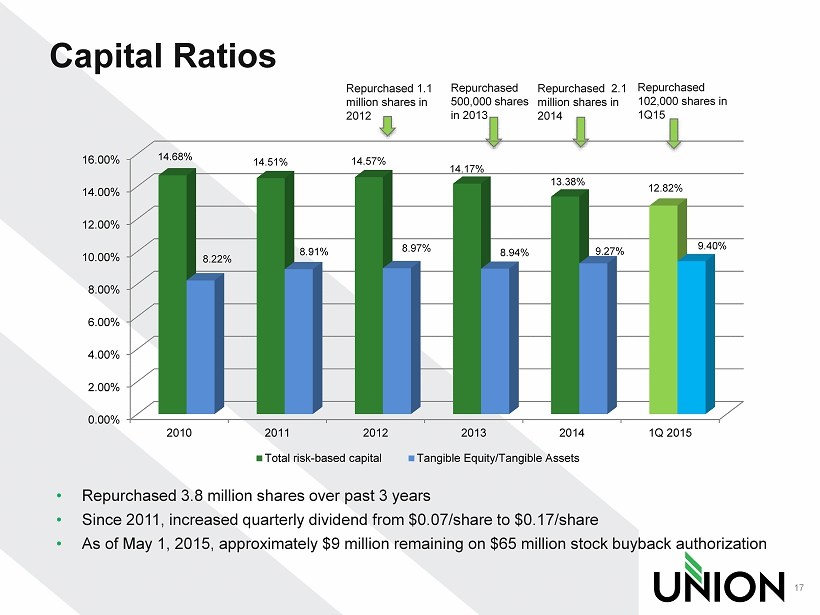
Repurchased 1.1 million shares in 2012 Capital Ratios 17 • Repurchased 3.8 million shares over past 3 years • Since 2011, increased quarterly dividend from $0.07/share to $0.17/share • As of May 1, 2015, approximately $ 9 million remaining on $65 million stock buyback authorization Repurchased 500,000 shares in 2013 Repurchased 2.1 million shares in 2014 Repurchased 102,000 shares in 1Q15 0.00% 2.00% 4.00% 6.00% 8.00% 10.00% 12.00% 14.00% 16.00% 2010 2011 2012 2013 2014 1Q 2015 14.68% 14.51% 14.57% 14.17% 13.38% 12.82% 8.22% 8.91% 8.97% 8.94% 9.27% 9.40% Total risk-based capital Tangible Equity/Tangible Assets
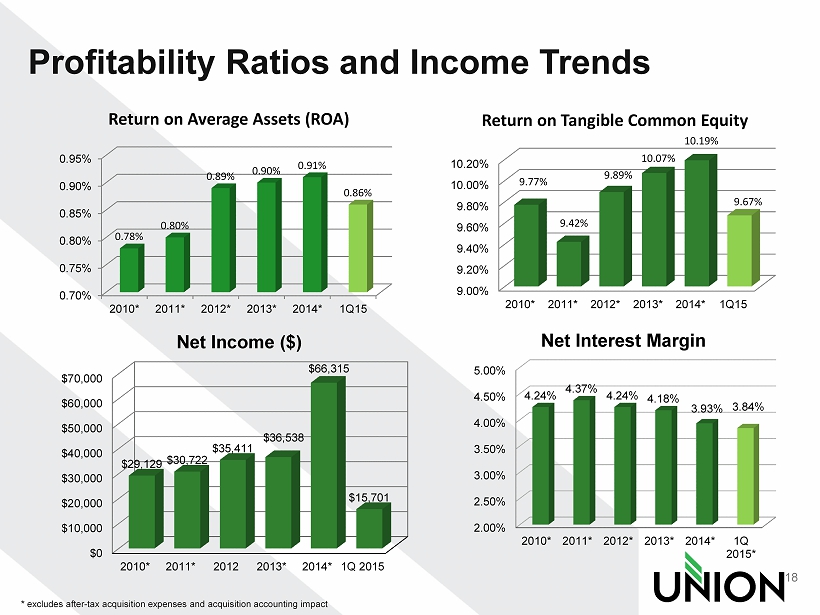
Profitability Ratios and Income Trends 18 * excludes after - tax acquisition expenses and acquisition accounting impact 0.70% 0.75% 0.80% 0.85% 0.90% 0.95% 2010* 2011* 2012* 2013* 2014* 1Q15 0.78% 0.80% 0.89% 0.90% 0.91% 0.86% Return on Average Assets (ROA) 9.00% 9.20% 9.40% 9.60% 9.80% 10.00% 10.20% 2010* 2011* 2012* 2013* 2014* 1Q15 9.77% 9.42% 9.89% 10.07% 10.19% 9.67% Return on Tangible Common Equity 2.00% 2.50% 3.00% 3.50% 4.00% 4.50% 5.00% 2010* 2011* 2012* 2013* 2014* 1Q 2015* 4.24% 4.37% 4.24% 4.18% 3.93% 3.84% Net Interest Margin $0 $10,000 $20,000 $30,000 $40,000 $50,000 $60,000 $70,000 2010* 2011* 2012 2013* 2014* 1Q 2015 $29,129 $30,722 $35,411 $36,538 $66,315 $15,701 Net Income ($)
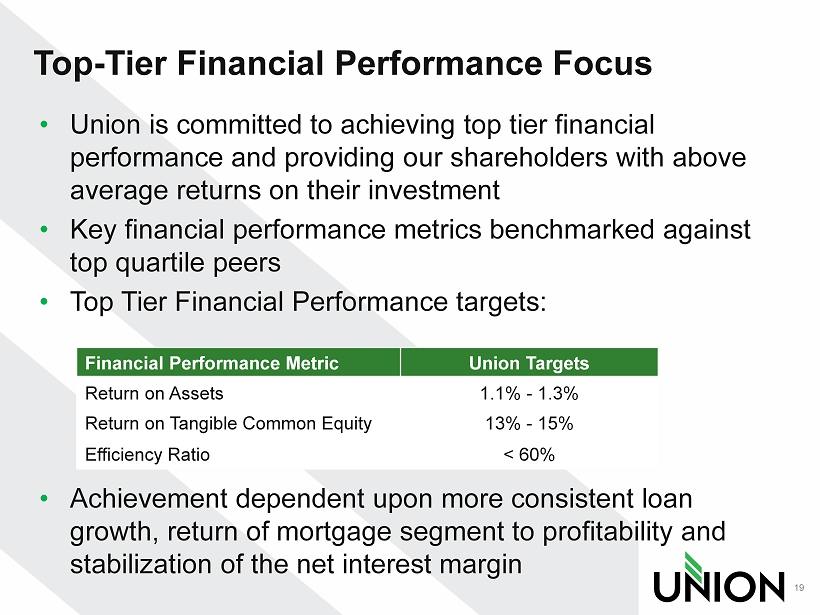
Top - Tier Financial Performance Focus • Union is committed to achieving top tier financial performance and providing our shareholders with above average returns on their investment • Key financial performance metrics benchmarked against top quartile peers • Top Tier Financial Performance targets: • Achievement dependent upon more consistent loan growth, return of mortgage segment to profitability and stabilization of the net interest margin 19 Financial Performance Metric Union Targets Return on Assets 1.1% - 1.3% Return on Tangible Common Equity 13% - 15% Efficiency Ratio < 60%
2015 Outlook • Leveraging new franchise • Stable to growing economy in footprint • Mid single digit loan growth • Modest net interest margin compression • Continued asset quality improvement – reduction of OREO • Improving ROA, ROTCE and Efficiency Ratio • $65 million in share repurchases authorized through 2015 - $ 9 million remaining 20
Value Proposition • Statewide Branch footprint is a competitive advantage and brings a unique franchise value • Strong balance sheet and capital base • Organic growth and acquisition opportunities • Experienced management team • Committed to top tier financial performance • Shareholder Value Driven • Solid dividend yield and payout ratio with earnings upside 21
APPENDIX
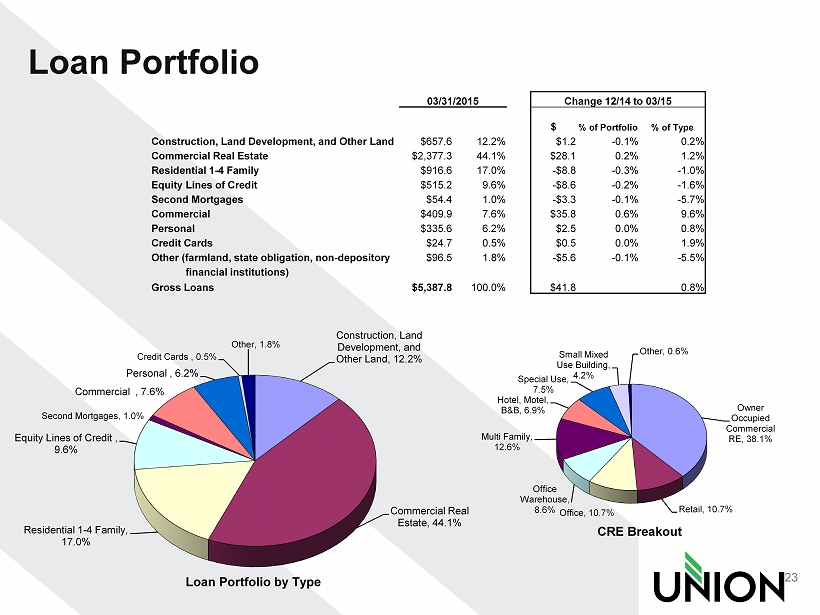
Loan Portfolio 23 03/31/2015 Change 12/14 to 03/15 $ % of Portfolio % of Type Construction, Land Development, and Other Land $657.6 12.2% $1.2 - 0.1% 0.2% Commercial Real Estate $2,377.3 44.1% $28.1 0.2% 1.2% Residential 1 - 4 Family $916.6 17.0% - $8.8 - 0.3% - 1.0% Equity Lines of Credit $515.2 9.6% - $8.6 - 0.2% - 1.6% Second Mortgages $54.4 1.0% - $3.3 - 0.1% - 5.7% Commercial $409.9 7.6% $35.8 0.6% 9.6% Personal $335.6 6.2% $2.5 0.0% 0.8% Credit Cards $24.7 0.5% $0.5 0.0% 1.9% Other (farmland, state obligation, non - depository $96.5 1.8% - $5.6 - 0.1% - 5.5% financial institutions) Gross Loans $5,387.8 100.0% $41.8 0.8% Construction, Land Development, and Other Land, 12.2% Commercial Real Estate, 44.1% Residential 1 - 4 Family, 17.0% Equity Lines of Credit , 9.6% Second Mortgages, 1.0% Commercial , 7.6% Personal , 6.2% Credit Cards , 0.5% Other, 1.8% Loan Portfolio by Type Owner Occupied Commercial RE, 38.1% Retail, 10.7% Office, 10.7% Office Warehouse, 8.6% Multi Family, 12.6% Hotel, Motel, B&B, 6.9% Special Use, 7.5% Small Mixed Use Building, 4.2% Other, 0.6% CRE Breakout
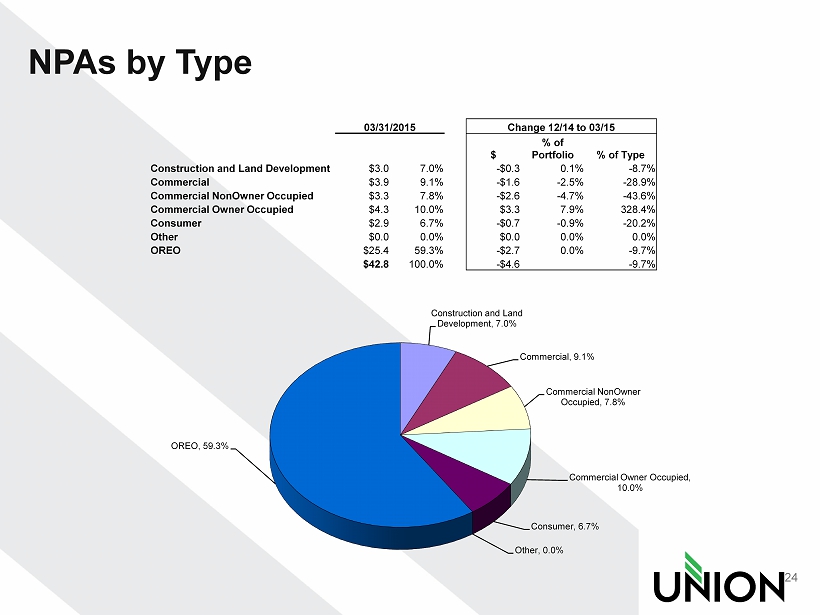
NPAs by Type 24 03/31/2015 Change 12/14 to 03/15 $ % of Portfolio % of Type Construction and Land Development $3.0 7.0% - $0.3 0.1% - 8.7% Commercial $3.9 9.1% - $1.6 - 2.5% - 28.9% Commercial NonOwner Occupied $3.3 7.8% - $2.6 - 4.7% - 43.6% Commercial Owner Occupied $4.3 10.0% $3.3 7.9% 328.4% Consumer $2.9 6.7% - $0.7 - 0.9% - 20.2% Other $0.0 0.0% $0.0 0.0% 0.0% OREO $25.4 59.3% - $2.7 0.0% - 9.7% $42.8 100.0% - $4.6 - 9.7% Construction and Land Development, 7.0% Commercial, 9.1% Commercial NonOwner Occupied, 7.8% Commercial Owner Occupied, 10.0% Consumer, 6.7% Other, 0.0% OREO, 59.3%
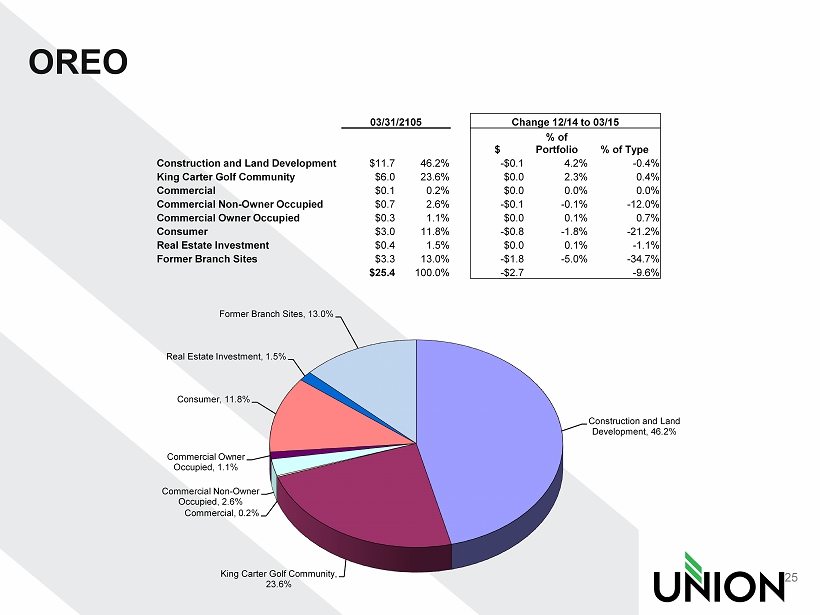
OREO 25 03/31/2105 Change 12/14 to 03/15 $ % of Portfolio % of Type Construction and Land Development $11.7 46.2% - $0.1 4.2% - 0.4% King Carter Golf Community $6.0 23.6% $0.0 2.3% 0.4% Commercial $0.1 0.2% $0.0 0.0% 0.0% Commercial Non - Owner Occupied $0.7 2.6% - $0.1 - 0.1% - 12.0% Commercial Owner Occupied $0.3 1.1% $0.0 0.1% 0.7% Consumer $3.0 11.8% - $0.8 - 1.8% - 21.2% Real Estate Investment $0.4 1.5% $0.0 0.1% - 1.1% Former Branch Sites $3.3 13.0% - $1.8 - 5.0% - 34.7% $25.4 100.0% - $2.7 - 9.6% Construction and Land Development, 46.2% King Carter Golf Community, 23.6% Commercial, 0.2% Commercial Non - Owner Occupied, 2.6% Commercial Owner Occupied, 1.1% Consumer, 11.8% Real Estate Investment, 1.5% Former Branch Sites, 13.0%